
(HDH) desalination
14
See discussions, stats, and author profiles for this publication at: http://www.researchgate.net/publication/266506930 Experimental and theoretical investigation of decentralized desalination system ARTICLE · JUNE 2014 READS 16 4 AUTHORS, INCLUDING: Mohammed Elsharkawy Mansoura University 1 PUBLICATION 0 CITATIONS SEE PROFILE Hossam AbdelMeguid University of Tabuk 33 PUBLICATIONS 63 CITATIONS SEE PROFILE Ibrahim I. El-Sharkawy Mansoura University, Egypt; Kyushu Universi… 63 PUBLICATIONS 575 CITATIONS SEE PROFILE Available from: Hossam AbdelMeguid Retrieved on: 21 October 2015
Transcript of (HDH) desalination

7/24/2019 (HDH) desalination
http://slidepdf.com/reader/full/hdh-desalination 1/14
See discussions, stats, and author profiles for this publication at: http://www.researchgate.net/publication/266506930
Experimental and theoretical investigation of decentralized desalination system
ARTICLE · JUNE 2014
READS
16
4 AUTHORS, INCLUDING:
Mohammed Elsharkawy
Mansoura University
1 PUBLICATION 0 CITATIONS
SEE PROFILE
Hossam AbdelMeguid
University of Tabuk
33 PUBLICATIONS 63 CITATIONS
SEE PROFILE
Ibrahim I. El-Sharkawy
Mansoura University, Egypt; Kyushu Universi…
63 PUBLICATIONS 575 CITATIONS
SEE PROFILE
Available from: Hossam AbdelMeguid
Retrieved on: 21 October 2015

7/24/2019 (HDH) desalination
http://slidepdf.com/reader/full/hdh-desalination 2/14
1
Experimental and Theoretical Investigation ofDecentralized Desalination System
ال مركلنظام تح یة میونظاختبار ع
Mohamed Elsharkawya,1, Hossam AbdelMeguid b,2, Ibrahim El-Sharkawy b,3, and Lotfy Rabie b
aTaba desalination plant, Holding company of water and waste water north &south Sinai,
Taba, Egypt. bMechanical Power Engineering Department, Faculty of Engineering, Mansoura University,El-Mansoura 35516, Egypt1 Email: [email protected], Tel.: +2010988161822 Email: [email protected], Tel.: +2010664647123 Email:[email protected], Tel.: +201006107242
مل
فى
الكافیة
الفنیة
وال ھارة
الخبرة
لنقص
ال ی
وارد
م
درة
و
ة
الع رانی
ات
التج ع
ة
ق
ع
م
النائیة
داتال ناطق
وح
د
ع
ة
العذب
باس تخدام مص ادر حراری ة منخفض ة درج ة"زال ة الرطوب الترطی ب و"ت ث ل طریق ة.الالمركزی ة ح ل أمث تح یة ال ی ا
نت اجھ م التقنی ات ال س تخدمة ف ىح دىخت ف ةالحرارة مثل الطاقة الش سیة أو الحرارة ال فقودة فى العدی د م ن الع ی ات ال ل دراس ة نظری ة وع ی ة ع ى ھ ذه الطریق. ال یاه العذبة المركزیا ع یھ فقد ت م ع وذجفف. وبناء ل ن ھ ذا البح ث ت م ع
وذج النظ إلثب انتاجی ة لدراس ة العوام ل ال خت ف ة الت ى ت ؤثر ع ى نظ ر وذج تجرص حة ھ ذا الن ل ن ب ىت م ع وذج النظ(MATLAB) اتال تم تطویر برنامح حاسوب باس تخدام ا.لدراسة ھذه العوامل ع یا معالج ةلح ل الن
ال س ارالنظریة م ن حی ث الق یم ال ط ق ةبرھنت النتائج الع یة صحة الن وذج النظرى حیث توافقت النتائج الع یة.النتائج
الكت ة ف ى االج زاء ال خت ف ةق ال الح رارةنالنظریة بالفروض ال ثالی ة لع ی ات فسر الفرق بین النتائج الع یة.واالتجاه
أ ال ی اه(ل ى ال رط بالس اخنة الداخ ةوفى الدراسة الع یة وجد أنھ بزیادة معدل تص رف ال ی. الن وذج النظرناء ع
نتاجی ةث ت زداد ا/كج0.08 ل ىث/كج0.05 م نال ی اه ال غذی تصرن بزیادة معدلتزداد االنتاجیة حیث)ال غذیة
1.68س وم ن/لت4.08 ل ىس/لت3.24 م نس/لت5.76لىس/لت4.32منس/لت8.04لىس/لت5.76من ا أن ھ بزی ادة.ع ى الت والدرج ة مئوی70605036 ال ی اه ال غذی س عن د درج ة ح رارة/لت2.16لىس/لتر ك
5.16س وم ن/لت7.32 س إل ى/لت6.36 م ننتاجی ةث ت زداد /كج0.1لىث/كج0.055معدل سریان الھواء من عند درج ة ح رارة ال ی اهس/لت2.22لىس/لت1.92س ومن/لت4.08لىس/لت3.6منس/لت5.64س إلى/لتر
0.15ل ىث/كج0.08 التبری د م نبزی ادة مع دل تص رف می. درج ة مئوی ة ع ى الت وال70605036ال غذی ة 5.28س إل ى/لت4.68 س وم ن/لت6.84 س إل ى/لت6.12 م نخ رى ت زداد االنتاجی ث ومع ثب ات ال تغی رات /كجم7060حرارة ال ی اه ال غذی عند درجةس/لت2.04لىس/ت1.74س ومن/لت3.84لىس/لت3.24من/لتر
.درجة مئویة ع ى التوال5036و
AbstractThis paper presents experimental and theoretical investigation of decentralized desalination system based on ahumidification-dehumidification (HDH) process. HDH is one of the methods that employed in the decentralizedsystems in remote areas where there is lack of experienced operators, maintenance and water resources. HDH is
suitable for remote areas that require small amount of fresh water. In the current work, a mathematical model is presented to investigate the effect of different operating parameters on the system productivity. A computer program based on MATLAB software is developed to solve the mathematical model and post-process thenumerical results. In order to validate the mathematical model and verify the obtained numerical results, anexperimental setup of decentralized HDH desalination system is designed and constructed. A series ofexperimental and numerical runs for different operating parameters are performed. The experimental data arecompared with the numerical results and a good agreement in both values and trend is observed. The transientstate behaviour of each component of the system and the influence of the different operating parameters on thesystem productivity are presented theoretically and experimentally.
Keywords: Desalination; Humidification; Dehumidification; Decentralized.

7/24/2019 (HDH) desalination
http://slidepdf.com/reader/full/hdh-desalination 3/14
2
NomenclatureA heat transfer area [m2]As surface area [m2]a width [m]β temperature reciprocal [ C¯ ]
b length [m]Cpw specific heat of water [J/kg.K]c height [m]Gr Grashof number (The ratio of the
buoyancy to viscous force)g gravitational acceleration [m/s2]h convective heat transfer coefficient
[W/m2.K]ha enthalpy of air [J/kg]k thermal conductivity [W/m.K]Lc characteristic length [m]loss losses of component [Watt]MCp heat capacity [J/K]ṁ mass flow rate [kg/s]
Nu Nusselt Number (convective heattransfer / Conductive heat transfer)
Pr Prandtl number (Viscose diffusionrate / Surface diffusion rate)(Cp.µ/k)
p perimeter [m]Q heater capacity [Watt]Ra Rayleigh number (Grashof number
* Prandtl number) (Gr. Pr)
T temperature [o
C]Tf average temperature [oC]
U Overall heat transfer coefficient[W/m2.K]
w specific humidity [kgw/kga]Z insulation thickness [m]
Subscripts
a airamb ambienta1 air outlet from dehumidifiera2 air inlet to humidifiera3 air outlet from humidifiercw cooling waterDH dehumidifierH humidifierhor horizontali inletins insulationLc characteristic lengthloss lossesmw make up watero outletost outside storage tank
prod productst storage tankver verticalw1 feed water inlet to humidifier
w2 water outlet from humidifier
1. Introduction
Interest in seawater desalination goes backto the fourth century BC, when Greeksailors used to obtain drinking water fromseawater. The first work published on solardesalination was that of Arab alchemists in1551 [1]. However, the first solar still was
designed and constructed in Chile by theSwedish engineer, Carlos Wilson, in 1872[1].
World-wide water scarcity, especially inthe developing world, indicates a pressingneed to develop inexpensive, decentralizedsmall-scale desalination technologieswhich use renewable resources of energy.
Combining the principle ofhumidification–dehumidification (HDH)with solar desalination decreases theconsumption of conventional energyresources in desalination plants andtherefore appears to be the best method ofwater desalination in remote areas.
This section provides a comprehensive
review of the state-of-the-art in one of themost promising of these technologies,HDH desalination technology.
A number of studies on solar desalinationsystems using HDH technique were
presented in the literature [2-4]. Mostly,these studies include the performanceevaluation of the HDH desalinationsystems under different systems operating
7/24/2019 (HDH) desalination
http://slidepdf.com/reader/full/hdh-desalination 4/14
3
parameters. In addition, in some of thesestudies, different types of solar collectors(water and air), humidifying towers anddehumidifying exchangers were designedand constructed, and their effects on thesolar desalination system productivity were
evaluated theoretically and experimentally[5-7]. Moreover, the influence of differentsystem configurations, (such aswith/without solar air and water heaters)on the solar desalination units productivitywere investigated [8, 9]. As well, naturaland forced air circulation solar HDHdesalination were investigated [10]. Inaddition, a hybrid HDH-Flashingevaporating system and HDH-Compression systems were proposed andstudied [11, 12].
During the last decade, a number of HDHdesalination units were developed andtested [13, 14]. Dai and Zhang [15] studiedexperimentally a solar desalination systemwith HDH. The used process was based onthe principle of open air-closed watercycles and forced air circulation. Mainly, asolar water heater, humidifier andcondenser configure the system. The mostimportant characteristic of the system isthe ability to utilize efficiently low-grade
heat resources, such as waste heat,geothermal, gas/oil/coal burning, etc. Itwas found that the performance of thesystem is strongly dependent on the rate offeed water temperature, the mass flow rateof salt water and the mass flow rate of the
process air. In addition, it is reported thatwater productivity of the described solardesalination system is about 6.2 kg/m2.dayunder optimal operating conditions.
Chafik [16] presented a seawater
desalination process based on the stepwiseheating-humidifying technique. The mainfeature of the suggested process is that theair is successively loaded with the watervapour up to relative high humidity, suchas 10 or 15%. It was reported that, by thisway, the airflow rate through the plantcould be reduced and low investment andoperating costs could be achieved. In
addition, he developed two different typesof the humidifier, which are pad humidifierand U-tube spray chamber humidifier. Theexperimental results of the humidifiersindicated that their efficiency is about95%, and also, he tried to find out an
optimum number of requiredheating/humidifying stages.
Amara et al. [17] carried out anexperimental and theoretical study of a padhumidifier used in a multi-stage solardesalination process in Tunisia underdifferent ambient and operating conditions.The mathematical formulation of the padhumidifier was developed and the non-linear system of equations was solved byusing the numerical method, Newton-
Raphson. The numerical results werecompared to the experimental data tovalidate the numerical model and there wasa good agreement between them.
Nafey et al. [18, 19] carried out atheoretical and experimental study of aHDH process using solar energy at theweather conditions of Suez City, Egypt. Inthe theoretical study, a mathematicalmodel was developed, simulating thesystem, to study the effects of the differentsystem configurations and operatingconditions. The results showed that the
productivity of the system increases withthe increasing of air mass flow rate, solarair and water collector areas, and inputsolar energy. On the other hand,
productivity of the unit decreases with theincreasing of water mass flow rate. Finally,they reported that the wind speed andambient temperature have very smallinfluence on the system performance.
This study aims to develop a mathematicalmodel and validate it by usingexperimental data, and investigatetheoretically and experimentally the effectof different operating parameters, such asmass flow rates of air and water and feedwater temperature, on the productivity of adecentralized air HDH desalination system.
7/24/2019 (HDH) desalination
http://slidepdf.com/reader/full/hdh-desalination 5/14
4
Humidifier Dehumidifier
StorageTank
Heater
Valve
Flow
Meter
Tw1, ṁw1
ṁw2
Tw2
ṁmwTmw
Ta3, ṁawa3,ha3
Ta2, ṁa ,ha2
wa2=wa1
Tcwoṁcw
Tcwi
Product
Tank
T prod
ṁ prod
Air Loop
Water Loop
To drain
P
F
ṁcw
Water
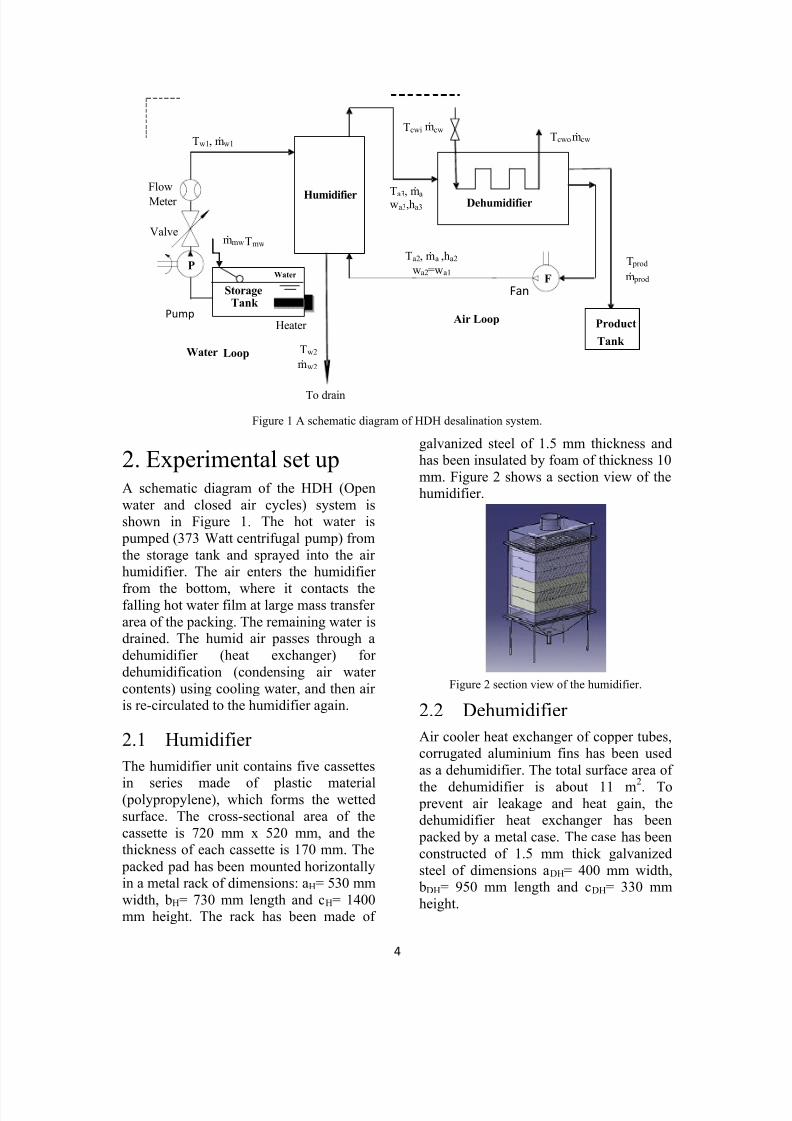
Figure 1 A schematic diagram of HDH desalination system.
2. Experimental set upA schematic diagram of the HDH (Open
water and closed air cycles) system is
shown in Figure 1. The hot water is
pumped (373 Watt centrifugal pump) from
the storage tank and sprayed into the air
humidifier. The air enters the humidifier
from the bottom, where it contacts thefalling hot water film at large mass transfer
area of the packing. The remaining water is
drained. The humid air passes through a
dehumidifier (heat exchanger) for
dehumidification (condensing air water
contents) using cooling water, and then air
is re-circulated to the humidifier again.
2.1 Humidifier
The humidifier unit contains five cassettes
in series made of plastic material(polypropylene), which forms the wetted
surface. The cross-sectional area of the
cassette is 720 mm x 520 mm, and the
thickness of each cassette is 170 mm. The
packed pad has been mounted horizontally
in a metal rack of dimensions: aH= 530 mm
width, bH= 730 mm length and cH= 1400
mm height. The rack has been made of
galvanized steel of 1.5 mm thickness and
has been insulated by foam of thickness 10
mm. Figure 2 shows a section view of the
humidifier.
Figure 2 section view of the humidifier.
2.2 Dehumidifier
Air cooler heat exchanger of copper tubes,
corrugated aluminium fins has been used
as a dehumidifier. The total surface area of
the dehumidifier is about 11 m2. To prevent air leakage and heat gain, the
dehumidifier heat exchanger has been
packed by a metal case. The case has been
constructed of 1.5 mm thick galvanized
steel of dimensions aDH= 400 mm width,
bDH= 950 mm length and cDH= 330 mm
height.
Fan
Pump

7/24/2019 (HDH) desalination
http://slidepdf.com/reader/full/hdh-desalination 6/14
5
2.3 Water storage tankThe water storage tank has beenconstructed of 5 mm thick plastic tank ofdimensions: 600 mm diameter, and 920mm height. The tank is thermally insulated
by glass wool of thickness 10 mm. Itconsists of one electric heater of capacityQ= 3 kW with a built-in thermostat. Theheater was horizontally placed at the
bottom of the tank. The heater was used toheat the water inside the tank to a certaintemperature to investigate the effect of thefeed water temperature on the system
productivity. A constant temperature andhead of water inside the storage tankduring the experimental runs have beenmaintained.
3. Mathematical modelling
In order to apply the energy and mass balance equations for each of the systemcomponents, the following assumptions areapplied to the present model:
1)
Either laminar or turbulent flow is fullydeveloped.
2) The effectiveness of the humidifying process is assumed to be unity, thus:a)
The air leaving the humidifier is atsaturation condition. Therefore, thewet-bulb and dry-bulb temperaturesare identical.
b) The temperature of water leavingthe humidifier is equal to the wet-
bulb temperature.3) The dehumidification process lies on
the saturation curve.4) Temperature gradient inside the water
storage tank is neglected (a perfect
mixing is assumed).5) The temperature of inlet water (feedwater) is equal to the water temperaturein the storage tank (no heat loss in thelines is assumed).
6) Cooling water temperature is constantduring the day (infinite source ofcooling is assumed).
7) Exit temperature of the condensatewater and the outlet cooling water areequal to the dry-bulb temperature ofthe dehumidifier exit.
Applying the thermodynamic laws for the
humidifier, dehumidifier, and storage tankas shown in Figure 1, the energy and mass balance equations can be written as:
3.1 Humidifier
Mass balance:ṁ + ṁw = ṁ + ṁw
(1)Heat balance:
MCp dT
dt = m
Cp
T
+ m h
− m CpT − m h−loss
(2)MCp = MCp + MCp +MCp + MCp
(3)The humidity and saturated air enthalpyare given by Al-Hallaj et al [20];
w
= 2.19∗10
T
− 1.85 ∗ 10
T
+ 7.06 ∗ 10T−0.077
(4)h = 0.00585T −0.497T + 19.87T−207.61 (5)
3.2 DehumidifierMass balance:
ṁ = ṁ ∗ (w − w )
(6)Heat balance:
MCp dTdt =ṁ
h +ṁ
CpT− ṁh − ṁCpT− ṁCpT − loss
(7)MCp = MCp +MCp+MCp + MCp
(8)
7/24/2019 (HDH) desalination
http://slidepdf.com/reader/full/hdh-desalination 7/14
6
3.3 Water storage tank
Mass balance:ṁ = ṁ − ṁ
(9)Heat balance:
MCp dT(t)dt = Q + ṁCpT+ ṁCpT− ṁCpT − loss (10)MCp = MCp + MCp
(11)
3.4 Heat losses from the system The heat lost from storage tank , [21]:
loss = A U(T − T ) (12)U = 1 (1 h ⁄ + Z k )⁄
(13)The relation between Nu and Ra forcylindrical shape, [22]:
Nu = ⎩⎨⎧
0.6 + 0.387Ra
1 + (0.559/Pr) ⎭⎬⎫
(14)
The heat lost from the humidifier:loss = 2h ab(T − T ) +2hcb(T − T ) +2hca(T − T ) (15)
The heat lost from the dehumidifier:
loss
= 2h
a
b
(T
− T
) +2hcb(T − T ) +2hca(T − T ) (16)
The relation between Nu and Ra forhorizontal plate, [22]:
Nu = 0.27Ra /
(17)
For vertical plate, Churchill and Chu [22] proposed:Nu
= 0.825+ 0.387Ra /
1 + (0.492/Pr) /
(18)Ra = β() ν Pr (19)Lc = As/p (20)
β = 1/T (21)T = (22)h = ∗ (23)
4. Numerical solution
A computer simulation program to solvethe mathematical model of the system has
been developed by means of MATLABsoftware to investigate the effect of thevarious operating parameters on the
productivity of decentralized HDHdesalination system. The transient statelumped parameter model has been solvednumerically by employing the functionode45.
ode45 implements a version of the Runge-
Kutta(RK) 4
th
/5
th
order algorithm [23].That means the numerical solver ode45combines a fourth-order method and afifth-order method, both of which aresimilar to the classical fourth-order RKmethod. The modified RK varies the stepsize, choosing the step size at each step inan attempt to achieve the desired accuracy.Therefore, the solver ode45 is suitable fora wide variety of initial value problems in
practical applications.
5. Results and discussionThis section presents the experimentalresults, the validation of the developedmathematical model and a parametricstudy for the decentralized HDHdesalination system. The parametric studyof the developed mathematical model

7/24/2019 (HDH) desalination
http://slidepdf.com/reader/full/hdh-desalination 8/14
7
includes the effects of feed water massflow rate and temperature, air mass flowrate, and cooling water mass flow rate onthe system productivity.
5.1 Model validation
The numerical results and experimentaldata of the steady-state system productivityat different values of the feed water massflow rate at temperatures of 36 °C and 50°C are compared in Figure 3. It can be seenthat the results obtained show a goodagreement in both values and trend withrelative error ranges from 3.9% to 6% forfeed water temperature of 50 °C, and 6.8%to 12.1% for feed water temperature of 36°C. This deviation can be attributed to the
assumptions 3, 4, and 5 that assume ideal processes.
Figure 4 shows a comparison between thenumerical results and experimental data ofthe steady-state system productivity atdifferent values of the feed water massflow rate at temperatures of 36 °C and 50°C. There is a good agreement in bothvalues and trend between the theoreticaland experimental data. The deviation
between the numerical results and theexperimental data varies from 1.3% to10.8% for feed water temperature of 50 °C,and from 6.3% to 9.2% for feed watertemperature of 36 °C. These differencesare due to the assumed perfect processesand ignoring the thermal and frictionallosses in the system.
The numerical results and experimentaldata of steady-state productivity of thesystem at different values of the coolingwater mass flow rate are compared inFigure 5. It can be seen from the figure that
both results are matching with each other.Due to the assumed ideal processes andneglecting both frictional and thermallosses (assumptions 3, 6, and 7), adeviation of 3.6% to 7.1% for feed watertemperature of 50 °C, and 6.8% to 8.1%for feed water temperature of 36 °C areobserved.
0.02 0.04 0.06 0.08Feed water mass flow rate, mw1[kg/s]
1
2
3
4
5
P r o d u c t i v i
t y [ l i t / h r ]
Exper.at Tw1=36 oC
Model.at Tw1=36 oC
Exper.at Tw1=50 oC
Model.at Tw1=50 oC
Figure 3 Comparison between experimental andnumerical results of the steady-state production atdifferent values of the feed water mass flow rate.
0.02 0.04 0.06 0.08 0.1
Air mass flow rate, ma[kg/s]
1
2
3
4
5
P r o d u c t i v i t y [ l i t / h r ]
Exper.at Tw1=36 oC
Model.at Tw1=36 oC
Exper.at Tw1=50 oC
Model.at Tw1=50 oC
mw1
=0.06 kg/s, mcw
=0.11 kg/s
Tcwi=19oC, Tamb=17oC
Figure 4 Comparison between experimental andnumerical results of the steady-state production at
different values of the air mass flow rate.
5.2 Experimental Results
In order to measure the experimental datathermocouples connected to a temperaturerecorder have been used to measure thevarious temperatures, a water flow meter(rotameter) to measure the mass flow rateof water, and an anemometer is used tomeasure the mass flow rate of air.

7/24/2019 (HDH) desalination
http://slidepdf.com/reader/full/hdh-desalination 9/14
8
0.06 0.08 0.1 0.12 0.14 0.16Cooling water mass flow rate, m
cw[kg/s]
1
2
3
4
5
P r o d u c t i v i t y [ l i t / h r ]
Exper.at Tw1=36 oC
Model.at Tw1=36 oC
Exper.at Tw1=50 oC
Model.at Tw1=50 oC
ma=0.055 kg/s, m
w1=0.06 kg/s
Tcwi
=19oC, Tamb
=17oC
Figure 5 Comparison between experimental andnumerical results of the steady-state production at
different values of the cooling water mass flow rate.The effect of feed water mass flow rate onthe system productivity is presented inFigure 6. It depicts that the productivity ofthe system increases from 5.76 to 8.04lit/hr and from 4.32 to 5.76 lit/hr for feedwater temperature of 70 and 60°C,respectively. The results show that the
productivity of the system increases withincreasing the mass flow rate of feed waterand the feed water temperature.
Increasing the water production with thefeed water mass flow rate can be explainedclearly with the aid of Figures 7 and 8. Itcan be seen that the difference between theoutlet temperatures of the air leaving thehumidifier, Ta3, and inlet temperatures, Ta1,increases as the feed water mass flow rateincreases, thus relative humidity of the airincreases. This is due to the increasing incontact surface area between the feedwater and process air.
Figure 7 illustrates the transient variationsof the humidifier inlet air temperatures,Ta1, at different feed water mass flow rates.For constant feed water temperature, theinlet air temperature increases graduallyfrom the initial temperature of about 17°C(ambient temperature) to reach a steady-state operation in about 20 min. As well, itcan be seen from the figure that as the feed
water mass flow rate increases, the steady-state operation of the inlet air temperatureincreases.
Figure 8 depicts the transient trajectory ofthe humidifier outlet air temperatures, Ta3,at different feed water mass flow rates. The
outlet air temperature rises from the initialtemperature of about 17 °C to reach asteady-state operation in about 20 min forconstant feed water temperature of 50 °C.In addition, the results showed thatincreasing the feed water mass flow rateincreases the steady-state operation of theoutlet air temperature.
0.04 0.05 0.06 0.07 0.08
Feed water mass flow rate, mw1 [kg/s]
2
4
6
8
10
P r o d u c t i v i t y [ l i t / h r ]
Tw1=60 oC
Tw1=70 oC
ma=0.055 kg/s, mcw=0.11 kg/s
Tcwi=19 °C, Tamb=17 °C
Figure 6 Effect of feed water mass flow rate on thesystem steady-state productivity.
0 10 20 30Time [min]
16
18
20
22
24
26
28
T a 1
[ o C ]
ma= 0.055 kg/s, mcw= 0.11 kg/s
Tcwi= 19 oC, Tamb= 17 oC,
Tw1=50 oC
Figure 7 Transient variations of the inlet air
temperatures, Ta1, at different feed water mass flowrates.

7/24/2019 (HDH) desalination
http://slidepdf.com/reader/full/hdh-desalination 10/14
9
0 10 20 30
Time [min]
16
20
24
28
32
36
40
T a 3
[ o C ]
ma= 0.055 kg/s, mcw= 0.11 kg/s
Tcwi= 19 oC, Tamb= 17 oC, Tw1=50 oC
Figure 8 Transient variation of the outlet air
temperature,Ta3, at different feed water mass flowrates.
5.3 Parametric studyA number of runs have been performed inorder to assess the influence of thefollowing operating parameters on thetransient and steady-state productivity ofthe system:
Mass flow rates of the feed waterṁw1;
Mass flow rate of the process airṁa;
Mass flow rate of the cooling waterṁcw; and
Feed water temperature.
Figure 9 depicts the transient variation ofthe system productivity at different valuesof feed water mass flow rate at constantfeed water temperature of 50 °C. Thesystem reaches a steady-state productionafter about 20 minutes due to thermalinertia of the system.
The effect of the feed water mass flow rate
on the system steady-state productivity forair mass flow rate of 0.055 kg/s andcooling water of 0.11 kg/s at 19 °C is
presented in Figure 10. It illustrates thatthe productivity of the system increaseswith increasing feed water mass flow rate.The theoretical results show that thedecentralized HDH desalination systemconsidered in this study produces 8.04
lit/hr in the steady-state operation at feedwater temperature of 70 °C and mass flowrate of 0.08 kg/s.
Figure 11 shows the transient variation ofthe humidifier inlet air temperature, Ta1,
with constant air mass flow rate at differentfeed water mass flow rates and constantinlet water temperature of 50 °C. Theincrease of feed water mass flow rateincreases inlet air temperature. The steady-state operation is achieved after 20 min dueto thermal inertia of the system.
0 10 20 30Time [min]
0
1
2
3
4
5
P r o d u c t i v i t y [ l i t
/ h r ]
ma= 0.055 kg/s, mcw= 0.11 kg/s
Tcwi= 19 oC, Tamb= 17 oC, Tw1=50 oC
Figure 9 Transient production at different massflow rates of feed water at a constant temperature of50°C.
0.02 0.04 0.06 0.08Feed water mass flow rate, mw1[kg/s]
2
4
6
8
10
P r o d u c t i v i t y [ l i t / h r ]
Tw1=60 oC
Tw1=70 oC
Figure 10 Effect of inlet hot water mass flow rateon productivity.
7/24/2019 (HDH) desalination
http://slidepdf.com/reader/full/hdh-desalination 11/14
10
0 10 20 30Time [min]
16
18
20
22
24
26
28
T a 1 [
o C ]
mcw
= 0.11 kg/s, ma= 0.055 kg/s
Tcwi= 19 oC, Tamb= 17 oC
Figure 11 Inlet air temperatures, Ta1, of the
humidifier at different feed water mass flow rates
and inlet water temperature of 50°C.
0 10 20 30Time [min]
15
20
25
30
35
40
T a 3
[ o C ]
mcw= 0.11 kg/s, ma= 0.055 kg/s
Tcwi= 19 o C, Tamb= 17 o C
Figure 12 Outlet air temperatures, Ta3, of the
humidifier at different feed water mass flow ratesand inlet water temperature of 50 °C.
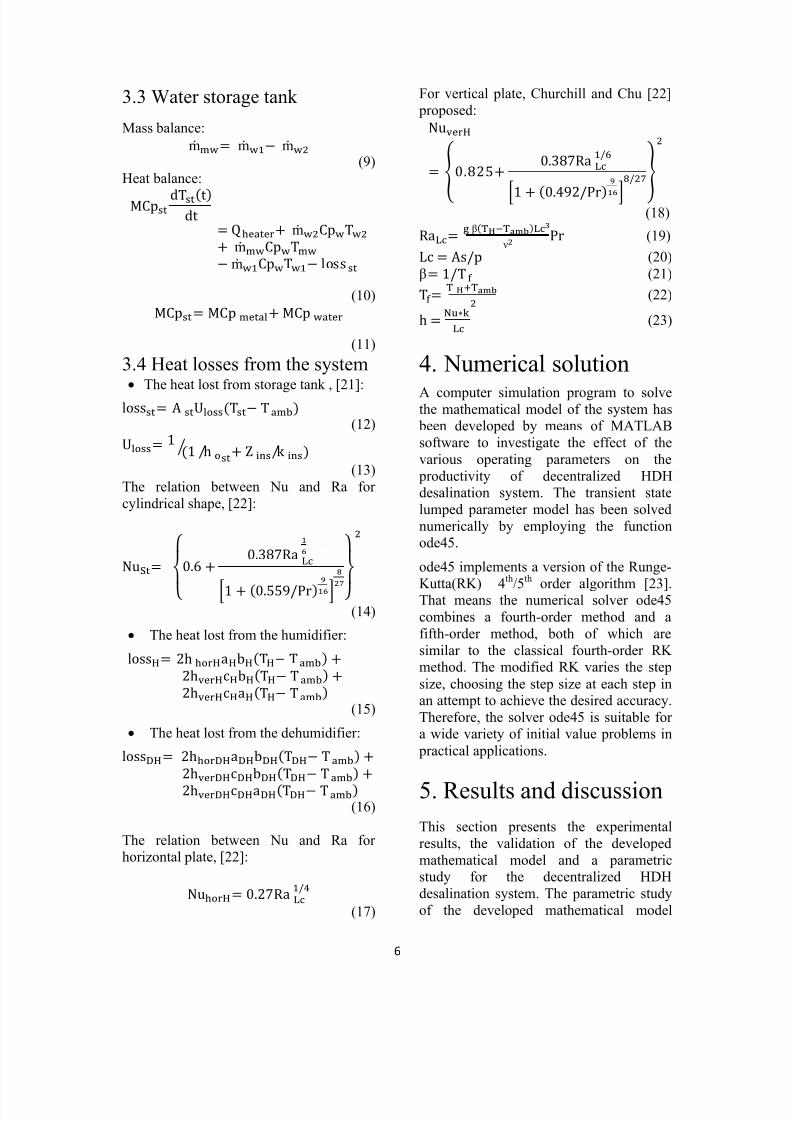
Figure 12 depicts the transient variation ofthe humidifier outlet air temperature, Ta3,with constant air mass flow rate at differentfeed water mass flow rates and constantinlet water temperature of 50 °C. Theincrease of feed water mass flow rateincreases the wet-bulb temperature of theair leaving the humidifier and approachesto the inlet feed water temperature.Consequently, the moisture content of theair leaving the humidifier increases and asignificant improvement on the system
productivity can be achieved by increasingthe feed water mass flow rate.
Figure 13 illustrates the transient variationof the system productivity with differentvalues of air mass flow rate at constant
feed water flow rate of 0.06 kg/s, constantinlet water temperature of 50 °C, coolingwater of constant mass flow rate of 0.11kg/s, and constant inlet cooling watertemperature of 19 °C. The system reachesthe steady-state production after about 20minutes due to thermal inertia of thesystem. The results also show that thesystem is capable of producing 4.26 lit/hrunder the previously mentioned conditionsand air mass flow rate of 0.1 kg/s.
0 10 20 30Time [min]
0
1
2
3
4
5
P r o d u c t i v i t y [ l i t / h r ]
ma=0.03 kg/s
ma=0.055 kg/s
ma=0.08 kg/s
ma=0.1 kg/s
mw1= 0.06 kg/s, m cw= 0.11 kg/s
Tcwi
= 19 oC, Tamb
= 17 o C
Figure 13 Transient production at different air massflow rates and inlet water temperature of 50°C.
0.02 0.04 0.06 0.08 0.1Air mass flow rate, ma[kg/s]
4
5
6
7
8
P r o d
u c t i v i t y [ l i t / h r ]
Tw1=60 oC
Tw1=70 oC
Figure 14 Effect of air mass flow rate on steady-state system productivity.

7/24/2019 (HDH) desalination
http://slidepdf.com/reader/full/hdh-desalination 12/14
11
It can be observed from Figure 14 that the productivity of the system increases byincreasing the air mass flow rate. This may
be due to the fact that increasing the airmass flow rate increases the entrainedwater vapour and, therefore, increases the
productivity. In addition, increasing the airmass flow rate increases the mass and heattransfer inside the humidifier, whichincreases the rate of vaporization of waterand, hence, the productivity.
Figure 15 depicts the transient variation ofthe system productivity with differentvalues of cooling water mass flow rate atconstant feed water mass flow rate of 0.06kg/s and inlet water temperature of50°C.The system reaches the steady-state
production after about 20 minutes due tothermal inertia of the system. Thenumerical results illustrate that the systemcould produce 3.98 lit/hr under the
previously mentioned conditions andcooling water mass flow rate of 0.15 kg/s.
The results shown in Figure 16 illustratethe effect of cooling water mass flow rateon the steady-state system productivity. Byincreasing the cooling water mass flowrate, significant drop in the surface
temperature of the cooler coil can beachieved and consequently, an increase ofthe rate of the condensation of the watercontent carried by the flowing air isachieved on the dehumidifier coil surface.
6. ConclusionsAn experimental study was performed toinvestigate the effect of different operatingconditions on the productivity of thedesalination system using the
humidification-dehumidification (HDH) process and to validate the developedmathematical model of the system.
The numerical results accord with theexperimental data in values and trend withdeviation ranges from 1.3% to 12.1% inthe steady-state system productivity fordifferent operating conditions.
0 10 20 30Time [min]
0
1
2
3
4
5
P r o d u c t i v i t y [ l i t / h r ]
mw1= 0.06 kg/s, ma= 0.055 kg/s
Tcwi = 19 o C, T amb = 17 o C
Figure 15Transient production at different massflow rates of cooling water for a constant feed watermass flow rate of 0.06 kg/s and constant inlet water
temperature of 50°C.
0.04 0.08 0.12 0.16 0.2Cooling water mass flow rate, mcw[kg/s]
4
5
6
7
8
P r o d u c t i v i t y [ l i t / h r ]
Tw1=60 oC
Tw1=70 oC
Figure 16 Effect of cooling water mass flow rate on
the steady-state system productivity.
Both experimental data and numericalresults show that the production increases
by increasing feed water mass flow rate,air mass flow rate, cooling water massflow rate, and feed water temperature.
For the considered system in the presentstudy, the numerical results depict that thedecentralized HDH desalination systemwith feed water mass flow rate of 0.08 kg/sat constant inlet water temperatures of 70°C, 60 °C, 50 °C and 36 °C, is capable of
producing steadily 8.42 lit/hr, 6.18 lit/hr,4.32 lit/hr and 2.31 lit/hr, respectively.

7/24/2019 (HDH) desalination
http://slidepdf.com/reader/full/hdh-desalination 13/14
12
While the experimental data show that thesystem produces 8.04 lit/hr, 5.76 lit/hr,4.08 lit/hr and 2.16 lit/hr for the sameoperating conditions.
Table 1 shows a comparison between this study andKabeel et al [10].
Researcher namePresentstudy
Kabeel[10]
Max. Product[kg/h]
8.04 23
Feed watertemperature,
Tw1[⁰C]70 50:90
Feed water massflow rate,ṁw1[kg/s]
0.080.01667
:0.06667
Deviation between Exp &
Theo
12.1% /5.9 %(max
/mean)
13% /7-8%
(max/mean)
Appendix
The values of constants used are;
Cpw=Cpwater=Cpcw=Cpprod=4.2kJ/kg.K
Cpair=Cpa= 1.007 kJ/kg.KCppacking= 1.9 kJ/kg.K
Cpmetal=0.42 kJ/kg.K for steel, 1.67kJ/kg.K for plastic
The parameters measured whileexperimental runs;
Tw1 (Feed water temperature)
ṁw1 (Feed water mass flow rate)
ṁa (Air mass flow rate)
ṁcw (Cooling water mass flow rate)ṁ prod (Production mass flow rate)
Ta3 (Outlet air temperature of humidifier)
Ta1 (Inlet air temperature of humidifier)
Tcwi (Cooling water inlet temperature)
Tcwo (Cooling water outlet temperature)
Tamb (Ambient air temperature)
The parameters Computed while numericalruns;
All other parameters computednumerically while using the numericalmodel.
References[1] G.D. Rai, Solar Energy Utilization: ATextbook for Engineering Students,Khanna Publishers, 1987.
[2] S. Al-Hallaj, S. Parekh, M.M. Farid,J.R. Selman, Solar desalination withhumidification–dehumidification cycle:Review of economics, Desalination,195(1–3) (2006) 169-186.
[3] J. Orfi, N. Galanis, M. Laplante, Airhumidification–dehumidification for awater desalination system using solarenergy, Desalination, 203(1–3) (2007)471-481.
[4] C. Yamalı, İ. Solmus, A solardesalination system using humidification– dehumidification process: experimentalstudy and comparison with the theoreticalresults, Desalination, 220(1–3) (2008) 538-551.
[5] A.M. Abdel Dayem, M. Fatouh,Experimental and numerical investigationof humidification/dehumidification solarwater desalination systems, Desalination,247(1–3) (2009) 594-609.
[6] G.P. Narayan, M.H. Sharqawy, E.K.Summers, J.H. Lienhard, S.M. Zubair,M.A. Antar, The potential of solar-drivenhumidification–dehumidificationdesalination for small-scale decentralized
water production, Renewable andSustainable Energy Reviews, 14(4) (2010)1187-1201.
[7] D. La, Y. Dai, H. Li, Y. Li, J.K.Kiplagat, R. Wang, Experimentalinvestigation and theoretical analysis ofsolar heating and humidification system
7/24/2019 (HDH) desalination
http://slidepdf.com/reader/full/hdh-desalination 14/14
13
with desiccant rotor, Energy and Buildings,43(5) (2011) 1113-1122.
[8] E.K. Summers, M.A. Antar, J.H.Lienhard V, Design and optimization of anair heating solar collector with integrated
phase change material energy storage foruse in humidification–dehumidificationdesalination, Solar Energy, 86(11) (2012)3417-3429.
[9] J.-h. Wang, N.-y. Gao, Y. Deng, Y.-l.Li, Solar power-driven humidification– dehumidification (HDH) process fordesalination of brackish water,Desalination, 305(0) (2012) 17-23.
[10] A.E. Kabeel, M.H. Hamed, Z.M.
Omara, S.W. Sharshir, Experimental studyof a humidification-dehumidification solartechnique by natural and forced aircirculation, Energy, 68(0) (2014) 218-228.
[11] Y. Ghalavand, M.S. Hatamipour, A.Rahimi, Humidification compressiondesalination, Desalination, 341(0) (2014)120-125.
[12] A.E. Kabeel, E.M.S. El-Said, Ahybrid solar desalination system of air
humidification, dehumidification and waterflashing evaporation: Part II. Experimentalinvestigation, Desalination, 341(0) (2014)50-60.
[13] K. Bourouni, M.T. Chaibi, L. Tadrist,Water desalination by humidification anddehumidification of air: State of the art,Desalination, 137(1–3) (2001) 167-176.
[14] H. Müller-Holst, M. Engelhardt, W.Schölkopf, Small-scale thermal seawater
desalination simulation and optimization ofsystem design, Desalination, 122(2–3)(1999) 255-262.
[15] Y.J. Dai, H.F. Zhang, Experimentalinvestigation of a solar desalination unitwith humidification and dehumidification,Desalination, 130(2) (2000) 169-175.
[16] E. Chafik, A new seawaterdesalination process using solar energy,Desalination, 153(1–3) (2003) 25-37.
[17] M.B. Amara, I. Houcine, A. Guizani,M. Mâalej, Theoretical and experimental
study of a pad humidifier used in aseawater desalination process,Desalination, 168(0) (2004) 1-12.
[18] A.S. Nafey, H.E.S. Fath, S.O. El-Helaby, A.M. Soliman, Solar desalinationusing humidification dehumidification
processes. Part I. A numericalinvestigation, Energy Conversion andManagement, 45(7–8) (2004) 1243-1261.
[19] A.S. Nafey, H.E.S. Fath, S.O. El-
Helaby, A. Soliman, Solar desalinationusing humidification–dehumidification processes. Part II. An experimentalinvestigation, Energy Conversion andManagement, 45(7–8) (2004) 1263-1277.
[20] S. Al-Hallaj, M.M. Farid, A. RahmanTamimi, Solar desalination with ahumidification-dehumidification cycle:
performance of the unit, Desalination,120(3) (1998) 273-280.
[21] C. Yamalı, İ. Solmuş, Theoreticalinvestigation of a humidification-dehumidification desalination systemconfigured by a double-pass flat plate solarair heater, Desalination, 205(1–3) (2007)163-177.
[22] S.W. Churchill, H.H.S. Chu,Correlating equations for laminar andturbulent free convection from a horizontalcylinder, International Journal of Heat andMass Transfer, 18(9) (1975) 1049-1053.
[23] J.R. Dormand, P.J. Prince, A family ofembedded Runge-Kutta formulae, Journalof Computational and AppliedMathematics, 6(1) (1980) 19-26.


![Technical specifications. - Setra · TopClass 500 S 515 HDH S 516 HDH S 517 HDH S 531 DT Air-conditioning system Refrigerant filling capacity [kg] 4.8 15.9 CO 2 equivalent [t] 6.864](https://static.fdocuments.in/doc/165x107/5ad0bd747f8b9a1d328ea769/technical-specifications-setra-500-s-515-hdh-s-516-hdh-s-517-hdh-s-531-dt-air-conditioning.jpg)

