HCM Signalized Intersection Capacity Analysis US 90 ... · HCM Signalized Intersection Capacity...
23
HCM Signalized Intersection Capacity Analysis US 90 Corridor Study 1: US 90 & Woodbine Rd 2017 AM Peak US 90 Corridor Study Synchro 7 - Report Page 1 Movement EBL EBT WBT WBR SBL SBR Lane Configurations Volume (vph) 280 785 1463 107 103 961 Ideal Flow (vphpl) 1900 1900 1900 1900 1900 1900 Total Lost time (s) 4.0 4.0 4.0 4.0 4.0 4.0 Lane Util. Factor 0.97 0.95 0.95 1.00 1.00 1.00 Frt 1.00 1.00 1.00 0.85 1.00 0.85 Flt Protected 0.95 1.00 1.00 1.00 0.95 1.00 Satd. Flow (prot) 3433 3539 3539 1583 1770 1583 Flt Permitted 0.95 1.00 1.00 1.00 0.95 1.00 Satd. Flow (perm) 3433 3539 3539 1583 1770 1583 Peak-hour factor, PHF 0.92 0.92 0.92 0.92 0.92 0.92 Growth Factor (vph) 105% 105% 105% 105% 105% 105% Adj. Flow (vph) 320 896 1670 122 118 1097 RTOR Reduction (vph) 0 0 0 28 0 102 Lane Group Flow (vph) 320 896 1670 94 118 995 Turn Type Prot Perm Perm Protected Phases 5 2 6 4 Permitted Phases 6 4 Actuated Green, G (s) 10.0 64.0 50.0 50.0 58.0 58.0 Effective Green, g (s) 10.0 64.0 50.0 50.0 58.0 58.0 Actuated g/C Ratio 0.08 0.49 0.38 0.38 0.45 0.45 Clearance Time (s) 4.0 4.0 4.0 4.0 4.0 4.0 Vehicle Extension (s) 3.0 3.0 3.0 3.0 3.0 3.0 Lane Grp Cap (vph) 264 1742 1361 609 790 706 v/s Ratio Prot c0.09 0.25 c0.47 0.07 v/s Ratio Perm 0.06 c0.63 v/c Ratio 1.21 0.51 1.23 0.15 0.15 1.41 Uniform Delay, d1 60.0 22.4 40.0 26.2 21.4 36.0 Progression Factor 1.00 1.00 1.00 1.00 1.00 1.00 Incremental Delay, d2 125.2 0.3 108.9 0.1 0.1 192.7 Delay (s) 185.2 22.7 148.9 26.3 21.5 228.7 Level of Service F C F C C F Approach Delay (s) 65.4 140.5 208.5 Approach LOS E F F Intersection Summary HCM Average Control Delay 138.5 HCM Level of Service F HCM Volume to Capacity ratio 1.32 Actuated Cycle Length (s) 130.0 Sum of lost time (s) 12.0 Intersection Capacity Utilization 111.6% ICU Level of Service H Analysis Period (min) 15 c Critical Lane Group
Transcript of HCM Signalized Intersection Capacity Analysis US 90 ... · HCM Signalized Intersection Capacity...

HCM Signalized Intersection Capacity Analysis US 90 Corridor Study1: US 90 & Woodbine Rd 2017 AM Peak
US 90 Corridor Study Synchro 7 - ReportPage 1
Movement EBL EBT WBT WBR SBL SBRLane ConfigurationsVolume (vph) 280 785 1463 107 103 961Ideal Flow (vphpl) 1900 1900 1900 1900 1900 1900Total Lost time (s) 4.0 4.0 4.0 4.0 4.0 4.0Lane Util. Factor 0.97 0.95 0.95 1.00 1.00 1.00Frt 1.00 1.00 1.00 0.85 1.00 0.85Flt Protected 0.95 1.00 1.00 1.00 0.95 1.00Satd. Flow (prot) 3433 3539 3539 1583 1770 1583Flt Permitted 0.95 1.00 1.00 1.00 0.95 1.00Satd. Flow (perm) 3433 3539 3539 1583 1770 1583Peak-hour factor, PHF 0.92 0.92 0.92 0.92 0.92 0.92Growth Factor (vph) 105% 105% 105% 105% 105% 105%Adj. Flow (vph) 320 896 1670 122 118 1097RTOR Reduction (vph) 0 0 0 28 0 102Lane Group Flow (vph) 320 896 1670 94 118 995Turn Type Prot Perm PermProtected Phases 5 2 6 4Permitted Phases 6 4Actuated Green, G (s) 10.0 64.0 50.0 50.0 58.0 58.0Effective Green, g (s) 10.0 64.0 50.0 50.0 58.0 58.0Actuated g/C Ratio 0.08 0.49 0.38 0.38 0.45 0.45Clearance Time (s) 4.0 4.0 4.0 4.0 4.0 4.0Vehicle Extension (s) 3.0 3.0 3.0 3.0 3.0 3.0Lane Grp Cap (vph) 264 1742 1361 609 790 706v/s Ratio Prot c0.09 0.25 c0.47 0.07v/s Ratio Perm 0.06 c0.63v/c Ratio 1.21 0.51 1.23 0.15 0.15 1.41Uniform Delay, d1 60.0 22.4 40.0 26.2 21.4 36.0Progression Factor 1.00 1.00 1.00 1.00 1.00 1.00Incremental Delay, d2 125.2 0.3 108.9 0.1 0.1 192.7Delay (s) 185.2 22.7 148.9 26.3 21.5 228.7Level of Service F C F C C FApproach Delay (s) 65.4 140.5 208.5Approach LOS E F F
Intersection SummaryHCM Average Control Delay 138.5 HCM Level of Service FHCM Volume to Capacity ratio 1.32Actuated Cycle Length (s) 130.0 Sum of lost time (s) 12.0Intersection Capacity Utilization 111.6% ICU Level of Service HAnalysis Period (min) 15c Critical Lane Group
HCM Unsignalized Intersection Capacity Analysis US 90 Corridor Study5: Diamond St & US 90 2017 AM Peak
US 90 Corridor Study Synchro 7 - ReportPage 2
Movement WBL WBR NBT NBR SBL SBTLane ConfigurationsVolume (veh/h) 84 5 765 28 4 1502Sign Control Stop Free FreeGrade 0% 0% 0%Peak Hour Factor 0.92 0.92 0.92 0.92 0.92 0.92Hourly flow rate (vph) 96 6 873 32 5 1714PedestriansLane Width (ft)Walking Speed (ft/s)Percent BlockageRight turn flare (veh)Median type None NoneMedian storage veh)Upstream signal (ft) 724pX, platoon unblocked 0.85 0.85 0.85vC, conflicting volume 1739 437 905vC1, stage 1 conf volvC2, stage 2 conf volvCu, unblocked vol 1517 0 536tC, single (s) 6.8 6.9 4.1tC, 2 stage (s)tF (s) 3.5 3.3 2.2p0 queue free % 0 99 99cM capacity (veh/h) 93 922 874
Direction, Lane # WB 1 NB 1 NB 2 NB 3 SB 1 SB 2 SB 3Volume Total 102 437 437 32 5 857 857Volume Left 96 0 0 0 5 0 0Volume Right 6 0 0 32 0 0 0cSH 98 1700 1700 1700 874 1700 1700Volume to Capacity 1.04 0.26 0.26 0.02 0.01 0.50 0.50Queue Length 95th (ft) 160 0 0 0 0 0 0Control Delay (s) 181.7 0.0 0.0 0.0 9.1 0.0 0.0Lane LOS F AApproach Delay (s) 181.7 0.0 0.0Approach LOS F
Intersection SummaryAverage Delay 6.8Intersection Capacity Utilization 55.5% ICU Level of Service BAnalysis Period (min) 15
HCM Signalized Intersection Capacity Analysis US 90 Corridor Study9: US 90 & Chumuckla Hwy 2017 AM Peak
US 90 Corridor Study Synchro 7 - ReportPage 3
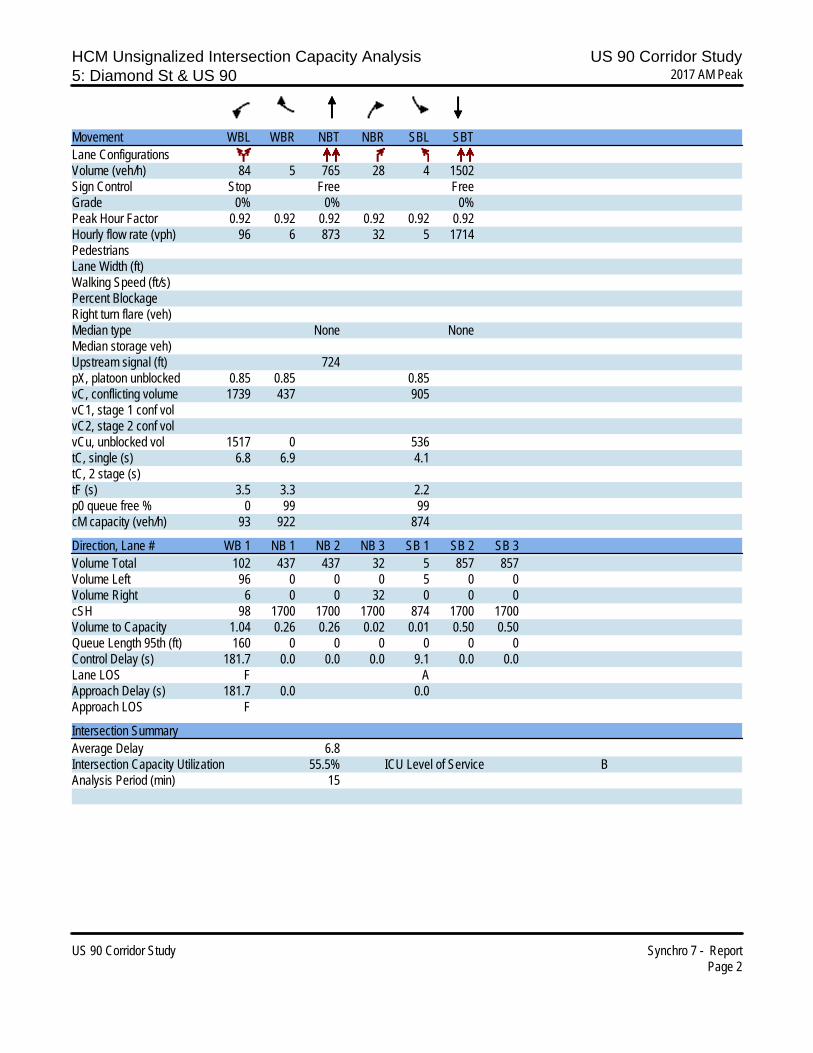
Movement EBL EBT EBR WBL WBT WBR NBL NBT NBR SBL SBT SBRLane ConfigurationsVolume (vph) 109 736 10 13 1164 67 47 40 22 136 16 344Ideal Flow (vphpl) 1900 1900 1900 1900 1900 1900 1900 1900 1900 1900 1900 1900Total Lost time (s) 4.0 4.0 4.0 4.0 4.0 4.0 4.0 4.0Lane Util. Factor 1.00 0.95 1.00 0.95 1.00 1.00 1.00 1.00Frt 1.00 1.00 1.00 0.99 1.00 0.95 1.00 0.86Flt Protected 0.95 1.00 0.95 1.00 0.95 1.00 0.95 1.00Satd. Flow (prot) 1770 3532 1770 3510 1770 1764 1770 1596Flt Permitted 0.10 1.00 0.31 1.00 0.36 1.00 0.62 1.00Satd. Flow (perm) 186 3532 575 3510 677 1764 1147 1596Peak-hour factor, PHF 0.92 0.92 0.92 0.92 0.92 0.92 0.92 0.92 0.92 0.92 0.92 0.92Growth Factor (vph) 105% 105% 105% 105% 105% 105% 105% 105% 105% 105% 105% 105%Adj. Flow (vph) 124 840 11 15 1328 76 54 46 25 155 18 393RTOR Reduction (vph) 0 1 0 0 5 0 0 21 0 0 245 0Lane Group Flow (vph) 124 850 0 15 1399 0 54 50 0 155 166 0Turn Type pm+pt pm+pt pm+pt pm+ptProtected Phases 5 2 1 6 3 8 7 4Permitted Phases 2 6 8 4Actuated Green, G (s) 45.9 40.8 37.2 36.1 15.1 11.0 18.5 12.7Effective Green, g (s) 45.9 40.8 37.2 36.1 15.1 11.0 18.5 12.7Actuated g/C Ratio 0.61 0.55 0.50 0.48 0.20 0.15 0.25 0.17Clearance Time (s) 4.0 4.0 4.0 4.0 4.0 4.0 4.0 4.0Vehicle Extension (s) 3.0 3.0 3.0 3.0 3.0 3.0 3.0 3.0Lane Grp Cap (vph) 237 1929 304 1696 197 260 332 271v/s Ratio Prot c0.04 0.24 0.00 c0.40 0.02 0.03 c0.04 c0.10v/s Ratio Perm 0.28 0.02 0.04 0.08v/c Ratio 0.52 0.44 0.05 0.83 0.27 0.19 0.47 0.61Uniform Delay, d1 12.2 10.1 9.5 16.6 24.9 27.9 23.2 28.7Progression Factor 1.00 1.00 1.00 1.00 1.00 1.00 1.00 1.00Incremental Delay, d2 2.1 0.2 0.1 3.4 0.8 0.4 1.0 4.1Delay (s) 14.3 10.3 9.6 20.0 25.6 28.3 24.2 32.8Level of Service B B A C C C C CApproach Delay (s) 10.8 19.9 27.1 30.5Approach LOS B B C C
Intersection SummaryHCM Average Control Delay 19.2 HCM Level of Service BHCM Volume to Capacity ratio 0.74Actuated Cycle Length (s) 74.7 Sum of lost time (s) 16.0Intersection Capacity Utilization 82.3% ICU Level of Service EAnalysis Period (min) 15c Critical Lane Group
HCM Signalized Intersection Capacity Analysis US 90 Corridor Study14: US 90 & W Spencer Field Rd 2017 AM Peak
US 90 Corridor Study Synchro 7 - ReportPage 4
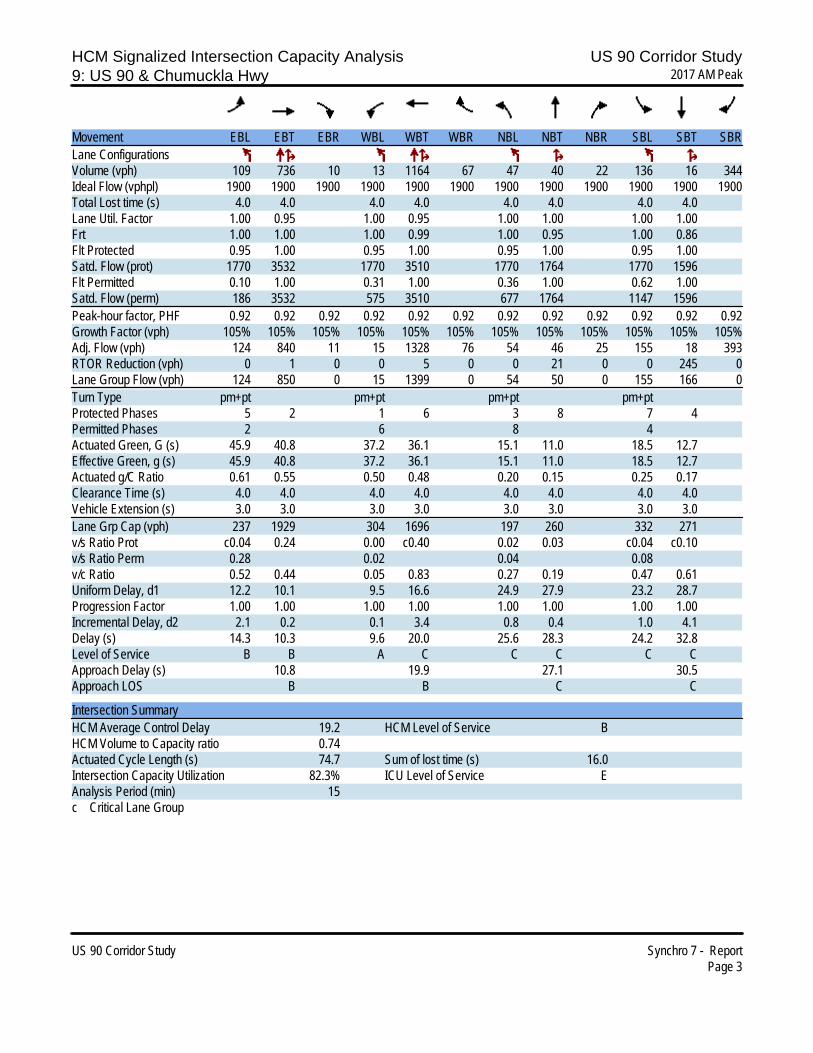
Movement EBL EBT EBR WBL WBT WBR NBL NBT NBR SBL SBT SBRLane ConfigurationsVolume (vph) 66 640 0 5 1049 70 0 0 0 167 0 246Ideal Flow (vphpl) 1900 1900 1900 1900 1900 1900 1900 1900 1900 1900 1900 1900Total Lost time (s) 4.0 4.0 4.0 4.0 4.0 4.0 4.0Lane Util. Factor 1.00 0.95 1.00 0.95 1.00 1.00 1.00Frt 1.00 1.00 1.00 1.00 0.85 1.00 0.85Flt Protected 0.95 1.00 0.95 1.00 1.00 0.95 1.00Satd. Flow (prot) 1593 3185 1593 3185 1425 1593 1425Flt Permitted 0.13 1.00 0.37 1.00 1.00 0.76 1.00Satd. Flow (perm) 219 3185 627 3185 1425 1269 1425Peak-hour factor, PHF 0.92 0.92 0.92 0.92 0.92 0.92 0.92 0.92 0.92 0.92 0.92 0.92Growth Factor (vph) 105% 105% 105% 105% 105% 105% 105% 105% 105% 105% 105% 105%Adj. Flow (vph) 75 730 0 6 1197 80 0 0 0 191 0 281RTOR Reduction (vph) 0 0 0 0 0 40 0 0 0 0 0 214Lane Group Flow (vph) 75 730 0 6 1197 40 0 0 0 0 191 67Turn Type pm+pt Perm pm+pt Perm Perm Perm PermProtected Phases 5 2 1 6 8 4Permitted Phases 2 2 6 6 8 4 4Actuated Green, G (s) 34.7 30.6 28.5 27.5 27.5 11.3 11.3Effective Green, g (s) 34.7 30.6 28.5 27.5 27.5 11.3 11.3Actuated g/C Ratio 0.63 0.56 0.52 0.50 0.50 0.21 0.21Clearance Time (s) 4.0 4.0 4.0 4.0 4.0 4.0 4.0Vehicle Extension (s) 3.0 3.0 3.0 3.0 3.0 3.0 3.0Lane Grp Cap (vph) 241 1775 343 1595 714 261 293v/s Ratio Prot c0.02 0.23 0.00 c0.38v/s Ratio Perm 0.17 0.01 0.03 c0.15 0.05v/c Ratio 0.31 0.41 0.02 0.75 0.06 0.73 0.23Uniform Delay, d1 6.1 7.0 6.4 11.0 7.0 20.4 18.2Progression Factor 1.00 1.00 1.00 1.00 1.00 1.00 1.00Incremental Delay, d2 0.7 0.2 0.0 2.0 0.0 10.1 0.4Delay (s) 6.8 7.1 6.4 13.0 7.1 30.5 18.6Level of Service A A A B A C BApproach Delay (s) 7.1 12.6 0.0 23.4Approach LOS A B A C
Intersection SummaryHCM Average Control Delay 12.9 HCM Level of Service BHCM Volume to Capacity ratio 0.78Actuated Cycle Length (s) 54.9 Sum of lost time (s) 16.0Intersection Capacity Utilization 58.9% ICU Level of Service BAnalysis Period (min) 15c Critical Lane Group
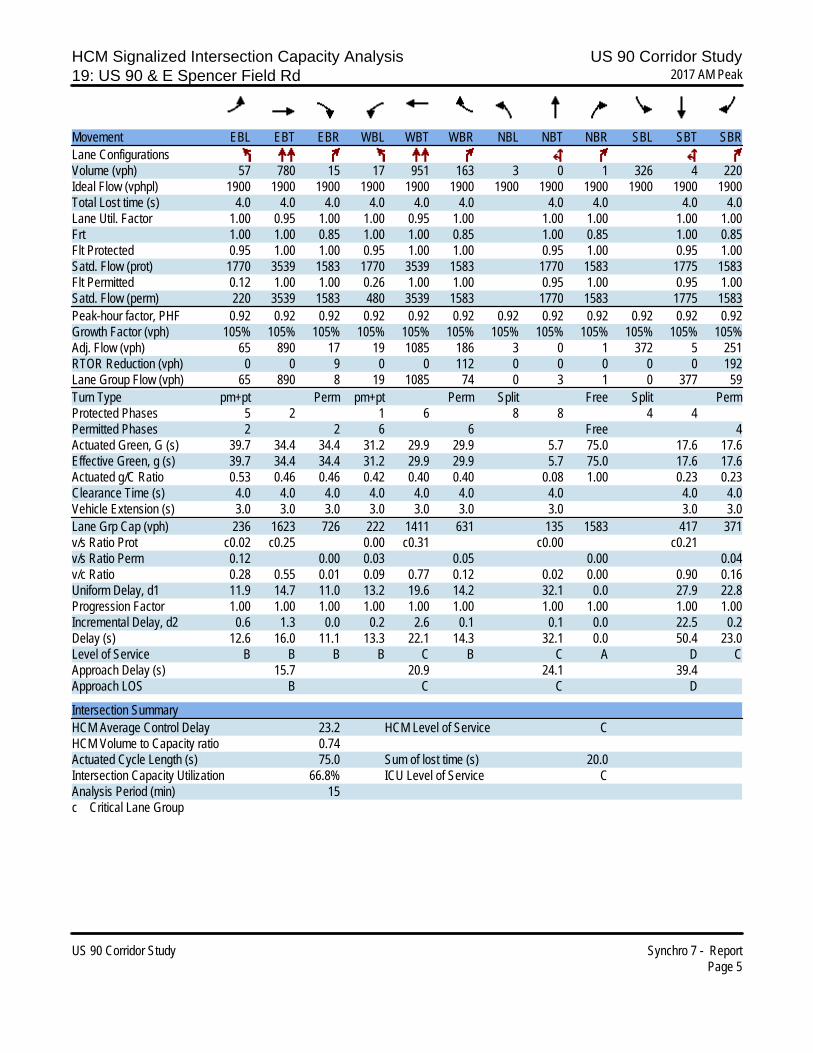
HCM Signalized Intersection Capacity Analysis US 90 Corridor Study19: US 90 & E Spencer Field Rd 2017 AM Peak
US 90 Corridor Study Synchro 7 - ReportPage 5
Movement EBL EBT EBR WBL WBT WBR NBL NBT NBR SBL SBT SBRLane ConfigurationsVolume (vph) 57 780 15 17 951 163 3 0 1 326 4 220Ideal Flow (vphpl) 1900 1900 1900 1900 1900 1900 1900 1900 1900 1900 1900 1900Total Lost time (s) 4.0 4.0 4.0 4.0 4.0 4.0 4.0 4.0 4.0 4.0Lane Util. Factor 1.00 0.95 1.00 1.00 0.95 1.00 1.00 1.00 1.00 1.00Frt 1.00 1.00 0.85 1.00 1.00 0.85 1.00 0.85 1.00 0.85Flt Protected 0.95 1.00 1.00 0.95 1.00 1.00 0.95 1.00 0.95 1.00Satd. Flow (prot) 1770 3539 1583 1770 3539 1583 1770 1583 1775 1583Flt Permitted 0.12 1.00 1.00 0.26 1.00 1.00 0.95 1.00 0.95 1.00Satd. Flow (perm) 220 3539 1583 480 3539 1583 1770 1583 1775 1583Peak-hour factor, PHF 0.92 0.92 0.92 0.92 0.92 0.92 0.92 0.92 0.92 0.92 0.92 0.92Growth Factor (vph) 105% 105% 105% 105% 105% 105% 105% 105% 105% 105% 105% 105%Adj. Flow (vph) 65 890 17 19 1085 186 3 0 1 372 5 251RTOR Reduction (vph) 0 0 9 0 0 112 0 0 0 0 0 192Lane Group Flow (vph) 65 890 8 19 1085 74 0 3 1 0 377 59Turn Type pm+pt Perm pm+pt Perm Split Free Split PermProtected Phases 5 2 1 6 8 8 4 4Permitted Phases 2 2 6 6 Free 4Actuated Green, G (s) 39.7 34.4 34.4 31.2 29.9 29.9 5.7 75.0 17.6 17.6Effective Green, g (s) 39.7 34.4 34.4 31.2 29.9 29.9 5.7 75.0 17.6 17.6Actuated g/C Ratio 0.53 0.46 0.46 0.42 0.40 0.40 0.08 1.00 0.23 0.23Clearance Time (s) 4.0 4.0 4.0 4.0 4.0 4.0 4.0 4.0 4.0Vehicle Extension (s) 3.0 3.0 3.0 3.0 3.0 3.0 3.0 3.0 3.0Lane Grp Cap (vph) 236 1623 726 222 1411 631 135 1583 417 371v/s Ratio Prot c0.02 c0.25 0.00 c0.31 c0.00 c0.21v/s Ratio Perm 0.12 0.00 0.03 0.05 0.00 0.04v/c Ratio 0.28 0.55 0.01 0.09 0.77 0.12 0.02 0.00 0.90 0.16Uniform Delay, d1 11.9 14.7 11.0 13.2 19.6 14.2 32.1 0.0 27.9 22.8Progression Factor 1.00 1.00 1.00 1.00 1.00 1.00 1.00 1.00 1.00 1.00Incremental Delay, d2 0.6 1.3 0.0 0.2 2.6 0.1 0.1 0.0 22.5 0.2Delay (s) 12.6 16.0 11.1 13.3 22.1 14.3 32.1 0.0 50.4 23.0Level of Service B B B B C B C A D CApproach Delay (s) 15.7 20.9 24.1 39.4Approach LOS B C C D
Intersection SummaryHCM Average Control Delay 23.2 HCM Level of Service CHCM Volume to Capacity ratio 0.74Actuated Cycle Length (s) 75.0 Sum of lost time (s) 20.0Intersection Capacity Utilization 66.8% ICU Level of Service CAnalysis Period (min) 15c Critical Lane Group
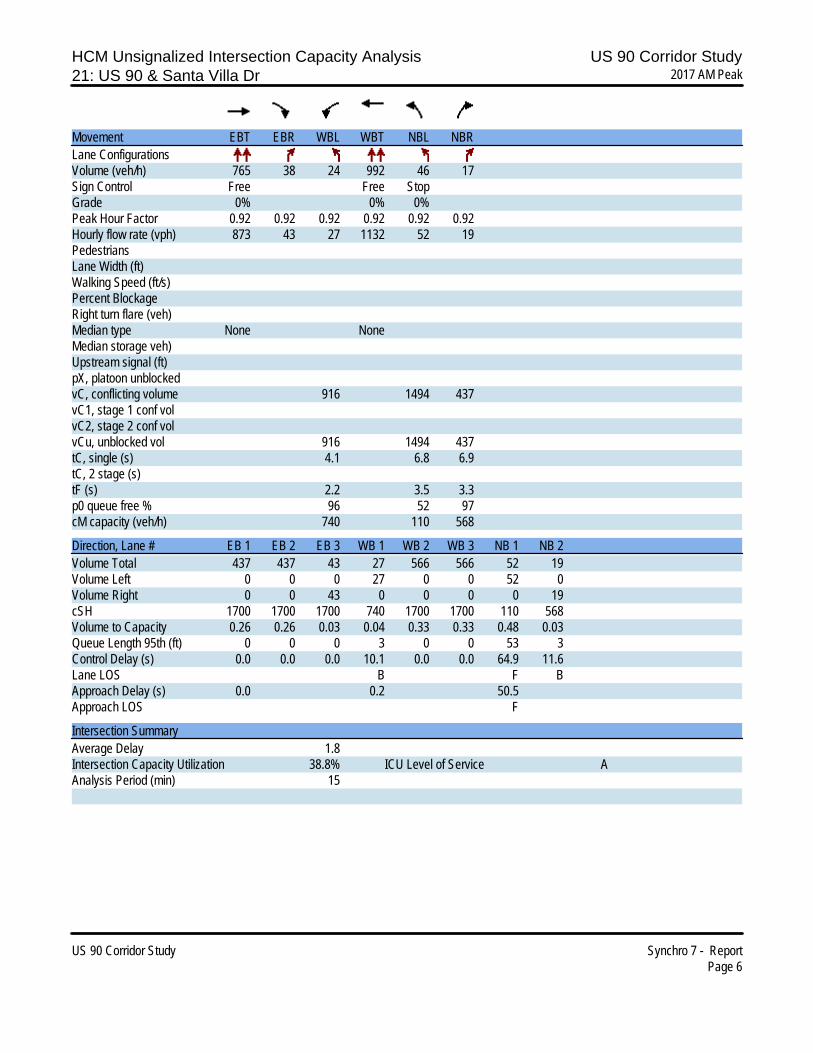
HCM Unsignalized Intersection Capacity Analysis US 90 Corridor Study21: US 90 & Santa Villa Dr 2017 AM Peak
US 90 Corridor Study Synchro 7 - ReportPage 6
Movement EBT EBR WBL WBT NBL NBRLane ConfigurationsVolume (veh/h) 765 38 24 992 46 17Sign Control Free Free StopGrade 0% 0% 0%Peak Hour Factor 0.92 0.92 0.92 0.92 0.92 0.92Hourly flow rate (vph) 873 43 27 1132 52 19PedestriansLane Width (ft)Walking Speed (ft/s)Percent BlockageRight turn flare (veh)Median type None NoneMedian storage veh)Upstream signal (ft)pX, platoon unblockedvC, conflicting volume 916 1494 437vC1, stage 1 conf volvC2, stage 2 conf volvCu, unblocked vol 916 1494 437tC, single (s) 4.1 6.8 6.9tC, 2 stage (s)tF (s) 2.2 3.5 3.3p0 queue free % 96 52 97cM capacity (veh/h) 740 110 568
Direction, Lane # EB 1 EB 2 EB 3 WB 1 WB 2 WB 3 NB 1 NB 2Volume Total 437 437 43 27 566 566 52 19Volume Left 0 0 0 27 0 0 52 0Volume Right 0 0 43 0 0 0 0 19cSH 1700 1700 1700 740 1700 1700 110 568Volume to Capacity 0.26 0.26 0.03 0.04 0.33 0.33 0.48 0.03Queue Length 95th (ft) 0 0 0 3 0 0 53 3Control Delay (s) 0.0 0.0 0.0 10.1 0.0 0.0 64.9 11.6Lane LOS B F BApproach Delay (s) 0.0 0.2 50.5Approach LOS F
Intersection SummaryAverage Delay 1.8Intersection Capacity Utilization 38.8% ICU Level of Service AAnalysis Period (min) 15
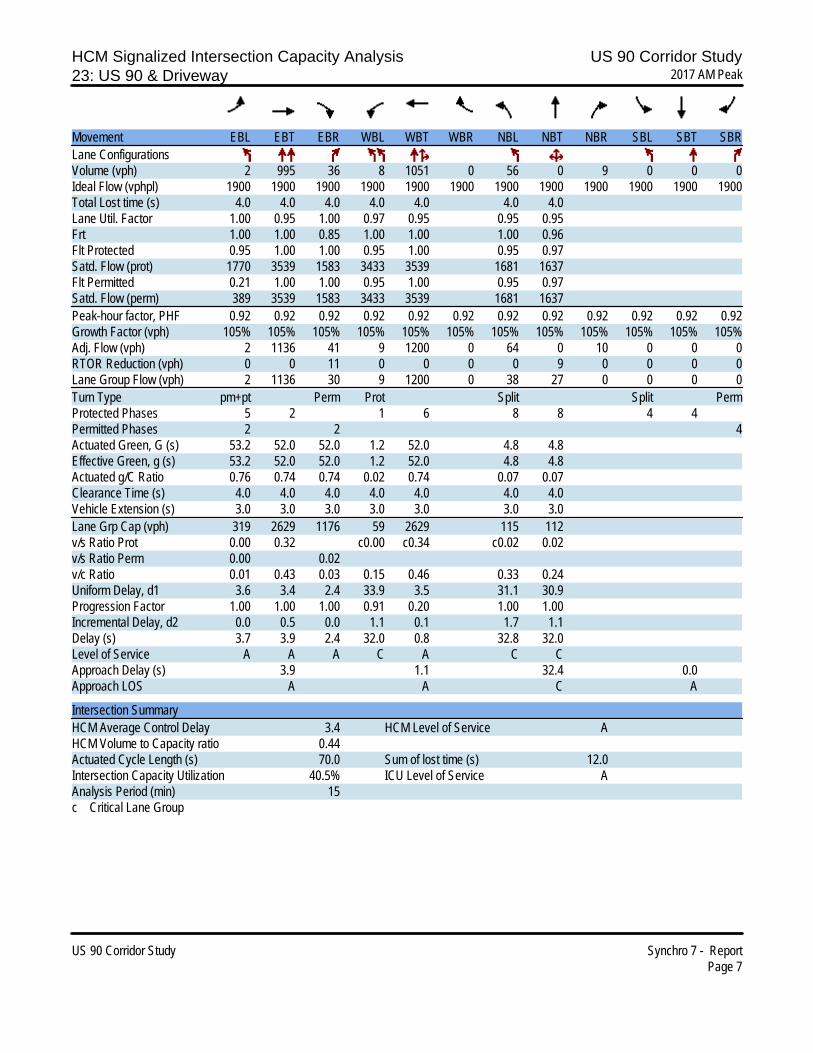
HCM Signalized Intersection Capacity Analysis US 90 Corridor Study23: US 90 & Driveway 2017 AM Peak
US 90 Corridor Study Synchro 7 - ReportPage 7
Movement EBL EBT EBR WBL WBT WBR NBL NBT NBR SBL SBT SBRLane ConfigurationsVolume (vph) 2 995 36 8 1051 0 56 0 9 0 0 0Ideal Flow (vphpl) 1900 1900 1900 1900 1900 1900 1900 1900 1900 1900 1900 1900Total Lost time (s) 4.0 4.0 4.0 4.0 4.0 4.0 4.0Lane Util. Factor 1.00 0.95 1.00 0.97 0.95 0.95 0.95Frt 1.00 1.00 0.85 1.00 1.00 1.00 0.96Flt Protected 0.95 1.00 1.00 0.95 1.00 0.95 0.97Satd. Flow (prot) 1770 3539 1583 3433 3539 1681 1637Flt Permitted 0.21 1.00 1.00 0.95 1.00 0.95 0.97Satd. Flow (perm) 389 3539 1583 3433 3539 1681 1637Peak-hour factor, PHF 0.92 0.92 0.92 0.92 0.92 0.92 0.92 0.92 0.92 0.92 0.92 0.92Growth Factor (vph) 105% 105% 105% 105% 105% 105% 105% 105% 105% 105% 105% 105%Adj. Flow (vph) 2 1136 41 9 1200 0 64 0 10 0 0 0RTOR Reduction (vph) 0 0 11 0 0 0 0 9 0 0 0 0Lane Group Flow (vph) 2 1136 30 9 1200 0 38 27 0 0 0 0Turn Type pm+pt Perm Prot Split Split PermProtected Phases 5 2 1 6 8 8 4 4Permitted Phases 2 2 4Actuated Green, G (s) 53.2 52.0 52.0 1.2 52.0 4.8 4.8Effective Green, g (s) 53.2 52.0 52.0 1.2 52.0 4.8 4.8Actuated g/C Ratio 0.76 0.74 0.74 0.02 0.74 0.07 0.07Clearance Time (s) 4.0 4.0 4.0 4.0 4.0 4.0 4.0Vehicle Extension (s) 3.0 3.0 3.0 3.0 3.0 3.0 3.0Lane Grp Cap (vph) 319 2629 1176 59 2629 115 112v/s Ratio Prot 0.00 0.32 c0.00 c0.34 c0.02 0.02v/s Ratio Perm 0.00 0.02v/c Ratio 0.01 0.43 0.03 0.15 0.46 0.33 0.24Uniform Delay, d1 3.6 3.4 2.4 33.9 3.5 31.1 30.9Progression Factor 1.00 1.00 1.00 0.91 0.20 1.00 1.00Incremental Delay, d2 0.0 0.5 0.0 1.1 0.1 1.7 1.1Delay (s) 3.7 3.9 2.4 32.0 0.8 32.8 32.0Level of Service A A A C A C CApproach Delay (s) 3.9 1.1 32.4 0.0Approach LOS A A C A
Intersection SummaryHCM Average Control Delay 3.4 HCM Level of Service AHCM Volume to Capacity ratio 0.44Actuated Cycle Length (s) 70.0 Sum of lost time (s) 12.0Intersection Capacity Utilization 40.5% ICU Level of Service AAnalysis Period (min) 15c Critical Lane Group
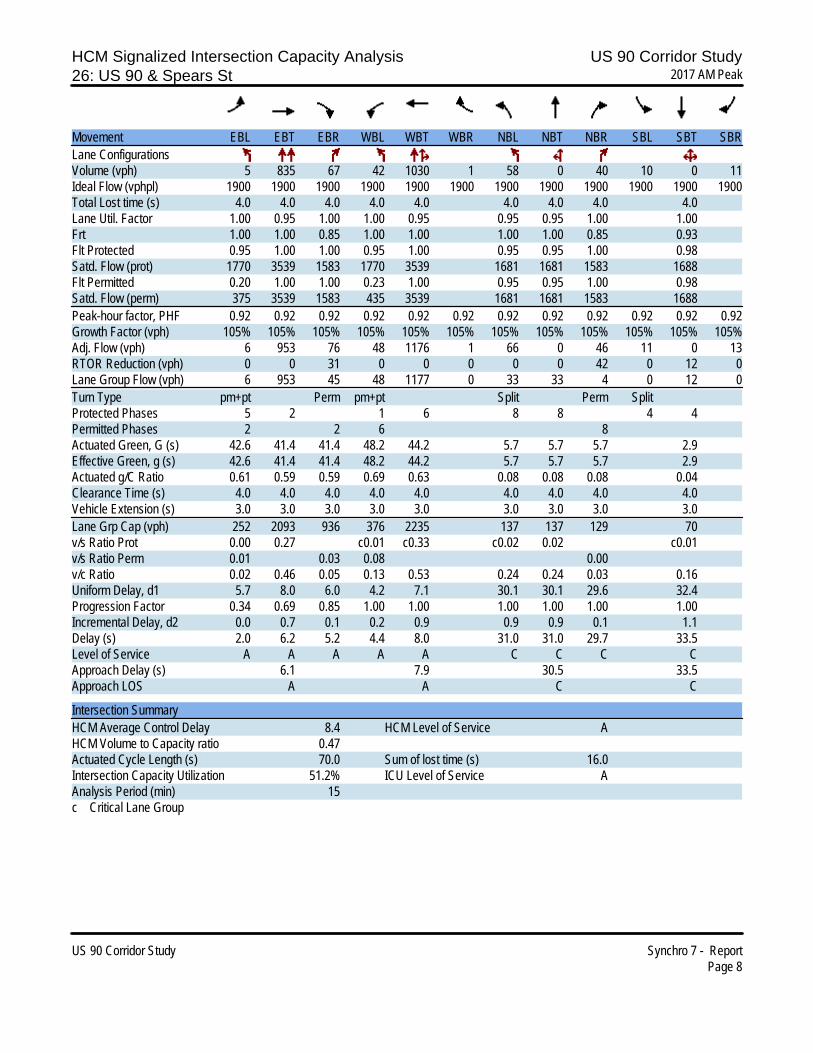
HCM Signalized Intersection Capacity Analysis US 90 Corridor Study26: US 90 & Spears St 2017 AM Peak
US 90 Corridor Study Synchro 7 - ReportPage 8
Movement EBL EBT EBR WBL WBT WBR NBL NBT NBR SBL SBT SBRLane ConfigurationsVolume (vph) 5 835 67 42 1030 1 58 0 40 10 0 11Ideal Flow (vphpl) 1900 1900 1900 1900 1900 1900 1900 1900 1900 1900 1900 1900Total Lost time (s) 4.0 4.0 4.0 4.0 4.0 4.0 4.0 4.0 4.0Lane Util. Factor 1.00 0.95 1.00 1.00 0.95 0.95 0.95 1.00 1.00Frt 1.00 1.00 0.85 1.00 1.00 1.00 1.00 0.85 0.93Flt Protected 0.95 1.00 1.00 0.95 1.00 0.95 0.95 1.00 0.98Satd. Flow (prot) 1770 3539 1583 1770 3539 1681 1681 1583 1688Flt Permitted 0.20 1.00 1.00 0.23 1.00 0.95 0.95 1.00 0.98Satd. Flow (perm) 375 3539 1583 435 3539 1681 1681 1583 1688Peak-hour factor, PHF 0.92 0.92 0.92 0.92 0.92 0.92 0.92 0.92 0.92 0.92 0.92 0.92Growth Factor (vph) 105% 105% 105% 105% 105% 105% 105% 105% 105% 105% 105% 105%Adj. Flow (vph) 6 953 76 48 1176 1 66 0 46 11 0 13RTOR Reduction (vph) 0 0 31 0 0 0 0 0 42 0 12 0Lane Group Flow (vph) 6 953 45 48 1177 0 33 33 4 0 12 0Turn Type pm+pt Perm pm+pt Split Perm SplitProtected Phases 5 2 1 6 8 8 4 4Permitted Phases 2 2 6 8Actuated Green, G (s) 42.6 41.4 41.4 48.2 44.2 5.7 5.7 5.7 2.9Effective Green, g (s) 42.6 41.4 41.4 48.2 44.2 5.7 5.7 5.7 2.9Actuated g/C Ratio 0.61 0.59 0.59 0.69 0.63 0.08 0.08 0.08 0.04Clearance Time (s) 4.0 4.0 4.0 4.0 4.0 4.0 4.0 4.0 4.0Vehicle Extension (s) 3.0 3.0 3.0 3.0 3.0 3.0 3.0 3.0 3.0Lane Grp Cap (vph) 252 2093 936 376 2235 137 137 129 70v/s Ratio Prot 0.00 0.27 c0.01 c0.33 c0.02 0.02 c0.01v/s Ratio Perm 0.01 0.03 0.08 0.00v/c Ratio 0.02 0.46 0.05 0.13 0.53 0.24 0.24 0.03 0.16Uniform Delay, d1 5.7 8.0 6.0 4.2 7.1 30.1 30.1 29.6 32.4Progression Factor 0.34 0.69 0.85 1.00 1.00 1.00 1.00 1.00 1.00Incremental Delay, d2 0.0 0.7 0.1 0.2 0.9 0.9 0.9 0.1 1.1Delay (s) 2.0 6.2 5.2 4.4 8.0 31.0 31.0 29.7 33.5Level of Service A A A A A C C C CApproach Delay (s) 6.1 7.9 30.5 33.5Approach LOS A A C C
Intersection SummaryHCM Average Control Delay 8.4 HCM Level of Service AHCM Volume to Capacity ratio 0.47Actuated Cycle Length (s) 70.0 Sum of lost time (s) 16.0Intersection Capacity Utilization 51.2% ICU Level of Service AAnalysis Period (min) 15c Critical Lane Group
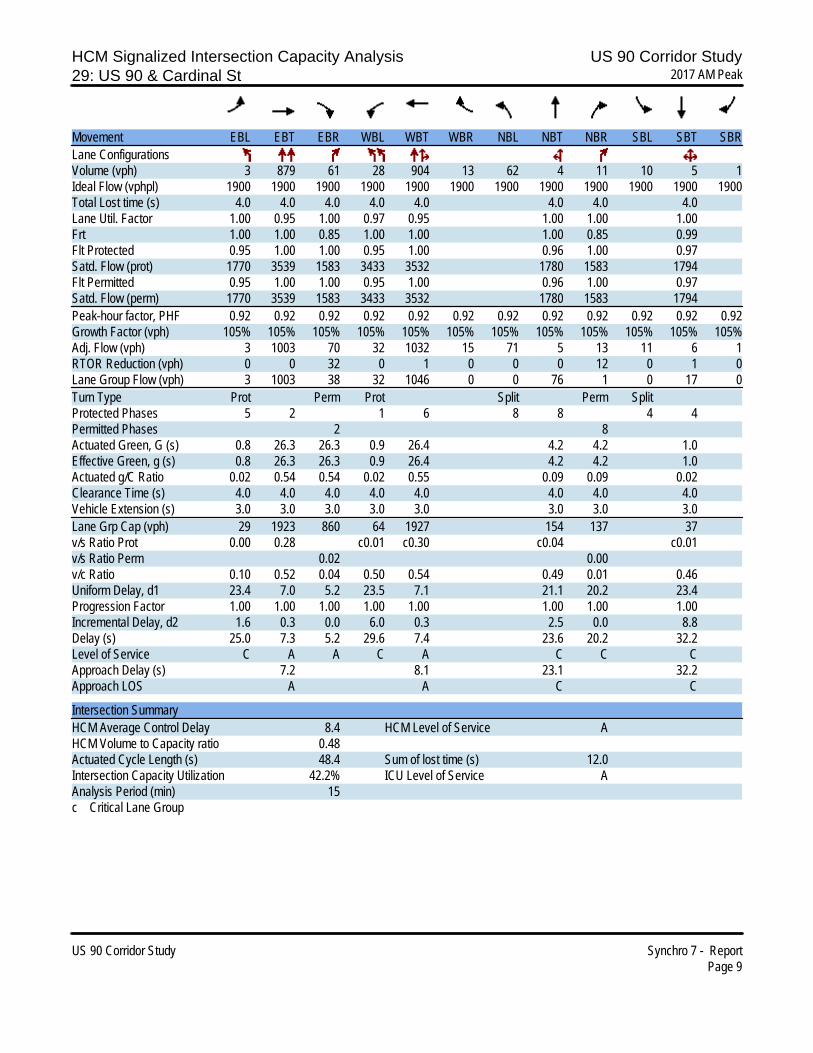
HCM Signalized Intersection Capacity Analysis US 90 Corridor Study29: US 90 & Cardinal St 2017 AM Peak
US 90 Corridor Study Synchro 7 - ReportPage 9
Movement EBL EBT EBR WBL WBT WBR NBL NBT NBR SBL SBT SBRLane ConfigurationsVolume (vph) 3 879 61 28 904 13 62 4 11 10 5 1Ideal Flow (vphpl) 1900 1900 1900 1900 1900 1900 1900 1900 1900 1900 1900 1900Total Lost time (s) 4.0 4.0 4.0 4.0 4.0 4.0 4.0 4.0Lane Util. Factor 1.00 0.95 1.00 0.97 0.95 1.00 1.00 1.00Frt 1.00 1.00 0.85 1.00 1.00 1.00 0.85 0.99Flt Protected 0.95 1.00 1.00 0.95 1.00 0.96 1.00 0.97Satd. Flow (prot) 1770 3539 1583 3433 3532 1780 1583 1794Flt Permitted 0.95 1.00 1.00 0.95 1.00 0.96 1.00 0.97Satd. Flow (perm) 1770 3539 1583 3433 3532 1780 1583 1794Peak-hour factor, PHF 0.92 0.92 0.92 0.92 0.92 0.92 0.92 0.92 0.92 0.92 0.92 0.92Growth Factor (vph) 105% 105% 105% 105% 105% 105% 105% 105% 105% 105% 105% 105%Adj. Flow (vph) 3 1003 70 32 1032 15 71 5 13 11 6 1RTOR Reduction (vph) 0 0 32 0 1 0 0 0 12 0 1 0Lane Group Flow (vph) 3 1003 38 32 1046 0 0 76 1 0 17 0Turn Type Prot Perm Prot Split Perm SplitProtected Phases 5 2 1 6 8 8 4 4Permitted Phases 2 8Actuated Green, G (s) 0.8 26.3 26.3 0.9 26.4 4.2 4.2 1.0Effective Green, g (s) 0.8 26.3 26.3 0.9 26.4 4.2 4.2 1.0Actuated g/C Ratio 0.02 0.54 0.54 0.02 0.55 0.09 0.09 0.02Clearance Time (s) 4.0 4.0 4.0 4.0 4.0 4.0 4.0 4.0Vehicle Extension (s) 3.0 3.0 3.0 3.0 3.0 3.0 3.0 3.0Lane Grp Cap (vph) 29 1923 860 64 1927 154 137 37v/s Ratio Prot 0.00 0.28 c0.01 c0.30 c0.04 c0.01v/s Ratio Perm 0.02 0.00v/c Ratio 0.10 0.52 0.04 0.50 0.54 0.49 0.01 0.46Uniform Delay, d1 23.4 7.0 5.2 23.5 7.1 21.1 20.2 23.4Progression Factor 1.00 1.00 1.00 1.00 1.00 1.00 1.00 1.00Incremental Delay, d2 1.6 0.3 0.0 6.0 0.3 2.5 0.0 8.8Delay (s) 25.0 7.3 5.2 29.6 7.4 23.6 20.2 32.2Level of Service C A A C A C C CApproach Delay (s) 7.2 8.1 23.1 32.2Approach LOS A A C C
Intersection SummaryHCM Average Control Delay 8.4 HCM Level of Service AHCM Volume to Capacity ratio 0.48Actuated Cycle Length (s) 48.4 Sum of lost time (s) 12.0Intersection Capacity Utilization 42.2% ICU Level of Service AAnalysis Period (min) 15c Critical Lane Group

HCM Unsignalized Intersection Capacity Analysis US 90 Corridor Study32: US 90 & Keyser Ln 2017 AM Peak
US 90 Corridor Study Synchro 7 - ReportPage 10
Movement EBL EBT EBR WBL WBT WBR NBL NBT NBR SBL SBT SBRLane ConfigurationsVolume (veh/h) 23 753 16 144 905 8 44 0 71 14 2 19Sign Control Free Free Stop StopGrade 0% 0% 0% 0%Peak Hour Factor 0.92 0.92 0.92 0.92 0.92 0.92 0.92 0.92 0.92 0.92 0.92 0.92Hourly flow rate (vph) 26 859 18 164 1033 9 50 0 81 16 2 22PedestriansLane Width (ft)Walking Speed (ft/s)Percent BlockageRight turn flare (veh) 8Median type None NoneMedian storage veh)Upstream signal (ft) 818 1254pX, platoon unblocked 0.98 0.96 0.97 0.97 0.96 0.97 0.97 0.98vC, conflicting volume 1042 878 1780 2283 430 1848 2296 521vC1, stage 1 conf volvC2, stage 2 conf volvCu, unblocked vol 998 783 1638 2158 315 1709 2172 466tC, single (s) 4.1 4.1 7.5 6.5 6.9 7.5 6.5 6.9tC, 2 stage (s)tF (s) 2.2 2.2 3.5 4.0 3.3 3.5 4.0 3.3p0 queue free % 96 79 0 100 88 61 93 96cM capacity (veh/h) 674 795 48 35 652 41 34 532
Direction, Lane # EB 1 EB 2 EB 3 EB 4 WB 1 WB 2 WB 3 NB 1 SB 1Volume Total 26 430 430 18 164 689 353 131 40Volume Left 26 0 0 0 164 0 0 50 16Volume Right 0 0 0 18 0 0 9 81 22cSH 674 1700 1700 1700 795 1700 1700 125 80Volume to Capacity 0.04 0.25 0.25 0.01 0.21 0.41 0.21 1.05 0.50Queue Length 95th (ft) 3 0 0 0 19 0 0 185 53Control Delay (s) 10.6 0.0 0.0 0.0 10.7 0.0 0.0 114.1 88.8Lane LOS B B F FApproach Delay (s) 0.3 1.5 114.1 88.8Approach LOS F F
Intersection SummaryAverage Delay 9.0Intersection Capacity Utilization 49.0% ICU Level of Service AAnalysis Period (min) 15
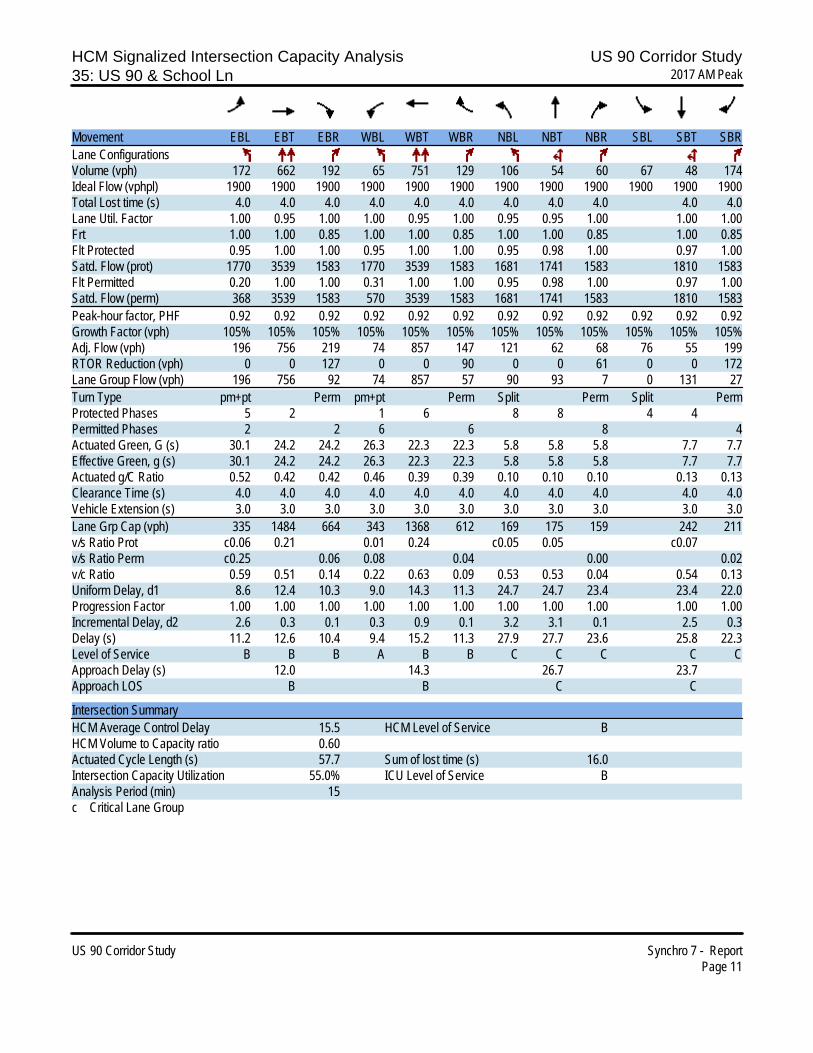
HCM Signalized Intersection Capacity Analysis US 90 Corridor Study35: US 90 & School Ln 2017 AM Peak
US 90 Corridor Study Synchro 7 - ReportPage 11
Movement EBL EBT EBR WBL WBT WBR NBL NBT NBR SBL SBT SBRLane ConfigurationsVolume (vph) 172 662 192 65 751 129 106 54 60 67 48 174Ideal Flow (vphpl) 1900 1900 1900 1900 1900 1900 1900 1900 1900 1900 1900 1900Total Lost time (s) 4.0 4.0 4.0 4.0 4.0 4.0 4.0 4.0 4.0 4.0 4.0Lane Util. Factor 1.00 0.95 1.00 1.00 0.95 1.00 0.95 0.95 1.00 1.00 1.00Frt 1.00 1.00 0.85 1.00 1.00 0.85 1.00 1.00 0.85 1.00 0.85Flt Protected 0.95 1.00 1.00 0.95 1.00 1.00 0.95 0.98 1.00 0.97 1.00Satd. Flow (prot) 1770 3539 1583 1770 3539 1583 1681 1741 1583 1810 1583Flt Permitted 0.20 1.00 1.00 0.31 1.00 1.00 0.95 0.98 1.00 0.97 1.00Satd. Flow (perm) 368 3539 1583 570 3539 1583 1681 1741 1583 1810 1583Peak-hour factor, PHF 0.92 0.92 0.92 0.92 0.92 0.92 0.92 0.92 0.92 0.92 0.92 0.92Growth Factor (vph) 105% 105% 105% 105% 105% 105% 105% 105% 105% 105% 105% 105%Adj. Flow (vph) 196 756 219 74 857 147 121 62 68 76 55 199RTOR Reduction (vph) 0 0 127 0 0 90 0 0 61 0 0 172Lane Group Flow (vph) 196 756 92 74 857 57 90 93 7 0 131 27Turn Type pm+pt Perm pm+pt Perm Split Perm Split PermProtected Phases 5 2 1 6 8 8 4 4Permitted Phases 2 2 6 6 8 4Actuated Green, G (s) 30.1 24.2 24.2 26.3 22.3 22.3 5.8 5.8 5.8 7.7 7.7Effective Green, g (s) 30.1 24.2 24.2 26.3 22.3 22.3 5.8 5.8 5.8 7.7 7.7Actuated g/C Ratio 0.52 0.42 0.42 0.46 0.39 0.39 0.10 0.10 0.10 0.13 0.13Clearance Time (s) 4.0 4.0 4.0 4.0 4.0 4.0 4.0 4.0 4.0 4.0 4.0Vehicle Extension (s) 3.0 3.0 3.0 3.0 3.0 3.0 3.0 3.0 3.0 3.0 3.0Lane Grp Cap (vph) 335 1484 664 343 1368 612 169 175 159 242 211v/s Ratio Prot c0.06 0.21 0.01 0.24 c0.05 0.05 c0.07v/s Ratio Perm c0.25 0.06 0.08 0.04 0.00 0.02v/c Ratio 0.59 0.51 0.14 0.22 0.63 0.09 0.53 0.53 0.04 0.54 0.13Uniform Delay, d1 8.6 12.4 10.3 9.0 14.3 11.3 24.7 24.7 23.4 23.4 22.0Progression Factor 1.00 1.00 1.00 1.00 1.00 1.00 1.00 1.00 1.00 1.00 1.00Incremental Delay, d2 2.6 0.3 0.1 0.3 0.9 0.1 3.2 3.1 0.1 2.5 0.3Delay (s) 11.2 12.6 10.4 9.4 15.2 11.3 27.9 27.7 23.6 25.8 22.3Level of Service B B B A B B C C C C CApproach Delay (s) 12.0 14.3 26.7 23.7Approach LOS B B C C
Intersection SummaryHCM Average Control Delay 15.5 HCM Level of Service BHCM Volume to Capacity ratio 0.60Actuated Cycle Length (s) 57.7 Sum of lost time (s) 16.0Intersection Capacity Utilization 55.0% ICU Level of Service BAnalysis Period (min) 15c Critical Lane Group
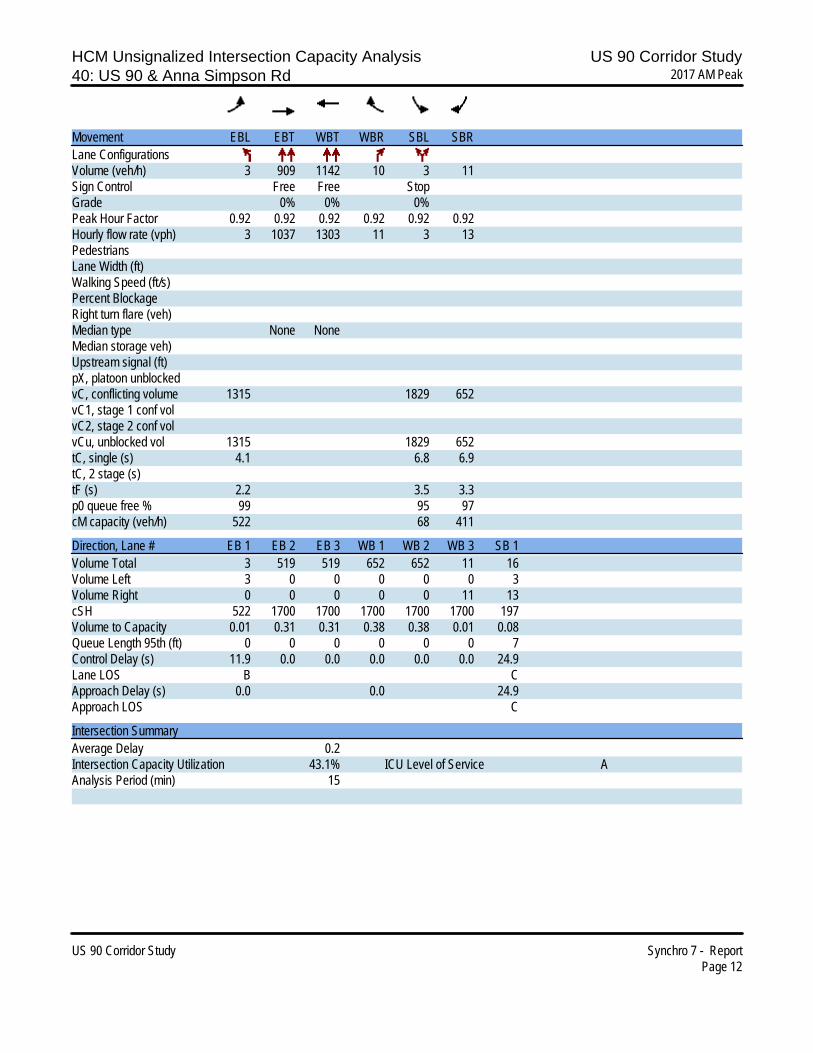
HCM Unsignalized Intersection Capacity Analysis US 90 Corridor Study40: US 90 & Anna Simpson Rd 2017 AM Peak
US 90 Corridor Study Synchro 7 - ReportPage 12
Movement EBL EBT WBT WBR SBL SBRLane ConfigurationsVolume (veh/h) 3 909 1142 10 3 11Sign Control Free Free StopGrade 0% 0% 0%Peak Hour Factor 0.92 0.92 0.92 0.92 0.92 0.92Hourly flow rate (vph) 3 1037 1303 11 3 13PedestriansLane Width (ft)Walking Speed (ft/s)Percent BlockageRight turn flare (veh)Median type None NoneMedian storage veh)Upstream signal (ft)pX, platoon unblockedvC, conflicting volume 1315 1829 652vC1, stage 1 conf volvC2, stage 2 conf volvCu, unblocked vol 1315 1829 652tC, single (s) 4.1 6.8 6.9tC, 2 stage (s)tF (s) 2.2 3.5 3.3p0 queue free % 99 95 97cM capacity (veh/h) 522 68 411
Direction, Lane # EB 1 EB 2 EB 3 WB 1 WB 2 WB 3 SB 1Volume Total 3 519 519 652 652 11 16Volume Left 3 0 0 0 0 0 3Volume Right 0 0 0 0 0 11 13cSH 522 1700 1700 1700 1700 1700 197Volume to Capacity 0.01 0.31 0.31 0.38 0.38 0.01 0.08Queue Length 95th (ft) 0 0 0 0 0 0 7Control Delay (s) 11.9 0.0 0.0 0.0 0.0 0.0 24.9Lane LOS B CApproach Delay (s) 0.0 0.0 24.9Approach LOS C
Intersection SummaryAverage Delay 0.2Intersection Capacity Utilization 43.1% ICU Level of Service AAnalysis Period (min) 15
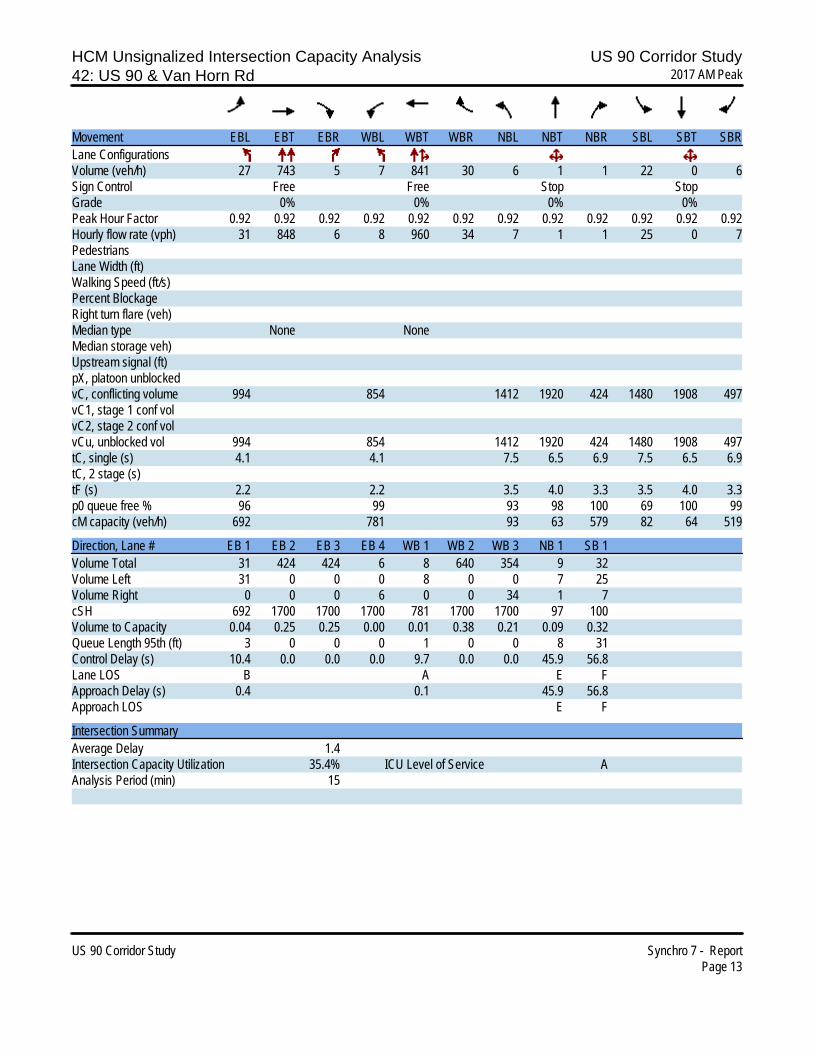
HCM Unsignalized Intersection Capacity Analysis US 90 Corridor Study42: US 90 & Van Horn Rd 2017 AM Peak
US 90 Corridor Study Synchro 7 - ReportPage 13
Movement EBL EBT EBR WBL WBT WBR NBL NBT NBR SBL SBT SBRLane ConfigurationsVolume (veh/h) 27 743 5 7 841 30 6 1 1 22 0 6Sign Control Free Free Stop StopGrade 0% 0% 0% 0%Peak Hour Factor 0.92 0.92 0.92 0.92 0.92 0.92 0.92 0.92 0.92 0.92 0.92 0.92Hourly flow rate (vph) 31 848 6 8 960 34 7 1 1 25 0 7PedestriansLane Width (ft)Walking Speed (ft/s)Percent BlockageRight turn flare (veh)Median type None NoneMedian storage veh)Upstream signal (ft)pX, platoon unblockedvC, conflicting volume 994 854 1412 1920 424 1480 1908 497vC1, stage 1 conf volvC2, stage 2 conf volvCu, unblocked vol 994 854 1412 1920 424 1480 1908 497tC, single (s) 4.1 4.1 7.5 6.5 6.9 7.5 6.5 6.9tC, 2 stage (s)tF (s) 2.2 2.2 3.5 4.0 3.3 3.5 4.0 3.3p0 queue free % 96 99 93 98 100 69 100 99cM capacity (veh/h) 692 781 93 63 579 82 64 519
Direction, Lane # EB 1 EB 2 EB 3 EB 4 WB 1 WB 2 WB 3 NB 1 SB 1Volume Total 31 424 424 6 8 640 354 9 32Volume Left 31 0 0 0 8 0 0 7 25Volume Right 0 0 0 6 0 0 34 1 7cSH 692 1700 1700 1700 781 1700 1700 97 100Volume to Capacity 0.04 0.25 0.25 0.00 0.01 0.38 0.21 0.09 0.32Queue Length 95th (ft) 3 0 0 0 1 0 0 8 31Control Delay (s) 10.4 0.0 0.0 0.0 9.7 0.0 0.0 45.9 56.8Lane LOS B A E FApproach Delay (s) 0.4 0.1 45.9 56.8Approach LOS E F
Intersection SummaryAverage Delay 1.4Intersection Capacity Utilization 35.4% ICU Level of Service AAnalysis Period (min) 15
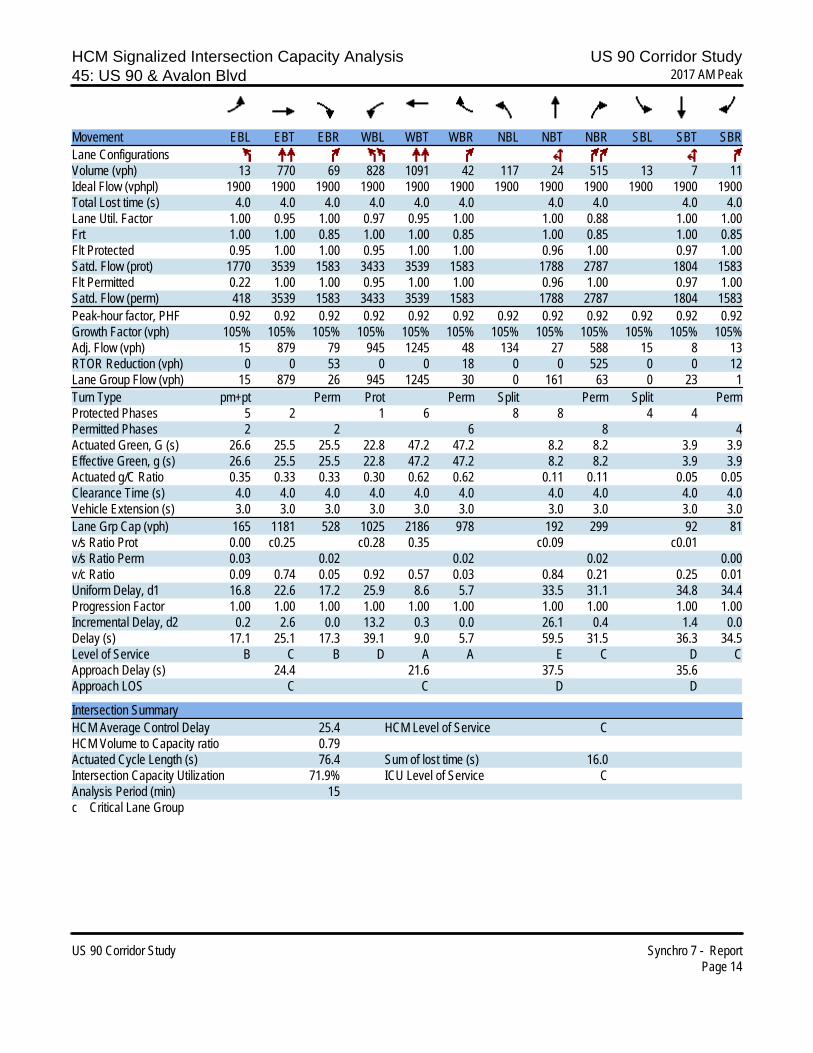
HCM Signalized Intersection Capacity Analysis US 90 Corridor Study45: US 90 & Avalon Blvd 2017 AM Peak
US 90 Corridor Study Synchro 7 - ReportPage 14
Movement EBL EBT EBR WBL WBT WBR NBL NBT NBR SBL SBT SBRLane ConfigurationsVolume (vph) 13 770 69 828 1091 42 117 24 515 13 7 11Ideal Flow (vphpl) 1900 1900 1900 1900 1900 1900 1900 1900 1900 1900 1900 1900Total Lost time (s) 4.0 4.0 4.0 4.0 4.0 4.0 4.0 4.0 4.0 4.0Lane Util. Factor 1.00 0.95 1.00 0.97 0.95 1.00 1.00 0.88 1.00 1.00Frt 1.00 1.00 0.85 1.00 1.00 0.85 1.00 0.85 1.00 0.85Flt Protected 0.95 1.00 1.00 0.95 1.00 1.00 0.96 1.00 0.97 1.00Satd. Flow (prot) 1770 3539 1583 3433 3539 1583 1788 2787 1804 1583Flt Permitted 0.22 1.00 1.00 0.95 1.00 1.00 0.96 1.00 0.97 1.00Satd. Flow (perm) 418 3539 1583 3433 3539 1583 1788 2787 1804 1583Peak-hour factor, PHF 0.92 0.92 0.92 0.92 0.92 0.92 0.92 0.92 0.92 0.92 0.92 0.92Growth Factor (vph) 105% 105% 105% 105% 105% 105% 105% 105% 105% 105% 105% 105%Adj. Flow (vph) 15 879 79 945 1245 48 134 27 588 15 8 13RTOR Reduction (vph) 0 0 53 0 0 18 0 0 525 0 0 12Lane Group Flow (vph) 15 879 26 945 1245 30 0 161 63 0 23 1Turn Type pm+pt Perm Prot Perm Split Perm Split PermProtected Phases 5 2 1 6 8 8 4 4Permitted Phases 2 2 6 8 4Actuated Green, G (s) 26.6 25.5 25.5 22.8 47.2 47.2 8.2 8.2 3.9 3.9Effective Green, g (s) 26.6 25.5 25.5 22.8 47.2 47.2 8.2 8.2 3.9 3.9Actuated g/C Ratio 0.35 0.33 0.33 0.30 0.62 0.62 0.11 0.11 0.05 0.05Clearance Time (s) 4.0 4.0 4.0 4.0 4.0 4.0 4.0 4.0 4.0 4.0Vehicle Extension (s) 3.0 3.0 3.0 3.0 3.0 3.0 3.0 3.0 3.0 3.0Lane Grp Cap (vph) 165 1181 528 1025 2186 978 192 299 92 81v/s Ratio Prot 0.00 c0.25 c0.28 0.35 c0.09 c0.01v/s Ratio Perm 0.03 0.02 0.02 0.02 0.00v/c Ratio 0.09 0.74 0.05 0.92 0.57 0.03 0.84 0.21 0.25 0.01Uniform Delay, d1 16.8 22.6 17.2 25.9 8.6 5.7 33.5 31.1 34.8 34.4Progression Factor 1.00 1.00 1.00 1.00 1.00 1.00 1.00 1.00 1.00 1.00Incremental Delay, d2 0.2 2.6 0.0 13.2 0.3 0.0 26.1 0.4 1.4 0.0Delay (s) 17.1 25.1 17.3 39.1 9.0 5.7 59.5 31.5 36.3 34.5Level of Service B C B D A A E C D CApproach Delay (s) 24.4 21.6 37.5 35.6Approach LOS C C D D
Intersection SummaryHCM Average Control Delay 25.4 HCM Level of Service CHCM Volume to Capacity ratio 0.79Actuated Cycle Length (s) 76.4 Sum of lost time (s) 16.0Intersection Capacity Utilization 71.9% ICU Level of Service CAnalysis Period (min) 15c Critical Lane Group
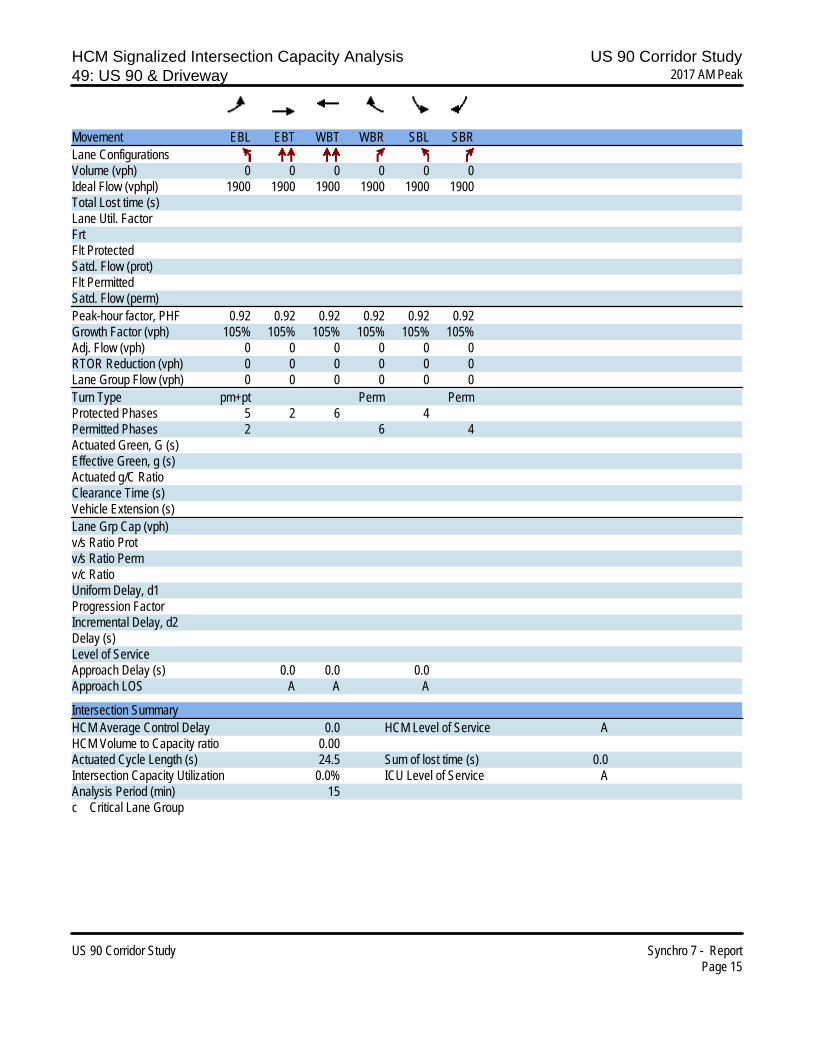
HCM Signalized Intersection Capacity Analysis US 90 Corridor Study49: US 90 & Driveway 2017 AM Peak
US 90 Corridor Study Synchro 7 - ReportPage 15
Movement EBL EBT WBT WBR SBL SBRLane ConfigurationsVolume (vph) 0 0 0 0 0 0Ideal Flow (vphpl) 1900 1900 1900 1900 1900 1900Total Lost time (s)Lane Util. FactorFrtFlt ProtectedSatd. Flow (prot)Flt PermittedSatd. Flow (perm)Peak-hour factor, PHF 0.92 0.92 0.92 0.92 0.92 0.92Growth Factor (vph) 105% 105% 105% 105% 105% 105%Adj. Flow (vph) 0 0 0 0 0 0RTOR Reduction (vph) 0 0 0 0 0 0Lane Group Flow (vph) 0 0 0 0 0 0Turn Type pm+pt Perm PermProtected Phases 5 2 6 4Permitted Phases 2 6 4Actuated Green, G (s)Effective Green, g (s)Actuated g/C RatioClearance Time (s)Vehicle Extension (s)Lane Grp Cap (vph)v/s Ratio Protv/s Ratio Permv/c RatioUniform Delay, d1Progression FactorIncremental Delay, d2Delay (s)Level of ServiceApproach Delay (s) 0.0 0.0 0.0Approach LOS A A A
Intersection SummaryHCM Average Control Delay 0.0 HCM Level of Service AHCM Volume to Capacity ratio 0.00Actuated Cycle Length (s) 24.5 Sum of lost time (s) 0.0Intersection Capacity Utilization 0.0% ICU Level of Service AAnalysis Period (min) 15c Critical Lane Group

HCM Signalized Intersection Capacity Analysis US 90 Corridor Study52: US 90 & Jaimee Lee Dr 2017 AM Peak
US 90 Corridor Study Synchro 7 - ReportPage 16
Movement EBL EBT EBR WBL WBT WBR NBL NBT NBR SBL SBT SBRLane ConfigurationsVolume (vph) 6 964 31 138 1344 6 122 2 141 17 2 27Ideal Flow (vphpl) 1900 1900 1900 1900 1900 1900 1900 1900 1900 1900 1900 1900Total Lost time (s) 4.0 4.0 4.0 4.0 4.0 4.0 4.0 4.0 4.0Lane Util. Factor 1.00 0.95 1.00 1.00 0.95 1.00 1.00 1.00 1.00Frt 1.00 1.00 0.85 1.00 1.00 0.85 1.00 0.85 0.92Flt Protected 0.95 1.00 1.00 0.95 1.00 1.00 0.95 1.00 0.98Satd. Flow (prot) 1770 3539 1583 1770 3539 1583 1775 1583 1682Flt Permitted 0.13 1.00 1.00 0.17 1.00 1.00 0.69 1.00 0.86Satd. Flow (perm) 242 3539 1583 314 3539 1583 1287 1583 1470Peak-hour factor, PHF 0.92 0.92 0.92 0.92 0.92 0.92 0.92 0.92 0.92 0.92 0.92 0.92Growth Factor (vph) 104% 104% 104% 104% 104% 104% 104% 104% 104% 104% 104% 104%Adj. Flow (vph) 7 1090 35 156 1519 7 138 2 159 19 2 31RTOR Reduction (vph) 0 0 16 0 0 2 0 0 135 0 26 0Lane Group Flow (vph) 7 1090 19 156 1519 5 0 140 24 0 26 0Turn Type pm+pt Perm pm+pt Perm Perm Perm PermProtected Phases 5 2 1 6 8 4Permitted Phases 2 2 6 6 8 8 4Actuated Green, G (s) 31.8 30.8 30.8 40.6 35.6 35.6 8.7 8.7 8.7Effective Green, g (s) 31.8 30.8 30.8 40.6 35.6 35.6 8.7 8.7 8.7Actuated g/C Ratio 0.55 0.54 0.54 0.71 0.62 0.62 0.15 0.15 0.15Clearance Time (s) 4.0 4.0 4.0 4.0 4.0 4.0 4.0 4.0 4.0Vehicle Extension (s) 3.0 3.0 3.0 3.0 3.0 3.0 3.0 3.0 3.0Lane Grp Cap (vph) 161 1902 851 370 2199 984 195 240 223v/s Ratio Prot 0.00 0.31 c0.04 c0.43v/s Ratio Perm 0.02 0.01 0.26 0.00 c0.11 0.02 0.02v/c Ratio 0.04 0.57 0.02 0.42 0.69 0.01 0.72 0.10 0.12Uniform Delay, d1 6.3 8.9 6.2 4.6 7.2 4.1 23.1 20.9 21.0Progression Factor 1.00 1.00 1.00 1.00 1.00 1.00 1.00 1.00 1.00Incremental Delay, d2 0.1 0.4 0.0 0.8 1.0 0.0 11.9 0.2 0.2Delay (s) 6.5 9.3 6.2 5.4 8.1 4.1 35.0 21.1 21.2Level of Service A A A A A A D C CApproach Delay (s) 9.2 7.9 27.6 21.2Approach LOS A A C C
Intersection SummaryHCM Average Control Delay 10.4 HCM Level of Service BHCM Volume to Capacity ratio 0.70Actuated Cycle Length (s) 57.3 Sum of lost time (s) 12.0Intersection Capacity Utilization 65.8% ICU Level of Service CAnalysis Period (min) 15c Critical Lane Group
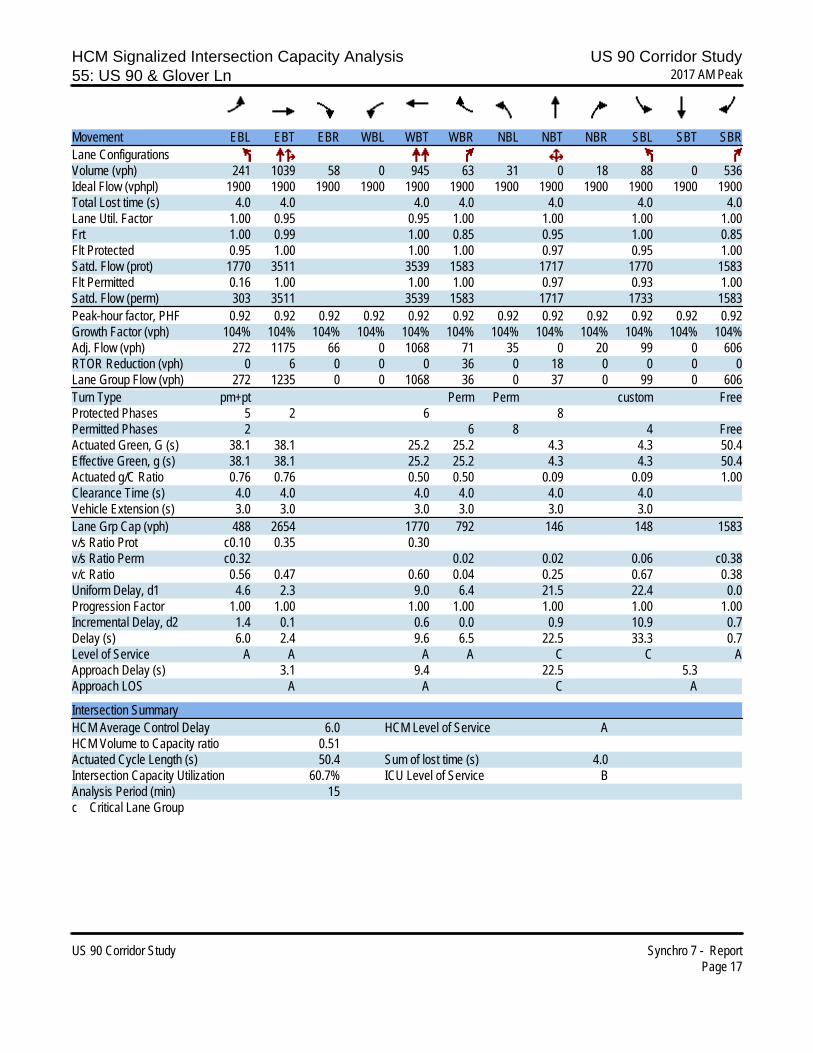
HCM Signalized Intersection Capacity Analysis US 90 Corridor Study55: US 90 & Glover Ln 2017 AM Peak
US 90 Corridor Study Synchro 7 - ReportPage 17
Movement EBL EBT EBR WBL WBT WBR NBL NBT NBR SBL SBT SBRLane ConfigurationsVolume (vph) 241 1039 58 0 945 63 31 0 18 88 0 536Ideal Flow (vphpl) 1900 1900 1900 1900 1900 1900 1900 1900 1900 1900 1900 1900Total Lost time (s) 4.0 4.0 4.0 4.0 4.0 4.0 4.0Lane Util. Factor 1.00 0.95 0.95 1.00 1.00 1.00 1.00Frt 1.00 0.99 1.00 0.85 0.95 1.00 0.85Flt Protected 0.95 1.00 1.00 1.00 0.97 0.95 1.00Satd. Flow (prot) 1770 3511 3539 1583 1717 1770 1583Flt Permitted 0.16 1.00 1.00 1.00 0.97 0.93 1.00Satd. Flow (perm) 303 3511 3539 1583 1717 1733 1583Peak-hour factor, PHF 0.92 0.92 0.92 0.92 0.92 0.92 0.92 0.92 0.92 0.92 0.92 0.92Growth Factor (vph) 104% 104% 104% 104% 104% 104% 104% 104% 104% 104% 104% 104%Adj. Flow (vph) 272 1175 66 0 1068 71 35 0 20 99 0 606RTOR Reduction (vph) 0 6 0 0 0 36 0 18 0 0 0 0Lane Group Flow (vph) 272 1235 0 0 1068 36 0 37 0 99 0 606Turn Type pm+pt Perm Perm custom FreeProtected Phases 5 2 6 8Permitted Phases 2 6 8 4 FreeActuated Green, G (s) 38.1 38.1 25.2 25.2 4.3 4.3 50.4Effective Green, g (s) 38.1 38.1 25.2 25.2 4.3 4.3 50.4Actuated g/C Ratio 0.76 0.76 0.50 0.50 0.09 0.09 1.00Clearance Time (s) 4.0 4.0 4.0 4.0 4.0 4.0Vehicle Extension (s) 3.0 3.0 3.0 3.0 3.0 3.0Lane Grp Cap (vph) 488 2654 1770 792 146 148 1583v/s Ratio Prot c0.10 0.35 0.30v/s Ratio Perm c0.32 0.02 0.02 0.06 c0.38v/c Ratio 0.56 0.47 0.60 0.04 0.25 0.67 0.38Uniform Delay, d1 4.6 2.3 9.0 6.4 21.5 22.4 0.0Progression Factor 1.00 1.00 1.00 1.00 1.00 1.00 1.00Incremental Delay, d2 1.4 0.1 0.6 0.0 0.9 10.9 0.7Delay (s) 6.0 2.4 9.6 6.5 22.5 33.3 0.7Level of Service A A A A C C AApproach Delay (s) 3.1 9.4 22.5 5.3Approach LOS A A C A
Intersection SummaryHCM Average Control Delay 6.0 HCM Level of Service AHCM Volume to Capacity ratio 0.51Actuated Cycle Length (s) 50.4 Sum of lost time (s) 4.0Intersection Capacity Utilization 60.7% ICU Level of Service BAnalysis Period (min) 15c Critical Lane Group
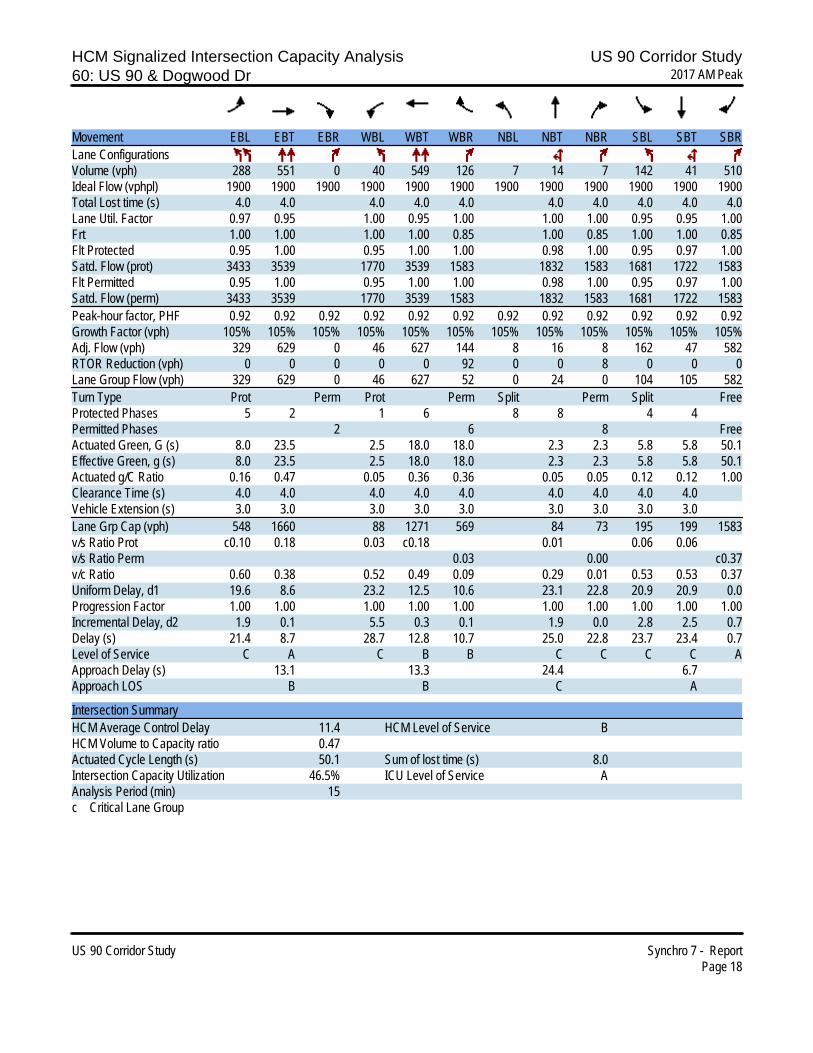
HCM Signalized Intersection Capacity Analysis US 90 Corridor Study60: US 90 & Dogwood Dr 2017 AM Peak
US 90 Corridor Study Synchro 7 - ReportPage 18
Movement EBL EBT EBR WBL WBT WBR NBL NBT NBR SBL SBT SBRLane ConfigurationsVolume (vph) 288 551 0 40 549 126 7 14 7 142 41 510Ideal Flow (vphpl) 1900 1900 1900 1900 1900 1900 1900 1900 1900 1900 1900 1900Total Lost time (s) 4.0 4.0 4.0 4.0 4.0 4.0 4.0 4.0 4.0 4.0Lane Util. Factor 0.97 0.95 1.00 0.95 1.00 1.00 1.00 0.95 0.95 1.00Frt 1.00 1.00 1.00 1.00 0.85 1.00 0.85 1.00 1.00 0.85Flt Protected 0.95 1.00 0.95 1.00 1.00 0.98 1.00 0.95 0.97 1.00Satd. Flow (prot) 3433 3539 1770 3539 1583 1832 1583 1681 1722 1583Flt Permitted 0.95 1.00 0.95 1.00 1.00 0.98 1.00 0.95 0.97 1.00Satd. Flow (perm) 3433 3539 1770 3539 1583 1832 1583 1681 1722 1583Peak-hour factor, PHF 0.92 0.92 0.92 0.92 0.92 0.92 0.92 0.92 0.92 0.92 0.92 0.92Growth Factor (vph) 105% 105% 105% 105% 105% 105% 105% 105% 105% 105% 105% 105%Adj. Flow (vph) 329 629 0 46 627 144 8 16 8 162 47 582RTOR Reduction (vph) 0 0 0 0 0 92 0 0 8 0 0 0Lane Group Flow (vph) 329 629 0 46 627 52 0 24 0 104 105 582Turn Type Prot Perm Prot Perm Split Perm Split FreeProtected Phases 5 2 1 6 8 8 4 4Permitted Phases 2 6 8 FreeActuated Green, G (s) 8.0 23.5 2.5 18.0 18.0 2.3 2.3 5.8 5.8 50.1Effective Green, g (s) 8.0 23.5 2.5 18.0 18.0 2.3 2.3 5.8 5.8 50.1Actuated g/C Ratio 0.16 0.47 0.05 0.36 0.36 0.05 0.05 0.12 0.12 1.00Clearance Time (s) 4.0 4.0 4.0 4.0 4.0 4.0 4.0 4.0 4.0Vehicle Extension (s) 3.0 3.0 3.0 3.0 3.0 3.0 3.0 3.0 3.0Lane Grp Cap (vph) 548 1660 88 1271 569 84 73 195 199 1583v/s Ratio Prot c0.10 0.18 0.03 c0.18 0.01 0.06 0.06v/s Ratio Perm 0.03 0.00 c0.37v/c Ratio 0.60 0.38 0.52 0.49 0.09 0.29 0.01 0.53 0.53 0.37Uniform Delay, d1 19.6 8.6 23.2 12.5 10.6 23.1 22.8 20.9 20.9 0.0Progression Factor 1.00 1.00 1.00 1.00 1.00 1.00 1.00 1.00 1.00 1.00Incremental Delay, d2 1.9 0.1 5.5 0.3 0.1 1.9 0.0 2.8 2.5 0.7Delay (s) 21.4 8.7 28.7 12.8 10.7 25.0 22.8 23.7 23.4 0.7Level of Service C A C B B C C C C AApproach Delay (s) 13.1 13.3 24.4 6.7Approach LOS B B C A
Intersection SummaryHCM Average Control Delay 11.4 HCM Level of Service BHCM Volume to Capacity ratio 0.47Actuated Cycle Length (s) 50.1 Sum of lost time (s) 8.0Intersection Capacity Utilization 46.5% ICU Level of Service AAnalysis Period (min) 15c Critical Lane Group
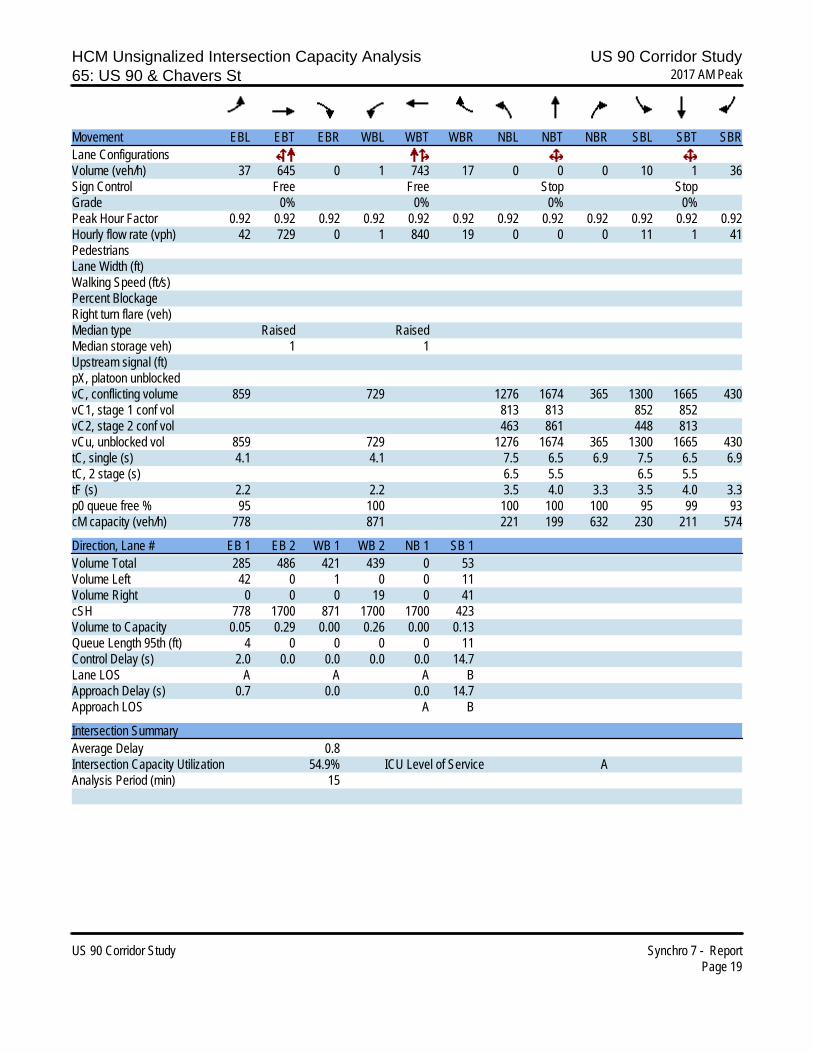
HCM Unsignalized Intersection Capacity Analysis US 90 Corridor Study65: US 90 & Chavers St 2017 AM Peak
US 90 Corridor Study Synchro 7 - ReportPage 19
Movement EBL EBT EBR WBL WBT WBR NBL NBT NBR SBL SBT SBRLane ConfigurationsVolume (veh/h) 37 645 0 1 743 17 0 0 0 10 1 36Sign Control Free Free Stop StopGrade 0% 0% 0% 0%Peak Hour Factor 0.92 0.92 0.92 0.92 0.92 0.92 0.92 0.92 0.92 0.92 0.92 0.92Hourly flow rate (vph) 42 729 0 1 840 19 0 0 0 11 1 41PedestriansLane Width (ft)Walking Speed (ft/s)Percent BlockageRight turn flare (veh)Median type Raised RaisedMedian storage veh) 1 1Upstream signal (ft)pX, platoon unblockedvC, conflicting volume 859 729 1276 1674 365 1300 1665 430vC1, stage 1 conf vol 813 813 852 852vC2, stage 2 conf vol 463 861 448 813vCu, unblocked vol 859 729 1276 1674 365 1300 1665 430tC, single (s) 4.1 4.1 7.5 6.5 6.9 7.5 6.5 6.9tC, 2 stage (s) 6.5 5.5 6.5 5.5tF (s) 2.2 2.2 3.5 4.0 3.3 3.5 4.0 3.3p0 queue free % 95 100 100 100 100 95 99 93cM capacity (veh/h) 778 871 221 199 632 230 211 574
Direction, Lane # EB 1 EB 2 WB 1 WB 2 NB 1 SB 1Volume Total 285 486 421 439 0 53Volume Left 42 0 1 0 0 11Volume Right 0 0 0 19 0 41cSH 778 1700 871 1700 1700 423Volume to Capacity 0.05 0.29 0.00 0.26 0.00 0.13Queue Length 95th (ft) 4 0 0 0 0 11Control Delay (s) 2.0 0.0 0.0 0.0 0.0 14.7Lane LOS A A A BApproach Delay (s) 0.7 0.0 0.0 14.7Approach LOS A B
Intersection SummaryAverage Delay 0.8Intersection Capacity Utilization 54.9% ICU Level of Service AAnalysis Period (min) 15
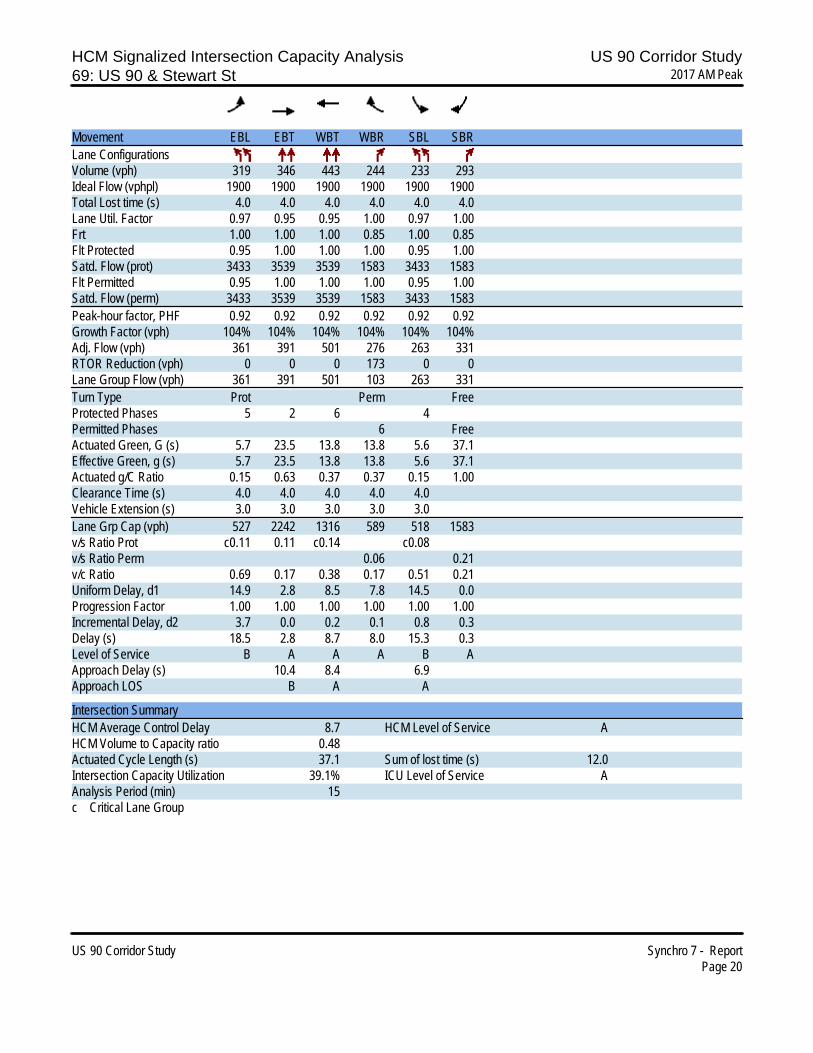
HCM Signalized Intersection Capacity Analysis US 90 Corridor Study69: US 90 & Stewart St 2017 AM Peak
US 90 Corridor Study Synchro 7 - ReportPage 20
Movement EBL EBT WBT WBR SBL SBRLane ConfigurationsVolume (vph) 319 346 443 244 233 293Ideal Flow (vphpl) 1900 1900 1900 1900 1900 1900Total Lost time (s) 4.0 4.0 4.0 4.0 4.0 4.0Lane Util. Factor 0.97 0.95 0.95 1.00 0.97 1.00Frt 1.00 1.00 1.00 0.85 1.00 0.85Flt Protected 0.95 1.00 1.00 1.00 0.95 1.00Satd. Flow (prot) 3433 3539 3539 1583 3433 1583Flt Permitted 0.95 1.00 1.00 1.00 0.95 1.00Satd. Flow (perm) 3433 3539 3539 1583 3433 1583Peak-hour factor, PHF 0.92 0.92 0.92 0.92 0.92 0.92Growth Factor (vph) 104% 104% 104% 104% 104% 104%Adj. Flow (vph) 361 391 501 276 263 331RTOR Reduction (vph) 0 0 0 173 0 0Lane Group Flow (vph) 361 391 501 103 263 331Turn Type Prot Perm FreeProtected Phases 5 2 6 4Permitted Phases 6 FreeActuated Green, G (s) 5.7 23.5 13.8 13.8 5.6 37.1Effective Green, g (s) 5.7 23.5 13.8 13.8 5.6 37.1Actuated g/C Ratio 0.15 0.63 0.37 0.37 0.15 1.00Clearance Time (s) 4.0 4.0 4.0 4.0 4.0Vehicle Extension (s) 3.0 3.0 3.0 3.0 3.0Lane Grp Cap (vph) 527 2242 1316 589 518 1583v/s Ratio Prot c0.11 0.11 c0.14 c0.08v/s Ratio Perm 0.06 0.21v/c Ratio 0.69 0.17 0.38 0.17 0.51 0.21Uniform Delay, d1 14.9 2.8 8.5 7.8 14.5 0.0Progression Factor 1.00 1.00 1.00 1.00 1.00 1.00Incremental Delay, d2 3.7 0.0 0.2 0.1 0.8 0.3Delay (s) 18.5 2.8 8.7 8.0 15.3 0.3Level of Service B A A A B AApproach Delay (s) 10.4 8.4 6.9Approach LOS B A A
Intersection SummaryHCM Average Control Delay 8.7 HCM Level of Service AHCM Volume to Capacity ratio 0.48Actuated Cycle Length (s) 37.1 Sum of lost time (s) 12.0Intersection Capacity Utilization 39.1% ICU Level of Service AAnalysis Period (min) 15c Critical Lane Group
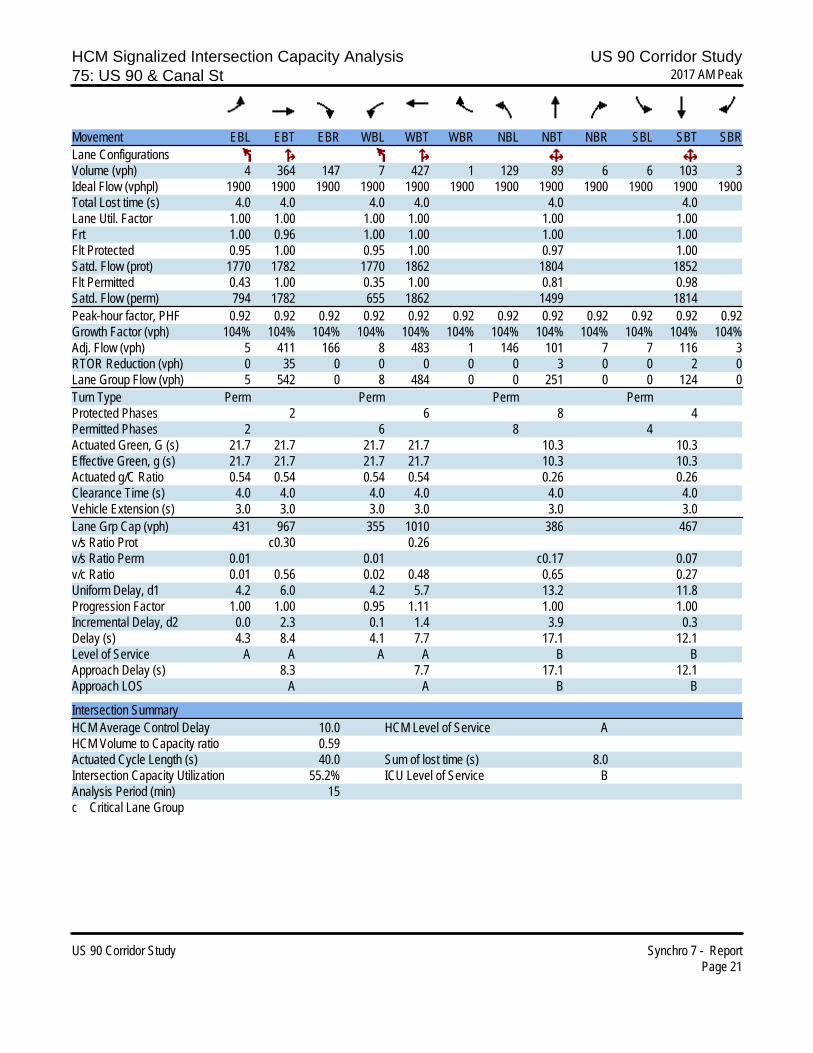
HCM Signalized Intersection Capacity Analysis US 90 Corridor Study75: US 90 & Canal St 2017 AM Peak
US 90 Corridor Study Synchro 7 - ReportPage 21
Movement EBL EBT EBR WBL WBT WBR NBL NBT NBR SBL SBT SBRLane ConfigurationsVolume (vph) 4 364 147 7 427 1 129 89 6 6 103 3Ideal Flow (vphpl) 1900 1900 1900 1900 1900 1900 1900 1900 1900 1900 1900 1900Total Lost time (s) 4.0 4.0 4.0 4.0 4.0 4.0Lane Util. Factor 1.00 1.00 1.00 1.00 1.00 1.00Frt 1.00 0.96 1.00 1.00 1.00 1.00Flt Protected 0.95 1.00 0.95 1.00 0.97 1.00Satd. Flow (prot) 1770 1782 1770 1862 1804 1852Flt Permitted 0.43 1.00 0.35 1.00 0.81 0.98Satd. Flow (perm) 794 1782 655 1862 1499 1814Peak-hour factor, PHF 0.92 0.92 0.92 0.92 0.92 0.92 0.92 0.92 0.92 0.92 0.92 0.92Growth Factor (vph) 104% 104% 104% 104% 104% 104% 104% 104% 104% 104% 104% 104%Adj. Flow (vph) 5 411 166 8 483 1 146 101 7 7 116 3RTOR Reduction (vph) 0 35 0 0 0 0 0 3 0 0 2 0Lane Group Flow (vph) 5 542 0 8 484 0 0 251 0 0 124 0Turn Type Perm Perm Perm PermProtected Phases 2 6 8 4Permitted Phases 2 6 8 4Actuated Green, G (s) 21.7 21.7 21.7 21.7 10.3 10.3Effective Green, g (s) 21.7 21.7 21.7 21.7 10.3 10.3Actuated g/C Ratio 0.54 0.54 0.54 0.54 0.26 0.26Clearance Time (s) 4.0 4.0 4.0 4.0 4.0 4.0Vehicle Extension (s) 3.0 3.0 3.0 3.0 3.0 3.0Lane Grp Cap (vph) 431 967 355 1010 386 467v/s Ratio Prot c0.30 0.26v/s Ratio Perm 0.01 0.01 c0.17 0.07v/c Ratio 0.01 0.56 0.02 0.48 0.65 0.27Uniform Delay, d1 4.2 6.0 4.2 5.7 13.2 11.8Progression Factor 1.00 1.00 0.95 1.11 1.00 1.00Incremental Delay, d2 0.0 2.3 0.1 1.4 3.9 0.3Delay (s) 4.3 8.4 4.1 7.7 17.1 12.1Level of Service A A A A B BApproach Delay (s) 8.3 7.7 17.1 12.1Approach LOS A A B B
Intersection SummaryHCM Average Control Delay 10.0 HCM Level of Service AHCM Volume to Capacity ratio 0.59Actuated Cycle Length (s) 40.0 Sum of lost time (s) 8.0Intersection Capacity Utilization 55.2% ICU Level of Service BAnalysis Period (min) 15c Critical Lane Group
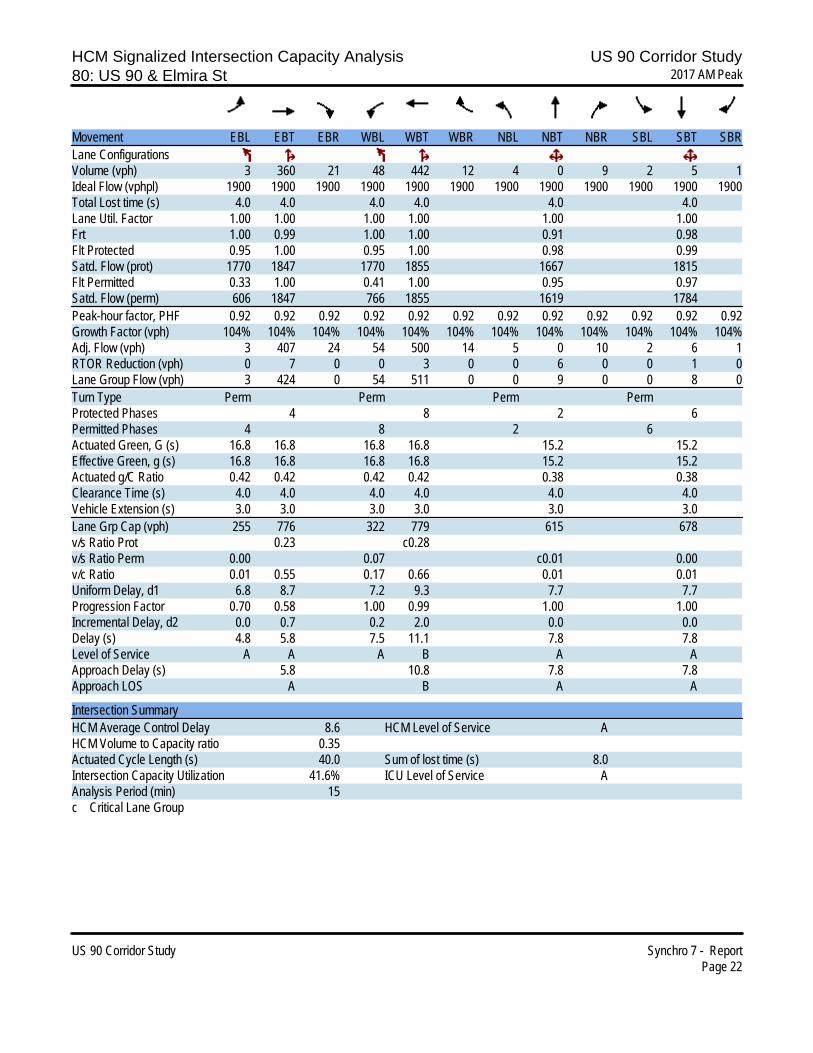
HCM Signalized Intersection Capacity Analysis US 90 Corridor Study80: US 90 & Elmira St 2017 AM Peak
US 90 Corridor Study Synchro 7 - ReportPage 22
Movement EBL EBT EBR WBL WBT WBR NBL NBT NBR SBL SBT SBRLane ConfigurationsVolume (vph) 3 360 21 48 442 12 4 0 9 2 5 1Ideal Flow (vphpl) 1900 1900 1900 1900 1900 1900 1900 1900 1900 1900 1900 1900Total Lost time (s) 4.0 4.0 4.0 4.0 4.0 4.0Lane Util. Factor 1.00 1.00 1.00 1.00 1.00 1.00Frt 1.00 0.99 1.00 1.00 0.91 0.98Flt Protected 0.95 1.00 0.95 1.00 0.98 0.99Satd. Flow (prot) 1770 1847 1770 1855 1667 1815Flt Permitted 0.33 1.00 0.41 1.00 0.95 0.97Satd. Flow (perm) 606 1847 766 1855 1619 1784Peak-hour factor, PHF 0.92 0.92 0.92 0.92 0.92 0.92 0.92 0.92 0.92 0.92 0.92 0.92Growth Factor (vph) 104% 104% 104% 104% 104% 104% 104% 104% 104% 104% 104% 104%Adj. Flow (vph) 3 407 24 54 500 14 5 0 10 2 6 1RTOR Reduction (vph) 0 7 0 0 3 0 0 6 0 0 1 0Lane Group Flow (vph) 3 424 0 54 511 0 0 9 0 0 8 0Turn Type Perm Perm Perm PermProtected Phases 4 8 2 6Permitted Phases 4 8 2 6Actuated Green, G (s) 16.8 16.8 16.8 16.8 15.2 15.2Effective Green, g (s) 16.8 16.8 16.8 16.8 15.2 15.2Actuated g/C Ratio 0.42 0.42 0.42 0.42 0.38 0.38Clearance Time (s) 4.0 4.0 4.0 4.0 4.0 4.0Vehicle Extension (s) 3.0 3.0 3.0 3.0 3.0 3.0Lane Grp Cap (vph) 255 776 322 779 615 678v/s Ratio Prot 0.23 c0.28v/s Ratio Perm 0.00 0.07 c0.01 0.00v/c Ratio 0.01 0.55 0.17 0.66 0.01 0.01Uniform Delay, d1 6.8 8.7 7.2 9.3 7.7 7.7Progression Factor 0.70 0.58 1.00 0.99 1.00 1.00Incremental Delay, d2 0.0 0.7 0.2 2.0 0.0 0.0Delay (s) 4.8 5.8 7.5 11.1 7.8 7.8Level of Service A A A B A AApproach Delay (s) 5.8 10.8 7.8 7.8Approach LOS A B A A
Intersection SummaryHCM Average Control Delay 8.6 HCM Level of Service AHCM Volume to Capacity ratio 0.35Actuated Cycle Length (s) 40.0 Sum of lost time (s) 8.0Intersection Capacity Utilization 41.6% ICU Level of Service AAnalysis Period (min) 15c Critical Lane Group
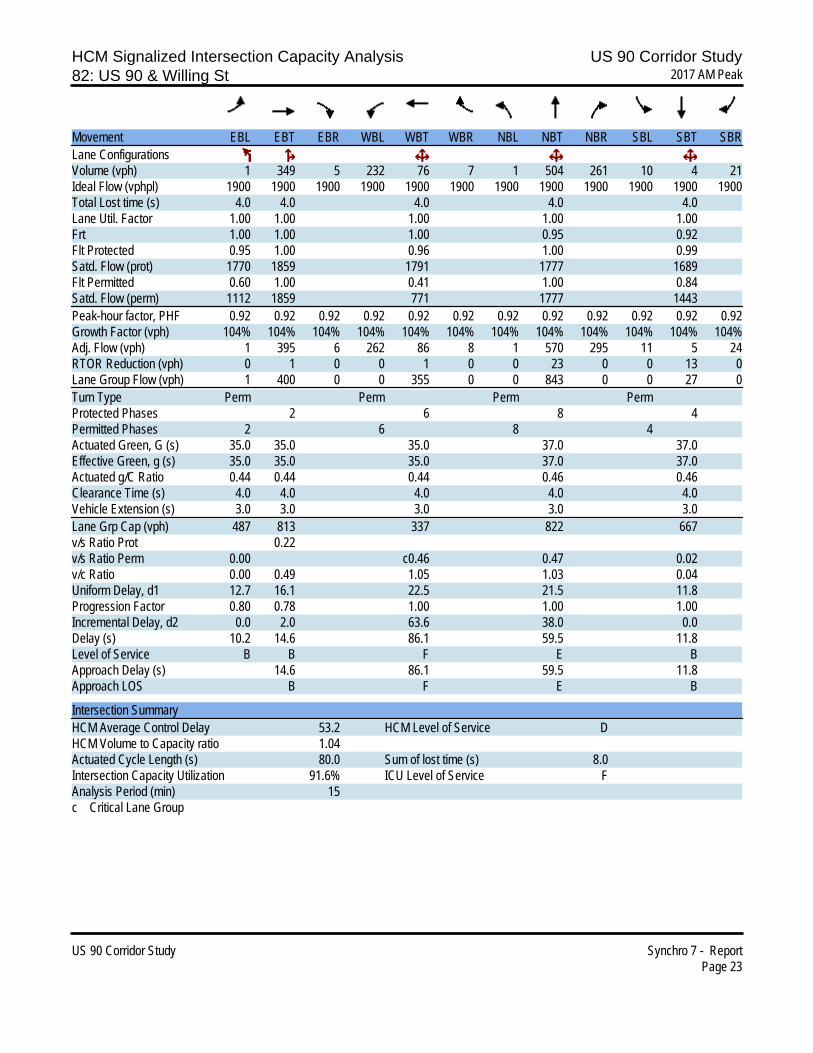
HCM Signalized Intersection Capacity Analysis US 90 Corridor Study82: US 90 & Willing St 2017 AM Peak
US 90 Corridor Study Synchro 7 - ReportPage 23
Movement EBL EBT EBR WBL WBT WBR NBL NBT NBR SBL SBT SBRLane ConfigurationsVolume (vph) 1 349 5 232 76 7 1 504 261 10 4 21Ideal Flow (vphpl) 1900 1900 1900 1900 1900 1900 1900 1900 1900 1900 1900 1900Total Lost time (s) 4.0 4.0 4.0 4.0 4.0Lane Util. Factor 1.00 1.00 1.00 1.00 1.00Frt 1.00 1.00 1.00 0.95 0.92Flt Protected 0.95 1.00 0.96 1.00 0.99Satd. Flow (prot) 1770 1859 1791 1777 1689Flt Permitted 0.60 1.00 0.41 1.00 0.84Satd. Flow (perm) 1112 1859 771 1777 1443Peak-hour factor, PHF 0.92 0.92 0.92 0.92 0.92 0.92 0.92 0.92 0.92 0.92 0.92 0.92Growth Factor (vph) 104% 104% 104% 104% 104% 104% 104% 104% 104% 104% 104% 104%Adj. Flow (vph) 1 395 6 262 86 8 1 570 295 11 5 24RTOR Reduction (vph) 0 1 0 0 1 0 0 23 0 0 13 0Lane Group Flow (vph) 1 400 0 0 355 0 0 843 0 0 27 0Turn Type Perm Perm Perm PermProtected Phases 2 6 8 4Permitted Phases 2 6 8 4Actuated Green, G (s) 35.0 35.0 35.0 37.0 37.0Effective Green, g (s) 35.0 35.0 35.0 37.0 37.0Actuated g/C Ratio 0.44 0.44 0.44 0.46 0.46Clearance Time (s) 4.0 4.0 4.0 4.0 4.0Vehicle Extension (s) 3.0 3.0 3.0 3.0 3.0Lane Grp Cap (vph) 487 813 337 822 667v/s Ratio Prot 0.22v/s Ratio Perm 0.00 c0.46 0.47 0.02v/c Ratio 0.00 0.49 1.05 1.03 0.04Uniform Delay, d1 12.7 16.1 22.5 21.5 11.8Progression Factor 0.80 0.78 1.00 1.00 1.00Incremental Delay, d2 0.0 2.0 63.6 38.0 0.0Delay (s) 10.2 14.6 86.1 59.5 11.8Level of Service B B F E BApproach Delay (s) 14.6 86.1 59.5 11.8Approach LOS B F E B
Intersection SummaryHCM Average Control Delay 53.2 HCM Level of Service DHCM Volume to Capacity ratio 1.04Actuated Cycle Length (s) 80.0 Sum of lost time (s) 8.0Intersection Capacity Utilization 91.6% ICU Level of Service FAnalysis Period (min) 15c Critical Lane Group