HCCI and Stratified-Charge CI Engine Combustion … and Stratified-Charge CI Engine Combustion...
21
HCCI and Stratified-Charge CI Engine Combustion Research May 10, 2011 – 9:30 a.m. U.S. DOE, Office of Vehicle Technologies Annual Merit Review and Peer Evaluation This presentation does not contain any proprietary, confidential, or otherwise restricted information. Program Manager: Gurpreet Singh Project ID: ACE004 John E. Dec Nicolas Dronniou and Yi Yang Sandia National Laboratories
Transcript of HCCI and Stratified-Charge CI Engine Combustion … and Stratified-Charge CI Engine Combustion...

HCCI and Stratified-Charge CI Engine Combustion Research
May 10, 2011 – 9:30 a.m.
U.S. DOE, Office of Vehicle TechnologiesAnnual Merit Review and Peer Evaluation
This presentation does not contain any proprietary, confidential, or otherwise restricted information.
Program Manager: Gurpreet Singh Project ID: ACE004
John E. DecNicolas Dronniou and Yi YangSandia National Laboratories

2
OverviewTimeline
• Project provides fundamental research to support DOE/Industry advanced engine projects.
• Project directions and continuation are evaluated annually.
Budget• Project funded by DOE/VT:
FY10 – $750kFY11 – $750k
Barriers• Extend HCCI (LTC) operating
range to higher loads.• Increase the efficiency of HCCI
(LTC).• Improve the understanding of
in-cylinder processes.
Partners / Collaborators• Project Lead: Sandia ⇒ John E. Dec• Part of Advanced Engine Combustion
working group – 15 industrial partners• General Motors – specific collaboration• LLNL – support kinetic modeling• Univ. of Michigan• Univ. of New South Wales, Australia• Chevron• LDRD – advanced biofuels project
(internal Sandia funding)

3
Objectives - Relevance
FY11 Objectives ⇒ High Loads, Increased Efficiency, Improved Understanding
• Thermal Stratification (TS): Determine 1) the main sources of colder near-wall gases, and 2) the primary mechanisms for transport and dispersion of this colder gas into the hotter bulk gas, at a base operating condition.– Initiate investigation of how operating conditions affect the development of TS.– Improve PLIF-based thermal imaging technique for side-view imaging.
• Improved Efficiency of Boosted HCCI: Examine various operating techni-ques to determine their potential for increasing the efficiency of intake-boosted HCCI (e.g. effects of Tin, CA50, ringing, DI vs. pre-mixed fueling).
• Continue collaborations with J. Oefelein (Sandia) to conduct LES modeling to better understand the mechanisms producing TS & how to improve TS.
• Support chemical-kinetic and CFD modeling of HCCI at LLNL, the Univ. of Michigan and General Motors ⇒ provide data and analysis.
Project objective: to provide the fundamental understanding (science-base) required to overcome the technical barriers to the development of practical HCCI or HCCI-like engines by industry.

4
Approach
• Metal engine ⇒ conduct well-characterized experiments to isolate specific aspects of HCCI/SCCI combustion.– Improved efficiency: Select representative boost, determine effect of parameters
of interest (Tin, CA50, fueling method) while holding other key parameters const.
• Optical engine ⇒ detailed investigations of in-cylinder processes.– Thermal stratification: Apply PLIF-based thermal-imaging using a vertical laser
sheet to simultaneously image both the boundary layer (BL) and bulk gas.
• Computational Modeling ⇒ supplement experiments by showing cause-and-effect relationships that are not easily measured. Also, to improve models. – Collaborate w/ J. Oefelein (Sandia) on LES modeling to understand mech. of TS.– Support LLNL & U of Mich. to improve kinetic mechanisms & on CFD modeling.
• Combination of techniques provides a more complete understanding.
• Transfer results to industry: 1) physical understanding, 2) improved models, 3) data to GM to support their in-house modeling of TS & boosted HCCI.
• Use a combination of metal- and optical-engine experiments and modeling to build a comprehensive understanding of HCCI processes.

5
All-Metal Engine
Optical Engine
Optics Table
Dynamometer
Intake Plenum
Exhaust Plenum
Water & Oil Pumps & Heaters
Flame Arrestor
Sandia HCCI / SCCI Engine Laboratory
• Matching all-metal & optical HCCI research engines.– Single-cylinder conversion from Cummins B-series diesel.
Optical Engine
All-Metal Engine
• Bore x Stroke = 102 x 120 mm • 0.98 liters, CR=14
Metal-engine experiments ⇒ Fuel is gasoline: RON = 91.7, MON = 83.4

6
Accomplishments• Determined the main sources of colder near-wall gases and the mechanism
for dispersing this colder gas into the hotter bulk-gas to produce TS.– Significantly improved side-view thermal imaging technique.– Preliminary data for effect of operating parameters on development of TS.
• Evaluated effects of fueling method on efficiency: premixed, DI, & Partial-DI.– Showed significant efficiency improvements with DI & partial-DI for boosted HCCI.
►Showed that partial-DI fueling allows a substantial increase in the high-load limit of boosted HCCI ⇒ gasoline becomes φ-sensitive with boost.
• Evaluated the effects of intake temperature (Tin), combustion timing (CA50), and ringing-intensity on engine efficiency.
► Investigated benefits of partial-DI fueling with ethanol, collab. with M. Sjöberg.
• Collaborating with J. Oefelein on LES modeling to supplement TS-imaging experiments ⇒ developed new high-fidelity grid, computations underway.
• Supported chemical-kinetic and CFD modeling work at LLNL, the Univ. of Michigan and General Motors ⇒ provided data and analysis.

7
• Increasing TS has strong potential for extending the high-load limit of HCCI.– And/or increasing efficiency.
• A better understanding of the mechanism(s) producing TS is needed.
Importance of Thermal Stratification (TS)• TS causes autoignition to occur
sequentially from hottest region to coldest.– Reduces max. pressure-rise rate (PRR) ⇒ allows higher loads and better efficiency.
• At time of max. PRR most combustion is from bulk gases (central region).
340°CA
370°CA
TDC - 360°CA
355°CA
T-Map Imagesmid-plane
Bottom-View
1368°CA 1368°CA 1368°CA
Side-View
372° 10
1
CA of Max. PRR368°
12364°
1.4366°
372° 10372° 10
1
CA of Max. PRR368° 1
CA of Max. PRR368°
12364° 12364°
1.4366° 1.4366°
• TS of bulk gas is critical for high-load HCCI.
6
6
6
6
6
6
6
6
6
6
7
0
10
20
30
40
50
-10
-20
-30
-40
-50
∆T [K]
6
6
6
6
6
6
6
6
6
6
7
0
10
20
30
40
50
-10
-20
-30
-40
-50
∆T [K]
0102030405060708090
100
340 350 360 370 380 390 400 410Crank Angle [°CA ATDC]
Cyl
inde
r Pre
ssur
e [b
ar] Model, Phi = 1.0
Exp., Phi = 0.44
• Prev. T-map images show TS development in bulk gas, late in compression stroke.

8
Simultaneous Bulk-Gas and BL Imaging• T-maps from PLIF with toluene tracer.
– Excite with Nd:YAG @ 266 nm.– Run inert with N2 to prevent quenching.– FY10 ⇒ motored or fired gives same TS.– Calibrate in-situ by varying Tin.
• Optical setup allows visualization of bulk-gas and boundary-layer regions.– View extends to cylinder wall because
window acts as a divergent lens.
• Image post-processing into T-map significantly more challenging.– Repeatable cold BL & fluctuating temp.– Vignetting and beam steering.
End view of laser sheet
Raw ImageTemperature map (T-map)

9
Cycle-Averaged T-maps
Compression Stroke
• Boundary layers develop at cyl. walls and firedeck.– Compression suppresses
thickness of BL at firedeck.
• Avg. temperature is fairly uniform throughout bulk-gas.
Expansion Stroke
• BL expansion and crevice out-gassing increase TS.– Not relevant to controlling
max. PRR.
• Average T-maps show TS that is consistent from cycle to cycle.– Boundary layers (BL) and out-gassing during early expansion.
• There is no evidence of consistent flows that transport cold gas from near-wall regions into central bulk gas.

10
Single-Cycle T-maps
• Substantial TS is evident in the bulk gas near TDC.
• Bulk-gas TS is dominated by a randomly fluctuating pattern of cold pockets.
• Random nature suggests it results from in-cylinder turbulence.
• Characterized by turbulent structures of cold gas extending from the walls.– Not isolated cold pockets.
• Bulk-gas TS ⇒ critical for controlling max. PRR ⇒ appears to result from in-cylinder turbulence ⇒ turbulent structures extending from the wall.
• Show all TS ⇒ 1) random fluctuations, and 2) consistent from cycle to cycle.– Selected images show typical amounts of TS.

11
Analysis of Cold-Pocket Structures
• T-maps converted to binary images of cold pockets.
• Pockets categorized as:– attached firedeck– attached to piston top – unattached, in bulk-gas
• Number of cold pockets and their fraction of the total image area increase up through TDC.
• Less cold area at piston top may be related to high T of quartz piston top.
• Most cold pockets are structures attached to firedeck or piston top.– “Unattached bulk-gas” pockets may
be attached out of image plane.
• Statistical analysis of turbulent cold pockets shows size and location.
InitialT-map
BinaryImage
IdentifiedCold Pockets
FluctuatingComponent
360 CA
12
Total thermal stratification
Fluctuating thermal stratification
Average thermalstratification
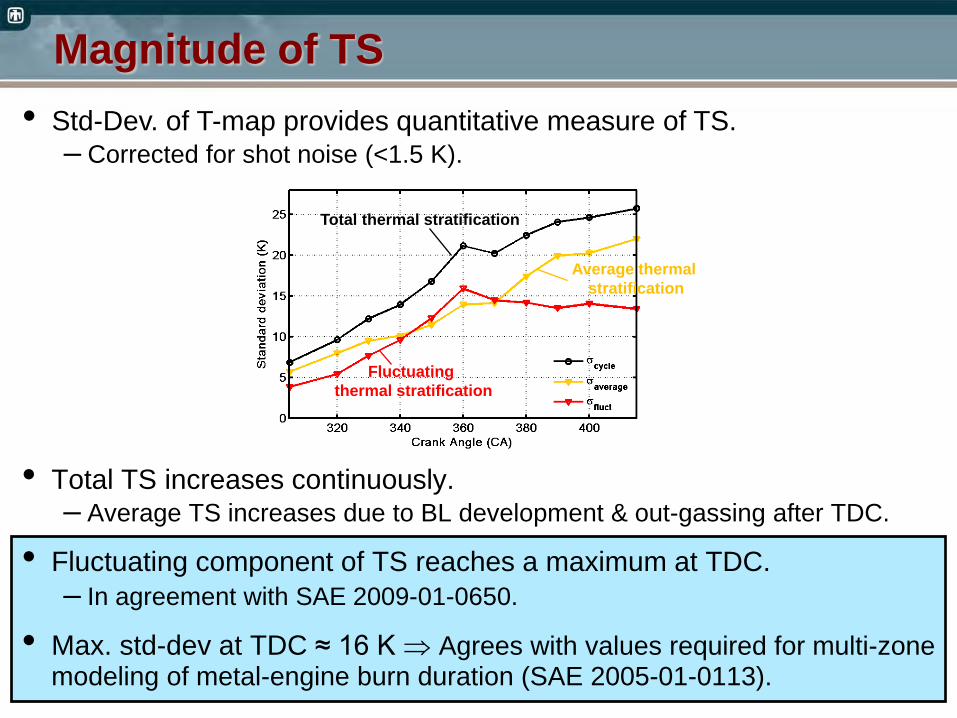
Magnitude of TS• Std-Dev. of T-map provides quantitative measure of TS.
– Corrected for shot noise (<1.5 K).
• Total TS increases continuously.– Average TS increases due to BL development & out-gassing after TDC.
• Fluctuating component of TS reaches a maximum at TDC.– In agreement with SAE 2009-01-0650.
• Max. std-dev at TDC ≈ 16 K ⇒ Agrees with values required for multi-zone modeling of metal-engine burn duration (SAE 2005-01-0113).

13
43.544.044.545.045.546.046.547.047.548.0
20 30 40 50 60 70 80 90 100Intake Temperature [°C]
Indi
cate
d Th
erm
al E
ff. [%
]
DI, CA50 = 376.7
PM, CA50 = 376.7
Early DI vs. PreMixedFueling = 55 mg/inj
43.544.044.545.045.546.046.547.047.548.0
20 30 40 50 60 70 80 90 100Intake Temperature [°C]
Indi
cate
d Th
erm
al E
ff. [%
]
DI, Ringing = 5DI, CA50 = 376.7PM, Ringing = 5PM, CA50 = 376.7
Early DI vs. PreMixedFueling = 55 mg/inj
370
371
372
373
374
375
376
377
378
20 30 40 50 60 70 80 90 100Intake Temperature [°C]
CA
50 [°
CA
]DI, CA50 = 376.7
PM, CA50 = 376.7
Improving Efficiency of Boosted HCCI• FY10: Showed Thermal-Eff. (T-E) could
increase from 43.5 → 47.5% by adjusting various operating parameters.
• FY11: Conduct systematic sweeps to determine mechanisms and trade-offs.
• Example: Vary Tin with constant fueling.1. Const. CA50 ⇒ T-E up as Tin reduced.
> Higher γ and less heat-transfer loss.> No advantage of DI fueling over PM.
2. Const. Ringing = 5 MW/m2 (const. PRR).⇒ PM fueling: T-E similar to const. CA50 since is ringing similar. ⇒ Early-DI fueling: T-E much higher.
> DI reduces HRR, so can advance CA50 to get ringing = 5 ⇒ higher T-E.
Pin = 2 bar, Fuel = 55 mg/inj, Gasoline
370
371
372
373
374
375
376
377
378
20 30 40 50 60 70 80 90 100Intake Temperature [°C]
CA
50 [°
CA
]DI, Ringing = 5DI, CA50 = 376.7PM, Ringing = 5PM, CA50 = 376.7• Why does early-DI give better performance?
– PLIF images show incomplete mixing ⇒ mixture stratification.

14
363
364
365
366
367
368
369
370
371
0.3 0.32 0.34 0.36 0.38 0.4 0.42 0.44 0.46 0.48 0.5Charge Mass Equivalence Ratio [φm]
CA
10 [°
CA
]
368
369
370
371
372
373
374
375
376
CA
10 [°
CA
]
PRF73, Pin = 1 bar, base-phi = 0.42
Gasoline, Pin = 1 bar, base-phi = 0.42
Pin varies
363
364
365
366
367
368
369
370
371
0.3 0.32 0.34 0.36 0.38 0.4 0.42 0.44 0.46 0.48 0.5Charge Mass Equivalence Ratio [φm]
CA
10 [°
CA
]
368
369
370
371
372
373
374
375
376
CA
10 [°
CA
]
PRF73, Pin = 1 bar, base-phi = 0.42
Gasoline, Pin = 1 bar, base-phi = 0.42
Gasoline, Pin = 2 bar, base-phi = 0.42
Pin varies
363
364
365
366
367
368
369
370
371
0.3 0.32 0.34 0.36 0.38 0.4 0.42 0.44 0.46 0.48 0.5Charge Mass Equivalence Ratio [φm]
CA
10 [°
CA
]
368
369
370
371
372
373
374
375
376
CA
10 [°
CA
]
PRF73, Pin = 1 bar, base-phi = 0.42Gasoline, Pin = 1 bar, base-phi = 0.42Gasoline, Pin = 2 bar, base-phi = 0.345Gasoline, Pin = 2 bar, base-phi = 0.42
Pin varies
363
364
365
366
367
368
369
370
371
0.3 0.32 0.34 0.36 0.38 0.4 0.42 0.44 0.46 0.48 0.5Charge Mass Equivalence Ratio [φm]
CA
10 [°
CA
]
368
369
370
371
372
373
374
375
376
CA
10 [°
CA
]
PRF73, Pin = 1 bar, base-phi = 0.42Gasoline, Pin = 1 bar, base-phi = 0.42Gasoline, Pin = 1.6 bar, base-phi = 0.367Gasoline, Pin = 2 bar, base-phi = 0.345Gasoline, Pin = 2 bar, base-phi = 0.42
Pin varies
Φ-Sensitivity of Gasoline
• Use Fire19/1 technique to isolate fuel-chemistry effects from thermal effects.– Dec & Sjöberg SAE 2004-01-0557.
• Sweep φ above & below base fueling.
• Pin = 1 bar ⇒ chemistry not φ-sensitive; like iso-octane, γ effect dominates.
• Pin = 2 bar ⇒ strong φ-sensitivity more than PRF73.
• Pin = 1.6 bar ⇒ intermed. φ-sensitivity.
• With boost, gasoline autoignition strongly φ-sensitive. Not for Pin = 1 bar.
0 1 2 3 4 5 6 7 8 9 10 11 12 13 14 15 16 17 18 19 20 21Cycle #
Pres
sure
φ = variable
Aquired cycle
φ = 0.20Fire 19/1
• For mixture stratification to reduce HRR, fuel autoignition must be sensitive to variations in the local φ.– Prev. thought to require a 2-stage
ignition fuel (e.g. PRF73).

15
• Partial fuel stratification (PFS) ⇒ premix most fuel & late DI up to 20%.– Vary DI timing or DI% to vary stratification.
• Large drop in ringing with increased DI%.
• Increased DI% ⇒ more regions of higher φm⇒ autoignite faster ⇒ advances hot ignition for same CA50 ⇒ increases burn duration.– Reduces peak HRR, PRRmax, and Pmax.
• Ultra-low NOx & soot. COV of IMEPg < 1.5%.
Pin = 2 bar: Controlled Mixture Stratification
50
60
70
80
90
100
110
340 350 360 370 380 390Crank Angle [°CA]
Pres
sure
[bar
]
3% DI @ 300°CA6% DI @ 300°CA9% DI @ 300°CA13% DI @ 300°CA17% DI @ 300°CA20% DI @ 300°CA
-5
0
5
10
15
340 350 360 370 380 390Crank Angle [°CA]
PRR
[bar
/°CA
]
3% DI @ 300°CA6% DI @ 300°CA9% DI @ 300°CA13% DI @ 300°CA17% DI @ 300°CA20% DI @ 300°CA
-1000
100200300400500600700
340 350 360 370 380 390Crank Angle [°CA]
HR
R [J
/°CA
]
3% DI @ 300°CA6% DI @ 300°CA9% DI @ 300°CA13% DI @ 300°CA17% DI @ 300°CA20% DI @ 300°CA
Hold: φm = 0.44, Tin = 60 C, CA50 = 374 CA
0
2
4
6
8
10
12
14
0 5 10 15 20 25DI Fuel [%]
Rin
ging
Inte
nsity
[MW
/m2 ]
10
11
12
13
14
15
16
17In
take
O2 C
onc.
[%]
Ringing IntensityIntake O2

16
5
6
7
8
9
10
11
12
13
14
0.25 0.3 0.35 0.4 0.45 0.5 0.55 0.6Charge-Mass Equiv. Ratio [φm]
IMEP
g [b
ar]
364
368
372
376
380
384
388
392
396
400
CA
50 [°
CA
]
IMEPg, Fully PreMixed
CA50, PreMixed
5
6
7
8
9
10
11
12
13
14
0.25 0.3 0.35 0.4 0.45 0.5 0.55 0.6Charge-Mass Equiv. Ratio [φm]
IMEP
g [b
ar]
364
368
372
376
380
384
388
392
396
400
CA
50 [°
CA
]
IMEPg, Full DI
IMEPg, Fully PreMixed
CA50, Full DI
CA50, PreMixed
Extend High-Load Limit with PFS, Pin = 2 bar
• PFS allows a large increase in load for gasoline boosted to Pin = 2 bar.
• Reduced ringing with PFS allows higher fueling and/or advanced CA50. • Premixed fueling ⇒ increase load from φm = 0.3 to knock/stability limit.
– Retard CA50 so Ringing ≤ 5 MW/m2 ⇒ Limit: IMEPg = 11.7 bar at φm = 0.47.
5
6
7
8
9
10
11
12
13
14
0.25 0.3 0.35 0.4 0.45 0.5 0.55 0.6Charge-Mass Equiv. Ratio [φm]
IMEP
g [b
ar]
364
368
372
376
380
384
388
392
396
400
CA
50 [°
CA
]
IMEPg, Full DIIMEPg, Partial DI (PFS)IMEPg, Fully PreMixedCA50, Full DICA50, Partial DICA50, PreMixed
• Full early-DI fueling:– Some mixture stratification– Allows advanced CA50, but stability
limit is IMEPg = 10.7 bar, φm = 0.40.
• PFS (partial DI) ⇒ much better stability ⇒ allows signif. higher loads.– Limit: IMEPg = 13.0 bar, φm = 0.54.– Approaching oxygen availability limit
⇒ 0.9% O2 in exhaust.
• Large reduction of HRR (PRR) allows – CA50 more advanced than premixed.– Higher thermal eff. and ringing reduced to 2 – 3 MW/m2 ⇒ greater stability.

17
Load-Limit & Eff. Improvements at Various Pin
• Our initial investigation of boosted HCCI in SAE 2010-01-1086 showed ⇒ maximum load attainable for well premixed HCCI at various boost levels.
8
9
10
11
12
13
14
15
16
1.4 1.6 1.8 2 2.2 2.4 2.6 2.8Intake Pressure [bar]
Max
imum
IMEP
g [b
ar]
0
1
2
3
4
5
CO
V of
IMEP
g [%
]
IMEP, PM, SAE 2010-01-1086
COV_IMEP, PM 2010-01-1086
8
9
10
11
12
13
14
15
16
1.4 1.6 1.8 2 2.2 2.4 2.6 2.8Intake Pressure [bar]
Max
imum
IMEP
g [b
ar]
0
1
2
3
4
5
CO
V of
IMEP
g [%
]
IMEP, PM, SAE 2010-01-1086IMEP, Partial DI (PFS)COV_IMEP, PM 2010-01-1086COV_IMEP, Partial DI (PFS)
43.0
43.5
44.0
44.5
45.0
45.5
46.0
46.5
47.0
892
883
1057
1082
1105
1094
1128
1192
1249
1295
1318
1335
1397
1410
1434
Average IMEPg [kPa] at various Pin [bar]
Indi
cate
d Th
erm
al E
ff. [%
] Premixed Partial Stratification
Pin = 1.8Pin = 1.6 Pin = 2.2Pin = 2.0 Pin = 2.4
R ≈ 2 R ≈ 4.5
IMEPg
[kPa]
O2 Limited• PFS allows higher loads for all Pin tested.– PFS quite stable Pin ≥ 2.0 bar
⇒ largest gain.– O2 limited for Pin ≥ 2.2 bar.– PFS less stable for Pin = 1.6 & 1.8 bar.
> Lower φ-sensitivity.
• Alternatively, PFS can allow CA50 advance for same ringing (PRR).
• T-E increases from 0.3 to 1.6% ⇒fuel economy gain of 0.7 – 3.6%.
• PFS gives typical fuel economy improvement of 2 – 2.5%.

18
Ethanol-Fueled HCCI – Effects of PFS
363364365366367368369370371372
0.35 0.37 0.39 0.41 0.43 0.45 0.47 0.49Charge Mass Equivalence Ratio [φm]
CA
10 [°
CA
]
368369370371372373374375376377
CA
10 [°
CA
]
PRF73, Pin = 1 barGasoline, Pin = 1 barEthanol, Pin = 1 barGasoline, Pin = 2 bar
2530354045505560
354 356 358 360 362 364 366 368 370 372 374Crank Angle [°CA]
Pres
sure
[bar
]
SOI = 40°CA, 20% DISOI = 280°CA, 20% DISOI = 280°CA, 30% DISOI = 280°CA, 40% DI
-50
0
50
100
150
200
250
300
354 356 358 360 362 364 366 368 370 372 374Crank Angle [°CA]
Hea
t-Rel
ease
Rat
e [J
/°CA
]
SOI = 40°CA, 20% DISOI = 280°CA, 20% DISOI = 280°CA, 30% DISOI = 280°CA, 40% DI
• PFS reduces HRR & PRR with ethanol, butbenefit is much less than for boosted gasoline.
• Ethanol is an important alternative fuel.• Exhibits true single-stage ignition
– Autoignition chemistry not φ-sensitive.– Very temperature sensitive.
• Also, a high heat of vaporization & much lower γ for a given φ than gasoline.
• Combination results in an inverse φ-sensitivity compared to boosted gasoline.
• Can we exploit this to reduce the HRR by using PFS to increase the TS?
• PRR and HRR are reduced with PFS due to increased TS. – Ignites lean-to-rich, opposite of boosted
gasoline with PFS.– NOx just below US-2010 at conditions tested.
19
Collaborations• Project is conducted in close cooperation with U.S. Industry through the
Advanced Engine Combustion (AEC) / HCCI Working Group.– Ten OEMs, Five energy companies, Four national labs, & Several universities.
• LLNL: Support chemical-kinetic mechanism development, Pitz et al.
• SNL: 1) Collaborate on ethanol HCCI with SI alt.-fuels lab, Sjöberg et al.2) Collaborative project on LES modeling of HCCI, Oefelein et al.
• General Motors: Bi-monthly internet meetings ⇒ in-depth discussions.– Support GM modeling of boosted HCCI and TS with data and discussions.
• U. of Michigan: Support modeling TS, boundary-layer devel. & heat transfer.
• U. of New South Wales: Support modeling of ethanol-fueled HCCI.
• Chevron: Funds-In project on advanced petroleum-based fuels for HCCI.
• JBEI (Joint BioEnergy Institute): Funds-In project on 2nd generation biofuel, iso-pentanol, for HCCI.
• SNL-LDRD: Funds-In project on biofuels produced by fungi ⇒ collab. with researchers in basic chemistry (C. Taatjes et al.) & Biofuels (M. Hadi et al.).

20
Future WorkThermal Stratification• Complete current parametric study using side-view imaging to determine the
of the effects of engine speed and intake temperature on TS.
• Extend parametric study to include: 1) independent variation of firedeck and piston-top temps, & 2) enhancing TS through increased turbulent convection.– Continue collaborations with J. Oefelein et al. on use of LES modeling of TS.
High-Efficiency, Boosted HCCI• Expand studies of PFS for boosted gasoline-fueled HCCI: 1) effects of
engine speed and load, & 2) improved mixture formation to improve stability.– Optical imaging of fuel distribution to assist improved mixture formation.
• Explore additional methods for increasing thermal efficiency of boosted HCCI ⇒ Fuel effects, compression ratio, and Miller cycle.
Support of HCCI Modeling• Continue collaborations with GM-research & U of Mich. on HCCI modeling.• Continue to collaborate with LLNL on improving chemical-kinetic
mechanisms of single components and gasoline-surrogate mixture.

21
Summary• Improvements to side-view imaging provide T-maps showing both bulk-gas
and boundary-layer thermal stratification (TS) simultaneously.
• No evidence of consistent flows transporting colder gas from near-wall regions into central bulk gas.
• Bulk-gas TS (which controls max. PRR) appears to result from in-cylinder turbulence producing turbulent structures extending from the wall.– Most cold pockets in bulk gas are structures attached to firedeck or piston top.– Bulk-gas TS reaches a maximum at TDC.
• Reducing Tin increases therm-eff. by reducing required EGR & heat transfer.
• Gasoline autoignition becomes strongly φ-sensitive with boost. ⇒ Enables large reduction in HRR and PRR with partial fuel stratification (PFS).
• PFS significantly increases high-load limit of gasoline-fueled, boosted HCCI.
• PFS also effective for increasing thermal efficiencies of boosted HCCI.– NOx and soot emissions were ultra-low for all PFS conditions studied.
• Ethanol shows “inverse” φ-sensitivity due to strong thermal effects. ⇒ Allows PFS to reduce HRR, but benefit is much less than for boosted gasoline.