
HBsAg loss: an achievable treatment target? - IC-HEP · 6 June 2015 HBsAg loss: an achievable...
55
6 June 2015 HBsAg loss: an achievable treatment target? Pietro Lampertico Gastroenterology and Hepatology Division Fondazione IRCCS Cà Granda - Ospedale Maggiore Policlinico University of Milan
Transcript of HBsAg loss: an achievable treatment target? - IC-HEP · 6 June 2015 HBsAg loss: an achievable...
6 June 2015
HBsAg loss: an achievable treatment target?
Pietro Lampertico
Gastroenterology and Hepatology Division
Fondazione IRCCS Cà Granda - Ospedale Maggiore Policlinico
University of Milan

Financial disclosures
► Advisory Board/Speaker Bureau for
- BMS, ROCHE, GILEAD SCIENCES, GSK, MSD

Outline of the presentation
• PEG-IFN and NUC therapy
• De-novo PEG and NUC combination
• Switch to PEG in NUC responders
• Add-on PEG in NUC responders
• New drugs/strategies

More highlights on sustained “off-therapy”
response in 2012 EASL guideline
EASL 2012
2012 EASL Guidelines
Ideal end-point: sustained off-therapy HBsAg clearance
with/without seroconversion
Satisfactory end-point: sustained off-therapy virological
and biochemical response without HBsAg loss
Next desirable end-point: maintained virological remission
(undetectable HBV DNA by a sensitive PCR assay)

Interferon therapy (Peg-IFN)

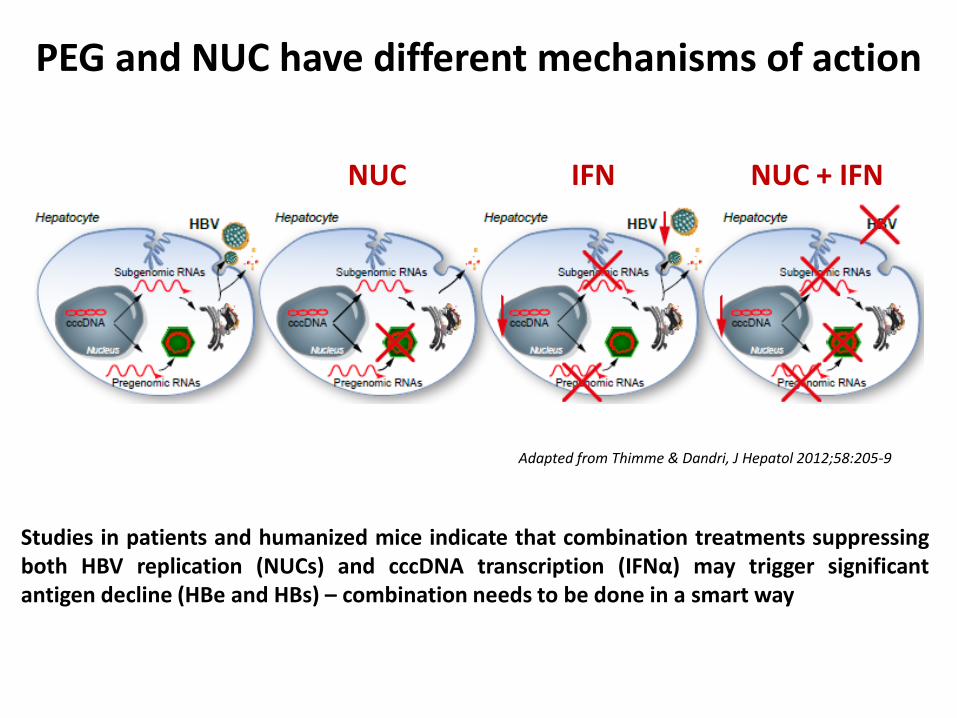
Studies in patients and humanized mice indicate that combination treatments suppressing both HBV replication (NUCs) and cccDNA transcription (IFNα) may trigger significant antigen decline (HBe and HBs) – combination needs to be done in a smart way
NUC IFN NUC + IFN
Adapted from Thimme & Dandri, J Hepatol 2012;58:205-9
PEG and NUC have different mechanisms of action

Treatment aims to enable patients to achieve inactive CHB with
sustained immune control
Peg-IFN alfa-2a treatment can also result in off-treatment immune
control2,3
Potential long-term clinical benefits of sustained immune control after a
finite course of Peg-IFN alfa-2a therapy:
What can we achieve with Peg-IFN alfa-2a in CHB?
1. Lau GK, et al. N Engl J Med 2005;352:2682–95; 2. Marcellin P, et al. Hepatol Int 2013;7:88–97
3. Marcellin P, et al. Gastroenterology 2009;136:2169–79; 4. Perrillo RP, et al. Hepatology 2006;43:S182–93
5. EASL clinical practice guidelines. J Hepatol 2012;57:167–85; 6. Liaw YF, et al. Antivir Ther 2010;15:25–33
Approximately 30% of patients respond to
treatment with Peg-IFN alfa-2a1,2
Approximately 30% of patients respond to
treatment with Peg-IFN alfa-2a1,2
Freedom from potentially life-long
treatment4
Freedom from potentially life-long
treatment4
No long-term safety concerns4
No long-term safety concerns4
Decreased risk of cirrhosis and liver cancer5,6
Decreased risk of cirrhosis and liver cancer5,6
HBsAg clearance
(clinical cure)2
HBsAg clearance
(clinical cure)2

48-week efficacy of HBV therapy
Aghemo A, Lampertico P, Colombo M, J Hepatol 2012

11/230
5%
1
14/230
6%
2
20/230
9%
3
25/230
11%
4
28/230
12%
5
Follow up (years)
0
2
4
6
8
10
12
14
5 years follow-up of Peg-IFN treated
HBeAg negative patients- HBsAg loss
Marcellin et al. EASL 2009
e-
Patients
with H
BsA
g
cle
ara
nce (
%)
230 patients with HBeAg-negative CHB treated Peg-IFN alfa 2a with ± lamivudine
11%
Genotype
D
5
5/47
All genotypes

Probability of HBsAg loss in IFN treated
HBeAg negative patients
HBsAg loss: 28 patients
(95%CI: 21-42%)
Lampertico P et al, EASL 2015
126 HBeAg neg patients, 90% geno D, IFN for 22 months, followed for 11 years
e-
IFN

Other biomarkers (including IP10) are under investigation; data from recent
studies investigating the relationship between IL28B and response have been
controversial and are currently under discussion9–14
Baseline predictors of response: accurate
prediction of response allows more informed
treatment decisions
IL28B = interleukin 28B
IP10 = interferon gamma-inducible
protein-10
ULN = upper limit of normal
1. Moucari R, et al. J Gastroenterol 2010;25:1469–75; 2. Buster EH, et al. Gastroenterology 2009;104:2449–57
3. Sonneveld MJ, et al. Hepatology 2012;56:67–75; 4. Piratvisuth T, et al. Hepatol Int 2013;7:429–36
5. EASL clinical practice guidelines. J Hepatol 2012;57:167–85; 6. Jansen L, et al. EASL 2013
7. de Niet A, et al. EASL 2013; 8. Bonino F, et al. Gut 2007;56:699–705; 9. Sonneveld MJ, et al.
Gastroenterology 2012;142:513–20; 10. Lampertico P, et al. Hepatology 2013;57:890–6
11. Lee IC, et al. PLoS One 2013;8:e58071; 12. Wei L, et al. AASLD 2013
13. Brouwer WP, et al. EASL 2013; 14. Papatheodoridis G, et al. AASLD 2013
HBeAg-positive patients1–7
Low HBsAg
High ALT (2 × ULN)
Low viral load (HBV DNA <2 × 10⁸ IU/mL)
HBV genotype (A > B > C > D)
Female gender
Wild-type vs precore/core promoter
mutations
HBeAg-positive patients1–7
Low HBsAg
High ALT (2 × ULN)
Low viral load (HBV DNA <2 × 10⁸ IU/mL)
HBV genotype (A > B > C > D)
Female gender
Wild-type vs precore/core promoter
mutations
HBeAg-negative patients5–8
Similar to those observed in HBeAg-
positive patients but less well defined
HBeAg-negative patients5–8
Similar to those observed in HBeAg-
positive patients but less well defined
Baseline factors associated with sustained response
in patients receiving Peg-IFN alfa-2a
Baseline factors associated with sustained response
in patients receiving Peg-IFN alfa-2a
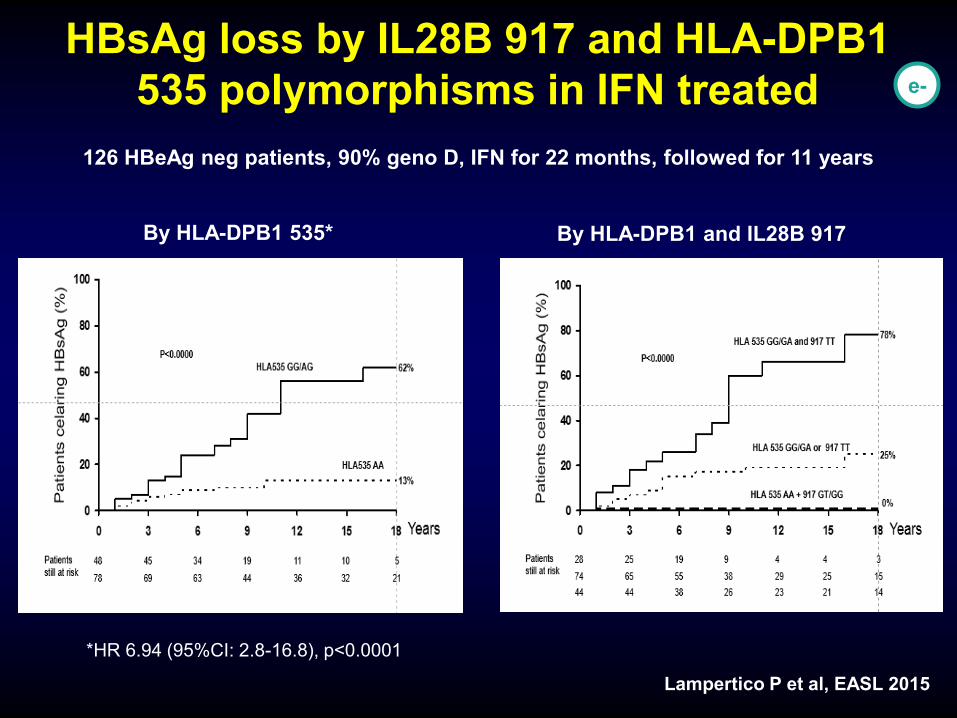
HBsAg loss by IL28B 917 and HLA-DPB1
535 polymorphisms in IFN treated
By HLA-DPB1 535*
Lampertico P et al, EASL 2015
126 HBeAg neg patients, 90% geno D, IFN for 22 months, followed for 11 years
e-
By HLA-DPB1 and IL28B 917
*HR 6.94 (95%CI: 2.8-16.8), p<0.0001

How can we improve PEG-IFN efficacy ?
• baseline predictors of response
• on-treatment predictors of response
• duration of therapy
• de-novo PEG+NUC combination therapy

De-novo PEG+NUC combination

Start TDF during follow-up if prespecified safety criteria met
De-novo combination of PEG-IFN +TDF
Randomized, controlled, open-label study (N=740)
– Stratified by screening HBeAg status and HBV genotype
Inclusion criteria
– HBeAg+ and HBV DNA ≥20,000 IU/mL; HBeAg- and HBV DNA ≥2,000 IU/mL
– ALT >54 and ≤400 U/L (men); ALT >36 and ≤300 U/L (women)
– No bridging fibrosis or cirrhosis on liver biopsy or by transient elastography
15
0 48 120 72
TDF + PEG
TDF+PEG → TDF
24
n=186
n=184
n=185
n=185 PEG
16
TDF
Week
Marcellin P et al, AASLD 2014

Start TDF during follow-up if prespecified safety criteria met
De-novo combination of PEG-IFN +TDF
Randomized, controlled, open-label study (N=740)
– Stratified by screening HBeAg status and HBV genotype
Inclusion criteria
– HBeAg+ and HBV DNA ≥20,000 IU/mL; HBeAg- and HBV DNA ≥2,000 IU/mL
– ALT >54 and ≤400 U/L (men); ALT >36 and ≤300 U/L (women)
– No bridging fibrosis or cirrhosis on liver biopsy or by transient elastography
16
0 48 120 72
TDF + PEG
TDF+PEG → TDF
24
n=186
n=184
n=185
n=185 PEG
16
TDF
Week
Marcellin P et al, AASLD 2014

HBsAg Loss Over Time (Week 72)
17
Pa
tie
nts
w
ith
HB
sA
g L
oss,
Ka
pla
n-M
eie
r E
stim
ate
(%
)
0.10
0.09
0.08
0.07
0.06
0.05
0.04
0.03
0.02
0.01
0.00
48 weeks
0 4 8 12 16 20 24 28 32 36 40 44 48 52 56 60 64 68 72
Week
0.15
0.14
0.13
0.12
0.11
72 weeks
7 patients had HBsAg seroreversion on or after Week 48 (4 in TDF+PEG 48 wk,
3 in TDF+PEG 16 wk →TDF 32 wk)
– 5/7 had ≤1 week of therapy after HBsAg loss
TDF + PEG 16 wk →TDF 32 wk
TDF + PEG 48 wk 9.0%
0%
2.8%
2.8%
p=0.003
p<0.001
p=NS
p=NS PEG 48 wk
TDF 120 wk
Marcellin P et al, AASLD 2014

‡
18 Chan et al, EASL 2015, O117
Baseline and On-Treatment Predictors of HBsAg Loss at Week 72
Univariate
P-value
Multivariate
P-value
Hazard ratio
Multivariate
Baseline
Predictors
Genotype A vs B 0.024 <0.001 7.32
Genotype A vs C <0.001 <0.001 16.76
Genotype A vs D 0.004 0.007 8.64
Arm A vs B (Peg+NUC short) 0.030 0.017 3.78
Arm A vs C (TDF) 0.018 0.070 15.68
Arm A vs D (Peg-IFN) 0.031 0.014 4.19
On-Treatment
Predictors
HBsAg decrease >1 log10 IU/mL by Week
12 (yes vs no) <0.001 <0.001 17.8
Anti-HBs >10 mIU/mL at Week 12 (yes vs
no) 0.138 0.003 9.97
ALT >400 U/L (males) or >300 U/L
(females) during first 12 weeks (yes vs no) <0.001 0.031 2.85
Arm A: PEG+NUC for 48 wks

On-Treatment Predictors of HBsAg Loss at Week 72
19
‡
Chan et al, EASL 2015, O117
Sensitivity Specificity
Positive
Predictive
Value
Negative
Predictive
Value
HBsAg decline from baseline
> 1 log10 at Week 12 71% 92% 43% 97%
TDF + PegIFN 48 wk
High negative predictive values are seen among patients treated
with TDF + PegIFN combination if they have:
HBsAg decline < 1 log10 IU/mL at Week 12

On-Treatment Predictors of HBsAg Loss at Week 72
20
‡
Chan et al, EASL 2015, O117
Sensitivity Specificity
Positive
Predictive
Value
Negative
Predictive
Value
HBsAg decline from baseline
> 1 log10 at Week 12 71% 92% 43% 97%
TDF + PegIFN 48 wk
High negative predictive values are seen among patients treated
with TDF + PegIFN combination if they have:
HBsAg decline < 1 log10 IU/mL at Week 12
87% of PEG-IFN +TDF treated should stop combo at
week 12 because of low chance (3%) of HBsAg loss

PegIFN vs PegIFN + TDF in CHB
21 Marcellin P et al, EASL 2015, P0657
Efficacy of combination of TDF+PegIFN compared to PegIFN monotherapy
PegIFN
(n=30)
PegIFN + TDF
(n=32)
HBsAg loss at week 48 (EOT) 2 (6.6%) 4 (12%)
HBsAg loss at year 3 (follow-up) 6 (20%) 6 (19%)
PegIFN + TDF (n=45)
PegIFN monotherapy (n=43)
Wk 0 Wk 48
CHB patients • HBeAg-negative, n=62
• HBeAg-positive, n=26
HBeAg-Negative patients
HBeAg-negative patients receiving PegIFN+TDF experienced higher EOT HBsAg loss than PegIFN monotherapy, but both groups had similar HBsAg loss 3 years after EOT
‡

Oral therapy (NUC)
Studies in patients and humanized mice indicate that combination treatments suppressing both HBV replication (NUCs) and cccDNA transcription (IFNα) may trigger significant antigen decline (HBe and HBs) – combination needs to be done in a smart way
NUC IFN NUC + IFN
Adapted from Thimme & Dandri, J Hepatol 2012;58:205-9
PEG and NUC have different mechanisms of action

8 years TDF for naïve CHB – Efficacy summary
1Missing/addition of FTC = failure [LTE-TDF]); 2Missing=excluded/addition of FTC = included.; 3Kaplan-Meier
(KM-ITT); NA = not applicable
%
HBeAg-
n=375
HBeAg+
n=266
HBV DNA ITT1 Observed2 ITT Observed
<69 IU/mL 75 99.6 58 98
<29 IU/mL 74 99 58 97
HBeAg loss / seroconversion NA NA 32 / 21 47 / 31
HBsAg loss / seroconversion 1.1 / 0.7 1.1 / 0.7 12.9 / 10.3 11.5 / 8.5
No resistance to TDF detected
Marcellin P et al, AASLD 2014
For HBeAg positive:
HBsAg loss: ~19% in white vs 0% in Asians

Indicators of future HBsAg loss: early HBeAg
loss and a fast decline in HBsAg levels
Multivariate models: HBeAg+ve; genotype A and D1
Characteristic Odds Ratio (95% CI) P-value
HBeAg loss in first 24 weeks 13.460
(2.159 - 83.927) 0.0054
Log10 slope of HBsAg: baseline to Week 12 12.440
(1.888 - 81.961) 0.0088
Years from diagnosis of HBV: ≤4 vs. >5 6.944
(1.119 - 43.478) 0.0375
1. Adapted from Marcellin P, et al. EASL 2011; Poster #740.

Summary of Efficacy Endpoints at Week 144
Chinese TDF vs. ADV Registration Study
a. Virological breakthrough was defined as HBV DNA level increase ≥ 1 log10 copies/mL above the treatment nadir and be confirmed on two consecutive
visits at least 1 month apart
b. Detected only at one visit and HBsAg became positive at subsequent visits
Table includes all randomized study subjects who received at least one dose of study medication (ITT population).
28
‡
Response
HBeAg+ Patients
P-value
HBeAg- Patients
P-value TDF-TDF
(n=103)
ADV-TDF
(n=99)
TDF-TDF
(n=154) ADV-TDF
(n=153)
Patients with HBV DNA < 400
copies/mL, n (%) 97 (94.2) 95 (96.0) 0.5571 144 (93.5) 145 (94.8) 0.6370
Log10 copies/mL decline from
baseline in HBV DNA, mean (SD) -6.6 (0.86) -6.5 (0.80) 0.7944 -4.9 (1.16) -4.9 (1.09) 0.8855
Virological breakthrougha, n (%) 0 6 (6.1) 0.0115 3 (1.9) 4 (2.6) 0.6958
ALT normalization, n (%) 92 (90.2) 87 (89.7) 0.9057 123 (90.4) 119 (90.2) 0.9362
HBeAg loss, n (%) 37 (35.9) 24 (24.2) 0.0678 NA NA -
HBeAg seroconversion, n (%) 33 (32.0) 20 (20.2) 0.0530 NA NA -
HBsAg loss, n (%) 1 (1.0)b 0 0.3149 0 1 (0.7)b 0.3157
HBsAg seroconversion, n (%) 0 0 - 0 1 (0.7)b 0.3157
Hou et al, APASL 2015, Oral #1292

Summary of Efficacy Endpoints at Week 144
Chinese TDF vs. ADV Registration Study
a. Virological breakthrough was defined as HBV DNA level increase ≥ 1 log10 copies/mL above the treatment nadir and be confirmed on two consecutive
visits at least 1 month apart
b. Detected only at one visit and HBsAg became positive at subsequent visits
Table includes all randomized study subjects who received at least one dose of study medication (ITT population).
29
‡
Response
HBeAg+ Patients
P-value
HBeAg- Patients
P-value TDF-TDF
(n=103)
ADV-TDF
(n=99)
TDF-TDF
(n=154) ADV-TDF
(n=153)
Patients with HBV DNA < 400
copies/mL, n (%) 97 (94.2) 95 (96.0) 0.5571 144 (93.5) 145 (94.8) 0.6370
Log10 copies/mL decline from
baseline in HBV DNA, mean (SD) -6.6 (0.86) -6.5 (0.80) 0.7944 -4.9 (1.16) -4.9 (1.09) 0.8855
Virological breakthrougha, n (%) 0 6 (6.1) 0.0115 3 (1.9) 4 (2.6) 0.6958
ALT normalization, n (%) 92 (90.2) 87 (89.7) 0.9057 123 (90.4) 119 (90.2) 0.9362
HBeAg loss, n (%) 37 (35.9) 24 (24.2) 0.0678 NA NA -
HBeAg seroconversion, n (%) 33 (32.0) 20 (20.2) 0.0530 NA NA -
HBsAg loss, n (%) 1 (1.0)b 0 0.3149 0 1 (0.7)b 0.3157
HBsAg seroconversion, n (%) 0 0 - 0 1 (0.7)b 0.3157
Hou et al, APASL 2015, Oral #1292

HBsAg kinetics in HBeAg-negative patients
treated with TDF for 4 years
• Asians have lower baseline levels of HBsAg than non-Asians
• In both groups, the overall 192 week declines were modest
Mean
HB
sA
g(L
og
10 IU
/mL
)
5.0
4.5
4.0
3.5
3.0
2.5
2.0
0 12 24 36 48 64 80 96 1 08 120 132 144 156 168 180 192
Weeks on treatment
0 12 24 36 48 64 80 96 108 120 132 144 156 168 180 192
Fung S, et al. APASL 2012; Poster #PP09-043.
Non-Asians (N = 281)
Asians (N = 94)
HBsAg decline: 0.35 -0.50 log/4 years

0
20
40
60
80
100
Pati
en
ts %
5 years ETV for real life, naive CHB patients
Virological summary
97%
n=744
97%
n=222
99%
n=418
96%
n=535
Europe1 Hong-Kong3 Italy2 Thailand5
100%
n=252
Japan4
1)Arends P, et al Gut. 2014 in press 2) Lampertico P, et al. J Hepatol 2013;58:S306. 3) Seto WK, et al J Gastroenterol
Hepatol 2014;29:1028-34. 4)Ono A, et al J Hepatol 2012;57:508–14. 5)Tanwandee T, et al. Hepatology 2013;58:672A
HBsAg loss
Anti-HBe seroconv. 33% 33% 38% 67% 55% 58%
1.5% 0.2% 0.4% 3.5% 4.1%

* Kaplan-Meier estimates
0
20
40
60
80
100
0 6 12 18 24 30 36 42 48 54 60 Months
Patients
at risk 72 68 52
55%
43 36 28
HBeAg seroconversion: 31 patients
25 22 16 11 7
0
20
40
60
80
100
0 6 12 18 24 30 36 42 48 54 60
34%
HBsAg loss: 15 patients
72 69 65 55 49 42 38 34 29 23 14
5-years ETV in naive, field practice CHB
Serological response in HBeAg pos
Lampertico et al , EASL 2013

NUC-experienced patients

0
5
10
15
20
Pati
en
ts (
%)
5 years TDF for LAM-ADV-exp CHB patients
HBsAg levels
7.8%
N=25
HBsAg
10-100 IU/ml
4.7%
N=15
HBsAg
loss
8.1%
N=26
HBsAg
0.05-10 IU/ml
320 patients, 59 yrs, 78% male, 85% HBeAg neg, 85% geno D, 97% LAM
exp, 88% ADV exp, 74% HBV-DNA neg, 60% cirrhotics
Lampertico P et al , EASL 2015
21%
HBsAg
<100 IU/ml
N=66

To improve HBsAg response in long-
term NUC treated patients

2013
“Switch to PEG” in long-term ETV treated pts:
OSST study 1-year follow-up e+
Ning Q et al, J Hepatol 2014
Mean duration of ETV at randomization: 20 months

Switching from long-term ETV to PegIFN 2a:
Results at week 48 (EOT for PEG) - mITT
Response, n (%) PegIFN alfa2a (n=94)
ETV (n=98)
P value
HBeAg loss 16 (38%) 16 (33%) NS
HBeAg seroconversion 14 (15%) 6 (6%) 0.046
HBsAg <100 IU/ml 22 (27%) 4 (4.4%) <0.0001
HBsAg <10 IU/ml 13 (16%) 0 <0.0001
HBsAg loss 8 (8.5%) 0 <0.01
HBsAg seroconversion 4 (4.3%) 0 NS
HBV DNA <1000 cp/mL 59 (72%) 90 (98%) <0.0001
ALT normal 48 (58%) 84 (94%) <0.0001
Ning Q, et al, J Hepatol 2014
e+

ANRS
26/07/2013
EASL 2015 / April 22-26 - Vienna 40
* Log10 IU/ml decrease between W0/W48 and W0/W96. Error bars represent 95% confidence intervals.
1.5
2.0
2.5
3.0
3.5
W0 W12 W24 W36 W48 W60 W72 W84 W96
Weeks
NUC alone (n=93)
PEG-IFN + NUC (n=90)
P=0.0001 P=0.006
-0.19*
-0.35*
-0.91* -0.89*
Bourliere M. et al, EASL 2015
A RCT of 48-week add-on Peg-IFN in NUC responders
185 HBeAg negative French patients, 40% Caucasians, neg HBV-DNA >1 year M
ea
n H
Bs
Ag
tit
ers
(lo
g IU
/ml)
HBsAg loss:
Week 48: 0% vs 8%, p<0.01
Week 96: 3% vs 8%, p=015

ANRS
On-treatment changes in HBsAg levels
26/07/2013
EASL 2015 / April 22-26 - Vienna 41
-2.5
-2.0
-1.5
-1.0
-0.5
0.0
0.5
1.0
1.5
2.0
2.5
3.0
3.5
W0 W12 W24 W36 W48 W60 W72 W84 W96
Me
an H
BsA
g ti
ter
log 1
0 (
IU/m
l)
Weeks
W96 non responder N=83
W96 PEG-IFN responder N=7
In the PEG-IFN + NUC group
P<0.0001 P<0.0001
-0.70* -0.62*
-3.27*
-3.74*
* Log10 IU/ml decrease between W0/W48 and W0/W96. Error bars represent 95% confidence intervals.
Bourliere M. et al, EASL 2015

0
200
400
600
800
1000
1200
1400
1600
-12 0 12 24 36 48
Med
ian
HB
sA
g l
evels
(IU
/ml)
Weeks
PEG
48 week Add-on Peg-IFN in HBeAg neg, geno D,
NUC responders - HERMES study
Lampertico P. et al, EASL 2015
Patients:
50 yr, 81% male, 100% Caucasian, 100% geno D
100% with HBV- DNA negative and normal ALT levels
Undetectable HBV DNA for 3.2 years (1.1-8) before add-on PEG
NUC
1160
308
P<0.001
Overall, 73% qHBsAg decline
43% pts with >50% decline
One HBsAg loss (1.4%)
Two HBsAg <10 IU/ml (3%)
(70 patients - Week 48 analysis)
e-
743

After NUC withdrawal

55
39
27
0
20
40
60
80
Patients
with s
usta
ined r
esponse
after
5.5
years
(%
)
Durability of response to ADV in
HBeAg-negative patients from Greece
Hadziyannis SJ, et al. Gastroenterology 2012;143:629–36
*Persistently HBV DNA undetectable and
persistently normal ALT;
ADV: adefovir; ALT: alanine aminotransferase
Sustained
responders*
HBsAg
loss
HBsAg
seroconversion
18/33 13/33 9/33
• 33 patients with undetectable HBV
DNA levels who had discontinued
ADV therapy were followed for 67–
72 months
• Initially all sustained responders,
had a
virological relapse and
76% had a hepatitis flare
• The 5.5-year rate of HBsAg loss in
sustained responders was 72%
• No patient with HBsAg loss
seroreverted

Stopping LAM treatment in
HBeAg-negative patients from Taiwan
• 105 HBeAg-negative patients
stopped LAM
(52% GT B; 48% GT C)
• Stopping rule: undetectable HBV
DNA for 12 months*
• Median follow up: 49 months
• Durable response: undetectable
HBV DNA (<2000 IU/mL)
57
40
32
3.2
12.6
30.3
0
20
40
60
80
100
1 3 6 1 3 6
Pa
tie
nts
(%
)
Years off treatment
Chen CH, et al. J Hepatol 2014;
doi.org/10.1016/j.jhep.2014.04.029 (epub ahead of print)
*2 consecutive assessments at least 6 months apart †Percentages are a proportion of the total population
not of those with a durable response
Durable response HBsAg loss†

HBsAg loss
qHBsAg predicts HBsAg loss and
HBV relapse after LAM discontinuation
Chen CH, et al. J Hepatol 2014;
doi.org/10.1016/j.jhep.2014.04.029 (epub ahead of print)
*defined as serum HBV DNA >2,000 IU/mL in
2 measurements at least 3 months apart
HBsAg 120–1000 IU/mL
60
40
20
0
0 52 104 156 208 260 312 364
Cum
ula
tive
incid
en
ce
of H
BsA
g loss
Duration of follow-up (weeks)
HBsAg <120 IU/mL P<0.001
HBsAg >1000 IU/mL
80
100
24 20 19 14 9 8 4 4
42 31 24 20 16 10 8 4
39 35 26 21 17 14 8 2
<120
120‒1000
>1000
No. at risk HBsAg (IU/mL)
HBV DNA relapse*
100
60
40
20
0
0 52 104 156 208 260 312 364
Duration of follow-up (weeks)
HBsAg <200 IU/mL
P<0.001
Cum
ula
tive
incid
en
ce
of H
BV
rela
pse
HBsAg >1000 IU/mL
HBsAg 200–1000 IU/mL
80
39 19 10 8 7 5 2 1
36 19 9 7 4 3 3 1
30 29 28 25 20 16 10 9
>1000
200‒1000
<200
No. at risk HBsAg (IU/mL)
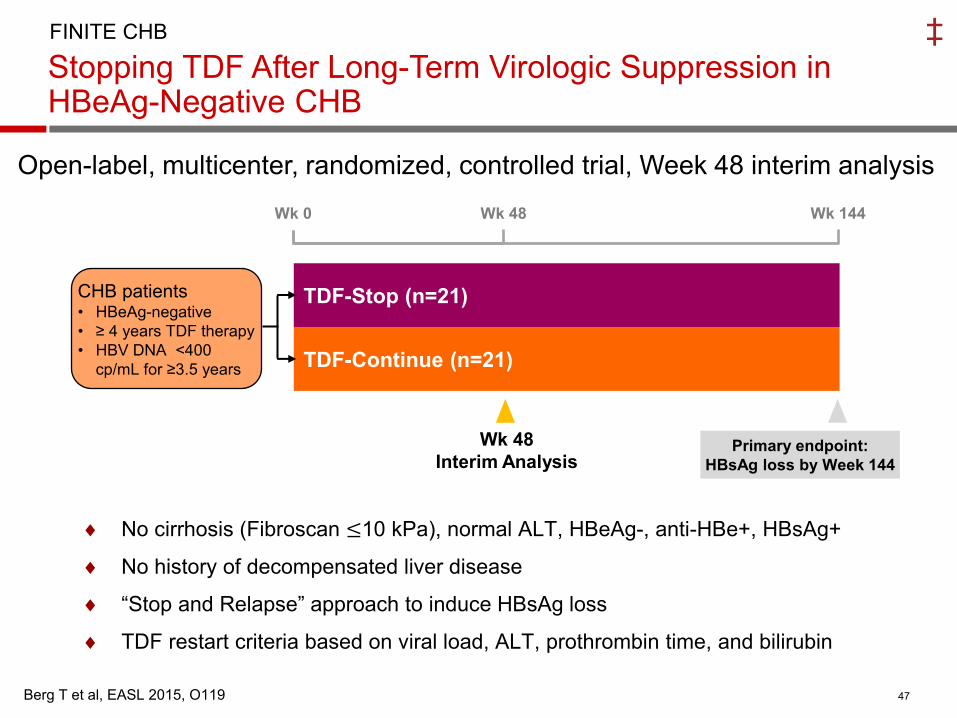
Stopping TDF After Long-Term Virologic Suppression in HBeAg-Negative CHB
47 Berg T et al, EASL 2015, O119
FINITE CHB
Open-label, multicenter, randomized, controlled trial, Week 48 interim analysis
TDF-Continue (n=21)
TDF-Stop (n=21)
Primary endpoint:
HBsAg loss by Week 144
Wk 0 Wk 48 Wk 144
CHB patients • HBeAg-negative
• ≥ 4 years TDF therapy
• HBV DNA <400
cp/mL for ≥3.5 years
Wk 48
Interim Analysis
No cirrhosis (Fibroscan ≤10 kPa), normal ALT, HBeAg-, anti-HBe+, HBsAg+
No history of decompensated liver disease
“Stop and Relapse” approach to induce HBsAg loss
TDF restart criteria based on viral load, ALT, prothrombin time, and bilirubin
‡

48
TDF-Stop (n=21): HBsAg loss, HBV DNA, ALT, TDF-Restart
FINITE CHB
0
20
40
60
80
100
Week 12 Week 24 Week 48
Pa
tie
nts
(%
)
HBsAg loss
HBV DNA <2000, ALT <2 x ULN
HBV DNA <2000, ALT >2 x ULN
HBV DNA >2000, ALT <2 x ULN
HBV DNA >2000, ALT >2 x ULN
TDF-Restart5%
24%
10%
10%
52% 48%
38%
10%
5%
57%
19%
14%
10%
‡
Berg T et al, EASL 2015, O119


Future HBV therapies: new targets, new drugs
Immunomodulation • Toll-like receptors
agonists, e.g. GS-9620
• Anti-PD-1 mAb, e.g. BMS-936559
• CYT107 • GI13000 • Vaccine therapy
Development stage: preclinical, clinical ; modified fand updated rom Zoulim, F, et al. Antiviral Res 2012;96(2):256–9; HBV Drug Watch, Available at: http://www.hepb.org/professionals/hbf_drug_watch.htm.
HBx
Endosome
rcDNA
cccDNA
Polymerase
pgRNA
Core
Surface proteins
Entry inhibitors (HBV/HDV) • Lipopeptides, e.g.
Myrcludex-B
Targeting cccDNA • HAPs • Chromatin-modifying
enzymes
Inhibition of Nucleocapsid Assembly, e.g. Bay 41-4109, NVR1221
Polymerase inhibitors • Nucleoside
analogues, e.g. • TAF, amdoxovir,
MIV-210 • Non-nucleoside,
e.g. LB80380
Inhibition of HBsAg release, e.g. REP 9AC
RNA interference, (siRNA) e.g. ARC-520
Inhibition of Prenylation (HDV) • Lonafarnib

What May a HBV Curative Regimen Look Like?
cccDNA inhibitor
NUC ±
Entry inhibitor
Agent to prevent viral spread, cccDNA re-amplification
Agents to activate antiviral immunity or relieve repression of the system
Selective agent to deplete or perturb cccDNA
Immune activator
+
+
HBV antigen inhibition
Agents to inhibit other components in the HBV life cycle [entry or cell-spread, capsid, HBX, HBsAg]
+
Adapted from S. Locarnini, 2014

HBsAg loss - Conclusions
• HBsAg loss is an achievable target today, however in
few patients only (duration of therapy)
• Genetic, disease and viral factors play a major role
• New strategies (de-novo combo, switch to or add-on)
with current drugs may improve HBsAg loss
• New strategies with new drugs aimed to HBsAg loss
• Is HBsAg loss a mandatory target ?
- NO, if the goal is to improve patient survival
- YES, if the goal is to shorten duration of NUC


Extended pegylated interferon alfa-2a therapy in Chinese
Patients with HBeAg-negative chronic hepatitis B: a
single-center, prospective, randomized open-label study
HBV-DNA suppression: <60 IU/ml
0
PegIFN
180 µg/week
96 48
Follow-up
RND
(n=66) PegIFN
180 µg/week Follow-up
60/72 108/120 weeks
n=36
n=30
Chen XP, et al. Poster 505. EASL 2012
HBsAg clearance at 48 weeks post-treatment significantly higher
in extended therapy group: 36.1% vs 13.3% (p<0.05)
HBsAg <1000 IU/ml and HBV DNA <60 IU/ml at end of treatment:
• PPV of 92% and NPV of 48.78% for achieving HBV DNA
suppression
e-

CHB Treatment
Guidelines EASL 2012 guidelines
HBeAg positive
A) confirmed anti-HBe seroconversion (and undectable
HBV DNA) after at least 12 months of consolidation*
B) confirmed HBsAg loss and anti-HBs seroconversion
HBeAg negative confirmed HBsAg loss and anti-HBs seroconversion
Cirrhotics confirmed HBsAg loss and anti-HBs seroconversion
When to stop NUC therapy ?
*A proportion of patients who discontinue NUC therapy after anti-HBe seroconversion may
require retreatment, since they fail to sustain their serological and/or virological response
adapted from EASL HBV Guidelines, J Hepatol 2012
Reijnders JG and Janssen HL. Hepatology 2013
Lampertico P. Gut 2014