Hazardous Bus Stops Identification: An Illustration Using GIS
19
Hazardous Bus Stops Identification 65 Hazardous Bus Stops Identification: An Illustration Using GIS Srinivas S. Pulugurtha, e University of North Carolina at Charlotte Vinay K. Vanapalli, Stantec Consulting Inc. Abstract Safety and accessibility to bus transit systems play a vital role in increasing transit market potential. Bus passengers often tend to cross the streets from either behind or in front of the bus as crosswalks do not exist near most bus stops, which are typically away from intersections. ese unsafe maneuvers frequently result in either auto- pedestrian collisions or conflicts. Identifying hazardous bus stops would serve as a building block to study the causal factors, select mitigation strategies, and allocate safety funds to improve bus passen- ger safety. e focus of this article is to develop a Geographic Information Systems (GIS) based methodology to assist decision-makers in identifying and ranking bus stops in high auto-pedestrian collision concentration areas. e working of the GIS- based methodology is illustrated using 2000–2002 auto-pedestrian collision data, traffic volumes, bus stop coverage, transit ridership data, and street centerline cov- erage for the Las Vegas metropolitan area. Results obtained are sensitive to buffer radius and ranking methods used to rank hazardous bus stops. Potential strategies and countermeasures to enhance safety at hazardous bus stops are also discussed. Introduction Increasing traffic congestion and decreasing air quality standards are growing problems in many urban areas. e quest to address these problems has been
Transcript of Hazardous Bus Stops Identification: An Illustration Using GIS

Hazardous Bus Stops Identification
65
Hazardous Bus Stops Identification: An Illustration Using GIS
Srinivas S. Pulugurtha, The University of North Carolina at Charlotte Vinay K. Vanapalli, Stantec Consulting Inc.
Abstract
Safety and accessibility to bus transit systems play a vital role in increasing transit market potential. Bus passengers often tend to cross the streets from either behind or in front of the bus as crosswalks do not exist near most bus stops, which are typically away from intersections. These unsafe maneuvers frequently result in either auto-pedestrian collisions or conflicts.
Identifying hazardous bus stops would serve as a building block to study the causal factors, select mitigation strategies, and allocate safety funds to improve bus passen-ger safety. The focus of this article is to develop a Geographic Information Systems (GIS) based methodology to assist decision-makers in identifying and ranking bus stops in high auto-pedestrian collision concentration areas. The working of the GIS-based methodology is illustrated using 2000–2002 auto-pedestrian collision data, traffic volumes, bus stop coverage, transit ridership data, and street centerline cov-erage for the Las Vegas metropolitan area. Results obtained are sensitive to buffer radius and ranking methods used to rank hazardous bus stops. Potential strategies and countermeasures to enhance safety at hazardous bus stops are also discussed.
IntroductionIncreasing traffic congestion and decreasing air quality standards are growing problems in many urban areas. The quest to address these problems has been

Journal of Public Transportation, Vol. 11, No. 2, 2008
66
ongoing for several years. An enhanced bus transit system is one possible solution to address the growing congestion and air quality problems in urban areas. The success of bus transit systems, which depends a lot on the generated revenue, in turn depends on ridership. Transit system passengers’ perception of transit system safety is very often a deciding factor as to whether one uses the system (Vogel and Pettinari 2002; Volinski and Tucker 2003). However, the bus transit market potential cannot be explored to its full extent unless issues related to safety of bus passengers (either on board or during their travel from/to the bus stop) and acces-sibility to the bus stops is addressed. Toolkits are being designed and developed to enhance accessibility and safety of bus stops to attract more riders and enhance systems performance (Weiner and Singa 2006; Hamby and Thompson 2006).
In general, a majority of bus transit trips begin and end with a walk trip. Stud-ies, such as the one by Moudon and Hess (2003), have shown a strong relation between auto-pedestrian collisions and widely used transit corridors. Providing appropriate pedestrian facilities along bus transit corridors makes access to transit systems more effective. At a minimum, such facilities should include sidewalks, crosswalks, and pedestrian signals. However, facilities such as crosswalks and pedestrian signals do not exist at bus stops, which are farther away from an inter-section. Lack of these facilities or having to use long circuitous routes encourages bus transit system users to cross the streets midblock from either behind or in front of the bus to board or alight a bus. These unsafe maneuvers frequently result in auto-pedestrian collisions or conflicts.
The focus of this article is to identify and rank bus stops in high auto-pedestrian collision concentration areas. Capabilities available in commercial Geographic Information Systems (GIS) software programs are explored to identify hazardous bus stops. The results obtained can be used by transit system managers to further study the causes of collisions, understand the problems, and identify strategies to better plan and operate bus transit systems. Further, the results also assist in identifying target locations for education, outreach, and enforcement to enhance safety.
DataThe data required to identify hazardous bus stops include auto-pedestrian colli-sion data, traffic volumes, bus-stop coverage, bus ridership data, and street center-line network in a GIS format. In this study, collision data for the years 2000–2002

Hazardous Bus Stops Identification
67
from the Nevada Department of Transportation (DOT) were used. One of the limitations of the collision data obtained from Nevada DOT was the lack of appro-priate information to identify auto-pedestrian collisions that involved transit system users. Hence, all auto-pedestrian collisions during the period 2000–2002 were used in this study.
Traffic volumes from 2000–2002 were obtained from Nevada DOT Annual Traf-fic Reports. The bus-stop coverage and bus ridership data was obtained from the Regional Transportation Commission of Southern Nevada (RTC). Street centerline coverage was obtained from the Clark County GIS Manager’s Office.
GIS MethodologyA GIS-based methodology was developed to identify and rank bus stops in high auto-pedestrian collision concentration areas. The GIS-based methodology involves the following steps:
1. Geocode auto-pedestrian collision data.
2. Create an auto-pedestrian collision concentration map.
3. Overlay bus-stop coverage on auto-pedestrian collision concentration map.
4. Extract the number of collisions for each bus stop in high auto-pedestrian collision concentration areas.
5. Identify traffic volumes and obtain alighting and boarding data.
6. Compute collision frequency, collision rates, and rank high-collision bus stops.
Step 1. Geocode Auto-Pedestrian Collision DataIn this step, the auto-pedestrian collision data collected are geocoded using stan-dard features available in commercial GIS software programs. The street centerline coverage is used to address-match the collision data. As the study area is an urban area, street name/reference street name and address reference systems are used to address match collision locations.
Step 2. Create an Auto-Pedestrian Collision Concentration MapThe geocoded auto-pedestrian collisions obtained in Step 1 may show spatial clustering and dispersion across the study area. However, the presence of a dot on a GIS map does not necessarily equal one collision. Several collisions may have

Journal of Public Transportation, Vol. 11, No. 2, 2008
68
occurred at this point. For example, Figure 1 shows the spatial distributions of auto-pedestrian collisions along a corridor. In the example, seven auto-pedestrian collisions occurred at the Flamingo Road/Maryland Parkway intersection whereas only one auto-pedestrian collision has occurred at the Flamingo Road/Tamarus Street intersection during the study period. However, in the figure, both the loca-tions appear as if they have only one collision each. This is because the symbols (dots in the map) for each of the collisions at one location lie on top of each other and cannot be distinguished. In other words, the map does not exactly reflect the collision concentrations of locations having more than one collision.
Figure 1. Spatial Distributions of Auto-Pedestrian Collisions—Points
Developing collision concentrations is extremely helpful in identifying high auto-pedestrian collision concentration areas. This can be achieved using the density map feature available in most commercial GIS software programs. The number of cells and radius are two parameters that have an affect on collision concentration. Figure 2 shows the concentration of collisions created using the Kernel Density

Hazardous Bus Stops Identification
69
Method for the same corridor in Figure1. From the figure, it can be clearly seen that the Flamingo Road/Maryland Parkway intersection has a greater number of auto-pedestrian collisions when compared to the Flamingo Road/Tamarus Street, and hence by comparison is a “higher” collision concentration location. Thus, in this step, a collision concentration map is created to identify high risk areas from the geocoded auto-pedestrian collision coverage using the Kernel Density Method.
Figure 2. Spatial Distributions of Auto-Pedestrian Collisions—
Concentrations
Step 3. Overlay Bus Stop Coverage on Auto-Pedestrian Collision Concentration MapThe objective of this study is to identify and rank bus stops in high auto-pedes-trian collision concentration areas. In this step, bus-stop coverage is overlaid on the collision concentration map developed in Step 2 to identify bus stops in high auto-pedestrian collision concentration areas.

Journal of Public Transportation, Vol. 11, No. 2, 2008
70
Step 4. Extract the Number of Collisions for Each Bus Stop in High Auto-Pedestrian Collision Concentration AreasHigh auto-pedestrian collision concentration areas are classified into no-, low-, medium-, and high-risk areas. The focus of this step is to extract the number of auto-pedestrian collisions in the vicinity of each bus stop in high auto-pedestrian collision concentration areas. Bus stops that may be considered further in analyses could only be those in high-risk level areas, medium- and high-risk level areas, or low-, medium-, and high-risk level areas.
First, buffers are generated around the bus stops in selected risk-level areas using standard features available in commercial GIS software programs to identify auto-pedestrian collisions in the vicinity of each bus stop. The buffer distance should be selected such that only auto-pedestrian collisions related to and within the area of bus stop of interest are identified.
Second, the buffers are then overlaid on the geocoded auto-pedestrian collision coverage to capture the identified auto-pedestrian collisions in the vicinity of each bus stop. Clipping, which is performed to cut a portion of one layer using one or more polygons in another layer, is used to capture the auto-pedestrian collisions. The resultant layer from the clipping process is a clipped collision shape file that gives the total number of collisions which fall in all the buffers. This layer does not identify the exact buffer in which a collision falls. The join tool is then used to link the collisions with their corresponding buffer. The two databases that are joined are the clipped collision database and buffered bus-stop database. Each collision is linked with its corresponding bus-stop buffer with the help of the join tool.
Step 5. Identify Traffic Volumes and Obtain Alighting and Boarding DataTraffic (link) volumes at each bus stop in high auto-pedestrian collision concentra-tion areas could be collected or identified from annual traffic reports. It is gener-ally felt that auto-pedestrian collisions are high at locations with high pedestrian activity or exposure. At bus stops, this can be easily observed by collecting data pertaining to the number of passengers alighting and boarding the bus. This step focuses on obtaining this data for each identified bus stop in high auto-pedestrian collision concentration areas.
Hazardous Bus Stops Identification
71
Step 6. Compute Collision Frequency, Collision Rates, and Rank High-Collision Bus StopsThe ranking of high-collision bus stops is done using three different methods. In the first method (collision frequency), high-collision bus stops are ranked using the number of auto-pedestrian collisions in the vicinity of each high collision bus stop. For the second method (collision rate–ADT), collision rates are calculated by dividing the number of auto-pedestrian collisions per year by traffic volume in million vehicles per year. In the third method (collision rate–TP), the collision rates for each high-collision bus stop are computed by dividing the percent of auto-pedestrian collisions in the vicinity of a high-collision bus stop by the per-cent of transit passengers (alighting and boarding) using the same high-collision bus stop. The high-collision bus stops are then ranked based on the computed collision rates. Percent was considered as transit ridership data were not available for the same duration for each bus stop. Further, transit ridership data were not available for the same period as collision data. If such data were available, collision rates could be computed by dividing the number of auto-pedestrian collisions in the vicinity of a high-collision bus stop by the number of transit passengers (alighting and boarding) using the same high-collision bus stop during the same period. Alternatives, such as passenger survey data, may be considered if no form of alighting and boarding data are available.
Illustration and DiscussionThe Las Vegas metropolitan area is considered as the study area for the illustration of the methodology. On average, the Las Vegas metropolitan area has seen more than 50 fatal auto-pedestrian collisions and 600 injury auto-pedestrian collisions per year during the last five years. This history of high incidence of auto-pedestrian collisions in the Las Vegas metropolitan area has generated awareness in the agen-cies (City of Henderson, City of Las Vegas, City of North Las Vegas, Clark County, and the Nevada Department of Transportation) that govern the area.
Previous research (Pulugurtha and Nambisan 2002, 2003) on auto-pedestrian collisions in the study area indicated that motorists’ failure to yield is a major con-tributing factor of auto-pedestrian collisions at intersections, whereas pedestrians’ failure to yield is a major contributing factor of auto-pedestrian collisions at mid-block locations (collisions on streets which are greater than 100 feet away from a cross street). Observations also show that a majority of auto-pedestrian collisions are outside the resort corridor and along high speed/high volume arterial streets.

Journal of Public Transportation, Vol. 11, No. 2, 2008
72
A majority of these high speed/high volume arterial streets (including both major and minor arterial streets) are part of the large and extensively used local transit system [Citizens Area Transit (CAT)].
CAT began serving the citizens of Clark County in December 1992. In just under 10 years, ridership grew from 15 million riders in 1993 to 55 million riders in 2005 (RTC 2007). Special bus service is available for qualified senior citizens and the disabled. At present, the CAT system consists of 51 routes served by 365 buses. Average daily passenger ridership during a weekday has risen to 180,000 during the last five years, a growth rate twice that of the national average. The significantly high percent of auto-pedestrian collisions due to pedestrians’ failure to yield at midblock locations and bus stops being far away from intersections indicate that transit system users contribute to a notable proportion of auto-pedestrian colli-sions at bus stops.
The auto-pedestrian collision data for 2000–2002 were obtained and geocoded using a commercial GIS software program. As stated above, one of the limitations of this data was the lack of information to identify auto-pedestrians that involved transit system users. Hence, all auto-pedestrian collisions were considered in this study. Figure 3 depicts 2000–2002 auto-pedestrian collisions in the Las Vegas metropolitan area. An auto-pedestrian collision concentration map was then cre-ated using the Kernel Density Method. Using a trail-and-error procedure, it was determined that a cell size of about 0.25-mile and radius in the range 100 to 500 feet is appropriate for generation of an auto-pedestrian collision concentration map. Figure 4 depicts an auto-pedestrian collision concentration map developed for the Las Vegas metropolitan area. The collision concentration area was divided into four risk-level areas: no-risk level (less than 1 auto-pedestrian collision per unit area), low-risk level (1–22 auto-pedestrian collisions per unit area), medium-risk level (22–44 auto-pedestrian collisions per unit area), and high-risk level (44–66 auto-pedestrian collisions per unit area).
To identify high-collision bus stops, the bus-stop coverage was overlaid on the auto-pedestrian collision concentration map. Figure 5 shows the overlaid bus-stop coverage on the collision concentration map.

Hazardous Bus Stops Identification
73
Figure 3. Spatial Distributions of Auto-Pedestrian Collisions in Las Vegas
Figure 4. Las Vegas Auto-Pedestrian Collision Concentration Map
Journal of Public Transportation, Vol. 11, No. 2, 2008
74
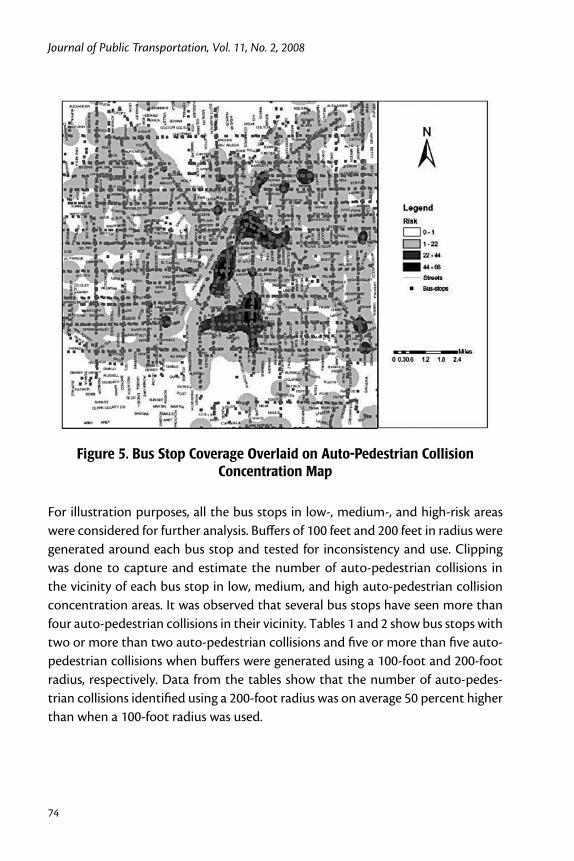
Figure 5. Bus Stop Coverage Overlaid on Auto-Pedestrian Collision Concentration Map
For illustration purposes, all the bus stops in low-, medium-, and high-risk areas were considered for further analysis. Buffers of 100 feet and 200 feet in radius were generated around each bus stop and tested for inconsistency and use. Clipping was done to capture and estimate the number of auto-pedestrian collisions in the vicinity of each bus stop in low, medium, and high auto-pedestrian collision concentration areas. It was observed that several bus stops have seen more than four auto-pedestrian collisions in their vicinity. Tables 1 and 2 show bus stops with two or more than two auto-pedestrian collisions and five or more than five auto-pedestrian collisions when buffers were generated using a 100-foot and 200-foot radius, respectively. Data from the tables show that the number of auto-pedes-trian collisions identified using a 200-foot radius was on average 50 percent higher than when a 100-foot radius was used.

Hazardous Bus Stops Identification
75
Table 1. High Auto-Pedestrian Collision Bus Stops when Buffer Radius = 100 Feet
Table 2. High Auto-Pedestrian Collision Bus Stops when Buffer Radius = 200 Feet

Journal of Public Transportation, Vol. 11, No. 2, 2008
76
High-collision bus stops identified were different (comparing the list of bus stops in Tables 1 and 2) when different radius were used to extract the number of col-lisions. Inconsistency in rankings was also observed. Differences in the results obtained indicate that the number of collisions estimated is sensitive to the con-sidered radius. Most farside and nearside bus stops are constructed such that they are 75 to 150 feet away from intersections. Considering a buffer radius greater than 100 feet may increase the likelihood of capturing auto-pedestrian collisions that (1) may not involve transit system users and their related activity, and (2) may fall in the vicinity of another bus stop at the same intersection. Based on the results obtained from the GIS analyses and that the influence area should be reasonably small, 100 feet is recommended for use in these types of studies.
Field visits show that all 19 high-collision bus stops identified using 100-foot buf-fers are either farside or nearside bus stops in the vicinity of signalized intersections with crosswalks. These intersections are reasonably well designed with appropriate sight distances and serve typical left-turn, through, and right-turn movements. The speed limit along the corridors with high-collision bus stops was either 35 mph or 45 mph. Actual traffic speeds at these bus stops varied from -5 to 5 percent of the speed limit. Sample field observations indicate that the purpose of more than 95 percent of pedestrian trips within 100 feet of these bus stops is transit sys-tem related. Collision rate–ADT for each bus stop was computed by dividing the number of auto-pedestrian collisions per year at each bus stop by the correspond-ing traffic volume (average daily traffic, ADT × 365 days) in million vehicles.
Pedestrian exposure or number of alighting and boarding passengers could be dif-ferent at bus stops. Considering this could play a vital role in the ranking process. Alighting and boarding passenger data were not available for the study area during the study period. However, RTC has conducted surveys during the study period to collect samples of transit ridership data at bus stops in the Las Vegas metropolitan area. The number of surveys conducted varied from one bus stop to another. Due to lack of better data, the survey data was utilized to measure pedestrian exposure at bus stops selected using collision frequency method. As the number of surveys conducted at bus stops was inconsistent, the percent of total transit passengers (alighting and boarding) was computed by dividing the average number of pas-sengers alighting and boarding a bus by the total average number of passengers alighting and boarding a bus at all selected bus stops and then multiplying it by

Hazardous Bus Stops Identification
77
100. Likewise, percent of auto-pedestrian collisions in the vicinity of a bus stop was computed by dividing the number of auto-pedestrian collisions at a bus stop by the total number of auto-pedestrian collisions at all selected bus stops and then multiplying it by 100.
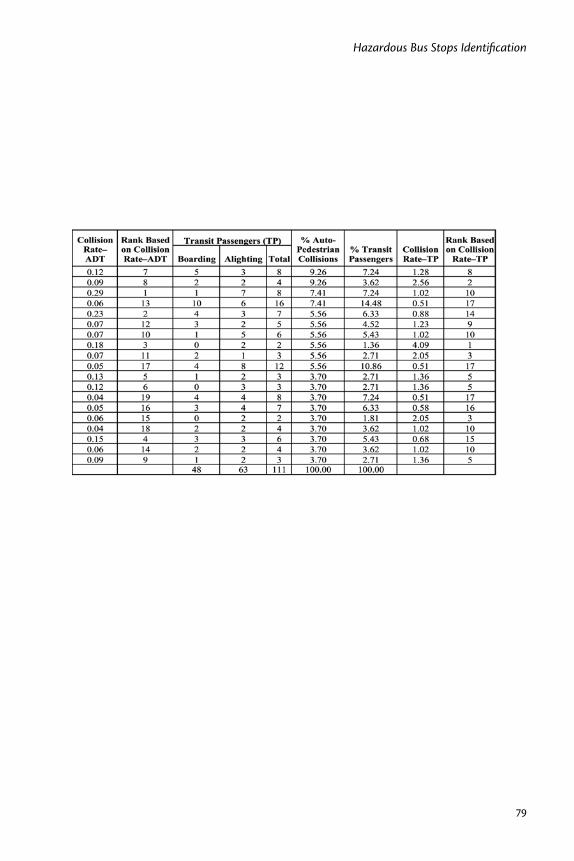
Collision rate–TP for each bus stop was then computed by dividing the percent of auto-pedestrian collisions by the percent of passengers alighting and boarding a bus. Table 3 shows route number, stop number, stop name, number of auto-pedestrian collisions in its vicinity, rank based on collision frequency, location of bus stop (farside or nearside), speed limit in miles per hour traffic volume (ADT), collision rate–ADT, rank based on collision rate–ADT, average number of alight-ing passengers, average number of boarding passengers, total number of transit passengers, percent of auto-pedestrian collisions, percent of transit passengers, collision rate–TP, and rank based on collision rate–TP. Several locations have the same rank when ranked using collision frequency method. However, ranks for bus stops were different when collision rate–ADT and collision rate–TP methods were used. As collision rate–TP method accounts for pedestrian exposure, this is recom-mended for use in ranking hazardous bus stops.

Journal of Public Transportation, Vol. 11, No. 2, 2008
78
Table 3. Computation and Comparison of Ranks Using Different Methods
*ADT is an average value obtained using 2000, 2001, and 2002 data except for locations with S. No. 2, 3, 6, and 18. For locations with S. No. 2, 6, and 18, ADT is an average value obtained using 2000 and 2001 data. For location with S. No. 3, ADT is an average value obtained using 2000, 2001, and 2002 data from the closest count station on the street with bus stop. Source: Nevada DOT Annual Traffic Reports.
Hazardous Bus Stops Identification
79
Journal of Public Transportation, Vol. 11, No. 2, 2008
80
Mitigation StrategiesMitigation strategies or countermeasures need to be identified to improve safety at bus stops and attract more transit riders. In general, bus stops should provide a safe and pleasant environment for passengers. Bus stops with greater than average daily boardings should have shelters, landscaping, and adequate lighting (Volinski and Tucker 2003; Meyer and Miller 2000). Bus-stop design should minimize con-flicts with motorized traffic as well as with other nonmotorized users such as bicy-clists in bike lanes or pedestrians walking past passengers waiting to board a bus.
Alighting passengers from the bus should be guided to cross the road from behind the bus rather than from in front of it. This would enable passengers to see the oncoming traffic. Pedestrians and commuters should also be guided not to walk near the bus or cross the road by walking near the bus. The likelihood that the bus driver would notice such pedestrians and commuters walking near the bus is low. This may lead to a fatal collision involving the transit bus and the pedestrian or commuter.
Some potential mitigation strategies to improve road safety and make a bus tran-sit system more attractive are listed below.
1. Provide signs on the road, along the road, and near the bus stop encouraging commuters to cross the road using the crosswalk at the nearest intersection (if a midblock crosswalk does not exist near the bus stop).
2. Provide an audio message (announcement) directing/encouraging alighting passengers to make use of the nearby crosswalk.
3. Provide crosswalks near the bus stop if there are no crosswalks 500 feet downstream or upstream of the location.
4. Wherever feasible, use farside bus stops rather than nearside bus stops as farside bus stops discourage passengers from crossing in front of the bus in comparison to nearside bus stops.
5. Build bus turnouts wherever feasible so that the alighting passenger has a clear vision of the approaching traffic when looking to cross the road. Reentering into the mainstream traffic is relatively difficult for bus drivers at bus turnouts. This will have an adverse impact on bus operations and schedule adherence. Such adverse impacts are low at farside bus turnouts in comparison to nearside bus turnouts.

Hazardous Bus Stops Identification
81
6. Provide education on the risk of crossing streets with or without inadequate facilities using television, flyers, and brochures. Information should include high-collision bus stops.
7. Conduct enforcement at identified high-collision bus stops and study/adver-tise its effectiveness.
8. Channel pedestrian movement to crosswalks wherever feasible.
9. If sidewalks do not exist along bus routes, construct sidewalks to the nearest intersection or section of existing sidewalk.
10. Construct overpasses near bus stops with high pedestrian activity. A ben-efit-cost study should be conducted to look at this option. The need for a large right-of-way and the likelihood of being underutilized as overpasses typically require out-of-direction travel by pedestrians should be considered in the benefit-cost study.
ConclusionsThis article presents a GIS-based methodology to identify bus stops in pedestrian high-collision concentration areas. The bus-stop coverage was overlaid on the developed collision concentration map to identify high-collision bus stops. Use of 100-foot and 200-foot buffer radius were studied to extract auto-pedestrian colli-sions in the vicinity of high-collision bus stops. High-collision bus stops were then ranked using collision frequency method. Inconsistency in rankings was observed when different radii were used to extract the number of collisions. Based on the sensitivity of results obtained and that the influence area should be as small as possible so as to not to capture collisions that are in the vicinity of other bus stops, a 100-foot buffer radius is recommended for use. Use of collision rate methods (based on traffic volumes and transit ridership) was also studied. Results obtained from collision rate methods were different when compared to collision frequency method or among themselves. Use of collision rate method based on transit pas-sengers is considered more suitable as it accounts for pedestrian exposure. Possible mitigation strategies are also discussed. Transit system managers can use the list of high-collision bus stops to study the causes of collisions in detail, understand the problems, and identify strategies to better plan and operate bus transit systems that have a significant impact on congestion and air quality in urban areas. Fur-ther, results from the study also assist in identifying target locations for education, outreach, and enforcement to enhance safety.

Journal of Public Transportation, Vol. 11, No. 2, 2008
82
Conditions within the study area are consistent with those to be found in many urban areas, and in communities with a wide, fast street system. Thus, the devel-oped GIS-based methodology can be adopted to identify high-collision bus stops in such areas. Sample field observations conducted indicate that more than 95 percent of pedestrian trips in the vicinity of selected bus stops are transit-system related. However, the assumption that all auto-pedestrian collisions in the vicinity of a bus stop involve transit system users may not be true all the time as some of the collisions may have occurred due to other reasons and may not be related to the activity at the bus stop of interest. This valuable piece of information should be collected, recorded, and provided to researchers and practitioners.
Driver and pedestrian behavior could have an impact on safety and the effective-ness of implemented mitigation strategies. Though difficult to quantify and evalu-ate, this warrants an investigation. Also, transit trips may begin and end with a bicycle trip. These are ignored in this study as they are relatively small in number. However, the methodology developed in this study can be applied to identify hazardous bus stops based on auto-bicycle collisions.
Acknowledgments
The authors thank Jacob Simmons of Regional Transportation Commission of Southern Nevada (RTC) for his help in providing the Las Vegas transit ridership survey data.
References
Hamby, B., and K. Thompson. 2006. New toolkit provides practical tools to build better bus stops. ITE Journal 76 (9): 22–26.
Meyer, M., and E. J. Miller. 2000. Urban transportation planning, 2nd ed. McGraw-Hill Publishers.
Moudon, A. W., and P. M. Hess. 2003. Pedestrian safety and transit corridors. Final Report (# WA-RD 556.1). Seattle, WA: Washington State Transportation Cen-ter (TRAC), University of Washington.
Pulugurtha, S. S., and S. S. Nambisan. 2002. Pedestrian safety engineering and intel-ligent transportation system-based countermeasures program for reducing
Hazardous Bus Stops Identification
83
pedestrian fatalities, injuries, conflicts, and other surrogate measures. Phase 1 Technical Report. Submitted to Federal Highway Administration and U.S. DOT, Transportation Research Center, University of Nevada, Las Vegas.
Pulugurtha, S. S., and S. S. Nambisan. 2003. A methodology to identify high pedes-trian crash locations: An illustration using the Las Vegas metro area. 82nd Annual Transportation Research Board Meeting, Pre-print CD-ROM.
RTC. 2007. Citizens Area Transit. Regional Transportation Commission of South-ern Nevada Website, http://www.rtcsouthernnevada.com/cat/. Last accessed April 20, 2007.
Vogel, M., and J. Pettinari. 2002. Personal safety and transit: Paths, environments, stops, and stations. Final Report. Minneapolis, MN: Center for Transportation Studies.
Volinski, J., and L. E. Tucker. 2003. Public transportation synthesis series: Safer stops for vulnerable customers. Final Report (# NCTR-473-13). , Tampa, FL: National Center for Transit Research, University of South Florida.
Weiner, R., and K. Singa. 2006. Toolkit for bus stop accessibility and safety. Bus and Paratransit Conference. Published by American Public Transportation Asso-ciation, CD-ROM.
About the Authors
Srinivas S. Pulugurtha ([email protected]) is an assistant professor of civil and environmental engineering and an assistant director of Center for Trans-portation Policy Studies at the University of North Carolina at Charlotte. His area of interests includes traffic safety, GIS applications, transportation planning/mod-eling, traffic simulation, and development of decision support tools. Prior to this position, he worked as an assistant research professor and assistant director of the Transportation Research Center at the University of Nevada, Las Vegas.
Vinay K. Vanapalli ([email protected]) is a transportation engineer for Stantec Consulting Inc. He has an M.S. in civil engineering from the University of Nevada, Las Vegas.