Hawkmoth flight in the unsteady wakes of flowerstwo interchangeable test sections with 60.96 cm...
13
RESEARCH ARTICLE Hawkmoth flight in the unsteady wakes of flowers Megan Matthews 1, * and Simon Sponberg 1,2 ABSTRACT Flying animals maneuver and hover through environments where wind gusts and flower wakes produce unsteady flow. Although both flight maneuvers and aerodynamic mechanisms have been studied independently, little is known about how these interact in an environment where flow is already unsteady. Moths forage from flowers by hovering in the flower’s wake. We investigated hawkmoths tracking a 3D-printed robotic flower in a wind tunnel. We visualized the flow in the wake and around the wings and compared tracking performance with previous experiments in a still-air flight chamber. As in still air, moths flying in the flower wake exhibit near-perfect tracking at the low frequencies at which natural flowers move. However, tracking in the flower wake results in a larger overshoot between 2 and 5 Hz. System identification of flower tracking reveals that moths also display reduced-order dynamics in wind compared with still air. Smoke visualization of the flower wake shows that the dominant vortex shedding corresponds to the same frequency band as the increased overshoot. Despite these large effects on tracking dynamics in wind, the leading edge vortex (LEV) remains bound to the wing throughout the wingstroke and does not burst. The LEV also maintains the same qualitative structure seen in steady air. Persistence of a stable LEV during decreased flower tracking demonstrates the interplay between hovering and maneuvering. KEY WORDS: Manduca sexta, Flight, Flower tracking, Leading edge vortex, Unsteady flow, System identification INTRODUCTION Flying animals rely on maneuverability to survive in unsteady environments, whether evading predators, finding mates or foraging for food (Dudley, 2002b; Sprayberry and Daniel, 2007; Broadhead et al., 2017). As these animals actively move through their environments, locomotion depends on interactions between their body and the surrounding fluid to produce necessary forces and torques. Changing fluid environments naturally manifest unsteady airflow. Animals must respond to perturbations due to wind gusts and wakes shed from flowers and other objects (Sane, 2003; Ravi et al., 2015). Successful flight control requires managing the impact of unsteady flow on body maneuvers and wing aerodynamic forces (Fig. 1). As biological systems are driven by sensing and feedback, changes to wing forces may also induce body motion and vice versa. How unsteady flow influences flight has been explored for hovering and forward flight (Ortega-Jimenez et al., 2013, 2014, 2016; Pournazeri et al., 2013; Combes and Dudley, 2009; Lentink et al., 2010; Ravi et al., 2016). However, we still do not know how an unsteady environment impacts the full dynamic range of maneuvers exhibited by flapping fliers. Nor do we know whether fundamental aerodynamic mechanisms present in hovering flight persist when an animal must maneuver in flow that is already unsteady. A system identification approach can reveal how flight maneuvers are changed in wind and whether this generalizes across environments (Cowan et al., 2014; Roth et al., 2014). Hawkmoths must maneuver in unsteady flow while hovering to feed in the wakes of flowers. They must quickly respond to environmental perturbations and changes in flower position (Farina et al., 1995; Sprayberry and Daniel, 2007; Sprayberry and Suver, 2011; Sponberg et al., 2015; Roth et al., 2016). Using precisely coordinated wing and body kinematics (Sponberg and Daniel, 2012), the agile hawkmoth Manduca sexta (Linnaeus 1763) has adapted robust mechanisms to shift the balance between stability and maneuverability depending on the desired behavior (Dudley, 2002a; Dyhr et al., 2013). Hawkmoths modulate their kinematics to track flower motion up to 14 Hz, well above what they encounter in nature, albeit with poor performance at high frequencies (Sponberg et al., 2015). Coordinated wing and body kinematics are also responsible for lift production through unsteady aerodynamic mechanisms (Weis-Fogh, 1973; Lighthill, 1973). One mechanism, the ubiquitous leading edge vortex (LEV), is thought to contribute to the high lift achieved in insect flight (Ellington et al., 1996; Sane, 2003; Dickinson et al., 1999; Chin and Lentink, 2016). The LEV has been visualized both qualitatively and quantitatively, revealing the basic vortex structure, its dynamics throughout a wingstroke and vortex stabilization for many insect species (e.g. Srygley and Thomas, 2002; Bomphrey et al., 2005, 2009). However, the LEV on the animal has only been visualized in steady flow (Willmott et al., 1997; Willmott and Ellington, 1997a,b,c). Moths may need to alter wing motion to maintain lift generation in unsteady flow, which could disrupt the quasi-steady LEV. LEV disruption is visualized as vortex bursting, which can occur when increased momentum deflects flow through the vortex core. The deflected flow alters the LEV structure and attachment to the wing (Birch and Dickinson, 2001). At the Reynolds numbers for hawkmoth flight, Re≈10 3 , LEVs on dynamically scaled flappers burst at high angles of attack (Lentink and Dickinson, 2009). However, LEV bursting has not been observed on freely flying or tethered hawkmoths in steady flow (Bomphrey et al., 2005; Johansson et al., 2013; Liu et al., 2018). Although we understand how the LEV generates lift, it is not known how vortex structure and stability are affected by flow in an environment that is already unsteady. For the hawkmoth, one way unsteady flow is generated in the environment is when natural winds encounter flowers. As wind moves around the flower shape, vortices are shed into the wake. Foraging moths feeding from these flowers must interact with these vortices. Feeding in a flower wake introduces two challenges: (1) steady freestream wind and (2) unsteady vortex shedding. In nature, these effects are inseparable and both could have Received 13 February 2018; Accepted 26 September 2018 1 School of Physics, Georgia Institute of Technology, Atlanta, GA 30332, USA. 2 School of Biological Sciences, Georgia Institute of Technology, Atlanta, GA 30332, USA. *Author for correspondence ([email protected]) M.M., 0000-0002-5209-2870 1 © 2018. Published by The Company of Biologists Ltd | Journal of Experimental Biology (2018) 221, jeb179259. doi:10.1242/jeb.179259 Journal of Experimental Biology
Transcript of Hawkmoth flight in the unsteady wakes of flowerstwo interchangeable test sections with 60.96 cm...
RESEARCH ARTICLE
Hawkmoth flight in the unsteady wakes of flowersMegan Matthews1,* and Simon Sponberg1,2
ABSTRACTFlying animals maneuver and hover through environments wherewind gusts and flower wakes produce unsteady flow. Although bothflight maneuvers and aerodynamic mechanisms have been studiedindependently, little is known about how these interact in anenvironment where flow is already unsteady. Moths forage fromflowers by hovering in the flower’s wake. We investigated hawkmothstracking a 3D-printed robotic flower in awind tunnel.We visualized theflow in the wake and around the wings and compared trackingperformancewith previous experiments in a still-air flight chamber. Asin still air, moths flying in the flower wake exhibit near-perfect trackingat the low frequencies at which natural flowers move. However,tracking in the flower wake results in a larger overshoot between 2 and5 Hz. System identification of flower tracking reveals that moths alsodisplay reduced-order dynamics in wind compared with still air.Smoke visualization of the flower wake shows that the dominantvortex shedding corresponds to the same frequency band as theincreased overshoot. Despite these large effects on trackingdynamics in wind, the leading edge vortex (LEV) remains bound tothe wing throughout the wingstroke and does not burst. The LEV alsomaintains the same qualitative structure seen in steady air.Persistence of a stable LEV during decreased flower trackingdemonstrates the interplay between hovering and maneuvering.
KEY WORDS: Manduca sexta, Flight, Flower tracking, Leading edgevortex, Unsteady flow, System identification
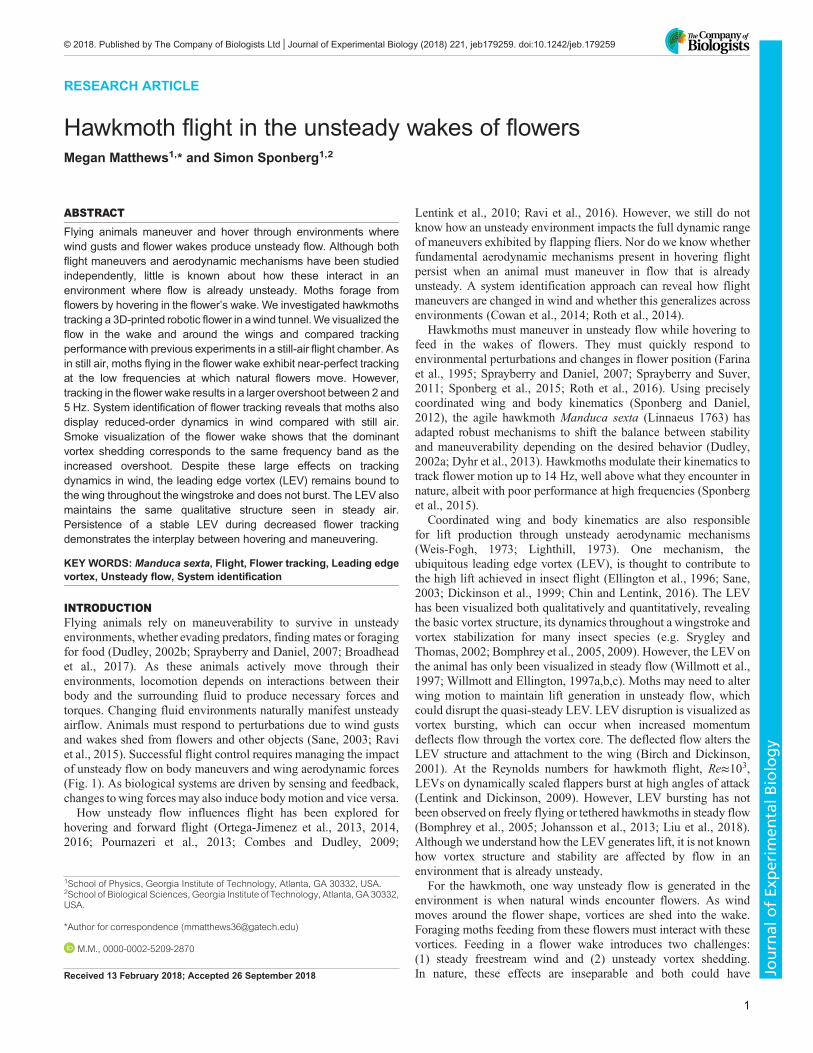
INTRODUCTIONFlying animals rely on maneuverability to survive in unsteadyenvironments, whether evading predators, finding mates or foragingfor food (Dudley, 2002b; Sprayberry and Daniel, 2007; Broadheadet al., 2017). As these animals actively move through theirenvironments, locomotion depends on interactions between theirbody and the surrounding fluid to produce necessary forces andtorques. Changing fluid environments naturally manifest unsteadyairflow. Animals must respond to perturbations due to wind gustsand wakes shed from flowers and other objects (Sane, 2003; Raviet al., 2015). Successful flight control requires managing the impactof unsteady flow on body maneuvers and wing aerodynamic forces(Fig. 1). As biological systems are driven by sensing and feedback,changes to wing forces may also induce body motion and vice versa.How unsteady flow influences flight has been explored for
hovering and forward flight (Ortega-Jimenez et al., 2013, 2014,2016; Pournazeri et al., 2013; Combes and Dudley, 2009;
Lentink et al., 2010; Ravi et al., 2016). However, we still do notknow how an unsteady environment impacts the full dynamic rangeof maneuvers exhibited by flapping fliers. Nor do we know whetherfundamental aerodynamic mechanisms present in hovering flightpersist when an animal must maneuver in flow that is alreadyunsteady. A system identification approach can reveal how flightmaneuvers are changed in wind and whether this generalizes acrossenvironments (Cowan et al., 2014; Roth et al., 2014).
Hawkmoths must maneuver in unsteady flow while hovering tofeed in the wakes of flowers. They must quickly respond toenvironmental perturbations and changes in flower position (Farinaet al., 1995; Sprayberry and Daniel, 2007; Sprayberry and Suver,2011; Sponberg et al., 2015; Roth et al., 2016). Using preciselycoordinated wing and body kinematics (Sponberg and Daniel,2012), the agile hawkmoth Manduca sexta (Linnaeus 1763) hasadapted robust mechanisms to shift the balance between stabilityand maneuverability depending on the desired behavior (Dudley,2002a; Dyhr et al., 2013). Hawkmoths modulate their kinematics totrack flower motion up to 14 Hz, well above what they encounter innature, albeit with poor performance at high frequencies (Sponberget al., 2015).
Coordinated wing and body kinematics are also responsiblefor lift production through unsteady aerodynamic mechanisms(Weis-Fogh, 1973; Lighthill, 1973). One mechanism, theubiquitous leading edge vortex (LEV), is thought to contribute tothe high lift achieved in insect flight (Ellington et al., 1996; Sane,2003; Dickinson et al., 1999; Chin and Lentink, 2016). The LEVhas been visualized both qualitatively and quantitatively, revealingthe basic vortex structure, its dynamics throughout a wingstroke andvortex stabilization for many insect species (e.g. Srygley andThomas, 2002; Bomphrey et al., 2005, 2009). However, the LEV onthe animal has only been visualized in steady flow (Willmott et al.,1997; Willmott and Ellington, 1997a,b,c). Moths may need to alterwing motion to maintain lift generation in unsteady flow, whichcould disrupt the quasi-steady LEV. LEV disruption is visualized asvortex bursting, which can occur when increased momentumdeflects flow through the vortex core. The deflected flow alters theLEV structure and attachment to the wing (Birch and Dickinson,2001). At the Reynolds numbers for hawkmoth flight, Re≈103,LEVs on dynamically scaled flappers burst at high angles of attack(Lentink and Dickinson, 2009). However, LEV bursting has notbeen observed on freely flying or tethered hawkmoths in steady flow(Bomphrey et al., 2005; Johansson et al., 2013; Liu et al., 2018).Although we understand how the LEV generates lift, it is not knownhow vortex structure and stability are affected by flow in anenvironment that is already unsteady.
For the hawkmoth, one way unsteady flow is generated in theenvironment is when natural winds encounter flowers. As windmoves around the flower shape, vortices are shed into the wake.Foraging moths feeding from these flowers must interact with thesevortices. Feeding in a flower wake introduces two challenges:(1) steady freestream wind and (2) unsteady vortex shedding.In nature, these effects are inseparable and both could haveReceived 13 February 2018; Accepted 26 September 2018
1School of Physics, Georgia Institute of Technology, Atlanta, GA 30332, USA.2School of Biological Sciences, Georgia Institute of Technology, Atlanta, GA 30332,USA.
*Author for correspondence ([email protected])
M.M., 0000-0002-5209-2870
1
© 2018. Published by The Company of Biologists Ltd | Journal of Experimental Biology (2018) 221, jeb179259. doi:10.1242/jeb.179259
Journal
ofEx
perim
entalB
iology
consequences for moth tracking behaviors. The unsteady wake canpotentially disrupt tracking maneuvers and the structure of the LEV.LEV bursting and changes to lift production could result in changesto body maneuvers and vice versa (Fig. 1). How do flower wakeinteractions lead to changes in tracking maneuvers? And how doesthe LEV interact with unsteady flow already in the environment?In order to address these two questions, we must investigate theinterplay between maneuvering, aerodynamics (specifically theLEV) and unsteady flow. To do this we have moths track roboticflowers in a wind tunnel, where we can control the flowenvironment. In wind, we also visualized the unsteady wakearound the robotic flower, natural flowers and the moth to revealimpacts on LEV structure.If flower tracking performance decreases in wind, then moths
must balance reactions to unsteady flow (i.e. the flower wake) withforaging maneuvers. In this case, we predicted that moths wouldreact to unsteady flow by matching the dominant vortex sheddingfrequencies in the flower wake. Consequently, foraging maneuversused to track the flower would suffer the most at these frequencies.
If the LEV is disrupted in the flower wake, then we would expectto observe LEV growth and bursting around mid-wing duringmid-stroke. If no vortex bursting is observed, then we can determinewhether LEV structure is altered in the flower wake by visualizingflow over the thorax. The presence of a vortex over the thoraxsuggests that the LEV is continuous across the full wingspan, ratherthan conical and rooted on the wings (Bomphrey et al., 2005).
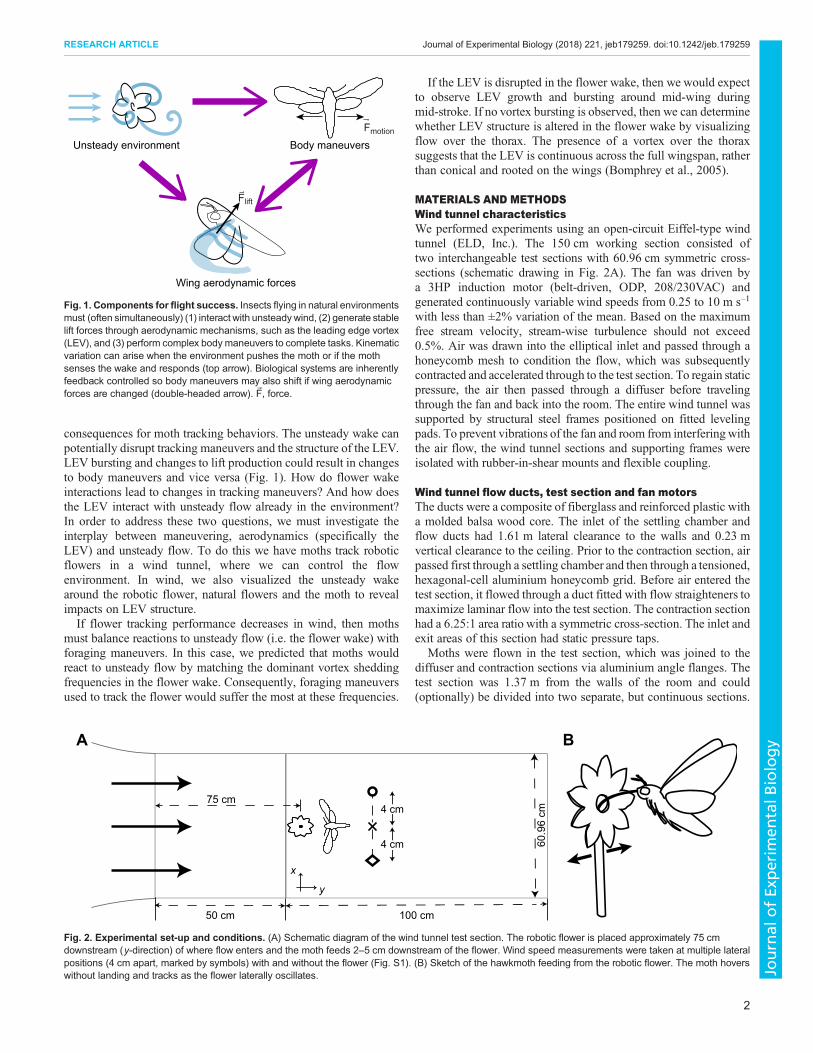
MATERIALS AND METHODSWind tunnel characteristicsWe performed experiments using an open-circuit Eiffel-type windtunnel (ELD, Inc.). The 150 cm working section consisted oftwo interchangeable test sections with 60.96 cm symmetric cross-sections (schematic drawing in Fig. 2A). The fan was driven bya 3HP induction motor (belt-driven, ODP, 208/230VAC) andgenerated continuously variable wind speeds from 0.25 to 10 m s–1
with less than ±2% variation of the mean. Based on the maximumfree stream velocity, stream-wise turbulence should not exceed0.5%. Air was drawn into the elliptical inlet and passed through ahoneycomb mesh to condition the flow, which was subsequentlycontracted and accelerated through to the test section. To regain staticpressure, the air then passed through a diffuser before travelingthrough the fan and back into the room. The entire wind tunnel wassupported by structural steel frames positioned on fitted levelingpads. To prevent vibrations of the fan and room from interferingwiththe air flow, the wind tunnel sections and supporting frames wereisolated with rubber-in-shear mounts and flexible coupling.
Wind tunnel flow ducts, test section and fan motorsThe ducts were a composite of fiberglass and reinforced plastic witha molded balsa wood core. The inlet of the settling chamber andflow ducts had 1.61 m lateral clearance to the walls and 0.23 mvertical clearance to the ceiling. Prior to the contraction section, airpassed first through a settling chamber and then through a tensioned,hexagonal-cell aluminium honeycomb grid. Before air entered thetest section, it flowed through a duct fitted with flow straighteners tomaximize laminar flow into the test section. The contraction sectionhad a 6.25:1 area ratio with a symmetric cross-section. The inlet andexit areas of this section had static pressure taps.
Moths were flown in the test section, which was joined to thediffuser and contraction sections via aluminium angle flanges. Thetest section was 1.37 m from the walls of the room and could(optionally) be divided into two separate, but continuous sections.
Flift
Fmotion
Wing aerodynamic forces
Unsteady environment Body maneuvers
Fig. 1. Components for flight success. Insects flying in natural environmentsmust (often simultaneously) (1) interact with unsteadywind, (2) generate stablelift forces through aerodynamic mechanisms, such as the leading edge vortex(LEV), and (3) perform complex body maneuvers to complete tasks. Kinematicvariation can arise when the environment pushes the moth or if the mothsenses the wake and responds (top arrow). Biological systems are inherentlyfeedback controlled so body maneuvers may also shift if wing aerodynamicforces are changed (double-headed arrow). ~F, force.
50 cm 100 cm
75 cm
x
y
60.9
6 cm4 cm
4 cm
A B
Fig. 2. Experimental set-up and conditions. (A) Schematic diagram of the wind tunnel test section. The robotic flower is placed approximately 75 cmdownstream (y-direction) of where flow enters and the moth feeds 2–5 cm downstream of the flower. Wind speed measurements were taken at multiple lateralpositions (4 cm apart, marked by symbols) with and without the flower (Fig. S1). (B) Sketch of the hawkmoth feeding from the robotic flower. The moth hoverswithout landing and tracks as the flower laterally oscillates.
2
RESEARCH ARTICLE Journal of Experimental Biology (2018) 221, jeb179259. doi:10.1242/jeb.179259
Journal
ofEx
perim
entalB
iology

The primary section (100 cm) was double the length of thesecondary test section (50 cm). Test sections were accessible by wayof portholes in the panels. The floor, ceiling and sidewalls of theprimary section were made of 13 mm thick soda lime glass.Sidewalls were secured with toggle clamps and could be removedand replaced with custom panels depending on experimental needs.On the operator side of the test section, the sidewall panel had apneumatic opening door for easy access to the test section. Theceiling, floor and sidewalls of the secondary section were made of19.1 mm thick, clear, GM grade acrylic. There were 34M stainlesssteel, high porosity (60%), tensioned catch screens in place on eitherside of the test section to prevent the moths from flying into othercomponents of the wind tunnel.Air flowed out from the test section into the diffuser, which
expanded with a total angle of 4.6 deg and was separated from thefan by an air gap. This air gap (13.9 cm in width and 2.43 m circularcross-section diameter) acted as a vibration isolator. The diffusercontained a highly porous perforated plate to decelerate the flowbefore it exited into the room, protecting the fan.The fan was 2.13 m from the door and was controlled by a
transistor inverter variable frequency speed controller (60 Hz/30 A).The fan was equipped with a fusible disconnect to protect the motorand controller. A remote control operator station was locateddownstream of the test section, near the upstream end of the diffuser.
Flow characteristicsWe placed a 3D-printed robotic flower (‘roboflower’; see below;Sponberg et al., 2015) at the front of the secondary test section, 75–80 cm downstream from the upstream mesh and at the approximatelateral midpoint (Fig. 2A, cross). The flower was actuated by abipolar stepper motor (57STH56 NEMA23 with 1067 controller;Phidgets, Inc.) using a 14.5 cm moment arm and the center of theflower face was 20 cm above the bottom panel of the test section.Wind speed measurements were made at multiple points along
the centerline of theworking section using an air velocity transducer(TSI Alnor) both with and without the robotic flower present.Measurements were taken at seven downstream points and threelateral positions (Fig. 2A; Fig. S1B). The 0.7 m s–1 freestreamvelocity was chosen to replicatewhat hawkmoths experience in theirnatural habitat. Anemometer recordings of average wind speedsaround six different species of hawkmoth-pollinated flowers allincluded 0.7 m s–1 (Sponberg et al., 2015).
Experimental set-up and procedureAnimalsThe hawkmoths used were shipped as pupae from a colonymaintained at the University of Washington on a diet containingretinoic acid (Sponberg et al., 2015). Prior to experiments, the mothswere kept on a 12 h:12 h day:night cycle with foraging/feedingtime (‘dusk’) set around noon EST. Tracking experiments wereperformed with 5 male and 5 female moths (mass m=1.87±0.54 g,mean±s.d.) and still-flower experiments with 5 male and 5 femalemoths (m=1.70±0.32 g, mean±s.d.); each moth was only used for asingle trial, 2–5 days post-eclosion, and was not exposed to theartificial flower prior to the experiments. For all trials, naivemoths were dark adapted to the experiment room for a minimumof 30 min. Temperature during experiments was maintainedbetween 24 and 26°C. A seven-component flower scent(mimicking Datura wrightii) was applied to the robotic flower toencourage foraging behavior (Riffell et al., 2014).Prior to experiments, moths were marked with a dot of white
paint (1:1 ratio of tempera and acrylic paint) on the ventral side of
the thorax for tracking. Only the thorax point was used as headtracking is not significantly different (Stöckl et al., 2017). Once themoth was feeding (Fig. 2B), we recorded the positions of boththe moth and flower throughout the 20 s tracking run. Moths wereremoved from the flight chamber if feeding was not initiatedwithin 5 min.
RoboflowerThe robotic flower consisted of a 3D-printed flower face (5 cmtip-to-tip diameter) and 2 ml glass nectary attached to the steppermotor. Flower motion was prescribed as the sum of 20 sinusoids(SoS), each with a different driving frequency and randomizedphase, and controlled through MATLAB. The stimulus wasdesigned to broadly sample the frequency range and minimizepotential learning effects (Roth et al., 2011). A dot of white acrylicpaint was applied to the nectary to allow for tracking of the flowermotion. The digitized time series verified that the robotic flowerreproduced the designed trajectory (green line, Fig. 3A,B). To limitpotential harmonic overlap, the prescribed driving frequencies werelogarithmically spaced prime multiples (0.2–19.9 Hz) (Roth et al.,2011, 2014; Dyhr et al., 2013). To prevent the moths from reachingthe saturation limit of their muscle output at the higher frequencies,the velocity amplitude of the flower motion was scaled to beconstant at all frequencies (Roth et al., 2014).
Video recordingsWe recorded all flights from below (ventral view) using a PhotronUX100 with a 50 mm lens operating at 125 frames s−1. Moths wereilluminated with two 850 nm IR lights (Larson Electronics) as wellas a ‘moon light’ (Neewer CW-126) used to make the flower facevisible and set background luminance (Sponberg et al., 2015). Colortemperature, based on a blackbody radiation spectrum, was 5400 K.The moon light was equipped with neutral density filters to reducethe measured illuminance to approximately 0.3±0.1 lx (measured infront and to each side of the flower face) for all trials, which is thepreferred foraging light level for M. sexta (Theobald et al., 2009).
For smoke-wire visualization, an additional Photron UX100(50 mm lens, 125 frames s−1) was used to record the side view ofthe animal. The ventral view was used to confirm the horizontalposition of the smoke plane relative to either the wingspan or theflower. Additionally, the moon light was increased approximately0.1 lx to enhance smoke visibility in the ventral camera.
Smoke-wire visualizationSmoke visualization (Merzkirch, 1987) was performed with a nickelchromium (nichrome) wire aligned with the center of the flower faceand approximately 10–20 cm upstream. The 0.25 mm wire wasdouble-coiled and coated with Protosmoke train smoke oil (MTHTrains). When a current is run through the wire, it causes the oil tocondense into droplets along the length of the wire, which are thenvaporized into smoke trails as the wire is heated.
Data analysisFrequency response and tracking performanceAfter digitizing the flower and moth motions using DLT trackingsoftware (Hedrick, 2008), the individual time series (Fig. S5) weredetrended and then Fourier transformed to be analyzed in thefrequency domain (in MATLAB). Flower tracking has beenpreviously shown to be a linear response (Sponberg et al., 2015;Roth et al., 2016). Using an SoS probes a wide dynamic range ofbehavior, but linearity allows us to generalize to other stimuli. Wecan characterize the broad frequency response of the system by the
3
RESEARCH ARTICLE Journal of Experimental Biology (2018) 221, jeb179259. doi:10.1242/jeb.179259
Journal
ofEx
perim
entalB
iology
gain and phase (G, φ) at each unique driving frequency (Fig. 3D,E,insets). First, we Fourier transformed the individual time series datafor each trial:
xflowerðtÞ ! XflowerðivÞ ¼ð1�1
xflowerðtÞe�ivtdt ¼ AflowerðivÞeiðvtþfÞ;
xmothðtÞ ! XmothðivÞ ¼ð1�1
xmothðtÞe�ivtdt ¼ AmothðivÞeiðvtþfÞ;
ð1Þ
where x is position, X is Fourier-transformed position, i is animaginary number [i=sqrt(−1)], ω is frequency, t is time and A ismotion amplitude.
We then used the complex ratio of the Fourier-transformed mothand flower motion to define gain (G) as the absolute value of thecomplex ratio:
GðivÞ ¼ XmothðivÞXflowerðivÞ����
���� ð2Þ
and phase (φ) as the angle between the real and imaginary parts ofthe complex response ratio:
fðivÞ ¼ tan�1Imaginary
XmothðivÞXflowerðivÞ
� �
RealXmothðivÞXflowerðivÞ
� �2664
3775: ð3Þ
0 5 10 15 20Time (s)
–4
–2
0
2
4
6P
ositi
on (c
m)
0.1 1 100
0.2
0.4
0.6
0.8
Dis
plac
emen
t (cm
)
0
0.2
0.4
0.6
0.8
1
Coh
eren
ce
0.1 1 10Frequency (Hz)
0
1
2
3
Velo
city
(cm
s–1
)
1 100
0.5
1
1.5
2
2.5
Gai
n1 10
–400
–300
–200
–100
0
Pha
se (d
eg)
1 10Frequency (Hz)
0
1
2
3
Trac
king
err
or
0.2
0.2
0.2
A
B
C
D
E
F
Flower motion
Moth motion
Tracking in wind
Still-air trackingUndershoot
Overshoot
Phaselead
Phaselag
Error (ε)
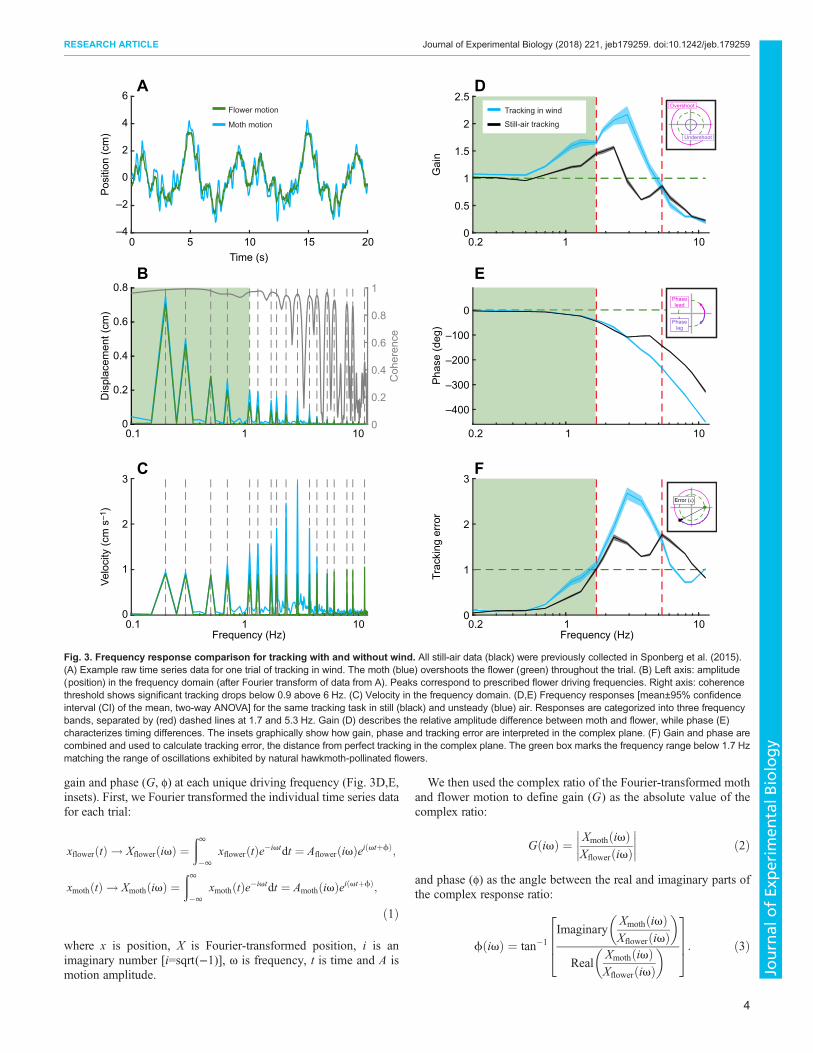
Fig. 3. Frequency response comparison for tracking with and without wind. All still-air data (black) were previously collected in Sponberg et al. (2015).(A) Example raw time series data for one trial of tracking in wind. The moth (blue) overshoots the flower (green) throughout the trial. (B) Left axis: amplitude(position) in the frequency domain (after Fourier transform of data from A). Peaks correspond to prescribed flower driving frequencies. Right axis: coherencethreshold shows significant tracking drops below 0.9 above 6 Hz. (C) Velocity in the frequency domain. (D,E) Frequency responses [mean±95% confidenceinterval (CI) of the mean, two-way ANOVA] for the same tracking task in still (black) and unsteady (blue) air. Responses are categorized into three frequencybands, separated by (red) dashed lines at 1.7 and 5.3 Hz. Gain (D) describes the relative amplitude difference between moth and flower, while phase (E)characterizes timing differences. The insets graphically show how gain, phase and tracking error are interpreted in the complex plane. (F) Gain and phase arecombined and used to calculate tracking error, the distance from perfect tracking in the complex plane. The green box marks the frequency range below 1.7 Hzmatching the range of oscillations exhibited by natural hawkmoth-pollinated flowers.
4
RESEARCH ARTICLE Journal of Experimental Biology (2018) 221, jeb179259. doi:10.1242/jeb.179259
Journal
ofEx
perim
entalB
iology

Respectively, these quantities represent the relative positionand timing differences between flower and moth. This frequencyresponse can be represented in the (polar) complex plane by orderedpairs (G, φ) where gain corresponds to the radial distance and phaseto the angle measured counterclockwise from the horizontal. In thisrepresentation, perfect flower tracking occurs at (1,0). To explorehow tracking performance (measured here using gain and phase)varies with frequency, we plotted gain and phase separately, butboth are necessary to describe the behavior of the system across allfrequency bands.
Tracking errorInstead of separating the real and imaginary components of thefrequency response, we can also use the distance from perfecttracking, (1,0), in the complex plane (Fig. 3F, inset) to assesstracking performance:
1 ¼ kð1þ 0iÞ � ðG þ fiÞk: ð4ÞAs tracking improves, tracking error approaches zero. Tracking errorabove 1 indicates that the moth would achieve better performanceby remaining stationary at that frequency (Roth et al., 2011;Sponberg et al., 2015).
Mechanical (and inertial) powerTo assess how body maneuvers specific to flower tracking changebecause of wind, we restricted our analysis to inertial center ofmass (COM) mechanical power. Following previous methods(Sprayberry and Daniel, 2007), we calculated the inertial powerrequired to laterally accelerate the COM during flower tracking. Themoth’s response to the summed sinusoid motion of the roboticflower can be written as:
xðtÞ ¼X20k¼1
Ak sinð2pfk t þ fkÞx; ð5Þ
where the indices k correspond to the 20 driving frequencies. Lateraloscillations dominate during flower tracking, so we neglectedcontributions from vertical and looming motion (Fig. S5). Previousexperiments with horizontal flower motion also showed thatdownstream distance from the flower (looming axis) and hoveringposition (vertical axis) remained fairly constant during tracking,which supports our assumptions (Sprayberry and Daniel, 2007).Inertial power (changes in kinetic energy) for the 1D lateralcomponent of tracking motion is given by:
_E ¼ maðtÞvðtÞ; ð6Þwhere:
vðtÞ ¼ 2pXk
ð fkAkÞ cosð2pfk t þ fkÞ;
aðtÞ ¼ �ð2pÞ2Xk
ð f 2k AkÞ sinð2pfk t þ fkÞð7Þ
are the lateral components of velocity and acceleration. Then, theinertial power needed for lateral tracking becomes:
_E ¼ �mð2pÞ3Xk
f 3k A2k sinð2pfk t þ fkÞ cosð2pfk t þ fkÞ: ð8Þ
Flower motion is periodic, so the time-averaged tracking power iseither positive or negative during each half-period. As power cyclestwice as fast as the underlying driving frequency, we averaged over a
quarter period of flower motion:
_E ¼ ð4fkÞ½mð2pÞ3f 3k A2k �
�ð1=4fk0
� sinð2pfk t þ fkÞ cosð2pfk t þ fkÞdt�����
�����; ð9Þ
_E ¼ 8mp2Xk
f 3k A2k : ð10Þ
As an upper bound, we calculated inertial power assuming that allchanges in kinetic energy must be actively generated. Positive andnegative work then contributed equally and we took the absolutevalue to get an upper bound for tracking power (Sprayberry andDaniel, 2007). If only positive work must be generated by theanimal and energy is dissipated by the environment (e.g.aerodynamic damping; Hedrick et al., 2009), then the inertialpower is exactly half the value in Eqn 10, which gives a lower boundfor inertial power requirements:
_Epositive ¼ 4mp2Xk
f 3k A2k : ð11Þ
By comparing the inertial COM power for tracking in wind and stillair, we can uncover how flower wake interactions affect bodymaneuvers. Interacting with the unsteady flower wake could altertotal mechanical power requirements compared with tracking in stillair. Total mechanical power in insect flight combines contributionsfrom multiple sources including profile and induced power, whichrefer to drag effects on the wings, and parasite and inertial power,corresponding to body drag and acceleration effects (Dudley,2002a). While inertial power involves costs for accelerating thewing mass (and added mass), it also includes costs due toaccelerations of the body (COM) required for flight maneuvers,such as tracking. Body inertial power can be thought of as the addedcost to maneuver, assuming all other metabolic costs remainconstant during maneuvering (e.g. wing inertial power,aerodynamic power and muscle efficiency; Sprayberry andDaniel, 2007).
StatisticsStatistically significant tracking was assessed at each drivingfrequency using a coherence threshold (Roth et al., 2011, 2014)and Fisher’s exact g-test for periodicity (±0.5 Hz frequencybands around each driving frequency were tested with aconfidence threshold of 0.05; Fisher, 1929; Sponberg et al.,2015). Additionally, all averaging and variance estimations wereperformed in the complex plane (Roth et al., 2011). These valueswere comparable to results for averaging log gain and using circularstatistics to average phase (Roth et al., 2016). Error bars are 95%confidence intervals (CI) of the mean unless otherwise noted.
Gain, phase and tracking error were all tested for significanceusing two-factor ANOVA (with wind and frequency as our factors).This test was also used to determine significant differences ininertial power within specific frequency bands.
RESULTSTracking performance decreases in an unsteadyflower wakeIn unsteady air, all moths successfully tracked for the full 20 s withsignificant tracking up to at least 6.1 Hz with 0.90 coherence (Rothet al., 2011; Sponberg et al., 2015) (Fig. 3B, gray line). Most moths(70%) were able to significantly track up to 11.3 Hz, but few moths(30% or less) were able to track any higher frequencies. This is
5
RESEARCH ARTICLE Journal of Experimental Biology (2018) 221, jeb179259. doi:10.1242/jeb.179259
Journal
ofEx
perim
entalB
iology

lower than in still air, where half of the moths significantly trackedflower motion up to 13.7 Hz.Comparisons between the frequency responses for tracking in
wind and still air are best interpreted by examining specificfrequency bands: (i) 0.2–1.7 Hz, (ii) 1.7–5.3 Hz and (iii)5.3–11.3 Hz. The first band corresponds to the range at whichnatural hawkmoth-pollinated flowers oscillate (Sponberg et al.,2015; Stöckl et al., 2017), the second captures the range with thelargest overshoot in position (Fig. 3B) and the third describes howthe moths modulate tracking as they fail.
Low-frequency response: moths track best at natural floweroscillation frequenciesThe effect of wind on moth dynamics was very small at the lowestfrequencies. In wind, moths tracked nearly perfectly (G=1; φ=0)across low frequencies up to 0.7 Hz, revealing only minordifferences with tracking in still air (gain and phase difference at0.7 Hz: 0.15 and 2.8 deg, Fig. 3D,E). Across all low frequencies(0.2–1.7 Hz), the moth’s gain was higher in windy conditions thanin still air, increasing by 14% at 1.7 Hz (gain for 0.2–1.7 Hz:F=30.25, d.f.=1, P<0.05). However, there were no distinguishabledifferences in the phase response (0.2–1.7 Hz: F=0.6, d.f.=1,P=0.4393).Higher gain does not necessarily indicate improved tracking
performance. Because the moth was overshooting the flower inwindy conditions, the tracking error was larger than that in still air(0.7–1.7 Hz, F=11.14, d.f.=1, P=0.0012, Fig. 3F, blue line).
Intermediate frequency response: interaction with wind decreasestracking performanceAs in still air, moths tracking in wind had a distinct region ofovershoot (G>1) in the intermediate frequency range (Fig. 3D).However, overshoot was both more pronounced and persistedover a greater range of frequencies in wind (peak G=2.17±0.16,φ=109.9±5.9 deg at 2.9 Hz). Overall, tracking in wind between 1.7and 5.3 Hz resulted in a nearly 40% higher peak overshoot (gain:F=79.52, d.f.=1, P<0.05). Tracking in wind also removed theplateau in the phase response, producing a monotonic roll off notseen in still air (phase: F=5.57, d.f.=1, P=0.0201).Tracking error throughout this frequency band was large as a
result of a combination of gains above 1 and phase lags greater than90 deg. Maximum tracking error in windy conditions was higherthan in still air, with a 70% increase at 2.9 Hz. Tracking error inwind steadily increased until the maximum of 2.68±0.14 at 2.9 Hz(Fig. 3E, blue line) and then decreased until it fell just below themaximum of still-air tracking error (1.65±0.11 at 5.3 Hz), resultingin a statistically significant difference with and without wind(F=58.62, d.f.=1, P<0.05). In both cases, but especially with wind,the moth would track these intermediate frequencies better if itstayed stationary (G=0; φ=0; ε=1).
High-frequency response: moths show similar failure dynamics whiletracking with and without windDespite the large overshoot in wind at the mid-range frequencies,moths tracking with and without wind failed similarly as flowermotion frequency increased towards the saturation limit of themoths’ flight system.Although few moths were able to successfully track above
11.3 Hz in wind, the decrease in gain leading up to this frequencywas similar to the response in still air, with no significant difference(F=3.19, d.f.=1,P=0.0773). The approximately 90 deg difference inphase lag between wind and still air grew until it exceeded a 100 deg
difference at 11.3 Hz (Fig. 3D,E). Above this frequency, the mothlagged the flower by a full cycle. The continuous phase roll off athigh frequency is likely due to an inescapable delay inherent in allreal biological systems. As tracking error is a distance in thecomplex plane and phases of 0 and ±360 deg are equivalent, theincreased phase lag for tracking in wind reduces tracking errorback toward a value of 1. This results in a maximum differenceof 0.63±0.03 between tracking in wind and in still air (F=36.31,d.f.=1, P<0.05).
These differences for tracking with and without wind lead to thedifferences in tracking error (Fig. 3F). In wind and still air, mothsfailed by undershooting and lagging behind the flower at higherfrequencies until, at the highest frequencies, they were effectivelynon-responsive (G=0; φ=0). As tracking gain approaches zero, thetracking error necessarily approaches 1.
Flower tracking in wind manifests simpler dynamicsThe change in the transfer function (frequency response, Fig. 3D,E;Fig. S2) suggests that windy conditions simplify trackingmaneuvers. Tracking in wind can be described by a reduced-orderdynamical system, compared with still air. While the low-frequencybehavior is maintained, the response at high frequencies isdiminished. The transfer function describing still-air trackingincludes a simple delay term (Sponberg et al., 2015; Roth et al.,2016; Stöckl et al., 2017) and a minimum of four poles and threezeroes to capture the double peak in gain but, more importantly, theplateau in phase between 3 and 5 Hz. In wind, the phase plateau isremoved and gain has a single peak, so tracking can be described bya lower-order transfer function with only two poles. This orderreduction suggests that wind acts as an environmental filter thatmodifies tracking dynamics at and above the range of vortexshedding. The second gain peak in still air represents a removed polebetween 4.3 and 6.1 Hz, which overlaps the end of the range ofvortex shedding frequencies.
Dominant vortex shedding frequencies of unsteadyflower wakes coincide with specific frequency bandsRoboflower sheds vortices in the intermediate frequency range,matching the frequency band of overshootTo explore the temporal dynamics of the unsteady flow around themoth, we imaged the wake of the stationary robotic flower. Usingsmoke-wire visualization, we observed that the dominant vortexstructures in the flower wake were irregular, but mostly within theintermediate frequency band of 1.7–5.3 Hz. The vortex sheddingfrequency was determined by observing the number of vortices(rotating in the same direction) over 300 frames, approximately5–10 cm downstream of the flower face (Fig. 4A, red box).Averaging across four videos, the vortex shedding frequency fromthe top petals was 2.16±0.25 Hz (mean±s.d.). Flow around thenectary shed vortices at 0.95±0.17 Hz (mean±s.d.). However, this isa lower bound of the vortex shedding frequency because the flowersheds vortices that rotate in multiple directions with one or morearriving at the same downstream location simultaneously (Movie 1).
While the streaklines had a slight upward drift because thetemperature was higher than that of the surrounding air, the flowerwake structure was distinct from the undisturbed streaklines abovethe flower. As the wake develops downstream, the shed vortexstructures interact with one another. Some vortices cluster (multiplevortices, Fig. 4B), appear distinct (single vortex, Fig. 4C) or mergewith counter-rotating, neighboring vortices (diffuse streaklines,Fig. 4D). These overlapping vortices (Fig. 4B,D) potentially doublethe number of vortices, raising the estimated dominant vortex
6
RESEARCH ARTICLE Journal of Experimental Biology (2018) 221, jeb179259. doi:10.1242/jeb.179259
Journal
ofEx
perim
entalB
iology

shedding frequency to 4.33±0.49 Hz (mean±s.d.) from the toppetals and 1.90±0.34 Hz (mean±s.d.) from the nectary. While themoth feeds in a relatively low flow region (approximately 5 cmdownstream), the wingspan extends past the face of the flower sostructures shed from the perimeter interact directly with both wings.The vortex shedding frequencies ranged from 2 to 5 Hz, overlappingthe region of increased overshoot (Fig. 3D).
Real hawkmoth-pollinated flowers shed unsteady wakesat low frequenciesSize and material differences between our robotic flower and naturalflowers could lead to different unsteady wakes. Hawkmoths foragefrom flowers of various sizes, from 1–2 cm up to 10 cm (Sprayberryand Suver, 2011; Sponberg et al., 2015), and natural flowers aremore flexible than the 3D-printed roboflower. Using the samevisualization method, we observed the wakes shed from fullybloomed Datura sp. flowers (tip-to-tip, flower face diameter: 9 cm,Fig. 5A) and Petunia sp. flowers (tip-to-tip, flower face diameter:7 cm, Fig. 5B) attached to the same rigid support used for therobotic flower. Larger Datura flowers shed vortices 2–3 cm furtherdownstream than Petunia flowers. This includes the feedingposition of the moth (Fig. 5A). Fewer vortices appear in themeasurement region (Fig. 5, red box), resulting in a lower frequencyof structures shed from the flower petals (lower bound: 0.43±0.06 Hz; upper bound: 0.87±0.12 Hz). The vortex sheddingfrequency around the nectary was similar to that from theroboflower as the same support structure was used (bottom wakestructure, Fig. 5A). Averaging over threeDatura videos gave a lowerbound of 0.88±0.26 Hz and an upper bound of 1.77±0.51 Hz.For Petunia, these vortices were partially disrupted because ofinteractions with the lower set of petals, which did not allow for
measurement of vortex shedding in this region (Fig. 5B). Based onthree different Petunia flowers, and averaged over four videos, thevortex shedding frequency was 0.95±0.18 Hz. Unlike the roboticflower wake, Petuniawakes showed fewer overlapping vortices, butvortices were still multi-directional, so while an upper bound of1.90±0.36 Hz is unlikely, some structures were shed at frequenciesabove 1 Hz.
Inertial power comparisons quantitatively confirmconsistency of flower wake and reveal non-linearityTo test whether flower tracking in wind (case 1) is a linearsuperposition of stationary hovering in wind (case 2, Fig. 6A,B) andtracking in still air (case 3), we compared the inertial power utilizedduring these maneuvers. For the two tracking cases, 1 and 3, mothsexhibited inertial COM power peaks at each of the drivingfrequencies and minimal power at the non-driving frequencies(Fig. 6C). When the flower was held stationary in wind (case 2), weexpected power requirements to only increase in the frequency bandcorresponding to vortex shedding. A stationary flower would resultin a stationary moth and therefore low inertial COM power. InertialCOM power for hover-feeding in wind (case 2) would then revealthe maneuvers induced by flower wake interactions (Fig. 6D).Agreement between tracking (case 1) and hover-feeding (case 2) inwind at the non-driving frequencies suggests that the flower motionat various frequencies does not significantly change the vortexshedding frequency. The sum of the moth’s inertial power for hover-feeding in wind (case 2) and tracking in still air (case 3) gives alinear prediction for the power needed to track in wind (case 1):
b_Ewindtracking ¼ _E
stilltracking þ _E
windhovering: ð12Þ
2 cm
A B
C
D
Multiple vortices
Single vortex
Merged vortices
Smoke wirealignment
Fig. 4. Smoke visualization of the robotic flower wake. (A) Full frame view of a flower wake. Inset shows smoke wire lateral alignment with the flower face.The moth primarily feeds in the relatively low flow region approximately 2–5 cm downstream of the flower. Vortices were most distinguishable around 5 cmdownstream (white dashed box) and vortex shedding frequency was measured at this location (red box). (B) Snapshot of flower wake (from red boxed region)showing multiple vortices, rotating in multiple directions, passing through the same location. (C) Snapshot of a single vortex. (D) Snapshot of diffuse streaklinesdue to merging vortices. Level adjustments were made to highlight the smoke lines using Photoshop with a mask over the robotic flower, shown in green.
7
RESEARCH ARTICLE Journal of Experimental Biology (2018) 221, jeb179259. doi:10.1242/jeb.179259
Journal
ofEx
perim
entalB
iology

The linear sum ð _EÞ over-predicts the measured response ð _EwindtrackingÞ
for tracking in wind at all non-driving frequencies (Fig. 6E). Theresponse at the lowest driving frequencies is well captured by alinear combination of still-air tracking and hover-feeding in wind.However, at the mid-range driving frequencies (1.7–5.3 Hz), thelinear sum consistently under-predicts the actual response by aminimum of 11.4 W kg–1 (at 5.3 Hz) and a maximum of92.1 W kg–1 (at 2.9 Hz). Although there is a slight increase ininertial power between hover-feeding (case 2) and tracking in wind(case 3), the over-prediction by the linear sum, especially between 2and 5 Hz (Fig. 6E), is too large to be explained by differences inflower wake characteristics alone.
Key features of the LEV are maintained in windAs the flower wake significantly decreases tracking performance,we next used smoke visualization to see whether the LEV bursts in
wind. Bursting is expected to occur along the mid-span during themiddle of the wingstroke. In the absence of bursting, the LEV maymaintain the same structure observed in steady air with a relativelyconstant diameter extending across the full wingspan duringmid-wingstroke (Bomphrey et al., 2005).
With the smoke wire aligned at mid-wing, we observed a singleLEV that reattached without bursting (Fig. 7A), consistent withLEV structure in steady air conditions (Ellington et al., 1996;Bomphrey et al., 2005). During each downstroke, the mid-wingLEV grows until it is shed prior to the beginning of the upstroke.The stable LEV was most visible at mid-downstroke (Fig. 7A;Movie 2). Although the freestream velocity in our experiments wasslightly lower than in previous studies (Ellington et al., 1996;Bomphrey et al., 2005), the mid-wing LEVwas qualitatively similarin size (relative to the wing chord) and shape to their results. Otherfeatures of the LEV structure, such as trailing edge (Fig. 7B, whitearrow) and tip vortices (Fig. 7A, yellow arrow) were also visible onsome wingstrokes, but the full vortex loop structure cannot beresolved with smoke-wire visualization alone.
The LEV structure is continuous across the thorax in the absenceof vortex bursting. Over the thorax, the LEV forms during strokereversal and grows during the upstroke (Fig. 8B; Movie 3),consistent with observations in steady air (Bomphrey et al., 2005).However, a transient LEV was sometimes present during thedownstroke (Fig. 8A), so LEV structure may not be conserved fromwingbeat to wingbeat. Despite possible inter-wingbeat variation,moths appear to use an unburst LEV with and without wind.
DISCUSSIONWake interactions shift tracking performance within vortexshedding frequency rangeAlthough performance declines, moths maintain near-perfecttracking in the flower wake within the range of flower oscillationsthey encounter in nature. Outside of this range, moths facesignificant challenges from vortices shed in the flower wake. Gainovershoot, tracking error and inertial power all peak within 2–5 Hzand are higher than in still air (Figs 3D,F and 6C,D,E). Hawkmoths(Ortega-Jimenez et al., 2013), bumblebees (Ravi et al., 2013) andfish (Liao et al., 2003a,b; Liao, 2007; Maia et al., 2015) have alldemonstrated an ability to stabilize perturbations at vortex sheddingfrequencies when maintaining a position. We found that shedvortices also impact active maneuvers, like flower tracking. Despitechanges in underlying tracking dynamics, the flower wake does notlead to tracking failure. Aerodynamic interactions challengetracking maneuvers, but moths still successfully feed andmaintain comparable positional errors (Fig. S4).
Responses to the flower wake are consistent across all non-driving frequencies, regardless of whether the flower is moving ornot. Wakes of oscillating cylinders exhibit increased vortex strength(Toebes, 1969) and varied modes of vortex shedding depending onthe frequency of oscillation (Griffin, 1971; Williamson and Roshko,1988; Placzek et al., 2009). When the cylinder oscillates at thenatural vortex shedding frequency of the still cylinder, a ‘lock-in’condition can be reached where the motion of the cylinder can drivevortex shedding away from the natural frequency (Koopmann,1967). Although the mean inertial power for moving and stillflowers in wind differs slightly at non-driving frequencies outside ofthe vortex shedding range, the confidence intervals maintainoverlap (Fig. 6D). The consistent overlap across non-drivingfrequencies in wind suggests that the vortex shedding in theflower wake occurs between 2 and 5 Hz whether the flower ismoving or not (Fig. 6D). Separation between vortex shedding
~1 cm
Smoke wirealignment
A
~1 cm
Smoke wirealignment
B
Fig. 5. Smoke visualization of natural flower wakes. (A) Snapshot ofDatura sp. wake. (B) Snapshot of Petunia sp. wake. Inset shows smoke wirelateral alignment with the flower face. For both flowers, vortices similar to thoseshed by the robotic flower are seen coming from the top petals, with fewerpassing through the measurement region for Datura (red box). The wakestructure from the bottom petals is disrupted by the rigid support rod. Globaladjustments weremade to brightness, contrast and gamma, within the Photronsoftware (PFV). Additional level adjustments weremade to highlight the smokelines using Photoshop with a mask over the flower, shown in green.
8
RESEARCH ARTICLE Journal of Experimental Biology (2018) 221, jeb179259. doi:10.1242/jeb.179259
Journal
ofEx
perim
entalB
iology

0.1 10
0.1 101
Tracking in wind
Linear combinationHover-feeding in windStill-air tracking
Frequency (Hz)Time (s)
Pos
ition
(cm
)
Dis
plac
emen
t (cm
)
0.1 1 10
Individuals
Average
0.02
0.04
0.06
0.08
0.1
0
–1
0
0.5
1
1.5
–2
–0.5
–1.5
10 15 200 5
Frequency (Hz)
Iner
tial p
ower
(W k
g–1 )
100
100
100
1
1
1
1
0.1 101
A B
C
D
E
Fig. 6. Effects of unsteady wake on inertial power. (A) Example time series data for hover-feeding trials in the wind tunnel. The flower (green) remainsstationary while themoth oscillates and tries tomaintain a stable position with 0.7 m s–1 freestreamwind. Traces of trajectories of all sampledmoths (gray) and themean (pink) show high variation between individuals. (B) Fourier transform of data from A. Each individual trial was transformed and then averaged. Despiteindividual variation, all moths display large amplitude oscillations below 1.7 Hz with an additional (smaller) peak occurring between 2 and 5 Hz. (C) Inertial (centerof mass, COM) power comparison (mean±95%CI) for tracking in wind (blue) and in still air (black). Power peaks at the driving frequencies for both tracking cases,but peaks are higher for tracking in wind. (D) Comparison of tracking in wind (blue) and hover-feeding in wind (pink). Power peaks at the driving frequencies fortracking in wind, but the two traces show agreement in non-driving frequencies between 1.7 and 5.3 Hz. (E) Comparison between measured tracking in wind(blue) and the linear combination of still-air tracking (Sponberg et al., 2015) and hover-feeding in wind (dark purple). While the linear combination agrees fairly wellwith the response at the lowest frequencies, it under-predicts the response between 1.7 and 5.3 Hz and over-predicts at the highest frequencies.
9
RESEARCH ARTICLE Journal of Experimental Biology (2018) 221, jeb179259. doi:10.1242/jeb.179259
Journal
ofEx
perim
entalB
iology

frequencies and flower motion frequencies may allow the moth todecouple tracking maneuvers and perturbation responses.In nature, even wind speeds below 5 cm s–1 induce small
amplitude oscillations (approximately 0.5 cm, peak-to-peak) inhawkmoth-pollinated flowers (Phlox) and higher wind speeds resultin larger lateral than longitudinal oscillations (Farina et al., 1994).Frequency analysis of multiple flower species showed that mosthawkmoth-pollinated flowers oscillate below 5 Hz (Sprayberry andSuver, 2011) with over 90% of flower power (power spectraldensity or oscillation energy at each frequency) contained below1.7 Hz (Sponberg et al., 2015). In addition to oscillating within thislow-frequency band (0.1–1.7 Hz), we found that natural hawkmoth-pollinated flowers shed wake structures at these frequencies (Fig. 5).Because the frequencies of flower oscillation and vortex sheddingoverlap, natural flower wakes could pose challenges to tracking innature. Alternatively, if the passive response to wind is in the samedirection as tracking motion, then moths might exploit thisphenomenon to ‘surf’ on flower wakes.
Non-linear inertial power response indicates non-lineartracking dynamics biased to low-frequency motionTracking performance is reduced in the flower wake with a largereffect at vortex shedding frequencies. More motion than predicted is
seen at the driving frequencies, especially at frequencies (2–5 Hz)where the flower sheds vortices (Figs 4 and 6). Moths do notcombine tracking and perturbation responses as a simplesuperposition. Hawkmoths have a high roll moment of inertia andare known to rely on passive damping mechanisms in response toroll perturbations (Hedrick et al., 2009; Cheng et al., 2011; Liu andCheng, 2017). Although the moment of inertia is lower around theyaw and pitch axes, similar passive mechanisms could be employedto stabilize position in the flower wake. Reliance on passivedamping could explain the large overshoot and tracking errorbetween 2 and 5 Hz (Fig. 3D,F), if the moth only actively tracksoutside this frequency range. The addition of unsteady flowemphasizes that best tracking performance is biased to lowfrequencies matching natural flower oscillations.
Moths are perturbed by wind, but they may correct for thisthrough feedback. Both experiments and numerical simulationsshowed that bumblebees in von Kármán streets respond toperturbations with passive, drag-based mechanisms (Hedrick et al.,2009; Ristroph et al., 2013), but must also use active flight control tomaintain stability as wake perturbation effects increase over time(Ravi et al., 2016). In addition, we know the abdomen respondsactively to visual motion stimuli to stabilize body pitch over multiplewingstrokes (Dyhr et al., 2013). Hawkmoths maneuvering in wind
A
B
Smoke wirealignment
Fig. 7. Smoke visualization of the LEV atthe mid-wing position. Free-flying moths(n=2) maintaining a stable position whilefeeding from the robotic flower in wind.Outline of moth added for clarity. (A) Mid-downstroke. Separated flow region of LEV(white arrow) and roll up of the tip vortex(yellow arrow). The LEV during the mid- tolate downstroke resembles what has beenseen previously for tethered Manduca insteady air (compare with Bomphrey et al.,2005), but the tip vortex (yellowarrow) showsa down and backward trajectory, rather thanback and upwards. (B) Early downstroke.A possible trailing edge vortex indicated by awhite arrow. Level adjustments weremade tohighlight the smoke lines using Photoshop.Inset shows smoke wire lateral alignmentwith the moth and flower face.
10
RESEARCH ARTICLE Journal of Experimental Biology (2018) 221, jeb179259. doi:10.1242/jeb.179259
Journal
ofEx
perim
entalB
iology

could adjust abdomen position either to increase drag and stabilizeagainst perturbations or tilt their aerodynamic force vector withoutchanging wing kinematics.Measurements of energetic costs of tracking showed that
maneuvering does increase COM inertial power, but the increaseis small compared with the energy required for hovering alone(Sprayberry and Daniel, 2007). At our freestream velocity, 0.7 m s–1,the moths are in slow forward flight; however, wing kinematics andbody pitch are comparable to hovering (Willmott et al., 1997).We only considered power due to lateral motion. Contributionsfrom wing aerodynamic power could also change in wind and it isnot clear how changes in wing kinematics would influenceaerodynamic power. At higher wind speeds, hawkmoths pitchdown and adopt a figure of 8 wing path (Willmott and Ellington,1997b). Adding the unsteady wake on top of higher speed steadywind could exaggerate these adjustments. Although the flower wakecould increase the total energy needed to hover, increased inertialpower requirements for motion may not be accompanied byincreased power output (or metabolic) demands. Rainbow troutadopt a Kármán gait to slalom though unsteady wakes and reducecosts of locomotion (Liao et al., 2003a). Moths could similarlyslalom through the flower wake to track flower motion (Lehmann,2008; Lua et al., 2011, 2017). If so, they may reduce control againstperturbations occurring at the driving frequencies, even if thisresults in increased overshoot (Fig. 3D). Energy from the flowerwake disrupts tracking maneuvers, but vortices are thought to firstinteract with the moth aerodynamically. Then, the flower wakeshould first disrupt the LEV, which we can identify with smokevisualization of vortex bursting.
LEV seen in steady air persists despite unsteady wakeinteractionsWe saw no evidence of vortex bursting due to interaction with theflower wake. Instead, we observed a continuous LEV across thewings and thorax. In wind, the flower sheds vortices in multipledirections, causing multidirectional flow separation at the leadingedge of the wing, which may inhibit the ability of each wing tostabilize bound vortices, such as the LEV. To maintain LEVstructure and size, energy must be dissipated or the vortex wouldcontinue to grow in size and strength until it is shed off the wing intothe wake of the insect. Interactions with the flower wake could alterspanwise flow (Birch and Dickinson, 2001) and potentially inducevortex bursting. However, additional energy from the flower wake issuccessfully dissipated out of the LEV. The lack of vortex burstingsuggests that the LEV is robust to interactions with vortex structuresat the spatiotemporal scale of the robotic flower.
Stability of the LEV in wind could be due to the small size ofvortex structures (Fig. 4), suggesting they may not be energeticenough to cause disruption. The comparable size of vortices innatural flower wakes (Fig. 5) also implies that vortex size is not achallenge to the LEV in nature. The temporal range of vortexshedding frequencies (2–5 Hz) lies well below the wingbeatfrequency of the moth during hovering and tracking(approximately 25 Hz). We found that while interacting with windat these frequencies, moths still maintained the time scale of thewingbeat (Fig. S3). Therefore, the time scale of LEV growth is alsomaintained in the unsteady flower wake. Nonetheless, wakes doaffect tracking. Quantitative flow visualization of LEV strength anddevelopment throughout the wingstroke could reveal whether lift
A
B
Mid-downstroke1st wingbeat
Mid-upstroke1st wingbeat
Mid-downstroke2nd wingbeat
Mid-downstroke3rd wingbeat
Mid-upstroke2nd wingbeat
Mid-upstroke3rd wingbeat
Smoke wirealignment
+9 ms
+29 ms
+49 ms
+69 ms
+89 ms
+109 ms
ok
Fig. 8. Smoke visualization of the LEV over the thorax (centerline). Flow is attached over the thorax at the late downstroke (for most wingstrokes),separates at stroke reversal, and then the LEV grows throughout the upstroke. Snapshots from three successive wingbeats for one moth show (A) atransient downstroke LEV over the thorax and (B) the persistent thorax LEV at mid-upstroke. Relative time throughout each wingbeat is shown based on theapproximately 25 Hz (or 40 ms) wingbeat frequency (Fig. S2). When present (white arrow and blue dashed outline), the downstroke LEV is comparable insize to the upstroke LEV. The wing is outlined in gray. Inset shows smoke wire lateral alignment with the moth and flower.
11
RESEARCH ARTICLE Journal of Experimental Biology (2018) 221, jeb179259. doi:10.1242/jeb.179259
Journal
ofEx
perim
entalB
iology

forces are affected by interactions with wind although the LEVstructure appears not to change.
Counter-intuitive reduced-order dynamics emerge in amore complex environmentAlthough LEV structure is qualitatively maintained, moths producereduced-order dynamics for tracking in wind compared with still air.Interactionwith the flower wake removes the bimodal response in bothgain and phase within the range of vortex shedding frequencies(Fig. 3D,E). The wake could be considered a disturbance, but ifthe unsteady flow also alters force generation of the wings, then theunderlying tracking dynamics have changed. In other words, the filterthat transforms kinematics to forces is likely changed in the flowerwake. Counter-intuitively, this environmental filter simplifies trackingdynamics within 2–5 Hz. With lower frequency disturbances, such asthe flower wake, moths may actively prioritize responses to lowerfrequencies and ignore the higher frequency flower motions. This isone way that adding the flower wake could filter the tracking responseof the moth. Electric fish vary opposing thrust and drag forces toremain stable in different flow speeds (Sefati et al., 2013). Passiveresponses to vortices in the flower wake could also counteract higher-order tracking maneuvers at certain frequencies, even if the moth doesnot deliberately control against these perturbations.
Contradiction in wake impact on maneuvering andaerodynamicsHawkmoths employ a stable LEV to produce lift despite changinghow well they track flowers in still and windy conditions. Asvortices in the flower wake are relatively small, interactions betweenthese structures and the LEVmay result in vorticity or lift magnitudedifferences, but not cause the overall LEV to burst or changestructure along the wingspan. LEVs have been classified for manydifferent insects based on the qualitative structure of the vortexacross the wingspan and a quantitative understanding of how energyis dissipated to maintain LEV stability (Bomphrey et al., 2005).Hawkmoths rely on a continuous, actively generated LEV in steadyair (Willmott et al., 1997) and operate in the Reynolds number rangeof vortex bursting. Our results show that moths continue to use thesame class of LEV with no obvious evidence of vortex bursting.While smoke visualization can identify LEV bursting, it cannot
quantify changes in spanwise flow, either through the vortex core ortowards the trailing edge of the wing. We conclude that any changesin spanwise flow due to the flower wake are not large enough toburst the LEV or change its class.
Consequences for flight controlFreely behaving animals rely on feedback systems to controllocomotion and encode information about both the environmentand their state within that environment. Fish swimming throughvon Kármán cylinder wakes largely maintain position throughvisual feedback (Liao, 2007). The foraging task studied here waspreviously shown to rely on redundant visual and mechanosensory(from the proboscis–nectary interaction) pathways (Roth et al.,2016). The addition of mechanosensory feedback may help mothsstabilize in wakes even if their vision is compromised. Manducasexta also has a longer proboscis than those of some otherhawkmoths (Deilephila elpenor or Macroglossum stellatarum;Haverkamp et al., 2016), which has been proposed to increasemechanosensory feedback during tracking as more of the proboscisis in contact with the nectary (Stöckl et al., 2017). A longerproboscis could also cause the moth to interact with vortices thatdevelop further downstream from the flower, requiring the LEV to
also be stable to the wakes of a wide range of flowers from Petuniato larger Datura (Fig. 5).
As they maneuver in nature, insects may need to encode both theenvironment around them and the forces they are able to producethrough interactions with that environment. Campaniform sensillapresent along the dorsal and ventral side of the hawkmoth forewingare sensitive to inertial forces on a time scale 80× smaller than thewingbeat period (Dickerson et al., 2014; Pratt et al., 2017). Inunsteady flow, aerodynamic interactions change local flow alongthe wing and lead to LEV bursting. Aerodynamic forces are notthought to influence overall wing motions, but they may locallystrain the wing if changes in flow are large. If the boundary layer isdisrupted, wind may also deflect hair sensilla on the thorax.Encoding local strains could be a mechanosensory feedbackmechanism for LEV stability.
Although performance suffers, the forces and torquesfundamental to successful flower tracking at natural floweroscillation frequencies are maintained in wind. Features of theenvironment are sensed and integrated by multiple neural pathwaysto achieve a desired motion. Variation in the environment then shiftsbehavior away from ideal locomotion, but not far enough to causefailure. Animals in nature may depend on sensing subtle changes inforce-generating mechanisms, such as the LEV, to balance bodymaneuvers and lift production in an unsteady environment.
AcknowledgementsWe thank Steven Chandler for his assistance in setting up and maintaining theanimals and experimental apparatus and many thoughtful discussions of thefrequency domain. We also thank Isabel Veith for preparing supplementaryinformation about the wind tunnel specifications.
Competing interestsThe authors declare no competing or financial interests.
Author contributionsConceptualization: M.M., S.S.; Methodology: M.M., S.S.; Software: M.M.; Validation:M.M.; Formal analysis: M.M.; Investigation: M.M.; Resources: M.M., S.S.; Datacuration: M.M.; Writing - original draft: M.M.; Writing - review & editing: M.M., S.S.;Visualization: M.M.; Supervision: S.S.; Funding acquisition: M.M., S.S.
FundingThis work was supported by a National Science Foundation Graduate ResearchFellowship (NSF GRFP) [grant no. DGE-1650044 to M.M.] and a National ScienceFoundation Physics of Living Systems CAREER Grant [grant no. MPS/PoLS1554790 to S.S.].
Data availabilityRaw data are available in Dryad for Matthews and Sponberg (2018) at doi:10.5061/dryad.56q7c2k.
Supplementary informationSupplementary information available online athttp://jeb.biologists.org/lookup/doi/10.1242/jeb.179259.supplemental
ReferencesBirch, J. M. and Dickinson, M. H. (2001). Spanwise flow and the attachment of the
leading-edge vortex on insect wings. Nature 412, 729-733.Bomphrey, R. J., Lawson, N. J., Harding, N. J., Taylor, G. K. and Thomas,
A. L. R. (2005). The aerodynamics of Manduca sexta: digital particle imagevelocimetry analysis of the leading-edge vortex. J. Exp. Biol. 208, 1079-1094.
Bomphrey, R. J., Taylor, G. K. and Thomas, A. L. R. (2009). Smoke visualizationof free-flying bumblebees indicates independent leading-edge vortices on eachwing pair. Exp. Fluids 46, 811-821.
Broadhead, G. T., Basu, T., von Arx, M. and Raguso, R. A. (2017). Diel rhythmsand sex differences in the locomotor activity of hawkmoths. J. Exp. Biol. 220,1472-1480.
Cheng, B., Deng, X. and Hedrick, T. L. (2011). The mechanics and control ofpitching manoeuvres in a freely flying hawkmoth (Manduca sexta). J. Exp. Biol.214, 4092-4106.
12
RESEARCH ARTICLE Journal of Experimental Biology (2018) 221, jeb179259. doi:10.1242/jeb.179259
Journal
ofEx
perim
entalB
iology

Chin, D. D. and Lentink, D. (2016). Flapping wing aerodynamics: from insects tovertebrates. J. Exp. Biol. 219, 920-932.
Combes, S. A. and Dudley, R. (2009). Turbulence-driven instabilities limit insectflight performance. Proc. Natl Acad. Sci. USA 106, 9105-9108.
Cowan, N. J., Ankarali, M. M., Dyhr, J. P., Madhav, M. S., Roth, E., Sefati, S.,Sponberg, S., Stamper, S. A., Fortune, E. S. and Daniel, T. L. (2014). Feedbackcontrol as a framework for understanding tradeoffs in biology. Integr. Comp. Biol.54, 223-237.
Dickerson, B. H., Aldworth, Z. N. and Daniel, T. L. (2014). Control of moth flightposture is mediated by wing mechanosensory feedback. J. Exp. Biol. 217,2301-2308.
Dickinson, M. H., Lehmann, F. O. and Sane, S. P. (1999). Wing rotation and theaerodynamic basis of insect flight. Science 284, 1954-1960.
Dudley, R. (2002a). Mechanisms and Implications of Animal Flight Maneuverability.Integr. Comp. Biol. 42, 135-140.
Dudley, R. (2002b). The Biomechanics of Insect Flight: Form, Function, Evolution.Princeton University Press.
Dyhr, J. P., Morgansen, K. A., Daniel, T. L. and Cowan, N. J. (2013). Flexiblestrategies for flight control: an active role for the abdomen. J. Exp. Biol. 216,1523-1536.
Ellington, C. P., van den Berg, C., Willmott, A. P. and Thomas, A. L. R. (1996).Leading-edge vortices in insect flight. Nature 384, 626-630.
Farina, W. M., Varju, D. and Zhou, Y. (1994). The regulation of distance to dummyflowers during hovering flight in the hawk moth Macroglossum stellatarum.J. Comp. Physiol. A 174, 239-247.
Farina, W. M., Kramer, D. and Varju, D. (1995). The response of the hovering hawkmothMacroglos sum stellatarum to translatory patternmotion. J. Comp. Physiol. A176, 551-562.
Fisher, R. A. (1929). Tests of significance in harmonic analysis. Proc. R. Soc.London Ser. A Contain. Pap. Math. Phys. Character 125.
Griffin, O. M. (1971). The unsteady wake of an oscillating cylinder at low reynoldsnumber. J. Appl. Mech. 38, 729.
Haverkamp, A., Bing, J., Badeke, E., Hansson, B. and Knaden, M. (2016). Innateolfactory preferences for flowersmatching proboscis length ensure optimal energygain in a hawkmoth. Nat. Commun. 7, 1-9.
Hedrick, T. L. (2008). Software techniques for two- and three-dimensional kinematicmeasurements of biological and biomimetic systems. Bioinspir. Biomim. 3,034001.
Hedrick, T. L., Cheng, B. and Deng, X. (2009). Wingbeat time and the scaling ofpassive rotational damping in flapping flight. Science 324, 252-255.
Johansson, L. C., Engel, S., Kelber, A., Heerenbrink, M. K. and Hedenstrom, A.(2013). Multiple leading edge vortices of unexpected strength in freely flyinghawkmoth. Sci. Rep. 3, 1-5.
Koopmann, G. H. (1967). The vortex wakes of vibrating cylinders at low Reynoldsnumbers. J. Fluid Mech. 28, 501-512.
Lehmann, F.-O. (2008). When wings touch wakes: understanding locomotor forcecontrol by wake wing interference in insect wings. J. Exp. Biol. 211, 224-233.
Lentink, D. and Dickinson, M. H. (2009). Rotational accelerations stabilize leadingedge vortices on revolving fly wings. J. Exp. Biol. 212, 2705-2719.
Lentink, D., Van Heijst, G. F., Muijres, F. T. and Van Leeuwen, J. L. (2010). Vortexinteractions with flapping wings and fins can be unpredictable. Biol. Lett. 6,394-397.
Liao, J. C. (2007). A review of fish swimming mechanics and behaviour in alteredflows. Philos. Trans. R. Soc. B Biol. Sci. 362, 1973-1993.
Liao, J. C., Beal, D. N., Lauder, G. V. and Triantafyllou, M. S. (2003a). Fishexploiting vortices decrease muscle activity. Science 302, 1566-1569.
Liao, J. C., Beal, D. N., Lauder, G. V. and Triantafyllou, M. S. (2003b). TheKarman gait: novel body kinematics of rainbow trout swimming in a vortex street.J. Exp. Biol. 206, 1059-1073.
Lighthill, M. J. (1973). On the Weis-Fogh mechanism of lift generation. J. FluidMech. 60, 1-17.
Liu, P. and Cheng, B. (2017). Limitations of rotational manoeuvrability in insectsand hummingbirds: evaluating the effects of neuro-biomechanical delays andmuscle mechanical power. J. R. Soc. Interface 14.
Liu, Y., Roll, J., Kooten, S. V. andDeng, X. (2018). Schlieren photography on freelyflying hawkmoth. Biol. Lett. 14.
Lua, K. B., Lim, T. T. and Yeo, K. S. (2011). Effect of wing-wake interaction onaerodynamic force generation on a 2D flapping wing. Exp. Fluids 51, 177-195.
Lua, K. B., Lee, Y. J., Lim, T. T. and Yeo, K. S. (2017). Wing-wake interaction ofthree-dimensional flapping wings. AIAA J. 55, 729-739.
Maia, A., Sheltzer, A. P. and Tytell, E. D. (2015). Streamwise vortices destabilizeswimming bluegill sunfish (Lepomis macrochirus). J. Exp. Biol. 218, 786-792.
Matthews M. and Sponberg S. (2018) Data from: Hawkmoth flight in the unsteadywakes of flowers. Dryad Digital Repository. https://doi.org/10.5061/dryad.56q7c2k.
Merzkirch, W. (1987). Techniques of Flow Visualization. Technical report, AdvisoryGroup for Aerospace Research & Development. Defense Technical InformationCenter.
Ortega-Jimenez, V. M., Greeter, J. S. M., Mittal, R. and Hedrick, T. L. (2013).Hawkmoth flight stability in turbulent vortex streets. J. Exp. Biol. 216, 4567-4579.
Ortega-Jimenez, V. M., Mittal, R. and Hedrick, T. L. (2014). Hawkmoth flightperformance in tornado-like whirlwind vortices. Bioinspir. Biomim. 9, 025003.
Ortega-Jimenez, V. M., Badger, M., Wang, H. and Dudley, R. (2016). Into rudeair: hummingbird flight performance in variable aerial environments. Phil.Trans. R. Soc. B 371, 20150387.
Placzek, A., Sigrist, J.-F. and Hamdouni, A. (2009). Numerical simulation of anoscillating cylinder in a cross-flow at low Reynolds number: Forced and freeoscillations. Comput. Fluids 38, 80-100.
Pournazeri, S., Segre, P. S., Princevac, M. and Altshuler, D. L. (2013).Hummingbirds generate bilateral vortex loops during hovering: Evidence fromflow visualization. Exp. Fluids 54.
Pratt, B., Deora, T., Mohren, T. and Daniel, T. L. (2017). Neural evidence supportsa dual sensory motor role for insect wings. Proc. R. Soc. B Biol. Sci. 284.
Ravi, S., Crall, J. D., Fisher, A. and Combes, S. A. (2013). Rolling with the flow:bumblebees flying in unsteady wakes. J. Exp. Biol. 216, 4299-4309.
Ravi, S., Crall, J. D., McNeilly, L., Gagliardi, S. F., Biewener, A. A. and Combes,S. A. (2015). Hummingbird flight stability and control in freestream turbulentwinds. J. Exp. Biol. 218, 1444-1452.
Ravi, S., Kolomenskiy, D., Engels, T., Schneider, K., Wang, C., Sesterhenn, J.and Liu, H. (2016). Bumblebees minimize control challenges by combining activeand passive modes in unsteady winds. Sci. Rep. 6, 35043.
Riffell, J. A., Shlizerman, E., Sanders, E., Abrell, L., Medina, B., Hinterwirth,A. J. and Kutz, J. N. (2014). Flower discrimination by pollinators in a dynamicchemical environment. Science 344, 1515-1518.
Ristroph, L., Ristroph, G., Morozova, S., Bergou, A. J., Chang, S.,Guckenheimer, J., Wang, Z. J. and Cohen, I. (2013). Active and passivestabilization of body pitch in insect flight. J. R. Soc. Interface 10, 20130237.
Roth, E., Zhuang, K., Stamper, S. A., Fortune, E. S. and Cowan, N. J. (2011).Stimulus predictability mediates a switch in locomotor smooth pursuitperformance for Eigenmannia virescens. J. Exp. Biol. 214, 1170-1180.
Roth, E., Sponberg, S. and Cowan, N. J. (2014). A comparative approach toclosed-loop computation. Curr. Opin. Neurobiol. 25, 54-62.
Roth, E., Hall, R. W., Daniel, T. L. and Sponberg, S. (2016). Integration of parallelmechanosensory and visual pathways resolved through sensory conflict. Proc.Natl Acad. Sci. USA 113, 12832-12837.
Sane, S. P. (2003). The aerodynamics of insect flight. J. Exp. Biol. 206, 4191-4208.Sefati, S., Neveln, I. D., Roth, E., Mitchell, T. R. T., Snyder, J. B., MacIver, M. A.,
Fortune, E. S. and Cowan, N. J. (2013). Mutually opposing forces duringlocomotion can eliminate the tradeoff betweenmaneuverability and stability. Proc.Natl Acad. Sci. USA 110, 18798-18803.
Sponberg, S. and Daniel, T. L. (2012). Abdicating power for control: a precisiontiming strategy to modulate function of flight power muscles. Proc. R. Soc. B Biol.Sci. 279, 3958-3966.
Sponberg, S., Dyhr, J. P., Hall, R. W. and Daniel, T. L. (2015). Luminance-dependent visual processing enables moth flight in low light. Science 348,1245-1248.
Sprayberry, J. D. H. and Suver, M. (2011). Hawkmoths’ innate flower preferences:a potential selective force on floral biomechanics. Arthropod Plant Interact. 5,263-268.
Sprayberry, J. D. H. and Daniel, T. L. (2007). Flower tracking in hawkmoths:behavior and energetics. J. Exp. Biol. 210, 37-45.
Srygley, R. B. and Thomas, A. L. R. (2002). Unconventional lift-generatingmechanisms in free-flying butterflies. Nature 420, 660-664.
Stockl, A. L., Kihlstrom, K., Chandler, S. and Sponberg, S. (2017). Comparativesystem identification of flower tracking performance in three hawkmoth speciesreveals adaptations for dim light vision. Philos. Trans. R. Soc. B Biol. Sci. 372.
Theobald, J. C., Warrant, E. J. and O’Carroll, D. C. (2009). Wide-field motiontuning in nocturnal hawkmoths. Proc. R. Soc. B Biol. Sci. 277, 853-860.
Toebes, G. H. (1969). The unsteady flow and wake near an oscillating cylinder.J. Basic Eng. 91, 493-502.
Weis-Fogh, T. (1973). Quick estimates of flight fitness in hovering animals, includingnovel mechanisms for lift production. J. Exp. Biol. 59, 169-230.
Williamson, C. H. K. and Roshko, A. (1988). Vortex formation in the wake of anoscillating cylinder. J. Fluid Struct. 2, 355-381.
Willmott, A. P. and Ellington, C. P. (1997a). Measuring the angle of attack ofbeating insect wings: robust three-dimensional reconstruction from two-dimensional images. J. Exp. Biol. 200, 2693-2704.
Willmott, A. P. and Ellington, C. P. (1997b). The mechanics of flight in thehawkmoth Manduca sexta. I. Kinematics of hovering and forward flight. J. Exp.Biol. 200, 2723-2745.
Willmott, A. P. and Ellington, C. P. (1997c). The mechanics of flight in thehawkmothManduca sexta. II. Aerodynamic consequences of kinematic andmorpholocial variation. J. Exp. Biol. 200, 2723-2745.
Willmott, A. P., Ellington, C. P. and Thomas, A. L. R. (1997). Flow visualizationand unsteady aerodynamics in the flight of the hawkmoth, Manduca sexta. Phil.Trans. R. Soc. B Biol. Sci. 352, 303-316.
13
RESEARCH ARTICLE Journal of Experimental Biology (2018) 221, jeb179259. doi:10.1242/jeb.179259
Journal
ofEx
perim
entalB
iology