Hawaii’s Electricity Industry: 2015 Analysis and Recent...
51
Hawaii’s Electricity Industry: 2015 Analysis and Recent Trends October 2016
Transcript of Hawaii’s Electricity Industry: 2015 Analysis and Recent...
Hawaii’s Electricity Industry: 2015 Analysis
and Recent Trends
October 2016

2
TABLE OF CONTENTS
1. INTRODUCTION ............................................................................................7
2. ELECTRICITY GENERATION BY PRODUCERS .......................................8
3. ELECTRICITY GENERATION BY SOURCES ..........................................14
4. FACTORS AFFECTING ELECTRICITY PRICES IN HAWAII ..................34
5. ELECTRICITY CONSUMPTION BY SECTOR ..........................................40
6. ELECTRICITY DEMAND .............................................................................47
7. CONCLUSIONS .............................................................................................49
3
LIST OF TABLES
Table 1 Total Electricity Generation by Producer .....................................................8
Table 2 Hawaii Net Electricity Generation by Utility .............................................10
Table 3 Hawaii Electricity Sales by Utility ..............................................................11
Table 4 Share of Utility Station Usage and Loss of Total Electricity Production ...12
Table 5 Share of Total Station Usage and Loss of Total Electricity Production ......13
Table 6 Electricity Generation by Fuel: Total Electric Power Industry ...................14
Table 7 Electricity Generation by Fuel: Electric Utilities .......................................15
Table 8 Electricity Generation by Fuel: IPP & CHP ................................................16
Table 9 Power Generating Capacity by Type: Total Electric Power Industry ........17
Table 10 Power Generating Capacity: Electric Utilities ..........................................18
Table 11 Power Generating Capacity: IPP and CHP ................................................19
Table 12 Power Generating Capacity by Type in 2013 ............................................20
Table 13 Average Operating Hours: Total Electric Power Industry .........................21
Table 14 Average Operating Hours: Electric Utilities ..............................................22
Table 15 Average Operating Hours: IPP and CHP ...................................................23
Table 16 Fuel Consumption by All Electricity Producers .......................................24
Table 17 Fuel Consumption by Electric Utility ........................................................26
Table 18 Fuel Consumption by IPP and CHP ..........................................................27
Table 19 Hawaii Utility Fuel Consumption ..............................................................28
Table 20 Hawaii Utility Fuel Cost ............................................................................29
Table 21 Hawaii Utility Average Fuel Cost ...............................................……. …30
Table 22 Renewable Electricity Generation in Hawaii ............................................31
Table 23 Hawaii Renewable Electricity by County .................................................33
Table 24 Hawaii Average Revenue of Electricity by Utility ...................................35
Table 25 Hawaii Average Cost of Fuel and Purchased Power by Utility .................36
Table 26 Utility Fuel Cost and Purchased Power Cost Comparison by Utility ........37
Table 27 Other Major Cost of Electricity by Utility ................................................39
Table 28 Electricity Consumption by Sector and by Utility .....................................41
Table 29 Number of Retail Customers by Sector in Hawaii ....................................42
Table 30 Annual Electricity Consumption per Customer by Sector.........................43
Table 31 Revenue from Retail Electricity Sales by Sector in Hawaii .....................44

4
Table 32 Average Electricity Price by County in Hawaii ........................................45
Table 33 Average Electricity Price by Sector in Hawaii .........................................46
Table 34 Total Electricity Demand in Hawaii .........................................................48

5
Executive Summary
This report analyzes the generation, consumption, and cost of Hawaii’s electricity using data from
the U.S. Energy Information Administration (EIA) and the monthly financial reports (MFR) of
Hawaii’s electric utilities. The following is a summary of the results and trends identified in this
report:
The importance of Hawaii’s non-utility electricity producers has increased over time. The
utility companies (HECO, MECO, HELCO, and KIUC) generated 53.7 percent of the total
electricity in 2015 and purchased the remainder from IPPs and CHPs. This was a 28.7
percentage point decrease from 1990, when utilities generated 82.4 percent of the total
electricity sold in Hawaii. This has also contributed to the increase in the share of electricity
generation from renewable sources, because non-utility producers in Hawaii use more
renewable energy and less petroleum.
Hawaii’s dependence on petroleum for electricity generation has decreased over time.
According to the most recent data from EIA, about 67.9 percent of the electricity was generated
from petroleum fuel in 2014, and this represented a 22.1 percentage point decrease from the
1990 figure of 90.0 percent. In 2015, electricity generated from renewable sources accounted
for 16.2 percent of the total electricity sold.
In spite of a significant price decrease in 2015, the quantity of electricity sold in Hawaii
remained about the same, suggesting that Hawaii’s electricity demand is inelastic with respect
to price. Total electricity sold by Hawaii’s utilities decreased 0.2 percent or 18 GWH from
9,406 GWH in 2014 to 9,389 GWH in 2015. A large portion of this decrease was due to an
increase in consumer-generated-electricity, mainly the customer rooftop photovoltaic systems.
The average price of electricity in 2015 was 26.3 cents/KWH statewide. Kauai consumers
paid the highest electricity rate at 33.1 cents/KWH, followed by Big Island consumers at 32.3
cents/KWH, Maui consumers at 30.2 cents/KWH, and Oahu consumers at 24.2 cents/KWH.
Hawaii’s residential electricity consumption decreased more than the other sectors. From 2005
to 2015, electricity sold to the residential sector decreased 2.1 percent per year. Over the same
period, electricity sold to the commercial sector and the industrial sector only decreased an
average 1.0 percent and 0.6 percent per year, respectively. In 2015, 39.3 percent of the

6
electricity was consumed by the industrial sector, 33.5 percent by the commercial sector, and
27.2 percent by the residential sector.
Total electricity demand in Hawaii was an estimated 12,794 GWH in 2015. Of this amount,
2,344 GWH or 18.3 percent was generated from customer rooftop photovoltaic systems, solar
water heating (SWH), and demand-side-management (DSM) such as using energy star
appliances. Total electricity generated by utilities, independent power producers (IPP), and
combined heat and power (CHP) firms totaled 10,450 GWH. Electricity station use and
transmission and distribution loss accounted for 10.2 percent, or 1,061 GWH of the total
electricity generated.
From 2005 to 2015, total electricity demand in Hawaii increased an average 0.4 percent per
year, from 12,280 GWH to 12,794 GWH. Electricity generation by the electric power industry
decreased 1.2 percent per year from 11,755 GWH to 10,450 GWH, electricity generated by
user owned PV systems increased 75.3 percent per year from 2 GWH to 665 GWH; electricity
replaced by SWH increased 6.7 percent per year from 84 GWH to 160 GWH; and electricity
replaced by DSM programs increased 13.2 percent per year from 439 GWH to 1,518 GWH.

7
1. Introduction
Electricity plays an important role in Hawaii’s economy. Hawaii’s total expenditures on
electricity reached a peak of about $3.3 billion in 2012 due to the state’s heavy reliance on imported
petroleum and the rapid increase in petroleum prices until late 2014. From 2005 to 2014, total
electricity expenditures in Hawaii increased from $1.9 billion to $3.2 billion, an average annual
increase of 5.6 percent. It is important to note that this increase was much higher than the 3.0
percent CPI increase during the same period, which indicates that energy expenditure growth
outpaced inflation. In 2015, total electricity expenditures decreased 23.1 percent due to decreased
petroleum prices and increased electricity generation from the customer-sited solar systems. Due
to decreased petroleum prices, the total fuel and purchased power cost of Hawaii’s utilities
decreased 32.6 percent, and the average revenue per kWh of electricity sold decreased 21.6 percent
in 2015. However, reduced electricity prices did not lead to increased electricity sales; total
electricity sold decreased 0.2 percent in 2015.
In 2013, the Research and Economic Analysis Division of DBEDT conducted a study to
examine Hawaii’s electric power industry based on data up to 2012. As a third follow up to the
2013 study, this study intends to answer the following research questions:
Who produces electricity in Hawaii?
What type of fuels are used to generate electricity in Hawaii?
What are the main factors that affect electricity prices in Hawaii?
How have the factors affecting electricity prices changed over time?
What role does renewable energy play in electricity generation?
What factors impact the production cost of electricity?
Who consumes electricity in Hawaii?
What are the recent trends in electricity consumption by types of consumers?
What is the performance of the electricity industry in 2015?
The data provided in this report were primarily from two major sources. The first source
was publicly available state level energy data from the U.S. Energy Information Administration
(EIA); the second source of data was each respective Hawaii electric utility’s Monthly Financial
Reports (MFR). The MFR data provided both annual and monthly data by county utility.
8
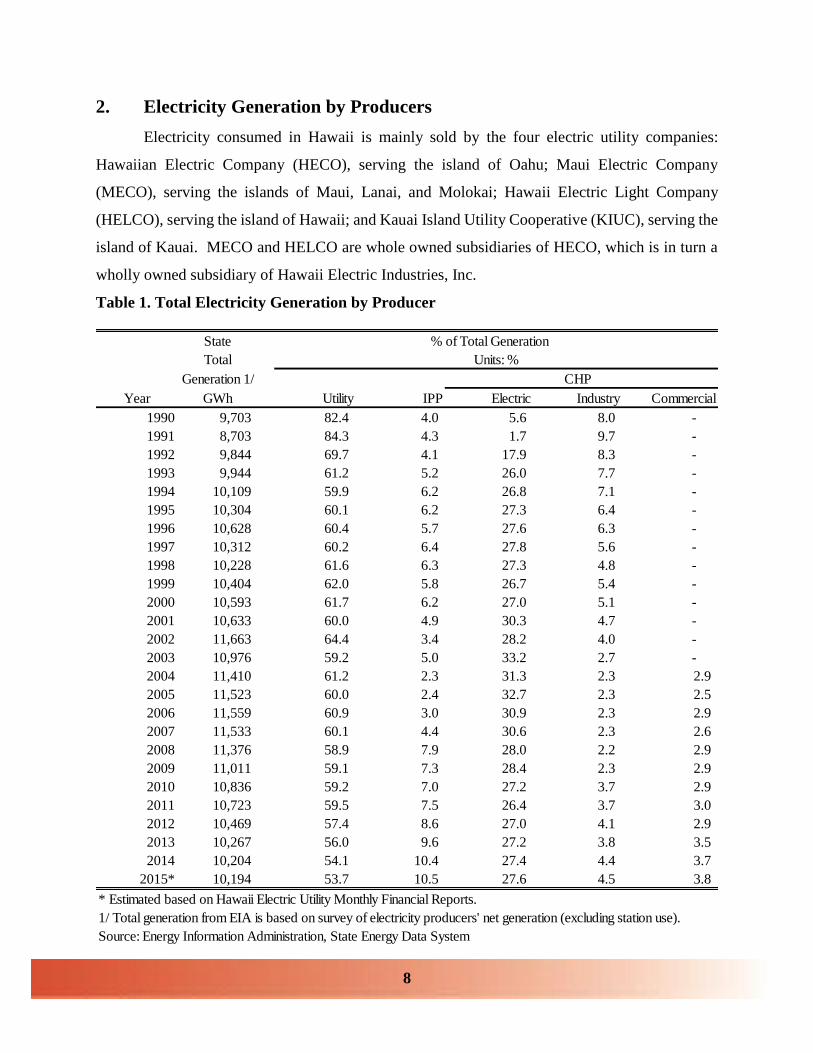
2. Electricity Generation by Producers
Electricity consumed in Hawaii is mainly sold by the four electric utility companies:
Hawaiian Electric Company (HECO), serving the island of Oahu; Maui Electric Company
(MECO), serving the islands of Maui, Lanai, and Molokai; Hawaii Electric Light Company
(HELCO), serving the island of Hawaii; and Kauai Island Utility Cooperative (KIUC), serving the
island of Kauai. MECO and HELCO are whole owned subsidiaries of HECO, which is in turn a
wholly owned subsidiary of Hawaii Electric Industries, Inc.
Table 1. Total Electricity Generation by Producer
State % of Total Generation
Total
Generation 1/ CHP
Year GWh Utility IPP Electric Industry Commercial
1990 9,703 82.4 4.0 5.6 8.0 -
1991 8,703 84.3 4.3 1.7 9.7 -
1992 9,844 69.7 4.1 17.9 8.3 -
1993 9,944 61.2 5.2 26.0 7.7 -
1994 10,109 59.9 6.2 26.8 7.1 -
1995 10,304 60.1 6.2 27.3 6.4 -
1996 10,628 60.4 5.7 27.6 6.3 -
1997 10,312 60.2 6.4 27.8 5.6 -
1998 10,228 61.6 6.3 27.3 4.8 -
1999 10,404 62.0 5.8 26.7 5.4 -
2000 10,593 61.7 6.2 27.0 5.1 -
2001 10,633 60.0 4.9 30.3 4.7 -
2002 11,663 64.4 3.4 28.2 4.0 -
2003 10,976 59.2 5.0 33.2 2.7 -
2004 11,410 61.2 2.3 31.3 2.3 2.9
2005 11,523 60.0 2.4 32.7 2.3 2.5
2006 11,559 60.9 3.0 30.9 2.3 2.9
2007 11,533 60.1 4.4 30.6 2.3 2.6
2008 11,376 58.9 7.9 28.0 2.2 2.9
2009 11,011 59.1 7.3 28.4 2.3 2.9
2010 10,836 59.2 7.0 27.2 3.7 2.9
2011 10,723 59.5 7.5 26.4 3.7 3.0
2012 10,469 57.4 8.6 27.0 4.1 2.9
2013 10,267 56.0 9.6 27.2 3.8 3.5
2014 10,204 54.1 10.4 27.4 4.4 3.7
2015* 10,194 53.7 10.5 27.6 4.5 3.8
* Estimated based on Hawaii Electric Utility Monthly Financial Reports.
1/ Total generation from EIA is based on survey of electricity producers' net generation (excluding station use).
Source: Energy Information Administration, State Energy Data System
Units: %
9
Electricity consumed in Hawaii is generated mainly by the electric utilities and non-utility
electricity producers. Non-utility producers include independent power producers (IPP),
combined heat and power (CHP)-Electric Power, CHP-Industrial Power, and CHP-Commercial
Power. In 2015, electric utilities accounted for about 53.7 percent of the 10,194 GWH of electricity
generation by the electric power industry, and the four types of non-utility producers accounted
for about 46.3 percent of total generation (Table 1). From 1990 to 2015, the electric utilities’ share
of total generation decreased from 82.4 percent to 53.7 percent. Electricity generated by utilities
and the four types of non-utility producers are defined as the electricity generated by the electric
power industry in the EIA data.
In addition to the electricity generated by the electric power industry, some consumers also
generated electricity, such as electricity generated from the photovoltaic (PV) systems owned by
residential or commercial users. Electricity generated by consumers and directly used without
being sold to the utility systems is not included in the total generation and consumption data.
Electricity generation data provided by the EIA and the utility MFR are not exactly
comparable. According to the MFR, electricity sold by the four utilities includes net generation
of the utilities and purchased electricity minus electricity lost in the utility systems (including a
small portion of electricity used but not paid for by electricity users). The net electricity generation
of the utilities is the total electricity generated minus the total usage by the utility owned power
stations. The purchased electricity is the total generation of non-utility producers minus their
station use. Since the usage data of non-utility producers is not available, total generation by the
non-utility producers is also not available. In 2014, total utility generation (including station use)
and purchased electricity in Hawaii was 10,211 GWH based on the utility MFR, slightly higher
than the total electricity generation from the EIA data (10,204 GWH). It appears that the station
use of non-utility producers is not included in the total electricity generation data provided by EIA.
Total electricity sold by the utilities includes utility net generation plus electricity
purchased from non-utility producers minus utility loss. Utility net generation is the utility total
generation minus utility station use. In general, total utility generation has been decreasing in
recent years. As shown in Table 2, the four electric utilities in Hawaii generated (including station
use) about 5,799 GWH of electricity in 2015, decreased 0.7 percent or 41 GWH from the previous
year. From 2005 to 2015, utility total generation decreased about 2.3 percent per year on average.
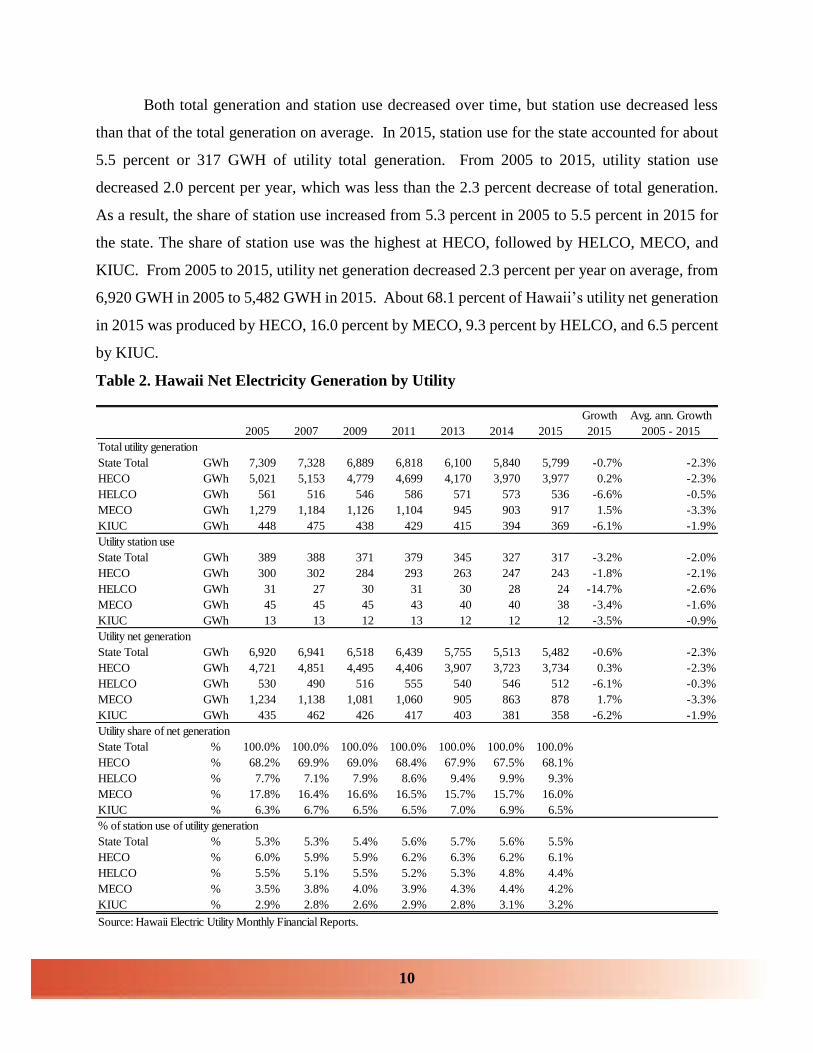
10
Both total generation and station use decreased over time, but station use decreased less
than that of the total generation on average. In 2015, station use for the state accounted for about
5.5 percent or 317 GWH of utility total generation. From 2005 to 2015, utility station use
decreased 2.0 percent per year, which was less than the 2.3 percent decrease of total generation.
As a result, the share of station use increased from 5.3 percent in 2005 to 5.5 percent in 2015 for
the state. The share of station use was the highest at HECO, followed by HELCO, MECO, and
KIUC. From 2005 to 2015, utility net generation decreased 2.3 percent per year on average, from
6,920 GWH in 2005 to 5,482 GWH in 2015. About 68.1 percent of Hawaii’s utility net generation
in 2015 was produced by HECO, 16.0 percent by MECO, 9.3 percent by HELCO, and 6.5 percent
by KIUC.
Table 2. Hawaii Net Electricity Generation by Utility
Growth Avg. ann. Growth
2005 2007 2009 2011 2013 2014 2015 2015 2005 - 2015
Total utility generation
State Total GWh 7,309 7,328 6,889 6,818 6,100 5,840 5,799 -0.7% -2.3%
HECO GWh 5,021 5,153 4,779 4,699 4,170 3,970 3,977 0.2% -2.3%
HELCO GWh 561 516 546 586 571 573 536 -6.6% -0.5%
MECO GWh 1,279 1,184 1,126 1,104 945 903 917 1.5% -3.3%
KIUC GWh 448 475 438 429 415 394 369 -6.1% -1.9%
Utility station use
State Total GWh 389 388 371 379 345 327 317 -3.2% -2.0%
HECO GWh 300 302 284 293 263 247 243 -1.8% -2.1%
HELCO GWh 31 27 30 31 30 28 24 -14.7% -2.6%
MECO GWh 45 45 45 43 40 40 38 -3.4% -1.6%
KIUC GWh 13 13 12 13 12 12 12 -3.5% -0.9%
Utility net generation
State Total GWh 6,920 6,941 6,518 6,439 5,755 5,513 5,482 -0.6% -2.3%
HECO GWh 4,721 4,851 4,495 4,406 3,907 3,723 3,734 0.3% -2.3%
HELCO GWh 530 490 516 555 540 546 512 -6.1% -0.3%
MECO GWh 1,234 1,138 1,081 1,060 905 863 878 1.7% -3.3%
KIUC GWh 435 462 426 417 403 381 358 -6.2% -1.9%
Utility share of net generation
State Total % 100.0% 100.0% 100.0% 100.0% 100.0% 100.0% 100.0%
HECO % 68.2% 69.9% 69.0% 68.4% 67.9% 67.5% 68.1%
HELCO % 7.7% 7.1% 7.9% 8.6% 9.4% 9.9% 9.3%
MECO % 17.8% 16.4% 16.6% 16.5% 15.7% 15.7% 16.0%
KIUC % 6.3% 6.7% 6.5% 6.5% 7.0% 6.9% 6.5%
% of station use of utility generation
State Total % 5.3% 5.3% 5.4% 5.6% 5.7% 5.6% 5.5%
HECO % 6.0% 5.9% 5.9% 6.2% 6.3% 6.2% 6.1%
HELCO % 5.5% 5.1% 5.5% 5.2% 5.3% 4.8% 4.4%
MECO % 3.5% 3.8% 4.0% 3.9% 4.3% 4.4% 4.2%
KIUC % 2.9% 2.8% 2.6% 2.9% 2.8% 3.1% 3.2%
Source: Hawaii Electric Utility Monthly Financial Reports.

11
Table 3 shows that electricity purchased by the utilities increased from 4,202 GWH in 2005
to 4,402 GWH in 2015, an increase of 200 GWH. This increase is in contrast to the 1,438 GWH
decrease in net utility generation during the same period. Electricity purchased decreased from
2005 to 2011 and then increased from 2011 to 2015. In 2015, electricity purchased increased 0.7
percent or 31 GWH, over the previous year. Electricity purchased plus utility net generation is the
electricity net to system. The share of purchased electricity, as a percentage of the total net to
system, increased from 37.8 percent in 2005 to 44.5 percent in 2015.
Table 3. Hawaii Electricity Sales by Utility
Growth Avg. ann. Growth
2005 2007 2009 2011 2013 2014 2015 2015 2005 - 2015
Electricity purchased
State Total GWh 4,202 4,255 4,154 4,046 4,244 4,371 4,402 0.7% 0.5%
HECO GWh 3,383 3,238 3,267 3,187 3,281 3,379 3,352 -0.8% -0.1%
HELCO GWh 688 769 669 631 619 595 631 6.2% -0.9%
MECO GWh 97 221 185 191 296 333 325 -2.4% 12.8%
KIUC GWh 35 27 34 37 49 65 94 45.7% 10.4%
Electricity net to system
State Total GWh 11,122 11,195 10,672 10,485 9,999 9,884 9,884 0.0% -1.2%
HECO GWh 8,104 8,089 7,762 7,594 7,187 7,102 7,086 -0.2% -1.3%
HELCO GWh 1,217 1,259 1,184 1,187 1,159 1,140 1,143 0.3% -0.6%
MECO GWh 1,331 1,359 1,266 1,252 1,201 1,196 1,203 0.6% -1.0%
KIUC GWh 470 489 460 453 452 446 452 1.3% -0.4%
Utility loss
State Total GWh 584 610 546 524 498 478 496 3.7% -1.6%
HECO GWh 383 414 384 352 329 320 332 3.7% -1.4%
HELCO GWh 101 96 64 83 83 78 79 1.1% -2.5%
MECO GWh 79 79 74 70 66 64 66 2.0% -1.8%
KIUC GWh 21 22 24 19 20 16 19 22.9% -0.7%
Total electricity sold
State Total GWh 10,539 10,585 10,126 9,962 9,501 9,406 9,389 -0.2% -1.1%
HECO GWh 7,721 7,675 7,378 7,242 6,859 6,782 6,754 -0.4% -1.3%
HELCO GWh 1,116 1,163 1,120 1,104 1,076 1,063 1,065 0.2% -0.5%
MECO GWh 1,252 1,280 1,192 1,181 1,135 1,132 1,138 0.5% -1.0%
KIUC GWh 449 467 437 435 431 430 432 0.5% -0.4%
Share of purchased of net to system
State Total % 37.8% 38.0% 38.9% 38.6% 42.4% 44.2% 44.5%
HECO % 41.7% 40.0% 42.1% 42.0% 45.6% 47.6% 47.3%
HELCO % 56.5% 61.1% 56.5% 53.2% 53.4% 52.1% 55.2%
MECO % 7.3% 16.2% 14.6% 15.3% 24.7% 27.8% 27.0%
KIUC % 7.4% 5.5% 7.5% 8.1% 10.8% 14.5% 20.8%
Share of loss of net to system
State Total % 5.2% 5.5% 5.1% 5.0% 5.0% 4.8% 5.0%
HECO % 4.7% 5.1% 4.9% 4.6% 4.6% 4.5% 4.7%
HELCO % 8.3% 7.6% 5.4% 7.0% 7.2% 6.8% 6.9%
MECO % 5.9% 5.8% 5.8% 5.6% 5.5% 5.4% 5.5%
KIUC % 4.5% 4.5% 5.2% 4.1% 4.5% 3.6% 4.3%
Source: Hawaii Electric Utility Monthly Financial Reports.
12
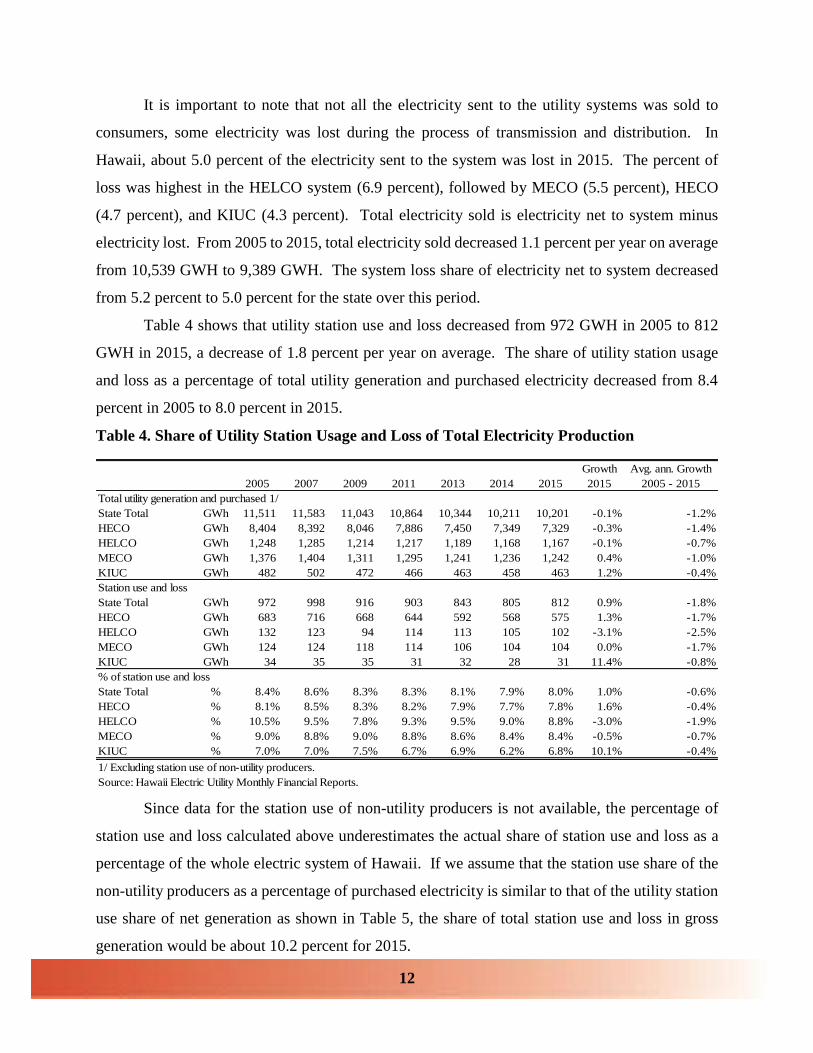
It is important to note that not all the electricity sent to the utility systems was sold to
consumers, some electricity was lost during the process of transmission and distribution. In
Hawaii, about 5.0 percent of the electricity sent to the system was lost in 2015. The percent of
loss was highest in the HELCO system (6.9 percent), followed by MECO (5.5 percent), HECO
(4.7 percent), and KIUC (4.3 percent). Total electricity sold is electricity net to system minus
electricity lost. From 2005 to 2015, total electricity sold decreased 1.1 percent per year on average
from 10,539 GWH to 9,389 GWH. The system loss share of electricity net to system decreased
from 5.2 percent to 5.0 percent for the state over this period.
Table 4 shows that utility station use and loss decreased from 972 GWH in 2005 to 812
GWH in 2015, a decrease of 1.8 percent per year on average. The share of utility station usage
and loss as a percentage of total utility generation and purchased electricity decreased from 8.4
percent in 2005 to 8.0 percent in 2015.
Table 4. Share of Utility Station Usage and Loss of Total Electricity Production
Since data for the station use of non-utility producers is not available, the percentage of
station use and loss calculated above underestimates the actual share of station use and loss as a
percentage of the whole electric system of Hawaii. If we assume that the station use share of the
non-utility producers as a percentage of purchased electricity is similar to that of the utility station
use share of net generation as shown in Table 5, the share of total station use and loss in gross
generation would be about 10.2 percent for 2015.
Growth Avg. ann. Growth
2005 2007 2009 2011 2013 2014 2015 2015 2005 - 2015
Total utility generation and purchased 1/
State Total GWh 11,511 11,583 11,043 10,864 10,344 10,211 10,201 -0.1% -1.2%
HECO GWh 8,404 8,392 8,046 7,886 7,450 7,349 7,329 -0.3% -1.4%
HELCO GWh 1,248 1,285 1,214 1,217 1,189 1,168 1,167 -0.1% -0.7%
MECO GWh 1,376 1,404 1,311 1,295 1,241 1,236 1,242 0.4% -1.0%
KIUC GWh 482 502 472 466 463 458 463 1.2% -0.4%
Station use and loss
State Total GWh 972 998 916 903 843 805 812 0.9% -1.8%
HECO GWh 683 716 668 644 592 568 575 1.3% -1.7%
HELCO GWh 132 123 94 114 113 105 102 -3.1% -2.5%
MECO GWh 124 124 118 114 106 104 104 0.0% -1.7%
KIUC GWh 34 35 35 31 32 28 31 11.4% -0.8%
% of station use and loss
State Total % 8.4% 8.6% 8.3% 8.3% 8.1% 7.9% 8.0% 1.0% -0.6%
HECO % 8.1% 8.5% 8.3% 8.2% 7.9% 7.7% 7.8% 1.6% -0.4%
HELCO % 10.5% 9.5% 7.8% 9.3% 9.5% 9.0% 8.8% -3.0% -1.9%
MECO % 9.0% 8.8% 9.0% 8.8% 8.6% 8.4% 8.4% -0.5% -0.7%
KIUC % 7.0% 7.0% 7.5% 6.7% 6.9% 6.2% 6.8% 10.1% -0.4%
1/ Excluding station use of non-utility producers.
Source: Hawaii Electric Utility Monthly Financial Reports.

13
Hawaii’s gross electricity generation in 2015 was estimated to be about 10,450 GWH. In
2015, about 72 percent of the gross generation was produced by the HECO system (including both
utility and non-utility producers). HELCO accounted for about 11 percent of gross generation,
MECO about 12 percent, and KIUC about 4 percent. From 2005 to 2015, each respective county
utility’s share of gross generation remained fairly stable.
Table 5. Share of Total Station Usage and Loss of Total Electricity Production
Growth Avg. ann. Growth
2005 2007 2009 2011 2013 2014 2015 2015 2005 - 2015
Station use of non-utility
State Total GWh 244 239 239 240 254 256 249 -2.7% 0.2%
HECO GWh 202 190 194 198 207 211 205 -2.8% 0.1%
HELCO GWh 38 40 37 33 33 29 28 -3.1% -3.0%
MECO GWh 3 8 7 8 13 15 14 -7.0% 14.8%
KIUC GWh 1 1 1 1 1 2 3 49.8% 11.6%
Total gross generation 1/
State Total GWh 11,755 11,822 11,282 11,104 10,598 10,467 10,450 -0.2% -1.2%
HECO GWh 8,606 8,582 8,240 8,085 7,657 7,560 7,534 -0.3% -1.3%
HELCO GWh 1,286 1,325 1,251 1,250 1,222 1,197 1,195 -0.2% -0.7%
MECO GWh 1,379 1,413 1,318 1,302 1,254 1,251 1,255 0.4% -0.9%
KIUC GWh 484 503 473 467 465 460 466 1.4% -0.4%
Share of gross generation
State Total % 100% 100% 100% 100% 100% 100% 100% 0.0% 0.0%
HECO % 73% 73% 73% 73% 72% 72% 72% -0.2% -0.2%
HELCO % 11% 11% 11% 11% 12% 11% 11% 0.0% 0.4%
MECO % 12% 12% 12% 12% 12% 12% 12% 0.5% 0.2%
KIUC % 4% 4% 4% 4% 4% 4% 4% 1.5% 0.8%
Total station use and loss
State Total GWh 1,217 1,237 1,156 1,143 1,097 1,061 1,061 0.0% -1.4%
HECO GWh 885 906 863 842 799 778 780 0.2% -1.3%
HELCO GWh 169 162 131 147 146 134 130 -3.1% -2.6%
MECO GWh 127 133 126 121 119 119 118 -0.9% -0.8%
KIUC GWh 35 36 36 32 33 30 34 13.9% -0.1%
% of station use and loss
State Total % 10.3% 10.5% 10.2% 10.3% 10.3% 10.1% 10.2% 0.2% -0.2%
HECO % 10.3% 10.6% 10.5% 10.4% 10.4% 10.3% 10.3% 0.5% 0.1%
HELCO % 13.2% 12.2% 10.5% 11.7% 12.0% 11.2% 10.9% -2.9% -1.9%
MECO % 9.2% 9.4% 9.5% 9.3% 9.5% 9.5% 9.4% -1.2% 0.2%
KIUC % 7.2% 7.1% 7.7% 6.9% 7.2% 6.6% 7.4% 12.4% 0.2%
1/ Including station use of non-utility producers. Estimated by DBEDT
Source: Hawaii Electric Utility Monthly Financial Reports.

14
3. Electricity Generation by Sources
Hawaii’s electricity generation depends heavily on imported petroleum as the major fuel
source. Before 1990, Hawaii’s electricity was almost all generated from petroleum products.
However, since 1990, electricity generated from waste, coal, wind, and geothermal energy became
more significant. Nevertheless, petroleum remains the dominant fuel in Hawaii’s electricity
generation and is the primary driver for the changes of electricity prices in Hawaii.
Table 6. Electricity Generation by Source: Total Electric Power Industry
From 1990 to 2014, the share of petroleum generated electricity in Hawaii (including both
utility and non-utility producers) decreased from 90.0 percent to 67.9 percent; the share of coal
generated electricity increased from 0.0 percent to 14.8 percent; the share of wind generated
electricity increased from 0.3 percent to 5.9 percent; the share of geothermal electricity increased
from 0.0 to 2.5 percent; and the share of biomass decreased from 8.7 percent to 3.3 percent (Table
6). In 2014, total renewable electricity (excluding customer-sited solar) accounted for about 12.7
percent of total electricity generation.
Total
Electricity % of Total Electricity Generation
Generation Other
Year GWH Petroleum Coal Gases 1/ Biomass Wood Geothermal Hydro Wind Solar 2/ Other
1990 9,703 90.0 0.0 0.2 8.7 - - 0.8 0.3 - -
1991 8,703 88.6 0.1 0.6 9.5 - - 0.8 0.4 - -
1992 9,844 84.7 5.7 0.6 8.2 0.0 0.0 0.6 0.2 - -
1993 9,944 74.4 14.9 0.6 7.8 0.0 1.5 0.6 0.2 - -
1994 10,109 75.6 13.1 0.7 7.2 0.0 1.8 1.4 0.2 - -
1995 10,304 74.5 15.2 0.7 6.2 0.0 2.3 0.9 0.2 - 0.0
1996 10,628 74.9 15.5 0.6 5.6 0.0 2.3 1.0 0.2 - -
1997 10,312 74.6 15.3 0.6 5.9 0.0 2.4 1.1 0.2 - -
1998 10,228 76.8 14.0 0.6 4.9 - 2.3 1.2 0.2 - -
1999 10,404 76.8 13.8 0.5 5.5 - 2.0 1.1 0.2 - -
2000 10,593 76.0 14.9 0.4 5.1 - 2.5 1.0 0.2 - -
2001 10,633 77.3 15.1 0.4 2.7 - 1.9 0.9 0.0 - 1.6
2002 11,663 81.2 13.3 0.3 2.5 - 0.6 0.8 0.0 - 1.2
2003 10,976 77.5 15.0 0.4 3.2 - 1.6 0.8 0.0 - 1.6
2004 11,410 78.4 14.1 0.4 2.9 - 1.9 0.8 0.1 - 1.5
2005 11,523 78.7 14.2 0.4 2.7 - 1.9 0.8 0.1 - 1.3
2006 11,559 78.3 13.4 0.4 2.8 - 1.8 1.0 0.7 - 1.5
2007 11,533 77.3 13.7 0.4 2.5 - 2.0 0.8 2.1 - 1.3
2008 11,376 76.2 14.5 0.3 2.7 - 2.1 0.7 2.1 0.00 1.4
2009 11,011 75.3 13.6 0.2 2.6 - 1.5 1.0 2.3 0.01 3.5
2010 10,836 74.6 14.3 0.2 2.6 0.0 1.9 0.6 2.4 0.02 3.4
2011 10,723 73.9 13.3 0.3 2.9 - 2.1 0.9 3.2 0.03 3.4
2012 10,469 71.5 14.7 0.4 2.7 - 2.5 1.1 3.6 0.04 3.5
2013 10,267 70.3 13.7 0.4 3.2 - 2.7 0.8 4.9 0.19 3.8
2014 10,204 67.9 14.8 0.6 3.3 - 2.5 0.9 5.7 0.38 4.0
1/ Other gases includes blast furnace gas, propane gas, and other manufactured and waste gases derived from fossil fuels.
2/ Does not include customer-sited solar.
Source: Energy Information Administration, State Energy Data System
15
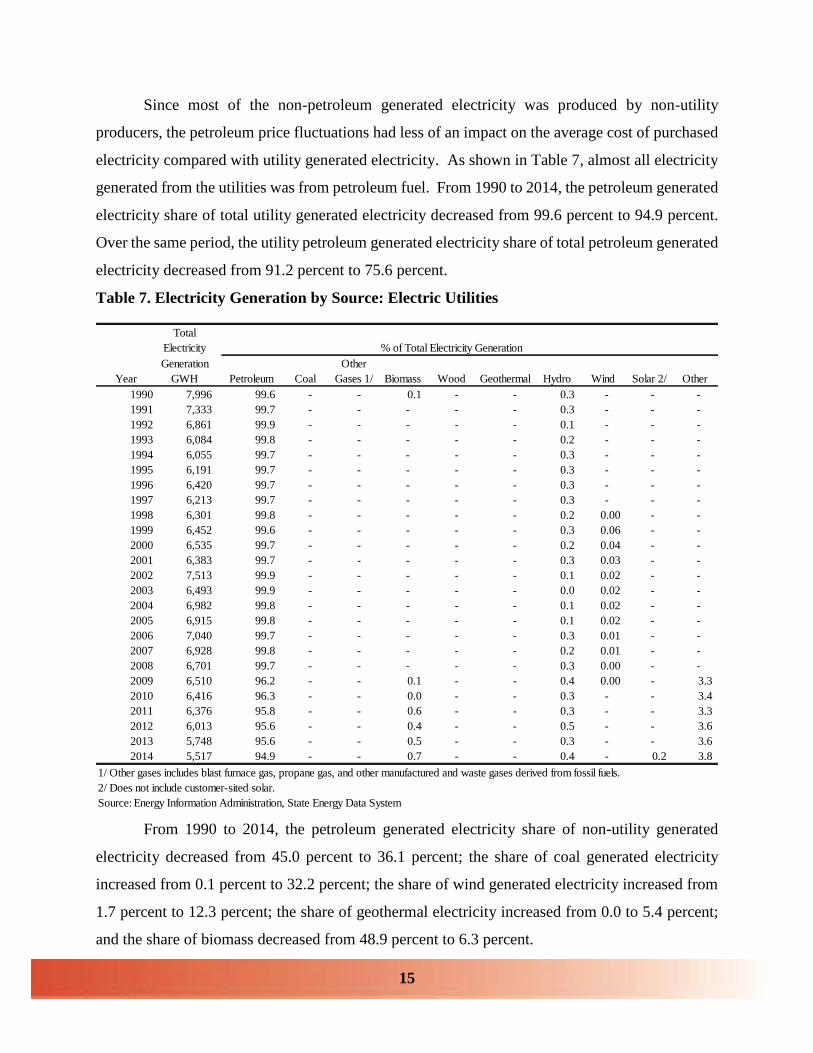
Since most of the non-petroleum generated electricity was produced by non-utility
producers, the petroleum price fluctuations had less of an impact on the average cost of purchased
electricity compared with utility generated electricity. As shown in Table 7, almost all electricity
generated from the utilities was from petroleum fuel. From 1990 to 2014, the petroleum generated
electricity share of total utility generated electricity decreased from 99.6 percent to 94.9 percent.
Over the same period, the utility petroleum generated electricity share of total petroleum generated
electricity decreased from 91.2 percent to 75.6 percent.
Table 7. Electricity Generation by Source: Electric Utilities
From 1990 to 2014, the petroleum generated electricity share of non-utility generated
electricity decreased from 45.0 percent to 36.1 percent; the share of coal generated electricity
increased from 0.1 percent to 32.2 percent; the share of wind generated electricity increased from
1.7 percent to 12.3 percent; the share of geothermal electricity increased from 0.0 to 5.4 percent;
and the share of biomass decreased from 48.9 percent to 6.3 percent.
Total
Electricity % of Total Electricity Generation
Generation Other
Year GWH Petroleum Coal Gases 1/ Biomass Wood Geothermal Hydro Wind Solar 2/ Other
1990 7,996 99.6 - - 0.1 - - 0.3 - - -
1991 7,333 99.7 - - - - - 0.3 - - -
1992 6,861 99.9 - - - - - 0.1 - - -
1993 6,084 99.8 - - - - - 0.2 - - -
1994 6,055 99.7 - - - - - 0.3 - - -
1995 6,191 99.7 - - - - - 0.3 - - -
1996 6,420 99.7 - - - - - 0.3 - - -
1997 6,213 99.7 - - - - - 0.3 - - -
1998 6,301 99.8 - - - - - 0.2 0.00 - -
1999 6,452 99.6 - - - - - 0.3 0.06 - -
2000 6,535 99.7 - - - - - 0.2 0.04 - -
2001 6,383 99.7 - - - - - 0.3 0.03 - -
2002 7,513 99.9 - - - - - 0.1 0.02 - -
2003 6,493 99.9 - - - - - 0.0 0.02 - -
2004 6,982 99.8 - - - - - 0.1 0.02 - -
2005 6,915 99.8 - - - - - 0.1 0.02 - -
2006 7,040 99.7 - - - - - 0.3 0.01 - -
2007 6,928 99.8 - - - - - 0.2 0.01 - -
2008 6,701 99.7 - - - - - 0.3 0.00 - -
2009 6,510 96.2 - - 0.1 - - 0.4 0.00 - 3.3
2010 6,416 96.3 - - 0.0 - - 0.3 - - 3.4
2011 6,376 95.8 - - 0.6 - - 0.3 - - 3.3
2012 6,013 95.6 - - 0.4 - - 0.5 - - 3.6
2013 5,748 95.6 - - 0.5 - - 0.3 - - 3.6
2014 5,517 94.9 - - 0.7 - - 0.4 - 0.2 3.8
1/ Other gases includes blast furnace gas, propane gas, and other manufactured and waste gases derived from fossil fuels.
2/ Does not include customer-sited solar.
Source: Energy Information Administration, State Energy Data System

16
The increased share of non-petroleum generated electricity, especially coal-fired
electricity, kept the growth rate of purchased electricity costs low. For example, the average cost
of coal-fired electricity purchased by HECO was only about 10 cents per kWh and this was
substantially below the average price of HECO electricity.
Table 8. Electricity Generation by Source: IPP & CHP
Based on the most recent data available from EIA, the generating capacity for Hawaii’s
total electric power industry increased from 1,976 MW in 1990 to 2,924 MW in 2014, an increase
of 1.6 percent per year on average. Coal-fired capacity increased from 24 MW to 203 MW or 9.3
percent per year over the period, wind capacity increased from 23 MW to 206 MW or 9.5 percent
per year on average, petroleum generation capacity increased from 1,692 MW to 2,081 MW or an
average of 0.9 percent over the period, and biomass capacity increased from 211 MW to 257 MW
or a 0.9 percent average per year (Table 9).
Total
Electricity
Generation Other
Year GWH Petroleum Coal Gases 1/ Biomass Wood Geothermal Hydro Wind Solar 2/ Other
1990 1,707 45.0 0.1 0.9 48.9 - - 3.3 1.7 - -
1991 1,370 29.3 0.6 3.8 60.1 - - 3.7 2.6 - -
1992 2,983 49.7 18.7 2.1 27.0 0.0 0.1 1.7 0.8 - -
1993 3,860 34.3 38.3 1.6 20.1 0.0 3.9 1.1 0.6 - -
1994 4,054 39.6 32.7 1.6 18.0 0.0 4.6 3.0 0.5 - -
1995 4,113 36.6 38.0 1.7 15.5 0.0 5.7 2.0 0.5 - 0.1
1996 4,208 37.1 39.0 1.4 14.1 0.0 5.8 2.0 0.5 - -
1997 4,100 36.5 38.4 1.6 14.8 0.0 6.0 2.4 0.4 - -
1998 3,927 39.8 36.5 1.5 12.8 - 6.0 2.7 0.5 - -
1999 3,952 39.6 36.4 1.3 14.6 - 5.3 2.4 0.3 - -
2000 4,059 37.8 38.9 1.0 13.3 - 6.5 2.2 0.4 - -
2001 4,250 43.8 37.8 0.9 6.8 - 4.9 1.9 0.0 - 4.0
2002 4,150 47.3 37.2 1.0 7.1 - 1.8 2.1 0.0 - 3.5
2003 4,483 44.9 36.7 0.9 7.7 - 4.0 2.0 0.0 - 3.8
2004 4,428 44.6 36.2 1.1 7.4 - 4.8 1.9 0.1 - 3.9
2005 4,608 47.0 35.4 0.9 6.7 - 4.8 1.9 0.1 - 3.2
2006 4,519 45.1 34.3 0.9 7.2 - 4.7 2.1 1.7 - 3.9
2007 4,605 43.5 34.3 1.0 6.2 - 5.0 1.7 5.2 - 3.2
2008 4,676 42.5 35.2 0.8 6.5 - 5.0 1.4 5.1 0.00 3.4
2009 4,501 45.0 33.3 0.5 6.2 - 3.7 1.9 5.6 0.03 3.7
2010 4,420 43.2 35.0 0.5 6.4 0.0 4.5 1.2 5.9 0.04 3.3
2011 4,347 41.8 32.8 0.8 6.3 - 5.2 1.7 7.8 0.08 3.6
2012 4,457 39.0 34.5 1.1 5.8 - 5.9 1.9 8.5 0.10 3.3
2013 4,519 38.2 31.1 0.9 6.7 - 6.1 1.3 11.1 0.43 4.2
2014 4,687 36.1 32.2 1.3 6.3 - 5.4 1.5 12.3 0.62 4.1
1/ Other gases includes blast furnace gas, propane gas, and other manufactured and waste gases derived from fossil fuels.
2/ Does not include customer-sited solar.
Source: Energy Information Administration, State Energy Data System
% of Total Electricity Generation
17
Table 9. Power Generating Capacity by Source: Total Electric Power Industry
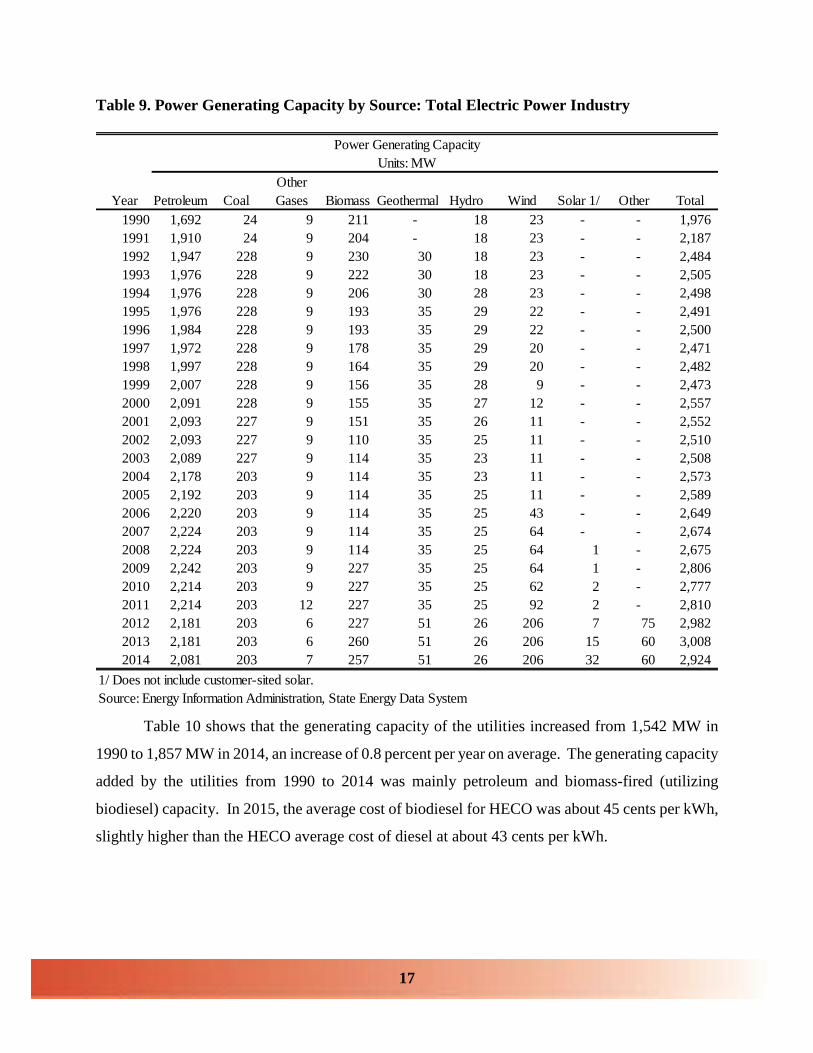
Table 10 shows that the generating capacity of the utilities increased from 1,542 MW in
1990 to 1,857 MW in 2014, an increase of 0.8 percent per year on average. The generating capacity
added by the utilities from 1990 to 2014 was mainly petroleum and biomass-fired (utilizing
biodiesel) capacity. In 2015, the average cost of biodiesel for HECO was about 45 cents per kWh,
slightly higher than the HECO average cost of diesel at about 43 cents per kWh.
Power Generating Capacity
Units: MW
Other
Year Petroleum Coal Gases Biomass Geothermal Hydro Wind Solar 1/ Other Total
1990 1,692 24 9 211 - 18 23 - - 1,976
1991 1,910 24 9 204 - 18 23 - - 2,187
1992 1,947 228 9 230 30 18 23 - - 2,484
1993 1,976 228 9 222 30 18 23 - - 2,505
1994 1,976 228 9 206 30 28 23 - - 2,498
1995 1,976 228 9 193 35 29 22 - - 2,491
1996 1,984 228 9 193 35 29 22 - - 2,500
1997 1,972 228 9 178 35 29 20 - - 2,471
1998 1,997 228 9 164 35 29 20 - - 2,482
1999 2,007 228 9 156 35 28 9 - - 2,473
2000 2,091 228 9 155 35 27 12 - - 2,557
2001 2,093 227 9 151 35 26 11 - - 2,552
2002 2,093 227 9 110 35 25 11 - - 2,510
2003 2,089 227 9 114 35 23 11 - - 2,508
2004 2,178 203 9 114 35 23 11 - - 2,573
2005 2,192 203 9 114 35 25 11 - - 2,589
2006 2,220 203 9 114 35 25 43 - - 2,649
2007 2,224 203 9 114 35 25 64 - - 2,674
2008 2,224 203 9 114 35 25 64 1 - 2,675
2009 2,242 203 9 227 35 25 64 1 - 2,806
2010 2,214 203 9 227 35 25 62 2 - 2,777
2011 2,214 203 12 227 35 25 92 2 - 2,810
2012 2,181 203 6 227 51 26 206 7 75 2,982
2013 2,181 203 6 260 51 26 206 15 60 3,008
2014 2,081 203 7 257 51 26 206 32 60 2,924
1/ Does not include customer-sited solar.
Source: Energy Information Administration, State Energy Data System

18
Table 10. Power Generating Capacity by Source: Electric Utilities
Table 11 shows that the generating capacity of the non-utility producers in Hawaii
increased from 435 MW in 1990 to 1,067 MW in 2014, an increase of 3.8 percent per year on
average. The growth rate of wind capacity was the highest during this period at 9.5 percent on
average per year. Wind was followed by coal-fired capacity at 9.3 percent per year and petroleum
capacity at 4.0 percent per year. Geothermal capacity increased from zero to 51 MW, but the
biomass capacity decreased from 211 MW to 144 MW over the period. The figures do not include
electricity generation from the customer-sited solar systems.
Power Generating Capacity
Units: MW
Other
Year Petroleum Coal Gases Biomass Geothermal Hydro Wind Solar 1/ Other Total
1990 1,538 - - - - 3 - - - 1,542
1991 1,574 - - - - 3 - - - 1,577
1992 1,617 - - - - 3 - - - 1,621
1993 1,655 - - - - 3 - - - 1,659
1994 1,655 - - - - 3 - - - 1,659
1995 1,655 - - - - 3 - - - 1,659
1996 1,664 - - - - 3 - - - 1,667
1997 1,652 - - - - 3 - - - 1,655
1998 1,677 - - - - 3 - - - 1,680
1999 1,687 - - - - 3 - - - 1,690
2000 1,705 - - - - 3 2 - - 1,710
2001 1,703 - - - - 3 2 - - 1,708
2002 1,702 - - - - 2 2 - - 1,706
2003 1,702 - - - - 2 2 - - 1,706
2004 1,791 - - - - 2 2 - - 1,795
2005 1,806 - - - - 4 2 - - 1,812
2006 1,833 - - - - 4 2 - - 1,839
2007 1,838 - - - - 4 2 - - 1,844
2008 1,838 - - - - 4 2 - - 1,844
2009 1,856 - - 113 - 4 2 - - 1,975
2010 1,827 - - 113 - 4 - - - 1,944
2011 1,827 - - 113 - 4 - - - 1,945
2012 1,788 - - 113 - 4 - - 39 1,945
2013 1,788 - - 113 - 4 - - 39 1,945
2014 1,688 - - 113 - 4 - 12 39 1,857
1/ Does not include customer-sited solar.
Source: Energy Information Administration, State Energy Data System

19
Table 11. Power Generating Capacity by Source: IPP and CHP
The detailed power generating capacity by county in 2016 is provided in Table 12.
Currently, the state of Hawaii has about 2,408.8 MW firm capacity (guaranteed available at a given
time); 1,726.5 MW in Honolulu, 278.9 MW in Hawaii County, 278.1 MW in Maui County, and
125.3 MW in Kauai County. About 83.0 percent of the firm capacity use petroleum, 7.5 percent
use coal, and 8.0 percent use biofuel or waste.
Power Generating Capacity
Units: MW
Other
Year Petroleum Coal Gases Biomass Geothermal Hydro Wind Solar 1/ Other Total
1990 154 24 9 211 - 15 23 - - 435
1991 337 24 9 204 - 15 23 - - 610
1992 329 228 9 230 30 15 23 - - 863
1993 320 228 9 222 30 15 23 - - 846
1994 320 228 9 206 30 24 23 - - 839
1995 320 228 9 193 35 26 22 - - 832
1996 320 228 9 193 35 26 22 - - 833
1997 320 228 9 178 35 26 20 - - 816
1998 320 228 9 164 35 26 20 - - 802
1999 320 228 9 156 35 25 9 - - 782
2000 386 228 9 155 35 24 10 - - 847
2001 390 227 9 151 35 23 9 - - 844
2002 391 227 9 110 35 23 9 - - 804
2003 387 227 9 114 35 21 9 - - 802
2004 387 203 9 114 35 21 9 - - 778
2005 386 203 9 114 35 21 9 - - 777
2006 387 203 9 114 35 21 41 - - 810
2007 386 203 9 114 35 21 62 - - 830
2008 386 203 9 114 35 21 62 1 - 831
2009 386 203 9 114 35 21 62 1 - 831
2010 387 203 9 114 35 21 62 2 - 833
2011 386 203 12 114 35 21 92 2 - 865
2012 393 203 6 114 51 22 206 7 36 1,037
2013 393 203 6 147 51 22 206 15 21 1,064
2014 393 203 7 144 51 22 206 20 21 1,067
1/ Does not include customer-sited solar.
Source: Energy Information Administration, State Energy Data System

20
The state also installed about 267.0 MW non-firm capacity, mostly by non-utility
producers; 138.1 MW in Honolulu, 47.5 MW in Hawaii County, 73.7 MW in Maui County, and
7.7 MW in Kauai County. Wind accounted for about 75.7 percent of the non-firm capacity;
followed by hydro at 9.2 percent, petroleum at 6.9 percent, and solar at 4.6 percent. In addition,
about 491.4 MW customer-sited solar was installed in Hawaii; 332.0 MW in Honolulu, 70.1 MW
in Hawaii County, 72.4 MW in Maui County, and 16.9 MW in Kauai County. Most of the
electricity generated by these systems were directly consumed by the consumers and not included
in the utility electricity sales.
Table 12. Power Generating Capacity by Type in 2016
Other Biofuel
Petroleum Coal Gases Waste Geothermal Hydro Wind Solar Total
State Total MW 2,018.9 180.0 9.6 192.5 34.6 26.0 202.1 12.2 2,675.8
State Total Firm MW 2,000.4 180.0 - 192.5 34.6 1.3 - - 2,408.8
State Total Non-Firm MW 18.5 - 9.6 - - 24.7 202.1 12.2 267.0
State Total Customer-Sited Solar - - - - - - - 491.4 491.4
State Total MW 2,018.9 180.0 9.6 192.5 34.6 26.0 202.1 12.2 2,675.8
Honolulu 1,376.5 180.0 9.6 188.5 - - 99.0 11.0 1,864.6
Hawaii 244.3 - - - 34.6 16.5 31.1 - 326.4
Maui 274.1 - - 4.0 - 0.5 72.0 1.2 351.8
Kauai 124.0 - - - - 9.0 - - 133.0
State Total Firm MW 2,000.4 180.0 - 192.5 34.6 1.3 - - 2,408.8
Honolulu 1,358.0 180.0 - 188.5 - - - - 1,726.5
Hawaii 244.3 - - - 34.6 - - - 278.9
Maui 274.1 - - 4.0 - - - - 278.1
Kauai 124.0 - - - - 1.3 - - 125.3
State Total Non-Firm MW 18.5 - 9.6 - - 24.7 202.1 12.2 267.0
Honolulu 18.5 - 9.6 - - - 99.0 11.0 138.1
Hawaii - - - - - 16.5 31.1 - 47.5
Maui - - - - - 0.5 72.0 1.2 73.7
Kauai - - - - - 7.7 - - 7.7
State Total Customer-Sited Solar - - - - - - - 491.4 491.4
Honolulu - - - - - - - 332.0 332.0
Hawaii - - - - - - - 70.1 70.1
Maui - - - - - - - 72.4 72.4
Kauai - - - - - - - 16.9 16.9
Source: Power Facts provided by HECO and KIUC.

21
The generating units in the electric power industry have multiple functions. Some
generating units are used to serve base load needs, while others are used to serve peak loads. Units
serving the base load needs have more average operating hours per year, and the average cost per
kWh is normally lower than the average cost of the units serving peak loads.
Table 13. Average Operating Hours: Total Electric Power Industry
Average Operating Hours
Units: Hours/Year
Other
Year Petroleum Coal Gases Biomass Geothermal Hydro Wind Solar 1/ Total
1990 5,163 100 1,796 3,990 - 4,418 1,245 - 4,909
1991 4,038 320 5,720 4,044 - 3,944 1,580 - 3,979
1992 4,281 2,443 6,933 3,508 71 3,396 1,006 - 3,964
1993 3,743 6,493 7,008 3,500 5,075 3,125 973 - 3,970
1994 3,868 5,824 7,302 3,553 6,177 5,052 902 - 4,047
1995 3,887 6,853 7,701 3,308 6,701 3,384 932 - 4,136
1996 4,014 7,213 6,707 3,066 6,914 3,600 1,023 - 4,252
1997 3,899 6,913 7,265 3,403 7,011 3,950 792 - 4,173
1998 3,931 6,299 6,716 3,073 6,774 4,196 952 - 4,121
1999 3,983 6,322 5,501 3,696 6,024 4,046 1,783 - 4,208
2000 3,851 6,924 4,686 3,473 7,487 3,832 1,417 - 4,143
2001 3,929 7,069 4,206 1,905 5,903 3,875 193 - 4,167
2002 4,523 6,810 4,535 2,696 2,079 3,803 147 - 4,647
2003 4,070 7,243 4,472 3,045 5,094 3,935 143 - 4,377
2004 4,107 7,900 5,323 2,884 6,094 4,083 681 - 4,435
2005 4,137 8,034 4,570 2,717 6,331 3,848 603 - 4,451
2006 4,079 7,629 4,751 2,857 6,065 4,803 1,853 - 4,364
2007 4,008 7,778 5,025 2,502 6,568 3,694 3,722 - 4,313
2008 3,898 8,116 4,286 2,653 6,695 3,374 3,750 18 4,253
2009 3,697 7,390 2,483 1,253 4,788 4,506 3,929 1,390 3,924
2010 3,653 7,613 2,435 1,249 5,731 2,817 4,212 885 3,902
2011 3,579 7,015 2,889 1,378 6,397 3,741 3,721 1,633 3,817
2012 3,431 7,573 7,839 1,239 5,118 4,373 1,840 640 3,511
2013 3,312 6,915 6,888 1,265 5,389 2,988 2,448 1,281 3,413
2014 3,328 7,444 8,639 1,298 4,977 3,591 2,814 1,219 3,490
1/ Does not include customer-sited solar.
Source: Energy Information Administration, State Energy Data System

22
For the total electric power industry in 2014, other gases-fueled units had the highest
average operating hours at 8,639 hours per year, followed by coal-fired units at 7,444 hours per
year, and geothermal units at 4,977 hours per year (Table 13). The coal and geothermal units were
used to serve base load needs. Hydro and petroleum units have average operating hours of around
3,300-3,600 hours per year, similar to the average operating hours of all units at 3,490 hours per
year. Biomass units have relatively low average operating hours because the biodiesel units at
HECO are used to serve peak loads. The low average operating hours of solar units is due to the
lower daily solar generating window.
Table 14. Average Operating Hours: Electric Utilities
Average Operating Hours
Units: Hours/Year
Other
Year Petroleum Coal Gases Biomass Geothermal Hydro Wind Solar 1/ Total
1990 5,180 - - - - 6,789 - - 5,187
1991 4,647 - - - - 6,090 - - 4,650
1992 4,236 - - - - 2,932 - - 4,233
1993 3,667 - - - - 4,105 - - 3,668
1994 3,646 - - - - 5,613 - - 3,650
1995 3,730 - - - - 4,763 - - 3,732
1996 3,848 - - - - 5,333 - - 3,851
1997 3,749 - - - - 5,609 - - 3,753
1998 3,749 - - - - 4,104 - - 3,750
1999 3,811 - - - - 5,625 - - 3,817
2000 3,822 - - - - 5,038 1,325 - 3,821
2001 3,736 - - - - 6,044 1,055 - 3,737
2002 4,408 - - - - 4,267 803 - 4,404
2003 3,813 - - - - 1,039 781 - 3,806
2004 3,892 - - - - 4,862 743 - 3,890
2005 3,823 - - - - 2,292 849 - 3,816
2006 3,828 - - - - 5,914 420 - 3,828
2007 3,761 - - - - 3,682 219 - 3,757
2008 3,636 - - - - 4,468 86 - 3,634
2009 3,374 - - 29 - 7,152 43 - 3,296
2010 3,382 - - 14 - 4,180 - - 3,300
2011 3,342 - - 343 - 4,878 - - 3,279
2012 3,213 - - 191 - 7,059 - - 3,092
2013 3,073 - - 252 1 4,625 - - 2,956
2014 3,101 - - 324 2 5,742 - - 2,972
1/ Does not include customer-sited solar.
Source: Energy Information Administration, State Energy Data System

23
Table 14 and Table 15 compare the average operating hours of utility generating units and
non-utility generating units. For all generating capacity, the average operating hours of utility-
based units decreased from 5,187 hours per year in 1990 to 2,972 hours per year in 2014, a decrease
of 2.3 percent per year on average. In contrast, the average operating hours of non-utility units
increased from 3,925 hours per year in 1990 to 4,392 hours per year in 2014, an increase of 0.5
percent per year on average.
Table 15. Average Operating Hours: IPP and CHP
Average Operating Hours
Units: Hours/Year
Other
Year Petroleum Coal Gases Biomass Geothermal Hydro Wind Solar 1/ Total
1990 5,000 100 1,796 3,962 - 3,875 1,245 - 3,925
1991 1,193 320 5,720 4,044 - 3,453 1,580 - 2,245
1992 4,503 2,443 6,933 3,508 71 3,502 1,006 - 3,458
1993 4,134 6,493 7,008 3,500 5,075 2,900 973 - 4,561
1994 5,011 5,824 7,302 3,553 6,177 4,974 902 - 4,830
1995 4,697 6,853 7,701 3,308 6,701 3,204 932 - 4,941
1996 4,874 7,213 6,707 3,066 6,914 3,372 1,023 - 5,054
1997 4,669 6,913 7,265 3,403 7,011 3,735 792 - 5,023
1998 4,884 6,299 6,716 3,073 6,774 4,208 937 - 4,897
1999 4,890 6,322 5,501 3,696 6,024 3,835 1,373 - 5,051
2000 3,976 6,924 4,686 3,473 7,487 3,681 1,435 - 4,792
2001 4,772 7,069 4,206 1,905 5,903 3,592 1 - 5,036
2002 5,023 6,810 4,535 2,696 2,079 3,762 1 - 5,162
2003 5,202 7,243 4,472 3,045 5,094 4,211 1 - 5,590
2004 5,099 7,900 5,323 2,884 6,094 4,008 668 - 5,691
2005 5,604 8,034 4,570 2,717 6,331 4,144 548 - 5,930
2006 5,267 7,629 4,751 2,857 6,065 4,592 1,923 - 5,579
2007 5,184 7,778 5,025 2,502 6,568 3,696 3,835 - 5,548
2008 5,149 8,116 4,286 2,653 6,695 3,165 3,869 18 5,627
2009 5,251 7,390 2,483 2,466 4,788 4,002 4,054 1,390 5,416
2010 4,932 7,613 2,435 2,472 5,731 2,557 4,212 885 5,306
2011 4,703 7,015 2,889 2,407 6,397 3,516 3,721 1,633 5,025
2012 4,423 7,573 7,839 2,279 5,118 3,875 1,840 640 4,296
2013 4,400 6,915 6,888 2,041 5,389 2,685 2,448 1,281 4,247
2014 4,304 7,444 8,639 2,060 4,977 3,192 2,814 1,428 4,392
1/ Does not include customer-sited solar.
Source: Energy Information Administration, State Energy Data System

24
For petroleum generating capacity, the average operating hours of utility-based units
decreased from 5,180 hours per year in 1990 to 3,101 hours per year in 2014, an average decrease
of 2.1 percent per year. The average operating hours of non-utility units decreased from 5,000
hours per year in 1990 to 4,304 hours per year in 2014, an average decrease of 0.6 percent per
year.
Table 16. Fossil Fuel Consumption by All Electricity Producers
Consumption Consumption Per MWH
Other Other
Petroleum Coal Gases Petroleum Coal Gases
Year BBL ST Billion BTU BBL ST Billion BTU
1990 16,033,262 2,013 211 1.84 0.85 0.01
1993 12,605,395 603,669 1,044 1.70 0.41 0.02
1994 12,933,103 596,431 913 1.69 0.45 0.01
1995 13,034,983 688,499 663 1.70 0.44 0.01
1996 13,451,479 742,026 1,027 1.69 0.45 0.02
1997 13,226,872 754,453 622 1.72 0.48 0.01
1998 13,262,910 638,057 811 1.69 0.44 0.01
1999 13,544,370 646,215 447 1.69 0.45 0.01
2000 13,754,387 691,513 388 1.71 0.44 0.01
2001 13,661,310 717,290 315 1.66 0.45 0.01
2002 15,661,770 706,734 325 1.65 0.46 0.01
2003 13,133,452 751,987 361 1.54 0.46 0.01
2004 13,995,473 702,545 269 1.56 0.44 0.01
2005 14,131,327 703,865 231 1.56 0.43 0.01
2006 14,211,287 674,909 240 1.57 0.44 0.01
2007 13,943,232 689,627 254 1.56 0.44 0.01
2008 13,407,277 746,642 213 1.55 0.45 0.01
2009 12,739,777 663,171 126 1.54 0.44 0.01
2010 12,334,599 733,480 123 1.53 0.47 0.01
2011 12,089,799 709,440 198 1.53 0.50 0.01
2012 11,199,945 756,726 265 1.50 0.49 0.01
2013 10,765,251 701,013 228 1.49 0.50 0.01
2014 10,388,099 743,893 350 1.50 0.49 0.01
Source: Energy Information Administration, State Energy Data System

25
Fossil fuels used to generate electricity in Hawaii consist mainly of petroleum and coal.
As shown in Table 16, for the whole electric power industry, total petroleum used for electricity
generation decreased from about 16.0 million barrels (BBLs) in 1990 to 10.4 million BBLs in
2014, an average decrease of 1.8 percent per year. Decreased petroleum consumption for
electricity generation was due to both a reduction in electricity generated by petroleum and a
reduction in petroleum consumption per kWh of electricity generated. From 1990 to 2014, total
electricity generated by petroleum decreased an average of 1.0 percent per year and petroleum
consumption per MWH of electricity decreased 0.8 percent per year, from 1.84 BBL per MWH in
1990 to 1.50 BBL per MWH in 2014.
Coal used for electricity generation in Hawaii was very limited before 1993. From 1993
to 2014, total coal used for electricity generation increased from 603,669 short tons (STs) to
743,893 STs, an average increase of 1.0 percent per year. During this period, total coal generated
electricity increased 0.1 percent per year, and coal consumption per MWH generated increased 0.9
percent per year on average from 0.41 ST per MWH to 0.49 ST per MWH.
The utilities accounted for about 86 percent of the petroleum used to generate electricity in
Hawaii. As shown in Table 17, petroleum consumption per MWH was fairly stable over the period
analyzed for utility units. From 1990 to 2014, petroleum consumption per MWH decreased only
slightly from 1.73 BBL per MWH to 1.70 BBL per MWH.
For non-utility producers, petroleum consumption per MWH produced decreased
significantly over time. From 1990 to 2014, petroleum consumption per MWH decreased an
average of 4.9 percent per year from 2.95 BBL to 0.89 BBL. In 2014, the per unit petroleum
consumption for non-utility producers was only about 52 percent of the unit consumption by utility
producers.

26
Table 17. Fossil Fuel Consumption by Electric Utility
Consumption Consumption Per MWH
Other Other
Petroleum Coal Gases Petroleum Coal Gases
Year BBL ST Billion BTU BBL ST Billion BTU
1990 13,769,448 - - 1.73 - -
1995 10,712,608 - - 1.73 - -
1996 10,980,227 - - 1.72 - -
1997 10,792,923 - - 1.74 - -
1998 10,864,385 - - 1.73 - -
1999 11,195,221 - - 1.74 - -
2000 11,439,206 - - 1.76 - -
2001 11,055,880 - - 1.74 - -
2002 12,825,449 - - 1.71 - -
2003 11,099,634 - - 1.71 - -
2004 12,046,236 - - 1.73 - -
2005 12,039,252 - - 1.74 - -
2006 12,238,861 - - 1.74 - -
2007 12,027,927 - - 1.74 - -
2008 11,516,852 - - 1.72 - -
2009 10,859,417 - - 1.73 - -
2010 10,601,260 - - 1.72 - -
2011 10,471,897 - - 1.71 - -
2012 9,646,276 - - 1.68 - -
2013 9,267,226 - - 1.69 - -
2014 8,892,659 - - 1.70 - -
Source: Energy Information Administration, State Energy Data System

27
Table 18. Fossil Fuel Consumption by IPP and CHP
Fuel consumption data provided by the EIA is only available at the state level, and the most
recent data available is for 2014. Conversely, data available from the utility MFR includes fuel
consumption by individual utility producers, and the average price of fuel data is available up to
2015. The fuel cost of non-utility producers, however, is not available in the utility MFR.
Consumption Consumption Per MWH
Other Other
Petroleum Coal Gases Petroleum Coal Gases
Year BBL ST Billion BTU BBL ST Billion BTU
1990 2,263,814 2,013 211 2.95 0.85 0.01
1993 1,949,294 603,669 1,044 1.47 0.41 0.02
1994 2,524,020 596,431 913 1.57 0.45 0.01
1995 2,322,375 688,499 663 1.54 0.44 0.01
1996 2,471,252 742,026 1,027 1.58 0.45 0.02
1997 2,433,949 754,453 622 1.63 0.48 0.01
1998 2,398,525 638,057 811 1.53 0.44 0.01
1999 2,349,149 646,215 447 1.50 0.45 0.01
2000 2,315,181 691,513 388 1.51 0.44 0.01
2001 2,605,430 717,290 315 1.40 0.45 0.01
2002 2,836,321 706,734 325 1.44 0.46 0.01
2003 2,033,818 751,987 361 1.01 0.46 0.01
2004 1,949,237 702,545 269 0.99 0.44 0.01
2005 2,092,075 703,865 231 0.97 0.43 0.01
2006 1,972,426 674,909 240 0.97 0.44 0.01
2007 1,915,305 689,627 254 0.96 0.44 0.01
2008 1,890,425 746,642 213 0.95 0.45 0.01
2009 1,880,360 663,171 126 0.93 0.44 0.01
2010 1,733,339 733,480 123 0.91 0.47 0.01
2011 1,617,902 709,440 198 0.89 0.50 0.01
2012 1,553,669 756,726 265 0.89 0.49 0.01
2013 1,498,025 701,013 228 0.87 0.50 0.01
2014 1,495,440 743,893 350 0.89 0.49 0.01
Source: Energy Information Administration, State Energy Data System

28
As shown in Table 19, from 2005 to 2015, total petroleum consumption by the four electric
utilities in Hawaii decreased an average 2.6 percent per year from about 12.0 million BBLs to
about 9.2 million BBLs; fuel oil consumption decreased an average 2.9 percent per year from 9.1
million BBLs to 6.8 million BBLs; diesel oil (excluding biodiesel) consumption decreased an
average 1.7 percent per year from 2.9 million BBLs to 2.5 million BBLs. In 2015, petroleum
consumption by the utilities decreased 0.4 percent from the previous year; fuel oil decreased 1.5
percent, while diesel increased 2.6 percent.
Table 19. Hawaii Utility Fuel Consumption
Growth Avg. ann. Growth
2005 2007 2009 2011 2013 2014 2015 2015 2005 - 2015
Petroleum
State Total BBL 12,046,758 12,045,419 11,244,809 10,873,734 9,633,073 9,265,797 9,228,096 -0.4% -2.6%
HECO BBL 7,993,010 8,195,607 7,555,082 7,312,962 6,408,203 6,167,276 6,213,113 0.7% -2.5%
HELCO BBL 1,136,268 1,067,210 1,089,738 1,031,711 997,659 965,542 909,157 -5.8% -2.2%
MECO BBL 2,170,554 1,959,432 1,869,575 1,806,667 1,539,175 1,480,580 1,477,603 -0.2% -3.8%
KIUC BBL 746,926 823,170 730,414 722,394 688,036 652,399 628,223 -3.7% -1.7%
Fuel Oil
State Total BBL 9,120,687 9,358,136 8,617,627 8,263,907 7,207,891 6,867,426 6,766,206 -1.5% -2.9%
HECO BBL 7,874,530 8,098,475 7,411,899 7,285,178 6,391,243 6,112,576 6,139,949 0.4% -2.5%
HELCO BBL 726,866 787,051 734,535 577,107 533,483 458,212 387,475 -15.4% -6.1%
MECO BBL 519,291 472,610 471,193 401,622 283,165 296,638 238,782 -19.5% -7.5%
KIUC BBL - - - - - - -
Diesel
State Total BBL 2,926,071 2,687,283 2,627,182 2,609,827 2,425,182 2,398,371 2,461,890 2.6% -1.7%
HECO BBL 118,480 97,132 143,183 27,784 16,960 54,700 73,164 33.8% -4.7%
HELCO BBL 409,402 280,159 355,203 454,604 464,176 507,330 521,682 2.8% 2.5%
MECO BBL 1,651,263 1,486,822 1,398,382 1,405,045 1,256,010 1,183,942 1,238,821 4.6% -2.8%
KIUC BBL 746,926 823,170 730,414 722,394 688,036 652,399 628,223 -3.7% -1.7%
% of Fuel Oil
State Total % 75.7% 77.7% 76.6% 76.0% 74.8% 74.1% 73.3%
HECO % 98.5% 98.8% 98.1% 99.6% 99.7% 99.1% 98.8%
HELCO % 64.0% 73.7% 67.4% 55.9% 53.5% 47.5% 42.6%
MECO % 23.9% 24.1% 25.2% 22.2% 18.4% 20.0% 16.2%
KIUC % 0.0% 0.0% 0.0% 0.0% 0.0% 0.0% 0.0%
County % of Fuel Oil
State Total % 100.0% 100.0% 100.0% 100.0% 100.0% 100.0% 100.0%
HECO % 86.3% 86.5% 86.0% 88.2% 88.7% 89.0% 90.7%
HELCO % 8.0% 8.4% 8.5% 7.0% 7.4% 6.7% 5.7%
MECO % 5.7% 5.1% 5.5% 4.9% 3.9% 4.3% 3.5%
KIUC % 0.0% 0.0% 0.0% 0.0% 0.0% 0.0% 0.0%
County % of Diesel
State Total % 100.0% 100.0% 100.0% 100.0% 100.0% 100.0% 100.0%
HECO % 4.0% 3.6% 5.5% 1.1% 0.7% 2.3% 3.0%
HELCO % 14.0% 10.4% 13.5% 17.4% 19.1% 21.2% 21.2%
MECO % 56.4% 55.3% 53.2% 53.8% 51.8% 49.4% 50.3%
KIUC % 25.5% 30.6% 27.8% 27.7% 28.4% 27.2% 25.5%
Source: Hawaii Electric Utility Monthly Financial Reports.

29
Table 19 also shows that the fuel oil share of total petroleum consumption for electricity
production decreased from 75.7 percent in 2005 to 73.3 percent in 2015. For HECO, almost all
the petroleum consumed was fuel oil. Fuel oil also accounted for about 42.6 percent of total
petroleum consumption at HELCO in 2015. Fuel oil only accounted for about 16.2 percent of total
petroleum consumption at MECO and all petroleum consumed at KIUC was diesel.
From 2005 to 2012, both total fuel oil cost and total diesel oil cost paid by the utilities in
Hawaii increased significantly, although consumption of both fuels decreased. The growth rate of
fuel oil costs was significantly higher than the growth rate of diesel costs.
Table 20. Hawaii Utility Fuel Cost
From 2005 to 2012, total petroleum costs for Hawaii’s utilities increased an average 10.2
percent per year from $694 million to $1,373 million; fuel oil costs increased an average 12.0
percent per year from $467 million to $1,033 million; diesel oil costs increased an average 6.0
percent per year from $226 million to $339 million (Table 20). Due to the faster growth of fuel
oil expenditures, the fuel oil share of total utility petroleum expenditures increased from 67.4
percent in 2005 to 75.3 percent in 2012, an increase of 7.9 percentage points.
Growth Avg. ann. Growth
2005 2007 2009 2011 2012 2013 2014 2015 2015 2005 - 2015
Petroleum
State Total $M 694 850 724 1,339 1,373 1,259 1,193 682 -42.8% -0.2%
HECO $M 421 526 460 892 926 833 798 434 -45.5% 0.3%
HELCO $M 65 75 74 122 117 126 117 72 -38.7% 1.0%
MECO $M 154 174 137 234 235 209 193 125 -35.5% -2.1%
KIUC $M 54 76 52 91 94 92 84 51 -39.6% -0.6%
Fuel Oil
State Total $M 467 592 519 993 1,033 922 868 465 -46.5% -0.1%
HECO $M 412 516 447 889 924 831 790 428 -45.9% 0.4%
HELCO $M 33 48 44 62 65 60 48 24 -50.7% -3.4%
MECO $M 22 28 28 42 44 31 30 13 -55.0% -5.0%
KIUC $M - - - - - - - -
Diesel
State Total $M 226 258 205 346 339 338 325 217 -33.1% -0.4%
HECO $M 9 9 13 3 2 2 7 7 -8.6% -2.9%
HELCO $M 32 27 30 60 52 66 69 48 -30.4% 4.2%
MECO $M 132 145 110 192 191 178 164 111 -31.9% -1.7%
KIUC $M 54 76 52 91 94 92 84 51 -39.6% -0.6%
% of Fuel Oil
State Total % 67.4% 69.6% 71.7% 74.2% 75.3% 73.2% 72.8% 68.1%
HECO % 97.9% 98.2% 97.2% 99.7% 99.8% 99.7% 99.1% 98.4%
HELCO % 51.2% 63.5% 59.1% 50.6% 55.4% 47.5% 40.8% 32.8%
MECO % 14.5% 16.2% 20.3% 18.0% 18.7% 14.7% 15.3% 10.7%
KIUC % 0.0% 0.0% 0.0% 0.0% 0.0% 0.0% 0.0% 0.0%
Source: Hawaii Electric Utility Monthly Financial Reports.

30
Since 2012, however, the costs of fuel oil and diesel both decreased from the previous year.
In 2015, the cost of utility petroleum decreased 42.8 percent or $517 million from the previous
year; the cost of fuel oil decreased 46.5 percent or $403.3 million, and the cost of diesel decreased
33.1 percent or $ 107.4 million. The decrease in fuel costs for 2015 was mainly driven by the
decrease in petroleum prices.
The average unit cost of petroleum used for utility electricity generation increased rapidly
from 2005 to 2012, with the growth rate being significantly higher than the growth rate of crude
oil prices. In this period before the decline in oil prices, from 2005 to 2012, the average unit
petroleum cost for the four electric utilities in Hawaii increased an average of 13.2 percent per year
from $57.57 per BBL to $136.88 per BBL (Table 21). Fuel oil costs increased an average 14.9
percent per year from $51.22 per BBL to $135.72 per BBL, and diesel oil (excluding biodiesel)
costs increased an average 8.9 percent per year from $77.36 per BBL to $140.52 per BBL. In
comparison, the average crude oil price increased an average 7.6 percent per year during the same
period. The unit fuel oil cost decreased 5.8 percent in 2013 and 1.2 percent in 2014 from the
previous year, and the unit diesel cost also decreased. In 2015, the unit fuel oil cost decreased 45.7
percent, and the unit diesel cost decreased 34.8 percent from the previous year. In 2015, the unit
fuel oil costs were highest at HECO, followed by HELCO and MECO. Unit diesel costs were
highest at HELCO, followed by HECO, MECO, and KIUC.
Table 21. Hawaii Utility Average Fuel Cost
Growth Avg. ann. Growth
2005 2007 2009 2011 2012 2013 2014 2015 2015 2005 - 2015
Petroleum
State Total $/BBL 57.57 70.60 64.38 123.11 136.88 130.73 128.71 73.89 -42.6% 2.5%
HECO $/BBL 52.61 64.13 60.90 121.99 137.86 130.05 129.35 69.92 -45.9% 2.9%
HELCO $/BBL 57.44 70.24 68.28 118.09 129.27 125.81 121.40 79.03 -34.9% 3.2%
MECO $/BBL 70.88 88.60 73.54 129.58 138.60 135.57 130.51 84.38 -35.3% 1.8%
KIUC $/BBL 72.19 92.64 71.13 125.40 133.12 133.37 129.37 81.09 -37.3% 1.2%
Fuel Oil
State Total $/BBL 51.22 63.27 60.24 120.15 135.72 127.85 126.38 68.67 -45.7% 3.0%
HECO $/BBL 52.26 63.75 60.34 122.03 137.88 130.04 129.30 69.65 -46.1% 2.9%
HELCO $/BBL 45.96 60.50 59.89 106.84 121.43 111.80 104.45 60.89 -41.7% 2.9%
MECO $/BBL 42.93 59.63 59.24 105.17 117.39 108.67 99.99 55.92 -44.1% 2.7%
KIUC $/BBL
Diesel
State Total $/BBL 77.36 96.13 77.96 132.48 140.52 139.28 135.38 88.25 -34.8% 1.3%
HECO $/BBL 76.07 95.67 89.82 112.16 128.37 132.18 134.92 92.15 -31.7% 1.9%
HELCO $/BBL 77.84 97.63 85.63 132.38 140.56 141.92 136.71 92.51 -32.3% 1.7%
MECO $/BBL 79.67 97.80 78.36 136.56 144.61 141.64 138.15 89.87 -35.0% 1.2%
KIUC $/BBL 72.19 92.64 71.13 125.40 133.12 133.37 129.37 81.09 -37.3% 1.2%
Source: Hawaii Electric Utility Monthly Financial Reports.

31
In recent years, electricity generated from renewable sources has increased significantly.
Based on the most recent data provided by the utility Renewable Portfolio Standard Status Reports,
from 2005 to 2015, total renewable electricity generated by the electric power industry (excluding
customer generated electricity) increased 7.8 percent per year on average, from 714 GWH to 1,518
GWH (Table 22). The renewable electricity share of total electricity sales increased from 6.8
percent to 16.2 percent during this period.
Table 22. Renewable Electricity Generation in Hawaii
Year Total Biomass Biofuels Geothermal Hydro Wind PV&Solar 1/
2005 714 403 0 221 82 7 -
2006 861 470 0 212 97 82 -
2007 938 392 1 230 72 242 -
2008 963 413 2 234 78 237 -
2009 930 399 5 168 107 250 1
2010 897 359 3 202 70 261 2
2011 1,096 365 59 233 90 344 4
2012 1,134 342 23 266 104 388 12
2013 1,352 416 30 281 74 504 48
2014 1,457 433 37 255 85 578 68
2015 1,518 422 53 230 107 613 92
Growth 05-15 7.8% 0.5% 87.4% 0.4% 2.6% 56.4%
Year Total Biomass Biofuels Geothermal Hydro Wind PV&Solar 1/
2005 100.0 56.5 0.0 31.0 11.6 1.0 -
2006 100.0 54.6 0.0 24.6 11.3 9.5 -
2007 100.0 41.8 0.1 24.5 7.7 25.9 -
2008 100.0 42.8 0.2 24.3 8.1 24.6 -
2009 100.0 42.9 0.5 18.0 11.5 26.9 0.1
2010 100.0 40.0 0.4 22.5 7.8 29.1 0.2
2011 100.0 33.3 5.4 21.3 8.3 31.4 0.3
2012 100.0 30.1 2.0 23.5 9.2 34.2 1.0
2013 100.0 30.7 2.2 20.8 5.4 37.2 3.6
2014 100.0 29.7 2.5 17.5 5.9 39.7 4.7
2015 100.0 27.8 3.5 15.2 7.0 40.4 6.1
1/ Does not include customer-sited solar.
Source: HECO and KIUC Renewable Portfolio Standard Status Report.
Renewable Electricity Generation (GWH)
% in Renewable Electricity Generation

32
In 2015, 40.4 percent of Hawaii’s renewable electricity was generated from wind, 27.8
percent from biomass, 15.2 percent from geothermal, 7.0 percent from hydro, 3.5 percent from
biofuels, and 6.1 percent from PV and solar thermal (does not include customer-sited PV solar
systems).
Table 23 shows renewable electricity generation by county. From 2005 to 2015, Honolulu
renewable electricity generation increased the most at 362 GWH or 7.6 percent per year. This was
followed by Maui at 239 GWH or 15.4 percent per year, Hawaii County at 161 GWH or 4.8 percent
per year, and Kauai at 42 GWH or 7.8 percent per year. In 2015, renewable electricity accounted
for about 40.3 percent of electricity sales in Hawaii County. Hawaii County was followed by Maui
at about 27.6 percent, Kauai at 18.5 percent, and Honolulu at 10.3 percent.

33
Table 23. Hawaii Renewable Electricity Generation by County
Table 23. Hawaii Renewable Electricity Generation by County
Growth Avg. ann. Growth
2005 2007 2009 2011 2013 2014 2015 2015 2005 - 2015
Renewable Generation State GWH 714 938 930 1,096 1,352 1,457 1,518 4.2% 7.8%
Honolulu GWH 333 326 364 431 552 647 695 7.4% 7.6%
Hawaii GWH 268 389 368 436 470 436 429 -1.6% 4.8%
Maui GWH 75 196 161 189 283 315 314 -0.5% 15.4%
Kauai GWH 37 26 37 40 48 58 80 36.7% 7.8%
Biomass State GWH 403 392 399 365 416 433 422 -2.5% 0.5%
Honolulu GWH 333 326 360 322 375 390 386 -1.1% 1.5%
Hawaii GWH - - - - - - -
Maui GWH 70 66 38 44 41 43 31 -28.5% -7.9%
Kauai GWH - - - - - - 5
Biofuels State GWH 0 1 5 59 30 37 53 44.0% 87.4%
Honolulu GWH - - 3 45 29 36 52 44.9%
Hawaii GWH - - - - - - -
Maui GWH 0 1 2 15 1 1 1 7.6% 25.7%
Kauai GWH - - - - - - -
Geothermal State GWH 221 230 168 233 281 255 230 -9.6% 0.4%
Honolulu GWH - - - - - - -
Hawaii GWH 221 230 168 233 281 255 230 -9.6% 0.4%
Maui GWH - - - - - - -
Kauai GWH - - - - - - -
Hydroelectricity State GWH 82 72 107 90 74 85 107 24.9% 2.6%
Honolulu GWH - - - - - - -
Hawaii GWH 40 42 60 45 35 43 63 47.1% 4.7%
Maui GWH 5 3 10 6 5 8 10 20.5% 7.0%
Kauai GWH 37 26 37 39 33 34 34 -1.8% -1.1%
Wind State GWH 7 242 250 344 504 578 613 6.0% 56.4%
Honolulu GWH - - - 64 122 184 216 17.6%
Hawaii GWH 7 116 141 157 152 136 132 -2.8% 34.2%
Maui GWH - 126 110 123 230 258 264 2.5%
Kauai GWH - - - - - - -
Photovoltaic and Solar State GWH - - 1 4 48 68 92 34.4%
Honolulu GWH - - - 0 27 37 41 9.1%
Hawaii GWH - - - 0 2 2 3 63.1%
Maui GWH - - 1 2 5 5 8 48.5%
Kauai GWH - - - 1 14 24 41 68.7%
Electricity Sold State GWH 10,539 10,585 10,126 9,962 9,501 9,406 9,389 -0.2% -1.1%
Honolulu GWH 7,721 7,675 7,378 7,242 6,859 6,782 6,754 -0.4% -1.3%
Hawaii GWH 1,116 1,163 1,120 1,104 1,076 1,063 1,065 0.2% -0.5%
Maui GWH 1,252 1,280 1,192 1,181 1,135 1,132 1,138 0.5% -1.0%
Kauai GWH 449 467 437 435 431 430 432 0.5% -0.4%
% of Renewable State % 6.8 8.9 9.2 11.0 14.2 15.5 16.2
Honolulu % 4.3 4.2 4.9 5.9 8.0 9.5 10.3
Hawaii % 24.0 33.4 32.9 39.5 43.7 41.0 40.3
Maui % 6.0 15.3 13.5 16.0 24.9 27.9 27.6
Kauai % 8.4 5.7 8.5 9.3 11.0 13.6 18.5
Source: HECO and KIUC Renewable Portfolio Standard Status Report.

34
4. Factors Affecting Electricity Prices in Hawaii
Hawaii’s electricity prices and total revenue from electricity sales are affected by the
expenses associated with electricity generation, mainly the fuel and purchased power costs. In
2015, due to sharp a decrease in fuel and purchased power costs, the 9,389 GWH of electricity
sold in Hawaii produced a total revenue of about $2.5 billion, a decrease of 21.7 percent from the
previous year. Total electricity sold decreased only 0.2 percent or 18 GWH, but total revenue from
electricity sales decreased 21.8 percent or $687.5 million in 2015 from the previous year. The
total revenue for the utilities, which reflects the total cost of electricity for customers, increased an
average of 5.6 percent per year from $1.9 billion in 2005 to $3.2 billion in 2014. Revenue from
electricity sales increased an average of 7.9 percent per year from 2005 to 2012; then decreased
3.9 percent in 2013. In 2014, revenue from electricity sales remained about the same from the
previous year, although GWH sales decreased 1.0 percent. Total GWH sold has been decreasing
in recent years in Hawaii. From 2005 to 2007, total GWH sold in Hawaii increased only slightly.
However, since 2007, total GWH sold has decreased each year.
Since the consumption of electricity has been relatively stable over time, the fluctuation of
the total electricity cost for customers was mainly due to fluctuations in the average price of
electricity. As shown in Table 24, the average revenue per kWh sold in Hawaii increased almost
every year from 18.3 cents in 2005 to 33.5 cents in 2014, an increase of 7.0 percent per year over
this period. In 2015, however, the average revenue from electricity sales decreased 21.6 percent,
from 33.5 cents per kWh in 2014 to 26.3 cents per kWh in 2015. The average electricity revenue
in 2015 was the highest at KIUC at about 33.1 cents per kWh. This was followed by HELCO at
32.3 cents per kWh, MECO at 30.2 cents per kWh, and HECO at 24.2 cents per kWh. From 2005
to 2015, the average cost of electricity increased the most at HECO at 4.5 percent per year;
followed by MECO at 2.3 percent per year, HELCO at 2.1 percent per year, and KIUC at 1.3
percent per year.
35
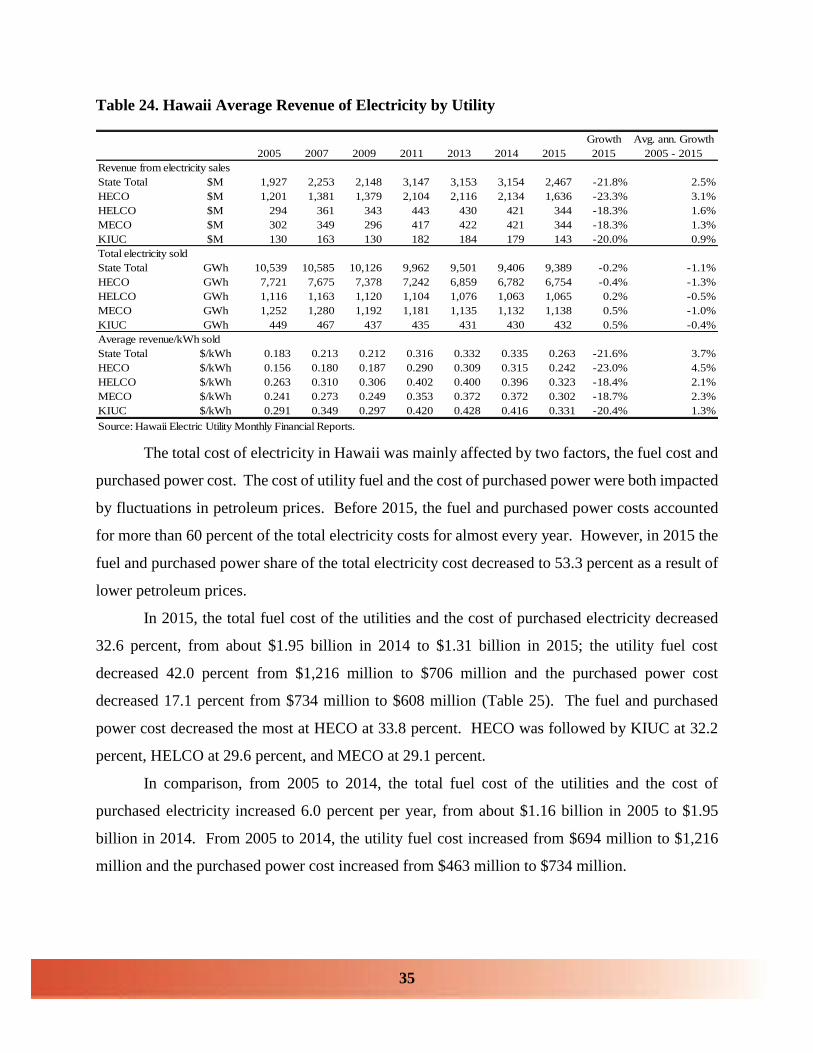
Table 24. Hawaii Average Revenue of Electricity by Utility
The total cost of electricity in Hawaii was mainly affected by two factors, the fuel cost and
purchased power cost. The cost of utility fuel and the cost of purchased power were both impacted
by fluctuations in petroleum prices. Before 2015, the fuel and purchased power costs accounted
for more than 60 percent of the total electricity costs for almost every year. However, in 2015 the
fuel and purchased power share of the total electricity cost decreased to 53.3 percent as a result of
lower petroleum prices.
In 2015, the total fuel cost of the utilities and the cost of purchased electricity decreased
32.6 percent, from about $1.95 billion in 2014 to $1.31 billion in 2015; the utility fuel cost
decreased 42.0 percent from $1,216 million to $706 million and the purchased power cost
decreased 17.1 percent from $734 million to $608 million (Table 25). The fuel and purchased
power cost decreased the most at HECO at 33.8 percent. HECO was followed by KIUC at 32.2
percent, HELCO at 29.6 percent, and MECO at 29.1 percent.
In comparison, from 2005 to 2014, the total fuel cost of the utilities and the cost of
purchased electricity increased 6.0 percent per year, from about $1.16 billion in 2005 to $1.95
billion in 2014. From 2005 to 2014, the utility fuel cost increased from $694 million to $1,216
million and the purchased power cost increased from $463 million to $734 million.
Growth Avg. ann. Growth
2005 2007 2009 2011 2013 2014 2015 2015 2005 - 2015
Revenue from electricity sales
State Total $M 1,927 2,253 2,148 3,147 3,153 3,154 2,467 -21.8% 2.5%
HECO $M 1,201 1,381 1,379 2,104 2,116 2,134 1,636 -23.3% 3.1%
HELCO $M 294 361 343 443 430 421 344 -18.3% 1.6%
MECO $M 302 349 296 417 422 421 344 -18.3% 1.3%
KIUC $M 130 163 130 182 184 179 143 -20.0% 0.9%
Total electricity sold
State Total GWh 10,539 10,585 10,126 9,962 9,501 9,406 9,389 -0.2% -1.1%
HECO GWh 7,721 7,675 7,378 7,242 6,859 6,782 6,754 -0.4% -1.3%
HELCO GWh 1,116 1,163 1,120 1,104 1,076 1,063 1,065 0.2% -0.5%
MECO GWh 1,252 1,280 1,192 1,181 1,135 1,132 1,138 0.5% -1.0%
KIUC GWh 449 467 437 435 431 430 432 0.5% -0.4%
Average revenue/kWh sold
State Total $/kWh 0.183 0.213 0.212 0.316 0.332 0.335 0.263 -21.6% 3.7%
HECO $/kWh 0.156 0.180 0.187 0.290 0.309 0.315 0.242 -23.0% 4.5%
HELCO $/kWh 0.263 0.310 0.306 0.402 0.400 0.396 0.323 -18.4% 2.1%
MECO $/kWh 0.241 0.273 0.249 0.353 0.372 0.372 0.302 -18.7% 2.3%
KIUC $/kWh 0.291 0.349 0.297 0.420 0.428 0.416 0.331 -20.4% 1.3%
Source: Hawaii Electric Utility Monthly Financial Reports.

36
Table 25. Hawaii Average Cost of Fuel and Purchased Power by Utility
In 2015, the average fuel and purchased electricity cost per kWh decreased 32.5 percent
from 20.7 cents to 14.0 cents. The fuel and purchased power cost share, as a percentage of the
total cost of electricity sold, decreased from 61.8 percent in 2014 to 53.3 percent in 2015. In 2015,
the share of fuel and purchased power cost was the highest for HECO at 54.9 percent, followed by
MECO at 52.5 percent, HELCO at 49.3 percent, and KIUC at 45.7 percent.
In comparison, from 2005 to 2014, the average fuel and purchased electricity cost per kWh
increased from 11.0 cents to 20.7 cents, an average increase of 7.3 percent per year. The share of
fuel and purchased power cost as a percentage of the total cost of electricity sold increased from
60.0 percent in 2005 to 61.8 percent in 2014. In 2014, the share of fuel and purchased power cost
was the highest in HECO at 63.7 percent, followed by MECO at 60.4 percent, HELCO at 57.2
percent, and KIUC at 53.8 percent.
Growth Avg. ann. Growth
2005 2007 2009 2011 2013 2014 2015 2015 2005 - 2015
Fuel and purchased power cost
State Total $M 1,157 1,392 1,228 2,053 1,998 1,950 1,314 -32.6% 1.3%
HECO $M 760 894 827 1,432 1,379 1,359 899 -33.8% 1.7%
HELCO $M 168 210 187 259 254 240 169 -29.6% 0.1%
MECO $M 170 207 158 264 263 254 180 -29.1% 0.6%
KIUC $M 59 81 56 98 101 96 65 -32.2% 1.0%
Utility fuel cost
State Total $M 694 850 724 1,356 1,277 1,216 706 -42.0% 0.2%
HECO $M 421 526 460 909 851 821 458 -44.2% 0.9%
HELCO $M 65 75 74 122 126 117 72 -38.7% 1.0%
MECO $M 154 174 137 234 209 193 125 -35.5% -2.1%
KIUC $M 54 76 52 91 92 84 51 -39.6% -0.6%
Purchased power cost
State Total $M 463 542 504 697 720 734 608 -17.1% 2.8%
HECO $M 339 369 367 523 528 538 441 -18.0% 2.7%
HELCO $M 103 135 113 137 128 123 98 -20.9% -0.5%
MECO $M 16 33 20 30 54 61 56 -8.8% 13.1%
KIUC $M 5 5 4 8 10 12 14 20.9% 11.1%
Average fuel and purchased power cost
State Total $/kWh 0.110 0.132 0.121 0.206 0.210 0.207 0.140 -32.5% 2.5%
HECO $/kWh 0.098 0.117 0.112 0.198 0.201 0.200 0.133 -33.6% 3.1%
HELCO $/kWh 0.150 0.181 0.167 0.235 0.236 0.226 0.159 -29.7% 0.6%
MECO $/kWh 0.136 0.162 0.132 0.223 0.232 0.225 0.158 -29.4% 1.6%
KIUC $/kWh 0.131 0.173 0.128 0.226 0.235 0.224 0.151 -32.5% 1.4%
Share of fuel and purchased power cost
State Total % 60.0% 61.8% 57.1% 65.2% 63.4% 61.8% 53.3% -13.8% -1.2%
HECO % 63.2% 64.8% 60.0% 68.0% 65.2% 63.7% 54.9% -13.7% -1.4%
HELCO % 57.2% 58.2% 54.5% 58.5% 59.0% 57.2% 49.3% -13.8% -1.5%
MECO % 56.4% 59.3% 53.1% 63.2% 62.3% 60.4% 52.5% -13.2% -0.7%
KIUC % 45.2% 49.7% 43.1% 53.9% 54.9% 53.8% 45.7% -15.2% 0.1%
Source: Hawaii Electric Utility Monthly Financial Reports.
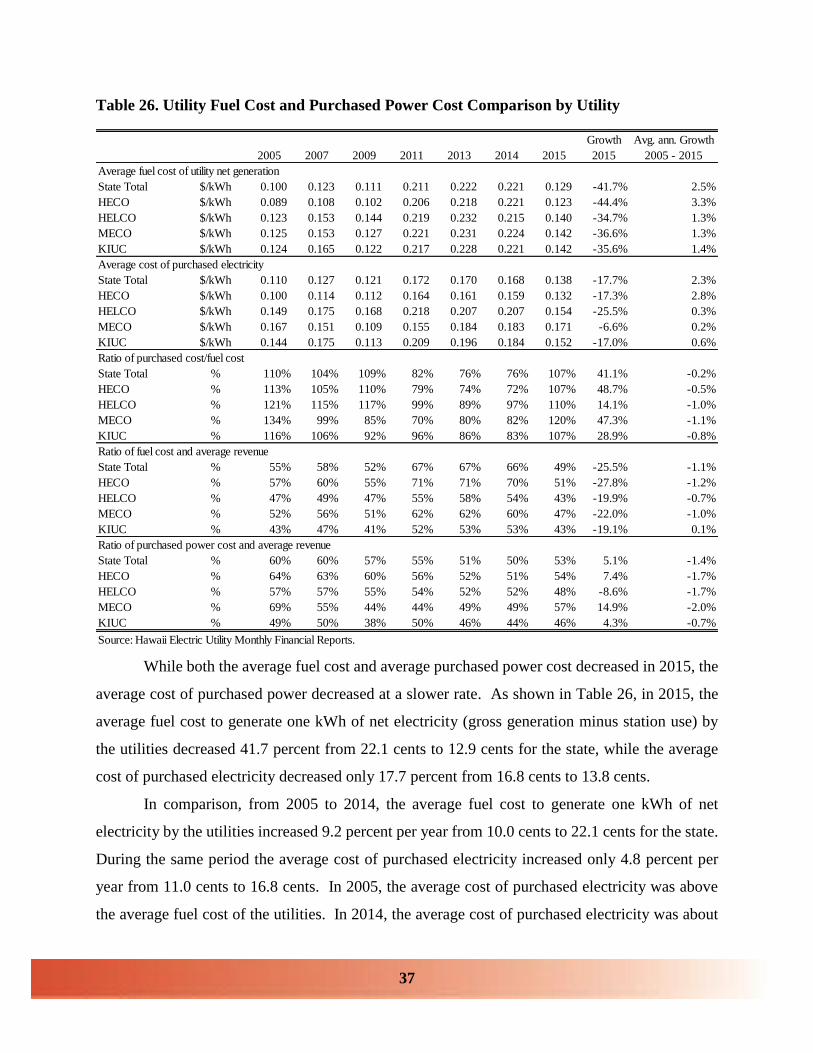
37
Table 26. Utility Fuel Cost and Purchased Power Cost Comparison by Utility
While both the average fuel cost and average purchased power cost decreased in 2015, the
average cost of purchased power decreased at a slower rate. As shown in Table 26, in 2015, the
average fuel cost to generate one kWh of net electricity (gross generation minus station use) by
the utilities decreased 41.7 percent from 22.1 cents to 12.9 cents for the state, while the average
cost of purchased electricity decreased only 17.7 percent from 16.8 cents to 13.8 cents.
In comparison, from 2005 to 2014, the average fuel cost to generate one kWh of net
electricity by the utilities increased 9.2 percent per year from 10.0 cents to 22.1 cents for the state.
During the same period the average cost of purchased electricity increased only 4.8 percent per
year from 11.0 cents to 16.8 cents. In 2005, the average cost of purchased electricity was above
the average fuel cost of the utilities. In 2014, the average cost of purchased electricity was about
Growth Avg. ann. Growth
2005 2007 2009 2011 2013 2014 2015 2015 2005 - 2015
Average fuel cost of utility net generation
State Total $/kWh 0.100 0.123 0.111 0.211 0.222 0.221 0.129 -41.7% 2.5%
HECO $/kWh 0.089 0.108 0.102 0.206 0.218 0.221 0.123 -44.4% 3.3%
HELCO $/kWh 0.123 0.153 0.144 0.219 0.232 0.215 0.140 -34.7% 1.3%
MECO $/kWh 0.125 0.153 0.127 0.221 0.231 0.224 0.142 -36.6% 1.3%
KIUC $/kWh 0.124 0.165 0.122 0.217 0.228 0.221 0.142 -35.6% 1.4%
Average cost of purchased electricity
State Total $/kWh 0.110 0.127 0.121 0.172 0.170 0.168 0.138 -17.7% 2.3%
HECO $/kWh 0.100 0.114 0.112 0.164 0.161 0.159 0.132 -17.3% 2.8%
HELCO $/kWh 0.149 0.175 0.168 0.218 0.207 0.207 0.154 -25.5% 0.3%
MECO $/kWh 0.167 0.151 0.109 0.155 0.184 0.183 0.171 -6.6% 0.2%
KIUC $/kWh 0.144 0.175 0.113 0.209 0.196 0.184 0.152 -17.0% 0.6%
Ratio of purchased cost/fuel cost
State Total % 110% 104% 109% 82% 76% 76% 107% 41.1% -0.2%
HECO % 113% 105% 110% 79% 74% 72% 107% 48.7% -0.5%
HELCO % 121% 115% 117% 99% 89% 97% 110% 14.1% -1.0%
MECO % 134% 99% 85% 70% 80% 82% 120% 47.3% -1.1%
KIUC % 116% 106% 92% 96% 86% 83% 107% 28.9% -0.8%
Ratio of fuel cost and average revenue
State Total % 55% 58% 52% 67% 67% 66% 49% -25.5% -1.1%
HECO % 57% 60% 55% 71% 71% 70% 51% -27.8% -1.2%
HELCO % 47% 49% 47% 55% 58% 54% 43% -19.9% -0.7%
MECO % 52% 56% 51% 62% 62% 60% 47% -22.0% -1.0%
KIUC % 43% 47% 41% 52% 53% 53% 43% -19.1% 0.1%
Ratio of purchased power cost and average revenue
State Total % 60% 60% 57% 55% 51% 50% 53% 5.1% -1.4%
HECO % 64% 63% 60% 56% 52% 51% 54% 7.4% -1.7%
HELCO % 57% 57% 55% 54% 52% 52% 48% -8.6% -1.7%
MECO % 69% 55% 44% 44% 49% 49% 57% 14.9% -2.0%
KIUC % 49% 50% 38% 50% 46% 44% 46% 4.3% -0.7%
Source: Hawaii Electric Utility Monthly Financial Reports.

38
23.9 percent below the average fuel cost of the utilities in Hawaii. In 2015, however, the average
cost of purchased electricity was above the average fuel cost of the utilities again.
Due to the slower growth of purchased electricity costs from 2005 to 2014, the ratio of
average purchased power cost to average utility fuel cost decreased from 110 percent in 2005 to
76 percent in 2014. In 2015, the ratio of average purchased power cost to average utility fuel cost
increased to 107 percent. In 2015, the purchased electricity was cheapest at HECO (13.2
cents/kWh), followed by KIUC (15.2 cents/kWh), HELCO (15.4 cents/kWh), and MECO (17.1
cents/kWh).
In addition to fuel and purchased power costs, the cost of electricity is also affected by four
other factors. As shown in Table 27, the operating income of the utilities accounted for about 8.2
percent, taxes accounted for about 12.8 percent, depreciation and amortization accounted for about
7.8 percent, and other utility operating expenses accounted for about 18.3 percent of the total
electricity cost paid by consumers in 2015. Other utility operating expenses include other
operation and maintenance expense, transmission and distribution expenses, customer accounts
and service expenses, and administration and general expenses.
The total of these other costs have increased from $777 million in 2005 to $1,163 million
in 2015, an average increase of 4.1 percent per year. This growth rate was higher than the 2.8
percent average inflation rate (Honolulu CPI-U) during the same period. Among the four
components of other electricity costs, other utility operating expenses increased the most at 4.7
percent per year, followed by operating income at 4.2 percent per year, taxes at 3.7 percent per
year, and depreciation and amortization at 3.4 percent per year.
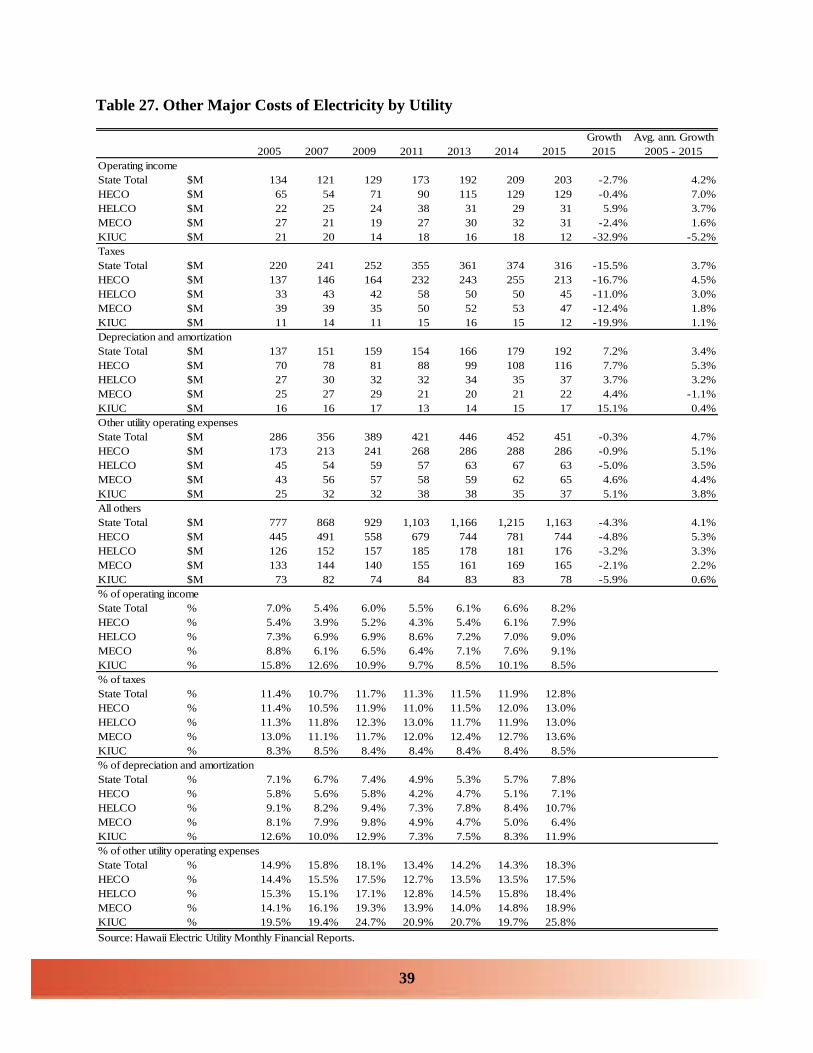
39
Table 27. Other Major Costs of Electricity by Utility
Growth Avg. ann. Growth
2005 2007 2009 2011 2013 2014 2015 2015 2005 - 2015
Operating income
State Total $M 134 121 129 173 192 209 203 -2.7% 4.2%
HECO $M 65 54 71 90 115 129 129 -0.4% 7.0%
HELCO $M 22 25 24 38 31 29 31 5.9% 3.7%
MECO $M 27 21 19 27 30 32 31 -2.4% 1.6%
KIUC $M 21 20 14 18 16 18 12 -32.9% -5.2%
Taxes
State Total $M 220 241 252 355 361 374 316 -15.5% 3.7%
HECO $M 137 146 164 232 243 255 213 -16.7% 4.5%
HELCO $M 33 43 42 58 50 50 45 -11.0% 3.0%
MECO $M 39 39 35 50 52 53 47 -12.4% 1.8%
KIUC $M 11 14 11 15 16 15 12 -19.9% 1.1%
Depreciation and amortization
State Total $M 137 151 159 154 166 179 192 7.2% 3.4%
HECO $M 70 78 81 88 99 108 116 7.7% 5.3%
HELCO $M 27 30 32 32 34 35 37 3.7% 3.2%
MECO $M 25 27 29 21 20 21 22 4.4% -1.1%
KIUC $M 16 16 17 13 14 15 17 15.1% 0.4%
Other utility operating expenses
State Total $M 286 356 389 421 446 452 451 -0.3% 4.7%
HECO $M 173 213 241 268 286 288 286 -0.9% 5.1%
HELCO $M 45 54 59 57 63 67 63 -5.0% 3.5%
MECO $M 43 56 57 58 59 62 65 4.6% 4.4%
KIUC $M 25 32 32 38 38 35 37 5.1% 3.8%
All others
State Total $M 777 868 929 1,103 1,166 1,215 1,163 -4.3% 4.1%
HECO $M 445 491 558 679 744 781 744 -4.8% 5.3%
HELCO $M 126 152 157 185 178 181 176 -3.2% 3.3%
MECO $M 133 144 140 155 161 169 165 -2.1% 2.2%
KIUC $M 73 82 74 84 83 83 78 -5.9% 0.6%
% of operating income
State Total % 7.0% 5.4% 6.0% 5.5% 6.1% 6.6% 8.2%
HECO % 5.4% 3.9% 5.2% 4.3% 5.4% 6.1% 7.9%
HELCO % 7.3% 6.9% 6.9% 8.6% 7.2% 7.0% 9.0%
MECO % 8.8% 6.1% 6.5% 6.4% 7.1% 7.6% 9.1%
KIUC % 15.8% 12.6% 10.9% 9.7% 8.5% 10.1% 8.5%
% of taxes
State Total % 11.4% 10.7% 11.7% 11.3% 11.5% 11.9% 12.8%
HECO % 11.4% 10.5% 11.9% 11.0% 11.5% 12.0% 13.0%
HELCO % 11.3% 11.8% 12.3% 13.0% 11.7% 11.9% 13.0%
MECO % 13.0% 11.1% 11.7% 12.0% 12.4% 12.7% 13.6%
KIUC % 8.3% 8.5% 8.4% 8.4% 8.4% 8.4% 8.5%
% of depreciation and amortization
State Total % 7.1% 6.7% 7.4% 4.9% 5.3% 5.7% 7.8%
HECO % 5.8% 5.6% 5.8% 4.2% 4.7% 5.1% 7.1%
HELCO % 9.1% 8.2% 9.4% 7.3% 7.8% 8.4% 10.7%
MECO % 8.1% 7.9% 9.8% 4.9% 4.7% 5.0% 6.4%
KIUC % 12.6% 10.0% 12.9% 7.3% 7.5% 8.3% 11.9%
% of other utility operating expenses
State Total % 14.9% 15.8% 18.1% 13.4% 14.2% 14.3% 18.3%
HECO % 14.4% 15.5% 17.5% 12.7% 13.5% 13.5% 17.5%
HELCO % 15.3% 15.1% 17.1% 12.8% 14.5% 15.8% 18.4%
MECO % 14.1% 16.1% 19.3% 13.9% 14.0% 14.8% 18.9%
KIUC % 19.5% 19.4% 24.7% 20.9% 20.7% 19.7% 25.8%
Source: Hawaii Electric Utility Monthly Financial Reports.

40
5. Electricity Consumption by Sector
Electricity sold by the utilities can be classified into three sectors. First is the residential
sector, which includes all residential customers and utility employees’ accounts. Second is the
industrial sector, which includes the large power customers. Third is the commercial sector, which
includes all other customers.
Due to the installation of customer-sited solar systems, total electricity sold by utilities
decreased. Since most of the customer-sited solar systems were installed by residential customers,
electricity sold to residential customers decreased more than that of the other sectors. As shown
in Table 28, from 2005 to 2015, total electricity sold decreased an average 1.1 percent per year in
Hawaii, while electricity sold to the residential sector decreased an average 2.1 percent per year
from 3,164 GWH to 2,558 GWH. In comparison, electricity sold to the commercial sector and the
industrial sector only decreased an average 1.0 percent and 0.6 percent per year, respectively, over
the same period. As a result, the residential sector share of total electricity sold decreased from
30.0 percent in 2005 to 27.2 percent in 2015. In 2015, the residential sector’s electricity sales
increased 0.8 percent over the previous year.
At the county level, from 2005 to 2015, residential sales in the HECO system decreased
the most at 2.7 percent per year; followed by MECO (decreased 1.5 percent per year), and HELCO
(decreased 0.9 percent per year). Residential sales of KIUC increased slightly during the same
period.
It appears that the decrease in electricity consumption in recent years was due to decreased
consumption per customer, rather than a decrease in the number of customers. As shown in Table
29, from 2005 to 2015, total utility customers for the state increased an average 0.7 percent per
year. The number of residential customers increased 0.7 percent per year from 398,332 customers
to 429,085 customers, the number of commercial customers increased 0.1 percent per year from
64,072 to 64,769, and the number of industrial customers increased 1.3 percent per year from 684
to 778.
At the county utility level, the number of customers increased slower at HECO compared
with the other utilities. From 2005 to 2015, the share of HECO customers as a percentage of total
statewide utility customers decreased 1.8 percentage points, from 63.0 percent to 61.2 percent.

41
Table 28. Electricity Consumption by Sector and by Utility
Growth Avg. ann. Growth
2005 2007 2009 2011 2013 2014 2015 2015 2005 - 2015
Total
State Total GWH 10,539 10,585 10,126 9,962 9,501 9,406 9,389 -0.2% -1.1%
HECO GWH 7,721 7,675 7,378 7,242 6,859 6,782 6,754 -0.4% -1.3%
HELCO GWH 1,116 1,163 1,120 1,104 1,076 1,063 1,065 0.2% -0.5%
MECO GWH 1,252 1,280 1,192 1,181 1,135 1,132 1,138 0.5% -1.0%
KIUC GWH 449 467 437 435 431 430 432 0.5% -0.4%
Residential
State Total GWH 3,164 3,201 3,055 2,929 2,609 2,539 2,558 0.8% -2.1%
HECO GWH 2,143 2,135 2,025 1,925 1,667 1,611 1,627 1.0% -2.7%
HELCO GWH 423 451 440 427 396 387 388 0.5% -0.9%
MECO GWH 442 450 428 418 388 382 381 -0.2% -1.5%
KIUC GWH 156 165 162 159 158 159 162 1.7% 0.4%
Commercial
State Total GWH 3,465 3,521 3,389 3,368 3,269 3,185 3,143 -1.3% -1.0%
HECO GWH 2,480 2,513 2,449 2,429 2,341 2,270 2,221 -2.2% -1.1%
HELCO GWH 453 463 441 446 435 428 432 1.1% -0.5%
MECO GWH 406 417 382 379 379 374 374 -0.1% -0.8%
KIUC GWH 125 129 118 114 113 114 116 1.9% -0.8%
Industrial
State Total GWH 3,909 3,863 3,681 3,665 3,623 3,682 3,687 0.2% -0.6%
HECO GWH 3,098 3,028 2,904 2,888 2,850 2,900 2,906 0.2% -0.6%
HELCO GWH 240 248 238 231 245 248 244 -1.6% 0.2%
MECO GWH 404 414 382 384 368 376 383 1.7% -0.5%
KIUC GWH 167 173 157 161 160 157 155 -1.7% -0.8%
% of Residential
State Total % 30.0% 30.2% 30.2% 29.4% 27.5% 27.0% 27.2%
HECO % 27.7% 27.8% 27.5% 26.6% 24.3% 23.8% 24.1%
HELCO % 37.9% 38.8% 39.3% 38.7% 36.8% 36.4% 36.5%
MECO % 35.3% 35.1% 35.9% 35.4% 34.2% 33.7% 33.5%
KIUC % 34.8% 35.4% 37.1% 36.6% 36.6% 37.0% 37.5%
% of Commercial
State Total % 32.9% 33.3% 33.5% 33.8% 34.4% 33.9% 33.5%
HECO % 32.1% 32.7% 33.2% 33.5% 34.1% 33.5% 32.9%
HELCO % 40.6% 39.8% 39.4% 40.4% 40.4% 40.2% 40.6%
MECO % 32.4% 32.5% 32.0% 32.1% 33.4% 33.0% 32.9%
KIUC % 27.9% 27.6% 26.9% 26.3% 26.3% 26.4% 26.8%
County % of Total
State Total % 100.0% 100.0% 100.0% 100.0% 100.0% 100.0% 100.0%
HECO % 73.3% 72.5% 72.9% 72.7% 72.2% 72.1% 71.9%
HELCO % 10.6% 11.0% 11.1% 11.1% 11.3% 11.3% 11.3%
MECO % 11.9% 12.1% 11.8% 11.9% 11.9% 12.0% 12.1%
KIUC % 4.3% 4.4% 4.3% 4.4% 4.5% 4.6% 4.6%
County % of Total
State Total % 100.0% 100.0% 100.0% 100.0% 100.0% 100.0% 100.0%
HECO % 67.7% 66.7% 66.3% 65.7% 63.9% 63.5% 63.6%
HELCO % 13.4% 14.1% 14.4% 14.6% 15.2% 15.2% 15.2%
MECO % 14.0% 14.0% 14.0% 14.3% 14.9% 15.0% 14.9%
KIUC % 4.9% 5.2% 5.3% 5.4% 6.1% 6.3% 6.3%
Source: Hawaii Electric Utility Monthly Financial Reports.
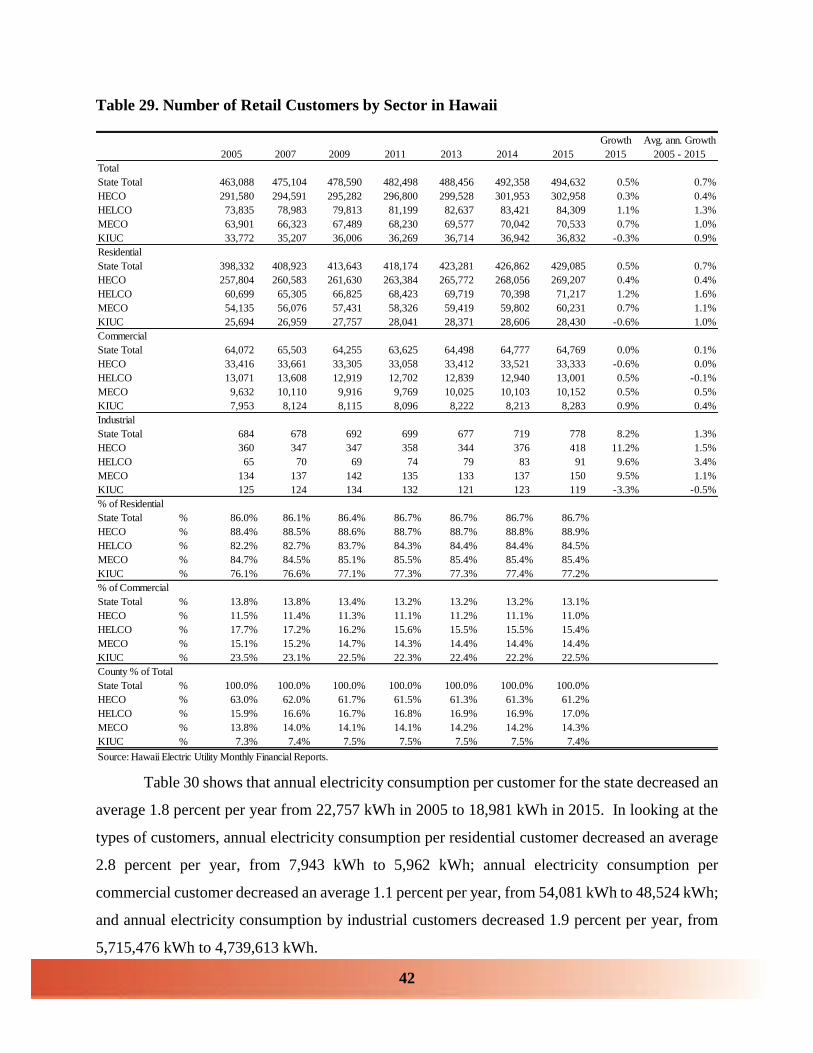
42
Table 29. Number of Retail Customers by Sector in Hawaii
Table 30 shows that annual electricity consumption per customer for the state decreased an
average 1.8 percent per year from 22,757 kWh in 2005 to 18,981 kWh in 2015. In looking at the
types of customers, annual electricity consumption per residential customer decreased an average
2.8 percent per year, from 7,943 kWh to 5,962 kWh; annual electricity consumption per
commercial customer decreased an average 1.1 percent per year, from 54,081 kWh to 48,524 kWh;
and annual electricity consumption by industrial customers decreased 1.9 percent per year, from
5,715,476 kWh to 4,739,613 kWh.
Growth Avg. ann. Growth
2005 2007 2009 2011 2013 2014 2015 2015 2005 - 2015
Total
State Total 463,088 475,104 478,590 482,498 488,456 492,358 494,632 0.5% 0.7%
HECO 291,580 294,591 295,282 296,800 299,528 301,953 302,958 0.3% 0.4%
HELCO 73,835 78,983 79,813 81,199 82,637 83,421 84,309 1.1% 1.3%
MECO 63,901 66,323 67,489 68,230 69,577 70,042 70,533 0.7% 1.0%
KIUC 33,772 35,207 36,006 36,269 36,714 36,942 36,832 -0.3% 0.9%
Residential
State Total 398,332 408,923 413,643 418,174 423,281 426,862 429,085 0.5% 0.7%
HECO 257,804 260,583 261,630 263,384 265,772 268,056 269,207 0.4% 0.4%
HELCO 60,699 65,305 66,825 68,423 69,719 70,398 71,217 1.2% 1.6%
MECO 54,135 56,076 57,431 58,326 59,419 59,802 60,231 0.7% 1.1%
KIUC 25,694 26,959 27,757 28,041 28,371 28,606 28,430 -0.6% 1.0%
Commercial
State Total 64,072 65,503 64,255 63,625 64,498 64,777 64,769 0.0% 0.1%
HECO 33,416 33,661 33,305 33,058 33,412 33,521 33,333 -0.6% 0.0%
HELCO 13,071 13,608 12,919 12,702 12,839 12,940 13,001 0.5% -0.1%
MECO 9,632 10,110 9,916 9,769 10,025 10,103 10,152 0.5% 0.5%
KIUC 7,953 8,124 8,115 8,096 8,222 8,213 8,283 0.9% 0.4%
Industrial
State Total 684 678 692 699 677 719 778 8.2% 1.3%
HECO 360 347 347 358 344 376 418 11.2% 1.5%
HELCO 65 70 69 74 79 83 91 9.6% 3.4%
MECO 134 137 142 135 133 137 150 9.5% 1.1%
KIUC 125 124 134 132 121 123 119 -3.3% -0.5%
% of Residential
State Total % 86.0% 86.1% 86.4% 86.7% 86.7% 86.7% 86.7%
HECO % 88.4% 88.5% 88.6% 88.7% 88.7% 88.8% 88.9%
HELCO % 82.2% 82.7% 83.7% 84.3% 84.4% 84.4% 84.5%
MECO % 84.7% 84.5% 85.1% 85.5% 85.4% 85.4% 85.4%
KIUC % 76.1% 76.6% 77.1% 77.3% 77.3% 77.4% 77.2%
% of Commercial
State Total % 13.8% 13.8% 13.4% 13.2% 13.2% 13.2% 13.1%
HECO % 11.5% 11.4% 11.3% 11.1% 11.2% 11.1% 11.0%
HELCO % 17.7% 17.2% 16.2% 15.6% 15.5% 15.5% 15.4%
MECO % 15.1% 15.2% 14.7% 14.3% 14.4% 14.4% 14.4%
KIUC % 23.5% 23.1% 22.5% 22.3% 22.4% 22.2% 22.5%
County % of Total
State Total % 100.0% 100.0% 100.0% 100.0% 100.0% 100.0% 100.0%
HECO % 63.0% 62.0% 61.7% 61.5% 61.3% 61.3% 61.2%
HELCO % 15.9% 16.6% 16.7% 16.8% 16.9% 16.9% 17.0%
MECO % 13.8% 14.0% 14.1% 14.1% 14.2% 14.2% 14.3%
KIUC % 7.3% 7.4% 7.5% 7.5% 7.5% 7.5% 7.4%
Source: Hawaii Electric Utility Monthly Financial Reports.

43
At the county level, MECO had the highest annual electricity consumption per residential
customer in 2015 at 6,328 kWh. This was followed by HECO at 6,043 kWh, KIUC at 5,692 kWh,
and HELCO at 5,453 kWh. However, the difference between utilities’ average residential
electricity consumption per customer has been decreasing over time with HECO’s residential
consumption per customer decreasing faster than others. From 2005 to 2015, residential
consumption per customer decreased an average 3.1 percent per year at HECO, decreased 2.5
percent per year at MECO, decreased 2.4 percent per year at HELCO, and decreased 0.6 percent
per year at KIUC.
Table 30. Annual Electricity Consumption per Customer by Sector
Due to the rapid growth of electricity prices from 2005 to 2012, total revenue from retail
electricity sales increased substantially over this period. This occurred in spite of a decrease in the
kWh of electricity sold over the same period. From 2005 to 2012, the total revenue generated from
retail electricity sales increased an average 7.9 percent per year for the state, revenue from
residential sales increased an average 6.6 percent per year from $653 million to $1,023 million,
and revenue from commercial and industrial sales (separate revenues from the commercial sector
and the industrial sector are not available in the MFR) increased an average 8.5 percent per year
from $1,274 million to $2,258 million.
Growth Avg. ann. Growth
2005 2007 2009 2011 2013 2014 2015 2015 2005 - 2015
Total
State Total kWh/C 22,757 22,279 21,158 20,646 19,451 19,104 18,981 -0.6% -1.8%
HECO kWh/C 26,481 26,054 24,985 24,401 22,898 22,459 22,294 -0.7% -1.7%
HELCO kWh/C 15,121 14,721 14,031 13,591 13,022 12,737 12,630 -0.8% -1.8%
MECO kWh/C 19,595 19,300 17,666 17,309 16,311 16,163 16,129 -0.2% -1.9%
KIUC kWh/C 13,284 13,261 12,125 11,987 11,752 11,638 11,731 0.8% -1.2%
Residential
State Total kWh/C 7,943 7,827 7,386 7,004 6,163 5,948 5,962 0.2% -2.8%
HECO kWh/C 8,311 8,191 7,741 7,309 6,273 6,010 6,043 0.5% -3.1%
HELCO kWh/C 6,977 6,912 6,585 6,238 5,676 5,491 5,453 -0.7% -2.4%
MECO kWh/C 8,165 8,017 7,451 7,165 6,528 6,387 6,328 -0.9% -2.5%
KIUC kWh/C 6,072 6,127 5,834 5,673 5,564 5,564 5,692 2.3% -0.6%
Commercial
State Total kWh/C 54,081 53,760 52,751 52,939 50,689 49,176 48,524 -1.3% -1.1%
HECO kWh/C 74,227 74,652 73,519 73,475 70,072 67,734 66,641 -1.6% -1.1%
HELCO kWh/C 34,685 34,027 34,165 35,089 33,892 33,040 33,234 0.6% -0.4%
MECO kWh/C 42,163 41,198 38,525 38,811 37,851 37,013 36,816 -0.5% -1.3%
KIUC kWh/C 15,749 15,881 14,487 14,139 13,804 13,820 13,967 1.1% -1.2%
Industrial
State Total kWh/C 5,715,476 5,697,455 5,320,073 5,242,739 5,351,326 5,120,741 4,739,613 -7.4% -1.9%
HECO kWh/C 8,606,672 8,726,082 8,368,077 8,068,244 8,284,797 7,712,821 6,951,690 -9.9% -2.1%
HELCO kWh/C 3,686,703 3,546,493 3,455,506 3,122,719 3,104,552 2,992,745 2,685,072 -10.3% -3.1%
MECO kWh/C 3,014,884 3,021,683 2,692,158 2,844,143 2,763,182 2,745,471 2,551,411 -7.1% -1.7%
KIUC kWh/C 1,338,824 1,392,734 1,172,027 1,221,235 1,323,260 1,278,578 1,298,817 1.6% -0.3%
Source: Hawaii Electric Utility Monthly Financial Reports.
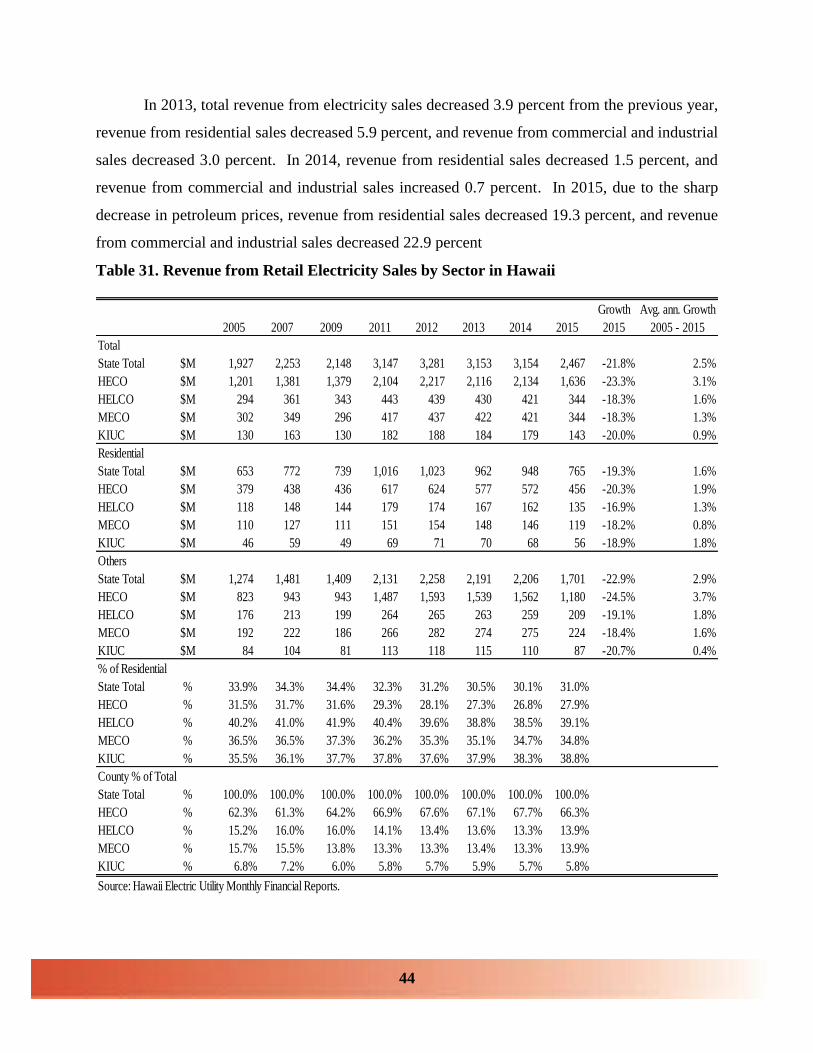
44
In 2013, total revenue from electricity sales decreased 3.9 percent from the previous year,
revenue from residential sales decreased 5.9 percent, and revenue from commercial and industrial
sales decreased 3.0 percent. In 2014, revenue from residential sales decreased 1.5 percent, and
revenue from commercial and industrial sales increased 0.7 percent. In 2015, due to the sharp
decrease in petroleum prices, revenue from residential sales decreased 19.3 percent, and revenue
from commercial and industrial sales decreased 22.9 percent
Table 31. Revenue from Retail Electricity Sales by Sector in Hawaii
Growth Avg. ann. Growth
2005 2007 2009 2011 2012 2013 2014 2015 2015 2005 - 2015
Total
State Total $M 1,927 2,253 2,148 3,147 3,281 3,153 3,154 2,467 -21.8% 2.5%
HECO $M 1,201 1,381 1,379 2,104 2,217 2,116 2,134 1,636 -23.3% 3.1%
HELCO $M 294 361 343 443 439 430 421 344 -18.3% 1.6%
MECO $M 302 349 296 417 437 422 421 344 -18.3% 1.3%
KIUC $M 130 163 130 182 188 184 179 143 -20.0% 0.9%
Residential
State Total $M 653 772 739 1,016 1,023 962 948 765 -19.3% 1.6%
HECO $M 379 438 436 617 624 577 572 456 -20.3% 1.9%
HELCO $M 118 148 144 179 174 167 162 135 -16.9% 1.3%
MECO $M 110 127 111 151 154 148 146 119 -18.2% 0.8%
KIUC $M 46 59 49 69 71 70 68 56 -18.9% 1.8%
Others
State Total $M 1,274 1,481 1,409 2,131 2,258 2,191 2,206 1,701 -22.9% 2.9%
HECO $M 823 943 943 1,487 1,593 1,539 1,562 1,180 -24.5% 3.7%
HELCO $M 176 213 199 264 265 263 259 209 -19.1% 1.8%
MECO $M 192 222 186 266 282 274 275 224 -18.4% 1.6%
KIUC $M 84 104 81 113 118 115 110 87 -20.7% 0.4%
% of Residential
State Total % 33.9% 34.3% 34.4% 32.3% 31.2% 30.5% 30.1% 31.0%
HECO % 31.5% 31.7% 31.6% 29.3% 28.1% 27.3% 26.8% 27.9%
HELCO % 40.2% 41.0% 41.9% 40.4% 39.6% 38.8% 38.5% 39.1%
MECO % 36.5% 36.5% 37.3% 36.2% 35.3% 35.1% 34.7% 34.8%
KIUC % 35.5% 36.1% 37.7% 37.8% 37.6% 37.9% 38.3% 38.8%
County % of Total
State Total % 100.0% 100.0% 100.0% 100.0% 100.0% 100.0% 100.0% 100.0%
HECO % 62.3% 61.3% 64.2% 66.9% 67.6% 67.1% 67.7% 66.3%
HELCO % 15.2% 16.0% 16.0% 14.1% 13.4% 13.6% 13.3% 13.9%
MECO % 15.7% 15.5% 13.8% 13.3% 13.3% 13.4% 13.3% 13.9%
KIUC % 6.8% 7.2% 6.0% 5.8% 5.7% 5.9% 5.7% 5.8%
Source: Hawaii Electric Utility Monthly Financial Reports.

45
The higher growth in commercial and industrial electricity revenue, compared with
residential revenue from 2005 to 2012, was due to the higher growth in commercial and industrial
electricity prices. From 2005 to 2012, the average electricity price increased an average of 9.3
percent per year, from 18.3 cents per kWh to 34.0 cents per kWh. The average residential
electricity price increased 8.8 percent per year, from 20.6 cents per kWh to 37.3 cents per kWh,
and the average commercial and industrial electricity price increased 9.6 percent per year, from
17.3 cents per kWh to 32.7 cents per kWh.
In 2013, the average residential electricity price decreased 1.2 percent and the average
commercial and industrial electricity price decreased 2.9 percent. In 2014, the average residential
electricity price increased 1.2 percent and the average commercial and industrial electricity price
increased 1.1 percent. In 2015, the average residential electricity price decreased 19.9 percent and
the average commercial and industrial electricity price decreased 22.5 percent.
Table 32. Average Electricity Price by County in Hawaii
Growth Avg. ann. Growth
2005 2007 2009 2011 2012 2013 2014 2015 2015 2005 - 2015
Total
State Total $/kWh 0.183 0.213 0.212 0.316 0.340 0.332 0.335 0.263 -21.6% 3.7%
HECO $/kWh 0.156 0.180 0.187 0.290 0.318 0.309 0.315 0.242 -23.0% 4.5%
HELCO $/kWh 0.263 0.310 0.306 0.402 0.405 0.400 0.396 0.323 -18.4% 2.1%
MECO $/kWh 0.241 0.273 0.249 0.353 0.382 0.372 0.372 0.302 -18.7% 2.3%
KIUC $/kWh 0.291 0.349 0.297 0.420 0.435 0.428 0.416 0.331 -20.4% 1.3%
Residential
State Total $/kWh 0.206 0.241 0.242 0.347 0.373 0.369 0.373 0.299 -19.9% 3.8%
HECO $/kWh 0.177 0.205 0.215 0.320 0.351 0.346 0.355 0.280 -21.0% 4.7%
HELCO $/kWh 0.279 0.328 0.327 0.419 0.425 0.422 0.419 0.346 -17.3% 2.2%
MECO $/kWh 0.249 0.283 0.259 0.361 0.391 0.382 0.382 0.313 -18.0% 2.3%
KIUC $/kWh 0.297 0.356 0.301 0.434 0.450 0.443 0.430 0.343 -20.2% 1.5%
Others
State Total $/kWh 0.173 0.201 0.199 0.303 0.327 0.318 0.321 0.249 -22.5% 3.7%
HECO $/kWh 0.147 0.170 0.176 0.280 0.306 0.296 0.302 0.230 -23.8% 4.6%
HELCO $/kWh 0.253 0.299 0.293 0.391 0.393 0.387 0.383 0.309 -19.2% 2.0%
MECO $/kWh 0.236 0.267 0.243 0.349 0.377 0.367 0.366 0.296 -19.1% 2.3%
KIUC $/kWh 0.287 0.345 0.294 0.411 0.426 0.419 0.407 0.324 -20.6% 1.2%
Source: Hawaii Electric Utility Monthly Financial Reports.

46
Table 33 shows the statewide average electricity price by sector in Hawaii, sourced from
EIA data. The data shows prices by sector from 1990 to 2014 are provided.
Table 33. Average Electricity Price by Sector in Hawaii
Residential Commercial Industrial Other Total
Year Cents/kWh Cents/kWh Cents/kWh Cents/kWh Cents/kWh
1990 10.26 10.18 7.57 9.40 9.02
1991 10.52 10.33 7.71 9.56 9.22
1992 10.90 10.53 7.83 9.71 9.44
1993 12.28 11.68 8.95 11.26 10.66
1994 12.45 11.67 8.82 11.21 10.68
1995 13.32 12.16 9.27 12.11 11.29
1996 14.26 12.99 10.03 12.91 12.12
1997 14.80 13.26 10.32 13.20 12.49
1998 13.82 12.31 9.41 12.28 11.56
1999 14.30 12.74 9.70 12.66 11.97
2000 16.41 14.81 11.69 14.76 14.03
2001 16.34 14.81 11.68 16.81 14.05
2002 15.63 14.11 11.02 16.85 13.39
2003 16.73 15.02 12.20 NA 14.47
2004 18.06 16.19 13.35 NA 15.70
2005 20.70 19.04 15.79 NA 18.33
2006 23.35 21.42 17.96 NA 20.72
2007 24.12 21.91 18.38 NA 21.29
2008 32.50 29.72 26.05 NA 29.20
2009 24.20 21.86 18.14 NA 21.21
2010 28.10 25.93 21.94 NA 25.12
2011 34.68 32.37 28.40 NA 31.59
2012 37.34 34.88 30.82 NA 34.04
2013 36.98 34.05 29.87 NA 33.26
2014 37.04 34.21 30.22 NA 33.43
Source: Energy Information Administration, State Energy Data System

47
6. Electricity Demand
The overall demand for electricity can be met through several alternative channels.
Electricity users can purchase electricity from the utilities (generated by utility and non-utility
producers) and/or generate electricity by themselves. Another option is to reduce electricity
demand through electricity savings displacement projects such as solar water heating (SWH) and
energy efficiency technologies such as the demand-side-management (DSM) programs. Total
electricity generated by the electric power industry (including both utility and non-utility
producers) includes electricity sold by the utilities, system losses, and station use by both utility
and non-utility electricity producers. Data for electricity sold by the utilities, system losses and
station use of utilities was available; however, the station use of purchased electricity from non-
utility producers was not available. Therefore, we estimated this value with the assumption that
the percentage of station use in gross generation for non-utility producers was the same as that for
utility producers.
For the data on electricity generated and consumed by the final users, only the electricity
generated from PV systems was available. The electricity saved from the SWH and DSM
programs were available up to 2014. The values of electricity saved from the SWH and DSM
programs in 2015 were estimated based on the historical trend. In this study, we define total
electricity demand as the sum of gross generation by the electric power industry, electricity
generated and consumed by the customers (mainly from the customer-sited solar systems), and
electricity saved by the SWH and DSM programs.
From 2005 to 2015, total electricity demand in Hawaii increased only slightly, with an
average annual increase of 0.4 percent per year from about 12,280 GWH to 12,794 GWH (Table
34). Decreased gross generation by the electric power industry was offset by electricity savings
and customer-sited generations. Over this period, electricity generation by the electric power
industry decreased 1.2 percent per year from 11,755 GWH to 10,450 GWH, electricity generated
by user owned PV systems increased 75.3 percent per year from 2 GWH to 665 GWH; electricity
replaced by SWH increased 6.7 percent per year from 84 GWH to 160 GWH; and electricity
replaced by DSM programs increased 13.2 percent per year from 439 GWH to 1,518 GWH. This
analysis estimated that the share of gross electricity generation produced by the electric power
industry decreased from 95.7 percent in 2005 to 81.7 percent in 2015, a decrease of 14.0 percentage
points.

48
Table 34. Total Electricity Demand in Hawaii
Electricity Generation and Conservation (Demand-Side-Management)
Units: GWH
Gross 1/ By Users Gross
Year Generation PV SWH DSM Sub-Total Total
2005 11,755 2 84 439 525 12,280
2006 11,803 4 95 497 596 12,399
2007 11,822 8 109 619 736 12,558
2008 11,601 12 117 750 880 12,481
2009 11,282 33 130 809 972 12,254
2010 11,194 53 172 916 1,141 12,335
2011 11,104 90 180 1,027 1,298 12,402
2012 10,758 190 185 1,210 1,584 12,342
2013 10,598 356 174 1,320 1,850 12,447
2014 10,467 532 160 1,416 2,108 12,575
2015 2/ 10,450 665 160 1,518 2,344 12,794
Growth 05-15 -1.2% 75.3% 6.7% 13.2% 16.1% 0.4%
Changes 05-15 (1,305) 662 76 1,080 1,818 513
Electricity Generation and Conservation (Demand-Side-Management)
Units: % in Gross Total
Gross 1/ By Users Gross
Year Generation PV SWH DSM Sub-Total Total
2005 95.7 0.02 0.68 3.57 4.3 100.00
2006 95.2 0.03 0.77 4.01 4.8 100.00
2007 94.1 0.06 0.87 4.93 5.9 100.00
2008 93.0 0.10 0.94 6.01 7.0 100.00
2009 92.1 0.27 1.06 6.60 7.9 100.00
2010 90.7 0.43 1.39 7.43 9.3 100.00
2011 89.5 0.73 1.45 8.28 10.5 100.00
2012 87.2 1.54 1.50 9.80 12.8 100.00
2013 85.1 2.86 1.40 10.60 14.9 100.00
2014 83.2 4.23 1.28 11.26 16.8 100.00
2015 2/ 81.7 5.20 1.25 11.87 18.3 100.00
1/ Including station use of non-utility producers. Estimated by DBEDT.
2/ 2015 SWH and DSM data are estimated by DBEDT
Source: HECO and KIUC Renewable Portfolio Standard Status Report and DBEDT estimate.
49
7. Conclusions
In recent years, electricity generated by utilities as a percentage of the total electricity
generated has decreased significantly. From 1990 to 2015, the share of utility generated electricity
decreased 28.7 percentage points, from 82.4 percent to 53.7 percent. A large part of this decrease
can be attributed to an increase in electricity purchased by the utility, which has replaced electricity
generated by the utility. Since the average cost of electricity purchased by the utility was below
the average fuel cost of utility generated electricity in most of the years from 2005 to 2014, the
increased share of purchased electricity had helped reduce the cost of electricity sold by the utility.
In 2015, however, the average cost of electricity purchased by the utility was above the average
fuel cost of utility generated electricity due to reduced petroleum price.
Not all the electricity generated by the electric power industry is sold to the utility
customers. In 2015, about 5.5 percent of the gross electricity generated by the utilities in Hawaii
was consumed by the utility owned power stations. In addition, about 5.0 percent of utility net
generation (gross generation minus station use) and purchased power was lost during electricity
transmission and distribution. Therefore, less than 90 percent of the electricity generated was sold
to utility customers.
From 2005 to 2014, the average fuel cost per kWh of electricity generated by the utilities
in Hawaii increased an average of 9.2 percent per year from 10.0 cents/kWh to 22.1 cents/kWh.
The fuel cost increase was significantly higher than the 4.8 percent average cost increase for
purchased electricity, which increased from 11.0 cents/kWh to 16.8 cents/kWh during the same
period. In 2015, however, the average fuel cost per kWh of electricity generated by the utilities in
Hawaii decreased 41.7 percent from 22.1 cents/kWh to 12.9 cents/kWh. In 2015, the average cost
of purchased electricity was 7.4 percent above the average fuel cost of utility generated electricity.
The average cost of purchased electricity in 2015 was the lowest at HECO at about 13.2
cents/kWh. The lower average cost of purchased power at HECO was partially due to the lower
purchased power cost from coal generated electricity. The average cost of purchased power from
coal generated electricity was less than 10 cents/kWh, lower than the average cost of purchased
power by HECO.
The relatively slower growth in purchased power prices from 2005 to 2014 was due to a
high and increasing share of electricity being generated from non-petroleum sources including coal
and renewable energy by non-utility producers. In 2014, about 94.9 percent of utility generated

50
electricity was from petroleum; in contrast, only 36.1 percent of non-utility generated electricity
was from petroleum.
From 2005 to 2012, the average unit petroleum cost for the four electric utilities in Hawaii
increased an average of 13.2 percent per year, from $57.57 per BBL to $136.88 per BBL. Fuel oil
costs increased the most at an average 14.9 percent per year from $51.22 per BBL to $135.72 per
BBL. This was followed by diesel oil (excluding biodiesel) costs increasing an average 8.9 percent
per year, from $77.36 per BBL to $140.52 per BBL. It is important to note that the average crude
oil price only increased an average 7.6 percent per year over the same period. In 2013 and 2014,
the unit fuel oil cost decreased 5.8 percent and 1.2 percent, respectively, from the previous year.
The unit diesel cost also decreased. In 2015, the unit fuel oil cost decreased 45.7 percent and the
unit diesel cost decreased 34.8 percent from the previous year.
From 2005 to 2014, the average revenue from electricity sold in Hawaii increased 7.0
percent per year, from 18.3 cents/kWh to 33.5 cents/kWh. In 2015, the average revenue from
electricity sold in Hawaii decreased 21.6 percent, from 33.5 cents/kWh to 26.3 cents/kWh.
In addition to the fuel and purchased power costs, the cost of electricity was also affected
by four other factors. The operating income of the utilities accounted for about 8.2 percent, taxes
accounted for about 12.8 percent, depreciation and amortization accounted for about 7.8 percent,
and other utility operating expenses accounted for about 18.3 percent of total electricity prices paid
by consumers in 2015. Other utility operating expenses include other operation and maintenance
expenses, transmission and distribution expenses, customer accounts and service expenses, and
administration and general expenses. The total of these other costs have increased from $777
million in 2005 to $1,163 million in 2015, an average increase of 4.1 percent per year. This growth
rate was higher than the 2.8 percent average inflation rate (Honolulu CPI-U) during the same
period.
Total electricity sold by utilities decreased over the period analyzed. A large part of this
decrease was due to reduced consumption caused by the installation of customer-sited solar
systems. From 2005 to 2015, total electricity sold decreased an average 1.1 percent per year in
Hawaii. The largest decrease during this period was for residential customers, which decreased
an average 2.1 percent per year from 3,164 GWH to 2,558 GWH. In contrast, electricity sold to
the commercial sector and the industrial sector only decreased an average 1.0 percent and 0.6

51
percent per year, respectively. As a result, the residential sector share of total electricity sold
decreased from 30.0 percent in 2005 to 27.2 percent in 2015.
The analysis showed that the decrease in electricity consumption was due to a decrease in
consumption per customer, rather than a decrease in the number of customers. From 2005 to 2015,
total utility customers for the state increased 0.7 percent per year. Industrial customers increased
the most at 1.3 percent per year. This was followed by residential customers with an increase of
0.7 percent per year and commercial customers which increased 0.1 percent per year.
Electricity demand can be met by both electricity generated from the electric power
industry (including both utility and non-utility producers), energy conservation (such as the DSM
programs), electricity savings displacement projects (such as SWH), and user generated electricity
(such as user installed PV systems). From 2005 to 2015, the total share of electricity generated by
the electric power industry as a percentage of total electricity demand in Hawaii decreased 14.0
percentage points, from 95.7 percent to 81.7 percent. Without the electricity generated and
conserved by users, total electricity expenditure in Hawaii would have been higher.