Hauora Tairāwhiti
77
Hauora Tairāwhiti Annual Report For the Year End 30 June 2016
Transcript of Hauora Tairāwhiti

Hauora Tairāwhiti Annual Report For the Year End 30 June 2016

VERSION # DATE: CHANGES: REVIEW BY REVIEW DATE:
V1.0 13.10.16
V1.1 19.10.16 Inclusion of Financial Notes
V1.2 21.10.16 Update to SSP
V1.3 26.10.16 Update to SSP
V1.4 31.10.16 Final Updates and contents page
2

Contents Our District 4
Governance & Accountability Statement 5
Our Achievements 12
2015/16 Performance Overview 16
Summary of Revenue & Expenses by Output Class 41
Statutory Information 42
Statement of Responsibility 44
Independent Auditor’s Report 45
Statement of Comprehensive Revenue & Expense 49
Statement of Financial Position 50
Statement of Changes in Equity 51
Statement of Cash Flow 52
Notes to Financial Statements 53
3

Our District
Hauora Tairāwhiti funds and provides health and disability services for a large area of the northern East Coast of the North Island of New Zealand, stretching from beyond Hicks Bay in the north to the Wharerata Ranges in the south and inland to Motu in the west.
Background Hauora Tairāwhiti is a crown entity, established on 1 January 2001, responsible for funding, providing, and ensuring the provision of personal health, mental health and Māori health services to the resident population of the district and disability support services for residents over 65 years of age.
4

Hauora Tairāwhiti 's role is three fold, namely Owner/Governance, Funder, and Provider of public health and disability services in the district.
Our Mission Statement “Working together, to elevate the wellbeing of Tairāwhiti." "Mahia nga mahi i roto i te kotahitanga kia piki ake te oranga o te Tairāwhiti.
Governance and Accountability Statement
Role of the Board The people of Tairāwhiti elected seven members to the Board in October 2013. The Minister of Health appointed a further four members to form the governing Board.
All Board members are required to act in the best interests of Hauora Tairawhiti. Members acknowledge that the Board must stand unified behind its decisions; individual members have no separate governing role outside the boardroom.
5

Directory Board Members David Scott (Chair) Appointed, June 2010
Reappointed, December 2010 Reappointed, December 2013
Craig Bauld Elected, November 2001 Re-elected, October 2004 Re-elected, October 2007 Re-elected, October 2010 Re-elected, October 2013
Barbara Clarke Elected, October 2004 Re-elected, October 2007 Re-elected, October 2010 Re-elected, October 2013
Rehette Stoltz Elected, October 2013 Geoff Milner Appointed, December 2010
Reappointed, December 2013 Maaka Tibble Elected, October 2013 Erana Reedy Appointed, December 2013 Kathy Sheldrake Elected, October 2010
Re-elected, October 2013 Matt Todd Appointed, December 2010
Reappointed, October 2013 Clive Bibby Elected, October 2013 Brian Wilson Elected, October 2007
Re-elected, October 2010 Re-elected, October 2013
Corporate Office
Hauora Tairāwhiti Private Bag 7001 421 Ormond Road Gisborne 4040
Profile of the Board The Board carries out its governance role through regular formal meetings and through associated subcommittees. The Board has a partnership relationship with each of the Runanga in Tairāwhiti. It also has a Caucus Accord with local Māori representing iwi, Māori providers, and Māori organisations, through Te Waiora o Nukutaimemeha Māori Relationship Board. A partnership relationship also exists with the Pacific Islands Community Trust. Hauora Tairāwhiti was established under the New Zealand Public Health and Disability Act 2000 and as such has to fulfil the three distinct roles of a District Health Board (DHB) namely owner/governance, funder, and provider of services as appropriate in the context of Tairāwhiti. The funding arm, Te Puna Waiora (Spring of Wellness), leads the process of assessing the needs and planning for the services required by the people of Tairāwhiti.
6

The team administers the agreements generated through the funding process. It also has a monitoring and auditing function in most part carried out through HealthShare, the Midland DHBs’ Shared Services Agency. Hauora Tairāwhiti is the principal provider of secondary health and disability services to the people of Tairāwhiti. These services include medical, surgical, women’s health, child health, elderly, disability support, mental health, public health, and related support services. Hauora Tairāwhiti also accesses health services for the people of Tairāwhiti from organisations outside the district, primarily through referrals to Waikato Hospital and Auckland Starship for tertiary services, and Wellington for other specialist services.
Structure of Hauora Tairawhiti
DHB Operations The Board has appointed a single employee, the Chief Executive (CE), to manage all DHB operations. The CE has appointed all other employees of Hauora Tairāwhiti. The Board directs the CE by delegating responsibility and authority for the achievement of objectives through setting policy.
Board Committees The Board Advisory Committees, including those Statutory Committees required under the NZ Public Health and Disability Act 2000, were set up to provide a more detailed level of focus on particular issues. The committees have delegated authority for governance to action the Board’s policies as well as monitoring the organisation’s progress towards meeting Hauora Tairāwhiti’s objectives. The committees also have formal budgetary delegations to fund services or approve expenditure on Hauora Tairāwhiti’s behalf. The Board’s standing committees (including the statutory permanent advisory committees) are: Committee: Community and Public Health (CPHAC) - Bi-Monthly and Community Open Forums twice annually Aged & Disability Support Advisory (ADSAC) - Bi-Monthly and Community Open Forums twice annually Hospital Advisory (HAC) - Monthly Finance Audit & IT (FAIT) - Monthly Te Waiora o Nukutaimemeha Iwi Relationship Board (TWON) - Monthly Staffing & Governance Committee (S & G) - Quarterly or as required.
Advisory Committee Members The Committees include, in addition to selected Board members, representatives from the Tairāwhiti community selected through an application process.
7

Quality Improvement The Clinical Governance Committee oversees the quality improvement environment at Hauora Tairāwhiti reporting through the Chief Executive to the Board on patient safety matters and clinical quality improvement. Through these mechanisms the Board guides the overall setting of the Hauora Tairāwhiti Quality Plan. It is important to note that the Quality Plan for Hauora Tairāwhiti extends beyond its own provider services to include the operation of the funding arm and the activities of providers with agreements with Hauora Tairawhiti. The monitoring and audit plan for Hauora Tairāwhiti, completed in conjunction with HealthShare and the Minitsry of Health’s Sector Services, follows the quality improvement activity of providers. Reporting to the Board of audits for these providers is made through the FAIT Committee for overview.
Subsidiaries and Associates
Group Organisational Structure
Tairawhiti Laundry Services Limited (TLSL) TLSL (registered under the Companies Act 1993) is a wholly owned subsidiary of Hauora Tairāwhiti and is the holding company for its 50 percent investment in the Gisborne Laundry Services Partnership.
Gisborne Laundry Services (GLS) GLS is a partnership between TLSL and Mahia Resort Limited that provides laundry services to Gisborne Hospital, its associated services, and other commercial laundry services to external customers.
Tairawhiti District Health
Tairawhiti Laundry Services
Ltd 100%
Gisborne Laundry Services 50%
HealthShare Limited 20% TLab Limited 50%
8

HealthShare Limited (HSL) HSL (registered under the Companies Act 1993) is the Midland Region DHBs’ shared services agency, which is owned in equal shares by the five DHBs of the Midland Region. The company provides specialist audit services to DHBs, other support service roles in areas such as internal audit, workforce development, regional planning and clinical network coordination, where this improves the effectiveness and efficiency of DHB operations.
TLab Limited (TLAB) TLab Ltd (registered under the Companies Act 1993) is the 50/50 joint venture company between Hauora Tairāwhiti and MedLab Central Ltd, which provides laboratory services at Gisborne Hospital and for the wider Tairāwhiti community. The Company was established on 1 September 2007.
Governance Philosophy
Connection with Stakeholders The Board acknowledges its responsibility to keep in touch with stakeholders and, in particular, remain cognisant of the Minister of Health’s expectations.
Division of Roles between the Board and Management The efficient running of Hauora Tairāwhiti requires a clear division between the roles of the Board and Management. The Board concentrates on setting policy, approving strategy, and monitoring progress towards meeting objectives. Management is concerned with implementing policy and strategy. The Board has clearly distinguished these roles by ensuring that the delegation of authority to the CE is concise and complete as delineated in the approved delegation policy.
Accountability The Board holds meetings most months and monitors progress toward its strategic objectives. The Board also ensures Hauora Tairāwhiti actions and those of its subsidiary and associates adhere to Hauora Tairāwhiti’s policies.
Members’ Interests The Board maintains an Interests Register and ensures members are aware of their obligations to declare any interests they may have in matters under consideration by the Board or in the wider operations of Hauora Tairāwhiti.
9

At least on an annual basis, or as interests arise, the CE and direct reports to the CE are required to make a declaration of interests, which the Board Chair reviews for any conflicts, with associated management strategies put in place. These interests are also reported to the Board.
Internal Audit Overall responsibility for maintaining effective systems of internal control ultimately rests with the Board. Internal controls include the policies, systems, and procedures established to provide assurance that specific objectives of the Board are achievable, and that reporting to the Board is reliable. The Board and Management have acknowledged their responsibility by signing the Statement of Responsibility which can be found on page 44 of this report. Hauora Tairāwhiti contracts an Internal Audit function through the Internal Audit division of HealthShare, which is responsible for monitoring its systems of internal control and the quality and reliability of financial and non-financial information reported to the Board. Internal Audit operates independently of management and reports its findings directly to the Board’s FAIT Committee, which in turn reports any issues or concerns to the Board. Internal Audit liaises closely with the external auditors, who review the systems of internal control to the extent necessary to support their audit opinion.
Risk Management The Board acknowledges that it is ultimately responsible for the management of risks to Hauora Tairāwhiti. The Board has charged the CE, through its Risk Management Policy, with establishing and operating a risk management programme in accordance with the “Guidelines for Managing Risk in the Australian and New Zealand Public Sector SAA/NZSHB 143:1999”. The FAIT committee receives three monthly reports on the risk management programme.
Legislative Compliance The Board acknowledges its responsibility to ensure the organisation complies with all legislation. The CE has delegated authority from the Board to develop and operate a programme that systematically identifies compliance issues and ensures staff awareness of legislative requirements that are particularly relevant to them. The FAIT committee receives a quarterly report on the legislative compliance programme.
10

Board Members Register of Interest The following are particulars of entries in the Interest Register made by Board members for the period between 01 July 2015 and 30 June 2016 . Report of Permissions under Section 68(6) of the Crown Entities Act 2004 Board Member
Transaction / Matter
Conflict Arising Nature of Conflict/s Board Response / Action
Oct-15
Brian Wilson
Item 16.2: Medirest Cleaning, Orderly & Security Services
Wife employed by Medirest.
Medirest hold the contract to provide food services to TDH and the decision by HBL may affect the future employment of the member's spouse with that company.
Mr Wilson was asked to refrain from speaking or contributing to the decision.
Nov-15
Craig Bauld Item 10.1: Submission on Gisborne District Gambling Poicy
Gisborne District Councillor and representative on the relevant GDC Sub-Committee
TDH submission is being presented to GDC Council for consideration. The conflict is in relation to the member's role as a Councillor deciding over the issue at Council and on the TDH Board making the submission.
Mr Bauld was asked to refrain from speaking or contributing to the decision.
Rehette Stoltz
Item 10.1: Submission on Gisborne District Gambling Poicy
Gisborne District Councillor and representative on the relevant GDC Sub-Committee
TDH submission is being presented to GDC Council for consideration. The conflict is in relation to the member's role as a Councillor deciding over the issue at Council and on the TDH Board making the submission.
Ms Stoltz was asked to refrain from speaking or contributing to the decision.
Na Raihania
Item 16.1 East Coast Review Update
Member of TRONPnui Board (term yet to be commenced)
Hauora Tairāwhiti and TRONPnui are collaborative partners in the Ngāti Porou Health Services on the East Coast: Service Model and Base Facility Feasibility review.
The Board agreed Mr Raihania could remain and participate in the discussion given the Board term has yet to be commenced and because TRONPnui are a collaborative partner with NPH and Hauora Tairāwhiti in the review.
Apr-16 Na Raihania
Item 13.2 East Coast Review
Member of TRONPnui Board
The paper reflects Hauora Tairāwhiti position in relation to the Ngāti Porou Health Services on the East Coast: Service Model and Base Facility Feasibility review.
The members agreed that as this item was for the purposes of an interim discussion, Mr Raihania be invited to remain and speak to the paper.
11

3.0 – Our Achievements
Chair’s Report Kia ora Koutou This year has seen the Board and the Chief Executive initiate the most significant organisational cultural change in the history of the District Health Board. Before officially commencing the change process the Chief Executive and I proceeded to Wellington to brief and seek the sanction of both the Minister of Health and the Director General of the Ministry of Health. Following extensive presentations, discussions and debates the decision was made to totally change direction and commence a new and innovative approach to improving the health of people living in Tairāwhiti. This change involved the creation of four key values i.e. Whakarangatira (Enrich) Awhi (Support) Kotahitanga (Togetherness) Aroha (Compassion) as well as changing the name of the organisation to Hauora Tairāwhiti. These four key values underpin the new culture within the organisation and a deal of time was also spent introducing and workshopping the values with the staff. Our poor health statistics; especially the lower than (both other cultures in Tairāwhiti plus average NZ statistics) life expectancy of Maori in Tairāwhiti really dictated change. It was patently clear that the best intentioned health care delivery provided by Hauora Tairāwhiti over the past fifteen years was not working and therefore clearly if we carried on doing the same thing we would get the same results. A conscious decision was also made that Hauora Tairāwhiti would work hard outside the ‘health box’. Close relationships are being forged with other social service agencies i.e. WINZ, Housing NZ, Police, Education and Sport Gisborne. This close working relationship is also being supported by the Government with their proposed ‘Social Investment Cross Agency’ programme. The inherent difficulty with the new Hauora Tairāwhiti pathway is that it is not an immediate or even near future solution; but something that will not be clear, as indicated by emerging results, until 10 or 15 years. We are laying the foundations for a very healthy region with markedly better longevity and a population who take great responsibility for their own health. Another innovation this year has been the marked growth in life-changing bariatric surgery with a team led by Surgeon Mr Peter Stiven. Nine people have benefitted from this skilled team whereas in previous years we might have been lucky to secure surgery out of the district for two people. This year also saw the retirement of our long-serving Chief Financial Officer Mr Mike Costello. He was given an appropriate farewell after 16 years of loyal service. The Chief Executive and Leadership Team, Clinicians and all staff are to be congratulated on the this year’s effort to diagnose, educate and treat our unhealthy population as well as committing to and cooperating with the new forward looking Hauora Tairāwhiti. David S Scott MNZM, JP Chair –Hauora Tairāwhiti Board June 2016
12

Chief Executive’s Report When I wrote the equivalent summary to this last year I signed it out in this way:- We did well in 2014/15 however we have big challenges ahead to keep the momentum on the care and services, and rein in our costs of doing that. With the benefit of looking back over the year now we kept the momentum on care and services but have not been able to rein in our costs. What happened? First of all we changed our name and took a fresh look at how we appear to the world. We rededicated ourselves to service to the community through our WAKA values of whakarangatira, awhi, kotahitanga and aroha. Through a variety of events and methods over the year we have kept the profile of Hauora Tairāwhiti up within our organisation, the community and nationally. Our staff have responded in providing a very positive assessment of our new persona. We have a springboard for moving forward. We have created new records for elective services for our community. This year we surpassed the previous elective services discharges total and produced at 115% of target. This is our best ever performance and we can list where Tairāwhiti people got the benefit of these procedures. At the same time though our acute services have seen a significant ramp up in throughput, against the trend of the past five years of diminishing volumes. ED attendances have been up month on month on prior years and this has converted to acute admissions, although our staff have done well to temper the influx with assistance from primary care. In the community there have been significant developments that have meant new possibilities for Tairāwhiti people. The E Tipu E Rea programme has generated life changing outcomes for the children and families involved. The iwi providers have supported parenting and made practical contributions to families like supporting parents to get drivers licenses, removing stress and cost for families and increasing changes of employment. The high rate of cardio-vascular risk assessments and are plans completed in primary has directly resulted in a reduction in people presenting at Gisborne Hospital with heart attacks. The work of the Nurse Practitioner in Aged care has supported older people to remain longer where they live, not being transferred to Gisborne Hospital late in their lives. The pathways for faster treatment of cancer have meant that there was a 20% (or 50 people) increase in people diagnosed with cancer at Gisborne Hospital, meaning those diagnoses were earlier which leads to more successful treatment. For Health Targets we have met the hospital based targets for Emergency Department patient flow and elective discharges. The Cancer Treatment target has been more difficult to achieve. Pushing toward the 85% target for people referred to treatment within 62 days has been hampered by our population dynamics, staffing, generalist workforce, information systems, competing demands and distance from specialist tertiary services. We are responding to all those factors but it is taking time. For the community based Health Targets we have met those for smoking advice in primary care the rate of heart and diabetes checks. More difficult to achieve has been the target for immunisation at 8 months which was at 90% on a 95% target. Our teams across primary care and within Hauora Tairāwhiti have worked extremely hard to ensure coverage is lifted as high as possible. New ways to support families are being tried and in the further development of programmes such as E Tipu e Rea we see new opportunities. Service developments throughout the year have accentuated the care we can provide for our community. The support of secondary mental health services for primary care has seem more people with mental health issues returned to primary care where there is better all-round care coordination. Clinician teams have lead
13

innovations such as specialised clinics for people following stroke or the expansion of local surgery options including laparoscopic urological surgery. Nine people have had life changing bariatric surgery when in prior years we struggled to secure surgery out of district for two. Innovative new clinical service delivery has occurred in mental health with the Mahi a Atua care paradigm. Additional to this we have ideas for even more service delivery innovations and additions. Our imagination is only constrained by the reality of our situation and the unexpected acute burden we have had to respond to. Service quality is also a feature of our year but in some respects our results are frustrating. For example our hand hygiene rates have been persistently down despite strong clinical leadership to drive improvement. Our falls reduction programme has seen more input to the design and implementation of systems to reduce falls, but more serious incidents. However the revamping of our Clinical Governance Group is leading even stronger clinical leadership with significant innovations such as our first full multi-disciplinary mortality and morbidity review meetings. And the audit against the Health and Disability Sector Safety Standards drew compliments on our service delivery, with our lowest number of corrective action requests. There is no doubting though that you cannot have it all. On the back of what has been a testing year across the whole of the organisation we have not been able to claw back our deficit. Instead the deficit has increased to ($6.7m) from ($3.5m) last year. Disappointing to say the least. We did well in 2015/16, with even more troubled waters for our waka. However our crew are determined, innovative and strong. So we go forward a longer distance in 2016/17, with way less shipped water. Jim Green Chief Executive
14
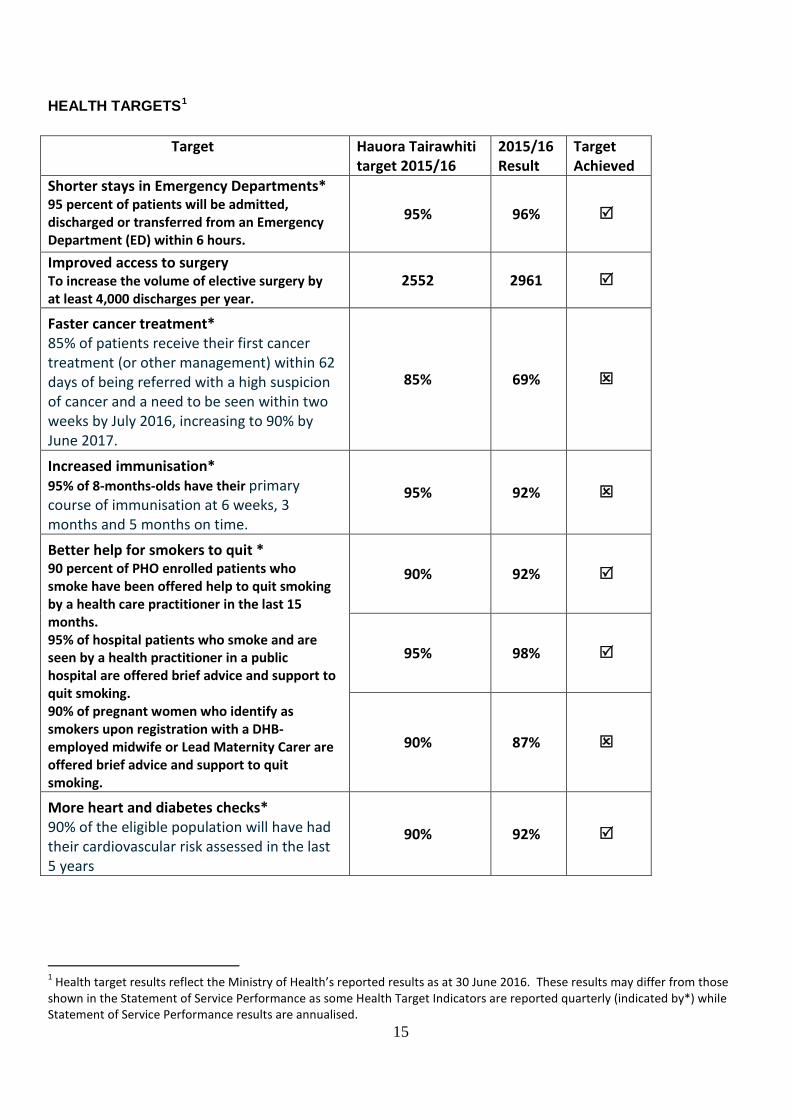
HEALTH TARGETS1
Target Hauora Tairawhiti target 2015/16
2015/16 Result
Target Achieved
Shorter stays in Emergency Departments* 95 percent of patients will be admitted, discharged or transferred from an Emergency Department (ED) within 6 hours.
95% 96%
Improved access to surgery To increase the volume of elective surgery by at least 4,000 discharges per year.
2552 2961
Faster cancer treatment* 85% of patients receive their first cancer treatment (or other management) within 62 days of being referred with a high suspicion of cancer and a need to be seen within two weeks by July 2016, increasing to 90% by June 2017.
85% 69%
Increased immunisation* 95% of 8-months-olds have their primary course of immunisation at 6 weeks, 3 months and 5 months on time.
95% 92%
Better help for smokers to quit * 90 percent of PHO enrolled patients who smoke have been offered help to quit smoking by a health care practitioner in the last 15 months. 95% of hospital patients who smoke and are seen by a health practitioner in a public hospital are offered brief advice and support to quit smoking. 90% of pregnant women who identify as smokers upon registration with a DHB-employed midwife or Lead Maternity Carer are offered brief advice and support to quit smoking.
90% 92%
95% 98%
90% 87%
More heart and diabetes checks* 90% of the eligible population will have had their cardiovascular risk assessed in the last 5 years
90% 92%
1 Health target results reflect the Ministry of Health’s reported results as at 30 June 2016. These results may differ from those shown in the Statement of Service Performance as some Health Target Indicators are reported quarterly (indicated by*) while Statement of Service Performance results are annualised.
15

Statement of Performance To perform our functions well the actions we take must:
• Help deliver our outputs • make the impacts we intend; and • contribute to the achievement of our outcomes.
In order to do so we have identified a set of performance measures against which we can evaluate our performance as an organisation on an annual basis. The measures chosen are a mixture of indicators of quantity, quality and timeliness in our priority areas. The targets we set for these measures were determined by factors including national direction, population demographics, assumption of little increase in funding and the actions we will or have undertaken. The measures and targets are outlined in our Statement of Forecast Service Performance for 2014/172 with the following section presenting the results achieved against the identified targets.
Structure of this section The map on the next page shows the linkages between the 4 output classes below and Hauora Tairawhiti’s 4 high level outcomes. By including short term, medium term and long term measures linking high level outcomes and output classes we can demonstrate clear pathways to improving the health of Tairawhiti.
Output Classes Outputs are goods and services that are supplied to someone outside our DHB. Output classes are an aggregation of outputs, or groups of similar outputs of a similar nature. The output classes used in our statement of forecast service performance are also reflected in our financial measures. The four output classes that have been agreed nationally are described below. They represent a continuum of care, as follows:
2 The statement of forecast service performance is published in our Statement of Intent : http://www.tdh.org.nz/about-us/documents-and-publications/accountability-documents/
16

Map of Indicators
Key
Long Term Outcome Measures
Medium Term Impact Measures
Short Term Output Measures
17

2015/16 Performance Overview 2015/16 has seen another record year in terms of Tairawhiti residents receiving elective surgery with a 35% increase in volumes compared to 2014/15. We have seen further increases in the number of inpatients receiving advice and support to quit smoking during 2015/16 and have also seen the average length of inpatient stay fall. Our rates of vaccination against the Human Papilloma Virus (HPV) are amongst the highest in the country with our rates of immunisation by Maori females under 20 years of age reaching 98% in 2015/16 and total population rates topping 80%. Immunisation rates for 8 month old infants fell during this year and along with raising the numbers of elderly in our region receiving influenza vaccinations will be a focus area for the coming year. The number of people receiving a Green Prescription in 2015/16 was the highest in the past 3 years and is demonstrative of the Hauora Tairawhiti commitment of ‘A healthier Tairawhiti by working together”. This is further enhanced by the increased numbers of people receiving CVD risk assessments during the past year and the increased number of young people enrolled in DHB funded dental services.
Overall the results displayed in the following section are positive and reflective of the dedication of staff throughout all areas of the health system in Tairawhiti. Each of the indicators below relies on input from Primary, Secondary and Community health providers and when all aspects work together.
PREVENTION SERVICES Preventative health services promote and protect the health of our population by improving physical and social environments and supporting people to make healthier choices. These services include education programmes to raise awareness of risk behaviours, legislation and policy to protect people from environmental risks, and health protection services such as immunisation and lifestyle programmes that support people to modify their lifestyles and maintain good health. Success is defined by positive changes in behaviours and high coverage levels, which signal engagement in programmes and the effectiveness of positive health messaging and the quality of the support and advice being provided.
Outcome 1 – People are supported to take greater responsibility for their health Why is this outcome a priority? New Zealand is experiencing a growing prevalence of long-term conditions such as diabetes and cardiovascular disease, which are major causes of poor health and account for a significant number of presentations in primary care and admissions to hospital and specialist services. We are more likely to develop long-term conditions as we age, and with an ageing population, the burden of long-term conditions will increase. The World Health Organisation (WHO) estimates more than 70% of all health funding is spent on long-term conditions. Tobacco smoking, inactivity, poor nutrition and rising obesity rates are major and common contributors to a number of the most prevalent long-term conditions. These are avoidable risk factors, preventable through a supportive environment, improved awareness and personal responsibility for health and wellbeing. Supporting people to make healthy choices will enable our population to attain a higher quality of life and to avoid, delay or reduce the impact of long-term conditions.
18

OUTCOME MEASURES - Long Term Outcome: Fewer People Smoke Smoking is a major contributor to preventable illness and long term conditions such as cancer, respiratory disease, heart disease and strokes. Cancer is the leading cause of death in New Zealand (29.8%), and is a major cause of hospitalisation and driver of cost. Cancer also highlights continuing inequalities, with Māori experiencing a higher incidence (20+ %), higher mortality and higher stage at presentation. Supporting our population to say “no” to tobacco smoking is our foremost opportunity to target improvements in the health of our population.
Measure: The number of Daily Smokers decreases
The 2011-13 NZ Health Survey contains the most recent DHB level data. The 2014-15 NZ Health Survey only contains national results.
Outcome: Improving health behaviours Good nutrition is fundamental to health and prevention of disease and disability. Nutrition-related risk factors (such as high cholesterol, high blood pressure and obesity) jointly contribute to two out of every five deaths in New Zealand each year. By seeing a reduction in obesity, a proxy measure of successful health promotion and engagement, and a change in the social and environmental factors that influence people to make healthier choices.
5-14 Years 15+ Years Maori Total Maori Total
2006/07 14.3% 9.0% 37.5% 22.8% 2011/12 12.7% 8.4% 43.0% 26.5% 2012/13 16.1% 10.2% 45.3% 27.8% 2013/14 16.6% 10.4% 45.8% 29.7% 2014/15 14.8% 10.3% 46.5% 30.7%
Measure: Obesity Rates for Children and Adults decrease
Data Source: 2014/15 New Zealand Health Survey.
19

IMPACT MEASURES – Medium Term Outcome: Fewer People Smoke In order to have the greatest impact, we will support people from taking up smoking in the first place (Year 10 students), working our way through the continuum from prevention, to detection (identifying adults who smoke and offering them cessation advice), and ultimately reducing the number of people who smoke.
Year 10 Students in Tairawhiti who report they have never smoked
2013 2014 2015 61% 72% 69%
Measure: The number of year 10 Students who have never smoked increases
Outcome: Reduction in vaccine preventable diseases Immunisation can prevent a number of diseases and is a very cost-effective health intervention. Immunisation provides protection not only for individuals but for the whole population by reducing the incidence of diseases and preventing them from spreading to vulnerable people or population groups.
Q4 12/13
Q4 13/14
Q4 14/15
Q4 15/16
Tairawhiti 89% 91% 91% 90%
National 90% 92% 93% 93%
Measure: More Children are fullly Immunised at 8 months of age
Data Source -. ASH New Zealand. 2015. National Year 10 ASH Snapshot Survey.
20

Outcome: Improving health behaviours People gain weight when they consume more energy than they use. What a person eats and drinks, and how much activity they do directly affects whether they gain, lose or stay the same weight. As well as helping you reach or maintain a healthy weight, regular activity can lower your stress levels, improve your posture, help you sleep better, and keep your bones and muscles strong. The Ministry of Health recommends people aim for at least two and a half hours of physical activity a week. Improvements in physical activity levels and diets will lead to reductions in obesity levels. The 2011-13 NZ Health Survey contains the most recent DHB level data. The 2014-15 NZ Health Survey only contains national results.
Measure: Percentage of Adults physically acitve for 30 minutes or more on 5 of the past 7 days
Outcome: Reduction in vaccine preventable diseases Population benefits only arise with high immunisation rates (herd immunity) and New Zealand’s historical rates were low by international standards and insufficient to prevent or reduce the impact of preventable diseases such as measles or pertussis (whooping cough).
2014/15 results are the most recent reliable results avaliable due to data access limitiations
Year Tairawhiti Midland Region
New Zealand
11/12 44.60 26.42 34.33 12/13 44.60 43.02 39.27 13/14 26.80 20.99 18.79 14/15 26.80 13.30 11.11
3 year Ave 52.77 25.77 22.88
Measure: The number of children 0-14 admitted to hospital for a Vaccine Preventable disease decreases
Key to Output Tables Symbol Definition
Ω Measure of Quality τ Measure of Timeliness
δ Measure of Quantity
Data Source :National Minimum Data Set
21
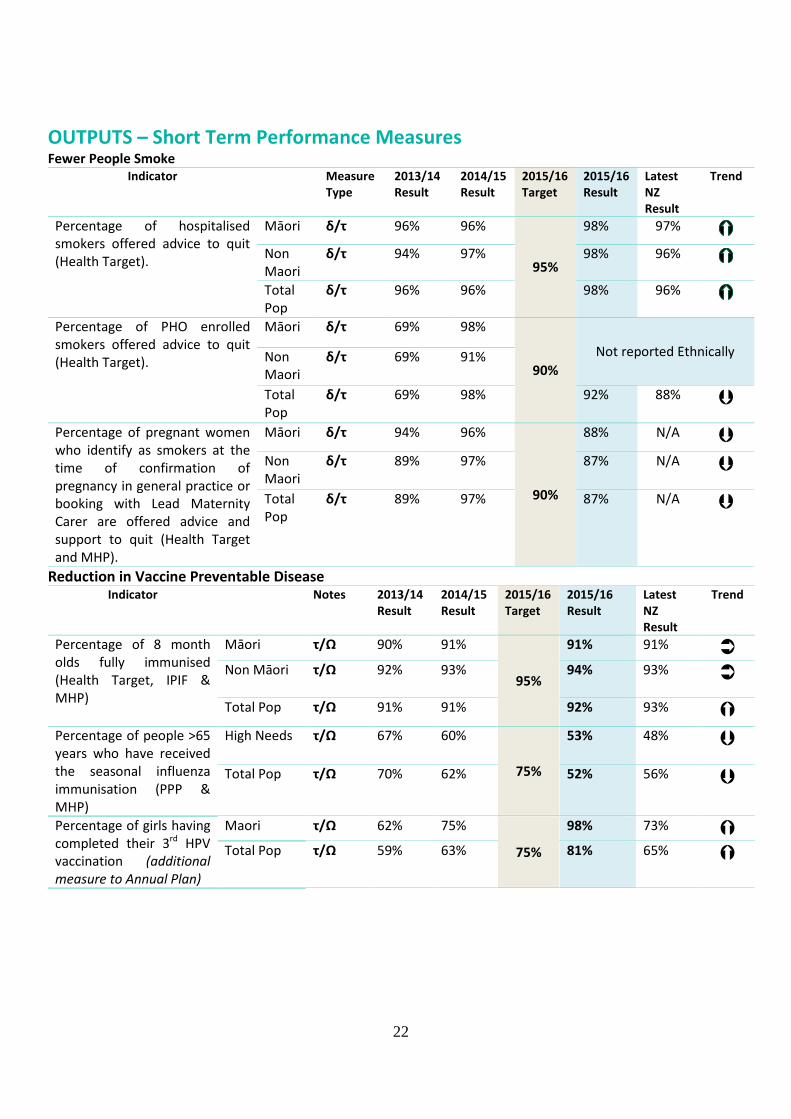
OUTPUTS – Short Term Performance Measures Fewer People Smoke
Indicator Measure Type
2013/14 Result
2014/15 Result
2015/16Target
2015/16 Result
Latest NZ Result
Trend
Percentage of hospitalised smokers offered advice to quit (Health Target).
Māori δ/τ 96% 96%
95%
98% 97%
Non Maori
δ/τ 94% 97% 98% 96% Total Pop
δ/τ 96% 96% 98% 96%
Percentage of PHO enrolled smokers offered advice to quit (Health Target).
Māori δ/τ 69% 98%
90% Not reported Ethnically Non
Maori δ/τ 69% 91%
Total Pop
δ/τ 69% 98% 92% 88% Percentage of pregnant women who identify as smokers at the time of confirmation of pregnancy in general practice or booking with Lead Maternity Carer are offered advice and support to quit (Health Target and MHP).
Māori δ/τ 94% 96%
90%
88% N/A Non Maori
δ/τ 89% 97% 87% N/A
Total Pop
δ/τ 89% 97% 87% N/A
Reduction in Vaccine Preventable Disease Indicator Notes 2013/14
Result 2014/15 Result
2015/16 Target
2015/16 Result
Latest NZ Result
Trend
Percentage of 8 month olds fully immunised (Health Target, IPIF & MHP)
Māori τ/Ω 90% 91%
95%
91% 91% Non Māori τ/Ω 92% 93% 94% 93% Total Pop τ/Ω 91% 91% 92% 93%
Percentage of people >65 years who have received the seasonal influenza immunisation (PPP & MHP)
High Needs τ/Ω 67% 60%
75%
53% 48% Total Pop τ/Ω 70% 62% 52% 56%
Percentage of girls having completed their 3rd HPV vaccination (additional measure to Annual Plan)
Maori τ/Ω 62% 75%
75%
98% 73% Total Pop τ/Ω 59% 63% 81% 65%
22

Improving Health Behaviours
Indicator Notes 2013/14 Result
2014/15 Result
2015/16 Target
2015/16 result
Latest NZ Result
Trend
Percentage of infants who are partially, fully or exclusively breastfeeding at 6 Months (MHP) (2015/16 rates as at 31 March 2016)
Māori δ/τ 10% 62%
≥59%
54% 53%
Non Maori
δ/τ 55% 66% 61% 66%
Total Pop
δ/τ 19% 66% 61% 66%
The number of people participating in the Green Prescription programmes
Total Pop
δ/τ 939 962 1024 1013 18,849
Reduce the prevalence of gonorrhoea (Local Indicator)
Total Pop
δ/τ 400 per 100,000
319 per 100,000
72 per 100,000
229 per 100,000
70 per 100,000
2015/16 Prevention Services Performance During the past year we have seen a further increase in the number of patients receiving brief advice and support to quit smoking while they are admitted to hospital. The number of women in Tairawhiti who smoke during and after pregnancy is still too high however we have seen pleasing results in the increased numbers of year 10 students who report that they have never smoked. Immunisation rates in our district have remained steady over the past year with the decrease in influenza vaccine rates being more reflective of changes in data sources from IPIF reporting to the National Immunisation Register than changes in vaccine uptakes. This decrease in rates has been noted across the midlands region. HPV rates in Tairawhiti are markedly higher than the national rates with Maori rates out performing total population rates. More people in Tairawhiti are participating in the Green Prescriptions programme which is a health professional’s written advice to become more physically active as part of a person’s overall health management process, success in this area along with increased consumption of fruit and vegetables will see obesity rates in Tairawhiti decrease.
Early detection and management services support people to better manage their long-term conditions and avoid complications, acute illness and crises. By promoting regular engagement with health services, we support people to maintain good health through earlier diagnosis and treatment, which provides an opportunity to intervene in less invasive and more cost-effective ways associated with better long-term outcomes. Success is defined by high coverage and utilisation of services, signalling engagement with and access to health services. Increases in access to diagnostics and agreed referral pathways and reductions in avoidable hospital admissions also reflect improvement.
23

Goal 2 - People stay well in their homes and communities Why is this outcome a priority? For most people, their general practice team is their first point of contact with health services. Primary care can deliver services sooner and closer to home and prevent disease through education, screening, early detection and timely provision of treatment. Primary care is also vital as a point of continuity and effective coordination across the continuum of care, particularly in improving the management of care for people with long-term conditions. Supporting primary care are a range of other health professionals including midwives, community nurses, social workers, aged residential care providers, personal health providers and pharmacists. These providers have prevention and early intervention perspectives that link people with other health and social services and support them to stay well. Studies show countries with strong primary and community care systems have lower rates of death from heart disease, cancer and stroke, and achieve better health outcomes for lower cost than countries with systems that focus on specialist level care.
OUTCOME MEASURES - Long Term Outcome: Children and adolescents have
better oral health Increasing the proportion of adolescents, in school Year 9 (13/14-year olds) up to and including 17 years of age, who have accessed DHB-funded oral health services will show that the DHB has made an impact on the outcome of protecting and promoting good oral health by providing accessible publicly-funded adolescent oral health programmes. The programmes will help reduce the prevalence and severity of oral disease in adolescents. This measure indicates the coverage of publicly-funded adolescent oral health services and provides a measure that can be used to demonstrate progress towards the population priority of “improving oral health” in the New Zealand Health Strategy.
Measure: the number of Year 9 – 17 year olds enrolled in DHB Funded dental services increases
Data above is calendar year data and is reported in quarter 3 each year.
24
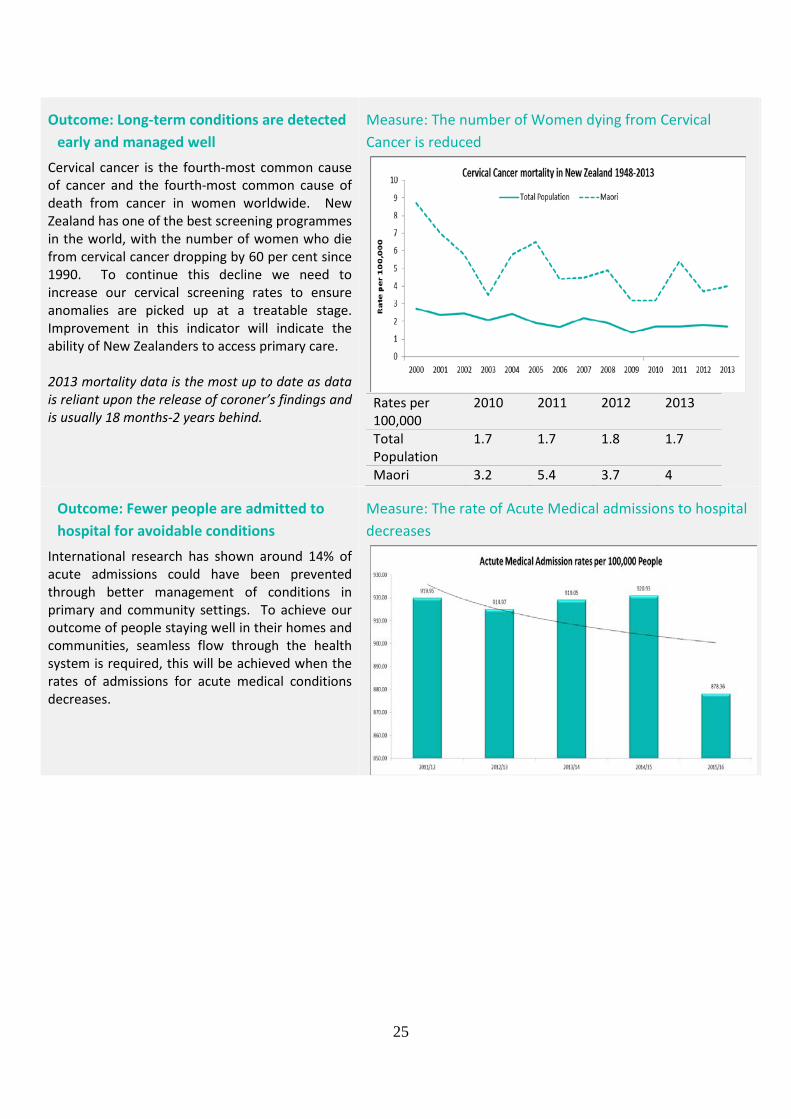
Outcome: Long-term conditions are detected early and managed well
Cervical cancer is the fourth-most common cause of cancer and the fourth-most common cause of death from cancer in women worldwide. New Zealand has one of the best screening programmes in the world, with the number of women who die from cervical cancer dropping by 60 per cent since 1990. To continue this decline we need to increase our cervical screening rates to ensure anomalies are picked up at a treatable stage. Improvement in this indicator will indicate the ability of New Zealanders to access primary care. 2013 mortality data is the most up to date as data is reliant upon the release of coroner’s findings and is usually 18 months-2 years behind.
Measure: The number of Women dying from Cervical Cancer is reduced
Rates per 100,000
2010 2011 2012 2013
Total Population
1.7 1.7 1.8 1.7
Maori 3.2 5.4 3.7 4
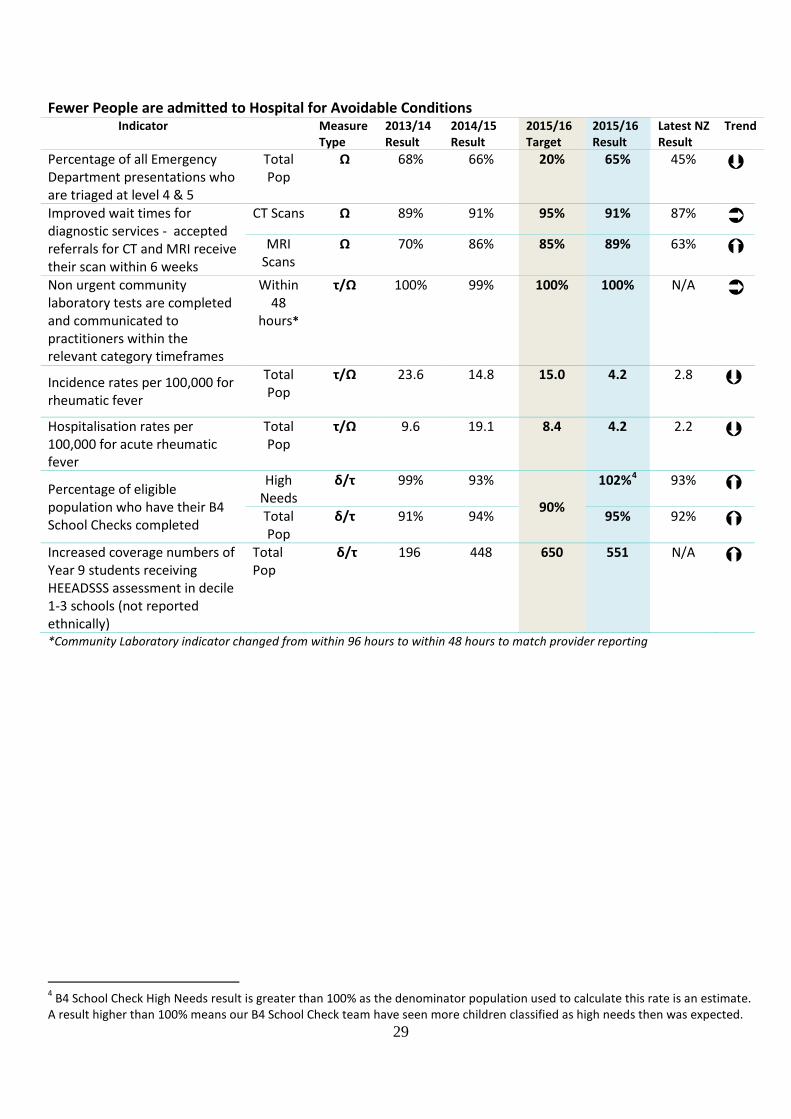
Outcome: Fewer people are admitted to hospital for avoidable conditions
International research has shown around 14% of acute admissions could have been prevented through better management of conditions in primary and community settings. To achieve our outcome of people staying well in their homes and communities, seamless flow through the health system is required, this will be achieved when the rates of admissions for acute medical conditions decreases.
Measure: The rate of Acute Medical admissions to hospital decreases
25

IMPACT MEASURES – Medium Term Outcome: Children and adolescents have
better oral health Improved oral health is a proxy measure of equity of access, and the effectiveness of mainstream services in targeting those most in need. Diseased, Missing or Filled Teeth (DMFT) is a count of Diseased, Missing or Filled Teeth in permanent dentition (permanent teeth) in a person’s mouth. By Year 8, children’s teeth should be their permanent teeth and any damage at this stage is life long, so the lower a child’s DMFT, the more likely that their teeth will last a life time. A continued decrease in the DMFT score of year 8 children will signal that we are succeeding. 2011 2012 2013 Tairawhiti Maori 1.26 1.02 1.17 Tairawhiti All 1.06 0.90 1.02 Midland Maori 2.10 1.98 1.97 Midland All 1.51 1.44 1.38 NZ Maori 1.83 1.75 1.70 NZ All 1.24 1.18 1.14
Measure: The rate of Diseased Missing Filled Teeth in year 8 students decreases
Outcome: Long-term conditions are detected early and managed well
Cervical cancer is one of the most preventable forms of cancer and screening every three years can reduce the risk of developing it by up to 90%. Identifying and treating cancers when they are small, is one of the most effective methods to reduce the impact of some cancers. Early detection will lead to either successful treatment, or delaying or reducing the need for hospital and specialist care.
Measure: The percentage of women who have had a cervical Screen in the past 3 years increases
26

Outcome: Fewer people are admitted to hospital for avoidable conditions
There are a number of admissions to hospital for conditions which are seen as avoidable through appropriate early intervention and a reduction in risk factors. As such, these admissions provide an indication of the effectiveness of screening, early intervention and community-based care. A reduction in these admissions will reflect better management and treatment of people across the whole system, will free up hospital resources for more complex and urgent cases, and support enhanced delivery of the Government’s priority of “better, sooner, more convenient” healthcare.
00-04 11/12 12/13 13/14 14/15 15/16* Maori 10,131 7,506 7,499 7,052 7,534 Non Maori 6,634 5,473 5,540 8,679 6,989 Total 8,802 6,781 6,751 7,643 7,336
Measure: The rate of avoidable admissions to hospital decreases
45-64 11/12 12/13 13/14 14/15 15/16* Maori 4,408 4,207 4,192 3,461 3,813 Non Maori 2,244 2,246 2,197 1,885 2,435 Total 3,077 3,019 2,984 2,543 3,010
*2015/16 Results to 28 June 2016
OUTPUTS – Short Term Performance Measures An Improvement in Childhood Oral Health
Indicator Notes 2013/14 Result
2014/15 Result
2015/16Target
2015/16 Result
Latest NZ Result
Trend
Percentage of enrolled pre-school and primary school children (0-12) overdue for their scheduled dental examination (PP13)*
Total Pop
τ 11% 9% 10% 5% N/A
Percentage of adolescent utilisation of DHB-funded dental services (PP12)*
Total Pop
Ω 71% 69% 85% 54% N/A
Percentage of Children (0-4) enrolled in DHB funded dental service (PP12)*
Māori Ω 85% 90% 90%
93% N/A Total Pop
Ω 89% 93% 95% N/A
*All results are Calendar year rates, no national rates for 2015/16 available and only reported as Maori and Total Population rates
27

Long term Conditions are Detected Early and Managed Well
Indicator Measure Type
2013/14 Result
2014/15 Result
2015/16 Target
2015/16 Result
Latest NZ Result
Trend
Percentage of eligible population will have had their cardiovascular risk assessed in the last 5 years (Health Target, IPIF & MHP).
Māori δ 83% 88%
90%3
91% 86%
Non Māori
δ 89% 91% 94% 91%
Total Pop δ 86% 90% 92% 90%
Improve the proportion of patients with good or acceptable glycaemic control (PP20)
Total Ω 65% 38% 90% 71% N/A
Percentage of eligible women (20-69) have a Cervical Cancer Screen every 3 years (IPIF &MHP)
Māori δ/τ 72% 73%
75%
70% 66% Non
Maori δ/τ 82% 78% 85% 78%
Total δ/τ 77% 77% 78% 77% Percentage of eligible women (50-69) who have a Breast Screen every 3 years (MHP) *Results to 31 March
Māori δ/τ 67% 69%
70%
67% 64% Non
Maori δ/τ 73% 73% 71% 71%
Total δ/τ 73% 70% 70% 70%
3 For the 12 months 1 April 2015 to 31 March 2016 28
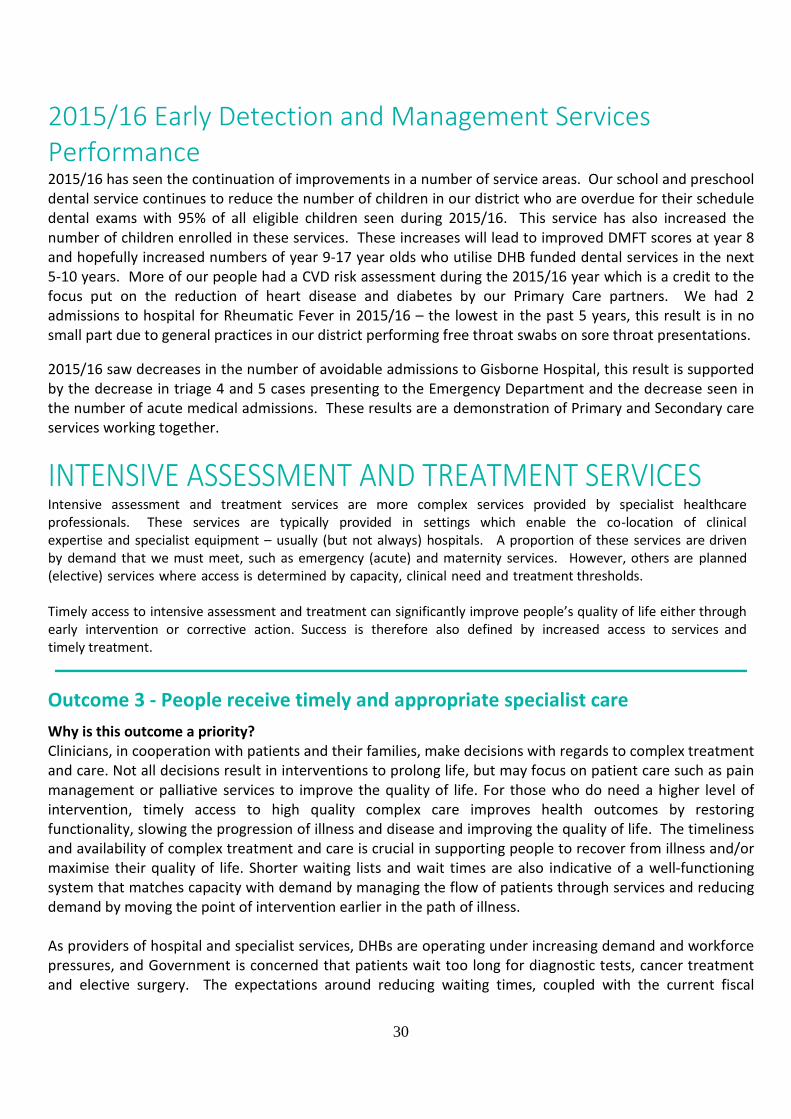
Fewer People are admitted to Hospital for Avoidable Conditions
Indicator Measure Type
2013/14 Result
2014/15 Result
2015/16 Target
2015/16 Result
Latest NZ Result
Trend
Percentage of all Emergency Department presentations who are triaged at level 4 & 5
Total Pop
Ω 68% 66% 20% 65% 45%
Improved wait times for diagnostic services - accepted referrals for CT and MRI receive their scan within 6 weeks
CT Scans Ω 89% 91% 95% 91% 87%
MRI Scans
Ω 70% 86% 85% 89% 63%
Non urgent community laboratory tests are completed and communicated to practitioners within the relevant category timeframes
Within 48
hours*
τ/Ω 100% 99% 100% 100% N/A
Incidence rates per 100,000 for rheumatic fever
Total Pop
τ/Ω 23.6 14.8 15.0 4.2 2.8
Hospitalisation rates per 100,000 for acute rheumatic fever
Total Pop
τ/Ω 9.6 19.1 8.4 4.2 2.2
Percentage of eligible population who have their B4 School Checks completed
High Needs
δ/τ 99% 93%
90%
102%4 93%
Total Pop
δ/τ 91% 94% 95% 92%
Increased coverage numbers of Year 9 students receiving HEEADSSS assessment in decile 1-3 schools (not reported ethnically)
Total Pop
δ/τ 196 448 650 551 N/A
*Community Laboratory indicator changed from within 96 hours to within 48 hours to match provider reporting
4 B4 School Check High Needs result is greater than 100% as the denominator population used to calculate this rate is an estimate. A result higher than 100% means our B4 School Check team have seen more children classified as high needs then was expected.
29
2015/16 Early Detection and Management Services Performance 2015/16 has seen the continuation of improvements in a number of service areas. Our school and preschool dental service continues to reduce the number of children in our district who are overdue for their schedule dental exams with 95% of all eligible children seen during 2015/16. This service has also increased the number of children enrolled in these services. These increases will lead to improved DMFT scores at year 8 and hopefully increased numbers of year 9-17 year olds who utilise DHB funded dental services in the next 5-10 years. More of our people had a CVD risk assessment during the 2015/16 year which is a credit to the focus put on the reduction of heart disease and diabetes by our Primary Care partners. We had 2 admissions to hospital for Rheumatic Fever in 2015/16 – the lowest in the past 5 years, this result is in no small part due to general practices in our district performing free throat swabs on sore throat presentations. 2015/16 saw decreases in the number of avoidable admissions to Gisborne Hospital, this result is supported by the decrease in triage 4 and 5 cases presenting to the Emergency Department and the decrease seen in the number of acute medical admissions. These results are a demonstration of Primary and Secondary care services working together.
Intensive assessment and treatment services are more complex services provided by specialist healthcare professionals. These services are typically provided in settings which enable the co-location of clinical expertise and specialist equipment – usually (but not always) hospitals. A proportion of these services are driven by demand that we must meet, such as emergency (acute) and maternity services. However, others are planned (elective) services where access is determined by capacity, clinical need and treatment thresholds. Timely access to intensive assessment and treatment can significantly improve people’s quality of life either through early intervention or corrective action. Success is therefore also defined by increased access to services and timely treatment.
Outcome 3 - People receive timely and appropriate specialist care Why is this outcome a priority? Clinicians, in cooperation with patients and their families, make decisions with regards to complex treatment and care. Not all decisions result in interventions to prolong life, but may focus on patient care such as pain management or palliative services to improve the quality of life. For those who do need a higher level of intervention, timely access to high quality complex care improves health outcomes by restoring functionality, slowing the progression of illness and disease and improving the quality of life. The timeliness and availability of complex treatment and care is crucial in supporting people to recover from illness and/or maximise their quality of life. Shorter waiting lists and wait times are also indicative of a well-functioning system that matches capacity with demand by managing the flow of patients through services and reducing demand by moving the point of intervention earlier in the path of illness. As providers of hospital and specialist services, DHBs are operating under increasing demand and workforce pressures, and Government is concerned that patients wait too long for diagnostic tests, cancer treatment and elective surgery. The expectations around reducing waiting times, coupled with the current fiscal
30

situation, mean DHBs need to develop innovative ways of treating more people and reducing waiting times with limited resources. This goal reflects the importance of ensuring that hospital and specialist services are sustainable and that the Midland Region has the capacity to provide for the complex needs of its population now and into the future.
Outcome Measures – Long Term Outcome: People receive prompt and appropriate acute care
About half the deaths under 75 years of age in New Zealand are classified as amenable. That is, they are ‘untimely, unnecessary’ deaths from causes amenable to health care. These causes range from some cancers to pregnancy complications to chronic disorders. Decreases in these rates are reflective of a high performing health system with seamless flow between Primary and Secondary Care Services. Amenable Mortality Rates have not been published at a national level since 2012
Measure: The rate of mortality from potentially avoidable conditions decreases
Outcome: People have appropriate access to elective services
Elective services are an important part of the health system, as they improve a patient’s quality of life by reducing pain or discomfort and improving independence and wellbeing. The Government wants more New Zealanders to have access to elective surgical services. Continued Improvement in this indicator in Tairawhiti is a credit to the work led by our surgical services department.
Measure: The number of people receiving elective surgery increases
31

Outcome: Improved access to Mental Health services
It is estimated that at any one time, 20% of the New Zealand population will have a mental illness or addiction, and 3% are severely affected by mental illness. With high suicide rates in some of our communities, we are working to reduce this rate and support our communities with Whanau Ora initiatives.
Measure: The number of people subject to compusory treatment orders under section 29 of the Mental Health (Compulsory Assessment and Treatment) Act 1992 is reduced.
IMPACT MEASURES – Medium Term
Outcome: People receive prompt and appropriate acute care
Long stays in Emergency Departments (EDs) are linked to overcrowding of the ED, negative clinical outcomes and compromised standards of privacy and dignity for patients. Less time spent waiting and receiving treatment in an ED improves the health services DHBs are able to provide. The duration of stay in ED is influenced by services provided in the community to reduce inappropriate ED presentations, the effectiveness of services provided in ED and the hospital and community services provided following exit from ED.
Measure: Percentage of Patients admitted, discharged or transferred from ED within 6 hours
DHB 11/12 12/13 13/14 14/15 15/16 Bay of Plenty
89% 90% 93% 94% 94%
Lakes 89% 92% 91% 90% 89% Tairawhiti 98% 95% 96% 96% 96% Taranaki 90% 96% 94% 96% 95% Waikato 92% 88% 93% 94% 91% National 94% 93% 94% 95% 94%
32

Outcome: People have appropriate access to elective services
Improved performance against this measure is indicative of improved hospital productivity ensuring the most effective use of resources so wait times can be minimised and people in Tairawhiti receive prompt and appropriate care when they need it. Decreases in these rates are reflective of a higher performing primary care sector with conditions been diagnosed and treated earlier preventing them from reaching the surgical stage.
Measure: Standardised Discharge Rates per 10,000 for publicly funded discharges
Procedure* 2013/14 Result
2014/15 Result
2015/16 Result
Cardiac Surgery 7.21 6.60 6.24 Major Joint Replacement
19.66 27.80 27.33
Cataract Proceedures
38.45 25.56 36.91
Percutaneous Revascularization
10.61 9.38 8.40
Coronary Angiography
29.02 26.24 28.53
*All rates as at 31 March
Outcome: Improved access to Mental Health services
Access is the key to improving health status for people with a severe mental illness. Our goal is to build on our existing, and well established cooperation between primary / community and secondary services, by offering programmes to individuals and groups from a broad range of ages – children and youth, adults and older people. If we improve access, and providing we provide services to people at the right time, and in the right place, and can expect to see a reduction in our 28 day readmission rate. This will, in turn, assist in reducing pressure on our hospital services.
Measure: The 28 day acute readmission rate for Mental Health services reduces
28 Day acute re-admission rate DHB 2010/11 2011/12 2012/13 2013/14 2014/15 Bay of Plenty 16% 20% 19% 18% 18% Lakes 24% 20% 18% 12% 18% Tairawhiti 22% 17% 15% 18% 16% Taranaki 13% 19% 14% 14% 15% Waikato 12% 10% 12% 13% 12% 2014/15 results are the most complete results available at this stage. Work continues to identify up reliable and accurate data sources for this measure.
33

OUTPUTS – Short Term Performance Measures People receive Prompt and Appropriate Acute and Arranged Care
Indicator Measure Type
2013/14 Result
2014/15 Result
2015/16 Target
2015/16 Result
Latest NZ Result
Trend
Acute Readmission rate *Rate as at 31 March 2016
Total Pop
δ/τ/ Ω 5.04% 6.4% <4.3% 6.40% 7.90%
Faster Cancer Treatment – Proportion of patients with a confirmed diagnosis of cancer who receive their first cancer treatment within 31 days of diagnosis
Total Pop
δ/τ 82% 88% 100% 86% 86%
Faster Cancer Treatment – Proportion of patients with a high suspicion of cancer who receive their first cancer treatment within 62 days or less (Health Target)
Total Pop
δ/τ New Measure
for 2014/15
69% 85% 69% 74%
Percentage of patients who require radiation or chemotherapy are treated within 4 weeks (previous Health Target, this is the last year it will be reported.)
Total Pop
δ/τ 100% 100%
100%
100% 100%
Percentage of missed outpatient appointments (previously called Did not attend percentage for outpatient services (MHP))
Māori
δ/τ
16% 16%
10%
16% 16% Non
Māori 6% 8% 8% 8%
Total 10% 12% 12% 9%
People have appropriate access to Elective Services
Indicator Measure Type
2013/14 Result
2014/15 Result
2015/16 Target
2015/16 Result
Latest NZ Result
Trend
Percentage of patients waiting longer than four months for their first specialist assessment (Elective Service Performance Indicator 2)
Total Pop
δ/τ 0% 0% 0% 1% 0.8%
Number of Surgical discharges under the Elective initiative (Health Target)
Total Pop
δ/τ 2133 2185 2552 2961 200,323
Inpatient average length of Stay (elective) *Rate as at 31 March
Total Pop
δ 3.14 days
2.95 days
<1.59 days
1.39 days
1.61 days
34

Improved access to Mental Health services Improved Health Status for those with Severe Mental Illness and/or addictions
Indicator Measure Type
2013/14 Result
2014/15 Result
2015/16 Target
2015/16 Result
Latest NZ Result
Trend
Percentage of people referred for non-urgent mental health or addiction services seen within 3 weeks (PP8)
Mental Health 00-19 years
δ/τ
68% 69% 80% 67% 20-64 years 77%
Change in National reporting – measure no longer reported 65+ years 76%
Addiction Services 00-19 years
δ/τ
62% 80% 80% 70% 20-64 years Change in National reporting – measure no
longer reported 65+ years
Improving the percentage of long-term clients with up to date relapse prevention/treatment plans (PP7)
<20 yr olds
Maori
δ/τ/ Ω
58% The Child and Youth with a transition plan programme is a national roll out and has not yet reached Tairawhiti. Programme will be implemented during the second half of 2015/16
Non Maori 95% Total 76%
20+ yr olds
Maori δ/τ/ Ω 88% 89%
95%
80% N/A Non Maori 77% 71% 95% N/A Total 83% 81% 95% N/A
Average length of Acute Inpatient Stays*(KPI8) Result to 31 Dec 2015
Total Pop δ/τ/ Ω 19 days 16 days 14-21 days
16 days N/A
Rates of Post discharge community care (KPI18)
Total Pop δ/τ/ Ω 66% 60%* Rate to 31 May 2015
90% 55%*Rate to 31 May 2016
N/A
2015/16 Intensive Assessment and Treatment Services Performance 2015/16 has seen another record year in terms of Tairawhiti people receiving elective surgery with a 35% increase on 2014/15 volumes. The length of stay for patients in Gisborne Hospital also continues to decrease for both Acute and Elective inpatients. A project is underway at Hauora Tairawhiti to reduce the number of missed outpatient appointments, This project began in 2016 and is starting to produce results with 2015/16 rates on par with 2014/15 rates and local rates currently below the National rates. Our short term output indicators for people receiving prompt and appropriate acute and arranged care for 2015/16 show consistent results with 2014/15 rates. This is a pleasing result as it shows that even with increased numbers of elective surgeries been performed in 2015/16 the day to day activities performed by Hauora Tairawhiti have not suffered.
35

Rehabilitation and support services assist people to regain functional independence after an illness or disability. Even when returning to full health is not possible, timely access to responsive support services helps people to manage their needs and remain safe and well in their own homes. In preventing deterioration and acute illness or crisis, these services have a major impact on the sustainability of the wider health system, reducing acute demand for services and the need for more complex intervention. By providing ongoing care for patients and improving recovery after an acute illness or hospital admission, these services also help to reduce hospital readmission rates. Services that support people in their own homes typically provide a much higher quality of life, as a result of people staying active and positively connected to their communities. Success is therefore defined by increased access to community-based services, less dependence on hospital and residential care and a reduction in illness or deterioration that leads to acute admission or readmission.
Goal 4 - People maintain functional independence This is a new goal from the Annual Plan 2015/16 and consists of section 1.8.7 of the Annual Plan and a new set of Palliative care measures. Why is this outcome a priority? If we are to deliver on our twin goals of improving health outcomes and reducing or eliminating health inequalities for our older population, we need to support people to maintain functional independence. As our ageing population increases, so does demand on our constrained funding. We are looking to manage the expected growth in demand, as a consequence of an ageing population, by improved models of care that support people to remain independent and living in their own homes for as long as possible.
36

Outcome Measures – Long Term Outcome: People stay Well in their homes and communities
Ideally we would like to promote a model of care that reduces the length of time an older person requires aged related residential care facilities (ARRC). As we do not currently capture this information, our best proxy indicator is to monitor the increase in the average age at which an older person enters ARRC. Increases in the age of entry will see decreases in age related residential care with increases in home based support services with people remaining resident in their own homes longer. 2014/15 results are the most complete results available at this stage. Work continues to identify up to date data sources for this measure.
Measure: Average age of people entering Age Related Residential Care increases
Average Age of Entry to Residential Care (years)
Care level
2012/13 2013/14 2014/15
Rest Home
83.3 84.9 83.3
Hospital 84.9 83.7 81.2 Dementia 85.5 85.5 83.0
Outcome: People with end stage conditions are supported
Palliative and end of life care provides people with humane and dignified support and services as they face a life limiting condition. In order to develop a service that meets the need of people requiring Palliative Care support system wide improvements are required. Proper identification and coding of these clients across the health system will allow for improved management and development of Palliative Care in Tairawhiti.
Measure: The number of patients identified as requiring Palliative Care assistance increases Financial Year 2013/14 2014/15 2015/16 Number of Patients admitted under Health Speciality Code M80
9 16 7
37
IMPACT MEASURES – Medium Term
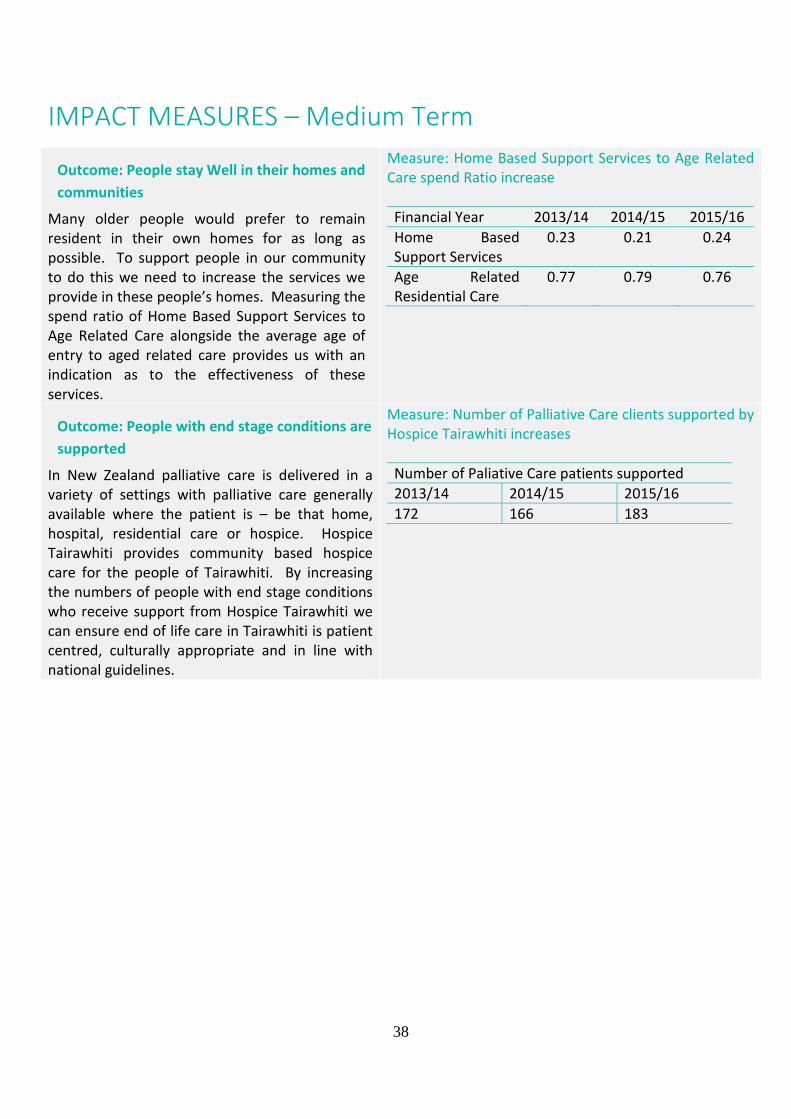
Outcome: People stay Well in their homes and communities
Many older people would prefer to remain resident in their own homes for as long as possible. To support people in our community to do this we need to increase the services we provide in these people’s homes. Measuring the spend ratio of Home Based Support Services to Age Related Care alongside the average age of entry to aged related care provides us with an indication as to the effectiveness of these services.
Measure: Home Based Support Services to Age Related Care spend Ratio increase Financial Year 2013/14 2014/15 2015/16 Home Based Support Services
0.23 0.21 0.24
Age Related Residential Care
0.77 0.79 0.76
Outcome: People with end stage conditions are supported
In New Zealand palliative care is delivered in a variety of settings with palliative care generally available where the patient is – be that home, hospital, residential care or hospice. Hospice Tairawhiti provides community based hospice care for the people of Tairawhiti. By increasing the numbers of people with end stage conditions who receive support from Hospice Tairawhiti we can ensure end of life care in Tairawhiti is patient centred, culturally appropriate and in line with national guidelines.
Measure: Number of Palliative Care clients supported by Hospice Tairawhiti increases Number of Paliative Care patients supported 2013/14 2014/15 2015/16 172 166 183
38
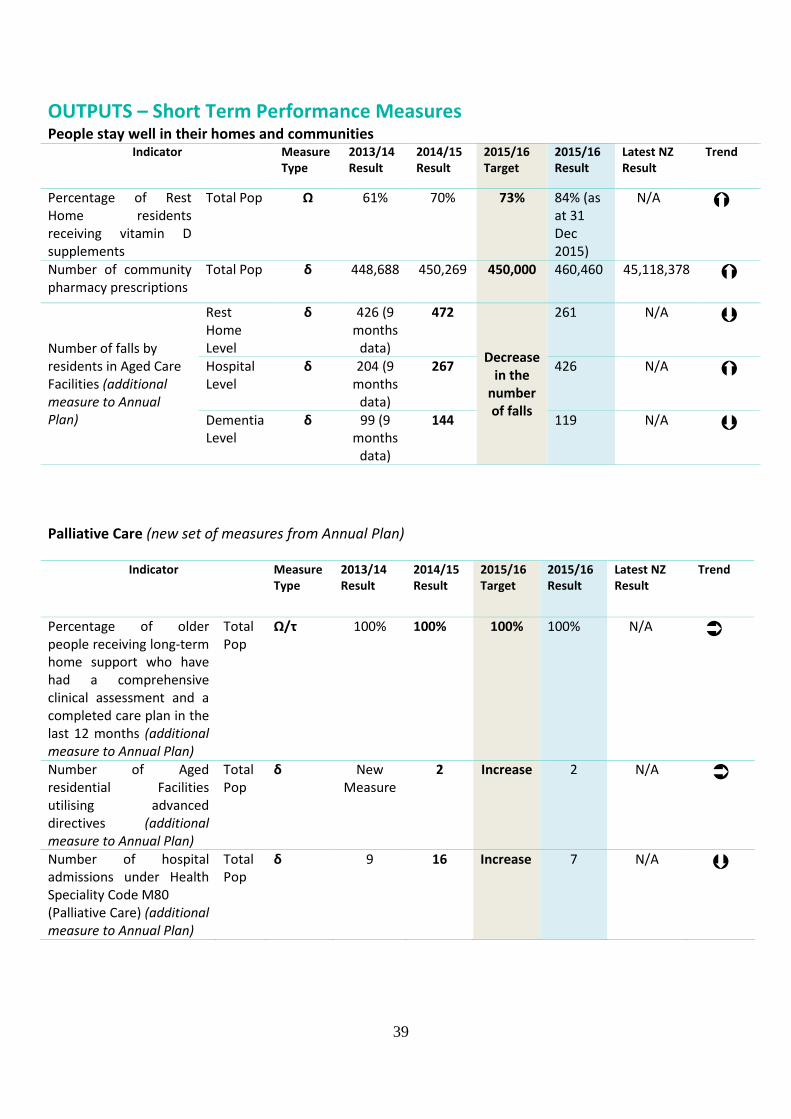
OUTPUTS – Short Term Performance Measures People stay well in their homes and communities
Indicator Measure Type
2013/14 Result
2014/15 Result
2015/16 Target
2015/16 Result
Latest NZ Result
Trend
Percentage of Rest Home residents receiving vitamin D supplements
Total Pop Ω 61% 70% 73% 84% (as at 31 Dec 2015)
N/A
Number of community pharmacy prescriptions
Total Pop δ 448,688 450,269 450,000 460,460 45,118,378
Number of falls by residents in Aged Care Facilities (additional measure to Annual Plan)
Rest Home Level
δ 426 (9 months
data)
472
Decrease in the
number of falls
261 N/A
Hospital Level
δ 204 (9 months
data)
267 426 N/A
Dementia Level
δ 99 (9 months
data)
144 119 N/A
Palliative Care (new set of measures from Annual Plan)
Indicator Measure Type
2013/14 Result
2014/15 Result
2015/16 Target
2015/16 Result
Latest NZ Result
Trend
Percentage of older people receiving long-term home support who have had a comprehensive clinical assessment and a completed care plan in the last 12 months (additional measure to Annual Plan)
Total Pop
Ω/τ 100% 100% 100% 100% N/A
Number of Aged residential Facilities utilising advanced directives (additional measure to Annual Plan)
Total Pop
δ New Measure
2 Increase 2 N/A
Number of hospital admissions under Health Speciality Code M80 (Palliative Care) (additional measure to Annual Plan)
Total Pop
δ 9 16 Increase 7 N/A
39

2015/16 Rehabilitation and Support Services Performance 2015/16 has seen further development in terms of the indicators measured in this area with the emergence of Palliative Care as an area of increased focus nationally. Locally we have increased the number of people who receive palliative care support from Hospice Tairawhiti, we have seen increased numbers of prescriptions dispensed at pharmacies across the region and more of our older population are receiving vitamin D supplements to help with falls injury reduction. 2015/16 has seen a decrease in the number of falls by aged care residents at rest home and dementia level care with increases at hospital level care reflective of increases in resident numbers at this level. Vote Health: Health and Disability Support Services Tairawhiti DHB The appropriation received for population based funding was $147,136,000 MOH population based revenue is the received by the DHB and equals the Governments actual expenses incurred in relation to the appropriation, which is a required disclosure under the Public Finance Act.
40

Summary of Revenue and Expenses by Output Class
Statement of Intent The Crown Entities Act 2004 requires DHBs to report revenue and expenses for each Output Class There are four output classes for 2015/16
• Prevention • Early detection and management • Intensive assessment and treatment • Rehabilitation and support.
Hauora Tairawhiti has allocated the revenues and expenses to each output class for the periods covered by this report and the results are as per the table below: Output Class Funding Allocation
Actual
2015/16 Budget
2015/16 Actual
2014/15 $000’s $000’s $000’s
Income Prevention 5,706 5,321 6,505 Early detection and management 42,577 44,091 36,700
Intensive assessment and treatment 102,652 99,350 102,667
Rehabilitation and support 16,672 18,340 18,534
Total Income 167,607 167,102 164,406 Expenditure
Prevention 5,790 5,311 6,313 Early detection and management 43,862 44,008 35,717 Intensive assessment and treatment 107,456 99,162 105,217 Rehabilitation and support 17,157 18,305 20,741
Total Expenditure 174,266 166,786 167,988
Surplus/(Deficit) ($6,658) $316 ($3,582) Output class cost allocation differs from the Statement of Comprehensive Revenue & Expense as the shares of the associates have been excluded as activities provided by these services are either already included within the cost allocation (TLAB) or are not linked to the provision of health care services (Laundry Services). the difference amounts to $534,000 in 15/16 actual year, $350,000 in the 15/16 budget year and $608,000 in the 14/15 year. This approach is consistent with the approach taken since the inception of outcome class cost allocation financial reporting.
41

Statutory Information
New Zealand Public Health and Disability Act 2000 Report on the extent to which TDH has met its objectives under section 22 [s.42 (3) (b)]; This information can be found in the Statement of Service Performance commencing on page 16. Each objective included in the Statement of Service Performance is referenced back to objectives (a) to (k) from section 22 of the New Zealand Public Health and Disability Act 2000. (a) To improve, promote, and protect the health of people and communities. (b) To promote the integration of health services, especially primary and secondary health services. (c) To promote effective care or support for those in need of personal health services or disability
support services. (d) To promote the inclusion and participation in society and independence of people with disabilities. (e) To reduce health disparities by improving health outcomes for Māori and other population groups. (f) To reduce, with a view to eliminating, health outcome disparities between various population groups
within New Zealand by developing and implementing, in consultation with the groups concerned, services and programmes designed to raise their health outcomes to those of other New Zealanders.
(g) To exhibit a sense of social responsibility by having regard to the interests of the people to whom it provides, or for whom it arranges the provision of services.
(h) To foster community participation in health improvement and in planning for the provision of services and for significant changes to the provision of services.
(i) To uphold the ethical and quality standards commonly expected of providers of services and of public sector organisations.
(j) To exhibit a sense of environmental responsibility by having regard to the environmental implications of its operations.
(k) To be a good employer. Statement of how TDH has given effect and intends to give effect to its functions specified in section 23(1) (a) to (e) [s.42 (3) (i)]; (a) To ensure the provision of services for its resident population and for other people as specified in its
Crown funding agreement: All Crown Funding Agreement (CFA) actions for the period completed as required. Compliance with the Service Coverage Schedule for both TDH provider and other community
providers via service agreements (excluding those exceptions to meeting the schedule, as outlined in TDH’s Annual Plan).
Overall outputs for the provider arm met – with variation between service lines. (b) To actively investigate, facilitate, sponsor, and develop co-operative and collaborative arrangements
with persons in the health and disability sector or in any other sector to improve, promote, and protect the health of people, and to promote the inclusion and participation in society and independence of people with disabilities: TDH has developed a series of clinical alliances with other DHBs and providers both locally and
across the country in order to achieve its aims. 42

TDH is a member of DHB Shared Services, the joint agency for all DHBs. TDH contributes to, and gains benefit from collaborative action to advance the aims of TDH and the health sector in general.
(c) To issue relevant information to the resident population, persons in the health and disability sector, and persons in any other sector working to improve, promote, and protect the health of people for the purposes of paragraphs (a) and (b): TDH has a positive relationship with the local media, particularly the newspaper. All matters of importance are communicated to the Tairāwhiti population. Regular contact with other providers is maintained. Regular reporting to the MoH. Regular reporting to Board and Advisory Committees via public accountability system.
(d) To establish and maintain processes to enable Māori to participate in, and contribute to, strategies for Māori health improvement: The Māori Caucus Te Waiora o Nukutaimemeha sits alongside the TDH Board at a governance
level, therefore ensuring active participation and contribution by Māori. The Board of TDH meets with Boards of Māori providers on an annual basis The Board of TDH meets once a year with representatives of the Runanga with which it has signed
Memorandum of Understanding. The two Runanga are Te Runanganui o Ngāti Porou and Te Runanga o Turanganui a Kiwa.
Involvement of Koroua / Kuia in services. (e) To continue to foster the development of Māori capacity for participating in the health and disability
sector and for providing for the needs of Māori: Funding of Māori providers. Joint application of the Māori provider development funding held by the MoH.
43


Statement of Comprehensive Revenue & Expense
For the year ended 30 June 2016Notes Economic Entity
Actual Budget Actual2016 2016 2015$000 $000 $000
RevenuePatient care revenue 2 165,477 164,990 162,383Interest revenue 113 120 235Other revenue 3 1,778 1,643 1,788Total revenue 167,368 166,753 164,406
ExpensesPersonnel Cost 4 64,890 58,782 60,856Depreciation and amortisation expenses
Property, plant and equipment 13 2,657 2,776 2,663 Intangible 14 274 336 274Outsourced services 6,174 5,683 7,547Clinical Supplies 13,782 12,726 13,668Infrastructure and non-clinical expenses 9,207 9,867 9,917Other district health boards 20,507 19,612 20,759Non-health-board provider expenses 53,103 52,834 48,048Capital charge 5 2,458 2,675 2,619Interest expense 714 738 845Other expense 6 793 758 792Total expenses 174,559 166,787 167,988Share of associate surplus / (deficit) 12 534 350 608Surplus / (deficit) (6,657) 316 (2,974)Other comprehensive revenue and expenseitem that will not be reclassified to surplus / (deficit)Revaluation of land and buildings 0 0 (497)Total other comprehensive revenue and expense 0 0 (497)Total comprehensive revenue and expense (6,657) 316 (3,471)
Explanations of major variances against budget are provided in Note 31.
The accompanying notes form part of these financial statements.
49

Statement of Financial Position
As at 30 June 2016Notes Economic Entity
Actual Budget Actual2016 2016 2015$000 $000 $000
AssetsCurrent assetsCash & cash equivalents 7 27 27 28Receivables 8 4,937 3,572 3,360Prepayments 932 650 928Inventories 10 1,819 1,684 1,678Total current assets 7,715 5,933 5,994
Non-current assetsInvestments in subsidiary and associates 12 707 650 738Property, plant and equipment 13 59,742 61,362 60,948Intangible assets 14 2,558 3,279 2,554Total non-current assets 63,007 65,291 64,240Total assets 70,722 71,224 70,234
LiabilitiesCurrent LiabilitiesHealth Partnership NZ Ltd 7 6,804 5,983 4,866Payables and deferred revenue 15 9,342 8,697 7,289Borrowings 17 1,820 112 112Employee entitlements 18 9,593 8,163 9,906Total current liabilities 27,559 22,955 22,173
Non-current LiabilitiesBorrowings 17 14,107 15,807 15,927Employee entitlements 18 789 747 827Total non-current liabilities 14,896 16,554 16,754Total liabilities 42,455 39,509 38,927
Net Assets 28,267 31,715 31,307
Equity 20Crown equity 19,598 15,598 15,980Accumulated surpluses / (deficits) (28,082) (20,634) (21,425)Property revaluation reserves 36,725 36,724 36,725Trust funds and bequests 27 27 27Total equity 28,268 31,715 31,307
Explanations of major variances against budget are provided in Note 31.
The accompanying notes form part of these financial statements.
50

Statement of Changes in Equity
For the year ended 30 June 2016
Notes Economic Entity
Actual Budget Actual
2016 2016 2015
$000 $000 $000
Balance at 1 July
31,307 31,781 35,160
Total comprehensive revenue and expense (6,658) 316 (3,471)
Owner transactions Capital contribution
4,000 0 0 Repayment of capital
(382) (382) (382)
Balance at 30 June
28,267 31,715 31,307
Explanations of major variances against budget are provided in Note 31.
The accompanying notes form part of these financial statements.
51

Statement of Cash Flow
For the year ended 30 June 2016
Notes Economic Entity
Actual Budget Actual
2016 2016 2015
$000 $000 $000
Cash flows from operating activities Receipts from patient care Ministry of Health
159,838 161,421 156,088 Other
4,004 4,389 6,329
Interest receipts
113 120 235 Receipts from other revenue
1,777 846 1,788
Payments to suppliers
(101,807) (101,483) (104,022) Payments to employees
(65,241) (59,819) (60,209)
Capital charge
(2,458) (2,675) (2,619) Interest paid
(716) (738) (845)
GST (net)
212 0 (308) Net Cash flow from operating activities
(4,278) 2,061 (3,563)
Cash flow from investing activities Advance from subsidiary company
565 350 608 Purchase of property, plant and equipment (1,453) (2,724) (3,396) Purchase of intangible assets
(279) (1,265) 0
Acquisition of investments
0 0 (88) Net cash Flow from investing activities
(1,167) (3,639) (2,876)
Cash flow from financing activities Capital contributions from the crown
4,000 0 0 Repayment of capital to the Crown
(382) (382) (382)
Repayment of finance leases
(112) (120) (104) Net cash flow from financing activities
3,506 (502) (486)
Net (decrease) / increase in cash and cash equivalents (1,939) (2,080) (6,925) Cash and cash equivalents at the start of the year (4,838) (3,877) 2,087 Cash and cash equivalents at the end of the year (6,777) (5,957) (4,838)
Explanations of major variances against budget are provided in Note 31.
The accompanying notes form part of these financial statements.
52

Notes to the Financial Statements
Note 1: Statement of Accounting Policies Reporting / Economic Entity Hauora Tairawhiti is a Health Board established by the New Zealand Public Health and Disability Act 2000. Hauora Tairawhiti is a crown entity in terms of the Crown Entities Act 2004, owned by the Crown and domiciled in New Zealand. Hauora Tairawhiti is a public benefit entity (PBE), as defined in the external reporting board standard A1. The group consists of Hauora Tairawhiti, its subsidiary company Tairawhiti Laundry Services Limited (TLSL), which holds the associated partnership share in Gisborne Laundry Services (GLS), and its associated companies HealthShare Limited and TLab Limited (TLab). The group activities involve delivering health and disability services and mental health services in a variety of ways to the community. The financial statements are for the year ended 30 June 2016, and were authorised by the Board on 6 December 2016. Basis of preparation The financial statements have been prepared on a going concern basis, and the accounting policies have been applied consistently throughout the period. Statement of Going Concern The going concern principle has been adopted in the preparation of these financial statements. The Board, after making enquiries, has a reasonable expectation that the DHB has adequate resources to continue operations for the foreseeable future based on current trading terms and legislative requirements. The Board has reached this conclusion having regard to circumstances which it considers likely to affect the DHB during the period of one year from the date of signing the 2015/16 financial statements, and to circumstances which it knows will occur after that date which could affect the validity of the going concern assumption (as set out in its current Statement of Intent). The key considerations are set out below. Letter of comfort The Board has received a letter of comfort, dated 16 November 2016 from the Ministers of Health and Finance which states that deficit support will be provided where necessary to maintain viability. Capital injection of $4m was received during the current financial year. Operating and Cash flow forecasts The Board has considered forecast information relating to operational viability and cash flow requirements. The Board is satisfied that there will be sufficient cash flows generated from operating activities to meet the
53

investing and financing cash flow requirements of the DHB as set out in its current Statement of Intent and based on current trading terms and legislative requirements. Borrowing covenants and forecast borrowing requirements The forecast for the next year prepared by the DHB shows that the peak borrowing requirement will not exceed the available borrowing facilities. Furthermore, the forecast borrowing requirements can be met without breaching covenants or other borrowing restrictions. While the Board is confident in the ability of the DHB to continue as a going concern, if the forecast information relating to operational viability and cash flow requirements is not achieved there would be significant uncertainty as to whether the DHB would be able to continue as a going concern based on current trading terms and legislative requirements. Statement of Compliance The financial statements of Hauora Tairawhiti have been prepared in accordance with the requirements of the New Zealand Public Health and Disability Act 2000 and the Crown Entities Act 2004, which include the requirement to comply with generally accepted accounting practice in New Zealand (NZ GAAP). The financial statements have been prepared in accordance with Tier 1 PBE accounting standards. Presentation currency and Rounding The financial statements are presented in New Zealand Dollars rounded to the nearest thousand ($000). Significant Accounting Policies Revenue Revenue from the Crown Hauora Tairawhiti is primarily funded from the Crown, which is restricted in its use for the purpose of Hauora Tairawhiti meeting its objectives as specified in the statement of intent. The fair value of revenue from the crown has been determined to be equivalent to the amounts due in the funding arrangements. Revenue from Other DHB’s Hauora Tairawhiti receives revenue when a patient from another area is treated at Hauora Tairawhiti, this revenue is paid via an Inter District Flows mechanism after the patient is discharged. Interest Interest revenue is recognised using the effective interest method. Donated services Certain operations of Hauora Tairawhiti are partially reliant on services provided by volunteers. Volunteer services received are not recognised as revenue or expenditure. Donated assets Where a physical asset is gifted to or acquired by Hauora Tairawhiti for nil consideration or at a subsidised cost, the asset is recognised at fair value and the difference between the consideration provided and fair value of the asset is recognised as revenue.
54

Expenditure Capital charge The capital charge is recognised as an expense in the financial year to which the charge relates. Borrowing costs Borrowing costs are recognised as an expense in the financial year in which they are incurred. Finance Leases Leases, which effectively transfer to Hauora Tairawhiti substantially all the risks and benefits incident to ownership of the leased items, are classified as finance leases. These are capitalised at the lower of the fair value of the asset or the present value of the minimum lease payments. The leased assets and corresponding lease liabilities are recognised in the statement of financial position. The leased assets are depreciated over the period the Hauora Tairawhiti is expected to benefit from their use. Operating Leases Leases where the lessor effectively retains substantially all the risks and benefits of ownership of the leased items are classified as operating leases. Payments under these leases are recognised as expenses in the periods in which they are incurred. Cash and Cash equivalents Cash and cash equivalents comprises cash balances, call deposits with a maturity of no more than three months. Receivables Short-term receivables are recorded at their face value, less any provision for impairment. A receivable is considered impaired when there is evidence that Hauora Tairawhiti will not be able to collect the amount due. The amount of the impairment is the difference between the carrying amount of the receivable and the present value of the amounts expected to be collected. Investments Investments, including those in subsidiaries, are stated at fair value. Any decreases are recognised in the Statement of comprehensive revenue and expense. After initial recognition, these investments are measured at their fair value with gains and losses recognised in other comprehensive revenue and expense, except for impairment losses that are recognised in the surplus or deficit. A significant or prolonged decline in the fair value of the investment below its cost is considered objective evidence of impairment. If impairment evidence exists, the cumulative loss recognised in other comprehensive revenue and expense is reclassified from equity to the surplus or deficit.
Inventories Inventories held for distribution in the provision of services that are not supplies on a commercial basis are measured at cost, determined on weighted average cost basis. Inventories acquired through non-exchange transactions are recorded at fair value at the date of acquisition.
55

The amount of any write-down for the loss of service potential or from cost to net realisable value is recognised in the surplus or deficit in the period of the write down. Property, plant and equipment Property, plant and equipment consists of the following asset classes: land, buildings, clinical equipment, other equipment, information technology and vehicles. Property, plant and equipment vested from the Hospital and Health Service. Under section 95(3) of the New Zealand Public Health and Disability Act 2000, the assets of Tairawhiti Healthcare Limited (a Hospital and Health Service) were vested in Hauora Tairawhiti on 1 January 2001. Accordingly, assets were transferred at their net book values as recorded in the books of the Hospital and Health Service. In effecting this transfer, the Board has recognised the cost and accumulated depreciation amounts from the records of the Hospital and Health Service. The vested assets will continue to be depreciated over their remaining useful lives. Property, plant and equipment acquired since the establishment of Hauora Tairawhiti. Assets acquired by the Board since its establishment, other than those vested from the Hospital and Health Service and land and buildings, are recorded at cost less accumulated depreciation. This includes all appropriate costs of acquisition and installation, including materials, labour, direct overheads, financing, and transport costs. Land is measured at fair value, and buildings are measured at fair value less accumulated depreciation. All other asset classes are measured at cost, less accumulated depreciation and impairment losses. Revaluations Land and buildings are valued by an independent qualified valuer at least 3 yearly to confirm that their carrying value in the financial statements of the organisation reflect their fair value. Valuations will be undertaken more regularly if necessary to ensure that no class of assets is included at a valuation that is materially different from its fair value. Where fair value of an asset is not able to be reliably determined using market-based evidence, optimised depreciated replacement cost is considered the most appropriate basis for determination of fair value. Land and buildings revaluation movements are accounted for on a class-of-asset basis. The net revaluation results are credited or debited to other comprehensive revenue and are accumulated to an asset revaluation reserve in equity for that class of asset. Where this would result in debit balance in the asset revaluation reserve, this balance is not recognised in other comprehensive revenue but is recognised in the surplus or deficit. Any subsequent increase on revaluation that reverses a previous decrease in value recognised in the surplus or deficit will be recognised first in the surplus or deficit up to the amount previously expensed, and then recognised in other comprehensive revenue. The results of revaluing land and buildings are credited or debited to an asset revaluation reserve for that class of asset. Where a revaluation results in a debit balance in the asset revaluation reserve, the debit balance will be expensed in the Statement of comprehensive revenue and expense. Additions between revaluations are recorded at cost less depreciation Disposals Any gain or loss on disposal is determined by comparing the proceeds with the carrying amount of the asset and this amount is included in the net surplus or deficit.
56

Depreciation Depreciation is provided on a straight line basis on all property, plant and equipment other than land, at rates which will write-off the cost (or revaluation) of the assets to their estimated residual values over their useful lives. The useful lives and associated depreciation or amortisation rates of major classes of assets have been estimated as follows: Buildings - Structure 67 years (1.5%) Buildings - Fit out 5 - 67 years (1.5 - 20%) Equipment 3 - 25 years (4 – 33.33%) Information Technology 2 - 12.5 years (8 – 50%) Intangible Assets 3 - 12.5 years (8 – 33.33%) Motor vehicles 6.7 - 12 years (6.67 - 15%) The residual value and useful life of an asset is reviewed, and adjusted if applicable, at each financial year end. Work in progress is recognised at cost less impairment and is not depreciated. The total cost of a project is transferred to the relevant asset category on its completion and then depreciated. Intangibles Acquired computer software costs are capitalised on the basis of costs incurred to acquire and bring to use. Ongoing staff training and maintenance costs are recognised as expenses when incurred. The carrying value of an intangible asset with a finite life is amortised on a straight line basis over its useful life. The amortisation charge is recognised in the Statement of comprehensive revenue and expense Impairment Hauora Tairawhiti does not hold any cash-generating assets. Assets are considered cash-generating where their primary objective is to generate a commercial return. Property, plant and equipment and Intangible assets that have a finite useful life are reviewed for impairment each year. An impairment loss is recognised for the amount by which the asset’s carrying amount exceeds its recoverable amount. The recoverable amount is the higher of an asset’s fair value less costs to sell and value in use. Value in use is determined using an approach based on either a depreciated replacement cost approach, restoration cost approach, or a service units approach. The most approraiate approach used to measure value in use dependes on the nature of the impairment and availability of information. The total impairment loss, or reversal of impairment loss, is recognised in the surplus or deficit. Creditors and payables Creditors and other payables are measured at fair value, and subsequently measured at amortised cost using the effective interest rate method. Provisions A provision is recognised for future expenditure of uncertain amount or timing when there is a present obligation (either legal or constructive) as a result of a past event, it is probable that an outflow of future economic benefits will be required to settle the obligation, and a reliable estimate can be made of the amount of the obligation. Provisions are measured at the present value of the expenditure expected to be required to settle the obligation using a pre-tax discount rate that reflects current market assessments of the time value of money
57

and the risks specific to the obligation. The increase in the provision due to the passage of time is recognised as an interest expense and is included in “finance costs”. Borrowings Borrowings are initially recognised at their fair value plus transaction costs. After initial recognition, all borrowings are measured at amortised cost using the effective interest method. Borrowings are classified as current liabilities unless Hauora Tairawhiti has an unconditional right to defer settlement of the liability for at least 12 months after balance date. Borrowings where Hauora Tairawhiti has an unconditional right to defer settlement of the liability for at least 12 months after balance date are classified as current liabilities if Hauora Tairawhiti expects to settle the liability within 12 months of the balance date. Employees Employee entitlements Provision is made in respect of Hauora Tairawhiti’s liability for annual, parental, long service, sick, leave sabbatical, retirement, and conference leave. Annual leave, Parental Leave and Conference leave have been calculated on an actual entitlement basis at current rates of pay whilst Long Service and Retirement provisions have been calculated on an actuarial basis. The liability for sick leave is recognised, to the extent that compensated absences in the coming year are expected to be greater than the sick leave entitlements earned in the coming year. The amount is calculated based on the unused sick leave entitlement that can be carried forward at balance date; to the extent the DHB anticipates it will be used by staff to cover those future absences. Superannuation Schemes Defined contribution schemes Employer contributions to Kiwisaver, the Government Superannuation Fund, and the State Sector Retirement Savings Scheme are accounted for as defined contribution schemes and are recognised as an expense in the surplus or deficit as incurred. Defined benefit schemes The DHB makes employer contributions to the Defined Benefit Plan Contributors Scheme (the scheme), which is managed by the Board of Trustees of the National Provident Fund. The scheme is a multi-employer defined benefit scheme. Insufficient information is available to use defined benefit accounting, as it is not possible to determine from the terms of the scheme the extent to which the surplus/deficit will affect future contributions by individual employers, as there is no prescribed basis for allocation. The scheme is therefore accounted for as a defined contribution scheme. Equity Equity is measured as the difference between total assets and total liabilities. Equity is disaggregated and classified into the following components. • contributed capital • accumulated surplus/(deficit); • revaluation reserves • other reserves
58
Budget figures The budget figures are those approved by the Board and published in its Statement of Intent and have been prepared in accordance with generally accepted accounting practice and are consistent with the accounting policies adopted by the Board for the preparation of the financial statements. Goods and services tax All items in the financial statements are exclusive of goods and services tax (GST) with the exception of receivables and payables, which are stated with GST included. Where GST is irrecoverable as an input tax, it is recognised as part of the related asset or expense. The net GST recoverable from or payable to the Inland Revenue Department is included as part of receivables or payables in the Statement of Financial Position. The net GST paid to, or received from the Inland Revenue Department, including the GST relating to investing and financing activities, is classified as an operating cash flow in the statement of cashflows. Taxation Hauora Tairawhiti is a public authority under the New Zealand Public Health and Disability Act 2000 and is exempt from income tax under Section CB3 of the Income Tax Act 2007. Trusts and bequest funds Donations and bequests to Hauora Tairawhiti are recognised as revenue when control over assets is obtained or entitlement to receive money is established. A liability, rather than revenue, is recognised where fulfilment of any restrictions attached to those assets is not probable. Those donations and bequests with restrictive conditions are appropriated from Retained Earnings to the Trust Funds component of Equity. When expenditure is subsequently incurred in respect of these funds, it is recognised in the Statement of comprehensive revenue and expense, an equivalent amount is transferred from the Trust Funds component of Equity to Retained Earnings. Financial instruments Hauora Tairawhiti and the Group is party to financial instruments as part of its normal operations. These financial instruments include bank accounts, short term deposits, investments, debtors, creditors, and loans. All financial instruments are recognised in the Statement of Financial Position and all revenues and expenses in relation to financial instruments are recognised in the Statement of comprehensive revenue and expense. Except for loans, which are recorded at cost, and those items covered by a separate accounting policy, all financial instruments are shown at their estimated fair value. Cost of service statements The cost of service statements, as reported in the statement of objectives and service performance, reports the net cost of services for the outputs of Hauora Tairawhiti and are represented by the cost of providing the output less all the revenue that can be allocated to these activities. Cost allocation Direct costs are charged directly to output classes. Indirect costs, those which cannot be identified in an economically feasible manner to a specific output class, are charged to output classes based on cost drivers and related activity/usage information.
59

The cost of internal services not directly charged to outputs is allocated as overheads using appropriate cost drivers such as actual usage, staff numbers, and floor area. There have been no changes to the cost allocation methodology since the date of the last audited financial statements. Critical accounting estimates In preparing these financial statements, Hauora Tairawhiti has made estimates and assumptions concerning the future. These estimates and assumptions may differ from the subsequent actual results. Estimates and assumptions are continually evaluated and are based on historical experience and other factors, including expectations of future events that are believed to be reasonable under the circumstances. The estimates and assumptions that have a significant risk of causing a material adjustment to the carrying amounts of assets and liabilities within the next financial year are discussed below. Estimating the fair value of land and buildings. The significant assumptions applied in determining the fair value of land and buildings are disclosed in note 10. Estimating useful lives and residual values of property, plant, and equipment At each balance date, the useful lives and residual values of property, plant, and equipment are reviewed. Assessing the appropriateness of useful life and residual value estimates of property, plant, and equipment requires a number of factors to be considered such as the physical condition of the asset, expected period of use of the asset by Hauora Tairawhiti, and expected disposal proceeds from the future sale of the asset. An incorrect estimate of the useful life or residual value will affect the depreciation expense recognised in the surplus or deficit, and carrying amount of the asset in the statement of financial position. Hauora Tairawhiti minimises the risk of this estimation uncertainty by:
• physical inspection of assets; • asset replacement programs; • review of second hand market prices for similar assets; and • analysis of prior asset sales.
Hauora Tairawhiti has not made significant changes to past assumptions concerning useful lives and residual values. Retirement and long service leave. Note 18 provides an analysis of the exposure in relation to estimates and uncertainties surrounding retirement and long service leave liabilities.
60

Note 2 Patient Care RevenueActual Actual2016 2015$000 $000
MoH population-based Funding 147,136 143,812MoH other contracts 13,862 12,844Inter-district Flows (other DHBs) 2,056 1,963Other patient care related revenue 2,423 3,764Total Patient care revenue 165,477 162,383
Prior year MoH figures restated to show population based funding separate
Note 3 Other RevenueActual Actual2016 2015$000 $000
Donated equipment 1 0Cash donation received 16 85Rental revenue 217 232Other revenue 1,544 1,471
1,778 1,788
Note 4 Personnel costsActual Actual2016 2015$000 $000
Salaries and wages 63,887 58,954Defined contribution plan employer contributions 1,354 1,255Increase / (decrease) in liability for employee entitlements (351) 647
64,890 60,856Prior year defined contribution plan figures have been restated to include Kiwisaver.
Note 5 Capital ChargeHauora Tairawhiti pays a capital charge every six months to the crown. The charge is based on the previoussix month actual closing equity balance as at 31 December and 30 June. The capital charge rate for the year ended 30 June 2016 was 8% per annum (2015: 8%)
Actual ActualNote 6 Other Expenses 2016 2015
Fees to auditor $000 $000 - Audit NZ for audit of the financial statements 103 99 - Other external auditor 3 3 - Internal audit fees 84 80Bad debts written off 4 22Operating lease expense 269 342Board member fees 25 278 246Loss on disposal of property, plant and equipment 2 0Other Expenses 50 0
793 792Prior years figures have been restated, these amounts were included with Infrastructure and non-clinical expenses
61
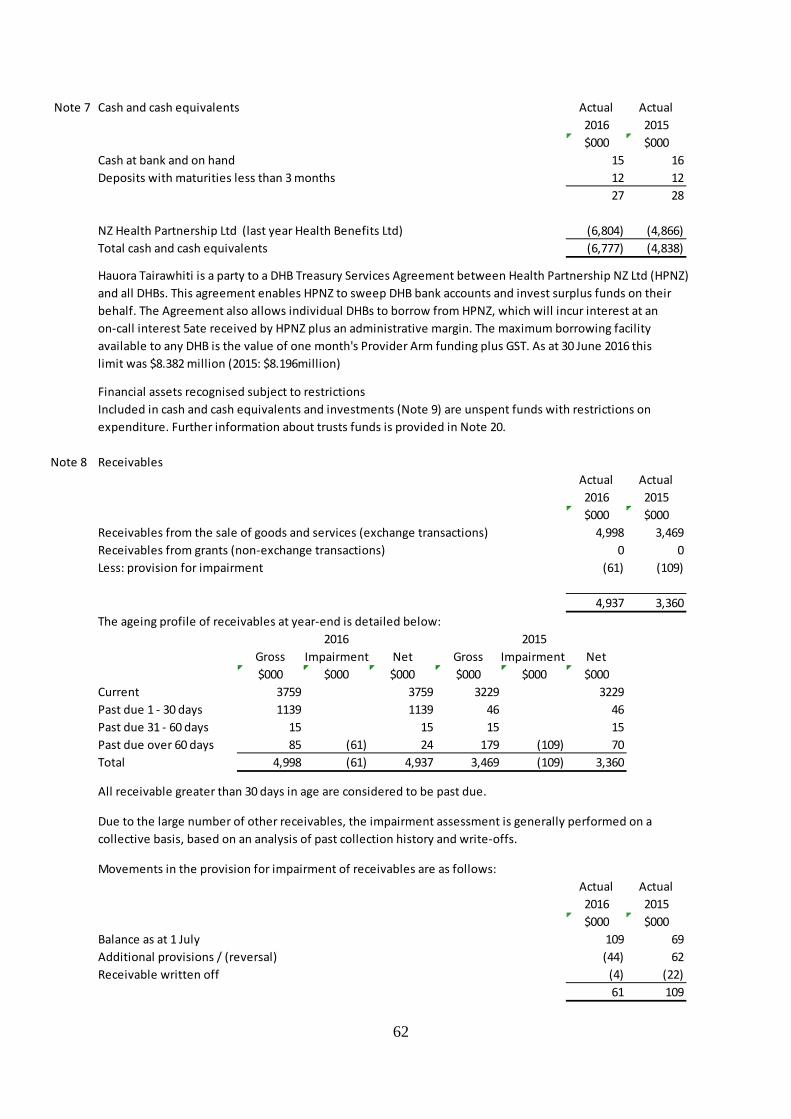
Note 7 Cash and cash equivalents Actual Actual2016 2015$000 $000
Cash at bank and on hand 15 16Deposits with maturities less than 3 months 12 12
27 28
NZ Health Partnership Ltd (last year Health Benefits Ltd) (6,804) (4,866)Total cash and cash equivalents (6,777) (4,838)
Hauora Tairawhiti is a party to a DHB Treasury Services Agreement between Health Partnership NZ Ltd (HPNZ)and all DHBs. This agreement enables HPNZ to sweep DHB bank accounts and invest surplus funds on theirbehalf. The Agreement also allows individual DHBs to borrow from HPNZ, which will incur interest at an on-call interest 5ate received by HPNZ plus an administrative margin. The maximum borrowing facility available to any DHB is the value of one month's Provider Arm funding plus GST. As at 30 June 2016 thislimit was $8.382 million (2015: $8.196million)
Financial assets recognised subject to restrictionsIncluded in cash and cash equivalents and investments (Note 9) are unspent funds with restrictions onexpenditure. Further information about trusts funds is provided in Note 20.
Note 8 ReceivablesActual Actual2016 2015$000 $000
Receivables from the sale of goods and services (exchange transactions) 4,998 3,469Receivables from grants (non-exchange transactions) 0 0Less: provision for impairment (61) (109)
4,937 3,360The ageing profile of receivables at year-end is detailed below:
2016 2015Gross Impairment Net Gross Impairment Net$000 $000 $000 $000 $000 $000
Current 3759 3759 3229 3229Past due 1 - 30 days 1139 1139 46 46Past due 31 - 60 days 15 15 15 15Past due over 60 days 85 (61) 24 179 (109) 70Total 4,998 (61) 4,937 3,469 (109) 3,360
All receivable greater than 30 days in age are considered to be past due.
Due to the large number of other receivables, the impairment assessment is generally performed on acollective basis, based on an analysis of past collection history and write-offs.
Movements in the provision for impairment of receivables are as follows:Actual Actual2016 2015$000 $000
Balance as at 1 July 109 69Additional provisions / (reversal) (44) 62Receivable written off (4) (22)
61 109
62

Note 9 InvestmentsTerm deposits with maturities less than 3 months are included in cash and cash equivalents (Note 7).
The carrying amounts of term deposits with maturities less than 12 months approximate their fair value.
There is no impairment provision for term deposits.
Note 10 InventoriesActual Actual2016 2015$000 $000
Held for distribution inventoriesPharmaceuticals 213 212Surgical and medical supplies 680 753Main store 780 652Other supplies 146 61
1,819 1,678
The amount of inventories recognised as an expense during the year was $2,936k (2015: $3,880k)which is included in a number of expense lines in the statement of comprehensive revenues and expenses.
The net write down of inventories held for distribution amounted to $( 1) k (2015: $22k)Minor variances occur throughout the year result of periodic stock counts.
No inventories are pledged as security for liabilities (2015: $nil). However some inventories aresubject to retention of title clauses.
Note 11 Non-current assets held for saleAs at balance date there were no assets held for resale (2015: $nil)
Note 12 Investments in subsidiaries and associatesInvestment in SubsidiaryEntity Tairawhiti Laundry Services Limited (TLSL)Principle activity Partner in Gisborne Laundry ServicesOwnership interest 100%Balance Date 30 JuneFinancial information for subsidiary has been included in these consolidated Hauora Tairawhiti results
Investment in AssociatesEntity HealthShare LimitedPrinciple activity Midland region DHBs shared service agencyOwnership interest 20% (100 shares)Balance Date 30 June
Summaries financial information (Hauora Tairawhiti's share) Actual Actual2016 2015$000 $000
Assets 2,992 2,798Liabilities 2,796 2,617Revenue 2,396 2,199Surplus 15 86Hauora Tairawhiti's share of contingent liabilities 0 0
63

Entity TLab LimitedPrinciple activity Provision of laboratory servicesOwnership interest 50% (85,000 shares)Balance Date 30 June
Summaries financial information (Hauora Tairawhiti's share) Actual Actual2016 2015$000 $000
Assets 625 623Liabilities 265 227Revenue 2,339 2,340Surplus 219 246Hauora Tairawhiti's share of contingent liabilities 0 0
Entity Gisborne Laundry ServicesPrinciple activity Provision of laundry services in Gisborne and Hawkes BayOwnership interest 50% (partnership via Tairawhiti Laundry Services Ltd)Balance Date 30 June
Summaries financial information (Hauora Tairawhiti's share) Actual Actual2016 2015$000 $000
Assets 220 230Liabilities 69 69Revenue 892 856Surplus 300 276Hauora Tairawhiti's share of contingent liabilities 0 0
Total investment in associates (share of assets less liabilities) 707 738Total share of associate results 534 608
64

Note 13 Property, plant and equipmentLand Buildings Clinical Other InformationVehicles Work in Total
Equipment Equipment Technology Progress$000 $000 $000 $000 $000 $000 $000 $000
Cost or ValuationBalance 1 July 2014 2,591 50,246 14,434 978 2,202 2,641 440 73,532Additions 1,104 1,737 62 141 59 (217) 2,886Disposals (1,059) (60) (2) (1,121)Revaluation (446) (2,317) (2,763)Balance 30 June 2015 2,145 49,033 15,112 980 2,341 2,700 223 72,534
Balance 1 July 2015 2,145 49,033 15,112 980 2,341 2,700 223 72,534Additions 0 132 836 120 367 0 1,455Disposals (432) (52) (46) (2) (532)Revaluation 0Balance 30 June 2016 2,145 49,165 15,516 1,048 2,662 2,700 221 73,457
Accumulated depreciationBalance 1 July 2014 (1,509) (7,188) (676) (1,224) (1,706) (12,303)Depreciation expense (771) (1,369) (71) (337) (115) (2,663)Elimination on disposals 1,050 59 4 1 1,114Revaluation 2,266 2,266Balance 30 June 2015 0 (14) (7,507) (688) (1,557) (1,820) 0 (11,586)
Balance 1 July 2015 0 (14) (7,507) (688) (1,557) (1,820) 0 (11,586)Depreciation expense (737) (1,415) (70) (316) (119) (2,657)Elimination on disposals 0 430 52 46 0 528Revaluation 0Balance 30 June 2016 0 (751) (8,492) (706) (1,827) (1,939) 0 (13,715)
Carrying amountsAs at 1 July 2014 2,591 48,737 7,246 302 978 935 440 61,229At 30 June and 1 July 2015 2,145 49,019 7,605 292 784 880 223 60,948At 30 June 2016 2,145 48,414 7,024 342 835 761 221 59,742
ValuationThe most recent valuation of land and buildings was performed by an independent registered valuerJones LaSelle Ltd as at 30 June 2015. This excluded some assets in rural areas subject to review fordisposal, with a book value of $0.346 million.
Land Land is valued at fair value using market-based evidence based on its highest and best use with reference tocomparable land values. This excludes the rural land referred to above which remains at it's 2012 valuationof $45k, which is assessed as approximating its current market value.Adjustments have been made to the "unencumbered" land value for land where there is a designation against the land or the use of the land is restricted. These adjustments are intended to reflect thenegative effect on the value of the land where an owner is unable to use the land more intensely.Restrictions on Hauora Tairawhiti's ability to sell land would normally not impair the value because it hasoperational use of the land for the foreseeable future and will receive substantially the full benefits of outright ownership.
65

BuildingsSpecialised hospital buildings are valued at fair value using depreciated replacement cost because no reliable market data is available for such buildings.Depreciated replacement cost is determined using a number of significant assumptions. These include:- the replacement asset is based on the replacement with modern equivalent assets, with adjustments where appropriate for optimisation due to over-design or surplus capacity.- the replacement cost is derived from recent construction contracts of similar assets and Property Institute of New Zealand cost information.- for earthquake-prone buildings that are expected to be strengthened, these costs have been deducted- the remaining useful life of assets is estimated using recent asset management information.- straight-line depreciation has been applied in determining the depreciated replacement cost value.
Non-specialised buildings (for example, residential buildings) are valued at fair value using market based evidence. Market rents and capitalisation rates were applied to reflect market value.
Restrictions on titleHauora Tairawhiti does not have full title to the Crown land it occupies, but transfer is arranged if and whenland is sold. Some of the land is subject to Waitangi Tribunal claims. The disposal of certain properties maybe subject to the provisions of section 40 of the Public Works Act 1981.
Titles to land transferred from the Crown to the DHB are subject to a memorial in terms of the Treaty ofWaitangi Act 1975. The effect on the value of assets resulting from potential Waitangi Tribunal claimscannot be quantified and is therefore not reflected in the value of the land.
Finance leasesThe net carrying amount of assets held under finance leases is $nil (2015: $nil) for buildings and $1,363k (2015: $1,558k) for other equipment.
66

Note 14 Intangible assetsFPSC Software WIP FPSC WIP TotalRights Rights Software
$000 $000 $000 $000 $000Cost or ValuationBalance 1 July 2014 4,555 207 295 5,057Additions 34 629 (90) 573Disposals (1,135) (1,135)Balance 30 June 2015 0 3,454 836 205 4,495
Balance 1 July 2015 0 3,454 836 205 4,495Additions 20 0 259 279Disposals (6) (6)RevaluationBalance 30 June 2016 0 3,468 836 464 4,768
Accumulated depreciationBalance 1 July 2014 (2,803) (2,803)Depreciation expense (274) (274)Elimination on disposals 1,136 1,136Balance 30 June 2015 0 (1,941) 0 0 (1,941)
Balance 1 July 2015 0 (1,941) 0 0 (1,941)Depreciation expense (274) 0 0 (274)Elimination on disposals 6 6Balance 30 June 2016 0 (2,209) 0 0 (2,209)
Carrying amountsAs at 1 July 2014 0 1,752 207 295 2,254At 30 June and 1 July 2015 0 1,513 836 205 2,554At 30 June 2016 0 1,259 836 464 2,558
There are no restrictions over the title of intangible assets. No intangible assets are pledged as security for liabilities. At 30 June 2016, Hauora Tairawhiti had made payments totalling $836k (2015: $836k) in relation to the national initiative for finance, procurement and supply chain (FPSC). This initiative is being run by a company owned by all DHBs, NZ Health Partnership Ltd.
The FPSC rights have been tested for impairment by comparing the carrying amount of the intangibleasset to its depreciated replacement cost, which is considered to equate to Hauora Tairawhiti'sshare of the underlying FPSC assets. There has been no impairment.
67
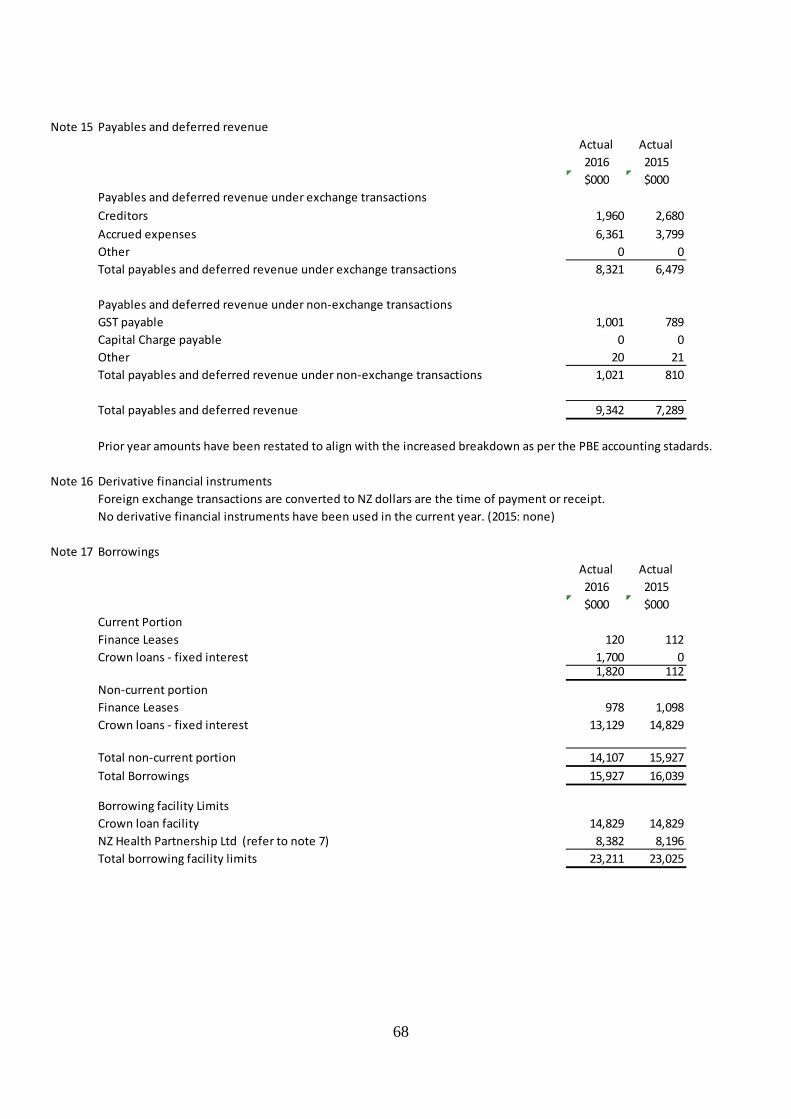
Note 15 Payables and deferred revenueActual Actual2016 2015$000 $000
Payables and deferred revenue under exchange transactionsCreditors 1,960 2,680Accrued expenses 6,361 3,799Other 0 0Total payables and deferred revenue under exchange transactions 8,321 6,479
Payables and deferred revenue under non-exchange transactionsGST payable 1,001 789Capital Charge payable 0 0Other 20 21Total payables and deferred revenue under non-exchange transactions 1,021 810
Total payables and deferred revenue 9,342 7,289
Prior year amounts have been restated to align with the increased breakdown as per the PBE accounting stadards.
Note 16 Derivative financial instrumentsForeign exchange transactions are converted to NZ dollars are the time of payment or receipt.No derivative financial instruments have been used in the current year. (2015: none)
Note 17 BorrowingsActual Actual2016 2015$000 $000
Current PortionFinance Leases 120 112Crown loans - fixed interest 1,700 0
1,820 112Non-current portionFinance Leases 978 1,098Crown loans - fixed interest 13,129 14,829
Total non-current portion 14,107 15,927Total Borrowings 15,927 16,039
Borrowing facility LimitsCrown loan facility 14,829 14,829NZ Health Partnership Ltd (refer to note 7) 8,382 8,196Total borrowing facility limits 23,211 23,025
68

Crown loansThe crown loans are secured by a negative pledge.Without the MoH's prior written approval, the DHB cannot perform the following actions: - create any security over it's assets, except in certain defined circumstances; - lend money to another person or entity (except in the ordinary course of business and then only on commercial terms) or give a guarantee; - make a substantial change in the nature or scope of it's business as presently conducted; or - dispose of any of it's assets, except disposals in the ordinary course of business or disposal for full value.
Fair valueThe fair value of borrowings has been determined using contractual cash flows discounted using a rate based on market borrowing rates.
The carrying value of borrowings approximates the fair value at balance date. Actual Actual
Interest rate summary 2016 2015Crown 2.21%-6.49% 2.9% - 6.5%Westpac 7.14% 7.14%NZ Health Partnership 3.38% 4.69%
Analysis of financial leaseMinimum lease payments payable:No later than one year 120 112Later than one year and not later than five years 659 866Later than five years 319 232Total minimum lease payments 1,098 1,210Future finance chargesPresent value of minimum lease payments 1,098 1,210
Present value of minimum lease payments payable:No later than one year 120 112Later than one year and not later than five years 659 866Later than five years 319 232Total present value of minimum lease payments 1,098 1,210
Description of finance leasing arrangementsHauora Tairawhiti has entered into finance leases for MRI equipment. The net carrying amount of this equipment is shown in Note 13.
There are no restrictions in place for any of the finance lease arrangements. These are effectively securedas the rights to the assets revert to the lessor in event of default in payment.
69

Note 18 Employee entitlementsActual Actual2016 2015$000 $000
Current portionAccrued salaries and wages 1,765 3,003Annual leave 5,978 5,388Sick leave and shift leave 154 97Sabbatical leave 307 86Continuing medical education leave 784 791Long service leave 500 406Retirement gratuities 105 135
9,593 9,906Non-current portionLong service leave 324 366Retirement gratuities 465 461
789 827Total employee entitlements 10,382 10,733
Key assumptions in measuring retirement and long service leave obligationsThe present value of sabbatical leave, long service leave and retirement gratuities obligations depend on a number of factors including: - assessment of leave required based upon prior years - review of the maximum potential liability in each class of leave reduced by the above
Note 19 ProvisionsHauora Tairawhiti has no material provisions (2015: Nil). Minor amounts are included with Accounts payable.
70

Note 20 EquityActual Actual2016 2015$000 $000
Crown equityBalance at 1 July 15,980 16,362Capital contributions from the crown 4,000 0Repayment of capital to the crown (382) (382)Balance at 30 June 19,598 15,980
Accumulated surpluses / (deficits)Balance at 1 July (21,425) (18,451)Surplus / (deficit) for the year (6,657) (2,974)Transfer from / (to) trust funds 0 0Balance at 30 June (28,082) (21,425)
Revaluation reservesBalance at 1 July 36,725 37,222Revaluations 0 (497)Balance at 30 June 36,725 36,725
Bequest Trusts and Capital reserveBalance at 1 July 27 27Transfer from / (to) trust funds 0 0Balance at 30 June 27 27Total equity 28,268 31,307
Trust funds and capital reserves represent the unspent portion of donations and bequests subject to restrictions. The restrictions generally specify how the donations and bequests are required to be spentin providing specific deliverables of the bequests.
Included in the accumulated surpluses / (deficits) are $147k (2015: $348k) of unspent mental health ring fenced funding representing the excess funding received over relevant mental health expenses since this funding was established.
71
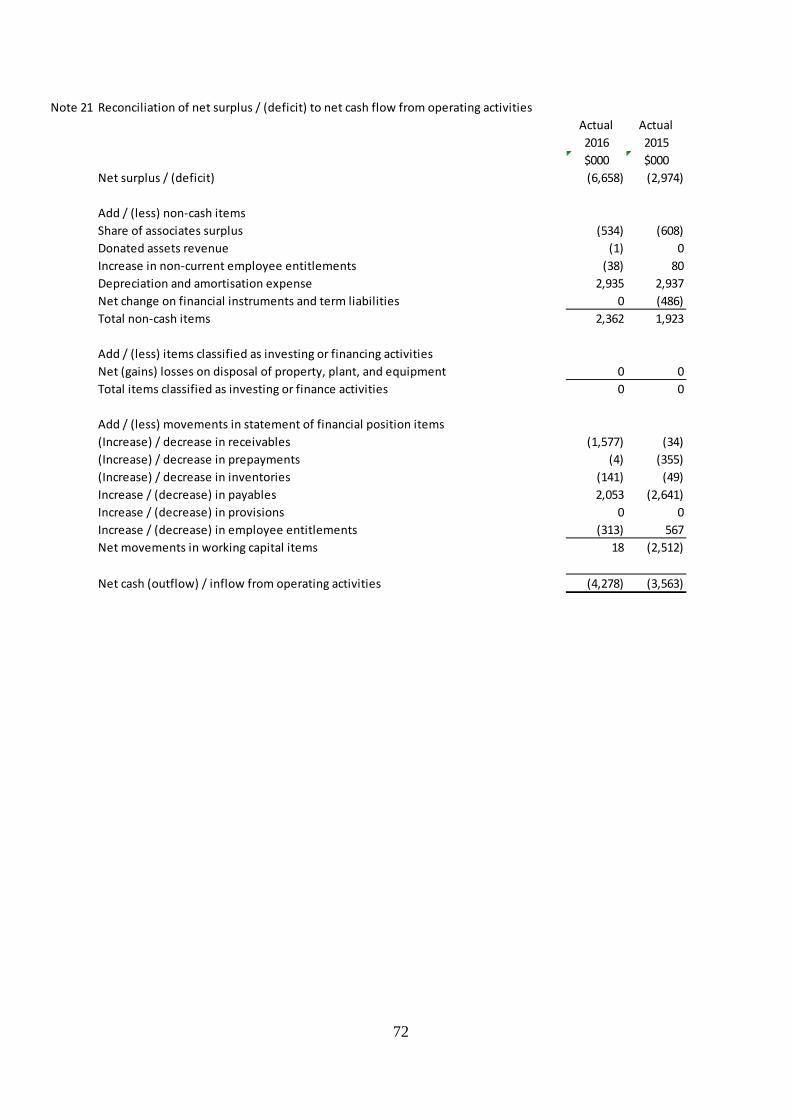
Note 21 Reconciliation of net surplus / (deficit) to net cash flow from operating activitiesActual Actual2016 2015$000 $000
Net surplus / (deficit) (6,658) (2,974)
Add / (less) non-cash itemsShare of associates surplus (534) (608)Donated assets revenue (1) 0Increase in non-current employee entitlements (38) 80Depreciation and amortisation expense 2,935 2,937Net change on financial instruments and term liabilities 0 (486)Total non-cash items 2,362 1,923
Add / (less) items classified as investing or financing activitiesNet (gains) losses on disposal of property, plant, and equipment 0 0Total items classified as investing or finance activities 0 0
Add / (less) movements in statement of financial position items(Increase) / decrease in receivables (1,577) (34)(Increase) / decrease in prepayments (4) (355)(Increase) / decrease in inventories (141) (49)Increase / (decrease) in payables 2,053 (2,641)Increase / (decrease) in provisions 0 0Increase / (decrease) in employee entitlements (313) 567Net movements in working capital items 18 (2,512)
Net cash (outflow) / inflow from operating activities (4,278) (3,563)
72
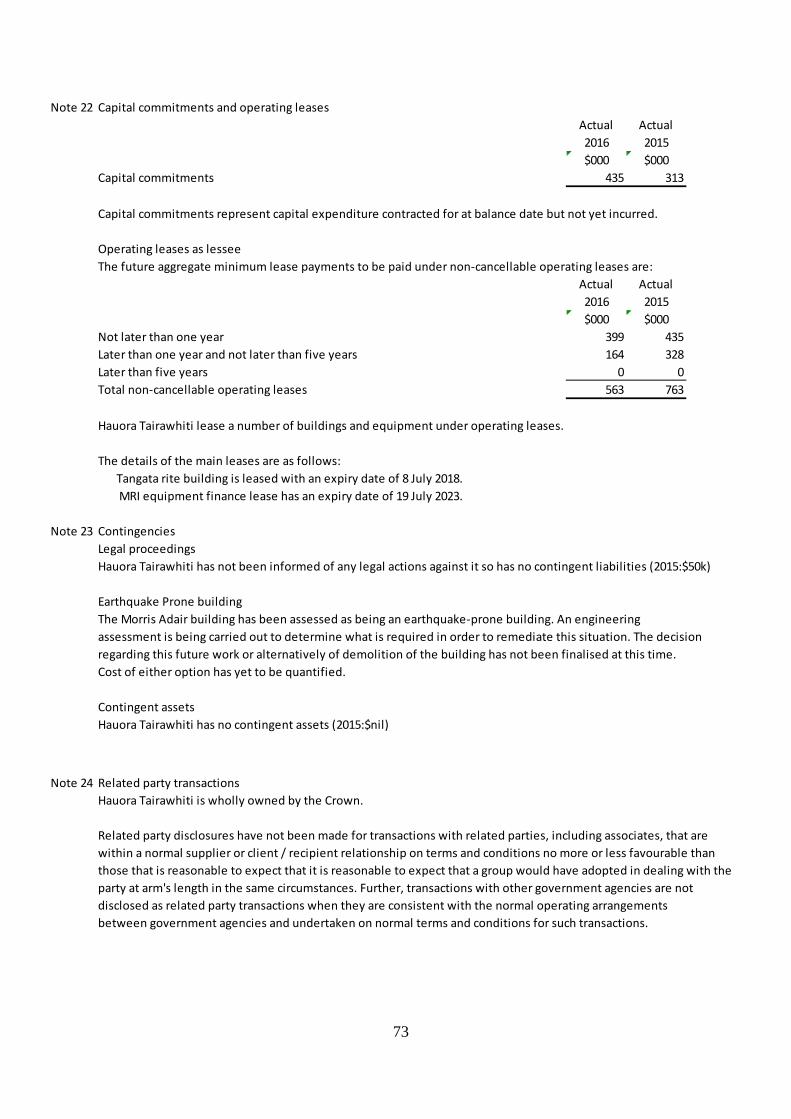
Note 22 Capital commitments and operating leasesActual Actual2016 2015$000 $000
Capital commitments 435 313
Capital commitments represent capital expenditure contracted for at balance date but not yet incurred.
Operating leases as lesseeThe future aggregate minimum lease payments to be paid under non-cancellable operating leases are:
Actual Actual2016 2015$000 $000
Not later than one year 399 435Later than one year and not later than five years 164 328Later than five years 0 0Total non-cancellable operating leases 563 763
Hauora Tairawhiti lease a number of buildings and equipment under operating leases.
The details of the main leases are as follows: Tangata rite building is leased with an expiry date of 8 July 2018. MRI equipment finance lease has an expiry date of 19 July 2023.
Note 23 ContingenciesLegal proceedingsHauora Tairawhiti has not been informed of any legal actions against it so has no contingent liabilities (2015:$50k)
Earthquake Prone buildingThe Morris Adair building has been assessed as being an earthquake-prone building. An engineering assessment is being carried out to determine what is required in order to remediate this situation. The decisionregarding this future work or alternatively of demolition of the building has not been finalised at this time.Cost of either option has yet to be quantified.
Contingent assetsHauora Tairawhiti has no contingent assets (2015:$nil)
Note 24 Related party transactionsHauora Tairawhiti is wholly owned by the Crown.
Related party disclosures have not been made for transactions with related parties, including associates, that are within a normal supplier or client / recipient relationship on terms and conditions no more or less favourable thanthose that is reasonable to expect that it is reasonable to expect that a group would have adopted in dealing with theparty at arm's length in the same circumstances. Further, transactions with other government agencies are not disclosed as related party transactions when they are consistent with the normal operating arrangementsbetween government agencies and undertaken on normal terms and conditions for such transactions.
73

Key management personnel compensation Actual Actual2016 2015
Board members $000 $000 Remuneration 246 246 Full time equivalent members 1 1
Leadership Team Remuneration 2,907 2901 Full time equivalent members 15 16
Total key management personnel remuneration 3153 3147Total full-time equivalent personnel 16 17
Note 25 Board Member RemunerationActual Actual2016 2015
Board MembersC Bauld 20,820 21,070C Bibby 20,070 21,070B A Clarke 25,495 26,597G Milner 22,445 22,257E Reedy 18,070 17,320D Scott 41,100 41,350K Sheldrake 19,320 20,320R Stoltz 20,320 19,570M Todd 19,070 16,030M Tibble 17,695 19,133B Wilson 21,339 20,882
245,744 245,599Maori Caucus & Community MembersW Burdett 1,500 1,750A Hawea 1,750 2,500P Henare 2,250 2,500J Hockey 1,500 750L McCarthy-Robinson 3,500 4,250A Ngarangione 4,000 3,500M Palmer 1,250 1,250M Para 4,750 4,500N Raihania 5,250 5,125H Rokx-Potae 0 1,250B Thomas 1,750 1,500B Turnpenny 2,500 2,250J Williams 2,250 2,000
32,250 33,125
Total governance remuneration 277,994 278,724
74

There have been no payments made to committee members appointed by the Board who are not Board members during the year.
Hauora Tairawhiti has provided a deed of indemnity to Board members for certain activities undertaken in the performance of the DHB's functions.
Hauora Tairawhiti has effected Directors and officers liability and professional indemnity insurance coverduring the financial year in respect of the liability or costs of Board members and employees.
No Board members received compensation or other benefits in relation to cessation (2015:$nil).
Note 26 Employee remunerationThe number of employees or former employees who received remuneration and other benefits of $100,000 or more within specified $10,000 bands were as follows:
Staff No. Staff No.2016 2015
From To100,000 109,999 12 11110,000 119,999 6 6120,000 129,999 5 4130,000 139,999 4 4140,000 149,999 4 2150,000 159,999 2 0160,000 169,999 2 2170,000 179,999 0 3180,000 189,999 1 1190,000 199,999 1 3200,000 209,999 2 0210,000 219,999 2 1220,000 229,999 0 1230,000 239,999 3 0240,000 249,999 3 2250,000 259,999 3 2260,000 269,999 3 3270,000 279,999 5 3280,000 289,999 4 4290,000 299,999 4 3300,000 309,999 5 6310,000 319,999 1 5320,000 329,999 4 1330,000 339,999 2 1340,000 349,999 6 3350,000 359,999 1 4360,000 369,999 3 1370,000 379,999 1 2380,000 389,999 1 1390,000 399,999 0 1400,000 409,999 2 0410,000 419,000 1 0420,000 429,999 0 1430,000 439,000 0 0440,000 450,000 0 2
93 83
75

During the year ended 30 June 2016, 3 (2015:2) employees received compensation and other benefits in relation to cessation totalling $36k (2015:$11k)
Note 27 Events after balance dateThere were no significant events after balance date.
Note 28 Financial InstrumentsThe carrying amounts of financial assets and liabilities in each of the financial instrument categories are as follows:
Actual Actual2016 2015$000 $000
Fair value through surplus or deficitCash and cash equivalents 12 12Receivables 4,937 3,360Investments in associates 707 738
5,656 4,110Financial liabilities measured at amortised costPayables (excluding income in advance and taxes payable) 18,935 17195Borrowings 14,829 14,829Finance leases 1,098 1,210
Total financial liabilities measured at amortised cost 34,862 33,234
Note 29 Capital ManagementHauora Tairawhiti's capital is its equity, which comprises accumulated funds, revaluation reserves and crown equityEquity is represented by net assets.Hauora Tairawhiti is subject to the financial management and accountability provisions of the Crown Entities Act 2004,which impose restrictions in relation to borrowings, acquisition of securities, issuing guarantees andindemnities, and the use of derivatives.Hauora Tairawhiti has complied with the financial management requirements of the Crown Entities Act 2004 during the year. Equity is managed as a by-product of prudently managing revenues, expenses, assets, liabilities,investments, and general financial dealings to ensure that Hauora Tairawhiti achieves its objectives and purposewhile remaining a going concern.
Note 30 Early Childhood CareHauora Tairawhiti receives funding from the Ministry of Education to fund part of children's ward
Actual Actual2016 2015$000 $000
Revenue from the Ministry of Education 83 72
ExpenditurePersonnel costs (53) (51)Operation expenses (2) (2)
(55) (53)
Net surplus / (deficit) 28 19
76

Note 31 Major Variations from the statement of intent
Explanations for major variances from Hauora Tairawhiti's budgeted figures in the Statement of Intent are as follows:
Statement of comprehensive revenue and expensePatient care revenue was $487k higher than budgeted in PBFF adjustments of $351k and Sub Contracts of $732k butunder achieved in side contracts. Revenue overall was ahead of budget by $614k.
Personnel Costs were over budget by $6.1 million or 10%. For a variety of reasons:Successful recruitment of Doctors and SpecialistUnrealistic low budgeted amount
This expenditure was the major contributor to the adverse result for the year.
Payments to other district health boards were $895k or 5% over budget caused by increase usage byTairawhiti residents of the other DHBs.
Non-health Board Providers increased by $269k
Statement of changes in equityThe deficit was $6.974 million below the budgeted result due to the reasons given above.The DHB also received deficit support equity of $4 million which was unbudgeted for.
Statement of financial positionCurrent assets are $1.8 million higher than budget with inventories being $135k up, prepayments $282k upand higher accrual of revenue from the ministry of health $798k, National Transport Assistance $120kplus "wash-up" from Healthshare Ltd up by $120k.
Current liabilities are $4 million higher than budgeted mainly through a $1.7 million reclassification of borrowingswith decrease in Leave liability being less than budget by $1.4 million income in advance up by $217k
Note 32 Breach of legislation
Delivery of information to Audit New Zealand was delayed due to the Board's decision on 25 October to seeka letter of support from the Ministers of Health and Finance. The letter was received on 16 November 2016and provided to the auditor the same day.
The delay meant that the Auditor-General was unable to meet the statutory obligation under the CrownEntities Act (section156[2]) to provide an audit report within 4 months after the end of the financial year.
77