HATCHERY AND GENETIC MANAGEMENT PLAN - … AND GENETIC MANAGEMENT PLAN ... Artificial Production...
44
HATCHERY AND GENETIC MANAGEMENT PLAN (HGMP) Photo: Courtesy of Marblemount Hatchery Staff Hatchery Program: Species or Hatchery Stock: Agency/Operator: Watershed and Region: Date Submitted: Date Last Updated: Skagit River Coho (Oncorhynchus kisutch) Washington Department of Fish and Wildlife Skagit River/Puget Sound October 31 2014 Skagit River Coho Hatchery Program (Integrated)
Transcript of HATCHERY AND GENETIC MANAGEMENT PLAN - … AND GENETIC MANAGEMENT PLAN ... Artificial Production...

HATCHERY AND GENETIC MANAGEMENT PLAN
(HGMP)
Photo: Courtesy of Marblemount Hatchery Staff
Hatchery Program:
Species or Hatchery Stock:
Agency/Operator:
Watershed and Region:
Date Submitted:
Date Last Updated:
Skagit River Coho (Oncorhynchus kisutch)
Washington Department of Fish and Wildlife
Skagit River/Puget Sound
October 31 2014
Skagit River Coho Hatchery Program (Integrated)

Marblemount Coho Program HGMP ii

Marblemount Coho Program HGMP 1
1 SECTION 1. GENERAL PROGRAM DESCRIPTION
1.1 Name of hatchery or program. Skagit River coho program – Marblemount Hatchery.
1.2 Species and population (or stock) under propagation, and ESA status. Skagit River coho salmon (Oncorhynchus kisutch). Puget Sound coho is not currently ESA listed.
1.3 Responsible organization and individuals Hatchery Operations Staff Lead Contact Name (and title): Ed Eleazer, Region 4-North, Hatchery Reform and Operations Manager Agency or Tribe: Washington Department of Fish and Wildlife Address: 16018 Mill Creek Blvd., Mill Creek, WA 98012 Telephone: 206-719-3293 Fax: 425-338-1066 Email: [email protected]
Fish Management Staff Lead Contact Name (and title): Brett Barkdull, Region 4 District Biologist Agency or Tribe: Washington Department of Fish and Wildlife Address: 111 Sherman Street, La Conner WA 98257 Telephone: 360-466-4345 Ext 270 Fax: 360-466-0515 Email: [email protected]
Other agencies, Tribes, co-operators, or organizations involved, including contractors, and extent of involvement in the program: The coho program is co-managed with the Sauk-Suiattle Tribe and Swinomish Indian Tribal Community (represented by Skagit River System Cooperative), and Upper Skagit Indian Tribe. The Skagit River System Cooperative (SRSC) provides natural resource management services for the Sauk-Suiattle Indian Tribe and the Swinomish Indian Tribal Community. In addition to the on-station production, eyed-eggs are provided to local schools and the Skagit Fisheries Enhancement Group for educational programs. Since 2010, eyed-eggs (up to 140,000) are also provided on demand to Glenwood Springs Hatchery when the returning broodstock to the facility is unable to meet on-site egg-take goals. Glenwood Springs is managed by Long Live the Kings (see Glenwood Springs Coho HGMP).
1.4 Funding source, staffing level, and annual hatchery program operational costs. Funding Sources Operational Information (for FY 2015)
General Fund – State (GF-S) Full time equivalent staff - 3.48 DJ - Federal Annual operating cost - $395,844
The GF-S and DJ funding information applies cumulatively to annual operating cost at Marblemount Hatchery and cannot be broken out specifically by program.
1.5 Location(s) of hatchery and associated facilities. Table 1.5.1: Location of culturing phases, by facility.
Facility Culturing Phase Location Marblemount Hatchery
Broodstock collection, rearing, acclimation, release.
Clark Creek (WRIA 04.1421) RM 0.5, tributary to the Cascade River (WRIA 04.1411). The Cascade River is a tributary to the Skagit River (WRIA 03.0176) at RM 78.

Marblemount Coho Program HGMP 2
Figure 1.5.1: Map of the Skagit Basin hatchery and trapping facilities. Source: WDFW GIS Staff.
1.6 Type of program. This is an integrated research program with harvest benefits as a secondary objective.
1.7 Purpose (Goal) of program. The purpose of this program is research and harvest.
1.8 Justification for the program. Coho program was designed to serve as an indicator stock for natural coho population in the Skagit River and provide information for assessment of regional and distant (Canadian) fisheries as well as marine survival, migration patterns, timing and distribution. The secondary goal is to provide harvest fish, however, harvest management in the region is focused on natural production. To minimize impacts on listed fish by WDFW facilities operation and the Marblemount Hatchery program, the following Risk Aversions are included in this HGMP:

Marblemount Coho Program HGMP 3
Table 1.8.1. Summary of risk aversion measures for the Marblemount spring Chinook program.
Potential Hazard HGMP Reference Risk Aversion Measures
Water Withdrawal 4.1 Water rights are formalized through permits obtained from WDOE. Water rights permit numbers are provided in HGMP section 4.1. Monitoring and measurement of water usage is reported in monthly NPDES reports.
Intake Screening 4.2, 5.8 The water intakes are in compliance with state and federal guidelines (NMFS 1995, 1996), but do not meet the current Anadromous Salmonid Passage Facility Design criteria (NMFS 2011). The current intakes on Clark and Jordan Creeks do not allow fish passage. The Jordan Creek intake project, designed to allow fish passage, is currently in the conceptual phase.
Effluent Discharge
4.2 The facility operates under the "Upland Fin-Fish Hatching and Rearing" National Pollution Discharge Elimination System administered by the Washington Department of Ecology (DOE) and is regulated through NPDES permit # WAG 13-3015.
Broodstock Collection & Adult Passage
2.2.3, 6.2.3, 6.3, 7.2, 7.9
Adult broodstock is collected from volunteers returning to the hatchery trap, located on Clark Creek, from late-May through September. Hatchery-origin spring Chinook are held for broodstock, and all unmarked Chinook and all other species, when encountered, are passed directly into Cascade River; no fish are released into Clark Creek above the trapping weir or Jordan Creek. Cascade River has no blockage and all fish (including hatchery fish) can by-pass hatchery and spawn naturally.
Disease Transmission
9.2.7, 10.9 The Salmonid Disease Control Policy of the Fisheries Co-Managers of Washington State (WDFW and WWTIT 1998, updated 2006) details hatchery practices and operations designed to stop the introduction and/or spread of any diseases.
Competition & Predation
2.2.3, 10.11 Fish are released at a time, size, life-history stage (smolts), and location to foster rapid downstream migration to marine waters.
1.9 List of program “Performance Standards”.
See HGMP section 1.10. Standards and indicators are referenced from Northwest Power Planning Council (NPPC) Artificial Production Review (APR) (NPPC 2001).
1.10 List of program “Performance Indicators”, designated by "benefits" and "risks." 1.10.1 “Performance Indicators” addressing benefits. Table 1.10.1.1: “Performance indicators” addressing benefits.
Benefits Performance Standard Performance Indicator Monitoring & Evaluation
3.2.2 Release groups are sufficiently marked in a manner consistent with information needs and protocols to enable determination of impacts to natural- and hatchery-origin fish in fisheries.
Number of marks of this program observed in fishery samples, and estimated total contribution of this population to fisheries, by fishery.
All juveniles released through this program are marked with adipose fin-clip (AD), and/or coded-wire tags (CWTs). Marks retention rates are monitored. Commercial, test and recreational fisheries are annually sampled for presence of CWT and presence or absence of adipose fin. Number and codes of recovered CWTs are continually reported to RMIS database and available

Marblemount Coho Program HGMP 4
through their web site. Collected data are used for estimate fisheries contribution, distribution and survival. Estimated total fisheries contribution of this population is presented in Table 3.3.1.1.
Recreational angler days, by fishery.
WDFW uses Catch Record Cards and creel surveys as s a tool to estimate recreational catch of salmon and selected other species.
Annual escapement of natural populations that are affected by fisheries targeting program fish.
WDFW annually monitors returning Chinook by preforming spawning and carcass ground and air surveys, observing numbers of built redds, live fish presence, and sampling carcasses for biological data including length, sex, scales, otoliths and DNA. Fish are also monitored for presence of external and internal marks. Data collected during fish monitoring are used to estimate fisheries contribution and distribution, escapement, survival, diversity and origin.
3.3.2 Releases are sufficiently marked to allow statistically significant evaluation of program contribution to natural production, and to evaluate effects of the program on the local natural population.
Number of marks and estimated total proportion of this population in juvenile dispersal and in adults on natural spawning grounds.
All juveniles released through this program are marked with adipose fin clip, and/or coded wire tags. Marks retention rates are monitored. Juvenile release numbers, size, date and condition are monitored at the hatchery and migration patterns are monitored at the smolt traps. Returning adults are annually sampled for the adipose fin and CWT presence and absence at the hatchery and on natural spawning grounds.
3.5.4 Juveniles are released on-station, or after sufficient acclimation to maximize homing ability to intended return locations.
Location of juvenile releases. Length of acclimation period. Release type, whether forced, volitional, or direct stream release.
Juvenile acclimation procedures, release location and method are monitored.
Proportion of adult returns to program’s intended return location, compared to returns to unintended dams, fisheries, and artificial or natural production areas.
Returning fish are annually sampled for the CWT presence and absence at the hatchery and natural spawning grounds. Retrieved coded wire tags enable evaluation of fish origin versus escapement location. CWT data releases and recaptured are annually reported to RMIS.

Marblemount Coho Program HGMP 5
3.6.1 The hatchery program uses standard scientific procedures to evaluate various aspects of artificial propagation.
Scientifically based experimental design, with measurable objectives and hypotheses.
The program is operated consistent with the Co-Manager’s Fish Health Policy (WDFW and WWTIT 1998, updated 2006) and WDFW rearing standards. Data in regards of hatchery population growth, development, and return, including annual size and run timing, age and sex composition is collected and recorded in WDFW Hatcheries Headquarters Database.
3.6.2 The artificial propagation program is monitored and evaluated on an appropriate schedule and scale to address progress towards achieving the experimental objective and evaluate beneficial and adverse effects on natural populations.
Monitoring and evaluation framework including detailed time line.
As an indicator stock, survival and contribution to fisheries and escapement will be estimated for natural-origin fish each brood year released.
3.8.2 Juvenile production costs are comparable to or less than other regional programs designed for similar objectives.
Average total cost of activities with similar objectives.
Annual operational cost is recorded and can be compared to calculated fishery contribution value estimated be Wegge (2009).
1.10.2 Performance Indicators” addressing risks. Table 1.10.2.1: “Performance indicators” addressing risks.
Risks Performance Standard Performance Indicator Monitoring & Evaluation
3.1.3 Program addresses ESA responsibilities.
ESA consultation(s) under Section 7 have been completed, Section 10 permits have been issued, or HGMP has been determined sufficient under Section 4(d), as applicable.
First HGMP for this program was submitted to NOAA fisheries in August 2002. This HGMP has been updated to reflect changes in the program and resubmitted to NOAA fisheries.
3.5.1 Patterns of genetic variation within and among natural populations do not change significantly as a result of artificial production.
Genetic composition of naturally produced adults and co-occurring adults of this program measured annually.
Currently not monitored.
3.5.2 Collection of broodstock does not adversely impact the genetic diversity of the naturally-spawning population.
Total number of spawners estimated to pass the collection facility to spawning areas compared to minimum effective population size (when established) required for those natural populations.
This is a segregated program maintained exclusively with returning hatchery adults.
3.5.3 Hatchery-origin adults in natural production areas do not exceed appropriate proportion of the total natural spawning population.
The ratio of observed and/or estimated total numbers of artificially-produced fish on natural spawning grounds, to total number of naturally-produced fish.
Natural production areas are monitored for returning fish and their markings (fin-clips and presence and absence of CWTs).
3.7.1 Hatchery facilities are operated in compliance with all applicable fish health
Annual reports indicating levels of compliance with applicable standards and criteria.
The program is operated consistent with the Salmonid Disease Control Policy of the Fisheries Co-

Marblemount Coho Program HGMP 6
guidelines and facility operation standards and protocols (IHOT, PNFHPC, the Salmonid Disease Control Policy of the Fisheries Co-Managers of Washington State (WDFW and WWTIT 1998, updated 2006), INAD, MDFWP).
Managers of Washington State (WDFW and WWTIT 1998, updated 2006).
Periodic audits indicating level of compliance with applicable standards and criteria.
Fish health and condition are monitored monthly by WDFW pathologist. Examination procedures performed at each life stage may include virus, bacteria and parasites testing and pathological changes observation.
3.7.2 Effluent from hatchery facility will not detrimentally affect natural populations.
Discharge water quality compared to applicable water quality standards by NPDES permit.
Flow and discharge are monitored and reported monthly in NPDES reports.
WDOE water rights permit compliance.
Usage of water at Marblemount Hatchery is regulated and compliant with trust water right permit.
3.7.3 Water withdrawals and in-stream water diversion structures for artificial production facility operation will not prevent access to natural spawning areas, affect spawning behavior of natural populations, or impact juvenile rearing environment.
Water withdrawals compared to NMFS, USFWS and WDFW applicable passage and screening criteria for juveniles and adults.
The current barriers and intake structures have been evaluated and needed changes has been recommended and prioritized (see Table 5.8.1).
3.7.4 Releases do not introduce pathogens not already existing in the local populations, and do not significantly increase the levels of existing pathogens. Follow Co-managers Fish Health Disease Policy (WDFW and WWTIT 1998, updated 2006).
Necropsies of fish to assess health, nutritional status, and culture conditions.
All fish present at the hatchery are inspected for pathogens by WDFW pathologists. Juvenile fish health assessments are performed monthly. As necessary remedial or preventive measures are taken to prevent or treat diseases, with administration of therapeutic or prophylactic treatments. A fish health database is maintained to identify trends in fish health, diseases and treatments.
Release and/or transfer exams for pathogens and parasites.
Fish to be releases are examined one to six weeks prior to transfer or release, in accordance with the Co-managers Fish Health Policy (WDFW and WWTIT 1998, updated 2006).
Inspection of adult broodstock for pathogens and parasites.
Lots of 60 adult are examined for pathogens at spawning.
Inspection of off-station fish/eggs prior to transfer to hatchery for pathogens and parasites.
Specific fish pathogens are tested prior to transfers in accordance to the Salmonid Disease Control Policy of the Fisheries Co-Managers of Washington State (WDFW and WWTIT 1998, updated 2006).
3.7.5 Any distribution of carcasses or other products for nutrient enhancement is
All applicable fish disease policies are followed.
Carcass distribution is performed in accordance to the Salmonid Disease Control Policy of the

Marblemount Coho Program HGMP 7
accomplished in compliance with appropriate disease control regulations and guidelines, including state, tribal and federal carcass distribution guidelines.
Fisheries Co-Managers of Washington State (WDFW and WWTIT 1998, updated 2006).
3.7.6 Adult broodstock collection operation does not significantly alter spatial and temporal distribution of any naturally-produced population.
Spatial and temporal spawning distribution of natural populations above and below weir/trap currently compared to historic distribution.
Run timing and spawning areas are monitored annually.
3.7.8 Predation by artificially produced fish on naturally produced fish does not significantly reduce numbers of natural fish.
Hatchery juveniles are raised to smolt-size and released from the hatchery at a time that fosters rapid migration downstream.
Hatchery smolt release size and time are monitored to quantify/minimize predation effects on naturally produced Chinook (Seiler et al., 2002, 2003).
1.11 Expected size of program
1.11.1 Proposed annual broodstock collection level (maximum number of adult fish).
Up to 300 adults collected annually.
1.11.2 Proposed annual fish release levels (maximum number) by life stage and location.
Table 1.11.2.1: Proposed annual releases for Marblemount Hatchery coho program. Life Stage Annual Release Level Release Location Yearling 250,000 Cascade River (WRIA 04.1411)
Source: Future Brood Document 2014. Notes: On-station release goal have been reduced by 41% after brood year 1994.
Off station releases into sloughs has been discontinued after 2012. Table 1.11.2.2: Transfer goals for Marblemount Hatchery coho (Skagit stock).
Destination Stage Number Date Skagit Fishing Enhancement Group Eyed-eggs 500 February Area Schools Eyed-eggs 1,000 October
Source: Future Brood Document, 2014
1.12 Current program performance, including estimated smolt-to-adult survival rates, adult production levels, and escapement levels. Indicate the source of these data. Based on the average smolt-to-adult survival of 5.64% for brood years 2000-2009 (RMIS 2014, see also Table 3.3.1.1), and a program release goal of 250,000 yearlings, the estimated adult production (goal) level would be 14,100 fish.

Marblemount Coho Program HGMP 8
Table 1.12.1: Coho escapement to Marblemount Hatchery, 2002-2013. Year Hatchery Escapement 2002 16,279 2003 4,072 2004 10,291 2005 10,249 2006 1,415 2007 8,952 2008 10,182 2009 9,544 2010 4,595 2011 9,366 2012 9,578 2013 13,644
Average 9,014 Source: WDFW Hatcheries Headquarters Database 2014.
1.13 Date program started (years in operation), or is expected to start. This program was initiated in 1947.
1.14 Expected duration of program. The program is expected to be ongoing.
1.15 Watersheds targeted by program. The program targets the Skagit River watershed (WRIA 03 and 04).
1.16 Indicate alternative actions considered for attaining program goals, and reasons why those actions are not being proposed. In order for any alternative actions to be considered for attaining program goals, the affected parties (co-managers) must approve any changes. The Puget Sound Salmon Management Plan (PSSMP), a federal court order, describes the co-management responsibilities of WDFW and the tribes with regard to fishery management and artificial production. The PSSMP explicitly states that "no change may be made to the Equilibrium Brood Document (program production goals) without prior agreement of the affected parties." In the Skagit River watershed any changes in the production at the Marblemount Hatchery have to be reviewed and approved by WDFW and the Skagit River System Cooperative (representing Sauk-Suiattle Tribe and Swinomish Indian Tribal Community) and the Upper Skagit Indian Tribe. Alternative 1: Eliminate the program: The Co-managers did not pursue this alternative because a portion of a program is needed to meet research objectives as set by the Pacific Salmon Commission technical committee and the remainder of the program are needed to augment harvest.
2 SECTION 2. PROGRAM EFFECTS ON NMFS ESA-LISTED
SALMONID POPULATIONS. (USFWS ESA-Listed Salmonid Species and Non-Salmonid Species are addressed in Addendum A)
2.1 List all ESA permits or authorizations in hand for the hatchery program. The Marblemount Coho HGMP was previously submitted to NOAA in March of 2003; however it was acted on by NOAA. This HGMP is submitted to NOAA Fisheries for ESA consultation,
Marblemount Coho Program HGMP 9
and determination regarding compliance of the plan with ESA Limit 6 of the 4(d) rule criteria for joint state/tribal hatchery resource management plans affecting listed species.
2.2 Provide descriptions, status, and projected take actions and levels for NMFS ESA-listed natural populations in the target area. 2.2.1 Description of NMFS ESA-listed salmonid population(s) affected by the
program. - Identify the NMFS ESA-listed population(s) that will be directly affected by the program. None ESA-listed populations are directly affected by this program.
- Identify the NMFS ESA-listed population(s) that may be incidentally affected by the program. Puget Sound Chinook (Oncorhynchus tshawytscha): Listed as Threatened on March 24, 1999 (64FR14308); Threatened status reaffirmed on June 28, 2005 (70FR37160); reaffirmed Threatened by five-year status review, completed August 15, 2011 (76FR50448). The Puget Sound Chinook salmon ESU is composed of 31 historically quasi-independent populations, of which 22 are believed to be extant currently. The ESU includes all naturally-spawned populations of Chinook salmon from rivers and streams flowing into Puget Sound including the Strait of Juan De Fuca from the Elwha River, eastward, including rivers and streams flowing into Hood Canal, South Sound, North Sound and the Strait of Georgia in Washington (Ford 2011), as well as twenty-seven artificial propagation programs (NMFS 2013 78FR38270). In the Skagit basin, the Technical Recovery Team (TRT) has identified demographically independent populations (DIPs) in the Lower Skagit River, Upper Skagit River, Upper Cascade River, Lower Sauk River, Upper Sauk River and Suiattle River (Ruckelshaus et al. 2006). Puget Sound steelhead (Oncorhynchus mykiss): Listed as Threatened under the ESA on May 11, 2007 (72FR26722); reaffirmed Threatened by five-year status review, completed August 15, 2011 (76FR50448). The DPS includes all naturally spawned anadromous winter-run and summer-run O. mykiss (steelhead) populations, below natural migration barriers in the river basins of the Strait of Juan de Fuca, Puget Sound, and Hood Canal, Washington. This DPS is bounded to the west by the Elwha River (inclusive) and to the north by the Nooksack River and Dakota Creek (inclusive, Ford 2011). Also includes steelhead from six artificial propagation programs: Green River Natural; White River Winter Steelhead Supplementation; Hood Canal Steelhead Supplementation Off-station Projects in the Dewatto, Skokomish, and Duckabush Rivers; and the Lower Elwha Fish Hatchery Wild Steelhead Recovery (NMFS 2013 78FR38270). In the Skagit Basin, the TRT has preliminarily delineated one winter steelhead DIP in Nookachamps Creek and three DIPs of combined winter/summer steelhead (mainstem Skagit River, Baker River and Sauk River) (PSSTRT 2013).
2.2.2 Status of NMFS ESA-listed salmonid population(s) affected by the program. - Describe the status of the listed natural population(s) relative to “critical” and “viable” population thresholds. Marblemount Hatchery (Skagit River) spring Chinook in the Puget Sound Chinook ESU. NMFS (1999) considered this stock to be part of the ESU, but not essential for recovery. This stock is a Category 2c. This stock was founded from within the ESU and is native to the basin in which it is released. However, most of the broodstock was trapped in the Suiattle River and the program operates in the Cascade River. The Suiattle and Cascade River spring-run populations are recognized as distinct (SSHAG 2003). Genetic analyses indicate that although this stock was founded by native spring-run Chinook salmon, there has been moderate divergence between the hatchery broodstock and other spring run population in the Skagit River Basin (Marshall et al. 1995).

Marblemount Coho Program HGMP 10
Marblemount Hatchery (Skagit River) summer Chinook in the Puget Sound Chinook ESU. NMFS (1999) considered this stock to be part of the ESU, but not essential for recovery. SSHAG (2003) designated this stock as Category 1a, due to recent founding from native natural-origin fish. Allozyme analysis has shown that Upper Skagit Chinook are not significantly different from Lower Skagit fall Chinook stock or from Upper Sauk spring Chinook (Marshall et al. 1995). The current program was established in 1995 using native Skagit River summer Chinook stock collected in the Upper Skagit River above Marblemount (between RM 80 and RM 84). Skagit River spring Chinook in the Puget Sound Chinook ESU. Recent escapement levels (2000-2011) have averaged 540 for natural spawners in the Upper Sauk River DPS, 343 for the Suiattle River DPS and 353 for the Cascade River DPS. During this same period, the Upper Sauk DPS has shown and increasing population trend, while the Suiattle has decreased and the Cascade has remained relatively flat (SaSI, WDFW 2013). Skagit Summer/Fall Chinook in the Puget Sound Chinook ESU. Recent escapement levels (2000-2011) have averaged 10,969 for natural spawners in the Upper Skagit River DPS, 688 for the Lower Sauk River DPS and 2,401 for the Lower Skagit River DPS. All populations have shown declining population trends during this same period (SaSI, WDFW 2013). Puget Sound Chinook salmon: Updated Risk Summary. All Puget Sound Chinook populations are well below the TRT planning range for recovery escapement levels. Most populations are also consistently below the spawner recruit levels identified by the TRT as consistent with recovery. Across the ESU, most populations have declined in abundance somewhat since the last status review in 2005, and trends since 1995 are mostly flat. Several of the risk factors identified by Good et al. (2005) are also still present, including high fractions of hatchery fish in many populations and widespread loss and degradation of habitat. Many of the habitat and hatchery actions identified in the Puget Sound Chinook recovery plan are expected to take years or decades to be implemented and to produce significant improvements in natural population attributes, and these trends are consistent with these expectations. Overall, the new information on abundance, productivity, spatial structure and diversity since the 2005 review does not indicate a change in the biological risk category since the time of the last BRT status review (Ford 2011). See Marblemount Chinook HGMPs for Chinook viability criteria. Skagit River summer and winter-run steelhead in the Puget Sound Steelhead DPS. The number of natural-origin winter steelhead has substantially increased in the last five years. From a low point in 2008-2009 of 2,502 spawners, the number of spawners increased to 3,981 in 2009-2010, 5462 in 2010-2011, to 6,182 in 2011-2012, and to 8,272 in 2012-2013. Ford (2011) used spawner data collected through 2008 and concluded the following: “Steelhead counts in the Skagit River have declined steadily since the 1980s. The estimated probability that this steelhead population would decline to 10% of its current estimated abundance (i.e., to 504 fish) is high—about 80% within 75 years. With an estimated mean population growth rate of −0.037 (λ = 0.964) and process variance of 0.005, NOAA was confident (P < 0.05) that a 90% decline in this population will not occur within the next 30 years, and that a 99% decline will not occur within the next 60 years. However, beyond the next 50 years NOAA was uncertain about the precise level of risk ”. Based on a habitat-based intrinsic potential (IP) estimate by the PSSTRT (2013), the capacity for summer and winter steelhead in Skagit system ranges from 6,478 to 129,551 for the mainstem Skagit DIP, 2,323 to 46,460 for the Sauk DIP, 503 to 10,056 for the Baker River DIP and between 123 and 2,462 for the Nookachamps Creek winter steelhead DIP (Table 2.2.2.1).

Marblemount Coho Program HGMP 11
Table 2.2.2.1: Estimated DIP abundance thresholds of wild steelhead in the Skagit basin. Abundance goals for summer-run fish (italics) are still under review. QET, quasi extinction threshold; SAS, smolt to adult survival. Minimum abundance = 100 (Low Abundance), 250 (Viable).
Population Basin Quasi Extinction Threshold
Low Abundance Viable Capacity
Population Name Area km2
Mean Elevation (m)
Total Stream Length (m) 1% SAS 5% SAS 20% SAS
Nookachamps Cr. 183 252 159,503 27 123 616 2,462 Skagit River 5,543 1,098 2,815,113 157 6,478 32,388 129,551 Sauk River 1,897 1,132 1,079,263 103 2,323 11,615 46,460 Baker River 771 999 421,859 36 503 2,514 10,056
Puget DPS Total 1,462 30,449 153,194 613,662 Source: Hard et al. 2014 Puget Sound steelhead: Updated Risk Summary. The number of winter steelhead spawners has increased for many populations in Puget Sound since 2009. The number of spawners for 16 Puget Sound winter steelhead populations, relative to the average number of spawners for each population in the four year period up to the listing in 2007, increased from an average of 51% in 2009 to 141% in 2013 (Figure 2.2.2.1).
Figure 2.2.2.1: Relative to average percent of 2004-2007 spawners for 16 Puget Sound winter steelhead populations.
These recent, short-term increases in spawners are a positive development, but do not negate the long term risks facing Puget Sound steelhead DPS. Using spawner data collected through 2008 or 2009, Ford (2011) concluded that the status of the listed Puget Sound steelhead DPS has not changed substantially since the 2007 listing, and that steelhead in the Puget Sound DPS remain at risk of extinction throughout all or a significant portion of their range in the foreseeable future but are not currently in danger of imminent extinction.
- Provide the most recent 12 year (e.g. 1988-present) progeny-to-parent ratios, survival data by life-stage or other measures of productivity for the listed population. See Marblemount Chinook HGMP for Chinook productivity data.

Marblemount Coho Program HGMP 12
Skagit System Steelhead (Oncorhynchus mykiss): Smolt monitoring traps utilized in larger river systems cannot successfully trap steelhead smolts. Smolt monitoring for Chinook and coho salmon in the Skagit River system indicates low numbers of wild steelhead smolts incidentally caught (Kinsel et al. 2008).
Table 2.2.2.2: Steelhead smolts and adults caught in Skagit River scoop and screw traps 1998-2007.
Species 1998 1999 2000 2001 2002 Scp Scr Scp Scr Scp Scr Scp Scr Scp Scr
Steelhead 1+ Natural 389 1,100 99 334 95 597 32 317 118 437 Hatchery 446 2,325 122 511 75 736 23 465 75 534
Steelhead Adult 1 3 11 1 1 2 0 0 1 2
Species 2003 2004 2005 2006 2007 Scp Scr Scp Scr Scp Scr Scp Scr Scp Scr
Steelhead 1+ Natural 32 366 337 1,287 45 289 36 293 179 746 Hatchery 26 474 213 2,401 16 183 17 624 114 1,932
Steelhead Adult 0 0 0 0 2 0 0 0 0 3 Source: Kinsel et al. 2008.
Table 2.2.2.3: Steelhead population exponential trend ln(nat. spawners) (95% CI) Population 1985-2009 1995-2009
Skagit River winter‐run 0.969 (0.954 ‐ 0.985) 0.978 (0.931 ‐ 1.029) Source: Ford 2011. These are based on analyses reported by Ford (2011) that are not necessarily agreed to
by WDFW, the Sauk-Suiattle Tribe, Swinomish Indian Tribal Community, and the Upper Skagit Indian Tribe.
- Provide the most recent 12 year (e.g. 1988-1999) annual spawning abundance estimates, or any other abundance information. Indicate the source of these data. See Marblemount HGMPs for Chinook escapement data.
Table 2.2.2.4: Wild Skagit River steelhead escapement 2001-2012. Return Year Winter Run* Summer Run
2000/2001 4,584 NA 2001/2002 5,394 NA 2002/2003 6,818 NA 2003/2004 7,332 NA 2004/2005 6,382 NA 2005/2006 6,757 NA 2006/2007 4,242 NA 2007/2008 4,887 NA 2008/2009 2,502 NA 2009/2010 3,981 NA 2010/2011 5,462 NA 2011/2012 6,185 NA Average 5,377 NA
Source: SaSI (WDFW 2014) * Total Escapement Data are total escapement estimates for all Skagit winter steelhead based on cumulative
redd counts in the mainstem Skagit River from RM 22.5 to 94.1 and in Alder, Diobsud, Rocky, O’Toole, Cumberland, Day, Sorenson, Hansen and Jones creeks. Estimates include winter steelhead in the Sauk and Cascade Rivers.
Marblemount Coho Program HGMP 13
- Provide the most recent 12 year (e.g. 1988-1999) estimates of annual proportions of direct hatchery-origin and listed natural-origin fish on natural spawning grounds, if known. See Marblemount Chinook HGMPs for estimates.
2.2.3 Describe hatchery activities, including associated monitoring and evaluation and research programs, that may lead to the take of NMFS listed fish in the target area, and provide estimated annual levels of take.
- Describe hatchery activities that may lead to the take of listed salmonid populations in the target area, including how, where, and when the takes may occur, the risk potential for their occurrence, and the likely effects of the take. Broodstock Collection: The Marblemount hatchery trap is usually operated from May 1 (May 15 at the latest) through middle of March (or later if necessary and possible) to accommodate Chinook, coho and steelhead broodstock collection and removal of hatchery-origin fish from the system. Spring Chinook program at Marblemount Hatchery is managed as segregated and no natural origin fish are targeted for the broodstock. However, any fish during brood collecting season can enter hatchery trap including unmarked and untagged fish. If it happens, any unmarked Chinook are return to the Cascade River that is not blocked by weir and allows unobstructed fish movement. Unmarked steelhead has not been encountered at the hatchery trap for past 12 years. Although trapping and handling process may pose injury or death, the risk is minimal and little or no mortality has been documented. Adult passage: The Jordan Creek Intake, one of four water sources that supply hatchery, may pose a low to moderate risk of take to listed fish by delaying passage or restricting access to the upper creek, though, potential Chinook utilization of Jordan Creek above the hatchery intake is limited by its very steep gradient. New Jordan Creek intake project, designed to allow fish passage, is currently in the conceptual phase. Permanent weir on Clark Creek blocks access to approximately one river mile remaining between hatchery and spring that feeds the creek. There is no obstruction to fish movement on Cascade River. Unmarked fish that volunteered to the hatchery are released into Cascade River. Operation of Hatchery Facilities: Potential facility operation impacts on listed fish include: water withdrawal, hatchery effluent, and intake compliance. Monitoring and maintenance are conducted along with staff observations. Effluent at outfall areas is rapidly diluted with mainstem flows and operation is within permitted guidelines (see HGMP sections 4.1 and 4.2). All permit requirements are followed in order to minimize the potential indirect ‘Take” associated with the operations of these facilities. No take of listed fish have been reported by staff during the normal operation of the hatchery. Disease Transmission: Interactions between hatchery-reared and naturally-produced populations may be a source of pathogen and disease transmission although there is little evidence showing that diseases are transmitted from hatchery fish to natural-origin fish (Steward and Bjornn 1990). WDFW conducts fish disease examinations to ensure minimal disease transmission and to prevent the introduction and/or spread of any fish diseases. Fish health monitoring efforts include fish health examinations and virus sampling, abnormal fish loss investigations, virus sampling, and pre-transfer and pre-liberation inspections. All activities are done in accordance with guidelines developed under the Salmonid Disease Control Policy of the Fisheries Co-Managers of Washington State (WDFW and WWTIT 1998, updated 2006). Hatchery Production/Density-Dependent Effects: Hatcheries can release numbers of fish that can exceed the density of the natural productivity in a limited area for a short period of time and can compete with listed fish. Fish are released as active smolts that will emigrate in order to minimize the effect of the release. Indirect take from density-dependent effects is unknown.

Marblemount Coho Program HGMP 14
Predation and Competition: Although coho have been documented to prey on other salmonids, primarily pink, chum and sockeye salmon, (Hawkins and Tipping 1999; Seiler et al. 2002; Hargreaves and LeBrasseur 1986), any predation potential to listed populations should be minimized by the timing and proximity of the release. Marblemount Hatchery releases coho in May at the size of 17 fpp that correlates with fish fork length of 140 mm. The length of migrating natural-origin Chinook salmon is around 60 mm (Seiler et al., 1999-2001). The USFWS (1994) suggested that juvenile salmonids can consume fish which are less than or equal to one-third its own body length. Based on this suggestion natural-origin Chinook are larger than the predation susceptibility size. Hatchery coho juveniles are also released as smolts, a practice to foster rapid seaward migration and reduce the duration of interaction with listed fish present in the river. Data from Seiler et al. (1998; 2000) indicated that coho smolts released from the Marblemount Hatchery emigrated quite rapidly, approximately 11.2 river miles per day, reaching the trap site (located at RM 17) within days of release. Trapping studies on the Skagit River (Seiler et al. 1999) also showed that by mid-May, over 80% of the natural-origin listed Chinook migration had passed the trap site. Steward and Bjornn (1990) also concluded, that hatchery fish kept in the facility for extended periods before release as smolts (e.g. yearlings) may have different food and habitat preferences than listed natural-origin fish making it less likely to out-compete the latter.
- Provide information regarding past takes associated with the hatchery program, (if known) including numbers taken, and observed injury or mortality levels for listed fish. Listed fish are not targeted for broodstock collection at the hatchery trap. Unmarked steelhead has not been encountered at the hatchery trap for past 12 years. Majority of Chinook arrive at the hatchery before coho broodstock collection take place, first coho usually arrives at the hatchery in mid-October. Any unmarked and untagged Chinook arriving at the trap throughout the season are transported, by tank truck, and immediately released into Cascade River. For numbers of listed Chinook takes at Marblemount Hatchery during entire trapping season see “Take” tables in the Marblemount Spring Chinook HGMP.
- Provide projected annual take levels for listed fish by life stage (juvenile and adult) quantified (to the extent feasible) by the type of take resulting from the hatchery program (e.g. capture, handling, tagging, injury, or lethal take). See “Take” Tables at the end of this document.
- Indicate contingency plans for addressing situations where take levels within a given year have exceeded, or are projected to exceed, take levels described in this plan for the program. If significant numbers of listed fish are observed impacted by this program operation, NOAA Fisheries will be consulted to develop a contingency plan.
3 SECTION 3. RELATIONSHIP OF PROGRAM TO OTHER
MANAGEMENT OBJECTIVES
3.1 Describe alignment of the hatchery program with any ESU-wide hatchery plan (e.g. Hood Canal Summer Chum Conservation Initiative) or other regionally accepted policies (e.g. the NPPC Annual Production Review Report and Recommendations - NPPC document 99-15). Explain any proposed deviations from the plan or policies. This HGMP is a component of the co-managers comprehensive resource management plan for Puget Sound coho.

Marblemount Coho Program HGMP 15
3.2 List all existing cooperative agreements, memoranda of understanding, memoranda of agreement, or other management plans or court orders under which program operates. This hatchery program, and all other WDFW anadromous salmon hatchery programs, operates under U.S. v Washington and the Puget Sound Salmon Management Plan (PSSMP 1985). These provide the legal framework for coordinating hatchery programs, defining artificial production objectives, and maintaining treaty-fishing rights. Hatchery salmon and steelhead production are negotiated annually through various contracts between WDFW and Co-managers. Hatchery salmon and steelhead production levels are detailed in the annual Future Brood Document (FBD). The FBD is a pre-season planning document for fish hatchery production in Washington State for the upcoming brood stock collection and fish rearing season (July 1 - June 30). The FBD is coordinated between WDFW, the Northwest Indian Fisheries Commission (NWIFC) representing Puget Sound and coastal treaty tribes, eastern Washington treaty tribes, and Federal fish hatcheries. Hatchery production by volunteers, schools, and Regional Fisheries Enhancement Groups (RFEGs) are represented by WDFW.
3.3 Relationship to harvest objectives. The coho program was designed to use as an indicator stock to provide information on exploitation rate as well as to monitor and evaluate migration patterns, timing and distribution that represents natural coho stock.
3.3.1 Describe fisheries benefitting from the program, and indicate harvest levels and rates for program-origin fish for the last twelve years (1988-99), if available.
Table 3.3.1.1: Marblemount Hatchery Coho Fishery Contributions Brood Years: 2000-2009 Fishery Years: 2003-2012
Average SAR%a 5.64 Agency Non-WA Fishery % of total Survival
ADFG All 0.01 CDFO All 3.13 ODFW All 1.07
Agency WA Fishery % of total Survival WDFW 10- Ocean Troll 0.34 MAKA 15- Treaty Troll 0.17 WDFW 15- Treaty Troll 0.72 WDFW 22- Coastal Gillnet 0.01 MAKA 23- PS Net 0.01 SSC 23- PS Net 0.93 TULA 23- PS Net 0.51 WDFW 23- PS Net 23.78 WDFW 41- Ocean Sport- Charter 1.54 WDFW 42- Ocean Sport- Private 4.24 WDFW 45- PS Sport 12.62 WDFW 46- Freshwater Sportb 5.39 UW 50- Hatchery Escapementc 0.00 WDFW 50- Hatchery Escapement 45.50 WDFW 50- Hatchery Escapement (Strays)c 0.01 WDFW 62- Test Fishery Seine 0.02
Total 100.00 Source: RMIS 2014 a Average SAR% = (tags recovered/tags released) b Freshwater Sport based on WDFW Catch Record Card (CRC) data. c Strays to North Toutle, Portage Bay, Soos Creek and Wallace River Hatcheries.

Marblemount Coho Program HGMP 16
3.4 Relationship to habitat protection and recovery strategies.
Habitat protection and restoration strategies are paramount to the self-sustaining, natural populations. Habitat protection and recovery strategies are addressed in documents developed for the Puget Sound area and individual watersheds. Different groups are involved in planning, funding and realizing restoration projects through the region as listed below. Puget Sound Salmon Recovery Plan (2005): Describes habitat related challenges (http://www.govlink.org/watersheds/9/plan-implementation/HabitatPlan.aspx). Based on this recovery plan, a number of habitat actions have been implemented, with additional improvements identified to be considered in the future. Puget Sound Partnership Action Plan: An ESU-wide recovery planning effort is being undertaken by the Puget Sound Partnership, a collaborative group dedicated to restoring salmon and steelhead throughout Puget Sound (online at: http://www.pugetsoundpartnership.org). State of Our Watershed: Individual member Tribes have worked with the NWIFC and SSHIAP to create the State of Our Watersheds report. This document examines key indicators of habitat quality and quantity across more than 20 watersheds in western Washington that lie within tribal Usual and Accustomed fishing areas as defined by U.S. v Washington (1974 Boldt Decision). Salmon Recovery Funding Board (SRFB). Created by the Legislature in 1999, the SRFB is composed of five citizens appointed by the Governor and five state agency directors, the Board provides grant funds to protect or restore salmon habitat and assist related activities. It works closely with local watershed groups known as lead entities (see below). The Board supports salmon recovery by funding habitat protection and restoration projects, and related programs and activities that produce sustainable and measurable benefits for fish and their habitat. Lead Entities - The Skagit Watershed Council is the Lead Entity for the Skagit basin that includes the lower and upper Skagit River (WRIAs 3 & 4). The Skagit basin is the largest watershed in Puget Sound. The land use in the lower portion is 64% forestry, 22% agriculture, 5% urban, 4% range and 5% other. In the uplands, land use is 73% forestry, 12% range and 15% other (see also: http://www.rco.wa.gov/salmon_recovery/lead_entities.shtml) Regional Fisheries Enhancement Groups (RFEGs). Several citizen-based groups work in conjunction with local governments on habitat actions that benefit both listed and non-listed stocks in the system. In the Skagit River system, this includes the Skagit Fisheries Enhancement Group. Puget Sound Partnership Action Plan: An ESU-wide recovery planning effort is being undertaken by the Puget Sound Partnership, a collaborative group dedicated to restoring salmon and steelhead throughout Puget Sound (online at http://www.pugetsoundpartnership.org).
3.5 Ecological interactions. (1) Salmonid and non-salmonid fishes or other species that could negatively impact the program.
Negative impacts by fishes and other species on the Marblemount Hatchery program coho could occur directly through predation on hatchery-produced fish, or indirectly through food resource competition, genetic effects, or other ecological interactions. In particular, fishes and other species could negatively impact Marblemount Hatchery coho survival rates through predation on newly released, emigrating juvenile fish in freshwater, estuarine and marine areas. Certain avian and mammalian species may also prey on juvenile salmonids while the fish are rearing at the hatchery site, if these species are not excluded from the rearing areas. Species that could potentially negatively impact hatchery juveniles through predation include the following:
- Avian predators, including mergansers, cormorants, belted kingfishers, great blue herons, and night herons

Marblemount Coho Program HGMP 17
- Mammalian predators, including mink, river otters, harbor seals, and sea lions - Cutthroat trout
Rearing and migrating juveniles and adults originating from the program may also serve as prey for large, mammalian predators in nearshore marine areas, the estuary and in freshwater areas downstream of the hatchery in the Skagit River watershed to the detriment of population abundance and the program's success in augmenting harvest. Species that may negatively impact program fish through predation may include:
- Orcas - Sea lions - Harbor seals - River otters
(2) Salmonid and non-salmonid fishes or other species that could be negatively impacted by the program (focus is on listed and candidate salmonid species).
- Puget Sound Chinook - Puget Sound steelhead - Puget Sound bull trout
ESA-listed Chinook, steelhead and bull trout from the Skagit River system populations may be adversely affected by hatchery-origin salmonids produced by the Marblemount Hatchery program. Juvenile fish of these listed species may serve as prey for newly released hatchery salmon in areas where the species co-occur if the listed juvenile fish are of a small size, and vulnerable to predation by out-migrating coho. The hatchery fish may also affect the listed species through competition for any limited resources, including food and space for juvenile fish, and spawning areas for adult fish.
(3) Salmonid and non-salmonid fishes or other species that could positively impact the program. Fish species that could positively impact the program may include other salmonid species and trout present in the Skagit River watershed through natural and hatchery production. Juvenile fish of these species may serve as prey items for hatchery-origin coho during their downstream migration in freshwater and into the marine area. Decaying carcasses of spawned adult fish may contribute nutrients that increase productivity in the watershed, providing food resources for emigrating salmon. Salmonid adults that return to the Skagit Basin and any seeding efforts using adult salmon carcasses may provide a source of nutrients and stimulate stream productivity. Many watersheds in the Pacific Northwest appear to be nutrient-limited (Gregory et al. 1987; Kline et al. 1997) and salmonid carcasses can be an important source of marine derived nutrients (Levy 1997). Carcasses from returning adult salmon have been found to elevate stream productivity through several pathways, including: 1) stimulation of primary productivity through the release of nutrients from decaying carcasses (Wipfli et al. 1998); 2) enrichment of the aquatic invertebrates food base from decaying carcasses (Mathisen et al. 1988); and 3) direct consumption of carcasses by juvenile salmonids (Bilby et al. 1996). The addition of nutrients has been observed to increase the production of salmonids (Slaney and Ward 1993; Slaney et al. 2003; Ward et al. 2003).
(4) Salmonid and non-salmonid fishes or other species that could be positively impacted by the program. The coho program could positively impact freshwater and marine fish species that prey on juvenile fish. Nutrients provided by decaying coho carcasses may also benefit fish in freshwater. These species include:
- Northern pikeminnow - Cutthroat trout - Steelhead - Bull trout - Pacific staghorn sculpin - Numerous marine pelagic fish species

Marblemount Coho Program HGMP 18
4 SECTION 4. WATER SOURCE
4.1 Provide a quantitative and narrative description of the water source (spring, well, surface), water quality profile, and natural limitations to production attributable to the water source. Table 4.1.1: Water sources available at Marblemount Hatchery.
Water Source Water Right Available Water Flow
Water Temp. (Fº) Usage Limitations Record/Cert. No. Permit No.
Wells (5) G1-23230C WRIS ----- 10 cfs 46 Incubation, rearing
Wells are sanding in and needs to be redeveloped
Clark Creek (surface)
S1-*06773C WRIS/ 03506
06152 10 cfs 40-45 Broodstock collection rearing, acclimation
Low flow in summer
S1-*21701C WRIS/ 10939
15832 5 cfs
S1-20241C WRIS ---- 10 cfs
Cascade River (surface)
S1-00419C WRIS 16698 30 cfs 38-58 Rearing, No limitations
Jordan Creek (surface)
S1-*06774C WRIS/ 03507
06153 15 cfs 38-65 Rearing High winter flows and high summer temperatures
Source: Phinney 2006, WDOE Water Resources Explorer 2014, WDFW hatchery data. Water to the hatchery is supplied from five wells, gravity flow from Jordan Creek, and pumped water from Clark Creek and Cascade River (Fuss and Ashbrook, 1995). Wells supply hatchery with stable temperature, pathogen free water that is used for incubation and rearing. Spring-fed Clark Creek provides stable flow of water used for broodstock collection (fish attraction) and holding, and juveniles rearing and acclimation. The Cascade River is the most utilized water source and is used for rearing; however, heavy bed loads movement in the river cause channel shifts and increased silt loads (Fuss and Ashbrook, 1995), resulting in necessity to use settling pond before water is pumped to the hatchery. Gravity-fed water from Jordan Creek is also used for rearing. The utilization of this water source however is limited by creeks high water temperatures in summer and high flows in winter. Also land management practices in the area have exacerbated an on-going-problem with historically unstable watershed conditions; transportation of huge rocks during high flow events that pose a large threat of damaging capital structures at the hatchery (Fuss and Ashbrook 1995). The water right permits at the Marblemount Hatchery are formalized through the Washington Department of Ecology (WDOE), and were obtained for Clark Creek in 1945, 1969 and 1972; for Jordan Creek in 1945; for the Cascade River in 1971; and for the wells in 1978. NPDES Permit: This facility operates under the “Upland Fin-Fish Hatching and Rearing” National Pollution Discharge Elimination System (NPDES) general permit which conducts effluent monitoring and reporting and operates within the limitations established in its permit administered by the Washington Department of Ecology (DOE), WAG 13-1015. Monthly and annual reports on water quality sampling, use of chemicals at this facility, compliance records are available from DOE. Discharges from the cleaning treatment system are monitored as follows:
• Total Suspended Solids (TSS) 1 to 2 times per month on composite effluent, maximum effluent and influent samples.
• Settleable Solids (SS) 1 to 2 times per week on effluent and influent samples. • In-hatchery Water Temperature - daily maximum and minimum readings.

Marblemount Coho Program HGMP 19
No listed fish are passed above Clark Creek. Jordan Creek is utilized only from April through November.
Table 4.1.2: Record of NPDES permit compliance at Marblemount Hatchery. Facility/ Permit #
Reports Submitted Y/N Last Inspection
Date
Violations Last 5 yrs
(see Table 4.1.3)
Corrective Actions
Y/N
Meets Compliance
Y/N Monthly Qtrly Annual
Marblemount WAG13-1015
Y Y Y 5/23/2005 1 N Y
Source: Ann West, WDFW Hatcheries Headquarters Database 2014. Table 4.1.3: List of NPDES violations at Marblemount Hatchery, over the last five years (2009-2013).
Monitoring Month Parameter Sample
Type Result/
Violation Permit Limit Comment Action
September 2011
N/A N/A N/A DMR due to Ecology by July 30, 2010
Late DMR to Ecology
Explanation to personnel to correct procedures
Source: Ann West, WDFW Hatcheries Headquarters Database 2014. Note: These violations did not result in non-compliance with NPDES permit.
4.2 Indicate risk aversion measures that will be applied to minimize the likelihood for the take of listed natural fish as a result of hatchery water withdrawal, screening, or effluent discharge. The surface water intakes at Marblemount Hatchery are in compliance with state and federal guidelines (NMFS 1995, 1996), but do not meet current Anadromous Salmonid Passage Facility Design criteria (NMFS 2011a). Improvements have been identified as a high-priority project and are on the WDFW’s 20-year Capital Plan to bring into compliance. The 2012 Legislature passed the “Jobs Now” bill, which provided WDFW with funding for hatchery capital improvements in addition to our Capital Budget request (see Table 5.8.1). This included bringing the intake into compliance and improvements to the Jordan Creek water supply line. The pipeline project was completed in 2013. The new intake project is currently in the conceptual designed phase.
5 SECTION 5. FACILITIES
5.1 Broodstock collection facilities (or methods). The facility has one trap located on Clark Creek and typically operated from May 1 (May 15 at the latest) through mid-March (or later if necessary and possible) to accommodate Chinook, coho and steelhead broodstock collection and removal of hatchery-origin fish from the system. During that time, a weir spanned across the creek blocks passage and directs fish through a four-step ladder and the “V”-trap into the separated 200'x10'x48'' section of the adult pond supplied with Clark Creek water.
5.2 Fish transportation equipment (description of pen, tank truck, or container used). Two tanker trucks (1,000- and 300-gallons), equipped with aerators and oxygen tanks, are available at the facility for transportation needs.
5.3 Broodstock holding and spawning facilities. Table 5.3.1: Adult holding facilities at Marblemount Hatchery.
Type Number Size (ft) Adult pond (Pond-22) 1 200x10x4 Concrete raceways 3 100x10x3

Marblemount Coho Program HGMP 20
Depending on the species, broodstock could be held in either the 10'x100'x36'' (3000 cu-ft) concrete ponds or a separated section of the adult pond. Coho broodstock is held in a separated section of the adult pond supplied with Clark Creek water. Spawning takes place at the side of the pond.
5.4 Incubation facilities. Table 5.4.1: Incubation vessels available at Marblemount Hatchery.
Type Number Size Vertical stack incubators 1,056 Trays 24''x25''x3'' Removable Shallow troughs 8 16'x11''x6''
5.5 Rearing facilities.
Table 5.5.1: Rearing ponds available at Marblemount Hatchery. Type Number Dimensions
Indoor Fiberglass Starter Tanks 16 16'x3'x28'' Gravel bottom pond 1 273'x53'x36'' Asphalt bottom adult pond 1 249'x89'x48'' Asphalt bottom pond 4 37'x350'x54'' Concrete ponds 21 10'x100'x36''
5.6 Acclimation/release facilities.
All fish are primarily reared on mix of well/surface water (a mix of Jordan/Clark/Cascade creeks), and exclusively on Clark Creek water for the last three weeks before release. Fish are released directly into Clark Creek, ten feet above the confluence with Cascade River.
5.7 Describe operational difficulties or disasters that led to significant fish mortality. No operational difficulties have led to significant coho loss.
5.8 Indicate available back-up systems, and risk aversion measures that will be applied, that minimize the likelihood for the take of listed natural fish that may result from equipment failure, water loss, flooding, disease transmission, or other events that could lead to injury or mortality. The following risk aversion measures are in place at Marblemount Hatchery:
• A crew member is on stand-by at the facility at all times to monitor hatchery operations and respond to any unexpected events.
• The facility is equipped with low water alarms, a back-up generator in case of power loss, and gas powered pumps in case of pump failure.
• Fish rearing is conducted in compliance with the Salmonid Disease Control Policy of the Fisheries Co-Managers of Washington State (1998, updated 2006). Adherence to artificial propagation, sanitation and disease control practices defined in the policy should reduce the risk of fish disease pathogen transfers.
The 2012 Legislature passed a jobs creation bill, which provided WDFW with funding for hatchery capital improvements in addition to our Capital Budget request. At Marblemount Hatchery, this allowed the following improvements:

Marblemount Coho Program HGMP 21
Table 5.8.1: Hatcheries capital improvement projects, funded under the “Jobs Now Act” (2012).
Projects Completion Date Replace or renovate Jordan Creek intake to meet current fish passage and screening requirements.
Estimated 2017-2019*
Replace Jordan Creek pipeline Completed fall 2013 Bring water intakes to compliance with current Anadromous Salmonid Passage Facility Design criteria (NMFS 2011).
Estimated 2017-2019*
* Estimated completion dates due to acquiring legislative funding. 6 SECTION 6. BROODSTOCK ORIGIN AND IDENTITY Describe the origin and identity of broodstock used in the program, its ESA-listing status, annual collection goals, and relationship to wild fish of the same species/population.
6.1 Source. Hatchery broodstock is collected from adult coho returning to Marblemount Hatchery trap. Puget Sound coho are not ESA-listed.
6.2 Supporting information. 6.2.1 History. The Marblemount Hatchery coho program began in 1946, with wild broodstock collected from the Skagit and Cascade Rivers. Shortly after inception, the production was maintained as a segregated program using adult returns to Marblemount Hatchery. Accepting the HSRG recommendation (2004), the production was converted from segregated to an integrated program, and has been maintained as such since brood year 2005. 6.2.2 Annual size. Up to 300 adults collected annually.
6.2.3 Past and proposed level of natural fish in broodstock. Levels of natural-origin fish included in the broodstock are unknown prior to the start of 100% mass-marking of released fish. Coho released through the Marblemount Hatchery program has been consistently marked since the 1998 releases (1996 brood) allowing for fish identification; however, the program was managed as segregated until 2004, and no natural-origin fish were intentionally included in the broodstock. In 2005, the co-managers agreed to accept the HSRG recommendation to manage this production as an integrated program and incorporate unmarked/untagged natural-origin volunteers into the hatchery broodstock.
6.2.4 Genetic or ecological differences. Allozyme analyses on coho collected in the late-1980s and early-1990s show that significant genetic differences exist within the basin, indicating that multiple coho stocks are present in the Skagit basin (David Teel, NMFS, personal communication). All Skagit basin coho collections show similarities to one another, and are quite different from South Puget Sound, Strait of Juan de Fuca and Columbia River coho (David Teel, NMFS, personal communication), (SaSI, 2002).
6.2.5 Reasons for choosing. The stock was chosen based on its indigenous origin.
6.3 Indicate risk aversion measures that will be applied to minimize the likelihood for adverse genetic or ecological effects to listed natural fish that may occur as a result of broodstock selection practices. No listed fish are selected for broodstock through this program. Puget Sound coho are not ESA-listed. Broodstock is selected randomly from all adult returns to the Marblemount Hatchery trap.

Marblemount Coho Program HGMP 22
This production is managed as an integrated program, and natural-origin coho are included in the broodstock in order of keeping the hatchery and naturally-spawning fish genetically similar and reducing the risk of divergence of these populations.
7 SECTION 7. BROODSTOCK COLLECTION
7.1 Life-history stage to be collected (adults, eggs, or juveniles). Adults.
7.2 Collection or sampling design. Coho broodstock is randomly selected from volunteers returning to the hatchery trap throughout the entire run time, typically September through mid-January. The trap is usually operated from May 1 (May 15 at the latest) through mid-March (or later if necessary and possible) to accommodate Chinook, coho and steelhead broodstock collection and removal of hatchery-origin fish from the system.
7.3 Identity. All fish released through this hatchery program have been consistently marked since the 1998 release (1996 brood). Coho are currently marked with adipose fin-clip only (64%), CWT-only (18%), and adipose fin-clip and CWT (18%), (see also HGMP section 10.7).
7.4 Proposed number to be collected: 7.4.1 Program goal (assuming 1:1 sex ratio for adults): Up to 300 adults collected annually.
7.4.2 Broodstock collection levels for the last twelve years (e.g. 1988-99), or for most recent years available:
Table 7.4.2.1: Fish origin and sex composition of broodstock spawned, Marblemount Hatchery coho program.
Brood Year
Hatchery Unknown Natural Male Female Jack Male Female Jack Male Female Jack
2000 370 367 0 11 10 0 2 1 0 2001 392 395 0 2002 265 267 0 2003 222 227 0 1 3 0 2 0 0 2004 183 183 0 2005 271 269 0 2 3 0 9 12 0 2006 164 168 0 1 2 0 10 5 0 2007 98 121 3 81 61 0 2008 153 170 2 36 21 0 2009 223 234 0 1 1 0 53 43 0 2010 214 227 4 1 2 0 59 45 1 2011 97 183 0 103 17 0 2012 160 179 0 47 26 0 2013 129 141 2 56 42 0
Avg. 221 234 1 4 4 0 32 27 0 Source: WDFW Hatcheries Headquarters Database 2014.
7.5 Disposition of hatchery-origin fish collected in surplus of broodstock needs. Fish collected above broodstock needs (surplus) can be donated to the local Tribes or local food bank, and/or used for nutrient enhancement. Surplus fish in good condition also may be sold to food processor.

Marblemount Coho Program HGMP 23
7.6 Fish transportation and holding methods. Coho collected for broodstock are held in a separated section of the holding pond supplied with well water, and are spawned at the end of the raceway. Unmarked coho collected in excess of broodstock needs are transported (via tanker truck and released into Cascade River above the hatchery intake.
7.7 Describe fish health maintenance and sanitation procedures applied. Standard fish health protocols, as defined in the Salmonid Disease Control Policy of the Fisheries Co-managers of Washington State (WDFW and WWTIT 1998, updated 2006) are adhered to. No antibiotics or formalin treatment is applied to coho.
7.8 Disposition of carcasses. Food-grade carcasses may be distributed to approved charitable organizations. Nonfood-grade carcasses are used in local streams for nutrient enhancement if approved by the Fish Health Specialist.
7.9 Indicate risk aversion measures that will be applied to minimize the likelihood for adverse genetic or ecological effects to listed natural fish resulting from the broodstock collection program. No listed fish are collected for broodstock through this program. Puget Sound coho are not ESA-listed. However, any fish during broodstock collecting can enter hatchery trap including unmarked and untagged fish. If it happens, any unmarked Chinook are return to the Cascade River that is not blocked by weir and allows unobstructed fish movement. Unmarked steelhead has not been encountered at the hatchery trap for past twelve years. Trapping methods do not generally pose lethal risks to the fish health.
8 SECTION 8. MATING Describe fish mating procedures that will be used, including those applied to meet performance indicators identified previously.
8.1 Selection method. Broodstock is selected randomly from ripe fish across the entire maturation time frame. Spawning takes place once a week.
8.2 Males. All males collected, regardless of size, are considered for spawning and selected randomly on spawn days.
8.3 Fertilization. Eggs from five females are pooled into one bucket; milt from each male is collected separately. Eggs from one bucket are then equally spread into five buckets and each bucket is fertilized with milt from one male, using a total of five males. After 60 seconds of fertilization time, eggs are combined into one bucket and moved to the incubation room.
8.4 Cryopreserved gametes. Cryopreserved gametes are not used.
8.5 Indicate risk aversion measures that will be applied to minimize the likelihood for adverse genetic or ecological effects to listed natural fish resulting from the mating scheme. Listed fish are not included in mating scheme through this program.

Marblemount Coho Program HGMP 24
9 SECTION 9. INCUBATION AND REARING - Specify any management goals (e.g. “egg to smolt survival”) that the hatchery is currently operating under for the hatchery stock in the appropriate sections below. Provide data on the success of meeting the desired hatchery goals. 9.1 Incubation:
The current egg-take goal for the on-station coho hatchery program and co-op needs is to collect up to 335,000 eggs (FBD 2014).
9.1.1 Number of eggs taken and survival rates to eye-up and/or ponding. Table 9.1.1.1: Survival rates from egg-take to ponding, Marblemount Hatchery coho, 2002-2013.
Brood Year Eggs Collected Green-to-Eye Up Eye-Up-to-Ponding 2002 512,820 91.0 98.0 2003 534,700 95.4 98.0 2004 537,500 96.6 98.0 2005 631,000 96.8 98.0 2006 491,200 95.5 98.0 2007 462,400 90.6 98.0 2008 471,000 92.5 98.0 2009 475,800 94.8 98.0 2010 589,000 96.1 98.0 2011 599,700 96.5 98.0 2012 479,000 94.6 98.0 2013 461,300 97.2 98.0
Average 520,452 94.6 98.0 Source: WDFW Hatchery Records 2014. 9.1.2 Cause for, and disposition of surplus egg takes. This production is managed as an integrated program, with a goal to incorporate natural-origin fish to the broodstock. In some years collected hatchery-origin eggs can be replaced with natural-origin eggs when they become available. Also hatchery-origin eggs collected at the beginning of the season may be replaced with eggs from late-arriving fish to represent the entire run. Culled eggs are buried on-station.
9.1.3 Loading densities applied during incubation. Fertilized eggs are placed in vertical incubators at around 8,000 per tray.
9.1.4 Incubation conditions. All eggs are incubated in trays supplied with well water at a flow rate of at 3.5 gpm. Average water temperature is a constant 46°F. Dissolved oxygen levels remain constant at 12 mg/l in water flowing in and 9.5 mg/l in water flowing out. Vexar® layers are placed in trays as a substrate substitute. If requested and collected, up to 145,000 eyed-eggs are transferred in January to Glenwood Springs Hatchery. Transportation to Glenwood Springs Hatchery may take up to four hours. In February, eyed-eggs are provided to schools and co-operative enhancement groups (see Table 1.11.2.2). Eyed-eggs are transported in buckets placed in coolers that are filled with ice and covered with burlap. Eggs destined for these programs are selected from hatchery x hatchery (HxH) crosses.

Marblemount Coho Program HGMP 25
9.1.5 Ponding. When approximately 95%+ buttoned up (February), fish are moved from trays into 10'x100'x36'' concrete raceways supplied with a mixture of water from Jordan/Clark/Cascade creeks.
9.1.6 Fish health maintenance and monitoring. All fertilized eggs are water-hardened in an iodophor solution. Fungus in incubators is controlled by formalin drip (15-minute injection per day at a target dose of 1,667-ppm formalin) throughout incubation to just prior to hatch. Dead eggs are removed after eyed-eggs are shocked. Fry loss is picked at the time of ponding, and then daily.
9.1.7 Indicate risk aversion measures that will be applied to minimize the likelihood for adverse genetic and ecological effects to listed fish during incubation.
No listed fish are incubated through this program. Coho and listed Chinook incubation time partially overlap, but eggs are incubated separately.
9.2 Rearing: 9.2.1 Provide survival rate data (average program performance) by hatchery life
stage (fry to subyearling; subyearling to smolt) for the most recent twelve years (1988-99), or for years dependable data are available.
Table 9.2.1.1: Survival rates from fry to release, Marblemount Hatchery coho, 2000-2011. Brood Year Fry-to-Sub-yearling Sub-yearling-to-Smolt
2002 94.4 93.9 2003 95.9 98.4 2004 93.6 96.7 2005 95.2 97.3 2006 96.1 94.9 2007 90.6 97.9 2008 96.9 92.8 2009 97.9 94.8 2010 96.3 93.7 2011 98.6 94.5 2012 96.4 93.3 2013 90.8 Not yet available
Average 95.2 95.3 Source: WDFW Hatchery Records 2014. 9.2.2 Density and loading criteria (goals and actual levels).
Loading and density levels at WDFW hatcheries conform to standards and guidelines set forth in Fish Hatchery Management (Piper et. al. 1982) and Salmonid Disease Control Policy of the Fisheries Co-managers of Washington State (WDFW and WWTIT 1998, updated 2006), INAD, MDFWP) (WDFW and WWTIT 1998, updated 2006). Fish rearing densities are maintained at maximum less than 3-lbs of fish/gpm at release and under 0.35-lbs/ft3.
9.2.3 Fish rearing conditions Fish are initially reared in concrete raceways. Marking takes place in June, when fish are around 160 fpp. In September, at around 20 fpp, fish are moved to the 37'x350'x54'' asphalt bottom pond, where they stay till May release. Rearing raceways and pond are supplied with Jordan/Clark/Cascade water mix.

Marblemount Coho Program HGMP 26
Table 9.2.3.1: Monthly average surface water temperatures (°F) at Clark and Jordan creeks, and Cascade River
Month Average Water Temperature (ºF)
Clark Creek Jordan Creek Cascade River January 45 33 40 February 45 34 38 March 46 40 48 April 47 45 48 May 47 48 50 June 48 50 50 July 48 55 50 August 49 60 52 September 50 55 52 October 48 50 50 November 47 46 50 December 46 36 45
Source: WDFW Hatchery Records 2012. 9.2.4 Indicate biweekly or monthly fish growth information (average program
performance), including length, weight, and condition factor data collected during rearing, if available.
Table 9.2.4.1: Average size (fpp), by month, of juvenile coho reared at Marblemount Hatchery.
Month Average Size (fpp) March 2,400 April 1,100 May 500 June 330 July 150 August 100 September 60 October 43 November 40 December 30 January 28 February 25 March 20 April 18 May 17
Source: WDFW Hatchery Records, 2012.
9.2.5 Indicate monthly fish growth rate and energy reserve data (average program performance), if available.
See Table 9.2.4 for growth information. No energy reserve data is available.

Marblemount Coho Program HGMP 27
9.2.6 Indicate food type used, daily application schedule, feeding rate range (e.g. % B.W./day and lbs/gpm inflow), and estimates of total food conversion efficiency during rearing (average program performance).
Coho are fed a variety of diet formulations including crumbles and pellets; the food brand used may vary, depending on cost and vendor contracts Feeding frequencies vary depending on fish size and water temperature, and usually begins at eight feedings/7 days/week, and end at two feedings/ five days/week. Feeding rates vary from 2.0% to 3.5% body weight/day. The overall feed conversion rate (feed fed/weight gained) for the season is approximately 1.2:1.
9.2.7 Fish health monitoring, disease treatment, and sanitation procedures. Fish health is monitored on a daily basis by hatchery staff and at least monthly by a WDFW Fish Health Specialist. Hatchery personnel carry out treatments prescribed by the Fish Health Specialist. Procedures are consistent with the Salmonid Disease Control Policy of the Fisheries Co-Managers of Washington State (WDFW and WWTIT 1998, updated 2006). See also HGMP section 10.9 for WDFW Standard Fish Health Procedures.
9.2.8) Smolt development indices (e.g. gill ATPase activity), if applicable. The migratory state of the release population is determined by fish behavior. Aggressive screen and intake crowding, leaner condition factors, a more silvery physical appearance and loose scales during feeding events are signs of smolt development. ATPase activity is not measured.
9.2.8 Indicate the use of "natural" rearing methods as applied in the program. No "NATURES" type rearing methods are applied through the program.
9.2.9 Indicate risk aversion measures that will be applied to minimize the likelihood for adverse genetic and ecological effects to listed fish under propagation.
No listed fish are propagated through this program; however, all reasonable and prudent measures are employed to minimize rearing and incubation losses. These include the use of high quality spring or well water for incubation, high-quality feeds for rearing, rearing densities and loadings that conform to best management practices, frequent fish health inspections and the presence of professionally trained personnel to operate the facilities. Hatcheries are designed to provide safe and secure rearing environment through the use of alarm systems, backup generators, and water re-use pumping systems to prevent catastrophic fish losses. Coho are reared separately from Chinook. However, while coho may have a risk of carrying fish disease pathogens because of higher rearing densities in the hatchery than in the natural rearing environment, this program is relatively small in size, and therefore crowding is not an issue.
10 SECTION 10. RELEASE Describe fish release levels, and release practices applied through the hatchery program.
10.1 Proposed fish release levels. Table 10.1.1. Proposed number, size, date of release, and location of program releases.
Age Class Maximum No. Size (fpp) Release Date Location Yearling 250,000 17 May Skagit River
Source: Future Brood Document 2014

Marblemount Coho Program HGMP 28
10.2 Specific location(s) of proposed release(s). Stream, river, or watercourse: Cascade River ( WRIA 03.1411) Release point: Cascade River at RM 1.0 Major watershed: Skagit River Basin or Region: Puget Sound
10.3 Actual numbers and sizes of fish released by age class through the program. Table 10.3.1. Number, size and dates of release, by year, 2003-2014.
Release Year
Indian Slough/Telegraph Slough* Cascade River
Yearling Avg. size (fpp) CV Date(s) Yearling Avg. size
(fpp) CV Date(s)
2003 105,000 24 6.0 2/17-18 265,584 16 5.4 5/29-30
2004 31,000 24 NA 2/12 254,393 18 5.6 6/1-7
2005 106,000 24 5.4 2/16-17 252,000 24 5.4 6/7
2006 100,000 24 5.8 2/27-28 257,500 17 9.0 5/19-22
2007 100,000 25 5.8 2/5-7 259,770 16 5.3 6/1-4
2008 102,000 25 8.2 2/18-25 255,199 17 5.2 5/16
2009 98,900 25 7.2 2/16-26 251,748 17 3.6 6/23-29
2010 100,000 24 8.5 2/11-26 252,500 16 5.3 5/13-18
2011 101,500 25 4.6 3/15 260,500 17 4.1 5/18-25
2012 105,000 25 4.6 2/2-10 264,500 17 5.3 5/1-15
2013 Discontinued
257,000 16 4.3 5/15
2014 252,000 14 3.1 5/13-16
Average 94,940 25 6.2 256,891 17 5.1 Source: WDFW Hatcheries Headquarters Database 2014 Note: 15 fpp = 146 mm fl; 17 fpp = 140 mm fl; 20 fpp =133 mm fl. * Indian Slough releases (2000-2007), Telegraph Slough releases (2008-2012)
10.4 Actual dates of release and description of release protocols. Coho are volitionally-released in May. Pond screens are pulled and fish are allowed to leave the pond for about ten days, after which water is drawn down to encourage remaining fish to leave. Fish are enumerated by a Smith-Root smolt counter whenever feasible. Actual release dates are summarized in Table 10.3.1.
10.5 Fish transportation procedures, if applicable. Not applicable. With the discontinuation of Telegraph Slough releases all fish are released on-station.
10.6 Acclimation procedures (methods applied and length of time). Coho are acclimated exclusively on Clark Creek water for three weeks prior to release.
10.7 Marks applied, and proportions of the total hatchery population marked, to identify hatchery adults. All coho released through this program are intended to be mass-marked and/or coded wire tagged. For mark/tag combinations specific to this program see Table 10.7.1.

Marblemount Coho Program HGMP 29
Table 10.7.1: Marks applied and numbers of fish marked, by brood year and age. Brood Year Yearlings Marking
2014 160,000 AD only 45,000 AD+CWT 45,000 CWT only
Source: Future Brood Document 2014.
10.8 Disposition plans for fish identified at the time of release as surplus to programmed or approved levels. Egg-take is carefully managed to minimize the likelihood of collecting surplus eggs or raising surplus fry. Annual fluctuation in survival rates may result in higher-than-expected production levels. Regional staff and NOAA Fisheries will be informed and consulted if actual fish production will results in excess of 10% of the proposed level.
10.9 Fish health certification procedures applied pre-release. Standard Fish Health Procedures performed at the facility: • All fish health monitoring is conducted by a qualified WDFW fish health specialist. • Juvenile fish examinations are conducted at least monthly and more often if necessary. A
representative sample (at the discretion of the fish health specialist) of healthy and moribund fish from each lot is examined.
• Abnormal levels of fish loss are investigated if they occur. • Fish health status is determined prior to release or transfer to another facility. The exam
may occur during the regular monthly monitoring visit, i.e. within 1 month of release or transfer.
• Appropriate actions, including drug or chemical treatments are recommended as necessary. If a bacterial pathogen requires treatment with antibiotics a drug sensitivity profile is be generated when possible.
• Findings and results of fish health monitoring are recorded on a standard Fish Health reporting form and maintained in a Fish Health database.
• Fish culture practices are reviewed, as necessary, with facility personnel. Where pertinent, nutrition, water flow and chemistry, loading and density indices, handling, disinfecting procedures and treatments are discussed.
10.10 Emergency release procedures in response to flooding or water system failure. In the case of a catastrophic event, conditions critical to the fishes health would be monitored and if necessary to prevent loss, fish can be released prematurely. Hatcheries Standby Procedures (revised March 2012), a guideline developed by WDFW, includes information regarding proper actions to follow by hatchery employees in case of an emergency.
10.11 Indicate risk aversion measures that will be applied to minimize the likelihood for adverse genetic and ecological effects to listed fish resulting from fish releases. Production and release of only smolts and volitional release practices foster rapid seaward migration with minimal delays in the rivers, limiting interactions with listed species. Coho at Marblemount Hatchery are released volitionally and are closely visually monitored for smolting activities to ensure they are released fully smolted. Coefficient of variation (CV) for length at release is also monitored. An average CV value of 10.0% or less is desirable to confirm the likelihood that most fish are ready to migrate (Fuss and Ashbrook 1995). The average CV, for release years 2003-2014, was 5.1% (see Table 10.3.1) indicating fish were released in migratory stage.

Marblemount Coho Program HGMP 30
Coho are scheduled for May release at the average size of 17 fpp, which coincides with average fork length of 140mm. Assuming the “1/3 size rule” (USFWS 1994), Chinook salmon smaller than 47 mm may be susceptible to predation by the average size hatchery coho released through this program. The fork length of age 0 juvenile Chinook emigrating out of the Skagit River in late-May average around 60 mm (Seiler at all, 1999) and is larger than the predation susceptibility size thus less likely to be preyed upon by the migrating hatchery coho. The Marblemount coho yearlings are also released after 80% of the annual natural juvenile Chinook salmon have migrated past the trapping site (see HGMP section 2.2.3). For monitoring and evaluation purposes fish are released properly marked to allow identification.
11 SECTION 11. MONITORING AND EVALUATION OF
PERFORMANCE INDICATORS
11.1 Monitoring and evaluation of “Performance Indicators” presented in Section 1.10. The monitoring process is used to verify if program goals are achieved and weight the program benefits against risks posed to wild populations (see HGMP section 1.10). This coho program was designed to be used as an indicator stock with an objective to collect representative data for assessment of contributions to regional and distant (Canadian) fisheries as well as marine survival, migration patterns, timing and distribution that conclude effects on wild coho population. The goal was to be achieved by monitoring releases of 250,000 yearling coho smolts, marked with adipose fin clip and/or CWT and released annually from the Marblemount Hatchery.
11.1.1 Describe plans and methods proposed to collect data necessary to respond to each “Performance Indicator” identified for the program.
Annually a statistically significant number of coho releases from the hatchery are both marked and tagged with CWTs to allow monitoring and evaluation of juvenile out-migrants (Seiler et al., 1998-2002) and adult returns. Coho spawning ground surveys are conducted by WDFW, USIT and SSIT at 7 to 10 day intervals throughout the Skagit Basin and generally begin around the second week of October and usually end the latter half of January (lower basin tributaries end earlier). Live and dead coho counts are recorded from each survey. Due to limited personnel, carcasses are not handled or sampled. WDFW’s Wild Salmonid Production/Evaluation Unit (WSP/E) has been annually monitoring juvenile migration since the spring of 1990 when Skagit River juvenile salmon trapping project was initiated. Since then two juvenile migrant traps are operated annually in the mainstem Skagit River, 17-miles upstream of the river mouth from late-January through late-July. Collected data has been used to estimate migrant abundance, survival and diversity.
This monitoring and research will be regularly evaluated by the co-managers with the intent of adjusting as appropriate the HGMPs consistent with stock recovery and fishing objectives. Mark-Selective monitoring of recreational coho fisheries in the marine catch areas of Puget Sound: WDFW’ Puget Sound Sampling Unit (PSSU) has been implementing sampling and monitoring program to collect data needed to evaluate each mark-selective coho fishery and its impact on unmarked salmon. As per state-tribal agreement (e.g., WDFW and NWIFC 2009), WDFW have developed area-specific sampling plans consisting of several comprehensive and complementary sampling components, including dockside creel sampling, test fishing, on-water or aerial effort surveys, and angler-completed voluntary trip reports (VTRs). Annually, all commercial salmon fisheries conducted in Skagit Bay and River are sampled and monitored, and the catch is reported on Fish Receiving Tickets. Treaty, or Non-treaty. Catch from recreational fisheries are reported on Catch Record Cards (CRC), or from creel surveys.

Marblemount Coho Program HGMP 31
Skagit River test fishery: SRSC annually preform Chinook (Blake’s Drift), coho (at Blake’s Spudhouse, and the Highway 9 Bridge), and chum (Jetty and in Skagit Bay) test fisheries. Data collected during test fisheries are used to estimate run timing distribution and its wild and hatchery components, including CWT groups. CWT recoveries contribute to estimates of terminal run size, exploitation rate, and total CWT recruitment.
11.1.2 Indicate whether funding, staffing, and other support logistics are available or committed to allow implementation of the monitoring and evaluation program.
Funding and resources are currently committed to monitor and evaluate this program as detailed in the Comprehensive Coho Management Plan (PSTT and WDFW 1998).
11.2 Indicate risk aversion measures that will be applied to minimize the likelihood for adverse genetic and ecological effects to listed fish resulting from monitoring and evaluation activities. Risk aversion measures will be developed in conjunction with the monitoring and evaluation plans. Monitoring and evaluation will be undertaken, with consultation with NOAA Fisheries, in a manner that does not result in an unauthorized take of listed fish.
12 SECTION 12. RESEARCH
12.1 Objective or purpose. No current research is directly associated with the program
12.2 Cooperating and funding agencies. Not applicable.
12.3 Principle investigator or project supervisor and staff. Not applicable.
12.4 Status of stock, particularly the group affected by project, if different than the stock(s) described in Section 2. Not applicable.
12.5 Techniques: include capture methods, drugs, samples collected, tags applied. Not applicable.
12.6 Dates or time period in which research activity occurs. Not applicable.
12.7 Care and maintenance of live fish or eggs, holding duration, transport methods. Not applicable.
12.8 Expected type and effects of take and potential for injury or mortality. Not applicable.
12.9 Level of take of listed fish: number or range of fish handled, injured, or killed by sex, age, or size, if not already indicated in Section 2 and the attached “take table” (Table 1). Not applicable.

Marblemount Coho Program HGMP 32
12.10 Alternative methods to achieve project objectives. Not applicable.
12.11 List species similar or related to the threatened species; provide number and causes of mortality related to this research project. Not applicable.
12.12 Indicate risk aversion measures that will be applied to minimize the likelihood for adverse ecological effects, injury, or mortality to listed fish as a result of the proposed research activities. Not applicable.

Marblemount Coho Program HGMP 33
13 SECTION 13. ATTACHMENTS AND CITATIONS Bilby R.E., B.R. Fransen, and P.A. Bisson. 1996. Incorporation of nitrogen and carbon from spawning coho salmon into the trophic system of small streams: evidence from stable isotopes. Canadian Journal of Fisheries and Aquatic Sciences 53:164–173.
Ford M.J. (ed.). 2011. Status review update for Pacific salmon and steelhead listed under the Endangered Species Act: Pacific Northwest. U.S. Dept. Commer., NOAA Tech. Memo. NMFS-NWFSC-113, 281 p.
Fuss, H. and C. Ashbrook. 1995. Hatchery operation plan and performance summaries (HOPPS). Washington Department of Fish and Wildlife. Olympia, Washington.
Good, T.P., R.S. Waples, and P. Adams, (editors). 2005. Updated status of federally listed ESUs of West Coast salmon and steelhead. U.S. Department Commerce. NOAA Tech. Memo. NMFS-NWFSC-66.
Gregory, S.V., G.A. Lamberti, D.C. Erman, K.V. Koski, M.L. Murphy, and J.R. Sedell. 1987. Influence of forest practices on aquatic production. In E.O. Salo and T.W. Cundy (editors), Streamside management: forestry and fishery interactions. Institute of Forest Resources, University of Washington, Seattle, Washington.
Hard, J. J., J. M. Myers, E. J. Connor, R. A. Hayman, R. G. Kope, G. Lucchetti, A. R. Marshall, G. R. Pess, and B. E. Thompson. 2014. Viability criteria for steelhead within the Puget Sound Distinct Population Segment. U.S. Dep. Commer., NOAA Tech. Memo. NMFS-NWFSC-XXX, 390 p.
Hargreaves, N. B., and R.J. LeBrasseur. 1986. Size selectivity of coho (Oncorhynchus kisutch) preying on juvenile chum salmon (O. keta). Canadian Journal of Fisheries and Aquatic Sciences 43: 581-586.
Hawkins S.W. and J.M. Tipping. 1999. Predation by juvenile hatchery salmonids on wild fall Chinook salmon fry in the Lewis River, Washington. California Fish Game 85:124–129.
Kinsel, C., M. Zimmerman, L. Kishimoto, and P. Topping. 2008. 2007 Skagit River salmon production evaluation: Report to Salmon Recovery Funding Board. Washington Department of Fish and Wildlife. Olympia, Washington. 74 pp.
Kinsel, C.W., S.E. Vincent, M.S. Zimmerman, and J.H. Anderson. 2013. Abundance and age structure of Skagit River steelhead smolts: 2012 Annual Report. Washington Department of Fish and Wildlife. Olympia, Washington. 43 pp.
Kline, T.C., J.J. Goring, Q.A. Mathisen, and P.H. Poe. 1997. Recycling of elements transported upstream by runs of Pacific salmon: I _15N and _13C evidence in Sashin Creek, southeastern Alaska. Can. J. Fish. Aquatic Sci. 47: pp136-144.
Levy, S. 1997. Pacific salmon bring it all back home. BioScience 47: pp 657-660.
Mathisen, O.A., P.L. Parker, J.J. Goering, T.C. Kline, P.H. Poe, and R.S. Scalan. 1988. Recycling of marine elements transported into freshwater systems by anadromous salmon. Verh. Int. Ver. Limnol. 23: pp 2249-2258.
NMFS (National Marine Fisheries Service). 1995. Juvenile fish screen criteria for pump intakes. Available at http://www.nwr.noaa.gov/1hydrop/nmfscrit1.htm.

Marblemount Coho Program HGMP 34
NMFS (National Marine Fisheries Service). 1996. Juvenile fish screen criteria for pump intakes. Available at http://www.nwr.noaa.gov/1hydrop/pumpcrit1.htm.
NMFS (National Marine Fisheries Service). 1999. Endangered and threatened species: Threatened status for three Chinook salmon Evolutionarily Significant Units in Washington and Oregon, and Endangered status for one Chinook salmon ESU in Washington; final rule. Partial 6-month extension on final listing determinations for four Evolutionarily Significant Units of West Coast Chinook salmon; proposed rule. Federal Register 64:14308-14328.
NMFS (National Marine Fisheries Service). 2000a. A risk assessment procedure for evaluating harvest mortality of Pacific salmonids. National Marine Fisheries Service, Sustainable Fisheries Division, Northwest Region. May 30. 33pp.
NMFS (National Marine Fisheries Service). 2007. Endangered and threatened species: final listing determination for Puget Sound steelhead. Federal Register 72FR26722.
NMFS (National Marine Fisheries Service). 2011. Anadromous Salmonid Passage Facility Design. NMFS, Northwest Region, Portland, Oregon.
NMFS (National Marine Fisheries Service). 2011. Evaluation of and recommended determination on a Resource Management Plan (RMP), pursuant to the salmon and steelhead 4(d) rule: Comprehensive management plan for Puget Sound Chinook: harvest management component. U.S. Department of Commerce, NOAA. FINWRl2010/06051.
NMFS SHIEER 2004, 70 FR 37160. June 28, 2005 - Final ESA listing determinations for 16 ESUs of West Coast salmon, and final 4(d) protective regulations for threatened salmonid ESUs; NMFS 2004. Salmonid Hatchery Inventory and Effects Evaluation Report (SHIEER). An evaluation of the effects of artificial propagation on the status and likelihood of extinction of west coast salmon and steelhead under the Federal Endangered Species Act. May 28, 2004. Technical Memorandum NMFS-NWR/SWR. U.S. Department of Commerce, National Oceanic and Atmospheric Administration, National Marine Fisheries Service. Portland, Oregon. 557p.
NPPC (Northwest Power Planning Council). 2001. Performance standards and indicators for the use of artificial production for anadromous and resident fish populations in the Pacific Northwest. Portland, Oregon. 19 pp.
Phinney, D. 2006. Compendium of Water Rights documents for Hatcheries and Wildlife areas. Washington Department of Fish and Wildlife Habitat Program. Olympia, Washington.
Piper, R., I.B. McElwain, L.E. Orme, J.P. McCraren, L.G. Fowler, J.R. Leonard, A.J. Trandahl, and V. Adriance. 1982. Fish Hatchery Management. United States Dept. of Interior, Fish and Wildlife Service. Washington, D.C.
PSSTRT (Puget Sound Steelhead Technical Recovery Team). 2013a. Identifying historical populations of steelhead within the Puget Sound Distinct Population Segment. Final Review Draft. 149 p.
PSSTRT (Puget Sound Steelhead Technical Recovery Team).2013b. Viability Criteria for Puget Sound Steelhead. Final Review Draft. 373 p.
PSTT (Puget Sound Treaty Tribes) and WDFW (Washington Department of Fish and Wildlife). 1998. Comprehensive coho management plan; second interim report. Washington Department of Fish and Wildlife. Olympia, Washington. 92pp.
Puget Sound Salmon Management Plan. 1985. United States v Washington (1606 F.Supp. 1405).

Marblemount Coho Program HGMP 35
RMIS (Regional Mark Information System). 2012. Retrieved August, 2014. Available from: http://www.rmpc.org/.
Ruckelshaus, M.H., K.P. Currens, W.H. Graeber, R.R. Fuerstenberg, K. Rawson, N.J. Sands, and J.B. Scott. 2006. Independent populations of Chinook salmon in Puget Sound. United States Department of Commerce, NOAA. Technical Memo. NMFS-NWFSC-78, Seattle, Washington. 125 pp.
Seiler, D., P. Hanratty, S. Neuhauser, P. Topping, M. Ackley, and L.E. Kishimoto. 1997. Wild salmon production and survival evaluation. Annual Report. RAD 97-03. Washington Department of Fish and Wildlife, Olympia, Washington.
Seiler, D., L. Kishimoto, and S. Neuhauser. 1998. 1997 Skagit River wild 0+ Chinook production evaluation. Contract report to Seattle City Light. Washington Department of Fish and Wildlife, Olympia, Washington.
Seiler, D., L. Kishimoto, and S. Neuhauser. 1999. 1998 Skagit River wild 0+ Chinook production evaluation. Contract report to Seattle City Light. Washington Department of Fish and Wildlife, Olympia, Washington.
Seiler, D., L. Kishimoto, and S. Neuhauser. 2000. 1999 Skagit River wild 0+ Chinook production evaluation. Contract report to Seattle City Light. Washington Department of Fish and Wildlife, Olympia, Washington.
Seiler, D., G. Volkhardt, L. Kishimoto, and P. Topping. 2002. 2000 Green River juvenile salmonid production evaluation. Report FPT 02-03. Washington Department of Fish and Wildlife, Olympia, Washington.
Seiler, D., L. Kishimoto, and S. Neuhauser. 2002. 2001 Skagit River wild 0+ Chinook production evaluation. Contract report to Seattle City Light. Report FPA 02-11. Washington Department of Fish and Wildlife, Olympia, Washington.
Seiler, D., G. Volkhardt, and L. Kishimoto. 2003. Evaluation of downstream migrant salmon production in 1999 and 2000 from three Lake Washington tributaries: Cedar River, Bear Creek, and Issaquah Creek. Report FPA 02-07. Washington Department of Fish and Wildlife, Olympia, Washington.
Slaney, P.A., B.R. Ward. 1993. Experimental fertilization of nutrient deficient streams in British Columbia. In G. Schooner and S. Asselin (editors), Le developpmente du saumon Atlantique au Quebec: connaitre les regles du jeu pour reussir. Colloque international e la Federation quebecoise pour le saumon atlantique, p. 128-141. Quebec, Decembre 1992. Collection Salmo salar no1.
Slaney, P.A., B.R. Ward, and J.C. Wightman. 2003. Experimental nutrient addition to the Keogh River and application to the Salmon River in coastal British Columbia. In J.G. Stockner, (editor), Nutrients in salmonid ecosystems: sustaining production and biodiversity, p. 111-126. American Fisheries Society, Symposium 34, Bethesda, Maryland.
SSHAG (Salmon and Steelhead Hatchery Assessment Group). 2003. Hatchery broodstock summaries and assessments for chum, coho, and Chinook salmon and steelhead stocks within evolutionarily significant units listed under the Endangered Species Act. NOAA Fisheries, Northwest Fisheries Science Center, Seattle, Washington and Southwest Fisheries Science Center, La Jolla, California. 326pp.
Steward, C. and T.C. Bjornn. 1990. Supplementation of salmon and steelhead stocks with hatchery fish; a synthesis of published literature. Idaho Cooperative Fish and Wildlife Research Unit. University of Idaho. Tech. Rpt. 90-1. Moscow, Idaho.

Marblemount Coho Program HGMP 36
U.S. District Court of Western Washington. 1974. United States v Washington, 384 F, Supp. 312.
United States v. Washington, No. 9213 Phase 1 (sub no. 85-2) Order Adopting Puget Sound Management Plan, 1985.
Ward, B.R., D.J.F. McCubbing, and P.A. Slaney. 2003. Evaluation of the addition of inorganic nutrients and stream habitat structures in the Keogh River watershed for steelhead trout and coho salmon. In J.G. Stockner, (editor), Nutrients in salmonid ecosystems: sustaining production and biodiversity, p. 127-147. American Fisheries Society, Symposium 34, Bethesda, Maryland.
WDFW (Washington Department of Fish and Wildlife) and WWTIT (Western Washington Treaty Indian Tribes). 1998 (Updated 2006). Salmonid disease control policy of the fisheries Co-Managers of Washington State. Washington Department of Fish and Wildlife and Western Washington Treaty Indian Tribes, Olympia Washington.
WDFW (Washington Department of Fish and Wildlife) and PSTT (Puget Sound Treaty Tribes). 2004. Non-Chinook Resource Management Plan. Washington Department of Fish and Wildlife. Olympia, Washington.
WDFW. (Washington Department of Fish and Wildlife). 2014. Catch Record Card (CRC) database. Washington Department of Fish and Wildlife. Olympia, Washington.
WDFW (Washington Department of Fish and Wildlife). 2014. 2014 Future brood document. Washington Department of Fish and Wildlife. Olympia, Washington. Available from: http://wdfw.wa.gov/publications/01356/.
WDFW (Washington Department of Fish and Wildlife). 2014. Hatcheries Headquarters Database. Washington Department of Fish and Wildlife, Olympia, Washington.
WDFW (Washington Department of Fish and Wildlife). 2014. Salmonid stock inventory (SaSI). Fish Program, Science Division. Washington Department of Fish and Wildlife. Olympia, Washington. Available from: http://wdfw.wa.gov/conservation/fisheries/sasi/
WDOE (Washington Department of Ecology). 2014. Water Resources Explorer. Retrieved September 5, 2014, from: https://fortress.wa.gov/ecy/waterresources/map/WaterResourcesExplorer.aspx.
Wegge, T. 2009. Methods for estimating region economic impacts of Washington hatchery programs: technical memorandum. TCW Economics. Sacramento, California. 10 pp.
Wipfli, M.S., J. Hudson, and J. Caouette. 1998. Influence of salmon carcasses on stream productivity: response of biofilm and benthic macro invertebrates in southeastern Alaska, U.S.A. Can J. Fish. Aquatic Sci. 55: pp 1503-1511.

Marblemount Coho Program HGMP 37
14 SECTION 14. CERTIFICATION LANGUAGE AND SIGNATURE OF RESPONSIBLE PARTY
“I hereby certify that the information provided is complete, true and correct to the best of my knowledge and belief. I understand that the information provided in this HGMP is submitted for the purpose of receiving limits from take prohibitions specified under the Endangered Species Act of 1973 (16 U.S.C.1531-1543) and regulations promulgated thereafter for the proposed hatchery program, and that any false statement may subject me to the criminal penalties of 18 U.S.C. 1001, or penalties provided under the Endangered Species Act of 1973.” Name, Title, and Signature of Applicant: Certified by_____________________________ Date:_____________

Marblemount Coho Program HGMP 38
15 ADDENDUM A. PROGRAM EFFECTS ON OTHER (AQUATIC OR TERRESTRIAL) ESA-LISTED POPULATIONS. (Anadromous salmonid effects are addressed in Section 2)
15.1 List all ESA permits or authorizations for USFWS ESA-listed, proposed, and candidate salmonid and non-salmonid species associated with the hatchery program. The WDFW and the USFWS have a Cooperative Agreement pursuant to section 6(c) of the Endangered Species Act that covers the majority of the WDFW actions, including hatchery operations.
"The department is authorized by the USFWS for certain activities that may result in the take of bull trout, including salmon/steelhead hatchery broodstocking, hatchery monitoring and evaluation activities and conservation activities such as adult traps, juvenile monitoring, spawning ground surveys..."
15.2 Describe USFWS ESA-listed, proposed, and candidate salmonid and non-salmonid species and habitat that may be affected by hatchery program. Skagit Bull Trout (Salvelinus confluentus): Bull trout were listed as a threatened species in the Coastal-Puget Sound Distinct Population Segment on November 1, 1999 (64 FR 58910). The USFSW identified the Lower Skagit River below Diablo Dam as a core area with 19 local populations and two potential local populations (USFWS 2004). This core area supports all four life forms of bull trout: resident, fluvial, adfluvial, and anadromous. The adfluvial form is only found in the Baker River system in both Lake Shannon and Baker Lake. While spawning has been documented in the Baker River and its tributaries above Baker Lake, it is believed that bull trout in Lake Shannon originate from fish spilling over the upper Baker dam and that any natural spawning is extremely limited. Anadromous bull trout are found throughout the system and also make extensive use of the estuarine and nearshore waters foraging on juvenile salmon, smelt, sandlance and herring. Resident and fluvial forms are also found throughout the anadromous zones of the Lower Skagit core area. Primarily spawning areas are found in the upper portions of the watershed at an elevation of 1,000 to 3,000 feet. The Lower Skagit core area is thought to represent the largest population of bull trout in Washington State and the status of this stock is considered to be healthy (WDFW 2004). The recovered population level for the Lower Skagit core area has been set at 3,800.
Table 15.2.1: Summary of core area rankings for population abundance, distribution and trend.
Core Area Population
Abundance Category (individuals)
Distribution Range Rank (stream length miles)
Short-term Trend Rank
Threat Rank
Final Rank
Lower Skagit River 2,500-10,000 620-3,000 Increasing Slightly Low Risk Source: USFWS 2008. Table 15.2.2. Bull trout redd counts in the South Fork Sauk River spawning index area, and bull trout smolt counts at the lower Skagit River trap (representing entire core area), 1998 to 2009.
Year Number of Redds Smolts Captured 1998 62 358 1999 --- 199 2000 --- 246 2001 163 142 2002 318 189 2003 287 149
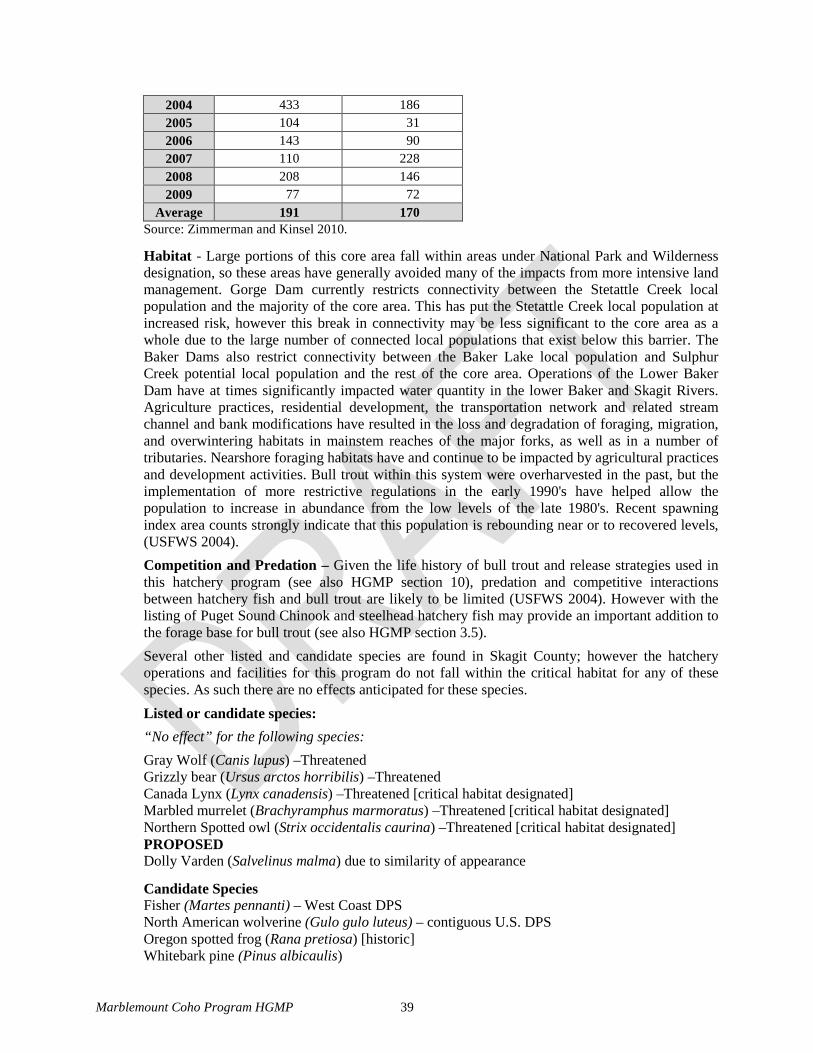
Marblemount Coho Program HGMP 39
2004 433 186 2005 104 31 2006 143 90 2007 110 228 2008 208 146 2009 77 72
Average 191 170 Source: Zimmerman and Kinsel 2010.
Habitat - Large portions of this core area fall within areas under National Park and Wilderness designation, so these areas have generally avoided many of the impacts from more intensive land management. Gorge Dam currently restricts connectivity between the Stetattle Creek local population and the majority of the core area. This has put the Stetattle Creek local population at increased risk, however this break in connectivity may be less significant to the core area as a whole due to the large number of connected local populations that exist below this barrier. The Baker Dams also restrict connectivity between the Baker Lake local population and Sulphur Creek potential local population and the rest of the core area. Operations of the Lower Baker Dam have at times significantly impacted water quantity in the lower Baker and Skagit Rivers. Agriculture practices, residential development, the transportation network and related stream channel and bank modifications have resulted in the loss and degradation of foraging, migration, and overwintering habitats in mainstem reaches of the major forks, as well as in a number of tributaries. Nearshore foraging habitats have and continue to be impacted by agricultural practices and development activities. Bull trout within this system were overharvested in the past, but the implementation of more restrictive regulations in the early 1990's have helped allow the population to increase in abundance from the low levels of the late 1980's. Recent spawning index area counts strongly indicate that this population is rebounding near or to recovered levels, (USFWS 2004). Competition and Predation – Given the life history of bull trout and release strategies used in this hatchery program (see also HGMP section 10), predation and competitive interactions between hatchery fish and bull trout are likely to be limited (USFWS 2004). However with the listing of Puget Sound Chinook and steelhead hatchery fish may provide an important addition to the forage base for bull trout (see also HGMP section 3.5). Several other listed and candidate species are found in Skagit County; however the hatchery operations and facilities for this program do not fall within the critical habitat for any of these species. As such there are no effects anticipated for these species. Listed or candidate species: “No effect” for the following species: Gray Wolf (Canis lupus) –Threatened Grizzly bear (Ursus arctos horribilis) –Threatened Canada Lynx (Lynx canadensis) –Threatened [critical habitat designated] Marbled murrelet (Brachyramphus marmoratus) –Threatened [critical habitat designated] Northern Spotted owl (Strix occidentalis caurina) –Threatened [critical habitat designated] PROPOSED Dolly Varden (Salvelinus malma) due to similarity of appearance
Candidate Species Fisher (Martes pennanti) – West Coast DPS North American wolverine (Gulo gulo luteus) – contiguous U.S. DPS Oregon spotted frog (Rana pretiosa) [historic] Whitebark pine (Pinus albicaulis)

Marblemount Coho Program HGMP 40
15.3 Analyze effects. There are no activities associated with this hatchery program that would directly impact the Skagit bull trout population. There is the possibility for indirect “take” associated with hatchery program operations—up to and including unintentional lethal take. Any observations of bull trout encountered during any hatchery activity, up to and including lethal take associated with hatchery activities, are reported annually by WDFW to USFWS under the ESA section 6 operating agreement. See section 15.1 above.
15.4 Actions taken to minimize potential effects. All adult trapping facilities are regularly checked at consistent short intervals while actively trapping. All efforts are made to minimize any holding time listed fish remain in any traps. All off-station collection activities attempt to minimize interaction with and effects to listed bull trout.
15.5 References USFWS (U.S. Fish and Wildlife Service). 2004. Draft recovery plan for the coastal-Puget Sound distinct population segment of bull trout (Salvelinus confluentus). Volume I (of II): Puget Sound management unit. Portland, Oregon. 389 + xvii pp.
USFWS (U.S. Fish and Wildlife Service). 2008. Bull trout (Salvelinus confluentus) 5-year review: Summary and evaluation. U.S. Fish and Wildlife Service. Portland, Oregon. 55 pp.
WDFW (Washington State Department of Fish and Wildlife). 2004. Washington State salmonid stock inventory bull trout/ Dolly Varden. Washington State Department of Fish and Wildlife. Olympia, Washington.
Zimmerman, M. and Kinsel, C. 2010. Migration of anadromous juvenile bull trout in the Skagit River, 1990-2009. Washington State Department of Fish and Wildlife. FPT 11-01. Olympia, Washington.

Marblemount Coho Program HGMP 41
“Take” Tables Table 1: Estimated listed salmonid take levels of by hatchery activity. Listed species affected: Chinook (Oncorhynchus tshawytscha)
ESU/Population: Puget Sound/ Lower Skagit River Chinook
Activity: Marblemount Coho Program
Location of hatchery activity: Marblemount Hatchery, RM 0.5 Cascade River (04.1411).
Dates of activity: October-June
Hatchery program operator: WDFW
Type of Take Annual Take of Listed Fish By Life Stage (Number of Fish)
Egg/Fry Juvenile/Smolt Adult Carcass
Observe or harass a) - - - -
Collect for transport b) - - - -
Capture, handle, and release c) - - 0 - Capture, handle, tag/mark/tissue sample, and release d) - - - -
Removal (e.g. broodstock) e) - - - -
Intentional lethal take f) - - - -
Unintentional lethal take g) - - - -
Other Take (specify) h) - - - - a. Contact with listed fish through stream surveys, carcass and mark recovery projects, or migrational delay at weirs. b. Take associated with weir or trapping operations where listed fish are captured and transported for release. c. Take associated with weir or trapping operations where listed fish are captured, handled and released upstream or
downstream. d. Take occurring due to tagging and/or bio-sampling of fish collected through trapping operations prior to upstream
or downstream release, or through carcass recovery programs. e. Listed fish removed from the wild and collected for use as broodstock. f. Intentional mortality of listed fish, usually as a result of spawning as broodstock. g. Unintentional mortality of listed fish, including loss of fish during transport or holding prior to spawning or prior
to release into the wild, or, for integrated programs, mortalities during incubation and rearing. h. Other takes not identified above as a category. Instructions: 1. An entry for a fish to be taken should be in the take category that describes the greatest impact. 2. Each take to be entered in the table should be in one take category only (there should not be more than one entry for the same sampling event). 3. If an individual fish is to be taken more than once on separate occasions, each take must be entered in the take table.

Marblemount Coho Program HGMP 42
Table 2. Estimated listed salmonid take levels of by hatchery activity.
Listed species affected: Steelhead (Oncorhynchus mykiss)
ESU/Population: Puget Sound/ Lower Skagit River Chinook
Activity: Marblemount Coho Program
Location of hatchery activity: Marblemount Hatchery, RM 0.5 Cascade River (04.1411)
Dates of activity: October-June
Hatchery program operator: WDFW
Type of Take Annual Take of Listed Fish By Life Stage (Number of Fish) Egg/Fry Juvenile/Smolt Adult Carcass
Observe or harass a) - - - - Collect for transport b) - - - - Capture, handle, and release c) - - 0 - Capture, handle, tag/mark/tissue sample, and release d) - - - -
Removal (e.g. broodstock) e) - - - - Intentional lethal take f) - - - - Unintentional lethal take g) - - - - Other Take (specify) h) - - - -
a. Contact with listed fish through stream surveys, carcass and mark recovery projects, or migrational delay at weirs. b. Take associated with weir or trapping operations where listed fish are captured and transported for release. c. Take associated with weir or trapping operations where listed fish are captured, handled and released upstream or
downstream. d. Take occurring due to tagging and/or bio-sampling of fish collected through trapping operations prior to upstream
or downstream release, or through carcass recovery programs. e. Listed fish removed from the wild and collected for use as broodstock. f. Intentional mortality of listed fish, usually as a result of spawning as broodstock. g. Unintentional mortality of listed fish, including loss of fish during transport or holding prior to spawning or prior
to release into the wild, or, for integrated programs, mortalities during incubation and rearing. h. Other takes not identified above as a category.