HATCHERY AND GENETIC MANAGEMENT...
58
HATCHERY AND GENETIC MANAGEMENT PLAN (HGMP) Hatchery Program: Species or Hatchery Stock: Agency/Operator: Watershed and Region: Date Submitted: Date Last Updated: Coho (Oncorhynchus kisutch) Wallace River (Skykomish) Stock Washington Department of Fish and Wildlife Skykomish River Snohomish Basin / Puget Sound May 31, 2013 Wallace River Coho Hatchery Program (Integrated)
Transcript of HATCHERY AND GENETIC MANAGEMENT...

HATCHERY AND GENETIC MANAGEMENT PLAN
(HGMP)
Hatchery Program:
Species or Hatchery Stock:
Agency/Operator:
Watershed and Region:
Date Submitted:
Date Last Updated:
Coho (Oncorhynchus kisutch) Wallace River (Skykomish) Stock
Washington Department of Fish and Wildlife
Skykomish River Snohomish Basin / Puget Sound
May 31, 2013
Wallace River Coho Hatchery Program (Integrated)

Wallace River Coho HGMP 2
SECTION 1. GENERAL PROGRAM DESCRIPTION 1.1) Name of hatchery or program.
Wallace River Coho Program
1.2) Species and population (or stock) under propagation, and ESA status. Skykomish Coho (Oncorhynchus kisutch) - not ESA listed.
1.3) Responsible organization and individuals Hatchery Operations Staff Lead Contact Name (and title): Brodie Antipa, Region 4 Hatchery Operations Manager Agency or Tribe: Washington Department of Fish and Wildlife Address: 13030 Auburn Black Diamond Rd., Auburn WA 98092 Telephone: (253) 931-3928 Fax: (253) 833-2805 Email: [email protected]
Fish Management Staff Lead Contact Name (and title): Jennifer Whitney, District Fish Biologist Agency or Tribe: Washington Department of Fish and Wildlife Address: 16018 Mill Creek Boulevard, Mill Creek WA 98012 Telephone: 425-775-1311 Ext 107 Fax: 425-338-1066 Email: [email protected]
Other agencies, Tribes, co-operators, or organizations involved, including contractors, and extent of involvement in the program: Tulalip Tribes Lead Contact Name (and title): Mike Crewson Agency or Tribe: Tulalip Tribes Address: Natural Resources 6406 Marine Drive Tulalip, WA 98271 Telephone: (360) 716-4626 Fax: (360) 716-0614 Email: [email protected]
Co-manager policies are in effect for all Puget Sound hatchery programs. The Tulalip and Stillaguamish tribes along with WDFW prepare an annual fishery management plan for the harvest of Snohomish River system fish released from hatchery programs. The legal basis for Co-management of salmon in Puget Sound is based on the Puget Sound Salmon Management Plan (PSSMP), which was developed by the Co-managers and adopted as an order of the Federal court in 1985 (United States v. Washington, No. 9213 Phase 1 (sub no. 85-2) 1985). Coho eggs collected at Wallace River Hatchery are for on-station program needs and transfer to the Bernie Kai Kai Gobin Salmon Hatchery (a Tulalip Tribes hatchery) for incubation, rearing and release each year (WDFW and Tulalip Tribes Hatchery MOU Agreements; MOU 1997, 2003, 2005, 2012), and South Sound net pens (see South Sound Net Pen Coho HGMP). Eggs are also allocated to Region 4 schools, and educational and enhancement co-operatives (Seattle Poggie Club and the Everett Steelhead and Salmon Club) (see Table 1.11.2.2).

Wallace River Hatchery Coho HGMP 3
1.4) Funding source, staffing level, and annual hatchery program operational costs. Funding Sources Operational Information (for FY 2013)* General Fund – State DJ – Federal Puget Sound Recreational Fisheries Enhancement
Full time equivalent staff – 3.48 Annual operating cost (dollars) - $466, 879
*The above information for annual operating cost applies cumulatively and cannot be broken out specifically by program.
1.5) Location(s) of hatchery and associated facilities. Wallace River Hatchery: Wallace River (WRIA 07.0940), RM 4 at the confluence with May
Creek (WRIA 07.0943); enters the Skykomish River (WRIA 07.0012) at RM 36. The Skykomish River is a tributary to the Snohomish River that drains into Puget Sound (at the juncture of Possession Sound and Port Susan between the Tulalip Indian Reservation and the city of Everett).
Sunset Falls Fishway: Upper SF Skykomish River (WRIA 07.0012), RM 51.5 (see HGMP section 6.2.3 for more details on the use of Sunset Falls).
1.6) Type of program. Integrated Harvest.
1.7) Purpose (Goal) of program. Harvest augmentation.
1.8) Justification for the program. The program mitigates for lost natural-origin fish production in the watershed by producing Skykomish population coho salmon for harvest in regional recreational fisheries, and Tulalip Tribal commercial and ceremonial and subsistence fisheries. The program helps meet tribal fishery harvest allocations that are guaranteed through treaties, as affirmed in U.S. v. Washington (1974). Program-origin salmon also help meet Pacific Salmon Treaty harvest sharing agreements with Canada. To minimize impacts on listed fish by WDFW facilities operation and the Wallace River Hatchery coho program, the following Risk Aversions are included in this HGMP: Table 1.8.1. Summary of risk aversion measures for the Wallace River Hatchery Coho program.
Potential Hazard HGMP Reference Risk Aversion Measures Water Withdrawal. 4.2 Surface water rights for Wallace River and May Creek
are formalized through permit #s S1-00109 and S1-05617, respectively. Monitoring and measurement of water usage is reported in monthly NPDES reports.
Intake Screening. 4.2 The intake screens on the Wallace River and May Creek are in compliance with State and Federal guidelines (NMFS 1995, 1996), but do not meet the current Anadromous Salmonid Passage Facility Design criteria (NMFS 2011).
Effluent Discharge. 4.2 This facility operates under the "Upland Fin-Fish Hatching and Rearing" National Pollution Discharge Elimination System administered by the Washington Department of Ecology (DOE) - WAG 13 - 3006.
Broodstock Collection & Adult Passage.
2.2.3, 5.1, 7.2 The hatchery, located at the confluence of May Creek and the Wallace River, operates two adult weirs on both systems. Due to limited habitat, Cryptobia (parasite)
Wallace River Hatchery Coho HGMP 4
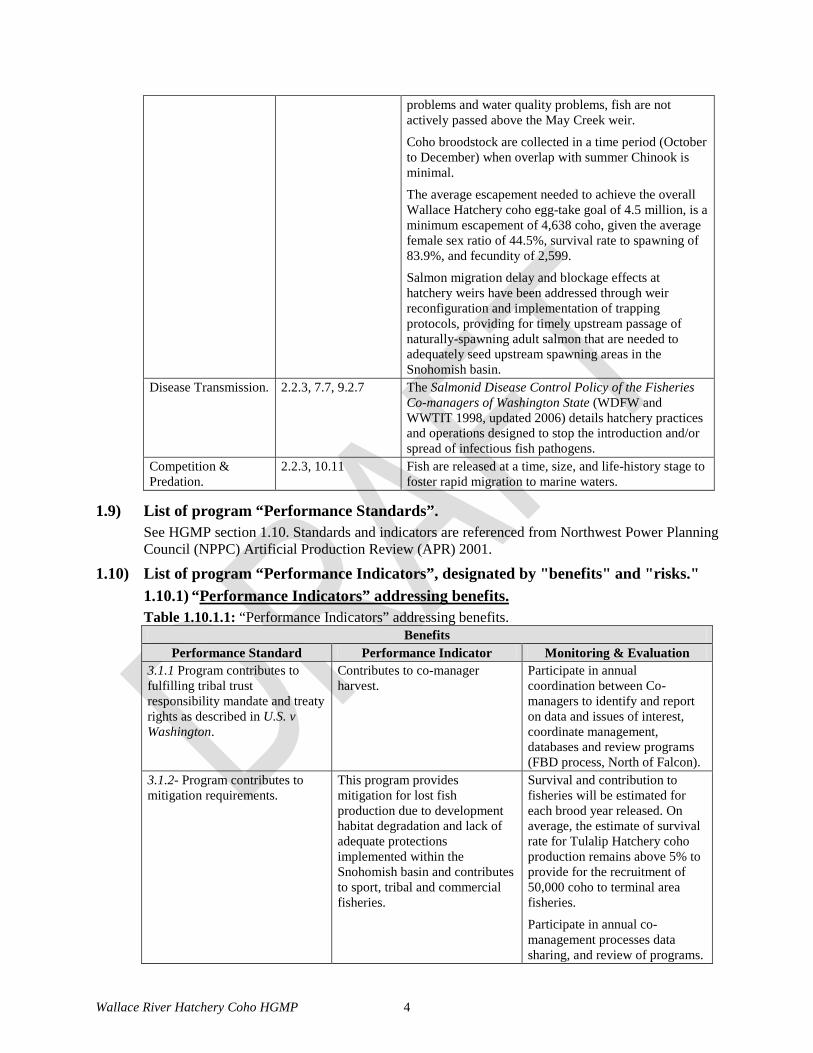
problems and water quality problems, fish are not actively passed above the May Creek weir.
Coho broodstock are collected in a time period (October to December) when overlap with summer Chinook is minimal.
The average escapement needed to achieve the overall Wallace Hatchery coho egg-take goal of 4.5 million, is a minimum escapement of 4,638 coho, given the average female sex ratio of 44.5%, survival rate to spawning of 83.9%, and fecundity of 2,599.
Salmon migration delay and blockage effects at hatchery weirs have been addressed through weir reconfiguration and implementation of trapping protocols, providing for timely upstream passage of naturally-spawning adult salmon that are needed to adequately seed upstream spawning areas in the Snohomish basin.
Disease Transmission. 2.2.3, 7.7, 9.2.7 The Salmonid Disease Control Policy of the Fisheries Co-managers of Washington State (WDFW and WWTIT 1998, updated 2006) details hatchery practices and operations designed to stop the introduction and/or spread of infectious fish pathogens.
Competition & Predation.
2.2.3, 10.11 Fish are released at a time, size, and life-history stage to foster rapid migration to marine waters.
1.9) List of program “Performance Standards”. See HGMP section 1.10. Standards and indicators are referenced from Northwest Power Planning Council (NPPC) Artificial Production Review (APR) 2001.
1.10) List of program “Performance Indicators”, designated by "benefits" and "risks." 1.10.1) “Performance Indicators” addressing benefits. Table 1.10.1.1: “Performance Indicators” addressing benefits.
Benefits Performance Standard Performance Indicator Monitoring & Evaluation
3.1.1 Program contributes to fulfilling tribal trust responsibility mandate and treaty rights as described in U.S. v Washington.
Contributes to co-manager harvest.
Participate in annual coordination between Co-managers to identify and report on data and issues of interest, coordinate management, databases and review programs (FBD process, North of Falcon).
3.1.2- Program contributes to mitigation requirements.
This program provides mitigation for lost fish production due to development habitat degradation and lack of adequate protections implemented within the Snohomish basin and contributes to sport, tribal and commercial fisheries.
Survival and contribution to fisheries will be estimated for each brood year released. On average, the estimate of survival rate for Tulalip Hatchery coho production remains above 5% to provide for the recruitment of 50,000 coho to terminal area fisheries.
Participate in annual co-management processes data sharing, and review of programs.

Wallace River Hatchery Coho HGMP 5
3.1.3 Program addresses ESA responsibilities.
Program complies with Federal ESA-listed fish take authorizations for harvest and hatchery actions.
HGMP is updated and revised to manage risks to listed fish in compliance with the Terms and Conditions of permits.
3.2.1 Fish produced for harvest are propagated and released in a manner enabling effective harvest, as described in all applicable fisheries management plans, while adequately minimizing by-catch of non-target species.
Externally-mark hatchery-origin fish to differentiate from natural-origin production and enable mark-selective fisheries, which can reduce directed harvest mortality on wild fish. Time-area fishery management strategies in terminal areas target hatchery production while limiting harvest rates on natural stocks.
Tulalip Hatchery production returns provide opportunity for weekly Treaty fishery and non-Treaty sport fishery in the same area.
Annually conduct and record 100% marking and/or tagging of all (100%) Snohomish-region hatchery production.
Harvests and hatchery returns are monitored by agencies to provide up-to-date information.
3.3.2 Releases are sufficiently marked to allow statistically significant evaluation of program contribution to natural production, and to evaluate effects of the program on the local natural population.
All Snohomish region hatchery production is marked and/or tagged enabling identification of all hatchery-origin fish. 100% mass-mark (adipose-fin clip, otolith) and representatively CWT production fish to distinguish them from naturally-produced fish.
Monitor and record fish size, number released, release date, numbers and proportions marked and tagged and marking and tagging efficiency rates. Annually record the final adjusted numbers and proportions of Ad+CWT, Ad-only, CWT-only, and unmarked fish, per the Co-managers EBD and the Tulalip-WDFW Hatchery MOU Agreement (2012) for all regional hatchery releases.
Returning fish are sampled in fisheries and hatcheries for adipose fin clips, otoliths and CWTs. Numbers of estimated hatchery (marked) and natural (unmarked) are recorded annually.
The double index tag (DIT) group (CWT-only) provides data to evaluate the effects of mark-selective fisheries (MSF), natural-origin coho catch contributions, run timing, total survival, migration patterns and straying into other watersheds
3.4.1 Fish collected for broodstock are taken throughout the return or spawning period in proportions approximating the timing and age distribution of population from which broodstock is taken.
Broodstock collection is done representatively and systematically throughout the entire return period.
NOB collection guidelines are representative to the abundance and timing of the return period
Numbers of all fish escaping to the hatchery are recorded annually by their mark/tag, sex and disposition and compiled annually. Annual return and spawn timing is recorded. Return proportions of both Sunset Falls

Wallace River Hatchery Coho HGMP 6
addressing genetic effective population size and run timing concerns.
and Wallace River coho runs are averaged over time and a collection of 500 adults (92.6% NOB) are distributed proportionally over roughly 85% of both returns to ensure that an effective population size of NOB are incorporated representatively from the entire return timing (over eight-weeks; integrated at a demographic-based PNID ranging from 0.90 to 0.99).
3.5.5 Juveniles are released at fully-smolted stage to benefit juvenile to adult survival rates, and reduce the likelihood for residualism and negative ecological interactions with natural-origin fish.
Smoltification status (size fpp/mass CV and condition factor) and behavior are monitored in the hatchery.
Fish condition monitored in the hatchery throughout rearing stages.
Monitor behavior, coloration, scale loss and other signs of full smoltification.
Annually record mean fork length, weight, condition factor, number released, and date of release.
3.5.6 The number of adults returning to the hatchery that exceeds broodstock needs is declining.
Program is properly sized to balance broodstock and egg-take goals with harvest and spawning objectives, as well as goals for genetic and ecological interactions; program fish are fully utilized for hatchery production and in target fisheries.
Harvests and hatchery returns are monitored throughout the run.
Egg-take, escapement and potential genetic and ecological interactions are monitored and potential interactions modeled with annual production and escapement data and adaptive management applied.
Numbers of surplus and shipped hatchery fish along with numbers of mortalities, numbers passed upstream and numbers spawned are recorded annually by mark-tag-sex disposition.
3.6.1 The hatchery program uses standard scientific procedures to evaluate various aspects of artificial propagation.
Follow HGMP spawning, rearing and post-release monitoring guidelines.
Apply basic monitoring standards during hatchery rearing: feed conversion ratios, growth trajectories, mark/tag rate efficiencies, and weight distributions (CVs).
Annual hatchery escapement data is recorded by mark/tag disposition, run timing, age and sex composition.
Growth rates (fork length, weight), survival rates, marking (otoliths and adipose fin clips) and coded-wire tagging rates, number and size of fish released and release dates are recorded annually.
3.8.3 Non-monetary societal benefits for which the program is designed are achieved.
Contributes to the cultural ceremonial, subsistence, religious and recreational benefits for Northwest Native Americans, and both cultural and recreational benefits to the
Annual harvest of hatchery fish based on mark (otolith/ad-clip) and/or CWT tag recovery estimates and creel surveys.
Annually record number of surplus fish provided to the

Wallace River Hatchery Coho HGMP 7
general community.
Recreational fishery angler days, length of season, number of licenses purchased.
Tribes for cultural, ceremonial, subsistence and religious uses, or donated to local food banks.
1.10.2) “Performance Indicators” addressing risks. Table 1.10.2.1: “Performance Indicators” addressing risks.
Risks Performance Standard Performance Indicator Monitoring & Evaluation
3.2.1 Fish produced for harvest are produced and released in a manner enabling effective harvest, as described in all applicable fisheries management plans, while adequately minimizing by-catch of non-target species.
Harvest is regulated to meet appropriate biological assessment criteria. Mass-mark juvenile hatchery fish prior to release to differentiate hatchery- from natural-origin fish and enable state agencies to implement selective fisheries.
Harvests and escapements are monitored by agencies to provide up-to-date information.
3.2.2 Release groups are sufficiently marked in a manner consistent with information needs and protocols to enable determination of impacts to natural- and hatchery-origin fish in fisheries.
All hatchery releases in the Snohomish basin are identifiable as hatchery-origin fish via mass-marking (adipose fin clips, thermal otolith marks) and representative CWTs)., to allow for their differentiation from naturally-produced fish.
The Wallace River Hatchery coho production has been 100% adipose fin-clipped and/or coded-wire tagged since brood year 2004 (~30% are Ad+CWT, ~30% are CWT-only as a DIT group, and the remainder are adipose fin-clipped only).
Per MOU Agreements, Tulalip Hatchery coho were marked at a 70% rate for brood years 2004 and 2005, 80% for brood years 2006-2008 and 100% since 2009. Tulalip Hatchery coho have been released 100% thermally (otolith) marked by hatchery of origin and brood year since 2004.
Annual harvest of mass-marked hatchery fish assessed based on CWT recovery estimates and creel surveys.
DIT groups (CWT-only) provide data on MSF. CWTs provide data on catch contributions, run timing, total survival, migration patterns, straying, and in-stream evaluations of juvenile and adult behaviors.
3.3.1 Hatchery program contributes to an increasing number of spawners returning to natural spawning areas.
Total number of spawners, are monitored by sub-watershed.
Snohomish Basin coho estimates are estimated from cumulative fish-day counts or calculated from live-fish curves for numerous index reaches.
3.3.2 Releases are sufficiently marked to allow for statistically
All hatchery production is identifiable in some manner
Annual estimates of the numbers and proportions of

Wallace River Hatchery Coho HGMP 8
significant evaluation of program contribution to natural production and to evaluate effects of the program on the local natural population.
(fin-marks, tags, otolith, etc.) consistent with information needs.
otolith-marked, Ad+CWT, Ad-only, CWT-only and unmarked/untagged hatchery-origin coho are made for all regional hatchery releases.
3.4.1 Fish collected for broodstock are taken throughout the return or spawning period in proportions approximating the timing and age distribution of population from which broodstock is taken.
Collection of broodstock is done randomly throughout the entire return period.
While there are no pNOB or PNID “goals” for this program, the Co-managers averaged return proportions for both Sunset Falls and Wallace River Coho runs over time to determine that a collection of around 500 adults distributed proportionally over roughly 85% of both returns would ensure that an adequate effective population size of NOB can be incorporated representatively from the entire return timing. Up to 500 NOB are collected over an eight-week period. This has resulted in egg-takes of around 700,000 eggs, integrated at a PNI ranging from 0.90 to 0.99; 200,000 of which are utilized for the on-station release, and the remaining 500,000 are shipped to regional net pen programs.
Annual run timing, age and sex composition and return timing data are collected.
3.4.2 Broodstock collection does not significantly reduce potential juvenile production in natural rearing areas.
Broodstock collections from natural spawning areas do not significantly reduce natural production or potential juvenile production in the system.
Annually record numbers of NOB used in broodstock. Recent production trend indicates a healthy stock; annual broodstock collection is not considered to limit natural juvenile production.
3.4.3 Life history characteristics of the natural population do not change as a result of this hatchery program.
Life history patterns of juvenile and adult NOR are stable.
A plan is in progress to annually monitor characteristics such as size (weight, length, condition factors), body condition, energy, scales, otoliths, age and size-at-age information for juvenile out-migrants and adult return timing and morphology.
3.5.1 Patterns of genetic variation within and among natural populations do not change significantly as a result of artificial production.
Within- and between-population genetic structure is not affected by artificial production.
Due to the high numbers of fish (average escapements have averaged 130,000 for the past 12 years) and extensive survey stream area (approximately 1,300 anadromous fish- bearing miles) it is not currently

Wallace River Hatchery Coho HGMP 9
feasible to monitor abundance or specific patterns of genetic variation within and among natural populations. For this same reason, it is not possible to monitor abundance by origin or gene flow, PNIG, pNID, pHOSD or pHOSG for Coho in the natural Snohomish escapement. However, all regional coho hatchery production is identifiable by a combination of otolith thermal marks, adipose fin clips and/or coded-wire tags and are monitored in terminal fisheries and hatchery escapements. While precise pHOS estimates are not yet available, it is believed that coho released from the Tulalip and Wallace River Hatcheries have not contributed substantially to natural spawning aggregations in the Snohomish basin. Previous analysis of scale circuli patterns indicative of hatchery residency revealed that roughly 1% of approximately 1,000 adult coho sampled from the Sunset Falls fish trap on the south fork of the Skykomish River were thought to be of hatchery-origin (Curt Kraemer, WDFW, personal comm. 2013).
3.5.2 Collection of broodstock does not adversely impact the genetic diversity of the naturally-spawning population.
Broodstock collections from natural spawning areas do not significantly reduce natural production or potential juvenile production in the system.
See HGMP section 3.5.2. Annual run timing, age and sex composition and return timing data are collected.
3.5.3 Hatchery-origin adults in natural production areas do not exceed appropriate proportion of the total natural spawning population.
The genetically effective- and demographic-based ratios of estimated numbers of artificially-produced fish to the total spawning escapement, (pHOSD and pHOSD).
While precise pHOS estimates for Snohomish coho are not yet available, it is believed that coho released from the Tulalip and Wallace River Hatcheries have not contributed substantially to natural spawning aggregations in the Snohomish basin. Hatchery contributions are thought to be low (see 3.5.1 above).
While the proportion of hatchery-origin coho is thought to be very low, the Co-managers have identified significant additional funding

Wallace River Hatchery Coho HGMP 10
that will be necessary to conduct the extensive monitoring that will be required to accurately estimate the hatchery contribution rates to the natural coho spawning populations in the basin and recalibrate Snohomish coho escapement estimation methods.
3.5.4 Juveniles are released on-station, or after sufficient acclimation to maximize homing ability to intended return locations.
Fish are released on station or in lower river locations after acclimation.
Annual release information is recorded.
3.5.5 Juveniles are released at a fully-smolted stage.
Level of smoltification and size at release (the goal is 17 fpp, observe coloration, scale loss, behavior).
Release method (forced).
Monitor size, coloration, scale loss, condition, and behavior. Annually record size (fpp, mean fork length, CV) and date of release.
3.5.6 The number of adults returning to the hatchery that exceeds broodstock needs is declining.
Program is sized appropriately for egg take and harvest goals.
Numbers of surplus hatchery returns are calculated annually.
Numbers of adults returning to the hatchery, broodstock collected or not collected, fish harvested, and surplus returns are recorded annually.
3.7.1 Hatchery facilities are operated in compliance with all applicable fish health guidelines and facility operation standards and protocols (IHOT, PNFHPC, WDFW Fish Health Policy, INAD, MDFWP).
Annual reports indicating levels of compliance with applicable standards and criteria.
Periodic audits indicating level of compliance with applicable standards and criteria.
Pathologists from WDFW’s Fish Health Section monitor program monthly and prior to releases per the Co-manager’s Disease Control Policy. Exams performed at each life stage may include tests for virus, bacteria, parasites and/or pathological changes, as needed
3.7.2 Effluent from hatchery facility will not detrimentally affect natural populations.
Discharge water quality compared to applicable water quality standards by NPDES permit.
WDOE water right permit compliance.
Flow and discharge reported in monthly NPDES reports.
3.7.3 Water withdrawals and in-stream water diversion structures for artificial production facility operation will not prevent access to natural spawning areas, affect spawning behavior of natural populations, or impact juvenile rearing environment.
Water withdrawals compared to NMFS, USFWS and WDFW applicable passage and screening criteria for juveniles and adults.
Barrier and intake structure compliance assessed and needed fixes are prioritized.
3.7.4 Releases do not introduce pathogens not already existing in the local populations, and do not significantly increase the levels of existing pathogens. Follow Salmonid Disease Control Policy of the Fisheries Co-Managers of
Necropsies of fish to assess health, nutritional status, and culture conditions.
WDFW Fish Health Section inspects adult broodstock yearly for pathogens and monitor juvenile fish on a monthly basis to assess health and detect potential disease problems. As necessary, WDFW’s Fish

Wallace River Hatchery Coho HGMP 11
Washington State (WDFW and WWTIT 1998, updated 2006).
Health Section recommends remedial or preventative measures to prevent or treat disease, with administration of therapeutic and prophylactic treatments as deemed necessary. A fish health database will be maintained to identify trends in fish health and disease and implement fish health management plans based on findings.
Release and/or transfer exams for pathogens and parasites.
1 to 6 weeks prior to transfer or release, fish are examined in accordance with the Co-managers Fish Health Policy.
Inspection of adult broodstock for pathogens and parasites.
At spawning, lots of a minimum of 60 adult broodstock are examined for pathogens.
Inspection of off-station fish/eggs prior to transfer to hatchery for pathogens and parasites.
Methods to control the spread of infectious fish pathogens through eggs/fish movements are conducted in accordance to Salmonid Disease Control Policy of the Fisheries Co-Managers of Washington State (WDFW and WWTIT 1998, updated 2006).
3.7.5 Any distribution of carcasses or other products for nutrient enhancement is accomplished in compliance with appropriate disease control regulations and guidelines, including state, tribal and federal carcass distribution guidelines.
All applicable fish disease policies are followed (see HGMP sections 7.5 and 7.8).
Disposition of carcasses are recorded in the WDFW Hatchery Adult Escapement Database.
3.7.6 Adult broodstock collection operation does not significantly alter spatial and temporal distribution of any naturally-produced population.
Spatial and temporal spawning distribution of natural populations above and below weirs is not altered.
Annual escapement estimates. A minimum escapement goal of 4,638 coho for the Snohomish Basin.
The Co-managers averaged return proportions for both Sunset Falls and Wallace River Coho runs over time to determine that a collection of ~500 adults distributed proportionally over roughly 85% of both returns would ensure that an adequate effective population size of NOB can be incorporated representatively from the entire return timing. Broodstock collections are limited spatially to these two locations and are collected throughout the ~eight-

Wallace River Hatchery Coho HGMP 12
week natural Coho return period at both Sunset and Wallace River weirs.
3.7.7 Weir/trap operations do not result in significant stress, injury or mortality in natural populations.
All observations of natural-origin fish at hatchery facilities are recorded and reported annually.
Trap checked daily. Natural- and hatchery-origin fish condition is observed on a regular basis each year and abundances recorded and reported annually.
All observations of natural-origin fish at hatchery facilities are recorded regularly and reported annually.
3.7.8 Predation by artificially produced fish on naturally –produced fish does not significantly reduce numbers of natural fish.
Hatchery juveniles are raised to full smoltification at a yearling size of 17fpp and released in early May during freshets when possible to foster rapid outmigration.
Relative body size of program fish released and size of prey, especially ESA-listed, zero-age Chinook and steelhead.
Relative occurrence, timing, distribution habitat use, stomach contents of hatchery- and natural-origin fish species.
Smoltification signs (migratory behavior and negative rheotaxis, silver skin coloration, scale loss, etc).
Summarized predation data is not directly available. However, the Tulalip Tribes have operated smolt traps on the Skykomish and Snoqualmie Rivers since 2000 recording the outmigration timing and relative size of all species by hatchery and natural origins.
The Co-managers, in cooperation with NOAA fisheries, have conducted beach seining studies in the Snohomish River estuary and nearshore marine areas since 2000 recording relative size, occurrences, outmigration timing, habitat use and stomach contents of natural- and hatchery-origin fish.
3.8.1 Cost of program operation does not exceed the net economic value of fisheries in dollars per fish for all fisheries targeting this population.
Total cost of operation. Annual operational cost of program compared to calculated fishery contribution value (Wegge 2009)
1.11) Expected size of program. 1.11.1) Proposed annual broodstock collection level (maximum number of adult
fish). Around 3,462 viable spawners, or 1,731 spawning pairs are needed to provide the overall egg-take of 4.50-million, which provides: 700,000 green eggs for the on-station (200,000) and regional net pen releases (~500,000); up to 2.1-million eggs for the Tulalip Hatchery program; and around 2.0-million eggs for the South Sound and Squaxin Island net pen programs (see HGMP section 1.11.2). The average total escapement needed to achieve the overall Wallace Hatchery coho egg-take goal is a minimum escapement of 4,638 adults, given the average female sex ratio of 44.5%, survival rate to spawning of 83.9%, and fecundity of 2,599 (1995-2007 averages).

Wallace River Hatchery Coho HGMP 13
1.11.2) Proposed annual fish release levels (maximum number) by life stage and location.
Table 1.11.2.1. Fish release levels by life stage and location. Life Stage Release Location Annual Release Level Yearlings Wallace River (WRIA 07.0940) 150,000
Source: Equilibrium Brood Document 2012.
In addition, coho eggs collected at Wallace River Hatchery are distributed to various facilities and co-operative enhancement projects to support their programs. Table 1.11.2.2. Transfer goals, Wallace River Hatchery coho (Skykomish stock).
Destination Stage Size (fpp) Number Date WSU Research Adults 8-10 50 October
Quilceda Treatment Plant Adults 8-10 20 October
Bernie Kai-Kai Gobin Hatchery Green eggs Green eggs 1,600,000* October
Marblemount Hatchery Green eggs Green eggs 1,700,000 October
WSU Research Green eggs Green eggs 10,000 November
Seattle Poggie Club Eyed eggs Eyed Eggs 60,000 November
Sky Valley SDA School Eyed eggs Eyed Eggs 10,000 November
Region 4 Education Coops Eyed eggs Eyed Eggs 8,500 November
Snohomish Sportsmen Unfed Fry 1,000 24,000 March
ESSC Everett Net Pens Sub-yearlings 25 20,000 January
South Sound Net Pens Sub-yearlings 25 305,000 January Source: WDFW Future Brood Document 2013. * The full on-station green eggtake goal (200,000) and the green egg transfer goal to Tulalip Hatchery of
1.6-million must be achieved before additional coho eggs are transferred to other hatchery programs. While the egg transfer goal to Tulalip is 1.6-million green coho eggs, the egg transfer and release levels to Tulalip Hatchery may be increased when surplus to production needs and by agreement of the Co-managers (Tulalip and WDFW 2012). The co-manager-agreed, proposed annual coho salmon production level under ESA evaluation by NOAA Fisheries for effects on ESA-listed fish for the Tulalip Hatchery program is a release of up to 2.0-million yearling smolts.
1.12) Current program performance, including estimated smolt-to-adult survival rates, adult production levels, and escapement levels. Indicate the source of these data. Based on the average smolt-to-adult survival rate of 5.97% (fishery years 2003-2008, see Table 3.3.1.1), and the program release goal (150,000 yearlings), the estimated annual production level would be 8,955 adults. Table 1.12.1. Wallace River Hatchery coho escapement 2000-2012.
Brood Year Hatchery Escapement 2000 26,263 2001 31,661 2002 11,802 2003 13,262 2004 13,880 2005 13,304* 2006 6,145* 2007 7,228*

Wallace River Hatchery Coho HGMP 14
2008 3,316* 2009 8,237* 2010 4,338* 2011 7,801* 2012 10,475*
Average 12,132 Source: Equilibrium Brood Database (Tulalip and WDFW 2012), WDFW Hatcheries Headquarters
Database 2012, RMIS 2012. *Sunset Falls transfers are included in the Hatchery Escapement column.
1.13) Date program started (years in operation), or is expected to start. Program has been in operation since the early-1900s.
1.14) Expected duration of program. Ongoing.
1.15) Watersheds targeted by program. Snohomish River watershed - Skykomish River (WRIA 07.0012); Wallace River (WRIA 07.0940)
1.16) Indicate alternative actions considered for attaining program goals, and reasons why those actions are not being proposed. In order for any alternative actions to be considered for attaining program goals, the affected parties (Co-managers) must approve any changes. The Puget Sound Salmon Management Plan (PSSMP 1985), a federal court order, describes the co-management responsibilities of WDFW and the tribes with regard to fishery management and artificial production. The PSSMP explicitly states that "no change may be made to the Equilibrium Brood Document (program production goals) without prior agreement of the affected parties." In the Snohomish River watershed, any changes in the production at the Wallace River Hatchery have to be reviewed and approved by WDFW and the Tulalip Tribes. Alternative 1: Reduce coho release numbers as a measure to decrease ecological risks to natural-origin Chinook salmon. Release size was reduced from 300,000 to 150,000 in 2001. Further reductions will not be pursued because the program would not meet enhancement or harvest objectives and would not meet the goals of either Co-manager, including providing recreational, cultural and subsistence, ceremonial, religious, commercial and non-commercial benefits, nor be compatible with Treaty Indian fishing rights (US v WA) or the Magnuson/Stevens Act for sustainable fisheries.
SECTION 2. PROGRAM EFFECTS ON NMFS ESA-LISTED SALMONID POPULATIONS. (USFWS ESA-Listed Salmonid Species and Non-Salmonid Species are addressed in Addendum A) 2.1) List all ESA permits or authorizations in hand for the hatchery program.
This HGMP is submitted to NOAA Fisheries for ESA consultation, and determination regarding compliance of the plan with ESA section 4(d) rule criteria for joint state/tribal hatchery resource management plans affecting listed Chinook salmon and steelhead.

Wallace River Hatchery Coho HGMP 15
2.2) Provide descriptions, status, and projected take actions and levels for NMFS ESA-listed natural populations in the target area. 2.2.1) Description of NMFS ESA-listed salmonid population(s) affected by the
program. - Identify the NMFS ESA-listed population(s) that will be directly affected by the program. None
- Identify the NMFS ESA-listed population(s) that may be incidentally affected by the program. Puget Sound Chinook (Oncorhynchus tshawytscha): Listed as Threatened on March 24, 1999 (64FR14308); Threatened status reaffirmed on June 28, 2005 (70FR37160); reaffirmed Threatened by five-year status review, completed August 15, 2011 (76FR50448). The Puget Sound Chinook salmon ESU is composed of 31 historically quasi-independent populations, of which 22 are believed to be extant currently. The ESU includes all naturally-spawned populations of Chinook salmon from rivers and streams flowing into Puget Sound including the Strait of Juan De Fuca from the Elwha River, eastward, including rivers and streams flowing into Hood Canal, South Sound, North Sound and the Strait of Georgia in Washington, as well as twenty-six artificial propagation programs (Ford 2011). In the Snohomish basin, the Technical Recovery Team (TRT) has identified demographically independent populations (DIPs) in the Skykomish and Snoqualmie River sub-basins (Ruckelshaus et al. 2006). Puget Sound steelhead (Oncorhynchus mykiss): Were listed as Threatened under the ESA on May 11, 2007 (72FR26722); reaffirmed Threatened by five-year status review, completed August 15, 2011 (76FR50448). The DPS includes all naturally spawned anadromous winter-run and summer-run O. mykiss (steelhead) populations, below natural migration barriers in the river basins of the Strait of Juan de Fuca, Puget Sound, and Hood Canal, Washington (Ford 2011). This DPS is bounded to the west by the Elwha River (inclusive) and to the north by the Nooksack River and Dakota Creek (inclusive), and also includes the Green River natural and Hood Canal winter-run steelhead hatchery stocks. In the Snohomish Basin, the TRT has preliminarily delineated three DIPs of winter steelhead (Snohomish/Skykomish, Pilchuck, and Snoqualmie) and two DIPs of summer steelhead (Tolt, and NF Skykomish) (PSSTRT 2013a).
2.2.2) Status of NMFS ESA-listed salmonid population(s) affected by the program. - Describe the status of the listed natural population(s) relative to “critical” and “viable” population thresholds. Wallace River Hatchery summer Chinook in Puget Sound Chinook ESU. NMFS (1999) considered this hatchery stock to be part of the ESU, but not essential for recovery. The hatchery population was listed with natural-origin Chinook salmon that are part of the Skykomish population (70 FR 37160. June 28, 2005; NMFS SHIEER 2004). This stock was designated Category 2a. The Wallace River Hatchery stock was derived primarily from locally-obtained natural-origin fish, and was considered by NMFS to be no more than moderately diverged from the donor Skykomish population (SSHAG 2003).

Wallace River Hatchery Coho HGMP 16
Table 2.2.2.1: Numbers and proportions of natural-origin fish in the Wallace River Hatchery Chinook broodstock relative to demographic-based estimates of the proportions of hatchery-origin fish on the target natural spawning grounds and demographic-based estimates of the Proportion of Natural Influence (PNID) for seven years of broodstock integration (2005-2011).
Year Wallace
NOB Sunset NOB
Total NOB
Total Integrated pNOB
pHOS (Skykomish Population)
PNI (Demographic)
Including Wallace River
Excluding Wallace River Sky Sky-Wall
2011 265 51 316 981 0.32 0.25 0.11 0.56 0.75
2010 83 82 165 699 0.24 0.27 0.16 0.47 0.59
2009 56 36 92 785 0.12 0.19 0.16 0.38 0.42
2008 179 108 287 724 0.40 0.18 0.04 0.69 0.91
2007 279 83 362 708 0.51 0.43 0.27 0.54 0.66
2006 124 108 232 719 0.32 0.17 0.09 0.66 0.78
2005 246 66 312 697 0.45 N/A N/A N/A 0.89 Source: Co-manager’s annual escapement estimate and carcass survey unpublished data, Mike Crewson Tulalip Tribes and Peter
Verhey WDFW 2012.
Snohomish Chinook in the Puget Sound ESU. Recent escapement levels (2000-2011) have averaged 3,990 for natural spawners in the Skykomish River DIP and 2,004 for the Snoqualmie River DPS. Both populations have shown declining population trends during this same period (SaSI, WDFW 2012). Puget Sound Chinook salmon: Updated Risk Summary. All Puget Sound Chinook populations are below the TRT planning range for recovery escapement levels. Most populations are also consistently below the spawner recruit levels identified by the TRT as consistent with recovery. Across the ESU, most populations have declined in abundance somewhat since the last status review in 2005, and trends since 1995 are mostly flat. Several of the risk factors identified by Good et al. (2005) are also still present, including high fractions of hatchery fish in many populations and widespread loss and degradation of habitat. Many of the habitat and hatchery actions identified in the Puget Sound Chinook recovery plan are expected to take years or decades to be implemented and to produce significant improvements in natural population attributes, and these trends are consistent with these expectations. Overall, the new information on abundance, productivity, spatial structure and diversity since the 2005 review does not indicate a change in the biological risk category since the time of the last BRT status review (Ford 2011). Table 2.2.2.2: Snohomish Chinook MU, minimum viability spawning abundance and abundance at equilibrium or replacement, and spawning A/P at MSY for a recovered state as determined by EDT analyses of properly functioning conditions and expressed as a Beverton-Holt function. The TRT minimum viability abundance was the equilibrium abundance or 17,000, whichever was less.
Region and population
TRT minimum viability
abundance
Under properly functioning conditions (PFC) NMFS Escapement Thresholds Equilibrium abundance
Spawners at MSY
Productivity at MSY Criticala Rebuildingb
Skykomish 17,000 39,000 8,700 3.4 1,650 3,500
Snoqualmie 17,000 25,000 5,500 3.6 400 1,250c
ESU 261,300 307,500 70,948 3.2 3,875 2,785 Source: Ford 2011; NMFS 2011. a Critical natural-origin escapement thresholds under current habitat and environmental conditions (McElhaney et al. 2000; NMFS 2000a).
b Rebuilding natural-origin escapement thresholds under current habitat and environmental conditions (McElhaney et al. 2000; NMFS 2000a).
c Based on generic VSP guidance (McElhaney et al. 2000; NMFS 2000a).
Snohomish winter-run Steelhead in Puget Sound Steelhead DPS. Steelhead counts in the Snohomish River have declined since the 1980s. The estimated probability that this steelhead population would decline to 10% of its current estimated abundance (i.e., to 445 fish) is

Wallace River Hatchery Coho HGMP 17
moderately high—about 50% within 100 years. With an estimated mean population growth rate of −0.024 (λ = 0.976) and process variance of 0.033, we can be highly confident (P < 0.05) that a 90% decline in this population will not occur within the next 15 years, and that a 99% decline will not occur within the next 35 years. However, beyond the next 40−50 years we are highly uncertain about the precise level of risk (Ford 2011). Based on a preliminary intrinsic potential (IP) estimate by the PSSTRT (2013a), the capacity for winter steelhead is between 21,389 and 42,779 adults in the Snohomish/ Skykomish DPS, 5,193 and 10,386 in the Pilchuck River and 16,740 to 33,479 in the Snoqualmie River. Tolt and North Fork Skykomish summer-run steelhead in the Puget Sound Steelhead DPS. Steelhead counts in the Tolt River have declined since the late 1990s. The estimated probability that this steelhead population would decline to 10% of its current estimated abundance (i.e., to 6 fish) is high—nearly 80% within 100 years. With an estimated mean population growth rate of −0.040 (λ = 0.961) and process variance of 0.010, we can be highly confident (P < 0.05) that a 90% decline in this population will not occur within the next 8−10 years, and that a 99% decline will not occur within the next 15−18 years. However, beyond the next 20 years we are highly uncertain about the precise level of risk (Ford 2011). There is no adequate population trend data North Fork Skykomish DPS and as such the status of this population is currently unknown (SaSI, WDFW 2012). Based on a preliminary IP estimate by the PSSTRT (2013a), the capacity for summer steelhead between 321 and 641 adults in the Tolt River and 663 and 1,325 in the North Fork Skykomish River. Puget Sound Steelhead: Updated Risk Summary. The status of the listed Puget Sound steelhead DPS has not changed substantially since the 2007 listing. Most populations within the DPS are showing continued downward trends in estimated abundance, a few sharply so (Ford 2011). For all but a few putative demographically independent populations of steelhead in Puget Sound, estimates of mean population growth rates obtained from observed spawner or redd counts are declining—typically 3 to 10% annually—and extinction risk within 100 years for most populations in the DPS is estimated to be moderate to high, especially for draft populations in the putative South Sound and Olympic MPGs. Collectively, these analyses indicate that steelhead in the Puget Sound DPS remain at risk of extinction throughout all or a significant portion of their range in the foreseeable future, but are not currently in danger of imminent extinction. Table 2.2.2.3: Interim DIP abundance goals for steelhead in Puget Sound, based on a four-year average. Abundance goals for summer-run fish (italics) are still under review. QET, quasi extinction threshold; SAS, smolt to adult survival. Minimum abundance = 100 (Low Abundance), 250 (Viable).
Population Basin Quasi Extinction Threshold
Low Abundance Viable Capacity
Population Name Area km2
Mean Elevation (m)
Total Stream Length (m) 1% SAS 5% SAS 20% SAS
Snohomish /Skykomish River 1,595 420 1,021,690 73 2,139 10,695 42,779
Pilchuck River 356 253 242,383 34 519 2,597 10,386 North Fork Skykomish River 156 1,195 117,602 25 100 (66) 331 1,325
Snoqualmie River 1,615 620 1,134,038 58 1,674 8,370 33,479
Tolt River 182 784 117,732 25 100 (32) 250 (160) 641
Puget DPS Total 1,462 30,449 153,194 613,662 Source: PSSTRT 2013b.

Wallace River Hatchery Coho HGMP 18
- Provide the most recent 12 year (e.g. 1988-present) progeny-to-parent ratios, survival data by life-stage or other measures of productivity for the listed population. Table 2.2.2.4: Puget Sound Chinook population average productivity for five-year intervals measured as recruits per spawner (R/S) and spawners per spawner (S/S) for natural origin fish. “ESU” refers to the aggregate Puget Sound Chinook evolutionarily significant unit.
Brood Years 1982-1986 1987-1991 1992-1996 1997-2001 2002-2006 Trend
Populations R/S S/S R/S S/S R/S S/S R/S S/S R/S S/S R/S S/S
Skykomish 6.54 0.97 2.53 0.43 2.44 0.8 3.47 0.94 2.25 0.56 -0.76 -0.03
Snoqualmie 4.7 0.76 8.09 1.04 3.72 1.52 3.81 1.28 1.78 0.61 -1.01 0.00
ESU 9.57 2.19 5.05 0.96 3.01 1.24 2.70 1.19 1.67 0.67 -1.81 -0.28 Source: This is from analyses reported by Ford (2011). These analyses incorporate assumptions for years where escapements were not
sampled for hatchery: natural-origin ratios that are not necessarily agreed to by WDFW and the Tulalip Tribes. Trend over the intervals is also given.
Table 2.2.2.5: Short and long term population trend and growth rate estimates for the Puget Sound Snohomish Chinook ESU populations.
Regions and Populations Years Trend Natural
Spawners w/Cl
Hatchery Fish Success = 0
Lambda w/Cl p>1
Hatchery Fish Success = 1
Lambda w/Cl p>1
Skykomish River 1995‐2009 1.036
(0.97 ‐ 1.105) 1.065
(0.688 ‐ 1.65) 0.84 0.952 (0.752 ‐ 1.205) 0.11
1965‐2009 0.99 (0.98 ‐ 1.0)
0.997 (0.934 ‐ 1.064) 0.46 0.921
(0.874 ‐ 0.972) 0.00
Snoqualmie River 1995‐2009 1.075
(0.972 ‐ 1.188) 1.043
(0.427 ‐ 2.546) 0.67 1.0 (0.428 ‐ 2.334) 0.50
1965‐2009 1.021 (1.007 ‐ 1.036)
1.021 (0.957 ‐ 1.09) 0.76 0.993
(0.933 ‐ 1.057) 0.40
Source: These are based on analyses reported by Ford (2011) that are not necessarily agreed to by WDFW and the Tulalip Tribes. “Lambda” is a measure of population growth rate. See Ford (2011) for explanation of the columns.
Table 2.2.2.6. Exp. Steelhead Population Trend ln (nat. spawners) (95% CI). Population 1985-2009 1995-2009
Snohomish River winter‐run 0.963 (0.941 ‐ 0.985) 0.961 (0.878 ‐ 1.050) Source: Ford 2011. These are based on analyses reported by Ford (2011) that are not necessarily agreed to
by WDFW and the Tulalip Tribes.
- Provide the most recent 12 year (e.g. 1988-1999) annual spawning abundance estimates, or any other abundance information. Indicate the source of these data. Table 2.2.2.7. Natural spawning Chinook escapements in the Snohomish basin, 2000-2011.
Year Skykomish Snoqualmie Total 2000 4,668 1,427 6,095 2001 4,575 3,589 8,164 2002 4,327 2,896 7,223 2003 4,239 1,972 6,211 2004 7,614 2,988 10,602 2005 3,203 1,281 4,484 2006 5,693 2,615 8,308 2007 2,648 1,334 3,982 2008 5,813 2,560 8,373 2009 1,414 895 2,309

Wallace River Hatchery Coho HGMP 19
2010 2,511 1,788 4,299 2011 1,180 700 1,880
Average 3,990 2,004 5,994 Source: Mike Crewson Tulalip Tribes and Peter Verhey WDFW unpublished 2012 Co-manager’s carcass
sampling and spawner survey data (includes HOR and NOR).
Table 2.2.2.8: Snohomish River basin winter and summer steelhead escapement 2001-2012.
Year Snohomish System Winter Steelhead Snohomish System Summer Steelhead
Snoqualmie River¹
Pilchuck River
Snohomish/ Skykomish River¹ Tolt River S.F.
Skykomish N.F.
Skykomish 2001 1,395 462 1,265 167 513 NA 2002 789 279 1,166 115 948 NA 2003 988 696 1,915 198 303 NA 2004 1,506 1,522 3,404 34 344 NA 2005 1,060 604 2,850 76 318 NA 2006 1,856 580 3,038 120 498 NA 2007 NA NA NA 50 NA NA 2008 NA 646 NA 52 282 NA 2009 NA 344 NA 86 311 NA 2010 662 294 732 116 369 NA 2011 732 552 1,150 68 328 NA 2012 914 848 880 122 592 NA
Average 1,100 621 1,822 100 437 NA Source: SaSI, WDFW 2012; Peter Verhey WDFW 2013
- Provide the most recent 12 year (e.g. 1988-1999) estimates of annual proportions of direct hatchery-origin and listed natural-origin fish on natural spawning grounds, if known. Skykomish and Snoqualmie Chinook in the Puget Sound Chinook ESU. Using methods described in Rawson, Kraemer and Volk (2001) applied to Co-manager’s annual escapement estimates and carcass surveys for the past seven years, naturally-produced Chinook have made up a sizeable fraction of the spawning abundance, averaging 77.5% for the basin in recent years (2005-2011), which is up from an average of 61.0% from 1997 to 2001 (Table 2.2.2.2). The hatchery-origin fraction of the Skykomish Chinook population in recent years (24.8%; 2006-2011) has dropped by half of what it averaged from 1997-2001 (49.9%). The hatchery-origin fraction of the Snoqualmie Chinook population has remained similar in the years for which data is available, currently averaging 18.4% (2005-2011) and averaging 15.6% from 1997-2001 (Table 2.2.2.1). It is not possible to determine the HOS/NOS fractions for the Skykomish population or the basin from 2002-2005 due to unmarked hatchery releases affecting return years 2002-2004 and no HOS/NOS sampling in the Wallace River in 2005. It is not possible to determine the HOS/NOS fractions prior to return year 1997 due to the lack of 100% marking and tagging. Table 2.2.2.9: Hatchery- and natural-origin fractions for the Skykomish and Snoqualmie Chinook populations and basin totals, 1997-2011.
Year Snoqualmie
NOS Skykomish
NOS Snoqualmie
HOS Skykomish
HOS Basin Total
NOS Basin Total
HOS 1997 93.7% 70.9% 6.3% 28.6% 81.6% 18.4%
1998 71.9% 33.9% 28.0% 66.2% 45.3% 54.7%
1999 77.4% 40.7% 22.7% 59.3% 51.0% 49.1%

Wallace River Hatchery Coho HGMP 20
2000 87.5% 38.0% 12.5% 62.0% 49.6% 50.4%
2001 91.5% 66.8% 8.5% 33.3% 77.6% 22.4%
2005 75.7% N/A 24.3% N/A N/A N/A
2006 82.6% 83.2% 17.4% 16.8% 83.0% 17.0%
2007 88.0% 57.0% 12.0% 43.0% 67.4% 32.6%
2008 85.5% 82.2% 14.5% 17.8% 83.2% 16.8%
2009 72.5% 81.0% 27.5% 19.0% 77.7% 22.3%
2010 88.7% 73.1% 11.3% 26.9% 79.6% 20.4%
2011 72.3% 74.6% 27.7% 25.4% 73.8% 26.2%
Avg: 1997-2001 84.4% 50.1% 15.6% 49.9% 61.0% 39.0% Avg: 2005-2011 80.8% 75.2% 19.2% 24.8% 77.5% 22.6% Overall Average 82.3% 63.8% 17.7% 36.2% 70.0% 30.0%
Source: Co-manager’s annual escapement estimate and carcass survey unpublished data, Mike Crewson Tulalip Tribes and Peter Verhey WDFW 2012.
Snohomish System steelhead (Oncorhynchus mykiss): The level of hatchery summer run steelhead spawners in the Snohomish River system is unknown. Due to spawn timing differences between the Chambers Creek stock winter steelhead, Skamania stock summer steelhead and a majority of the existing wild winter or summer stocks (being later February – June), interaction on the spawning grounds is unclear.
2.2.3) Describe hatchery activities, including associated monitoring and evaluation and research programs, that may lead to the take of NMFS listed fish in the target area, and provide estimated annual levels of take.
Smolt trap monitoring operations are ongoing in the Skykomish and Snoqualmie Rivers, as well as fyke netting and beach seining studies in the Snohomish River estuary, nearshore marine areas, and pocket estuaries. Spawner surveys are conducted throughout the Snohomish Basin. These monitoring activities are evaluated and authorized for takes of listed fish through other NMFS ESA consultation processes (Tribal research permit: http://www.nmfs.noaa.gov/pr/permits/esa_permits.htm). All Snohomish-regional hatchery production is identifiable through a combination (100%) of coded-wire tagging (representative groups), adipose fin clipping (100% less DIT groups), and thermal otolith mass-marking (100% at Tulalip). Installation of chiller equipment at Wallace River Hatchery is currently being evaluated. If installed, it will allow for the production to be 100% thermally (otolith) marked.
- Describe hatchery activities that may lead to the take of listed salmonid populations in the target area, including how, where, and when the takes may occur, the risk potential for their occurrence, and the likely effects of the take. Broodstock Collection. Coho broodstock are collected from October to December, when overlap with summer Chinook is minimal. The hatchery, located at the confluence of May Creek and the Wallace River, operates two adult collection weirs. The May Creek weir operates from June through November. The Wallace River weir operates from June through October, to collect Chinook salmon for broodstock. The weir is removed each year by approximately October 1, to avoid damage to the structure from seasonal flooding. All fish captured in the fall after weir removal are volunteers to the hatchery ladder, which remains open through the following March to remove hatchery-origin steelhead and facilitate coho broodstock collection. Captured adults can be passed above the weir for natural spawning, directly from the holding ponds through a series of transfer pipes. Fish are not passed above the May Creek upper weir, which blocks access above the hatchery’s water intake, to prevent disease transmission from anadromous fish into the hatchery. They are,

Wallace River Hatchery Coho HGMP 21
however, passed above the Wallace River weir and intake, and are allowed to volitionally move upstream when the weir is removed in the fall. An upstream passage policy was developed to address the effects on listed fish and fish passage concerns in the Wallace River related to operation of the weir during the Chinook broodstocking period to ensure that the viability of listed fish would not be adversely affected by the weir. Sex-specific “Minimum Natural Spawner Guidelines” (MSG) were developed, for both above and below the weir, to guide broodstocking and limit impacts on natural-origin fish. HOS control to limit potential adverse genetic and ecological interactions between natural- and hatchery-origin Chinook salmon in the basin is further limited to meet the MSGs above and below the weir to manage for minimum abundance. To manage spatial distribution and life history diversity, fish removals are limited to below the hatchery rack, while the MSG adopted for Wallace River Chinook considers the spatial distribution of Chinook throughout the Wallace system, above and below the hatchery weir. A trap-and-haul facility at the base of Sunset Falls, an anadromous fish barrier at RM 51.5 on the SF Skykomish River, is also operated annually from July through December. Most fish encountered in this trap are passed above the falls, although relatively small proportions of NOR Chinook and coho are taken for broodstock under the strict guidelines (see HGMP section 6.2.3, and the Wallace River Hatchery Chinook HGMP). Collection of coho for transfer to Wallace River Hatchery should not impact natural Chinook and steelhead, as all fish arriving at the facility that are not collected for broodstock are passed upstream. Integrating natural-origin fish into the broodstock is being done with the intent to increase local adaptation to the natural environment and boost productivity and diversity, while managing for other viability parameters (abundance, spatial distribution and genetic diversity). Capture, handle and release effects: The collection and handling of fish at the hatchery and at the Sunset Falls facility may result in takes of listed fish through migration delay, injury during holding or through handling and incidental mortality through trapping or handling. Coho broodstock is collected from October to December, when overlap with summer Chinook is minimal. Operation of Hatchery Facilities: Potential impacts from facility operations include water withdrawal, hatchery effluent, and intake compliance. Monitoring and maintenance are conducted along with staff observations. Hatchery effluent is monitored through the NPDES (see HGMP section 4.2). Disease Effects: The risk of disease transmission to wild salmonids in the area (Puget Sound) is low. Transmission of hatchery-origin diseases from the hatchery to wild fish in areas where they co-occur is an unlikely event. Although hatchery populations can be considered to be reservoirs for disease pathogens because of their elevated exposure to high rearing densities and stress, there is little evidence to suggest that diseases are routinely transmitted from hatchery to wild fish (Steward and Bjornn 1990). These impacts are addressed by rearing fish at lower densities, within widely recognized guidelines, continuing well-developed monitoring, diagnostic, and treatment programs already in place (Co-manager’s Fish Health Policy, WDFW and WWTIT 1998, updated 2006). Predation/Competition: Although coho have been documented to prey on other salmonids (primarily pink, chum and sockeye salmon) (Hawkins and Tipping 1999; Seiler et al. 2002; Hargreaves and LeBrasseur 1986), any predation potential to listed populations should be minimized by the timing and proximity of the release. Hatchery coho are released in May, usually during or right after a freshet, to foster rapid migration and minimize freshwater residence. Juvenile sampling in the Snohomish estuary showed that yearling coho abundance declined rapidly throughout May, indicating that both hatchery and wild coho migrate through the estuary quickly (Rowse and Fresh 2003). Similar studies in the Green River have shown that yearling coho salmon typically spend less than a week in the lower river and estuary reaches of the river
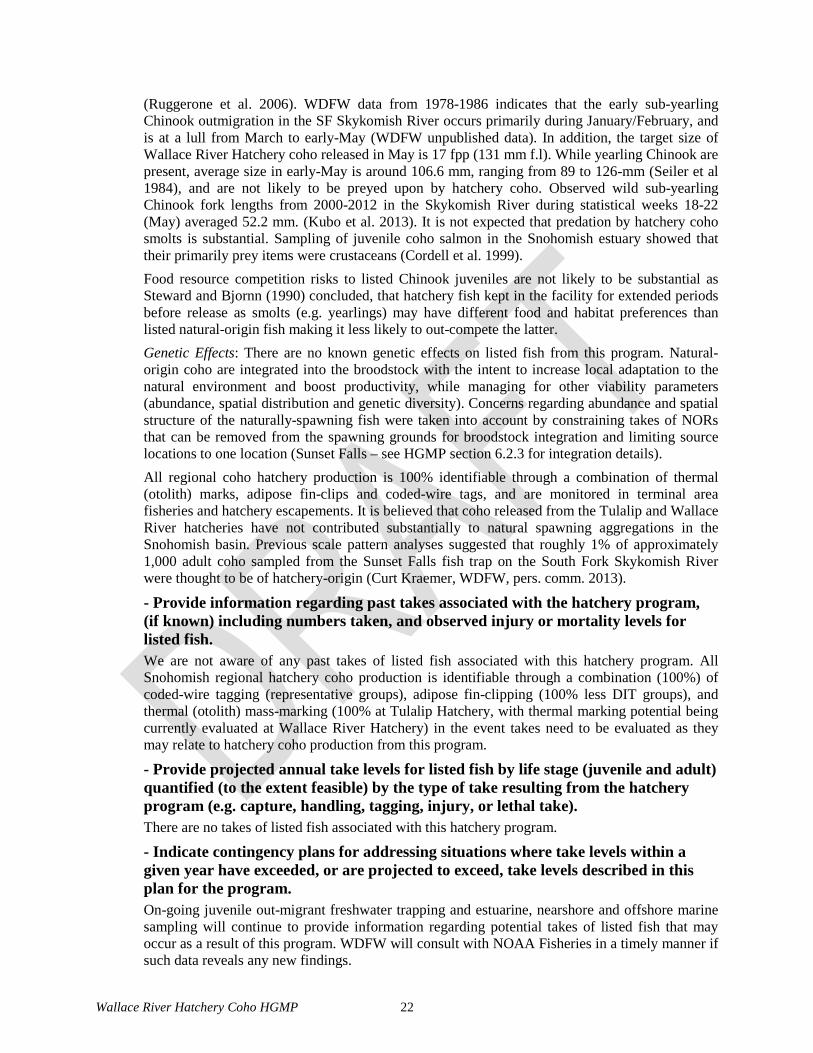
Wallace River Hatchery Coho HGMP 22
(Ruggerone et al. 2006). WDFW data from 1978-1986 indicates that the early sub-yearling Chinook outmigration in the SF Skykomish River occurs primarily during January/February, and is at a lull from March to early-May (WDFW unpublished data). In addition, the target size of Wallace River Hatchery coho released in May is 17 fpp (131 mm f.l). While yearling Chinook are present, average size in early-May is around 106.6 mm, ranging from 89 to 126-mm (Seiler et al 1984), and are not likely to be preyed upon by hatchery coho. Observed wild sub-yearling Chinook fork lengths from 2000-2012 in the Skykomish River during statistical weeks 18-22 (May) averaged 52.2 mm. (Kubo et al. 2013). It is not expected that predation by hatchery coho smolts is substantial. Sampling of juvenile coho salmon in the Snohomish estuary showed that their primarily prey items were crustaceans (Cordell et al. 1999). Food resource competition risks to listed Chinook juveniles are not likely to be substantial as Steward and Bjornn (1990) concluded, that hatchery fish kept in the facility for extended periods before release as smolts (e.g. yearlings) may have different food and habitat preferences than listed natural-origin fish making it less likely to out-compete the latter. Genetic Effects: There are no known genetic effects on listed fish from this program. Natural-origin coho are integrated into the broodstock with the intent to increase local adaptation to the natural environment and boost productivity, while managing for other viability parameters (abundance, spatial distribution and genetic diversity). Concerns regarding abundance and spatial structure of the naturally-spawning fish were taken into account by constraining takes of NORs that can be removed from the spawning grounds for broodstock integration and limiting source locations to one location (Sunset Falls – see HGMP section 6.2.3 for integration details). All regional coho hatchery production is 100% identifiable through a combination of thermal (otolith) marks, adipose fin-clips and coded-wire tags, and are monitored in terminal area fisheries and hatchery escapements. It is believed that coho released from the Tulalip and Wallace River hatcheries have not contributed substantially to natural spawning aggregations in the Snohomish basin. Previous scale pattern analyses suggested that roughly 1% of approximately 1,000 adult coho sampled from the Sunset Falls fish trap on the South Fork Skykomish River were thought to be of hatchery-origin (Curt Kraemer, WDFW, pers. comm. 2013).
- Provide information regarding past takes associated with the hatchery program, (if known) including numbers taken, and observed injury or mortality levels for listed fish. We are not aware of any past takes of listed fish associated with this hatchery program. All Snohomish regional hatchery coho production is identifiable through a combination (100%) of coded-wire tagging (representative groups), adipose fin-clipping (100% less DIT groups), and thermal (otolith) mass-marking (100% at Tulalip Hatchery, with thermal marking potential being currently evaluated at Wallace River Hatchery) in the event takes need to be evaluated as they may relate to hatchery coho production from this program.
- Provide projected annual take levels for listed fish by life stage (juvenile and adult) quantified (to the extent feasible) by the type of take resulting from the hatchery program (e.g. capture, handling, tagging, injury, or lethal take). There are no takes of listed fish associated with this hatchery program.
- Indicate contingency plans for addressing situations where take levels within a given year have exceeded, or are projected to exceed, take levels described in this plan for the program. On-going juvenile out-migrant freshwater trapping and estuarine, nearshore and offshore marine sampling will continue to provide information regarding potential takes of listed fish that may occur as a result of this program. WDFW will consult with NOAA Fisheries in a timely manner if such data reveals any new findings.

Wallace River Hatchery Coho HGMP 23
SECTION 3. RELATIONSHIP OF PROGRAM TO OTHER MANAGEMENT OBJECTIVES 3.1) Describe alignment of the hatchery program with any ESU-wide hatchery plan (e.g.
Hood Canal Summer Chum Conservation Initiative) or other regionally accepted policies (e.g. the NPPC Annual Production Review Report and Recommendations - NPPC document 99-15). Explain any proposed deviations from the plan or policies. WDFW hatchery programs in Puget Sound operate under, and adhere to Co-manager priorities and legal requirements of the Puget Sound Salmon Management Plan (PSSMP), the Co-managers’ Non-Chinook Resource Management Plan (RMP), for Puget Sound region non-Chinook salmon hatchery programs, and the Terms and Conditions of Permits issued under the Endangered Species Act (ESA), which are being integrated with harvest and habitat actions specified in the Snohomish Basin Salmon Recovery Plan. Legal requirements, Co-manager priorities and general principles for hatchery management are adapted to the unique genetic and ecological conditions of the Snohomish watershed. Hatchery programs operate in conjunction with harvest management, habitat restoration and protection to achieve near- and long-term goals for natural and hatchery production of salmonids in the Snohomish watershed (see HGMP section 3.4). In addition Comprehensive Coho Management Plan (CCMP), provides an overarching co-manager agreed to plan, which seeks to develop and implement improved coho management approaches that support the maintenance and restoration of wild stocks in a manner that reflects the regions fisheries objectives (resource protection, allocation, and harvest stabilization), production constraints, and production opportunities (PSTT and WDFW 1998).
3.2) List all existing cooperative agreements, memoranda of understanding, memoranda of agreement, or other management plans or court orders under which program operates. There is a considerable history of legal decisions, management plans, and MOU Agreements that have outlined the evolution of cooperative salmon enhancement programs between WDFW and the Tulalip Tribes dating back to the Boldt Decision in 1974. This hatchery program and all other Co-manager hatchery programs within the State of Washington, operate under U.S v Washington (1974). The legal basis for Co-management of salmon in Puget Sound is based on the Puget Sound Salmon Management Plan (PSSMP), developed by the Co-managers and adopted as an order of the Federal court in 1985. A series of state-tribal Hatchery MOU Agreements have been signed by the Co-managers dating back to 1997, 2003, 2005, and most recently, in 2012 (dated August 15, 2012 As Amended February 2013), which have set forth the understandings and agreements concerning Chinook and coho salmon programs of the Bernie Kai-Kai Gobin Salmon Hatchery, operated by the Tulalip Tribes, and the Wallace River Hatchery, operated by WDFW. These Agreements have included escapement, egg-take and release goals, identified the stocks to be used for artificial propagation, described the conditions for marking and tagging and specified other details of this joint state-tribal program which have added significant improvements in operating protocols and organization to both programs. See also HGMP section 3.1.
3.3) Relationship to harvest objectives. Tribal and non-Tribal commercial and recreational fisheries directed at salmon and steelhead produced through WDFW hatchery releases are managed to minimize incidental effects to listed Chinook salmon and steelhead. Compliance with the fisheries management strategy defined in the CCMP (PSTT and WDFW 1998) and the Co-managers’ Non-Chinook Resource Management Plan (RMP) for Puget Sound region non-Chinook salmon hatchery programs, leads to fisheries

Wallace River Hatchery Coho HGMP 24
on WDFW hatchery-origin stocks that are not likely to adversely affect listed Chinook, steelhead or listed summer chum. Each year state and tribal Co-managers plan and agree to a package of recreational and commercial salmon fisheries in consultation with Federal and Canadian fishery managers. These pre-season planning processes, known as the Pacific Fishery Management Council (PFMC), North of Falcon (NOF), and Pacific Salmon Commission (PSC) planning processes, involve a series of public meetings between domestic and international federal, state, tribal and industry representatives and other concerned citizens.
3.3.1) Describe fisheries benefitting from the program, and indicate harvest levels and rates for program-origin fish for the last twelve years, if available.
Table 3.3.1.1. Wallace River Hatchery Coho Fishery Contributions. Brood Years: 2001-2005 Fishery Years: 2003-2008
Average SAR% 5.97 Agency Non-WA Fishery % of total adult recruitment
ADFG All 0.1 CDFO All 3.0 NMFS All 0.0 ODFW All 0.7 Agency WA Fishery % of total adult recruitment WDFW 10- Ocean Troll 0.5 WDFW 15- Treaty Troll 2.3 QDNR 22- Coastal Gillnet 0.1 WDFW 23- PS Net 5.1 WDFW 41- Ocean Sport- Charter 1.2 WDFW 42- Ocean Sport- Private 2.5 WDFW 45- PS Sport 7.1 WDFW 46- Freshwater Sport 8.4 Unknown 50- Hatchery Escapement 5.4 WDFW 50- Hatchery Escapement 63.6 Total 100.0
Source: RMIS 2012. * Average SAR% = (tags recovered/tags released). ** Freshwater Sport based on WDFW Catch Record Card (CRC) data.
3.4) Relationship to habitat protection and recovery strategies. The purpose of this joint state-tribal hatchery program is to provide harvest opportunity while remaining consistent with the Co-manager’s primary management strategy and recovery objectives for local natural salmonid populations as reflected in the integrated recovery plan. This HGMP was designed to be consistent with the strategies and actions specified in the Snohomish Basin Salmon Conservation Plan (Snohomish Basin Salmon Recovery Forum 2005 – see below). This plan describes how this hatchery program will operate in conjunction with harvest management, habitat restoration and habitat protection actions to achieve near- and long-term goals for natural and hatchery production of salmon in the Snohomish watershed. The habitat protection and restoration strategies and actions identified in the recovery plan are paramount to the recovery of self-sustaining, natural populations. As natural populations recover through habitat improvements to a level that can support sustainable treaty and non-treaty harvest needs, hatchery program size may be reduced. Additional management criteria such as genetic and ecological benefits and risks (e.g., marine-derived nutrients, prey, predation, and competition), to

Wallace River Hatchery Coho HGMP 25
the extent they have been determined; and environmental regulations, will be addressed as habitat and the production of natural-origin fish are being improved. Salmon Recovery Funding Board (SRFB): Created by the Legislature in 1999, the SRFB is composed of five citizens appointed by the Governor and five state agency directors. The Board provides grant funds to protect or restore salmon habitat and assist related activities. It works closely with local watershed groups known as lead entities and the Snohomish Basin Salmon Recovery Forum (see below). The Board supports salmon recovery by funding habitat protection and restoration projects and related programs that produce sustainable and measurable benefits for fish and their habitat. Lead Entities: (http://www.rco.wa.gov/salmon_recovery/lead_entities.shtml): The Snohomish Lead Entity is currently working to implement the watershed chapters to the salmon recovery plans formally adopted by NOAA fisheries in 2007. The Snohomish River Basin Salmon Conservation Plan (Plan 2005) is a multi-salmonid strategy that emphasizes two ESA-listed species. The Plan, developed by a 41-member Snohomish Basin Salmon Recovery Forum (the Forum), incorporates actions across habitat, harvest, and hatchery management to bring the listed natural populations back to healthy, harvestable levels. Among the many responsibilities held by lead entities, the Snohomish Lead Entity facilitates the annual SRFB grant round to fund habitat and protection actions. Fisheries Enhancement Task Force (RFEG): Several citizen based groups in conjunction with local governments, work on habitat actions to benefit both listed and non-listed stocks in the system including the Stilly-Snohomish Fisheries Enhancement Task Force. Snohomish Basin Salmon Recovery Forum. The Snohomish Public Works/ Surface Water Management Division works with citizens, stakeholders and agency representatives to lead recovery planning efforts in the Snohomish Watershed and co-leads efforts in the Stillaguamish Watershed with the Stillaguamish Tribe. Cooperative recovery planning efforts in the basin date back to the mid-1990s. The 41-member Snohomish River Basin Salmon Recovery Forum includes members from Snohomish and King Counties, Tulalip Tribes, 14 cities, many special purpose districts, and interest groups ranging from conservation to farming and business, and citizens. The group set the recovery priorities for the basin in the Snohomish River Basin Salmon Conservation Plan (2005). The Forum promotes and monitors Plan implementation and will adjust priorities over time. The Forum is also a place to coordinate and exchange ideas and communicate about watershed issues. It is assisted by a Policy Development Committee and the Snohomish Basin Salmonid Recovery Technical Committee. The Forum has actively participated in regional recovery efforts.
3.5) Ecological interactions. (1) Salmonid and non-salmonid fishes or other species that could negatively impact the program.
Negative impacts by fishes and other species from Wallace River Hatchery programs could occur directly through predation on hatchery-produced fish, or indirectly through food resource competition, genetic effects, or other ecological interactions. In particular, fishes and other species could negatively impact Wallace River Hatchery coho survival rates through predation on newly released, emigrating juvenile fish in freshwater, estuarine and marine areas. Certain avian and mammalian species may also prey on juvenile salmonids while the fish are rearing at the hatchery site, if these species are not excluded from the rearing areas. Species that could potentially negatively impact hatchery juveniles through predation include the following:
- Avian predators, including bald eagles, golden eagles, common mergansers, double crested cormorants, belted kingfishers, turkey vultures, ring-billed gulls, California gulls, herring gulls, western gulls, glaucous-winged gulls, American dippers, Stellar’s jays, American crows, northwestern crows, common ravens great blue herons, and night herons.

Wallace River Hatchery Coho HGMP 26
- Mammalian predators, including black bears, mink, Virginia opossums, coyotes, raccoons, bobcats, river and sea otters, harbor seals, northern Steller sea lions, orcas, and harbor and Dall’s porpoises.
- Cutthroat trout, rainbow trout, bull trout, coho, Chinook and pink salmon, steelhead, Pacific staghorn sculpin, northern pike minnow and numerous marine pelagic fish species.
Rearing and migrating juvenile and adult coho originating through the program may also serve as prey for large, mammalian predators in nearshore marine areas, the estuary and in freshwater areas downstream of the hatchery in the Snohomish River watershed to the detriment of population abundance and the program's success in augmenting harvest. Species that may negatively impact program fish through predation may include:
- Orcas - Sea lions - Harbor seals - River otters
(2) Salmonid and non-salmonid fishes or other species that could be negatively impacted by the program (focus is on listed and candidate salmonid species).
- Puget Sound Chinook - Puget Sound steelhead - Puget Sound bull trout
ESA-listed Chinook salmon from the Skykomish and Snoqualmie populations, steelhead from the Snohomish/Skykomish, Pilchuck, Snoqualmie, Tolt, and NF Skykomish populations, and bull trout may be adversely affected by hatchery-origin salmonids produced by the Wallace River Hatchery program. Juvenile fish of the these listed species may serve as prey for newly released hatchery salmon in areas where the species co-occur and if the listed juvenile fish are of a small size, and vulnerable to predation by yearling life stage coho. The hatchery fish may also affect the listed species through competition for any limited resources, including food and space for juvenile fish, and spawning areas for adult fish.
(3) Salmonid and non-salmonid fishes or other species that could positively impact the program. Fish species that could positively impact the program may include other salmonid species and trout present in the Skykomish River watershed through natural and hatchery production. Juvenile fish of these species may serve as prey items for hatchery-origin salmonids during their downstream migration in freshwater and into the marine area. Decaying carcasses of spawned adult fish may contribute nutrients that increase productivity in the watershed, providing food resources for emigrating fish. Salmonid adults that return to the Snohomish basin and any seeding efforts using adult salmon carcasses may provide a source of nutrients and stimulate stream productivity. Many watersheds in the Pacific Northwest appear to be nutrient-limited (Gregory et al. 1987; Kline et al. 1997) and salmonid carcasses can be an important source of marine derived nutrients (Levy 1997). Carcasses from returning adult salmon have been found to elevate stream productivity through several pathways, including: 1) the releases of nutrients from decaying carcasses has been observed to stimulate primary productivity (Wipfli et al. 1998); 2) the decaying carcasses have been found to enrich the food base of aquatic invertebrates (Mathisen et al. 1988); and 3) juvenile salmonids have been observed to feed directly on the carcasses (Bilby et al. 1996). Addition of nutrients has been observed to increase the production of salmonids (Slaney and Ward 1993; Slaney et al. 2003; Ward et al. 2003).
(4) Salmonid and non-salmonid fishes or other species that could be positively impacted by the program: This coho program positively impacts numerous terrestrial and aquatic species in freshwater, estuarine and marine habitats. The input of nutrients provided by decaying coho carcasses afforded by this program are particularly critical for sustaining stable fry and smolt

Wallace River Hatchery Coho HGMP 27
productivity levels or elevating juvenile productivity to healthy levels and is currently thought to be an important limiting factor in some of the basin’s watersheds. Coho carcasses planted for nutrient enhancement purposes (ongoing annually from Wallace River Hatchery) are an important source of organic and inorganic nutrients affecting water quality as well. This ocean-origin source of nutrient input is considered to be significantly beneficial to the ecosystem. The historical amounts of nutrients available to streams in the Snohomish basin derived from salmon carcasses was likely large and contributed to the enhancement of many forms of aquatic life. This valuable, natural process of environmental nutrient recycling is expected to be increased through this program and contributes to local and regional salmon recovery efforts; increasing annual abundances of local juvenile and adult natural- and hatchery-origin salmonid spawning populations and stocks in the region. All of the predator species previously mentioned benefit from the program fish released from this program. As many as 138 species of birds are either directly connected to feeding on salmon carcasses or indirectly connected to either feeding on the insects that feed on the carcasses or on other birds that feed on the insects or carcasses. Juvenile salmonids may also benefit from the enhanced numbers of salmon carcasses that are provided by this program through increased spawning from improved fish returns. The additional input of nutrients from the carcasses made available to these organisms as a nutrient source through this program increases both nutrients available for the growth of fish as well as riparian and upland vegetation as well.
SECTION 4. WATER SOURCE 4.1) Provide a quantitative and narrative description of the water source (spring, well,
surface), water quality profile, and natural limitations to production attributable to the water source. Table 4.1.1. Water source available at Wallace River Hatchery.
Water Source Available
Water Flow (gpm)
Temp. (ºF) Usage Limitations
Wallace River (surface)
12,000 34-66 Broodstock collection, incubation, rearing, acclimation
No limitation
May Creek (surface)
5,800 34-66 Broodstock collection, incubation, rearing
No limitation
Water for incubation and rearing at Wallace River Hatchery comes from two sources: Wallace River and May Creek. Both are surface water in origin and exhibit similar temperature profiles ranging from mid-30s°F to the upper 60s°F. These streams are subject to rapid fluctuations in flow; especially during fall and winter seasons when high levels of precipitation commonly cause flooding events. Water for the hatchery is pumped: the Wallace River can provide as much as 12,000 gallons per minute (gpm); May Creek provides up to 800 gpm. Water rights for Wallace River Hatchery are regulated through permits #S1-00109 and #S1-05617 for the Wallace River and May Creek intakes, respectively. Monitoring and reporting of effluent discharge results have been in compliance with NPDES permit number WAG 13-3006 (see HGMP section 4.2).
4.2) Indicate risk aversion measures that will be applied to minimize the likelihood for the take of listed natural fish as a result of hatchery water withdrawal, screening, or effluent discharge. The intake screens on the Wallace River and May Creek are in compliance with state and federal guidelines (NMFS 1995, 1996), but do not meet the current Anadromous Salmonid Passage Facility Design criteria (NMFS 2011). The Wallace River Hatchery is currently scheduled for a facility remodel that will address any deficiencies in the intake structure. WFDW has identified
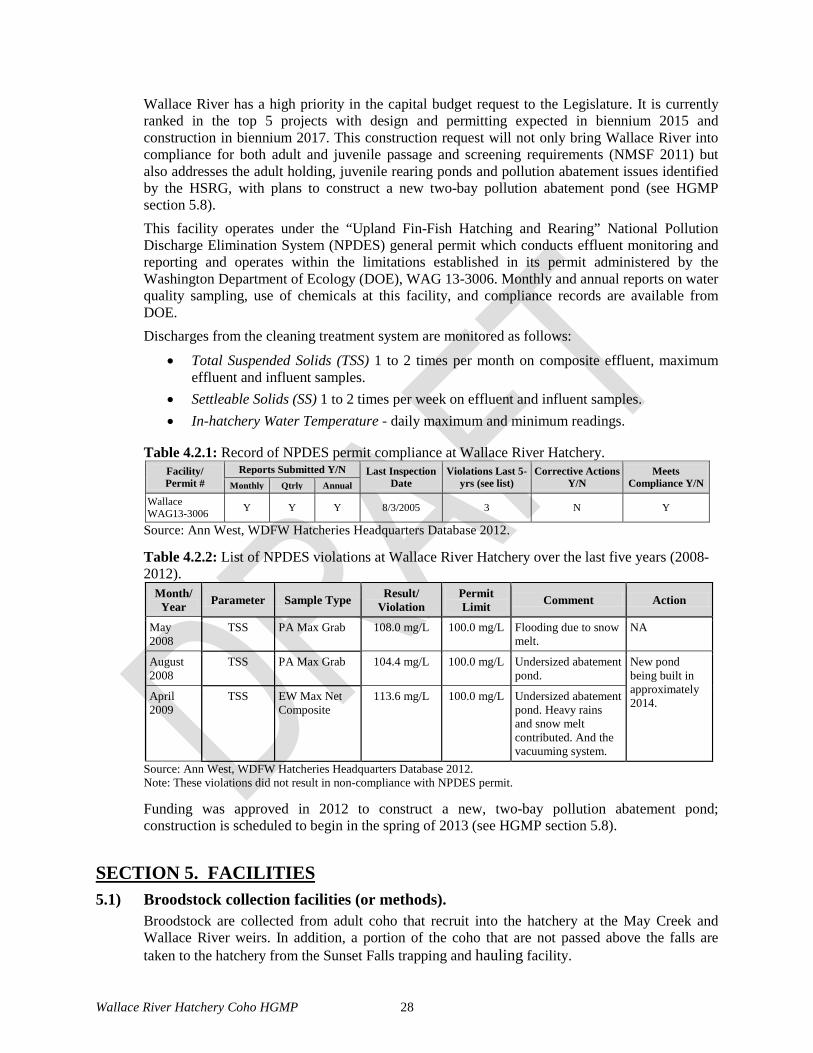
Wallace River Hatchery Coho HGMP 28
Wallace River has a high priority in the capital budget request to the Legislature. It is currently ranked in the top 5 projects with design and permitting expected in biennium 2015 and construction in biennium 2017. This construction request will not only bring Wallace River into compliance for both adult and juvenile passage and screening requirements (NMSF 2011) but also addresses the adult holding, juvenile rearing ponds and pollution abatement issues identified by the HSRG, with plans to construct a new two-bay pollution abatement pond (see HGMP section 5.8). This facility operates under the “Upland Fin-Fish Hatching and Rearing” National Pollution Discharge Elimination System (NPDES) general permit which conducts effluent monitoring and reporting and operates within the limitations established in its permit administered by the Washington Department of Ecology (DOE), WAG 13-3006. Monthly and annual reports on water quality sampling, use of chemicals at this facility, and compliance records are available from DOE. Discharges from the cleaning treatment system are monitored as follows:
• Total Suspended Solids (TSS) 1 to 2 times per month on composite effluent, maximum effluent and influent samples.
• Settleable Solids (SS) 1 to 2 times per week on effluent and influent samples. • In-hatchery Water Temperature - daily maximum and minimum readings.
Table 4.2.1: Record of NPDES permit compliance at Wallace River Hatchery. Facility/ Permit #
Reports Submitted Y/N Last Inspection Date
Violations Last 5-yrs (see list)
Corrective Actions Y/N
Meets Compliance Y/N Monthly Qtrly Annual
Wallace WAG13-3006 Y Y Y 8/3/2005 3 N Y
Source: Ann West, WDFW Hatcheries Headquarters Database 2012.
Table 4.2.2: List of NPDES violations at Wallace River Hatchery over the last five years (2008-2012).
Month/ Year Parameter Sample Type Result/
Violation Permit Limit Comment Action
May 2008
TSS PA Max Grab 108.0 mg/L 100.0 mg/L Flooding due to snow melt.
NA
August 2008
TSS PA Max Grab 104.4 mg/L 100.0 mg/L Undersized abatement pond.
New pond being built in approximately 2014. April
2009 TSS EW Max Net
Composite 113.6 mg/L 100.0 mg/L Undersized abatement
pond. Heavy rains and snow melt contributed. And the vacuuming system.
Source: Ann West, WDFW Hatcheries Headquarters Database 2012. Note: These violations did not result in non-compliance with NPDES permit.
Funding was approved in 2012 to construct a new, two-bay pollution abatement pond; construction is scheduled to begin in the spring of 2013 (see HGMP section 5.8).
SECTION 5. FACILITIES 5.1) Broodstock collection facilities (or methods).
Broodstock are collected from adult coho that recruit into the hatchery at the May Creek and Wallace River weirs. In addition, a portion of the coho that are not passed above the falls are taken to the hatchery from the Sunset Falls trapping and hauling facility.

Wallace River Hatchery Coho HGMP 29
1. May Creek: An in-stream trap located on May Creek measures 70-ft at its widest point, and is 110-ft long. Two step-type ladders are located on the lower end of the trap and a picket-type rack and V-notch weir are located at the upper end of the pond. The trap is dependent on the natural flow of May Creek for its water supply. The trap is operated annually from June through March. The May Creek weir is operated annually from June through November; however, the May Creek trap will be eliminated after construction of a barrier at the mouth of May Creek and three new adult holding ponds (see HGMP section 5.8).
2. Wallace River: A weir, installed annually across the Wallace River during the first week in June, diverts returning fish into a ladder leading up from the Wallace River to a series of three adult holding ponds supplied by surface water pumped from the river. The weir is removed every year around October 1, to avoid damage to the structure from seasonal flooding. All fish captured in the fall after weir-removal are volunteers to the hatchery ladder, which remains open through March. Captured adults can be passed directly from the holding ponds though the series of pipes, for natural spawning above the weir.
3. Sunset Falls: The Sunset Falls trapping and hauling facility is located on the South Fork Skykomish River. The facility was built in 1958 to collect fish for release 3.5 miles upstream above three falls, which are natural anadromous migration barriers, into more than 90 miles of quality spawning and rearing habitat (Shared Strategy 2005). The facility is operated annually, from July through December, during the adult salmon return migration period. Fish volunteer up the ladder into a holding area containing a hopper. Fish allowed into the hopper are moved to a truck and transported above the falls. A portion of these fish are collected for integration into the hatchery broodstock and transported to the hatchery (see HGMP section 7.4.2).
5.2) Fish transportation equipment (description of pen, tank truck, or container used). There is a 1,000-gallon tanker truck, equipped with aerators and oxygen tanks, available at the hatchery for transportation needs. Fish from the Sunset Falls trap are transported in a similar tanker truck.
5.3) Broodstock holding and spawning facilities.
Coho broodstock are held in the three adult capture ponds until spawning. Spawning facilities are located at the ends of these ponds. Table 5.3.1. Broodstock holding and spawning facilities at Wallace River Hatchery.
Rearing Vessel Type Number Width (ft) Length (ft) Depth (ft) Volume (ft3) Circular ponds 4 16 16 4.5 1,152
Adult Ponds 3 15 100 5.0 7,500
May Creek in-river pond 1 70 110 3.5 26,950
Wallace River: Adult coho returning to the hatchery from Wallace River are held in two out of three parallel adult ponds supplied with Wallace River water and equipped with water sprinklers. Adult coho transferred from the Sunset Falls facility are held in the third adult pond. Spawning takes place in a covered area located at the end of the ponds. May Creek Trap: Adult coho returning to the May Creek trap are held in the in-river pond through spawning. Spawning takes place at the pond side in a covered area. The May Creek trap will be eliminated after construction of a barrier at the mouth of May Creek and three new adult holding ponds (see HGMP section 5.8).
5.4) Incubation facilities. The incubation facility at Wallace River consists of "Heath"-style vertical incubators with 1,152 trays. Each incubator receives surface water supplied from May Creek at 4 gpm.

Wallace River Hatchery Coho HGMP 30
5.5) Rearing facilities. Table 5.5.1. Rearing vessels at Wallace River Hatchery.
Type Number Width (ft) Length (ft) Depth (in) Volume (ft3) Raceways 6 10 100 36 3,200 Standard ponds 4 20 80 20 5,800 Klubes pond 1 8 27 28 520 “Green Monster” 1 3 14 24 84 Rearing Channels a 3 28 1,000 37 42,000
a The three rearing channels can be sectioned off, as needed.
5.6) Acclimation/release facilities. Fish are acclimated on May Creek and/or Wallace River surface water their entire time in the hatchery.
5.7) Describe operational difficulties or disasters that led to significant fish mortality. No operational difficulties have led to significant fish loss.
5.8) Indicate available back-up systems, and risk aversion measures that will be applied, that minimize the likelihood for the take of listed natural fish that may result from equipment failure, water loss, flooding, disease transmission, or other events that could lead to injury or mortality. A hatchery employee is on stand-by at the hatchery at all times to monitor hatchery operations and respond to any unexpected events. The facility is equipped with low water alarms and a back-up generator in case of power loss. Fish rearing is conducted in compliance with the Salmonid Disease Control Policy of the Fisheries Co-Managers of Washington State (WDFW and WWTIT 1998, updated 2006) to minimize the likelihood for the take of listed natural fish that may result from disease transmission. Adherence to artificial propagation, sanitation and disease prevention, diagnosis, treatment and control practices defined in the policy prevent or reduce the incidence and intensity of disease during hatchery spawning, incubation and rearing. These methods control the transmission of infectious fish pathogens between hatchery- and natural-origin fish, as well as the potential to infect other natural-origin salmonids via the hatchery effluent or directly via horizontal (fish-to-fish) transmission, by preventing or reducing releases of infected hatchery fish. Several years of operation has demonstrated that trapping methods do not pose detrimental impacts to fish health. In 2012, the Legislature passed a jobs creation bill that provided WDFW with funding for hatchery capital improvements in addition to our capital budget request. At Wallace River Hatchery, this allowed for several capital improvements (Table 5.8.1). Table 5.8.1: Hatcheries capital improvement projects funded under the “Jobs Now Act” (2012).
Projects Purpose Construct new two-bay pollution abatement ponds.
Two-bay pollution abatement ponds will reduce the discharge of pollutants into the receiving waters that minimizes the likelihood for the take of listed natural fish by improving water quality below the hatchery
Build a barrier at the mouth of May Creek.
A barrier at the mouth of May Creek will prevent fish from entering May Creek and instead force them to continue moving up the Wallace River toward the trap. This would eliminate the adult trap on May Creek and the in-river adult holding pond, which is to be replaced with three new adult holding ponds.

Wallace River Hatchery Coho HGMP 31
SECTION 6. BROODSTOCK ORIGIN AND IDENTITY Describe the origin and identity of broodstock used in the program, its ESA-listing status, annual collection goals, and relationship to wild fish of the same species/population. 6.1) Source.
Adult coho salmon collected from Wallace River, May Creek and the Sunset Falls traps. Coho are not ESA-listed.
6.2) Supporting information. 6.2.1) History. The program was founded with wild coho trapped in the lower Snohomish basin. The hatchery stock has been maintained from fish returning to the Wallace River Hatchery since the early 1900s (HSRG 2002), and augmented with SF Skykomish natural-origin recruits returning to Sunset Falls since 2005.
6.2.2) Annual size. Approximately 3,462 viable spawners, or 1,731 spawning pairs are needed to provide the overall egg take of 4.5-million, which provides around 700,000 green eggs for the on-station (200,000) and regional net pen (500,000) releases; up to 2.1-million eggs for the Tulalip hatchery program; and around 2.0-million eggs for the South Sound and Squaxin Island net pen programs (Figure 6.2.2.1). The average total escapement needed to achieve the overall Wallace Hatchery coho egg-take goal of 4.5-million is a minimum escapement of 4,638 coho, given the average female sex ratio of 44.5%, survival rate to spawning of 83.9%, and fecundity of 2,599 (1995-2007 averages).
Figure 6.2.2.1. Coho egg collection and disposition at Wallace River Hatchery. Source: Equilibrium Brood Document (Tulalip Tribes) and Future Brood Document (WDFW) 2013.
Spawners Needed: 270 pairs*
Wallace River Hatchery Coho Egg Collection and Disposition
Marblemount Hatchery Transfer:
1.7-million (Passively Integrated)
Squaxin Island
Net Pens Transfer:
710,000
Tulalip Bay Release:
Up to 2.0-million
Peale Pass Release:
1.8-million
Spawners Needed: 654 pairs*
Spawners Needed: Up to 807 pairs*
On-station Program 200,000
Co- Ops, Schools, Net Pen Transfers
500,000
* “Spawners Needed” based on a female sex ratio of 44.5%, a survival-to-spawning rate of 83.9%, and an average fecundity of 2,599 (brood years 1995-2007).
305,000 810,000
South Sound Net Pens Transfer:
Bernie Kai-Kai Gobin Hatchery Transfer: Up to 2.0-million
(Passively Integrated)
On-Station Collection:
700,000 (Actively Integrated)
Skookumchuck Hatchery Transfer:
1.65-million
Various Releases (As listed in FBD, 2013)
Wallace River Release: 150,000

Wallace River Hatchery Coho HGMP 32
6.2.3) Past and proposed level of natural fish in broodstock. Levels of natural-origin fish included in the broodstock cannot be fully determined prior to brood year 2004 due to releases of unmarked coho from Wallace River Hatchery. All (100%) of the Snohomish regional hatchery coho production has been identifiable since brood year 2004, through a combination of adipose fin-clips, thermal (otolith) marks and CWTs: 100% adipose fin-clipping at Wallace since brood year 2004 (less the DIT group), and at Tulalip (since brood year 2009), 100% thermal (otolith) mass-marking at Tulalip since 2004, with thermal-marking potential at Wallace River Hatchery being currently evaluated, and representative coded-wire tagging in both programs for more than 12 years. See Table 7.4.2.1 for the numbers of natural–origin fish included in the broodstock for years 2000-2012. A total of 4.5-million coho salmon eggs are collected annually at Wallace River Hatchery. Of these, 3.8-million are passively-integrated with natural-origin fish in the broodstock, while the remaining 700,000 are actively-integrated (see HGMP section 6.2.2). While the 3.7-million eggs spawned for the Tulalip Hatchery program (up to 2.0 million) and the South Sound and Squaxin Island net pen programs (1.7-million) are largely comprised of marked and tagged Wallace River Hatchery-origin broodstock (HOB), they are considered to be integrated one generation out because all marked and tagged Wallace River Hatchery coho are integrated the previous generation; their marked/tagged progeny are used for broodstock for these programs. Because of the structure and size of both of these off station programs, and the abundance and health of the natural population, a small number of natural-origin fish may be included into these egg-takes, which is why they are considered “passively-integrated”. Assuming average fecundity of 2,599, ~540 viable spawners (270 spawning pairs at a 1:1 spawning ratio) are needed to produce the ~700,000 fertilized green eggs needed for the integrated regional releases as explained in HGMP section 6.2.2. Return proportions of both Sunset Falls and Wallace River coho runs were averaged over time, and a collection of 500 natural-origin fish will be distributed proportionally over roughly 85% of both return locations. This is to ensure that an effective population size of NOB are incorporated representatively from the entire return timing; a goal of 500 natural-origin coho will be collected over an eight-week period and incorporated into a total of only 540 (92.6%) total spawners needed annually for the regional actively integrated releases. While there are no demographic-based PNI (PNID) or pHOS (pHOSD) goals and pHOSD cannot currently be accurately estimated in the vast Snohomish basin where escapements regularly exceed 100,000 in more than 1,300 miles of anadromous fish-bearing habitat, Kraemer (personal communication 2013) previously estimated coho pHOSD at the Sunset Falls fish trap to be roughly 1%, based on scale pattern analysis of approximately 1,000 SF Skykomish coho salmon. In other natural coho spawner sampling, beginning in the Wallace River and moving outward to other areas within the Skykomish River basin, Kraemer (personal communication 2013) observed that the proportion of hatchery-origin spawners decreased rapidly as sampling progressed outside of the Wallace River, suggesting that straying is localized to the return stream of origin and is overshadowed by the relatively large natural-origin spawning population (the 20-year average Snohomish Coho escapement exceeds 110,000 with two escapements exceeding 250,000). Given the realized pNOBD of 92.6% and the rough pHOSD estimate of 1%, PNID was conservatively estimated assuming an actual pHOSD ranging from 1.0 to 10% (Tables 6.2.3.1 and 6.2.3.2), which yields realized demographic PNIs estimated to range from 0.90 to 0.99 since integration was initiated in 2005. Only 270 pairs or 540 total spawners are required (at 2,599 average fecundity) to achieve the 700,000 eggtake for the integrated releases. Of these 540 spawners, it was estimated that only 6-56 NOB would be required to exceed a PNID of 0.5 assuming pHOSD ranges from 1 to 10%. However, the numbers of coho integrated (500), and the schedule for NOB collections, was configured taking into consideration concerns over genetic effective population size and run timing.
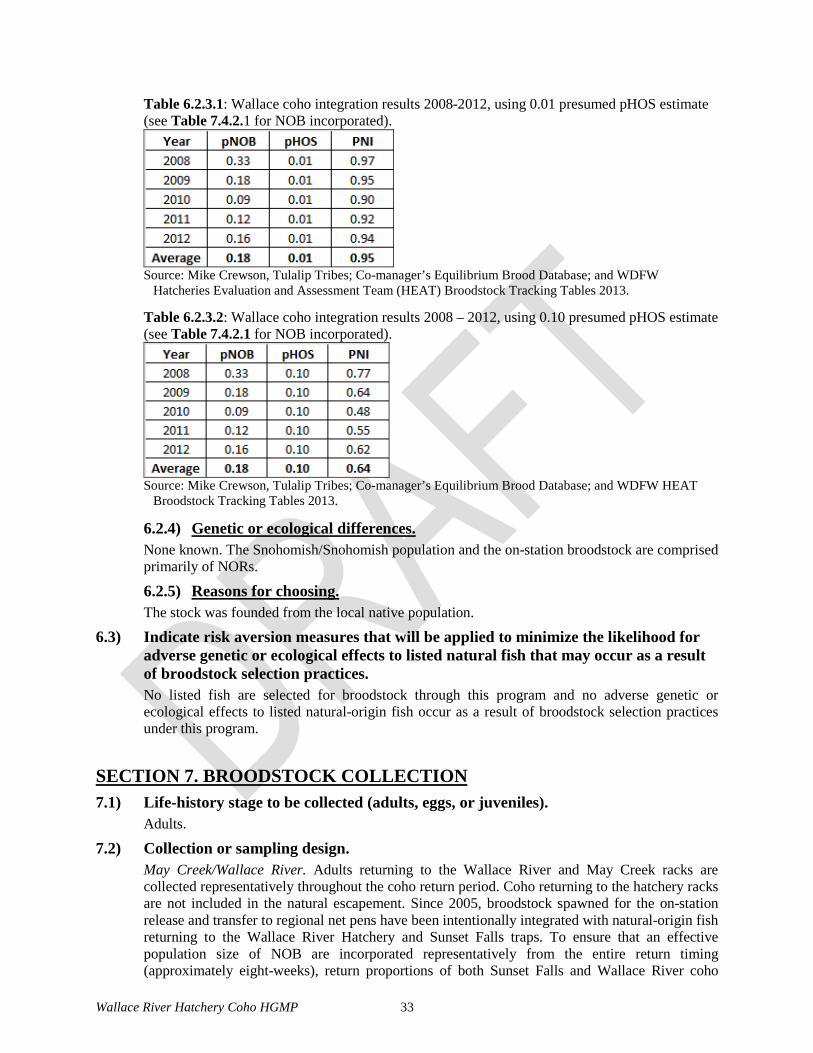
Wallace River Hatchery Coho HGMP 33
Table 6.2.3.1: Wallace coho integration results 2008-2012, using 0.01 presumed pHOS estimate (see Table 7.4.2.1 for NOB incorporated).
Source: Mike Crewson, Tulalip Tribes; Co-manager’s Equilibrium Brood Database; and WDFW
Hatcheries Evaluation and Assessment Team (HEAT) Broodstock Tracking Tables 2013.
Table 6.2.3.2: Wallace coho integration results 2008 – 2012, using 0.10 presumed pHOS estimate (see Table 7.4.2.1 for NOB incorporated).
Source: Mike Crewson, Tulalip Tribes; Co-manager’s Equilibrium Brood Database; and WDFW HEAT
Broodstock Tracking Tables 2013.
6.2.4) Genetic or ecological differences. None known. The Snohomish/Snohomish population and the on-station broodstock are comprised primarily of NORs.
6.2.5) Reasons for choosing. The stock was founded from the local native population.
6.3) Indicate risk aversion measures that will be applied to minimize the likelihood for adverse genetic or ecological effects to listed natural fish that may occur as a result of broodstock selection practices. No listed fish are selected for broodstock through this program and no adverse genetic or ecological effects to listed natural-origin fish occur as a result of broodstock selection practices under this program.
SECTION 7. BROODSTOCK COLLECTION 7.1) Life-history stage to be collected (adults, eggs, or juveniles).
Adults.
7.2) Collection or sampling design. May Creek/Wallace River. Adults returning to the Wallace River and May Creek racks are collected representatively throughout the coho return period. Coho returning to the hatchery racks are not included in the natural escapement. Since 2005, broodstock spawned for the on-station release and transfer to regional net pens have been intentionally integrated with natural-origin fish returning to the Wallace River Hatchery and Sunset Falls traps. To ensure that an effective population size of NOB are incorporated representatively from the entire return timing (approximately eight-weeks), return proportions of both Sunset Falls and Wallace River coho

Wallace River Hatchery Coho HGMP 34
runs were averaged over a series of years to determine that a collection of 500 natural-origin fish should be distributed proportionally over roughly 85% of both returns to be incorporated into a total of 540 total spawners (92.6%) (see HGMP section 6.2.3). Sunset Falls. The Sunset Falls trap-and-haul fishway was identified as an ideal and appropriate source for natural-origin SF Skykomish coho salmon that could be included in the hatchery broodstock. The hatchery stock was founded from native Skykomish coho trapped in the lower Snohomish Basin, has been maintained from fish returning to the Wallace River Hatchery since the early 1900s, and augmented with SF Skykomish natural-origin recruits returning to Sunset Falls since 2005 (see HGMP sections 5.1 and 6.2.3 for collection procedures). The trapping facility at Sunset Falls operates annually from July through December (see HGMP sections 2.2.3 and 5.1 for more information regarding Sunset Falls).
7.3) Identity. All (100%) of the Snohomish regional hatchery coho production has been identifiable since broodyear 2004, through a combination adipose fin clips, otolith thermal marks and CWTs: 100% adipose fin clipping at Wallace since BY2004 (less DIT group) and at Tulalip (since BY2009), thermal otolith mass-marking (100% at Tulalip since 2004, with thermal marking possibility being currently evaluated at Wallace River Hatchery), and coded-wire tagging (representative groups in both programs for more than 12 years). All coho released from the Wallace River Hatchery program have been consistently marked since broodyear 2004 (EBD database). Wallace River Hatchery coho are currently ~30% AD+CWT, ~30% CWT-Only (DIT group), and the remainder (~40%) are AD-Only.
7.4) Proposed number to be collected: 7.4.1) Program goal (assuming 1:1 sex ratio for adults): A total of ~3,462 viable spawners are needed to provide the overall egg take of 4.5-million given an average fecundity of 2,599 (brood years 1995-2007). The average total escapement needed to achieve the above egg take is 4,638 coho, given the average female sex ratio of 44.5% and survival rate to spawning of 83.9%. See also HGMP section 6.2.2.
7.4.2) Broodstock collection levels for the last twelve years or for the most recent years available:
Table 7.4.2.1. Fish origin and sex composition of broodstock spawned at Wallace River Hatchery for coho program.
Brood Year Hatchery Natural
Male Female Jack Male Female Jack 2000 1,523 1,517 9 70 44 0
2001 873 1,195 1 0 0 0
2002 1,533 1,526 3 105 128 0
2003 1,033 1,032 0 69 62 0
2004 647 754 0 598 609 0
2005 792 1,002 0 561 651 0
2006 683 819 0 691 599 0
2007 1,090 1,293 1 148 182 1
2008 598 981 2 451 320 0
2009 792 1,096 0 254 164 0
2010 1,149 1,431 20 172 87 0
2011 1,152 1,266 2 214 121 0

Wallace River Hatchery Coho HGMP 35
2012 1,200 1,191 0 229 238 0
Average 1,005 1,162 3 274 247 0 Source: EBD Database 2012, WDFW Hatcheries Headquarters Database 2012.
See Tables 6.2.3.1 and 6.2.3.2 for integration rates using the pHOS range 0.01 – 0.10.
7.5) Disposition of hatchery-origin fish collected in surplus of broodstock needs. Working with the Tulalip Tribes, and in accordance with the report to the Natural Resource Committees of the Washington State Legislature pursuant to ESSB 6444 Section 307 subsection 18, “Recommendations Regarding the Utilization of Hatchery Returns of Salmon in Excess of Hatchery Production Goals”, surplus Wallace River Hatchery coho are distributed according to best use of this comanaged resource. Best use includes distribution, in no particular order, to the Tulalip Tribes for ceremonial and subsistence purposes, to rivers to provide marine derived nutrients, sale to a salmon processor to generate revenue for the Regional Fisheries Enhancement Group (RCW 77.95.060), and donation to food banks to meet high quality protein needs to economically depressed people. Disposition of surplus carcasses, both spawned and unspawned, will follow the Disease Control Policy.
7.6) Fish transportation and holding methods. Sunset Falls trap. Adult coho collected at the Sunset Falls trap throughout the return are taken for Wallace River Hatchery broodstock, and transported to Wallace River Hatchery in 1,000-gallon tanks in a fish-hauling truck equipped with aerators and oxygen tanks. The trip lasts around half an hour. Wallace Hatchery. Adult coho returning to the hatchery from Wallace River or collected at the Sunset Fall trap are held in two parallel 15'x100'x60'' holding ponds supplied with Wallace River surface water. May Creek trap. Adults returning to May Creek are held in the in-river trap. This will be discontinued with the construction of a barrier across the mouth of May Creek and three new adult holding ponds.
7.7) Describe fish health maintenance and sanitation procedures applied. The program adheres to standard fish health protocols, as defined in the Salmonid Disease Control Policy of the Fisheries Co-Managers of Washington State (WDFW and WWTIT 1998, updated 2006).
7.8) Disposition of carcasses Spawned and un-spawned carcasses will be disposed in accordance to HGMP section 7.5.
7.9) Indicate risk aversion measures that will be applied to minimize the likelihood for adverse genetic or ecological effects to listed natural fish resulting from the broodstock collection program. No listed fish are collected for broodstock through this program. Puget Sound coho are not ESA-listed. The coho broodstock collection timeframe may overlap with late-returning, natural-origin Chinook and migrating steelhead. However, by the time that adult coho recruit into the rack, the weir has typically been removed and the fish are not forced to enter the hatchery but volunteer to the ladder. After Chinook broodstocking is concluded for the year, any natural-origin volunteers to the hatchery are returned unharmed to the river. The ladder remains open annually until March 15, to facilitate the removal of hatchery-origin steelhead, which can increase the potential for encounters with natural-origin steelhead. However, NOR steelhead do not recruit into the hatchery in large numbers.

Wallace River Hatchery Coho HGMP 36
SECTION 8. MATING Describe fish mating procedures that will be used, including those applied to meet performance indicators identified previously. 8.1) Selection method.
Coho used for broodstock are selected randomly and representatively across the entire return timing. Up to 500 natural-origin fish are integrated into the broodstock for on-station and regional net pen production, which are distributed proportionally over roughly 85% of both the Wallace River and Sunset Falls returns to ensure that an effective population size of NOB are incorporated representatively from the entire return timing (see HGMP sections 6.2.3 and 7.2). Broodstock that provides gametes for off-station releases other than the regional net pen programs are also selected randomly as they ripen across the entire maturation time frame from hatchery-origin fish that are integrated at least one generation out. From the representative population collected throughout the natural population’s return timing, the proportion of ripe fish encountered (of the total estimated to be available for spawning) applied to the total egg take goal is used to determine the egg take for the day so that the gametes collected over the spawning period represent the maturation timing, as well as the return timing.
8.2) Males. All males collected, including jacks, are considered for spawning and chosen randomly and representatively on any spawning day. Jacks are used at a rate of 2% of spawned males.
8.3) Fertilization. Eggs pooled from five females are equally distributed into five buckets and fertilized with milt from one male (matrix spawning). After 60 seconds of fertilization time, eggs are combined into one bucket. The eggs are then placed in vertical incubator trays and water-hardened for one hour in an iodophor solution of 100 ppm.
8.4) Cryopreserved gametes. Cryopreserved gametes are not used.
8.5) Indicate risk aversion measures that will be applied to minimize the likelihood for adverse genetic or ecological effects to listed natural fish resulting from the mating scheme. No listed fish are included in the mating scheme for this program. Puget Sound coho are not ESA listed.
SECTION 9. INCUBATION AND REARING - Specify any management goals (e.g. “egg to smolt survival”) that the hatchery is currently operating under for the hatchery stock in the appropriate sections below. Provide data on the success of meeting the desired hatchery goals. 9.1) Incubation:
The current coho egg-take goal at Wallace River Hatchery is 4,500,000; this includes eggs collected for various programs as listed in HGMP section 1.11.2.

Wallace River Hatchery Coho HGMP 37
9.1.1) Number of eggs taken and survival rates to eye-up and/or ponding. Table 9.1.1.1. Survival rates from egg-take to ponding, Wallace River Hatchery coho, 2001-2011.
Brood Year Eggs Collected Survival Rates (%)
Green-to-Eyed Egg Eyed Egg-to-Fry 2001 3,470,000 96.34 78.79 2002 4,945,000 90.15 91.32 2003 3,495,354 91.83 86.00 2004 4,422,000 NA NA 2005 4,544,800 95.27 84.78 2006 4,329,916 92.52 94.25 2007 4,461,454 87.03 92.88 2008 4,434,645 95.02 94.60 2009 4,418,829 88.74 78.33 2010 5,200,390 96.99 88.39 2011 4,332,080 94.05 94.02
Average 4,368,588 92.80 88.34 Source: Equilibrium Brood Database 2012, WDFW Hatchery Records 2012.
9.1.2) Cause for, and disposition of surplus egg takes. The egg take goal provides only the sufficient number of eggs to meet the needs for the program purposes identified in HGMP section 1.11.2. The full on-station green egg-take goal (200,000) and the minimum green egg transfer goal to the Tulalip hatchery program (1.6-million) must be achieved before additional coho eggs are transferred to other hatchery programs. The egg transfer and release levels to the Tulalip hatchery program may be increased when surplus to production needs, as described in Table 1.11.2.2 and by agreement of the Co-managers (Tulalip and WDFW 2012). The Co-manager-agreed, proposed annual coho salmon production level under ESA evaluation by NOAA Fisheries for effects on ESA-listed fish for the Tulalip hatchery program is a release of up to 2.0-million yearling smolts. If hatchery losses exceed the minimum levels needed to meet the program goals described in Table 1.11.2.2, then program goals for off-station transfers are not met.
9.1.3) Loading densities applied during incubation. Eggs are placed in vertical incubators at around 9,000 per tray.
9.1.4) Incubation conditions. All eggs are incubated in trays supplied with May Creek water at a flow rate of 4 gpm per incubator stack. The temperature of inflowing water is monitored and recorded daily. Dissolved oxygen is checked when needed. Vexar® layers are placed in the trays to provide substrate. The use of surface water causes silt problems. Excess amounts of silt is removed by “rodding” the trays and brushing the tray screens. This requires constant attention during flooding events. The Tulalip Tribes and Marblemount Hatchery personnel pick up gametes and conduct fertilization followed by rearing at their respective hatcheries.
9.1.5) Ponding. When 95%+ button-up occurs (April), swim-up fry are moved from the trays into 10'x100'x3' raceways or 20'x80'x1.7'' standard ponds and reared on May Creek surface water or a mix of May Creek and Wallace River surface waters.

Wallace River Hatchery Coho HGMP 38
9.1.6) Fish health maintenance and monitoring. All fertilized eggs are water-hardened in an iodophor solution. Opportunistic fungus that grows on dead eggs in the incubators is controlled by formalin drip treatments (15-minutes per day at a target dose of 1,667-ppm formalin) throughout incubation to just prior to hatching. Once eyed, eggs are shocked and dead eggs are removed. Eyed-egg to ponded-fry loss is picked at the time of ponding, and then fry mortalities are removed daily afterward.
9.1.7) Indicate risk aversion measures that will be applied to minimize the likelihood for adverse genetic and ecological effects to listed fish during incubation.
Coho eggs retained in the vertical incubator stacks are held at relatively low loading densities. Mortality due to fungal infection is controlled and water temperatures and dissolved oxygen levels are monitored. Silt deposition is closely monitored and removed as needed. All water systems are connected to 24-hr/day low water alarms and an emergency backup generator.
9.2) Rearing: 9.2.1) Provide survival rate data (average program performance) by hatchery life
stage (fry to fingerling; fingerling to smolt) for the most recent twelve years (1988-99), or for years dependable data are available.
Table 9.2.1.1. Fry-to-smolt coho survival at Wallace River Hatchery.
Brood Year Survival Rates (%)
Fry-to-Fingerling Fingerling-to-Smolt 2001 79.76 21.44 2002 73.69 69.53 2003 95.95 48.28 2004 73.38 52.19 2005 99.96 35.35 2006 96.75 62.38 2007 99.00 56.93 2008 98.72 54.10 2009 100.00 50.41 2010 96.63 72.82 2011 96.77 Not yet available
Average 91.40 52.34 Source: Equilibrium Brood Database 2012, WDFW Hatchery Records 2012.
9.2.2) Density and loading criteria (goals and actual levels). Loading and density levels at WDFW hatcheries conform to standards and guidelines set forth in Fish Hatchery Management (Piper et. al. 1982) and the Salmonid Disease Control Policy of the Fisheries Co-Managers of Washington State (WDFW and WWTIT 1998, updated 2006). Maximum fish rearing densities are maintained at a density that is less than 3 lbs of fish /gpm at release and under 0.35lbs /cu3 of flow until they have reached a size of 100 fpp.
9.2.3) Fish rearing conditions When fish reach 400 fpp (May to June), they are transferred to rearing channels, supplied with Wallace River surface water. In November and December annually, when fish have attained a size of ~30 fpp, fish are adipose fin-marked and coded-wire tagged and kept separated based on the types of mark imparted. Fish allocated for transfer to net pens are mass adipose fin-marked

Wallace River Hatchery Coho HGMP 39
only. In February, when fish reach 25 fpp, two groups of 305,000 and 20,000 juveniles, are transferred to South Sound and the Everett Steelhead and Salmon Club net pen programs, respectively. Fish are transported to the Everett net pen in a 1000-gallon tanker truck under oxygen. Transportation time is around one hour. Fish are shipped to South Sound net pens using various sizes of fish hauling tanker trucks available at WDFW. Transportation time is around three hours. After the adult capture season ends (March), yearling coho remaining on-station are moved to the adult ponds, supplied with Wallace River surface water, where they are held until their release in May the following spring. The goal size at the release for Wallace River yearling coho is 17 fpp. Table 9.2.3.1. Average surface water temperature (°F), by month, in May Creek.
Month May Creek Average Water Temperature (ºF)
January 42 February 44 March 45 April 46 May 48 June 51 July 57 August 59 September 55 October 52 November 45 December 43
Source: Wallace River Hatchery Records 2012.
9.2.4) Indicate biweekly or monthly fish growth information (average program performance), including length, weight, and condition factor data collected during rearing, if available.
Table 9.2.4.1. Average size (fpp), by month, of juvenile coho reared at Wallace River Hatchery. Month Average Size (fpp)
April 1,000 May 450 June 250 July 125 August 85 September 45 October 30 November 28 December 27 January 26 February 25 March 22 April 20 May 17
Source: Wallace River Hatchery Records 2012.

Wallace River Hatchery Coho HGMP 40
9.2.5) Indicate monthly fish growth rate and energy reserve data (average program performance), if available.
Not available.
9.2.6) Indicate food type used, daily application schedule, feeding rate range (e.g. % B.W./day and lbs/gpm inflow), and estimates of total food conversion efficiency during rearing (average program performance).
Coho are fed a variety of diet formulations including starter, crumbles and pellets. The food brand used may vary, depending on cost and vendor contacts. Feeding frequencies vary depending on fish size and water temperature and usually begin with eight feedings/day, seven days/week, and end at two to three feedings/day, five days/week. Feeding rates vary from 1.0% to 3.0% body weight/day. The overall feed conversion ratio (feed fed/weight gained) for the season is approximately 1.1 to 1.2:1.
9.2.7) Fish health monitoring, disease treatment, and sanitation procedures. Fish health is monitored on a daily basis by hatchery staff and at least monthly by a state Fish Health Specialist (FHS). Hatchery personnel carry out treatments prescribed by the FHS. Procedures are consistent with the Salmonid Disease Control Policy of the Fisheries Co-Managers of Washington State (WDFW and WWTIT 1998, Revised July 2006).
9.2.8) Smolt development indices (e.g. gill ATPase activity), if applicable. The migratory state of yearling coho prior to release is determined by fish behavior and appearance. Aggressive screen and intake crowding, leaner condition factors, a more silvery physical appearance, and loose scales, which are particularly noticeable during feeding events, are signs of smolt development. Gill ATPase activity is not measured.
9.2.9) Indicate the use of "natural" rearing methods as applied in the program. No "NATURES" type rearing methods are applied through the program.
9.2.10) Indicate risk aversion measures that will be applied to minimize the likelihood for adverse genetic and ecological effects to listed fish under propagation.
No listed fish are under propagation through this program. Puget Sound coho are not ESA-listed.
SECTION 10. RELEASE Describe fish release levels, and release practices applied through the hatchery program. 10.1) Proposed fish release levels.
Table 10.1.1: Proposed number, size, date of release, and watershed of program releases. Age Class Maximum Number Size (fpp) Release Date Location
Yearling 150,000 17 May Snohomish River Source: Equilibrium Brood Document (2012); Future Brood Document (2012). Note: 17 fpp = ~140 mm fork length (fl)
The release level for this program was decreased from 300,000 to 500,000 in 2001. Other eggs and fish transported for the other programs are released as described in those plans.
10.2) Specific location(s) of proposed release(s). Stream, river, or watercourse: Wallace River (07.0940) Release point: RM 4.0 (Wallace River Hatchery) Major watershed: Snohomish River

Wallace River Hatchery Coho HGMP 41
Basin or Region: Puget Sound
10.3) Actual numbers and sizes of fish released by age class through the program. Table 10.3.1. Actual number, size and dates of on-station releases, Wallace River Hatchery coho, 2000-2012.
Release Year Yearling Avg. size (fpp) CV Date(s) 2000 373,045 19 6.5 5/2 2001 155,345 18 6.2 5/1 2002 149,334 17 7.0 5/3 2003 142,765 18 6.1 5/6 2004 154,500 18 5.9 5/3 2005 154,500 19 5.5 5/1-3 2006 167,000 23 7.0 5/1 2007 152,266 20 7.2 5/1 2008 151,000 21 7.4 5/1-3 2009 152,005 21 6.2 5/18-20 2010 140,000 17 5.8 5/1-3 2011 141,000 19 6.9 5/1-2 2012 155,000 20 6.5 5/1
Average 169,438 19 6.5 Source: EBD Database 2012, WDFW Hatcheries Headquarters Database 2012. Note: 17 fpp = ~140 mm fork length (fl); 20 fpp = ~133 mm fl.
10.4) Actual dates of release and description of release protocols. Coho at Wallace River Hatchery are released on-station directly into the Wallace River. Releases began in early-May; pond screens are pulled for a forced release. After several days, fish remaining in the pond are seined out. See Table 10.3.1 for actual release dates.
10.5) Fish transportation procedures, if applicable. Not applicable. Fish destined for on-station program at the Wallace River Hatchery are released on-station.
10.6) Acclimation procedures (methods applied and length of time). All coho are reared and acclimated on Wallace River/May Creek surface water prior to release.
10.7) Marks applied, and proportions of the total hatchery population marked, to identify hatchery adults. Table 10.7.1. Number released, by mark type and age, Wallace River Hatchery on-station coho program.
Brood Year Yearlings Marking
2012 60,000 AD only 45,000 AD+CWT 45,000 CWT only
Source: Tulalip Tribes and WDFW Hatchery MOU Agreement (2012), Co-Manager’s Equilibrium Brood Document 2012.

Wallace River Hatchery Coho HGMP 42
10.8) Disposition plans for fish identified at the time of release as surplus to programmed or approved levels. While survival rates vary from year to year, the guideline is to be within 10% of program release goals. Over the past twelve years, coho releases have ranged from around 140,000 to 170,000, and averaged 151,000 smolts.
10.9) Fish health certification procedures applied pre-release. Fish health is monitored prior to release, and the fish health status of the population is certified by a WDFW Fish Health Specialist.
10.10) Emergency release procedures in response to flooding or water system failure. In the case of a catastrophic event, conditions critical to fish health will be monitored and if deemed necessary, the fish could be released prematurely to prevent their loss in the ponds. Hatchery Standby Procedures have been developed by WDFW that provide information regarding proper actions to follow by hatchery employees in the case of an emergencies.
10.11) Indicate risk aversion measures that will be applied to minimize the likelihood for adverse genetic and ecological effects to listed fish resulting from fish releases. Although coho have been documented to prey on other salmonids (primarily pink, chum and sockeye salmon) (Hawkins and Tipping 1999; Seiler et al. 2002; Hargreaves and LeBrasseur 1986), any predation potential to listed populations should be minimized by the timing and proximity of the release. Hatchery coho are released in May, usually during or right after a freshet, to foster rapid migration and minimize freshwater residence. Juvenile sampling in the Snohomish estuary showed that yearling coho abundance declined rapidly throughout May, indicating that both hatchery and wild coho migrate through the estuary quickly (Rowse and Fresh 2003). Similar studies in the Green River have shown that yearling coho salmon typically spend less than a week in the lower river and estuary reaches of the river (Ruggerone et al. 2006). WDFW data from 1978-1986 indicates that the early sub-yearling Chinook outmigration in the SF Skykomish River occurs primarily during January-February, and is at a lull from March to early-May (WDFW unpublished data). In addition, the target size of Wallace River Hatchery coho released in May is 17 fpp, which corresponds with 131 mm fl. While yearling Chinook are present, average size in early May is 106.6 mm, ranging from 89- to 126-mm (Seiler et al 1984), Assuming the "1/3 size rule" (USFWS 1994), Chinook salmon smaller than 44 mm fl may be susceptible to predation by average-sized yearling hatchery coho released through this program. Also, assuming that natural-origin listed Chinook in the Wallace/Skykomish system are similar in size to sub-yearling Chinook in the Skagit River in May (average 56.2 mm fl - Seiler et al. 1998-2007), these fish are larger than the threshold predation susceptibility size; predation by hatchery coho smolts is not expected to be a significant problem (see HGMP section 2.2.3.). Sampling of juvenile coho salmon in the Snohomish estuary showed that their primarily prey items were crustaceans (Cordell et al. 1999). Steward and Bjornn (1990) also concluded, that hatchery fish kept in the facility for extended periods before release as smolts (e.g. yearlings) may have different food and habitat preferences than listed natural-origin fish, making it less likely to out-compete the latter. Also production and release of only smolts through fish culture fosters rapid seaward migration with minimal delays in the rivers, limiting interactions with listed Chinook and steelhead. Coho at Wallace River Hatchery are closely visually monitored for smolting activities to ensure they are released fully-smolted. Coefficient of variation (CV) for length at release is also monitored and average CV value of 10.0% or less is desirable to confirm the likelihood that most fish are ready to migrate (Fuss and Ashbrook 1995). For release years 2000-2012, the average CV was 6.5% (Table 10.3.1)
Wallace River Hatchery Coho HGMP 43
SECTION 11. MONITORING AND EVALUATION OF PERFORMANCE INDICATORS 11.1) Monitoring and evaluation of “Performance Indicators” presented in Section 1.10.
The purpose of monitoring is to identify and evaluate the benefits and risks from this hatchery program, elements of which are identified in HGMP section 1.10. The Tulalip Tribes initiated extensive monitoring and biological sampling focused on juvenile salmonids in the Skykomish and Snoqualmie Rivers and nearshore marine areas and pocket estuaries operating smolt traps in the Skykomish and Snoqualmie Rivers annually since 2000 and 2001, respectively, and have partnered with NOAA Fisheries in an extensive juvenile salmonid sampling effort in the Snohomish estuary since 2001. WDFW has joined in these monitoring efforts, which include collaboration with the Tulalip Tribes and the newly-formed Salish Sea Marine Survival Technical Team and associated freshwater, estuarine, nearshore and offshore coordinated monitoring program. These programs provide valuable information on relative temporal-spatial co-occurrences, outmigration timing, size, habitat utilization, prey consumption and other important metrics and data that is helping to assess the potential for any adverse ecological interactions between hatchery- and natural-origin program fish and other species of juvenile salmonids. These activities are covered under other Research permits independent of this HGMP.
11.1.1) Describe plans and methods proposed to collect data necessary to respond to each “Performance Indicator” identified for the program.
Smolt trapping in freshwater (Skykomish, Snoqualmie and Sultan rivers), and estuarine, nearshore and offshore marine surveys continues to provide important information on the co-occurrence, out-migration timing, relative abundances, relative sizes and growth rates of program and listed fish including other fish species. These activities are covered under other research permits independent of this HGMP.
11.1.2) Indicate whether funding, staffing, and other support logistics are available or committed to allow implementation of the monitoring and evaluation program.
Funding and resources are currently committed to monitor and evaluate this program, though additional critical funding is needed to continue the ongoing genetic-based work as well as to improve our understanding of what is driving post-release survival; particularly marine survival.
11.2) Indicate risk aversion measures that will be applied to minimize the likelihood for adverse genetic and ecological effects to listed fish resulting from monitoring and evaluation activities. The ongoing monitoring and evaluation, programs, which have been under consultation with NOAA Fisheries, have proven for more than a dozen years to not result in any unauthorized take of listed Chinook, Steelhead or bull trout (e.g. Chinook mortalities from smolt trapping operations in the Skykomish and Snoqualmie rivers averaged less than one percent of the Chinook trapped (Nelson and Kelder, Nelson and Finley, Tulalip Tribes unpublished reports, 2001-2011).
SECTION 12. RESEARCH 12.1) Objective or purpose.
There is no current research directly associated with the program.
12.2) Cooperating and funding agencies. Not applicable.

Wallace River Hatchery Coho HGMP 44
12.3) Principle investigator or project supervisor and staff. Not applicable.
12.4) Status of stock, particularly the group affected by project, if different than the stock(s) described in Section 2. Not applicable.
12.5) Techniques include capture methods, drugs, samples collected, tags applied. Not applicable.
12.6) Dates or time period in which research activity occurs. Not applicable.
12.7) Care and maintenance of live fish or eggs, holding duration, transport methods. Not applicable.
12.8) Expected type and effects of take and potential for injury or mortality. Not applicable.
12.9) Level of take of listed fish: number or range of fish handled, injured, or killed by sex, age, or size, if not already indicated in Section 2 and the attached “take table” (Table 1). Not applicable.
12.10) Alternative methods to achieve project objectives. Not applicable.
12.11) List species similar or related to the threatened species; provide number and causes of mortality related to this research project. Not applicable.
12.12) Indicate risk aversion measures that will be applied to minimize the likelihood for adverse ecological effects, injury, or mortality to listed fish as a result of the proposed research activities. Not applicable.

Wallace River Hatchery Coho HGMP 45
SECTION 13. ATTACHMENTS AND CITATIONS Bilby, R.E., B.R. Fransen, and P.A. Bisson. 1996. Incorporation of nitrogen and carbon from spawning coho salmon into the trophic system of small streams: evidence from stable isotopes. Can. J. Fish. Aquatic Sci. 53: pp 164-173.
Cordell, J.R., C. Tanner and J.K. Aitkin. 1999. Fish assemblages and juvenile salmon diets at a breached-dike wetland site, Spencer Island, Washington 1997-98. Fisheries Research Institute, School of Fisheries, University of Washington, Seattle, Washington. 12pp.
Ford, M.J. (ed.). 2011. Status review update for Pacific salmon and steelhead listed under the Endangered Species Act: Pacific Northwest. U.S. Dept. Commer., NOAA Tech. Memo. NMFS-NWFSC-113, 281 p.
Fuss, H. and C. Ashbrook. 1995. Hatchery operation plan and performance summaries (HOPPS). Washington Department of Fish and Wildlife. Olympia, Washington.
FWC (Fish and Wildlife Commission). 2009. Washington Department of Fish and Wildlife hatchery and fishery reform: Policy Number: C-3619. Washington Fish and Wildlife Commission, Olympia, Washington.
Good, T.P., R.S. Waples, and P. Adams, (editors). 2005. Updated status of federally listed ESUs of West Coast salmon and steelhead. U.S. Department Commerce. NOAA Tech. Memo. NMFS-NWFSC-66.
Gregory, S.V., G.A. Lamberti, D.C. Erman, K.V. Koski, M.L. Murphy, and J.R. Sedell. 1987. Influence of forest practices on aquatic production. In E.O. Salo and T.W. Cundy (editors), Streamside management: forestry and fishery interactions. Institute of Forest Resources, University of Washington, Seattle, Washington.
Hargreaves, N. B., and R.J. LeBrasseur. 1986. Size selectivity of coho (Oncorhynchus kisutch) preying on juvenile chum salmon (O. keta). Canadian Journal of Fisheries and Aquatic Sciences 43: 581-586.
Hawkins S.W. and J.M. Tipping. 1999. Predation by juvenile hatchery salmonids on wild fall Chinook salmon fry in the Lewis River, Washington. California Fish Game 85:124–129.
HSRG (Hatchery Science Review Group). 2002. Hatchery reform recommendations for the Eastern Strait of Juan de Fuca, South Puget Sound, Stillaguamish and Snohomish Rivers. Long Live the Kings. Seattle, Washington.
HSRG (Hatchery Scientific Review Group). 2004. Hatchery Reform; Principles and Recommendations of the Hatchery Scientific Review Group. Long Live the Kings, 1305 Fourth Avenue, Suite 810, Seattle WA. http://hatcheryreform.us/hrp_downloads/reports/hsrg_princ_recs_report_full_apr04.pdf.
Kline, T.C., J.J. Goring, Q.A. Mathisen, and P.H. Poe. 1997. Recycling of elements transported upstream by runs of Pacific salmon: I _15N and _13C evidence in Sashin Creek, southeastern Alaska. Can. J. Fish. Aquatic Sci. 47: pp136-144.
Kubo, J., K. Finley, and K. Nelson. 2013. 2000-2012 Skykomish and Snoqualmie Rivers Chinook and Coho Salmon Out-migration Study. Draft Tulalip Tribes Natural Resources Department Report. Tulalip, Washington.
Levy, S. 1997. Pacific salmon bring it all back home. BioScience 47: pp 657-660.
Wallace River Hatchery Coho HGMP 46
Mathisen, O.A., P.L. Parker, J.J. Goering, T.C. Kline, P.H. Poe, and R.S. Scalan. 1988. Recycling of marine elements transported into freshwater systems by anadromous salmon. Verh. Int. Ver. Limnol. 23: pp 2249-2258.
McElhaney, P., M. H. Ruckelshaus, M. J. Ford, and T. C. Wainwright. 2000. Viable salmonid populations and the recovery of evolutionarily significant units. U.S. Dept. of Commerce, NOAA Tech. Memo., NMFS-NWFSC-42, 156 pp.
NMFS (National Marine Fisheries Service). 1995. Juvenile fish screen criteria for pump intakes. Available at http://www.nwr.noaa.gov/1hydrop/nmfscrit1.htm.
NMFS (National Marine Fisheries Service). 1996. Juvenile fish screen criteria for pump intakes. Available at http://www.nwr.noaa.gov/1hydrop/pumpcrit1.htm.
NMFS (National Marine Fisheries Service). 1999. Endangered and threatened species: Threatened status for three Chinook salmon Evolutionarily Significant Units in Washington and Oregon, and Endangered status for one Chinook salmon ESU in Washington; final rule. Partial 6-month extension on final listing determinations for four Evolutionarily Significant Units of West Coast Chinook salmon; proposed rule. Federal Register 64:14308-14328.
NMFS (National Marine Fisheries Service). 2000a. A risk assessment procedure for evaluating harvest mortality of Pacific salmonids. National Marine Fisheries Service, Sustainable Fisheries Division, Northwest Region. May 30. 33pp.
NMFS (National Marine Fisheries Service). 2007. Endangered and threatened species: final listing determination for Puget Sound steelhead. Federal Register 72FR26722.
NMFS (National Marine Fisheries Service). 2011. Anadromous Salmonid Passage Facility Design. NMFS, Northwest Region, Portland, Oregon.
NMFS (National Marine Fisheries Service). 2011. Evaluation of and recommended determination on a Resource Management Plan (RMP), pursuant to the salmon and steelhead 4(d) rule: Comprehensive management plan for Puget Sound Chinook: harvest management component. U.S. Department of Commerce, NOAA. FINWRl2010/06051.
NMFS SHIEER 2004, 70 FR 37160. June 28, 2005 - Final ESA listing determinations for 16 ESUs of West Coast salmon, and final 4(d) protective regulations for threatened salmonid ESUs; NMFS 2004. Salmonid Hatchery Inventory and Effects Evaluation Report (SHIEER). An evaluation of the effects of artificial propagation on the status and likelihood of extinction of west coast salmon and steelhead under the Federal Endangered Species Act. May 28, 2004. Technical Memorandum NMFS-NWR/SWR. U.S. Department of Commerce, National Oceanic and Atmospheric Administration, National Marine Fisheries Service. Portland, Oregon. 557p.
NPPC (Northwest Power Planning Council). 2001. Performance standards and indicators for the use of artificial production for anadromous and resident fish populations in the Pacific Northwest. Portland, Oregon. 19 pp.
Piper, R., I.B. McElwain, L.E. Orme, J.P. McCraren, L.G. Fowler, J.R. Leonard, A.J. Trandahl, and V. Adriance. 1982. Fish Hatchery Management. United States Dept of Interior, Fish and Wildlife Service. Washington, D.C.
PSSTRT (Puget Sound Steelhead Technical Recovery Team). 2013a. Identifying historical populations of steelhead within the Puget Sound Distinct Population Segment. Final Review Draft. 149 p.
Wallace River Hatchery Coho HGMP 47
PSSTRT (Puget Sound Steelhead Technical Recovery Team).2013b. Viability Criteria for Puget Sound Steelhead. Final Review Draft. 373 p.
PSTT (Puget Sound Treaty Tribes) and WDFW (Washington Department of Fish and Wildlife). 1998. Comprehensive coho management plan; second interim report. Washington Department of Fish and Wildlife. Olympia, Washington. 92pp. Puget Sound Salmon Management Plan. 1985. United States v Washington (1606 F.Supp. 1405).
RMIS (Regional Mark Information System). 2012. Retrieved February 6, 2012. Available from: http://www.rmpc.org/.
Rowse, M. and K. Fresh. 2003. Juvenile Salmonid Utilization of the Snohomish River Estuary, Puget Sound. Georgia Basin/Puget Sound Research Conference. 9pp.
Ruckelshaus, M.H., K.P. Currens, W.H. Graeber, R.R. Fuerstenberg, K. Rawson, N.J. Sands, and J.B. Scott. 2006. Independent populations of Chinook salmon in Puget Sound. United States Department of Commerce, NOAA. Technical Memo. NMFS-NWFSC-78, Seattle, Washington. 125 pp.
Ruggerone, G.T., T.S. Nelson and J. Hall. 2006. Habitat utilization, migration timing, growth, and diet of juvenile Chinook salmon in the Duwamish River and estuary. Salmon Recovery Funding Board King Conservation District. Seattle, Washington. 75 pp.
Seidel, P. 1983. Spawning Guidelines for Washington Department of Fish and Wildlife Hatcheries, Washington Department of Fish and Wildlife, Olympia, WA.
Seiler, D., S. Neuhauser, and M. Ackley. 1984. Upstream/Downstream Salmonid Tagging Project, 1980-1982. Washington Department of Fisheries, Olympia, Washington. 150 pp.
Seiler, D., P. Hanratty, S. Neuhauser, P. Topping, M. Ackley, and L.E. Kishimoto. 1997. Wild salmon production and survival evaluation. Annual Report. RAD 97-03. Washington Department of Fish and Wildlife, Olympia, Washington.
Seiler, D., L. Kishimoto, and S. Neuhauser. 1998. 1997 Skagit River wild 0+ Chinook production evaluation. Contract report to Seattle City Light. Washington Department of Fish and Wildlife, Olympia, Washington.
Seiler, D., L. Kishimoto, and S. Neuhauser. 1999. 1998 Skagit River wild 0+ Chinook production evaluation. Contract report to Seattle City Light. Washington Department of Fish and Wildlife, Olympia, Washington.
Seiler, D., L. Kishimoto, and S. Neuhauser. 2000. 1999 Skagit River wild 0+ Chinook production evaluation. Contract report to Seattle City Light. Washington Department of Fish and Wildlife, Olympia, Washington.
Seiler, D., L. Kishimoto, and S. Neuhauser. 2001. 2000 Skagit River wild 0+ Chinook production evaluation. Contract report to Seattle City Light. Washington Department of Fish and Wildlife, Olympia, Washington.
Seiler, D., L. Kishimoto, and S. Neuhauser. 2002. 2001 Skagit River wild 0+ Chinook production evaluation. Contract report to Seattle City Light. Report FPA 02-11. Washington Department of Fish and Wildlife, Olympia, Washington.
Seiler, D., G. Volkhardt, and L. Kishimoto. 2003. Evaluation of downstream migrant salmon production in 1999 and 2000 from three Lake Washington tributaries: Cedar River, Bear Creek, and

Wallace River Hatchery Coho HGMP 48
Issaquah Creek. Report FPA 02-07. Washington Department of Fish and Wildlife, Olympia, Washington.
Seiler, D., G. Volkhardt, L. Kishimoto, and P. Topping. 2002. 2000 Green River juvenile salmonid production evaluation. Report FPT 02-03. Washington Department of Fish and Wildlife, Olympia, Washington.
Shared Strategy for Puget Sound. 2005. Puget Sound salmon recovery plan. Volumes I and II. Plan adopted by the National Marine Fisheries Service January 19, 2007. Submitted by the Shared Strategy Development Committee. Shared Strategy for Puget Sound. Seattle, Washington.
Slaney, P.A., B.R. Ward. 1993. Experimental fertilization of nutrient deficient streams in British Columbia. In G. Schooner and S. Asselin (editors), Le developpmente du saumon Atlantique au Quebec: connaitre les regles du jeu pour reussir. Colloque international e la Federation quebecoise pour le saumon atlantique, p. 128-141. Quebec, decembre 1992. Collection Salmo salar no1.
Slaney, P.A., B.R. Ward, and J.C. Wightman. 2003. Experimental nutrient addition to the Keogh River and application to the Salmon River in coastal British Columbia. In J.G. Stockner,(editor), Nutrients in salmonid ecosystems: sustaining production and biodiversity, p. 111-126. American Fisheries Society, Symposium 34, Bethesda, Maryland.
Snohomish Basin Salmonid Recovery Technical Committee. 1999. Initial Snohomish River Basin Chinook salmon conservation/recovery technical work plan. Snohomish County Surface Water Management. Everett, Washington.
Snohomish Basin Salmon Recovery Forum. 2005. Snohomish River Basin salmon conservation plan. Available at: http://www1.co.snohomish.wa.us/Departments/Public_Works/Divisions/SWM/Work_Areas/Habitat/Salmon/Snohomish/Snohomish_Basin_Salmon_Conservation_Plan.htm.
SSHAG (Salmon and Steelhead Hatchery Assessment Group). 2003. Hatchery broodstock summaries and assessments for chum, coho, and Chinook salmon and steelhead stocks within evolutionarily significant units listed under the Endangered Species Act. NOAA Fisheries, Northwest Fisheries Science Center, Seattle, Washington and Southwest Fisheries Science Center, La Jolla, California. 326pp.
Steward, C. and T.C. Bjornn. 1990. Supplementation of salmon and steelhead stocks with hatchery fish; a synthesis of published literature. Idaho Cooperative Fish and Wildlife Research Unit. University of Idaho. Tech. Rpt. 90-1. Moscow, Idaho.
U.S. District court of Western Washington. 1974. United States v Washington, 384 F, Supp. 312.
USFWS (U.S. Fish and Wildlife Service). 1994. Biological assessment for operation of U.S. Fish and Wildlife Service operated or funded hatcheries in the Columbia River Basin in 1995-1998. Submitted to National Marine Fisheries Service under cover letter, dated August 2, 1994, from William F. Shake, Acting USFWS Regional Director, to Brian Brown, NMFS.
Ward, B.R., D.J.F. McCubbing, and P.A. Slaney. 2003. Evaluation of the addition of inorganic nutrients and stream habitat structures in the Keogh River watershed for steelhead trout and coho salmon. In J.G. Stockner,(editor), Nutrients in salmonid ecosystems: sustaining production and biodiversity, p. 127-147. American Fisheries Society, Symposium 34, Bethesda, Maryland.
WDFW (Washington Department of Fish and Wildlife) and WWTIT (Western Washington Treaty Indian Tribes). 1998 (Updated 2006). Salmonid disease control policy of the fisheries Co-Managers
Wallace River Hatchery Coho HGMP 49
of Washington State. Washington Department of Fish and Wildlife and Western Washington Treaty Indian Tribes, Olympia Washington.
WDFW. (Washington Department of Fish and Wildlife). 2012. Catch Record Card (CRC) database. Washington Department of Fish and Wildlife. Olympia, Washington.
WDFW (Washington Department of Fish and Wildlife). 2012. 2012 Future brood document. Washington Department of Fish and Wildlife. Olympia, Washington. Available from: http://wdfw.wa.gov/publications/01356/.
WDFW (Washington Department of Fish and Wildlife). 2012. Hatcheries Headquarters Database. Washington Department of Fish and Wildlife, Olympia, Washington.
WDFW (Washington Department of Fish and Wildlife). 2012. Salmonid stock inventory (SaSI). Fish Program, Science Division. Washington Department of Fish and Wildlife. Olympia, Washington. Available from: http://wdfw.wa.gov/conservation/fisheries/sasi/.
Wegge, T. 2009. Methods for estimating region economic impacts of Washington hatchery programs: technical memorandum. TCW Economics. Sacramento, California. 10 pp.
Wipfli, M.S., J. Hudson, and J. Caouette. 1998. Influence of salmon carcasses on stream productivity: response of biofilm and benthic macroinvertebrates in southeastern Alaska, U.S.A. Can J. Fish. Aquatic Sci. 55: pp 1503-1511.

Wallace River Hatchery Coho HGMP 50
SECTION 14. CERTIFICATION LANGUAGE AND SIGNATURE OF RESPONSIBLE PARTY “I hereby certify that the information provided is complete, true and correct to the best of my knowledge and belief. I understand that the information provided in this HGMP is submitted for the purpose of receiving limits from take prohibitions specified under the Endangered Species Act of 1973 (16 U.S.C.1531-1543) and regulations promulgated thereafter for the proposed hatchery program, and that any false statement may subject me to the criminal penalties of 18 U.S.C. 1001, or penalties provided under the Endangered Species Act of 1973.” Name, Title, and Signature of Applicant: Certified by_____________________________ Date:_____________

Wallace River Hatchery Coho HGMP 51
ADDENDUM A. PROGRAM EFFECTS ON OTHER (AQUATIC OR TERRESTRIAL) ESA-LISTED POPULATIONS. (Anadromous salmonid effects are addressed in Section 2) 15.1) List all ESA permits or authorizations for USFWS ESA-listed, proposed, and
candidate salmonid and non-salmonid species associated with the hatchery program. The WDFW and the USFWS have a Cooperative Agreement pursuant to section 6(c) of the Endangered Species Act that covers the majority of the WDFW actions, including hatchery operations.
"The department is authorized by the USFWS for certain activities that may result in the take of bull trout, including salmon/steelhead hatchery broodstocking, hatchery monitoring and evaluation activities and conservation activities such as adult traps, juvenile monitoring, spawning ground surveys..."
15.2) Describe USFWS ESA-listed, proposed, and candidate salmonid and non-salmonid species and habitat that may be affected by hatchery program. Snohomish/ Skykomish Bull Trout (Salvelinus confluentus): Bull trout were listed as a threatened species in the Coastal-Puget Sound Distinct Population Segment on November 1, 1999 (64 FR 58910). Four local populations have been identified in the Snohomish/ Skykomish Core Area, based the distribution of suitable spawning and rearing habitat: North Fork Skykomish River, Troublesome Creek, Salmon Creek and the South Fork Skykomish River. These populations exhibit anadromous, fluvial and resident life history forms and may spawn at the same time and place (WDFW Bull Trout SaSI 2004). Current data indicates that the anadromous form is much more abundant and widespread than the fluvial form in the drainage. This core area does not include any adfluvial populations, but some accessible lowland lakes are utilized by anadromous and fluvial forms as foraging habitat (USFWS 2004). The resident form typically occupies the upper watershed above anadromous reaches and its abundance is unknown. Migratory bull trout are known to spawn in Beckler and East Fork of the Foss Rivers as well as in the Upper North Fork Skykomish River and tributaries. The current status of the Snohomish/ Skykomish bull trout is healthy based on recent abundance data (WDFW Bull Trout SaSI 2004). The recovered abundance level for bull trout in the Snohomish /Skykomish Core Area has been set at 500 adult spawners, based on current habitat capacity (USFWS 2004). Table 15.2.1: Summary of core area rankings for population abundance, distribution, trend, threat, and final rank.
Core Area Population
Abundance Category
(individuals)
Distribution Range Rank (stream length miles)
Short-term Trend Rank Threat Rank Final
Rank
Snohomish & Skykomish Rivers 1,000-2,500 620-3,000 Increasing
Widespread, low-severity
Potential Risk
Source: USFWS 2008
Table 15.2.2: Bull trout redd counts from the North Fork Skykomish River index area and bull trout adult counts at the Sunset Falls trap on the South Fork Skykomish River, 2000 to 2011.
Year Number of Redds Number of Adults 2000 236 51 2001 319 62 2002 538 90 2003 No Data 92 2004 359 128

Wallace River Hatchery Coho HGMP 52
2005 247 103 2006 247 99 2007 136 53 2008 195 68 2009 93 52 2010 115 97 2011 105 60
Average 235 80 Source: WDFW SaSI 2012.
Habitat- Many of the key spawning and rearing habitats of local bull trout populations within the North Fork of the Skykomish River remain in good to excellent condition. Past and recent timber harvest and associated road building has impacted habitats primarily within the South Fork Skykomish River local population. Like most major river systems within the Puget Sound Management Unit, habitat complexity has been significantly reduced in the mainstems as a result of various land management and development activities. This has resulted in the degradation of foraging, migration, and overwintering habitat and potentially rearing habitat for the anadromous life history form. Nearshore foraging habitats have and continue to be impacted by development activities. Bull trout within this system were overharvested in the past, but the implementation of more restrictive regulations in the early 1990's have helped allow the population to increase in abundance from the low levels of the late 1980's.Recent returns strongly indicate that this population has likely rebounded near or to recovered levels of abundance, (USFWS 2004). Several listed and candidate species are found in Snohomish County; however the hatchery operations and facilities for this program do not fall within the critical habitat for any of these species. As such there are no effects anticipated for these species. Listed or candidate species: “No effect” for the following species: Canada Lynx (Lynx canadensis) –Threatened [critical habitat designated] Gray Wolf (Canis lupus) –Threatened Grizzly bear (Ursus arctos horribilis) –Threatened Marbled murrelet (Brachyramphus marmoratus) –Threatened [critical habitat designated] Northern Spotted owl (Strix occidentalis caurina) –Threatened [critical habitat designated] Candidate Species Fisher (Martes pennanti) – West Coast DPS North American wolverine (Gulo gulo luteus) – contiguous U.S. DPS Oregon spotted frog (Rana pretiosa) [historic] Yellow-billed cuckoo (Coccyzus americanus) Whitebark pine (Pinus albicaulis)
15.3) Analyze effects. Hatchery activities, including in-river broodstock collection, hatchery trap, and water intake structures may pose a risk to system bull trout populations. Annual estimates of bull trout encounters through the hatchery activities are recorded and reported.
15.4 Actions taken to minimize potential effects. Trap is checked at least daily. Any bull trout encountered at the trap are immediately returned to the stream. Bull trout may be encountered in other hatchery programs during broodstock collection activities (steelhead or coho) that would directly impact or create potential effects on bull trout in this system based on the current understanding of the status of these fish.

Wallace River Hatchery Coho HGMP 53
15.5 References USFWS (U.S. Fish and Wildlife Service). 2004. Draft recovery plan for the Coastal-Puget Sound distinct population segment of bull trout (Salvelinus confluentus). Volume I (of II): Puget Sound management unit. Portland, Oregon. 389 + xvii pp. USFWS (U.S. Fish and Wildlife Service). 2008. Bull trout (Salvelinus confluentus) 5-year review: Summary and evaluation. Portland, Oregon. U.S. Fish and Wildlife Service. 55 pp. WDFW (Washington State Department of Fish and Wildlife). 2004. Washington State salmonid stock inventory bull trout/ Dolly Varden. Washington State Department of Fish and Wildlife. Olympia, Washington.

Wallace River H
atchery Coho H
GM
P 54
Table 1a. Estimated listed salmonid take levels of by hatchery activity. Listed species affected: Chinook (Oncorhynchus tshawytscha)
ESU/Population: Puget Sound/Skykomish River Summer Chinook
Activity: Wallace River Coho Program
Location of hatchery activity: Wallace River Hatchery, Wallace River (07.0940)
Dates of activity: October-May
Hatchery program operator: WDFW
Type of Take Annual Take of Listed Fish By Life Stage (Number of Fish)
Egg/Fry Juvenile/Smolt Adult Carcass Observe or harass a) - - - - Collect for transport b) - - - - Capture, handle, and release c) - - 0 - Capture, handle, tag/mark/tissue sample, and release d) - - - - Removal (e.g. broodstock) e) - - - - Intentional lethal take f) - - - - Unintentional lethal take g) - - - - Other Take (specify) h) - - - -
a. Contact with listed fish through stream surveys, carcass and mark recovery projects, or migrational delay at weirs. b. Take associated with weir or trapping operations where listed fish are captured and transported for release. c. Take associated with weir or trapping operations where listed fish are captured, handled and released upstream or downstream. d. Take occurring due to tagging and/or bio-sampling of fish collected through trapping operations prior to upstream or downstream release, or through
carcass recovery programs. e. Listed fish removed from the wild and collected for use as broodstock. f. Intentional mortality of listed fish, usually as a result of spawning as broodstock. g. Unintentional mortality of listed fish, including loss of fish during transport or holding prior to spawning or prior to release into the wild, or, for
integrated programs, mortalities during incubation and rearing. h. Other takes not identified above as a category. Instructions: 1. An entry for a fish to be taken should be in the take category that describes the greatest impact. 2. Each take to be entered in the table should be in one take category only (there should not be more than one entry for the same sampling event). 3. If an individual fish is to be taken more than once on separate occasions, each take must be entered in the take table.

55
Wallace River H
atchery Coho H
GM
P 55
Table 1b. Estimated listed salmonid take levels of by hatchery activity. Listed species affected: Steelhead (Oncorhynchus mykiss)
ESU/Population: Puget Sound/Skykomish River Summer Chinook
Activity: Wallace River Coho Program
Location of hatchery activity: Wallace River Hatchery, Wallace River (07.0940)
Dates of activity: October-May
Hatchery program operator: WDFW
Type of Take Annual Take of Listed Fish By Life Stage (Number of Fish)
Egg/Fry Juvenile/Smolt Adult Carcass Observe or harass a) - - - - Collect for transport b) - - - - Capture, handle, and release c) - - 0 - Capture, handle, tag/mark/tissue sample, and release d) - - - - Removal (e.g. broodstock) e) - - - - Intentional lethal take f) - - - - Unintentional lethal take g) - - - - Other Take (specify) h) - - - -
a. Contact with listed fish through stream surveys, carcass and mark recovery projects, or migrational delay at weirs. b. Take associated with weir or trapping operations where listed fish are captured and transported for release. c. Take associated with weir or trapping operations where listed fish are captured, handled and released upstream or downstream. d. Take occurring due to tagging and/or bio-sampling of fish collected through trapping operations prior to upstream or downstream release, or through
carcass recovery programs. e. Listed fish removed from the wild and collected for use as broodstock. f. Intentional mortality of listed fish, usually as a result of spawning as broodstock. g. Unintentional mortality of listed fish, including loss of fish during transport or holding prior to spawning or prior to release into the wild, or, for
integrated programs, mortalities during incubation and rearing. h. Other takes not identified above as a category.

Wallace River Hatchery Coho HGMP 56
Attachment 1. Definition of terms referenced in the HGMP template. Augmentation - The use of artificial production to increase harvestable numbers of fish in areas where the natural freshwater production capacity is limited, but the capacity of other salmonid habitat areas will support increased production. Also referred to as “fishery enhancement”.
Critical population threshold - An abundance level for an independent Pacific salmonid population below which: depensatory processes are likely to reduce it below replacement; short-term effects of inbreeding depression or loss of rare alleles cannot be avoided; and productivity variation due to demographic stochasticity becomes a substantial source of risk.
Direct take - The intentional take of a listed species. Direct takes may be authorized under the ESA for the purpose of propagation to enhance the species or research.
Evolutionarily Significant Unit (ESU) - NMFS definition of a distinct population segment (the smallest biological unit that will be considered to be a species under the Endangered Species Act). A population will be/is considered to be an ESU if 1) it is substantially reproductively isolated from other conspecific population units, and 2) it represents an important component in the evolutionary legacy of the species.
Harvest project - Projects designed for the production of fish that are primarily intended to be caught in fisheries.
Hatchery fish - A fish that has spent some part of its life-cycle in an artificial environment and whose parents were spawned in an artificial environment.
Hatchery population - A population that depends on spawning, incubation, hatching or rearing in a hatchery or other artificial propagation facility.
Hazard - Hazards are undesirable events that a hatchery program is attempting to avoid.
Incidental take - The unintentional take of a listed species as a result of the conduct of an otherwise lawful activity.
Integrated harvest program - Project in which artificially propagated fish produced primarily for harvest are intended to spawn in the wild and are fully reproductively integrated with a particular natural population.
Integrated recovery program - An artificial propagation project primarily designed to aid in the recovery, conservation or reintroduction of particular natural population(s), and fish produced are intended to spawn in the wild or be genetically integrated with the targeted natural population(s). Sometimes referred to as “supplementation”.
Isolated harvest program - Project in which artificially propagated fish produced primarily for harvest are not intended to spawn in the wild or be genetically integrated with any specific natural population.
Isolated recovery program - An artificial propagation project primarily designed to aid in the recovery, conservation or reintroduction of particular natural population(s), but the fish produced are not intended to spawn in the wild or be genetically integrated with any specific natural population.
Mitigation - The use of artificial propagation to produce fish to replace or compensate for loss of fish or fish production capacity resulting from the permanent blockage or alteration of habitat by human activities.

Wallace River Hatchery Coho HGMP 57 57
Natural fish - A fish that has spent essentially all of its life-cycle in the wild and whose parents spawned in the wild. Synonymous with natural origin recruit (NOR).
Natural origin recruit (NOR) - See natural fish .
Natural population - A population that is sustained by natural spawning and rearing in the natural habitat.
Population - A group of historically interbreeding salmonids of the same species of hatchery, natural, or unknown parentage that have developed a unique gene pool, that breed in approximately the same place and time, and whose progeny tend to return and breed in approximately the same place and time. They often, but not always, can be separated from another population by genotypic or demographic characteristics. This term is synonymous with stock.
Stock - (see “Population”).
Take - To harass, harm, pursue, hunt, shoot, wound, kill, trap, capture, or collect, or to attempt to engage in any such conduct.
Viable population threshold - An abundance level above which an independent Pacific salmonid population has a negligible risk of extinction due to threats from demographic variation (random or directional), local environmental variation, and genetic diversity changes (random or directional) over a 100-year time frame.

Wallace River Hatchery Coho HGMP 58 58
Attachment 2. Age class designations by fish size and species for salmonids released from hatchery facilities. (generally from Washington Department of Fish and Wildlife, November, 1999).
SPECIES/AGE CLASS Number of fish/pound SIZE/CRITERIA Grams/fish
X Chinook Yearling <=20 >=23 X Chinook Subyearling >20 to 150 3 to <23 X Chinook Fry >150 to 900 0.5 to <3 X Chinook Unfed Fry >900 <0.5
X Coho Yearling 1/ <20 >=23 X Coho Subyearling >20 to 200 2.3 to <23 X Coho Fry >200 to 900 0.5 to <2.3 X Coho Unfed Fry >900 <0.5
X Chum Fry <=1000 >=0.45 X Chum Unfed Fry >1000 <0.45
X Sockeye Yearling 2/ <=20 >=23 X Sockeye Fingerling >20 to 8000 0.6 to <23 X Sockeye Fall Releases >150 >2.9 X Sockeye Fry >800 to 1500 0.3 to <0.6 X Sockeye Unfed Fry >1500 <0.3
X Pink Fry <=1000 >=0.45 X Pink Unfed Fry >1000 <0.45
X Steelhead Smolt <=10 >=0.45 X Steelhead Sub-yearling <=20 >=23 X Steelhead Fry >20 to 150 3 to <23 X Steelhead Unfed Fry >150 <3
X Cutthroat Yearling <=20 >=23 X Cutthroat Fingerling >20 to 150 3 to <23 X Cutthroat Fry >150 <3
X Trout Legals <=10 >=0.45 X Trout Fry >10 <0.45
1/ Coho yearlings defined as meeting size criteria, 1+ year old at release, and released prior to June 1st. 2/ Sockeye yearlings defined as meeting size criteria and 1+ year old.