
Hashim Raza Rizvi Department of Civil Engineering,...
13
Application of Lean-Six Sigma Approach in a Laboratory Experimental Case Study Hashim Raza Rizvi Department of Civil Engineering, University of Louisiana, Lafayette, LA, USA. Address: P.O.Box 40643, Lafayette, LA70504, USA. E-mail: [email protected] K E Y W O R D S A B S T R A C T A R T I C L E I N F O Value Stream Mapping, Muda, Heijunka, 5-S Received June 2013 Accepted June 2013 Available online December 2013 Laboratory experiments are a conventional activity performed at academic institutions, government and private organizations. These experimental studies provide the basis for new inventions in the field of science and engineering. Laboratory experiments are conducted on the basis of provided guidelines, already established by different standard organizations like ASTM, AASHTO etc. This article is based on a case study in which the process of an experiment is examined on the basis of Value Stream Maps (VSM) and potential improvement possibilities have been identified. After determining the potential waste, appropriate Lean tools are selected to implement and observe the improvements. The process is examined after application of the Lean tools and a comparison is performed. University laboratory environment can be improved considerably by applying Lean Tools. MUDA application reduced the total work time from 90.75 hours and 10-CD to 63.75 hours and 7-CD hence saving, 27 hours and 3-CD for one experiment. This is remarkable achievement of this application. Heijunka application provided the students equal workload and they performed explicitly better than they used to. 5-S tool provided the students the opportunity to manage the laboratory in an effective and clean way. Safety of the students is a very major concern at university laboratory environment. 5-S not only upgraded the laboratory overall performance, but it significantly raised the safety standards of the laboratory. More application of the Lean Tools should be exercised explored to have more effective and efficient university laboratory experimental environment.
Transcript of Hashim Raza Rizvi Department of Civil Engineering,...

Application of Lean-Six Sigma Approach in a Laboratory Experimental Case Study
Hashim Raza Rizvi
Department of Civil Engineering, University of Louisiana, Lafayette, LA, USA.
Address: P.O.Box 40643, Lafayette, LA70504, USA. E-mail: [email protected]
K E Y W O R D S A B S T R A C T
A R T I C L E I N F O
Value Stream Mapping, Muda, Heijunka, 5-S
Received June 2013 Accepted June 2013 Available online December 2013
Laboratory experiments are a conventional activity performed at academic institutions, government and private organizations. These experimental studies provide the basis for new inventions in the field of science and engineering. Laboratory experiments are conducted on the basis of provided guidelines, already established by different standard organizations like ASTM, AASHTO etc. This article is based on a case study in which the process of an experiment is examined on the basis of Value Stream Maps (VSM) and potential improvement possibilities have been identified. After determining the potential waste, appropriate Lean tools are selected to implement and observe the improvements. The process is examined after application of the Lean tools and a comparison is performed. University laboratory environment can be improved considerably by applying Lean Tools. MUDA application reduced the total work time from 90.75 hours and 10-CD to 63.75 hours and 7-CD hence saving, 27 hours and 3-CD for one experiment. This is remarkable achievement of this application. Heijunka application provided the students equal workload and they performed explicitly better than they used to. 5-S tool provided the students the opportunity to manage the laboratory in an effective and clean way. Safety of the students is a very major concern at university laboratory environment. 5-S not only upgraded the laboratory overall performance, but it significantly raised the safety standards of the laboratory. More application of the Lean Tools should be exercised explored to have more effective and efficient university laboratory experimental environment.

International Journal of Lean Thinking / Volume 4, Issue 2 (December2013)
2
INTRODUCTION
Laboratory experiments are a conventional activity performed at academic institutions,
government and private organizations. These experimental studies provide the basis for new
inventions in the field of science and engineering. Laboratory experiments are conducted on
the basis of provided guidelines, already established by different standard organizations like
ASTM, AASHTO etc. these procedures are comprehensively defined and organized. However,
experimental studies, especially in academic institutions, are performed on the basis of
experience and hit and trial basis because most of the time the experiments are performed to
establish new phenomena and explore new horizons.
In United States, academic institutions are performing exclusively in the field of engineering.
Fantabulous efforts are being made in the institutions to explore new area of research and
establish new concepts in the field of science and engineering. This effort eventually, requires
novel experimental methods and provides new experimental protocols. Waste is a common
by product in laboratory experimental environment, especially in academic institutions.
Insufficient training, lack of supervisory, inexperience, unsystematic performance measures,
lack of responsibility, inadequate material availability and above all lack of systematic
arrangement of laboratory and equipment are the few common reasons for this waste.
Academic institutions, especially public, are funded by the government for procurement.
Students are the major users of that procurement and their lack of responsibility towards
procedures and equipment is a major source of waste. Although, not all of these reasons can
be alleviated, however some areas can certainly be improved which can reduce waste in the
laboratory experimental study. In order to improve those areas, Lean Six Sigma approach is
utilized in this case study.
Lean manufacturing, lean enterprise, or lean production, often simply, "Lean," is a production
practice that considers the expenditure of resources for any goal other than the creation of
value for the end customer to be wasteful, and thus a target for elimination. Working from
the perspective of the customer who consumes a product or service, "value" is defined as any
action or process that a customer would be willing to pay for. Essentially, lean is centered on
preserving value with less work. Lean manufacturing is a management philosophy derived
mostly from the Toyota Production System (TPS) (hence the term Toyotism is also prevalent)
and identified as "Lean" only in the 1990s. TPS is renowned for its focus on reduction of the
original Toyota seven wastes to improve overall customer value, but there are varying
perspectives on how this is best achieved. The steady growth of Toyota, from a small company
to the world's largest automaker, has focused attention on how it has achieved this success.
(Jones, et al., 1990) and (Matthias, 2006).
Lean laboratory is also introduced by researchers and is implemented by different industrial
laboratories, especially in health laboratories (Graban, 2008). (Balaha, et al., 2010). No one
has yet introduced the Lean in academic laboratory environment where the work habits and
requirements are entirely different from the professional laboratories. Students are not paid
for laboratory work, rather it is an enjoyment for them to be in lab and play with the
instruments and materials. They do not take or willing to take the responsibility of the
laboratory work, rather it is part of their course work which is an additional work for them.
This article is based on a case study in which the process of an experiment is examined on the
basis of Value Stream Maps (VSM) and potential improvement possibilities have been

International Journal of Lean Thinking / Volume 4, Issue 2 (December2013)
3
identified. After determining the potential waste, appropriate Lean tools are selected to
implement and observe the improvements. The process is examined after application of the
Lean tools and a comparison is performed. Conclusion and summary is given at the end.
CASE STUDY:
Case study is a comparative study in which VSM approach is adopted to examine the
improvements. VSM is an approach in which a process is examined and flow is established on
the basis of the existing conditions. Then possible improvement areas are identified and
possible tools are selected to improve those areas. Then an improved process flow is produced
and compared with the existing work flow. The comparison of both is examined in order to
substantiate the effectiveness of application of Lean approach. In this case study a Highway
material Testing laboratory is selected, in which an experiment is conducted to improve the
contamination removal from the storm water of roads. A laboratory test is devised to perform
the experiment. The conventional OGFC samples were constructed using the limestone
aggregates and polymer modified asphalt binder, PAC30 obtained from the local contractors.
The mix design yielded 5.5% asphalt content and 22% total air voids in the mixture at 50
numbers of gyrations. All samples used in the study were 150 mm diameter and 51mm thick
with permeability values of 102 m/day and standard deviation of 10 m/day.
The particle size of GAC used was between 0.3 mm and 0.45 mm. GAC was evenly distributed
on the surface of OGFC sample at a required dosage (0.15%, 0.25%, 0.50%, and 0.75%) by
mass of OGFC sample. The sample was gently transferred to mechanical sieve shaker, fixed
firmly and shook for 30 minutes. Such shaking of the sample allowed the GAC particles to
penetrate into the sample’s interconnected voids. Four types of tests were conducted:
•Permeability Test
•Air void Calculation Test
•Total Organic Compound Test
•Total Suspended Solids Test
The non-value-added activities should be eliminated, reduced, or simplified. (Deborah, et al.,
2011). Although four steps have been mentioned by (Rother, et al., 1999), however we will
perform following number of steps in this case:
1.VSM project planning
2.Current state map
3.Lean tools
4.Future state map
5.Performance comparison
VSM Experiment Planning:
VSM technique suggests creating a process flow chart in order to better understand the
process existing situation and its current states. The current process is performed in
conventional way. The process flow chart is established based on the current process flow
Figure1. There are many types of wastes mentioned in the laboratory environment for
example: Lack of Focus, Long and Variable Lead Times, Ineffective Fast Track Systems, High
Leven of WIP, Volatile Incoming Workload etc. (Zidel, 2006). In our case the waste or non value
added activities are mentioned in the Table 1.

International Journal of Lean Thinking / Volume 4, Issue 2 (December2013)
4
Figure 1: Existing Process Flow Chart
Material inspection
Aggregates sieving
Aggregate Collection According to Gradation
Heating up the Oven
Aggregate Gradation and Binder Calculations
Putting Equipment and Aggregate in to Oven
Mixing of HMA
Putting Mixture Back into Oven
Compaction
Removal of HMA from the Mold
Cleaning All the Equipment
Physical Testing (Gmb, AV)
Cutting of HMA
Physical Testing of Cut Samples
Preparation of GAC (Carbon) to be put on the HMA
Permeability Test
Air Void Test
Total Suspended Solid test
Total Organic Compound Test
Results are calculated and compared
Results are Reported
FAIL
FAIL
F L O W
O F
S T E P S
International Journal of Lean Thinking / Volume 4, Issue 2 (December2013)
5
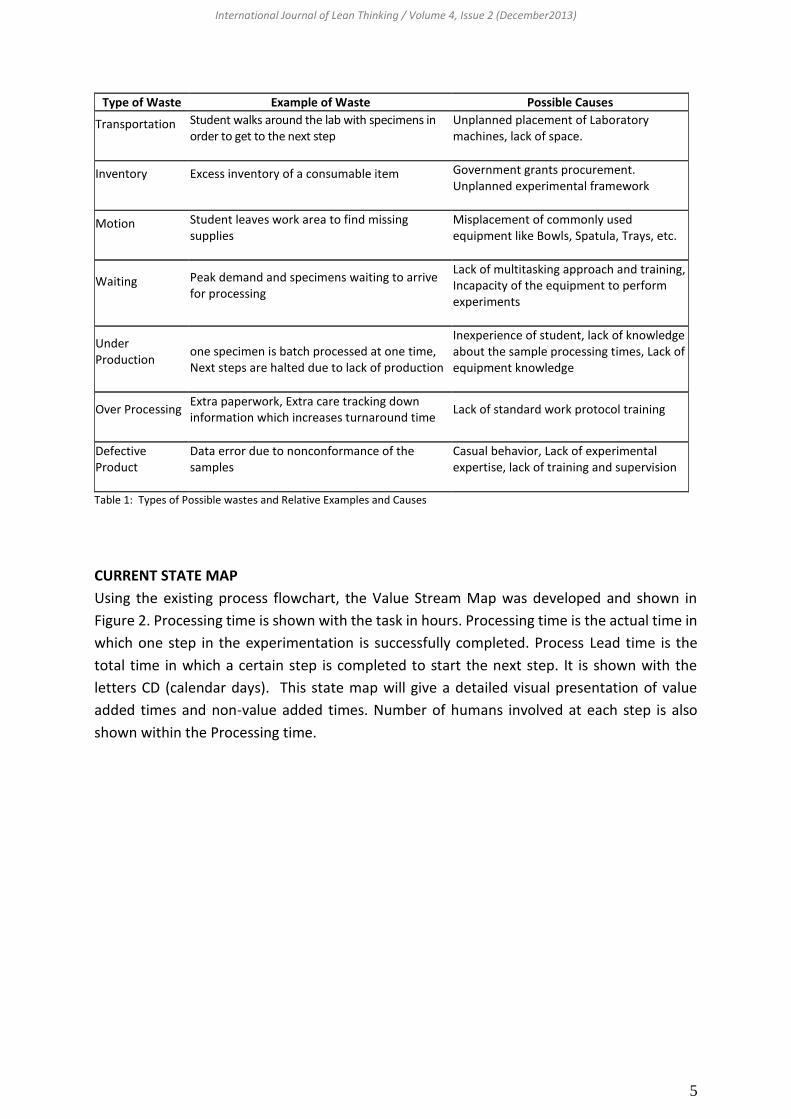
Type of Waste Example of Waste Possible Causes
Transportation Student walks around the lab with specimens in order to get to the next step
Unplanned placement of Laboratory machines, lack of space.
Inventory Excess inventory of a consumable item Government grants procurement. Unplanned experimental framework
Motion Student leaves work area to find missing supplies
Misplacement of commonly used equipment like Bowls, Spatula, Trays, etc.
Waiting Peak demand and specimens waiting to arrive for processing
Lack of multitasking approach and training, Incapacity of the equipment to perform experiments
Under Production
one specimen is batch processed at one time, Next steps are halted due to lack of production
Inexperience of student, lack of knowledge about the sample processing times, Lack of equipment knowledge
Over Processing Extra paperwork, Extra care tracking down information which increases turnaround time
Lack of standard work protocol training
Defective Product
Data error due to nonconformance of the samples
Casual behavior, Lack of experimental expertise, lack of training and supervision
Table 1: Types of Possible wastes and Relative Examples and Causes
CURRENT STATE MAP
Using the existing process flowchart, the Value Stream Map was developed and shown in
Figure 2. Processing time is shown with the task in hours. Processing time is the actual time in
which one step in the experimentation is successfully completed. Process Lead time is the
total time in which a certain step is completed to start the next step. It is shown with the
letters CD (calendar days). This state map will give a detailed visual presentation of value
added times and non-value added times. Number of humans involved at each step is also
shown within the Processing time.

International Journal of Lean Thinking / Volume 4, Issue 2 (December2013)
6
Figure 2 Current State Map with All Processing /Lead Times and Persons Involved in Steps

International Journal of Lean Thinking / Volume 4, Issue 2 (December2013)
7
We can see that there are 21 steps involved in this map. Detail of this map is discussed below.
PROCESS PROCESSING TIME LEAD TIME IMPROVEMENT?
Material Inspection 1 hr YES
Aggregate Sieving 24 hr 3 CD NO
Aggregate Gradation and binder Calculation 1 hr YES
Aggregate Collection 1 hr YES
Heating Up the Oven 1 hr YES
Putting Equipment and Aggregates in the oven 3 hr NO
Mixing of HMA 0.5 hr NO
Putting HMA mix back in oven 2 hr NO
Compaction 0.25 hr NO
Removal of HMA 1 hr NO
Cleaning All the Equipment 1 hr YES
Physical Testing 1 hr 1 CD NO
Cutting of HMA 1 hr YES
Physical Testing of Cut samples 1 hr 1 CD NO
Preparation of GAC 1 hr YES
PT 8 hr NO
AV test 1 hr NO
TSS Test 1 hr NO
TOC test 1 hr NO
Result and calculations 24 hr 3 CD YES
Report 16 hr 2 CD NO Table 2 Current State Map: Possible Improvements hr= Hours, CD=Calendar Days
Current state map was prepared and analyzed and all of 21 steps were shown in Table 2. The
activities given in the current value stream map were reviewed and analyzed to determine
possible areas that could be improved or eliminated to reduce waste in the process. A
summary of the possible areas of improvement is shown in Table 2. As indicated, there is the
possibility for improvement in each of the activities. The possible improvements are
mentioned across the steps.
LEAN TOOLS
Three lean tools were selected to be applied in this in order to improve the overall laboratory
experimental environment. those three tools are mentioned as under:
LEVEL THE LOAD AND THE MİX (HEİJUNKA)
At its simplest, leveling the load (overall workload) and the mix (the mix of sample types) is
about putting the same amount of work into the lab on a daily basis. This is probably the most
critical step and potentially the most beneficial for the majority of testing Laboratories.
Successfully leveling a volatile load and mix will significantly improve productivity and/or lead
time. The productivity improvement can be used to provide additional capacity or converted
into a cost reduction.

International Journal of Lean Thinking / Volume 4, Issue 2 (December2013)
8
ELİMİNATE WASTE (MUDA)
Lean laboratories continuously look to develop solutions and re-engineer processes to
eliminate or reduce the non value add and incidental tasks identified when ‘specifying value’.
THE 5 S's
There are five primary 5S phases: sorting, set in order, systematic cleaning, standardizing, and
sustaining.
Sorting
Eliminate all unnecessary tools, parts, and instructions. Go through all tools, materials, and so
forth in the laboratory and work area. Keep only essential items and eliminate what is not
required, prioritizing things per requirements and keeping them in easily-accessible places.
Everything else is stored or discarded.
Straightening or Setting in Order
Arranging tools, parts, and instructions in such a way that the most frequently used items are
the easiest and quickest to locate. The purpose of this step is to eliminate time wasted in
obtaining the necessary items for an operation.
Sweeping or Shining
Figure 3 Standardized cleaning-point at a 5S organized plant
Clean the workspace and all equipment, and keep it clean, tidy and organized. At the end of
each experiment, clean the work area and be sure everything is restored to its place. This
makes it easy to know what goes where and ensures that everything is where it belongs.
Standardizing
All work stations for a particular experiment should be identical. All students/researchers
doing the same job should be able to work in any station with the same tools that are in the
same location in every station. Everyone should know exactly what his or her responsibilities
are for adhering to the first 3 S's. Synonym: Systemize
Sustaining the Practice
Maintain and review standards. Once the previous 4 S's have been established, they become
the new way to operate. Maintain focus on this new way and do not allow a gradual decline
back to the old ways. While thinking about the new way, also be thinking about yet better
ways. When an issue arises such as a suggested improvement, a new way of working, a new
International Journal of Lean Thinking / Volume 4, Issue 2 (December2013)
9
tool or a new output requirement, review the first 4 S's and make changes as appropriate. It
should be made as a habit and be continually improved.
Future State Map
By applying the above mentioned lean tools the future state map was developed for the
laboratory experimental case study.
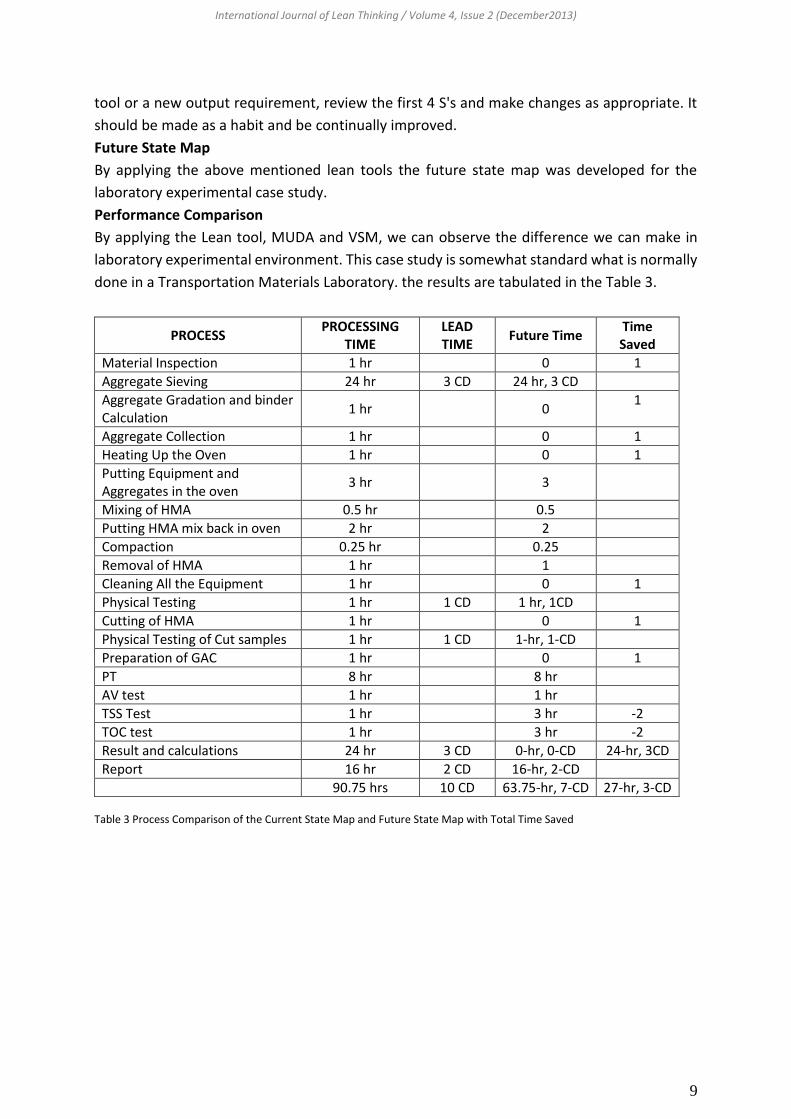
Performance Comparison
By applying the Lean tool, MUDA and VSM, we can observe the difference we can make in
laboratory experimental environment. This case study is somewhat standard what is normally
done in a Transportation Materials Laboratory. the results are tabulated in the Table 3.
PROCESS PROCESSING
TIME LEAD TIME
Future Time Time Saved
Material Inspection 1 hr 0 1
Aggregate Sieving 24 hr 3 CD 24 hr, 3 CD
Aggregate Gradation and binder Calculation
1 hr 0 1
Aggregate Collection 1 hr 0 1
Heating Up the Oven 1 hr 0 1
Putting Equipment and Aggregates in the oven
3 hr 3
Mixing of HMA 0.5 hr 0.5
Putting HMA mix back in oven 2 hr 2
Compaction 0.25 hr 0.25
Removal of HMA 1 hr 1
Cleaning All the Equipment 1 hr 0 1
Physical Testing 1 hr 1 CD 1 hr, 1CD
Cutting of HMA 1 hr 0 1
Physical Testing of Cut samples 1 hr 1 CD 1-hr, 1-CD
Preparation of GAC 1 hr 0 1
PT 8 hr 8 hr
AV test 1 hr 1 hr
TSS Test 1 hr 3 hr -2
TOC test 1 hr 3 hr -2
Result and calculations 24 hr 3 CD 0-hr, 0-CD 24-hr, 3CD
Report 16 hr 2 CD 16-hr, 2-CD
90.75 hrs 10 CD 63.75-hr, 7-CD 27-hr, 3-CD Table 3 Process Comparison of the Current State Map and Future State Map with Total Time Saved

International Journal of Lean Thinking / Volume 4, Issue 2 (December2013)
10
Figure 4 Future State VSM
Aggregates sieving, Material Testing, Aggregate Gradation and Binder calculations and Aggregate
Collection
Heating up the Oven, And putting the equipment and
aggregates in the oven
Mixing of HMA
Putting Mixture Back into Oven, Start Cleaning
Compaction
Removal of HMA from the Mold, Cleaning
Physical Testing (Gmb, AV), Cutting the Sample
Physical Testing of Cut Samples, Preparation of GAC
Permeability Test, Initial Results calculation
Air Void Test, Results Calculation
Total Suspended Solid test, Results Calculations
Total Organic Compound Test, Results Calculations
Results are Reported
PT-24 hr, 2-Persons
PT-3 hr, 1-Persons
PT-0.5 hr, 1-Persons
PT-2 hr, 1-Persons
PT-0.25 hr, 1-Persons
PT-1 hr, 1-Persons
PT-1 hr, 1-Persons CD-1
PT-1 hr, 1-Persons CD-1
PT-8 hr, 1-Persons
PT-2 hr, 1-Persons
PT-3 hr, 1-Persons
PT-3 hr, 1-Persons
PT-16 hr, 1-
Persons CD-2

International Journal of Lean Thinking / Volume 4, Issue 2 (December2013)
11
MUDA
It can be observed that by applying MUDA, 27 hours and 3 calendar days can be saved. Some
of the steps, which are shown 0 in column 4 of future time, can be jointed with the preceding
steps and a lot of time can be saved by applying Lean Tool.
HEİJUNKA
As mentioned earlier, Heijunka was also applied to the university laboratory experimental
environment. This tool was applied by making sure that every student works equal hours in
the laboratory in work shifts. These work shifts were assigned according to their flexibility to
maintain all the course work and make sure they perform all their required duties, other than
this course. The major issue in dealing with students is that they are not paid employees, as
we have in private laboratories. Most of the student take 3 courses on average in one
semester, especially graduate students. This is not only federal requirement to maintain their
status, yet they are always eager to finish the course work as soon as possible to get in the
professional life. This course load make it difficult for an instructor to make them work in
shifts, however, if it is managed properly it is possible. As in our case, we have 2 students, who
can work in flexible shifts. One more consideration in university environment is that students
do not mind to work at nights, rather most of them prefer to work at night as they are free
most the nights. So in this case we divided the day in three working shifts: each of 6 hours.
However, they were nor required to work in full stretch. they could flexibly schedule
themselves in 2 hours work shifts. This made it easier to apply Heijunka and distribute the
work load equivalently and to balance the experimental procedure more sophisticatedly.
5-S
Last tool which was applied in the university laboratory environment was 5-S. this is was the
most effective tool which could be applied in this sort of working environment, especially
when many people work at a place. Most of the manufacturing environment, people who
work at a station are classified. They always work at that station, hence it make it easier for
them to manage the station effectively. However, in laboratory experimental environment,
especially, in a university environment, this is not that easy. Many students, work in
laboratory, they put the things, at their convenience. Cleaning is a major issue in this
environment, as most of the Undergraduate students, only work there in their class time,
which is normally 2.5 hours. As soon as the time is up, they cannot stay there for cleaning, as
they normally, have to catch up with the next class. This application very difficult to apply in
this environment, however, we managed to apply this in bits. The course of application is
defined as following.
•It was make sure that the first laboratory class was just to let them know about the
laboratory, especially tools placement spots, safety considerations, cleaning techniques,
standardized work stations and straightening and setting in order.
•Every section of the laboratory was clearly labeled and highlighted with colors to have better
visual command.
•Each student had to go through all the laboratory rules and regulation page, and it was make
sure that they are graded on the basis of following those regulations.
International Journal of Lean Thinking / Volume 4, Issue 2 (December2013)
12
•student incentives, like bonus points, were introduced to work in proper places and putting
the tools back at the designated places and keeping their work stations clean.
•It was make sure that experiments should be finished within the 2 hour time and 30 minutes
were designated to shape up the laboratory back where they started from.
•If a certain experiment needs more than two class time, then the students were assigned
duties to perform their tests after the class hour, however, they had to sign a sheet in which
they were bound to sign that they reorganized the laboratory after completion of the
experiment.
•Last laboratory class was designated to reorganize the laboratory for the next semester
students, back in shape where they started from. This 5-S laboratory was assigned bonus
points, as whoever took part in this will be awarded extra points for his/her effort.
CONCLUSIONS
The following conclusions were derived from this case study.
1.University laboratory environment can be improved considerably by applying Lean Tools.
2.MUDA application reduced the total work time from 90.75 hours and 10-CD to 63.75 hours
and 7-CD hence saving, 27 hours and 3-CD for one experiment. This is remarkable
achievement of this application.
3.Heijunka application provided the students equal workload and they performed explicitly
better than they used to.
4.5-S tool provided the students the opportunity to manage the laboratory in an effective and
clean way.
5.Safety of the students is a very major concern at university laboratory environment. 5-S not
only upgraded the laboratory overall performance, but it significantly raised the safety
standards of the laboratory.
6.More application of the Lean Tools should be exercised explored to have more effective and efficient university laboratory experimental environment.
International Journal of Lean Thinking / Volume 4, Issue 2 (December2013)
13
REFERENCES: Balaha, J., White, M. J. http://www.isixsigma.com/methodology/kaizen/power-lean-laboratory-clinical-application; 2010. Deborah, F., Lee, J. Lean Construction Submittal Process-A Case Study 2011; 23; 1-10 (Quality Engineering). Graban, M., Padgett, S. Lean Laboratories: Competing with Methods From Toyota 2008; 39; 645-648 (Labmedicine). Womac, J., Jones, T., Roos, D. The Machine That Changed The World. New York; 1990. Matthias, H. The Genealogy of Lean Production 2006; 420-437 (Journal of Operations Management). Rother, M., Shook, J. Learning to See—Value Stream Mapping to Add Value and Eliminate Muda. Brookline: New York; 1999. Zidel T. A Lean Guide To Transforming Healthcare. Milwaukee: Wisconsin; 2006.


![University of Mumbai [1] RIZVI EDUCATION SOCIETY'S RIZVI .... Sem IV- Regular.… · PROGRAMME: BACHELOR OF COMMERCE- ACCOUNTING & FINANCE (B.COM.- A. & F.) SEMESTER- IV [4] RIZVI](https://static.fdocuments.in/doc/165x107/600174755bcc726418541603/university-of-mumbai-1-rizvi-education-societys-rizvi-sem-iv-regular.jpg)


