Hasbro First Quarter 2012 Earnings April 23,...
22
Hasbro First Quarter 2012 Earnings April 23, 2012
-
Upload
nguyenhanh -
Category
Documents
-
view
212 -
download
0
Transcript of Hasbro First Quarter 2012 Earnings April 23,...

Hasbro First Quarter 2012 Earnings April 23, 2012

2
Safe Harbor
This presentation contains forward-looking statements concerning management's expectations, goals, objectives and similar matters, which are subject to risks and uncertainties. These forward-looking statements may include comments concerning our product and entertainment plans, anticipated product performance, business opportunities and strategies, costs, financial goals and expectations for our future financial performance and achieving our objectives. There are many factors that could cause actual results and experience to differ materially from the anticipated results or other expectations expressed in these forward-looking statements, including consumer and retailer interest in and acceptance of our products and product lines, changes in marketing and business strategies as well as future global economic conditions, including foreign exchange rates. Some of those factors are set forth in the Company's Annual Reports on Form 10-K, in the Company's Quarterly Reports on Form 10-Q, in the Company's Current Reports on Form 8-K, the risk factors in the earnings release for the first quarter and in the Company's other public disclosures. The Company undertakes no obligation to make any revisions to the forward-looking statements contained in this presentation to reflect events or circumstances occurring after the date of this presentation.
3
First Quarter 2012 Snapshot
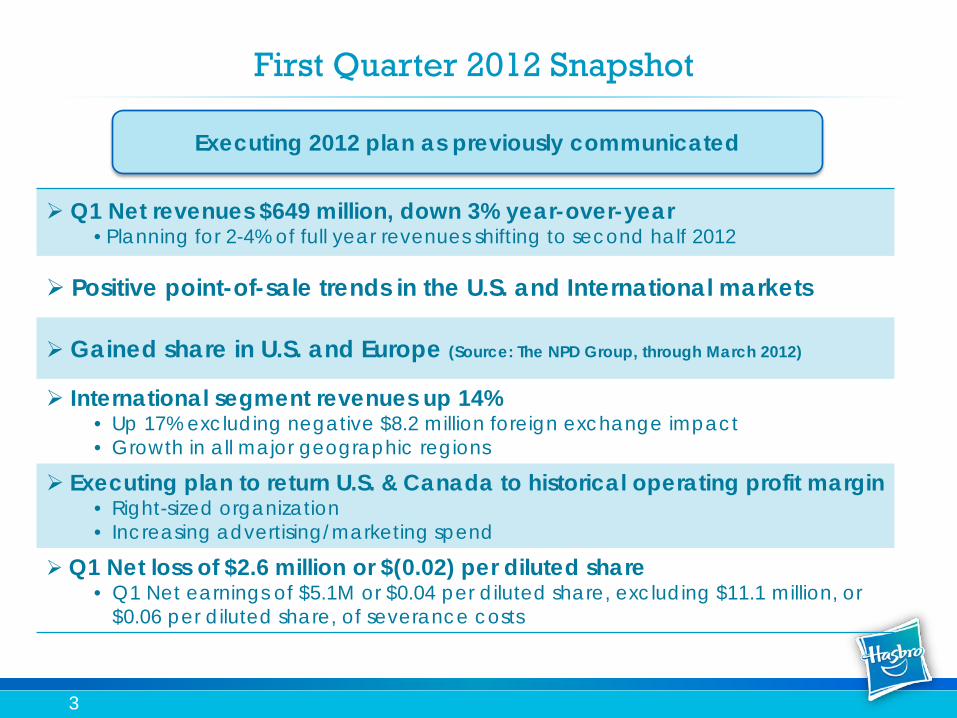
Executing 2012 plan as previously communicated
Q1 Net revenues $649 million, down 3% year-over-year • Planning for 2-4% of full year revenues shifting to second half 2012
Positive point-of-sale trends in the U.S. and International markets
Gained share in U.S. and Europe (Source: The NPD Group, through March 2012)
International segment revenues up 14% • Up 17% excluding negative $8.2 million foreign exchange impact • Growth in all major geographic regions
Executing plan to return U.S. & Canada to historical operating profit margin • Right-sized organization • Increasing advertising/marketing spend
Q1 Net loss of $2.6 million or $(0.02) per diluted share • Q1 Net earnings of $5.1M or $0.04 per diluted share, excluding $11.1 million, or
$0.06 per diluted share, of severance costs

4
Consistent with plan for full year 2012 to shift revenues to later in the year - better align with consumer demand
Negative foreign exchange impact of $8.5 million
First Quarter 2012 Revenues
$672 $649
$-
$200
$400
$600
$800
2011 2012
Quarterly Revenues
11.9% 14.7% ($ millions)
-3%

5
First Quarter 2012 Segment Revenues
$391 $254
$25
$329 $290
$29 $-
$100
$200
$300
$400
U.S. & Canada International Entertainment & Licensing
2011 2012
% 14.5% 14.7% ($ millions)
U.S. & Canada Positive point-of-sale;
Retail inventories down; Aligning shipments with
consumer demand
-16%
+14%
+19%
International Shipment and point-of
sale momentum continues; Growth in
Boys & Games; Preschool flat
Entertainment & Licensing
Global television programming;
TRANSFORMERS movie & licensed revenues

6
First Quarter 2012 Net Revenues By Region
($ millions) 2012 2011 % Change U.S./Canada Segment $329 $391 -16%
Europe 208 185 +13%
Latin America 39 31 +23%
Asia Pacific 43 38 +13%
International Segment 290 254 +14%
Entertainment & Licensing 29 25 +19%
Global Operations 1 2 ---
Total Net Revenues $649 $672 -3%
Growth in all major geographic regions outside U.S. & Canada

7
First Quarter 2012 Net Revenues By Product Category
($ millions) 2012 2011 % Change
Boys $ 303 $ 290 +4%
Games 182 201 -9%
Girls 93 113 -18%
Preschool 70 68 +2%
Other 1 0 ---
Total $ 649 $ 672 -3%

8
First Quarter 2012 Major Expense Items
($ millions) 2012 % of Sales
% Change Notes
Cost of Sales $ 257 39.6% -4% Product mix and severance costs
Royalties $ 52 8.1% +21% Strong sales of entertainment properties; Target 7%-8% of revenues FY 12
Product Development $45 6.9% -2% Target ~4.5% of FY 12 revenues
Advertising $65 10.0% -2% Target 10%-11% of FY 12 revenues
Amortization of Intangibles $11 1.7% --- $48M estimate for FY 12
Program Production Cost Amortization $3 0.5% --- $60M-$70M estimate for FY 12
Selling, Distribution & Administration $200 30.8% +7%
Severance costs and extra week of expenses offset lower overall expense levels
Note: Severance impact by major expense item provided on next slide

9
First Quarter 2012 Severance Cost Breakdown
($ millions) 2012 Cost of Sales $2.8 Product Development $2.4 SD&A $5.9 Total $11.1
Severance Impact by Major Expense Item

10
First Quarter 2012 Operating Profit
$49
$16
$- $10 $20 $30 $40 $50 $60
2011 2012
Quarterly Operating Profit
11.9% 14.7% ($ millions)
-68%
• $11.1M in severance costs
• Lower revenue in the quarter
• Extra week of certain expenses in
Q1 ’12
Negative impact on OP

11
First Quarter 2012 Segment Operating Profit
$41
$(2) $5
$14
$(5) $8
$(10)
$-
$10
$20
$30
$40
$50
U.S. & Canada International Entertainment & Licensing
2011 2012
12.3% 14.5% 14.7% ($ millions)
-65%
-193% +42%
U.S. & Canada Lower revenues;
severance; extra week; underlying expenses are
down
International Emerging market
expansion; severance; underlying profit similar
to Q1 11
Entertainment & Licensing
Higher revenues; better expense leverage

12
Net Earnings of $5.1 million or $0.04 excluding $11.1M in severance costs
Underlying tax rate of 26.0%
Average diluted shares 129.6M Note: If Hasbro reported net earnings in Q1 12, average diluted
shares would have been 131.6M
First Quarter 2012 Net Earnings
$17
$(3)
$(5)
$-
$5
$10
$15
$20
2011 2012
Quarterly Net Earnings (Loss)
11.9% 14.7% ($ millions, except per share)
$0.12 per share
$(0.02) per share

13
First Quarter 2012 Key Cash Flow & Balance Sheet Data
($ millions) 2012 Notes Cash $884 Majority outside the U.S.
Depreciation $19 Target similar to 2011
Amortization $11 Target $48M for FY 12
Television Program Spending $14 Target $70-$80M for FY 12
Capex $23 Target $125-$135M for FY 12
Dividends $39 Increased 20% on 2/2/12 – payable 5/15/12
Stock Repurchase $5 Approx. 140,000 shares at $35.80
Operating Cash Flow (Q1) (Trailing Twelve Months)
$285 $404
Target $500M on average per year
Accounts Receivable $457 DSOs at 63 days, down 12 days year-over-year
Inventory $397 Well positioned for 2012

14
Dividends
$-
$0.20
$0.40
$0.60
$0.80
$1.00
$1.20
$1.40
$1.60
2003 2004 2005 2006 2007 2008 2009 2010 2011 2012
0% 100%
50% 33%
33%
25% 0%
25%
20%
20%
• 20% Quarterly dividend increase announced 2/2/12
• Dividend payable 5/15/12 to shareholders of record at the close of business 5/1/12
Ann
ual D
ivid
end
Ra
te
2012 projected based on $0.36/share quarterly dividend rate approved by the Board on 2/2/12
15
Stock Buyback
$-
$100
$200
$300
$400
$500
$600
$700
2005 2006 2007 2008 2009 2010 2011 2012 YTD
$48
$457
$587
$358
$91
$637
$423
$5
$ M
illion
s
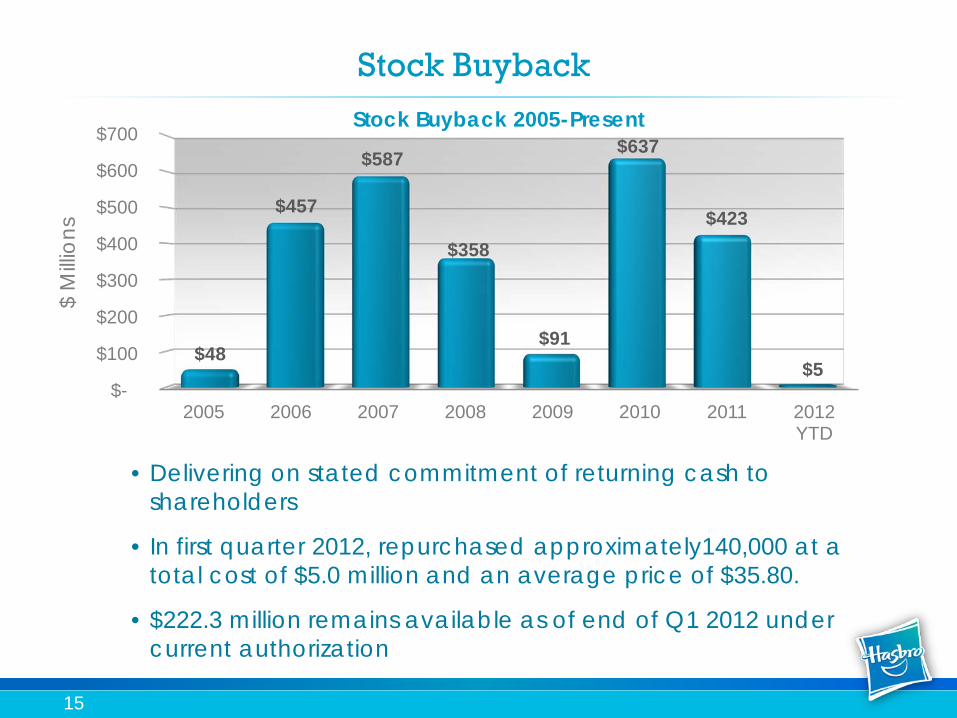
• Delivering on stated commitment of returning cash to shareholders
• In first quarter 2012, repurchased approximately140,000 at a total cost of $5.0 million and an average price of $35.80.
• $222.3 million remains available as of end of Q1 2012 under current authorization
Stock Buyback 2005-Present

16
Entertainment Update: Television
• Shows airing in 160+ countries
• 6 of the top10 shows on THE HUB in Q1
• Signed multi-year deal in April with Netflix for 10 shows
• 32% Ratings growth in Q1 ’12 vs. Q1 ’11 - Total Day against K2-11
• New Hasbro Studios and third party series launching

17
Entertainment Update: 2012 Feature Film Schedule
Film Scheduled Release Date
Scheduled Product On Shelf Date
Partner/Studio
Star Wars Episode 1 (3D) 2/10/12 Q4 11/Q1 12 Lucasfilm
Marvel’s The Avengers International U.S.
4/26/12 5/04/12
Q1 12 Q1 12
Marvel
Battleship International U.S.
4/11/12 5/18/12
Q2 12 Q2 12
Universal
G.I. Joe: Retaliation 6/29/12 Q2 12 Paramount
The Amazing Spider-Man 7/03/12 Q2 12 Marvel/Sony

18
Innovation
New Initiatives
International Business & Regaining U.S. Momentum
Immersive Experiences
Hasbro’s Branded Play Blueprint
Focused on Executing Our Strategy

Appendix
20
First Quarter 2012 Income Statement
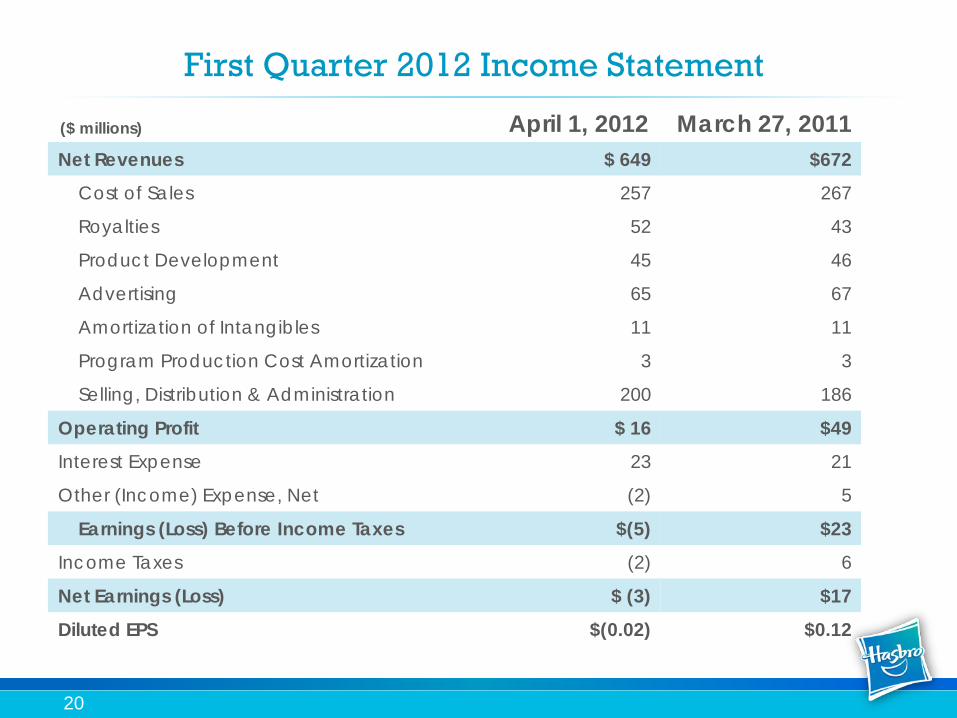
($ millions) April 1, 2012 March 27, 2011 Net Revenues $ 649 $672
Cost of Sales 257 267
Royalties 52 43
Product Development 45 46
Advertising 65 67
Amortization of Intangibles 11 11
Program Production Cost Amortization 3 3
Selling, Distribution & Administration 200 186
Operating Profit $ 16 $49
Interest Expense 23 21
Other (Income) Expense, Net (2) 5
Earnings (Loss) Before Income Taxes $(5) $23
Income Taxes (2) 6
Net Earnings (Loss) $ (3) $17
Diluted EPS $(0.02) $0.12

21
First Quarter 2012 Balance Sheets
($ millions) April 1, 2012 March 27, 2011 Cash $884 $928
Accounts Receivable 457 559
Inventory 397 401
Other Current Assets 281 173
Total Current Assets 2,019 2,061 Property, Plant & Equipment, Net 223 238
Other Assets 1,655 1,641
Total Assets $3,897 $3,940 Short Term Borrowings $171 $38
Payables & Accrued Liabilities 555 588
Total Current Liabilities 726 626 Long-term Debt 1,401 1,397
Other Liabilities 373 386
Total Liabilities $2,500 $2,409 Total Shareholders’ Equity $1,397 $1,531
Total Liabilities & Shareholders’ Equity $3,897 $3,940

22
($ millions) 2012 2011 Operating Cash Flows $ 285 $ 276
Investing Cash Flows:
Capex (23) (22)
Other 7 (2)
Total Investing (16) (24)
Financing Cash Flows:
Short Term Borrowings (10) 24
Stock Repurchases (5) (58)
Dividends (39) (34)
Stock Options 23 11
Total Financing (31) (57)
FX Impact on Cash 4 5
Beginning Cash 642 728
Ending Cash $ 884 $ 928
First Quarter 2012 Condensed Cash Flow