Harvey Nash CIO Survey 2015 · in association with HARVEY NASH CIO SURVEY 2015 IN ASSOCIATION WITH...
80
in association with HARVEY NASH CIO SURVEY 2015 IN ASSOCIATION WITH KPMG INTO AN AGE OF DISRUPTION
Transcript of Harvey Nash CIO Survey 2015 · in association with HARVEY NASH CIO SURVEY 2015 IN ASSOCIATION WITH...
in association with
HARVEY NASHCIO SURVEY 2015IN ASSOCIATION WITH KPMG
INTO AN AGE OF DISRUPTION

Introduction - The Watering Hole 3 The CIO Survey infographic 4 Executive summary 6The DNA of a disruptive CIO 8CFO or CEO - your boss and your priorities 9
1. Global Results 111.1 CIO priorities 12 1.2 People, skills and talent 17 1.3 Digital disruption 22 1.4 Managing the technology function 291.5 CIO careers 35
2. Regional Results 392.1 APAC 402.2 Australia 422.3 Belgium 442.4 China / Hong Kong 462.5 Finland 482.6 France 50 2.7 Germany 522.8 Ireland 542.9 Italy 562.10 The Netherlands 582.11 The Nordics 602.12 Norway 622.13 Poland 642.14 Scotland (UK) 662.15 Sweden 682.16 Switzerland 702.17 UK 722.18 US 742.19 Vietnam 76
Conclusion by KPMG 78
About the Survey and Participants The Harvey Nash CIO Survey 2015, in association with KPMG, collected data between 6th January and 19th April 2015 and represents the views of 3,691 technology leaders from more than 30 countries, with a combined IT spend of over $200bn. Of the respondents, 33 per cent identified themselves as CIOs, 9 per cent as CTOs, 32 per cent as director / VP in technology and the remaining 26 per cent were spread between a broad range of roles including CEO, COO, CDO and senior executives. The currency used in this survey is US Dollar (USD); at the launch of the survey the conversion rate was GBP 1 = USD 1.51 / Euro 1 = USD 1.18.

THE WATERING HOLENo technology leader needs to be told that the pace of technological change is quickening. They, perhaps more than any other executive, see it everywhere. Whether it’s the ‘big’ things like the board looking for guidance about how technology can create new business models, to the more prosaic, like walking into an executive meeting and seeing a peer proudly accessing the network holding a non-standard (and perhaps non-secure) new device, the CIO sees it all.
In the past, the IT organisation was like a water company; a natural monopoly strictly plumbed into, and in control of, everything we did. But things are changing, and today much of what IT does might be better described as a ‘watering hole’; a place that attracts, unites and gives fuel to often quite disparate groups of people who are there by choice, not compulsion. For the CIO, the difference can be radical; control is replaced by influence, structure by fluidity, certainty by ambiguity.
This year’s Harvey Nash CIO Survey, published in association with KPMG, and proudly presenting the views of almost 4,000 technology leaders, shines a light on these important changes. From board priorities to business relationships to careers, the CIO Survey provides insights and guidance about how to succeed in this fast-changing environment.
Despite the world becoming more ambiguous, one thing is for certain: it has never been a more exciting time to be a technology leader.
Albert EllisChief ExecutiveHarvey Nash Group
Marc SnyderManaging DirectorCIO AdvisoryGlobal Centre of ExcellenceKPMG in the US

WHAT'SON YOUR MIND?
CIO PRIORITIES
PEOPLE, SKILLS AND TALENT
IT projects thatMAKE money 66%
IT projects thatSAVE money 34%
Technology skills shortage is
getting worse
face skills shortage59%
BOARD PRIORITIES: TOP THREE:Improving business processes Operational efficienciesDelivering consistent and stable IT
123
BOARD PRIORITIES: FASTEST GROWING:Delivering business intelligence / analyticsBetter engagement with customers/prospectsReputation management via social media technology
Improving the relationship between IT & Marketing:only 33% rate it as ‘very strong’, but it is up from 30% since 2014.
123
FASTEST GROWING SKILLS DEMAND:Big data / analytics Change managementDevelopment
123
GREATEST FALL IN SKILLS DEMANDTechnical architectureEnterprise architectureBusiness analysis
Competition for talent is fierce.CIOs increasing technology headcount is at a five-year high.
123
the proportion of women in IT leadership roles responding to the CIO Survey remainsstubbornly low
8%2015
7%2014
9%2013
7%2012
CIO salary growth appears to have stalled (three in ten CIOs enjoyed an increase in salary in 2015, but the vast majority of CIOs (62%) did not see their salary rise.)
Benefits are on offer for more CIOs (72% receive benefits - including car, short and long term incentive plans, shares or equity)
DIGITAL DISRUPTION
MANAGING THE TECHNOLOGY FUNCTION
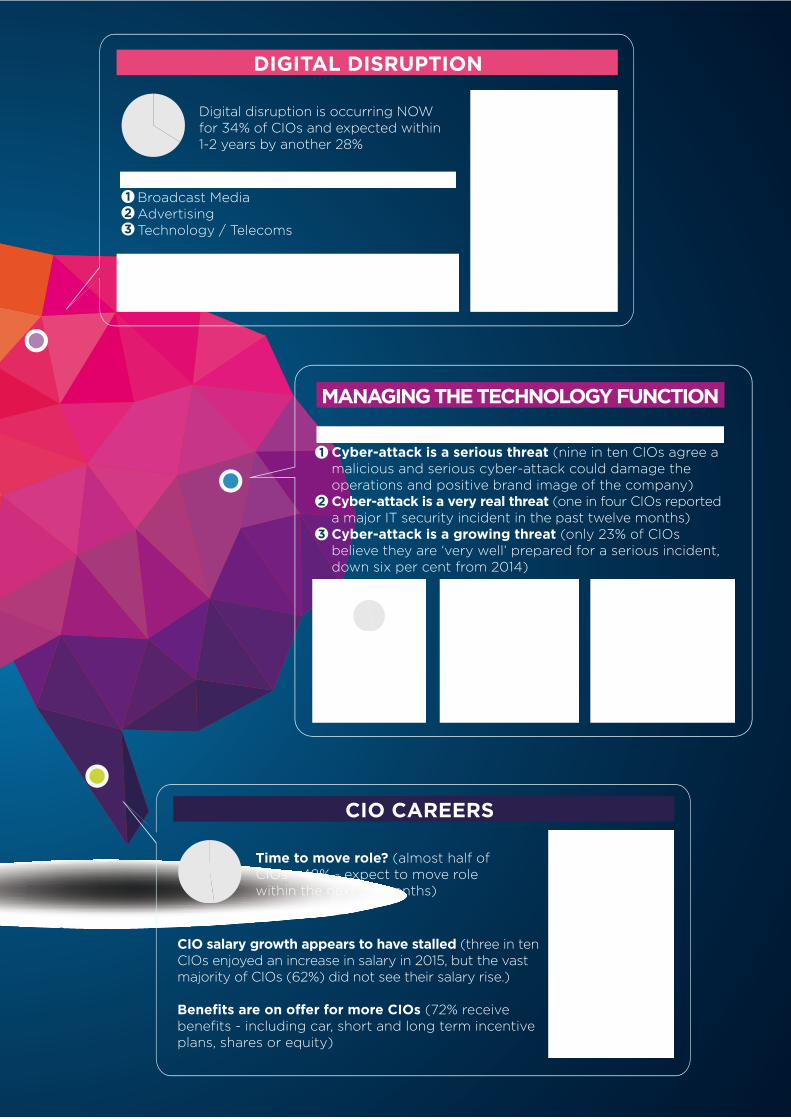
CYBER SECURITY CONCERN IS GROWINGCyber-attack is a serious threat (nine in ten CIOs agree a malicious and serious cyber-attack could damage the operations and positive brand image of the company)Cyber-attack is a very real threat (one in four CIOs reported a major IT security incident in the past twelve months)Cyber-attack is a growing threat (only 23% of CIOs believe they are ‘very well’ prepared for a serious incident, down six per cent from 2014)
1
2
3
MOST AFFECTED BY DIGITAL DISRUPTION NOWBroadcast MediaAdvertisingTechnology / Telecoms
IT Budgets are increasing
(for 44% of CIOs)
CIOs report that anything between one per cent and30 per cent of their organisation's annual sales (or public sector total budget) is spent on technology.
IT Outsourcing intent is increasing (three times as many CIOs will increase outsourcing spend in 2015 compared to those cutting back)
Time to build digital infrastructure: 56% will focus on this to allow greater innovation / agility
Digital disruption is occurring NOW for 34% of CIOs and expected within 1-2 years by another 28%
123
Greater ITresponsibilityfor digital(8% more CIOs reporting digital ownership this year)
A new colleague: the Chief Digital Officer(17% of organisations now have one, up from 7% last year)
CIO CAREERS
Time to move role? (almost half of CIOs - 48% - expect to move role within the next 24 months)
810
The CIO is a challenging, but a happy, role (eight out of ten CIOs report that they are either ‘fulfilled’ or ‘very fulfilled’, a slight increase of two per centsince 2014.)
EXECUTIVE SUMMARY
This year, the Harvey Nash CIO Survey in association with KPMG, has seen the biggest response from CIO leaders in its 17-year history. Between January and April, nearly 4,000 IT executives from more than 50 countries completed the 69-question poll.
Over a quarter of a million data points have been recorded. We believe that this is the largest survey of IT leadership in the world.
As expected, there was a great deal of variety in CIO opinion across such a diverse span of regions. However, one very clear trend emerged: the industry is changing rapidly and CIOs are telling us that speed is a top priority. Digital innovation is actively causing disruption to business models and IT leaders are moving swiftly to deliver new infrastructure, platforms and applications to meet fast-changing customer needs.
In terms of challenges, CIOs are reporting that key skills are now much in demand. In certain hotspots, there are chronic shortages. Many IT leaders tell us that this issue is holding them back and as a result, we note that salaries in key skill areas are rising.
All this contributes to a challenging, complex and constantly shifting landscape for the CIO. And their response? They’ve never been happier. Job satisfaction is heading towards historic highs. In terms of strategic impact there is also good news. Over the last six years, we have seen the relevance of CIOs in the board room steadily advance. In some corporations, CIOs are leading the post-crash transformation activities on behalf of their enterprise.
The CIO landscape is changing as business priorities shiftFor the first time in several years, we have seen a change in relative priorities. Business intelligence and analytics has surged in importance. Growth compared to last year is running at three times any other priority on our list. We believe that as a result of digital disruption, many organisations are changing their investment priorities. Additionally, customer relations and social media technologies are
starting to take hold. That said, traditional growth area skills such as project management continue to be in demand.
People, skills and talent are at the forefront of CIO decision makingTechnology skills shortages remain a pressing concern. Nearly six out of ten CIOs believe that skills shortages will prevent their organisation from keeping up with the pace of change. This is a trend which started last year and it appears to be accelerating. Skills concerns are running one-third higher than in 2013.
The skills that CIOs feel their teams need in order to keep up with the pace of technology change have also shifted in the past 12 months. There has been massive increase in demand for big data analytic skills - almost six times higher than the rise in the next most in-demand skill, change management. More than four in ten leaders are also looking to stiffen their teams by injecting new blood in the coming months. This reflects an ongoing and consistent trend in positive recruitment intent by CIOs since the end of the recession.
The era of digital disruption is here, but no consistent models are in place to deal with itAcross the three years that we have tracked digital influence, the dynamics have been constantly shifting. An overwhelming two thirds of CIOs believe digital ‘disruption’ is now a very significant change to business. They tell us that they believe this disruption will create new business models, products and services that are expected to outperform the old ones. Only one in ten CIOs believe their organisation will be unaffected by digital disruption in the coming years. More than a third of CIOs say they are responding to disruption ‘now’, while three in ten CIOs expect to be managing disruption within 24 months.
Last year, we found that many Chief Marketing Officers (CMOs) were owning and leading the digital agenda. This is changing. Today we are seeing some evidence of a ‘boomerang’ effect, where IT organisations are either collaborating with the CMOs or taking on the responsibility for themselves. Additionally, there has been a significant increase in the number of Chief Digital Officers appearing in the IT landscape. Almost one in five CIOs now work with a Chief Digital Officer (CDO) – a huge jump up from a mere seven per cent last year. An additional five per
cent of CIOs report that hiring is underway for a CDO in 2015. That said, ownership of digital, even with a CDO in place, appears to remain quite fluid for many. Amongst the wide range of responses, there seems to be no standard operating model or any blueprint emerging to help organisations address their digital challenges.
Cyber security is a real headache, but CIOs are not letting it inhibit innovationBoards and executive teams are increasingly becoming aware that cyber-attack is not just a technology risk, but a real business risk. Recent high profile media coverage of hackings into major global brands and major government institutions has no doubt helped affirm this. One in four CIOs reported that their organisations have had to deal with a major IT security incident in the past 12 months. However, critically, while security concerns are keeping CIOs awake at night, an overwhelming majority believe that the security measures they put in place do not materially inhibit their ability to innovate.
IT budget growth continues, but Shadow IT is alive and wellCIOs report that anything between one per cent and 30 per cent of their organisation's annual sales (or public sector total budget) is spent on technology. Manufacturing, construction and engineering are the most conservative (spending one - three per cent), while technology, telecoms, media and financial services all invest more than ten per cent of their sales revenue or public sector budget into IT.
Happily, almost half of CIOs have been allocated budget increases in the past 12 months and this is being directed towards projects which deliver benefits and make money for their organisations. However, challenges remain. Shadow IT, where the CIO does not control the budget, is still a significant force. While nearly half of CIOs give up less than five per cent of their IT budgets to their user community, some IT organisations are struggling, with many only able to control 80 per cent or even less of the technology budget.
Outsourcing is increasingly being used to acquire skills rather than to save moneyAs in previous years, CIOs often prefer to outsource software development and data centre functions. However, the reasons for outsourcing seem to be changing. Over the last five years there has been a
steady shift away from using outsourcing as a means to save money. Instead, many IT leaders now see outsourcing as a valuable way of acquiring new skills. Half of CIOs report increasing their dependence on partners to access skills not available in-house, or to free up internal resources.
A happy CIO does not necessarily mean a settled CIOCIOs remain fulfilled in their role. Eight out of ten report that they are either ‘fulfilled’ or ‘very fulfilled’, a slight increase of two per cent since 2014. However, perhaps mindful of the short life expectancy of a CIO, many leaders remain active in the career market. Three in ten moved jobs in the last 24 months, while almost six in ten CIOs have changed roles since 2010. The average life expectancy of a CIO does not seem to be increasing in these fast-paced times.
In terms of remuneration, the pace of CIO salary growth seen in the last few years appears to be slowing. While three in ten CIOs enjoyed an increase in salary in 2015, the vast majority of CIOs did not see any salary rise, with their total benefits package remaining essentially unchanged from 2014. Yet CIOs are positive. Memories from the worst of the recessionary years still linger, with CIOs admitting that even sluggish remuneration inflation is better than the negative salary inflation seen in the trough of the recession.
2015 is going to be a tough but exciting yearOverall, this year’s survey responses tell us that CIOs remain optimistic and that most are excited about the challenges ahead. There seems little doubt that the digital revolution is real and that IT leaders across the world are moving rapidly to exploit the new opportunities. Many of the old problems however, remain. Business change projects are often poorly executed and relationships with key stakeholders are challenging, but we sense a pervasive mood of optimism across the industry. For IT staff, new skills are required to deal with change and the smartest CIOs are often looking beyond the obvious, sometimes even beyond the traditional IT department, to secure new talent. The green shoots of positive sentiment we reported last year now seem to be growing and momentum is gathering. 2015 looks to be a tough but nonetheless exciting time to be an IT leader.
Dr Jonathan MitchellNon-Executive Chairman of Global CIO Practice, Harvey Nash
THE DNA OF A DISRUPTIVE CIO
We compared organisations that expect to perform ‘Much better’ than competitors on digital, to ones that expect to perform ‘Slightly worse’ or ‘Much worse’. Organisations
with the strongest digital outlook are more likely to have…
There is, alas, no instruction manual for creating a market beating digital strategy. However, there are remarkable similarities between organisations that are making a success
of it. An impassioned and committed CEO is one element. An innovative and ‘failure friendly’ culture is another. But in many cases the glue that seems to hold it together is a CIO who has
the ambition, relationships and influence to enable it all to happen.Marc Snyder , Managing Director, CIO Advisory Global Centre of Excellence, KPMG in the US
AN ENTERPRISE WIDE DIGITAL
STRATEGY(49%, compared to 15% for worse
performing organisations)
A CDO / OR INTEND TO EMPLOY ONE
(30%, compared to 15%)
A GROWING IT BUDGET
(61%, compared to 29%)
A DIGITAL STRATEGY OWNED JOINTLY BY IT AND
MARKETING(45%, compared to 35%)
A CEO FOCUSED ON MAKING RATHER
THAN SAVING MONEY
(83%, compared to 50%)
A CIO WITH A ‘VERY STRONG’RELATIONSHIP
WITH MARKETING (44%, compared to 21%)
CFO OR CEO – YOUR BOSS AND YOUR PRIORITIES
We compared CIOs who reported to the CFO with ones that had a CEO for a boss and picked out some differences, and some (perhaps surprising) similarities. CIOs who report to CFOs are:
TASKED BY THE BOARD WITH THE SAME TOP THREE
PRIORITIES AS CEO REPORTS
(increase efficiency, improve business processes, deliver
stable IT)
MORE LIKELY TO HAVE A CEO THAT
FOCUSES ON PROJECTS THAT
SAVE RATHER THAN MAKE MONEY
(43%, compared to 26% of CEO reports)
MORE LIKELY TO ENJOY PROJECT SUCCESS WITH
INTERNAL BUSINESS SYSTEMS LIKE ERP
AND FINANCE (CEO reports are more likely to have success with external systems like
web, mobile and big data)
SLIGHTLY MORE LIKELY TO HAVE MORE THAN 10% OF IT BUDGET
OUTSIDE THE IT DEPARTMENT’S
CONTROL (33%, compared to 28% of CEO
reports)
EQUALLY AS LIKELY TO HAVE HAD AN IT BUDGET INCREASE IN THE LAST YEAR
(49%, compared to 51% of CEO reports)
EQUALLY AS HAPPY IN
THEIR ROLE(eight in ten CFO and CEO reports were at least ‘quite’
fulfilled)
In the past, CIOs who reported to CFOs have often been seen as ‘different animals’ to their CEO reporting peers. Today, whilst there are still differences, what is striking is just how similar they are becoming. The role of the CIO is becoming more strategic,
more networked and more relationship driven than ever before, and this is an evolution that seems to be happening to all CIOs, regardless of reporting line.Jonathan Mitchell, Non-Executive Chairman, Harvey Nash CIO Practice


1. GLOBAL RESULTS
HARVEY NASH CIO SURVEY 201512
1. GLOBAL RESULTS
1. GLOBAL RESULTS
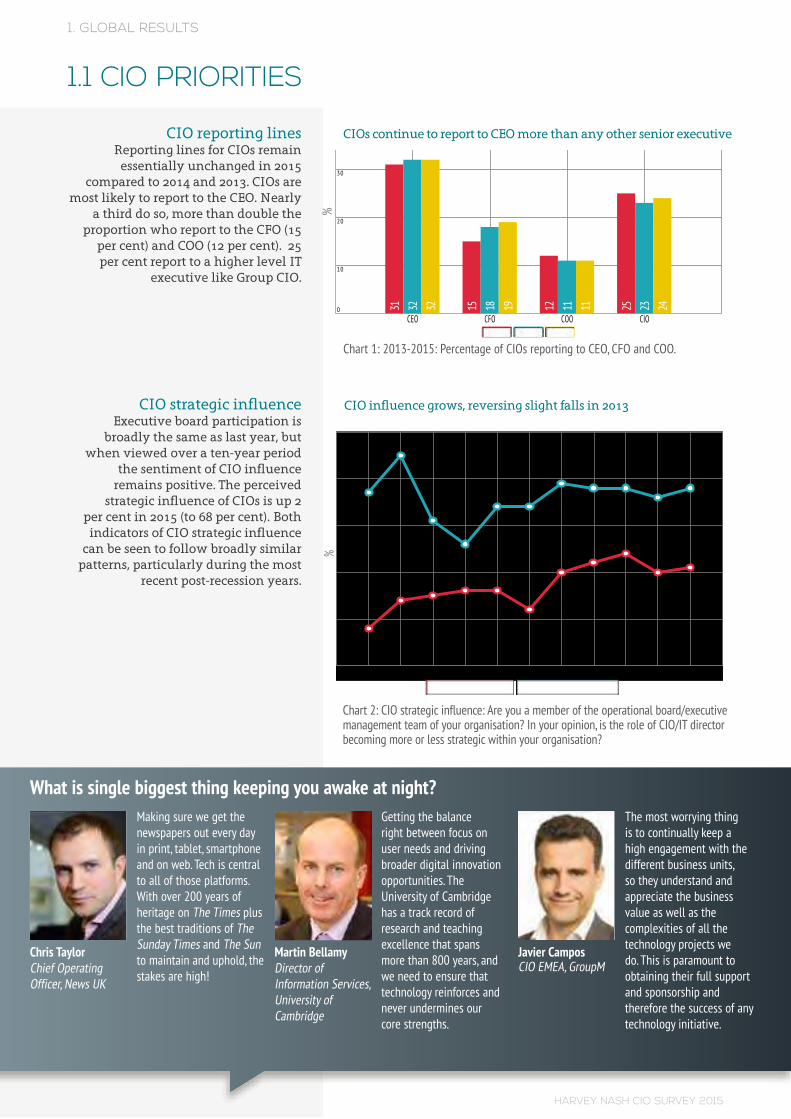
CIO reporting linesReporting lines for CIOs remain
essentially unchanged in 2015 compared to 2014 and 2013. CIOs are
most likely to report to the CEO. Nearly a third do so, more than double the
proportion who report to the CFO (15 per cent) and COO (12 per cent). 25 per cent report to a higher level IT
executive like Group CIO.
CIO strategic influenceExecutive board participation is
broadly the same as last year, but when viewed over a ten-year period
the sentiment of CIO influence remains positive. The perceived
strategic influence of CIOs is up 2 per cent in 2015 (to 68 per cent). Both
indicators of CIO strategic influence can be seen to follow broadly similar
patterns, particularly during the most recent post-recession years.
1.1 CIO PRIORITIES
CIOs continue to report to CEO more than any other senior executive
CIO influence grows, reversing slight falls in 2013
Chart 1: 2013-2015: Percentage of CIOs reporting to CEO, CFO and COO.
Chart 2: CIO strategic influence: Are you a member of the operational board/executive management team of your organisation? In your opinion, is the role of CIO/IT director becoming more or less strategic within your organisation?
2015 2014 2013CEO CFO COO CIO
30
20
10
0 31 15 12 2532 18 11 2332 19 11 24
%
CIOs on Exec Board CIO Strategic Influence
%
2005 2006 2007 2008 2009 2010 2011 2012 2013 2014 2015
80
70
60
50
40
30
The most worrying thing is to continually keep a high engagement with the different business units, so they understand and appreciate the business value as well as the complexities of all the technology projects we do. This is paramount to obtaining their full support and sponsorship and therefore the success of any technology initiative.
Getting the balance right between focus on user needs and driving broader digital innovation opportunities. The University of Cambridge has a track record of research and teaching excellence that spans more than 800 years, and we need to ensure that technology reinforces and never undermines our core strengths.
Making sure we get the newspapers out every day in print, tablet, smartphone and on web. Tech is central to all of those platforms. With over 200 years of heritage on The Times plus the best traditions of The Sunday Times and The Sun to maintain and uphold, the stakes are high!
Javier CamposCIO EMEA, GroupM
Martin BellamyDirector of Information Services, University of Cambridge
Chris TaylorChief Operating Officer, News UK
What is single biggest thing keeping you awake at night?
HARVEY NASH CIO SURVEY 201513
1. GLOBAL RESULTS
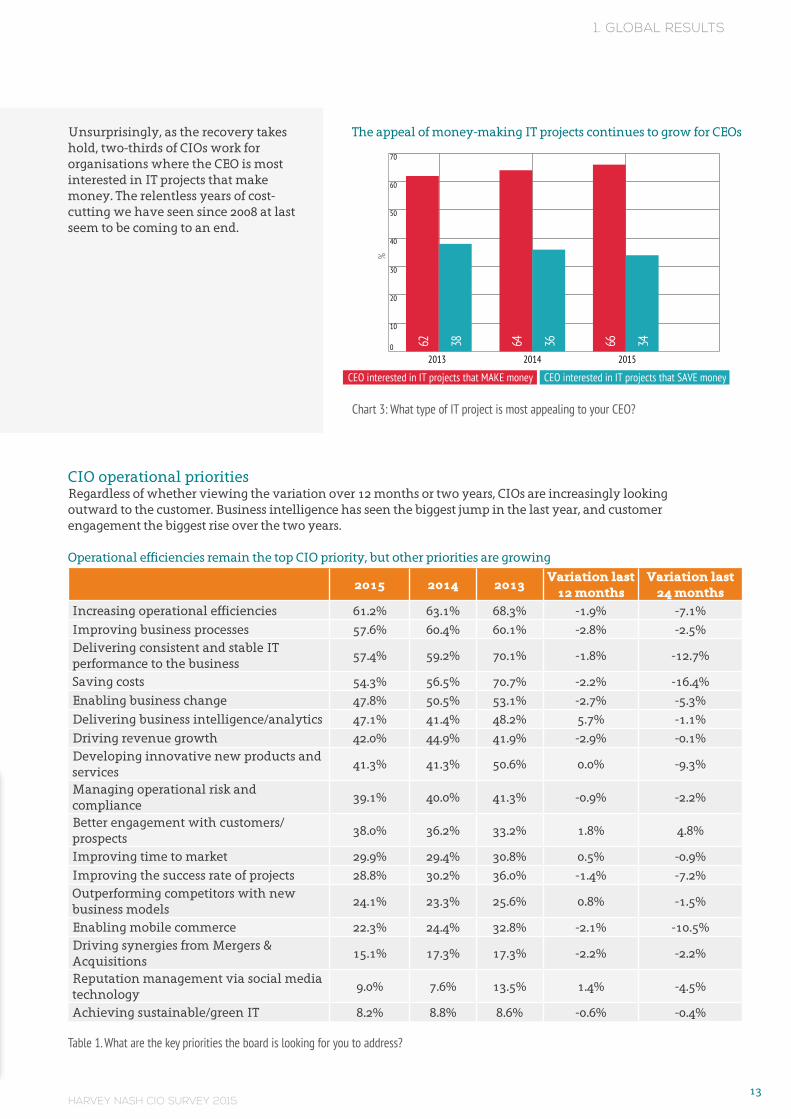
Chart 3: What type of IT project is most appealing to your CEO?
Unsurprisingly, as the recovery takes hold, two-thirds of CIOs work for organisations where the CEO is most interested in IT projects that make money. The relentless years of cost-cutting we have seen since 2008 at last seem to be coming to an end.
CIO operational prioritiesRegardless of whether viewing the variation over 12 months or two years, CIOs are increasingly looking outward to the customer. Business intelligence has seen the biggest jump in the last year, and customer engagement the biggest rise over the two years.
Operational efficiencies remain the top CIO priority, but other priorities are growing
2015 2014 2013Variation last
12 monthsVariation last
24 monthsIncreasing operational efficiencies 61.2% 63.1% 68.3% -1.9% -7.1%Improving business processes 57.6% 60.4% 60.1% -2.8% -2.5%Delivering consistent and stable IT performance to the business
57.4% 59.2% 70.1% -1.8% -12.7%
Saving costs 54.3% 56.5% 70.7% -2.2% -16.4%Enabling business change 47.8% 50.5% 53.1% -2.7% -5.3%Delivering business intelligence/analytics 47.1% 41.4% 48.2% 5.7% -1.1%Driving revenue growth 42.0% 44.9% 41.9% -2.9% -0.1%Developing innovative new products and services
41.3% 41.3% 50.6% 0.0% -9.3%
Managing operational risk and compliance
39.1% 40.0% 41.3% -0.9% -2.2%
Better engagement with customers/prospects
38.0% 36.2% 33.2% 1.8% 4.8%
Improving time to market 29.9% 29.4% 30.8% 0.5% -0.9%Improving the success rate of projects 28.8% 30.2% 36.0% -1.4% -7.2%Outperforming competitors with new business models
24.1% 23.3% 25.6% 0.8% -1.5%
Enabling mobile commerce 22.3% 24.4% 32.8% -2.1% -10.5%Driving synergies from Mergers & Acquisitions
15.1% 17.3% 17.3% -2.2% -2.2%
Reputation management via social media technology
9.0% 7.6% 13.5% 1.4% -4.5%
Achieving sustainable/green IT 8.2% 8.8% 8.6% -0.6% -0.4%
Table 1. What are the key priorities the board is looking for you to address?
CEO interested in IT projects that MAKE money CEO interested in IT projects that SAVE money%
2013 2014 2015
70
60
50
40
30
20
10
0 62 64 6638 36 34
The appeal of money-making IT projects continues to grow for CEOs
HARVEY NASH CIO SURVEY 201514
1. GLOBAL RESULTS
CIO operational prioritiesInterestingly the majority of board priorities have registered a decline
over the last two years. For some, like saving costs, this is easy to explain
as organisations look for growth; for others, like developing new products
and services or enabling mobile commerce, it's harder to explain.
As organisations look beyond the
recession it is possible that some of the urgency of these priorities has receded,
and they are not being discussed so much at board level.
However, the story of 2014-15 CIO priorities must be the heightened
importance of outward facing initiatives.
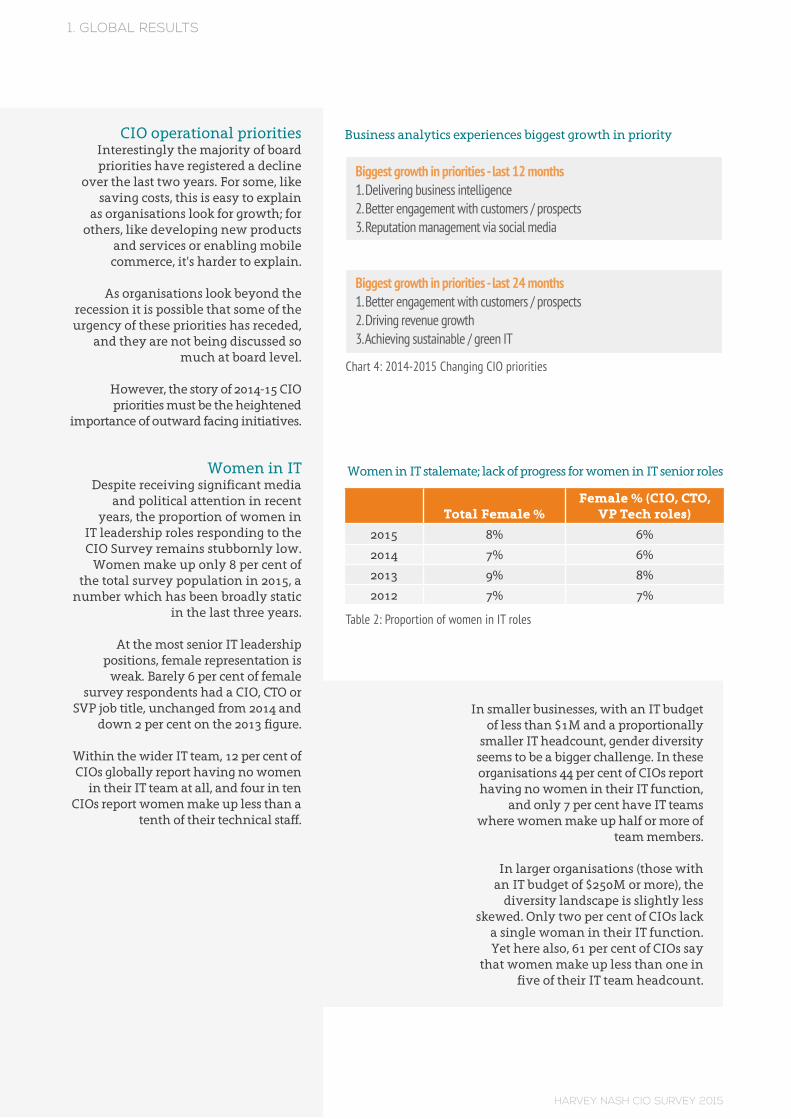
Women in ITDespite receiving significant media
and political attention in recent years, the proportion of women in
IT leadership roles responding to the CIO Survey remains stubbornly low.
Women make up only 8 per cent of the total survey population in 2015, a
number which has been broadly static in the last three years.
At the most senior IT leadership positions, female representation is
weak. Barely 6 per cent of female survey respondents had a CIO, CTO or
SVP job title, unchanged from 2014 and down 2 per cent on the 2013 figure.
Within the wider IT team, 12 per cent of CIOs globally report having no women
in their IT team at all, and four in ten CIOs report women make up less than a
tenth of their technical staff.
Business analytics experiences biggest growth in priority
Women in IT stalemate; lack of progress for women in IT senior roles
Total Female %Female % (CIO, CTO,
VP Tech roles)
2015 8% 6%
2014 7% 6%
2013 9% 8%
2012 7% 7%
Chart 4: 2014-2015 Changing CIO priorities
Table 2: Proportion of women in IT roles
Biggest growth in priorities - last 12 months1. Delivering business intelligence2. Better engagement with customers / prospects3. Reputation management via social media
Biggest growth in priorities - last 24 months1. Better engagement with customers / prospects2. Driving revenue growth3. Achieving sustainable / green IT
In smaller businesses, with an IT budget of less than $1M and a proportionally
smaller IT headcount, gender diversity seems to be a bigger challenge. In these organisations 44 per cent of CIOs report having no women in their IT function,
and only 7 per cent have IT teams where women make up half or more of
team members.
In larger organisations (those with an IT budget of $250M or more), the
diversity landscape is slightly less skewed. Only two per cent of CIOs lack
a single woman in their IT function. Yet here also, 61 per cent of CIOs say
that women make up less than one in five of their IT team headcount.
HARVEY NASH CIO SURVEY 201515
1. GLOBAL RESULTS
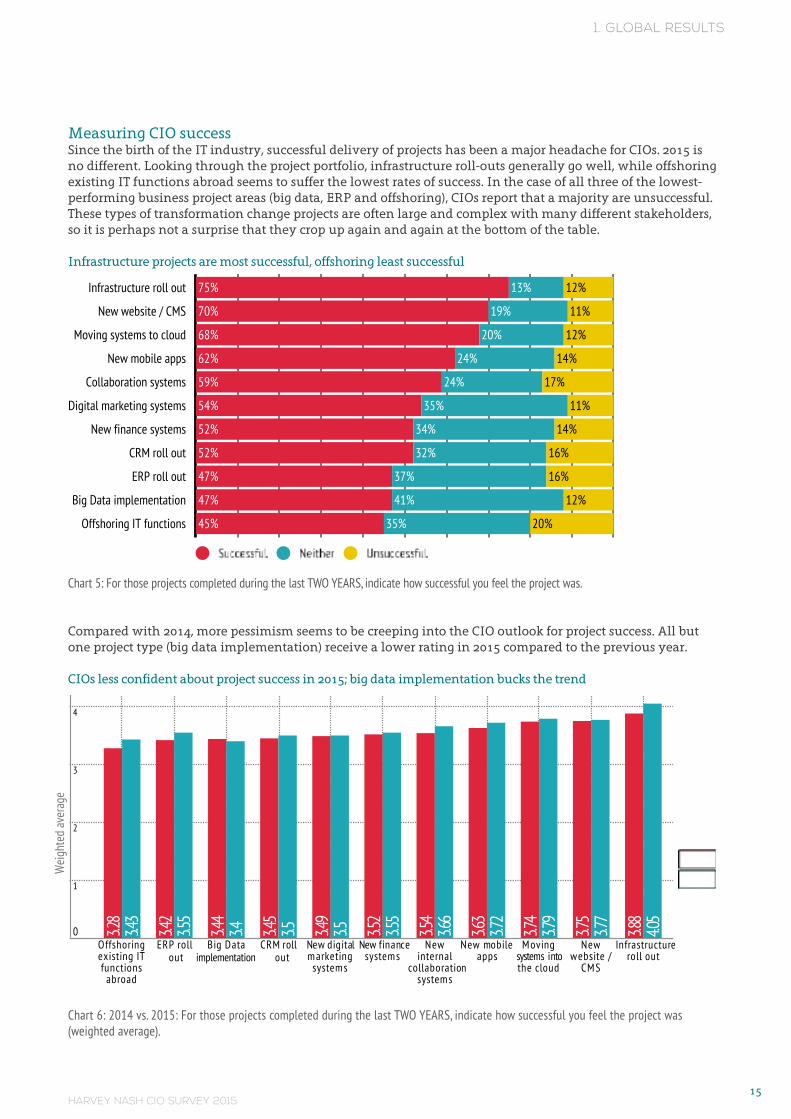
Measuring CIO successSince the birth of the IT industry, successful delivery of projects has been a major headache for CIOs. 2015 is no different. Looking through the project portfolio, infrastructure roll-outs generally go well, while offshoring existing IT functions abroad seems to suffer the lowest rates of success. In the case of all three of the lowest-performing business project areas (big data, ERP and offshoring), CIOs report that a majority are unsuccessful. These types of transformation change projects are often large and complex with many different stakeholders, so it is perhaps not a surprise that they crop up again and again at the bottom of the table.
Infrastructure projects are most successful, offshoring least successful
Chart 5: For those projects completed during the last TWO YEARS, indicate how successful you feel the project was.
Compared with 2014, more pessimism seems to be creeping into the CIO outlook for project success. All but one project type (big data implementation) receive a lower rating in 2015 compared to the previous year.
CIOs less confident about project success in 2015; big data implementation bucks the trend
Chart 6: 2014 vs. 2015: For those projects completed during the last TWO YEARS, indicate how successful you feel the project was (weighted average).
Wei
ghte
d av
erag
e
O ffshoringexisting ITfunctions
abroad
ERP
roll out
Big Dataimplementation
CRM
ro ll out
New digitalmarketing
systems
New financesystems
Newinternal
collaborationsystems
New mobileapps
Movingsystems intothe cloud
Newwebsite /
CMS
Infrastructureroll out
5
4
3
2
1
0 3.28
3.42
3.44
3.45
3.49
3.52
3.54
3.63
3.74
3.75
3.88
3.43
3.55
3.4 3.5 3.5 3.55
3.66
3.72
3.79
3.77
4.05
2 015 2014 2013CEO CFO COO CIO
40
30
20
10
0 31 15 12 2532 18 11 2332 19 11 24
CIOs on Exec Board CIO Strategic Influence
%
2005 2006 2007 2008 2009 2010 2011 2012 2013 2014 2015
80
70
60
50
40
30
CEO interested in IT projects that MAKE money CEO interested in IT projects that SAVE money
%
2013 2014 2015
70
60
50
40
30
20
10
0 62 64 6638 36 34
2015 2014 2013 2012
%
Total Female % Female % (CIO, CTO, VP Tech roles)
10
9
8
7
6
5
4
3
2
1
0 8 67 69 87 7Successful Neither Unsuccessful
OffshoringITfunctions
BigDataimplementation
ERProllout
Newfinancesystems
CRMrollout
Digitalmarketingsystems
Collaborationsystems
Newmobileapps
Movingsystemstocloud
Newwebsite/CMS
Infrastructurerollout
0 10 20 30 40 50 60 70 80 90
Not strong Quite strong Very strong
Mar
ketin
gHR
Sale
sLe
gal/
com
plian
ceFi
nanc
eOp
erat
ions
0 10 20 30 40 50 60 70 80 90
2015 2014
%
Operations Finance Sales Legal / compliance HR Marketing
70
60
50
40
30
20
10
0 64 51 38 36 34 3361 56 41 29 28 30
Yes No
59%
41%
Big data / analyticsChange management
TestingDevelopment
Project managementSecurity and resilience
IT strategyERP
Service managementOutsourcingCompliance
Business ‘ship rel mgmtMobile solutions
Social mediaBusiness analysis
Enterprise architectureTechnical architecture
-2-4-6 0 2 4 6 8 10
11.8%2.0%1.8%1.8%1.5%1.4%1.1%0.0%
-0.2%-0.7%-0.8%
-1.0%-2.7%-2.8%-4.0%-6.5%-7.8%
2011 2012 2013 2014 2015
100
90
80
70
60
50
40
30
20
10
0
2011 2012 2013 2014 2015
110
100
90
80
70
60
50
40
30
20
100
2015 2014Large Mid-Sized Small
50
40
30
20
10
0 32 35 2842 35 31
2015 Great Concern 2014 Great Concern
%6050403020100
22
24
27
27
27
32
32
34
35
37
38
41
41
41
47
51
27
38
31
27
33
38
34
47
31
33
31
38
38
45
33
34
%
5.7%
1.8%
1.4%
0.8%
0.5%
0.0%
-0.6%
-0.9%
-1.4%
-1.8%
-1.9%
-2.1%
-2.2%
-2.2%
-2.7%
-2.8%
-2.9%
Delivering business intelligence / analytics
Better engagement with customers/prospects
Reputation management via social media technology
Outperforming competitors with new business models
Improving time to market
Developing innovative new products and services
Achieving sustainable / green IT
Managing operational risk and compliance
Improving the success rate of projects
Delivering consistent & stable IT performance
Increasing operational efficiencies
Enabling mobile commerce
Saving costs
Driving synergies from Mergers & Acquisitions
Enabling business change
Improving business processes
Driving revenue growth
%%
Construction / Engineering
Utilities
Transport / Logistics
Manufacturing
Business / Prof Services
Financial Services
Education
Advertising / PR
Healthcare
Pharmaceuticals
Energy
Government
Retail / Leisure
Technology / Telecoms
Broadcast / Media
Charity / Non Profit
20152014
Decrease
Stay the same
Increase
No concern
Some concern
Great concern
%
Infrastructure roll out
New website / CMS
Moving systems to cloud
New mobile apps
Collaboration systems
Digital marketing systems
New finance systems
CRM roll out
ERP roll out
Big Data implementation
Offshoring IT functions
0 10 20 30 40 50 60 70 80 90 100
75% 13% 12%
70% 19% 11%
68% 20% 12%
62% 24% 14%
59% 24% 17%
54% 35% 11%
52% 34% 14%
52% 32% 16%
47% 37% 16%
47% 41% 12%
45% 35% 20%

HARVEY NASH CIO SURVEY 201516
1. GLOBAL RESULTS
RelationshipsRating the success of their
departmental relationships, CIOs tell us that their functions have the strongest relations with Operations and Finance, although Finance has
decreased compared to last year. Relationships seem to be improving
with HR departments compared to previous years.
Although CIOs rate the IT/Marketing relationship currently as the poorest
among all functions, the results show a slight improvement compared to last year. The proportion of CIOs who rated
their relationship with Marketing as ‘very strong’ rose from 30 per cent to 33
per cent within the last 12 months.
IT has the weakest relationship with marketing compared to other departments
Relationships with Marketing and HR improving (from a low base)
2015 2014
Operations Finance Sales Legal / compliance HR Marketing
70
60
50
40
30
20
10
64 51 38 36 34 3361 56 41 29 28 30
Chart 7: 2015: How strong would you rate your department’s relationship with the following business functions?
Chart 8: 2014-2015: Departments where CIOs rate their relationship ‘strong’
Marketing
HR
Sales
Legal / compliance
Finance
Operations
0 10 20 30 40 50 60 70 80 90 100
27% 40% 33%
24% 42% 34%
20% 42% 38%
20% 44% 36%
10% 39% 51%
5 31%% 64%
%
HARVEY NASH CIO SURVEY 201517
1.2 PEOPLE, SKILLS AND TALENT
Chart 8: Does the skills shortage prevent your organisation from keeping up with the pace of change? 2005 - 2014
1. GLOBAL RESULTS
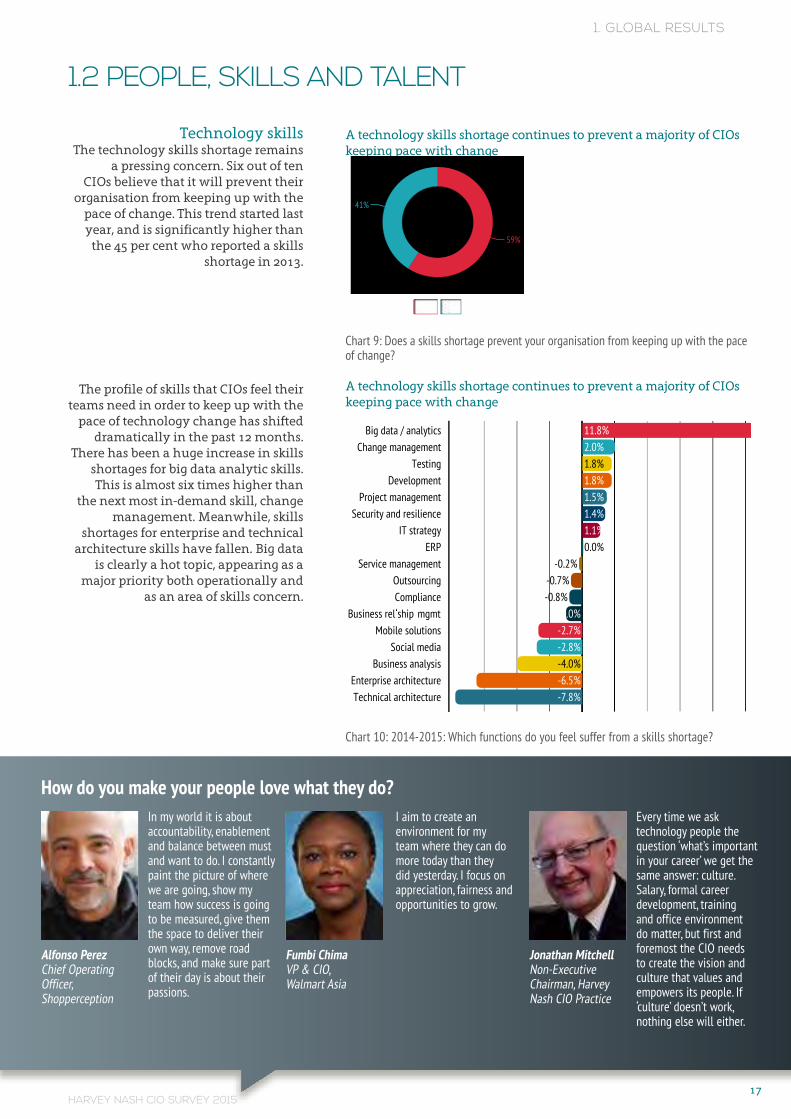
Technology skillsThe technology skills shortage remains
a pressing concern. Six out of ten CIOs believe that it will prevent their
organisation from keeping up with the pace of change. This trend started last year, and is significantly higher than
the 45 per cent who reported a skills shortage in 2013.
The profile of skills that CIOs feel their teams need in order to keep up with the
pace of technology change has shifted dramatically in the past 12 months.
There has been a huge increase in skills shortages for big data analytic skills. This is almost six times higher than
the next most in-demand skill, change management. Meanwhile, skills
shortages for enterprise and technical architecture skills have fallen. Big data
is clearly a hot topic, appearing as a major priority both operationally and
as an area of skills concern.
A technology skills shortage continues to prevent a majority of CIOs keeping pace with change
Chart 9: Does a skills shortage prevent your organisation from keeping up with the pace of change?
A technology skills shortage continues to prevent a majority of CIOs keeping pace with change
Chart 10: 2014-2015: Which functions do you feel suffer from a skills shortage?
Every time we ask technology people the question ‘what’s important in your career’ we get the same answer: culture. Salary, formal career development, training and office environment do matter, but first and foremost the CIO needs to create the vision and culture that values and empowers its people. If ‘culture’ doesn’t work, nothing else will either.
I aim to create an environment for my team where they can do more today than they did yesterday. I focus on appreciation, fairness and opportunities to grow.
In my world it is about accountability, enablement and balance between must and want to do. I constantly paint the picture of where we are going, show my team how success is going to be measured, give them the space to deliver their own way, remove road blocks, and make sure part of their day is about their passions.
Big data / analyticsChange management
TestingDevelopment
Project managementSecurity and resilience
IT strategyERP
Service managementOutsourcingCompliance
Business ‘ship rel mgmtMobile solutions
Social mediaBusiness analysis
Enterprise architectureTechnical architecture
-2-4-6 0 2 4 6 8 10
11.8%2.0%1.8%1.8%1.5%1.4%1.1%0.0%
-0.2%-0.7%-0.8%
-1.0%-2.7%-2.8%-4.0%-6.5%-7.8%
How do you make your people love what they do?
Yes No
59%
41%
Alfonso PerezChief Operating Officer, Shopperception
Fumbi ChimaVP & CIO,Walmart Asia
Jonathan MitchellNon-Executive Chairman, Harvey Nash CIO Practice
1. GLOBAL RESULTS
HARVEY NASH CIO SURVEY 201518
1. GLOBAL RESULTS
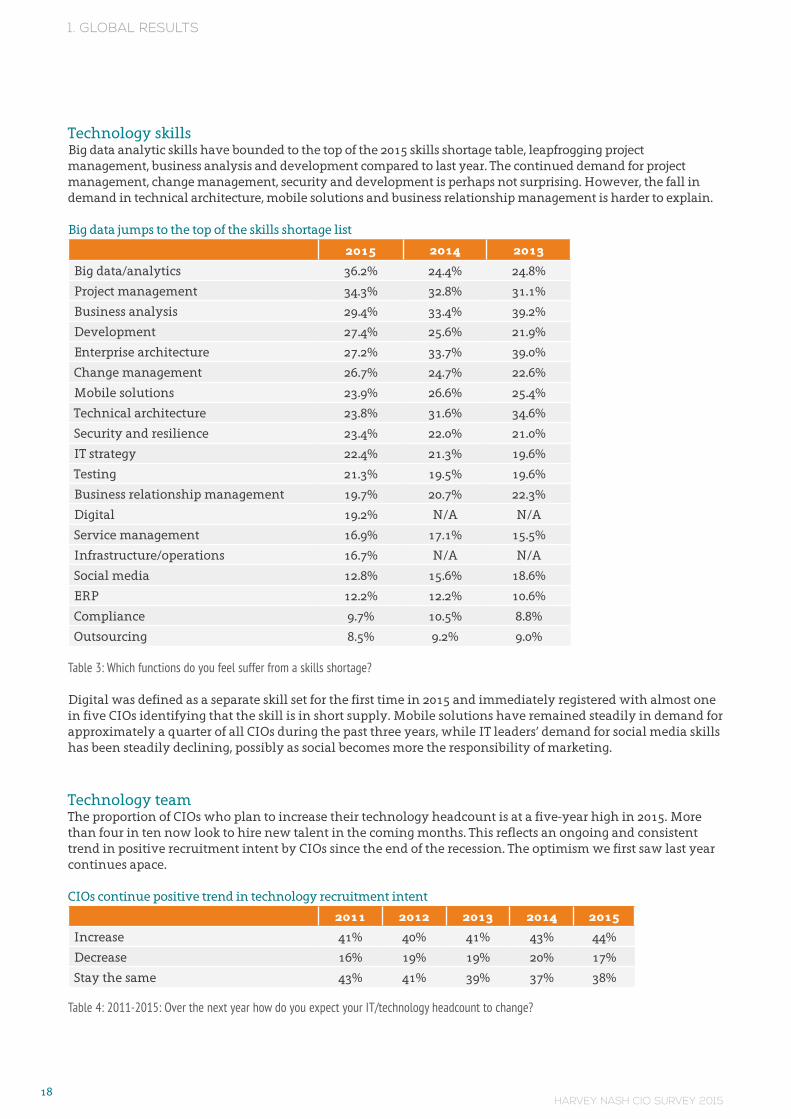
Technology skills Big data analytic skills have bounded to the top of the 2015 skills shortage table, leapfrogging project management, business analysis and development compared to last year. The continued demand for project management, change management, security and development is perhaps not surprising. However, the fall in demand in technical architecture, mobile solutions and business relationship management is harder to explain.
Big data jumps to the top of the skills shortage list
2015 2014 2013
Big data/analytics 36.2% 24.4% 24.8%
Project management 34.3% 32.8% 31.1%
Business analysis 29.4% 33.4% 39.2%
Development 27.4% 25.6% 21.9%
Enterprise architecture 27.2% 33.7% 39.0%
Change management 26.7% 24.7% 22.6%
Mobile solutions 23.9% 26.6% 25.4%
Technical architecture 23.8% 31.6% 34.6%
Security and resilience 23.4% 22.0% 21.0%
IT strategy 22.4% 21.3% 19.6%
Testing 21.3% 19.5% 19.6%
Business relationship management 19.7% 20.7% 22.3%
Digital 19.2% N/A N/A
Service management 16.9% 17.1% 15.5%
Infrastructure/operations 16.7% N/A N/A
Social media 12.8% 15.6% 18.6%
ERP 12.2% 12.2% 10.6%
Compliance 9.7% 10.5% 8.8%
Outsourcing 8.5% 9.2% 9.0%
Table 3: Which functions do you feel suffer from a skills shortage?
Digital was defined as a separate skill set for the first time in 2015 and immediately registered with almost one in five CIOs identifying that the skill is in short supply. Mobile solutions have remained steadily in demand for approximately a quarter of all CIOs during the past three years, while IT leaders’ demand for social media skills has been steadily declining, possibly as social becomes more the responsibility of marketing.
Technology teamThe proportion of CIOs who plan to increase their technology headcount is at a five-year high in 2015. More than four in ten now look to hire new talent in the coming months. This reflects an ongoing and consistent trend in positive recruitment intent by CIOs since the end of the recession. The optimism we first saw last year continues apace.
CIOs continue positive trend in technology recruitment intent
2011 2012 2013 2014 2015
Increase 41% 40% 41% 43% 44%
Decrease 16% 19% 19% 20% 17%
Stay the same 43% 41% 39% 37% 38%
Table 4: 2011-2015: Over the next year how do you expect your IT/technology headcount to change?
HARVEY NASH CIO SURVEY 201519
1. GLOBAL RESULTS
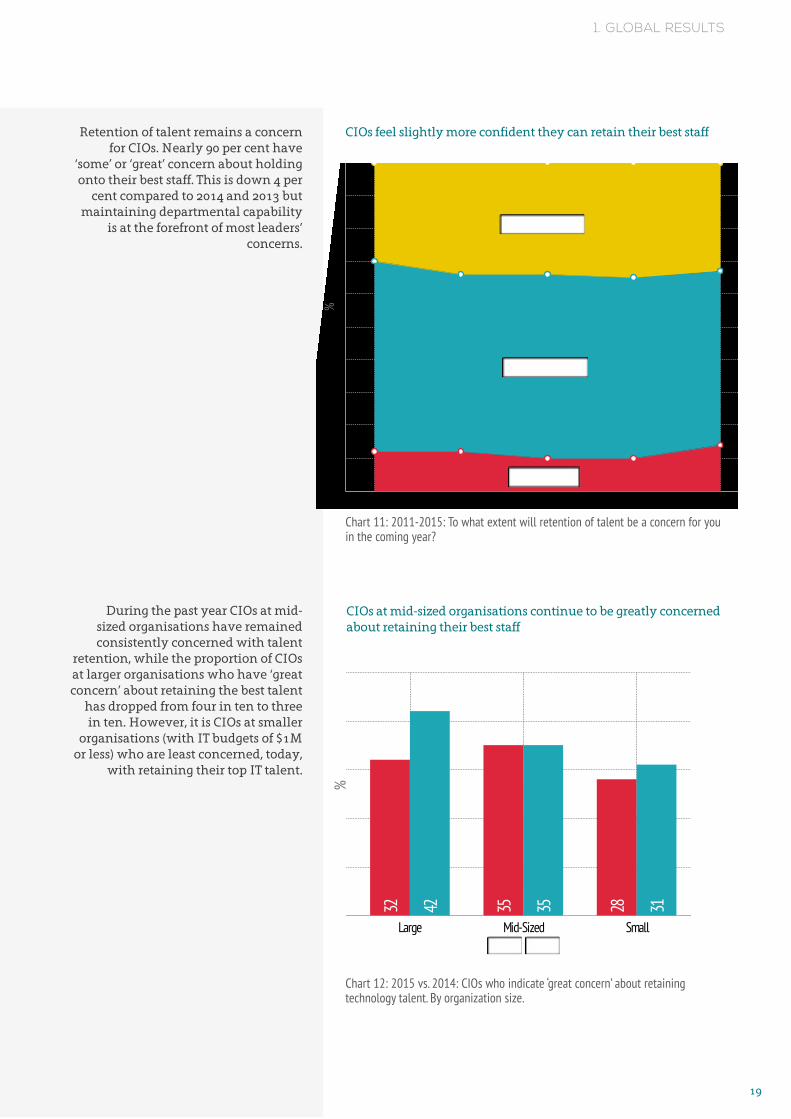
Retention of talent remains a concern for CIOs. Nearly 90 per cent have
‘some’ or ‘great’ concern about holding onto their best staff. This is down 4 per
cent compared to 2014 and 2013 but maintaining departmental capability
is at the forefront of most leaders’ concerns.
During the past year CIOs at mid-sized organisations have remained consistently concerned with talent
retention, while the proportion of CIOs at larger organisations who have ‘great concern’ about retaining the best talent
has dropped from four in ten to three in ten. However, it is CIOs at smaller
organisations (with IT budgets of $1M or less) who are least concerned, today,
with retaining their top IT talent.
CIOs feel slightly more confident they can retain their best staff
CIOs at mid-sized organisations continue to be greatly concerned about retaining their best staff
Chart 11: 2011-2015: To what extent will retention of talent be a concern for you in the coming year?
Chart 12: 2015 vs. 2014: CIOs who indicate ‘great concern’ about retaining technology talent. By organization size.
2011 2012 2013 2014 2015
100
90
80
70
60
50
40
30
20
100 No concern
Some concern
Great concern
%
2015 2014Large Mid-Sized Small
32 35 2842 35 31
%
HARVEY NASH CIO SURVEY 201520
1. GLOBAL RESULTS
2015 Great Concern 2014 Great Concern
22
24
27
27
27
32
32
34
35
37
38
41
41
41
47
51
27
38
31
27
33
38
34
47
31
33
31
38
38
45
33
34
Construction / Engineering
Utilities
Transport / Logistics
Manufacturing
Business / Prof Services
Financial Services
Education
Advertising / PR
Healthcare
Pharmaceuticals
Energy
Government
Retail / Leisure
Technology / Telecoms
Broadcast / Media
Charity / Non Profit
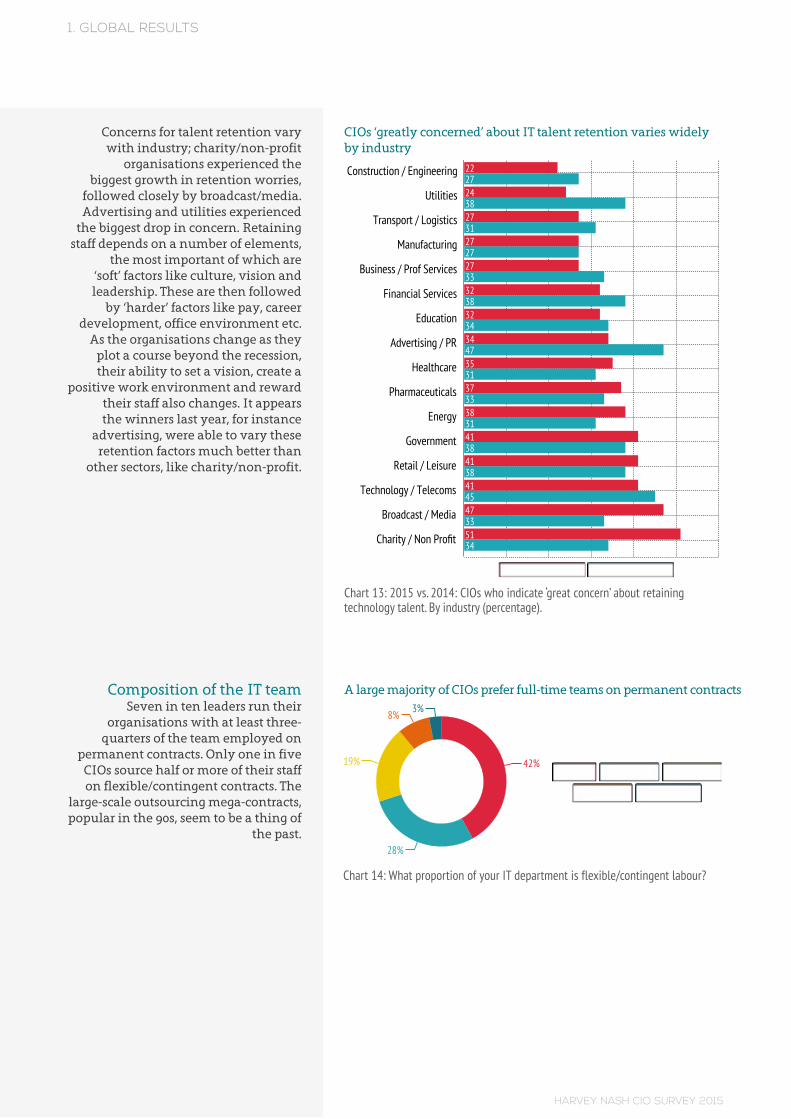
Concerns for talent retention vary with industry; charity/non-profit
organisations experienced the biggest growth in retention worries,
followed closely by broadcast/media. Advertising and utilities experienced
the biggest drop in concern. Retaining staff depends on a number of elements,
the most important of which are ‘soft’ factors like culture, vision and leadership. These are then followed
by ‘harder’ factors like pay, career development, office environment etc.
As the organisations change as they plot a course beyond the recession, their ability to set a vision, create a
positive work environment and reward their staff also changes. It appears the winners last year, for instance
advertising, were able to vary these retention factors much better than
other sectors, like charity/non-profit.
Composition of the IT teamSeven in ten leaders run their
organisations with at least three-quarters of the team employed on
permanent contracts. Only one in five CIOs source half or more of their staff on flexible/contingent contracts. The
large-scale outsourcing mega-contracts, popular in the 90s, seem to be a thing of
the past.
CIOs ‘greatly concerned’ about IT talent retention varies widely by industry
A large majority of CIOs prefer full-time teams on permanent contracts
Chart 14: What proportion of your IT department is flexible/contingent labour?
Chart 13: 2015 vs. 2014: CIOs who indicate ‘great concern’ about retaining technology talent. By industry (percentage).
0-10% 11%-25% 26%-50%51%-75% 76%-100%
42%
28%
19%
8%3%

HARVEY NASH CIO SURVEY 201521
1. GLOBAL RESULTS
Growing proportion of CIOs dependent on flexible contingent labour
Chart 15: 2011-2015: Proportions of CIOs where more than 50% of IT department is flexible/contingent labour.
However, there does appear to be a small rise in the number of CIOs who
use flexible contingent labour for more than half of their technology team.
2015 saw the largest proportion (11 per cent) since 2011.
Composition of the IT teamAlthough the growth percentages are
relatively small, there is a mounting dependence on flexible contingent
labour. More CIOs have more than 25 per cent of their workforce on flexible
contracts, while the proportion of CIOs who have less than a quarter of their
staff on flexible contracts is falling.
CIOs in each category above 25% are growing, indicating more reliance on flexible staff
Chart 16: 2014-2015: What proportion of your IT department is flexible/contingent labour?
%
2011 2012 2013 2014 2015
10
8
9%10%
9% 9%
11%
6
4
20
2015 2014
0-10% 11%-25% 26%-50% 51%-75% 76%-100%
41 29 19 8 3 243 31 17 7
%
HARVEY NASH CIO SURVEY 201522
1. GLOBAL RESULTS
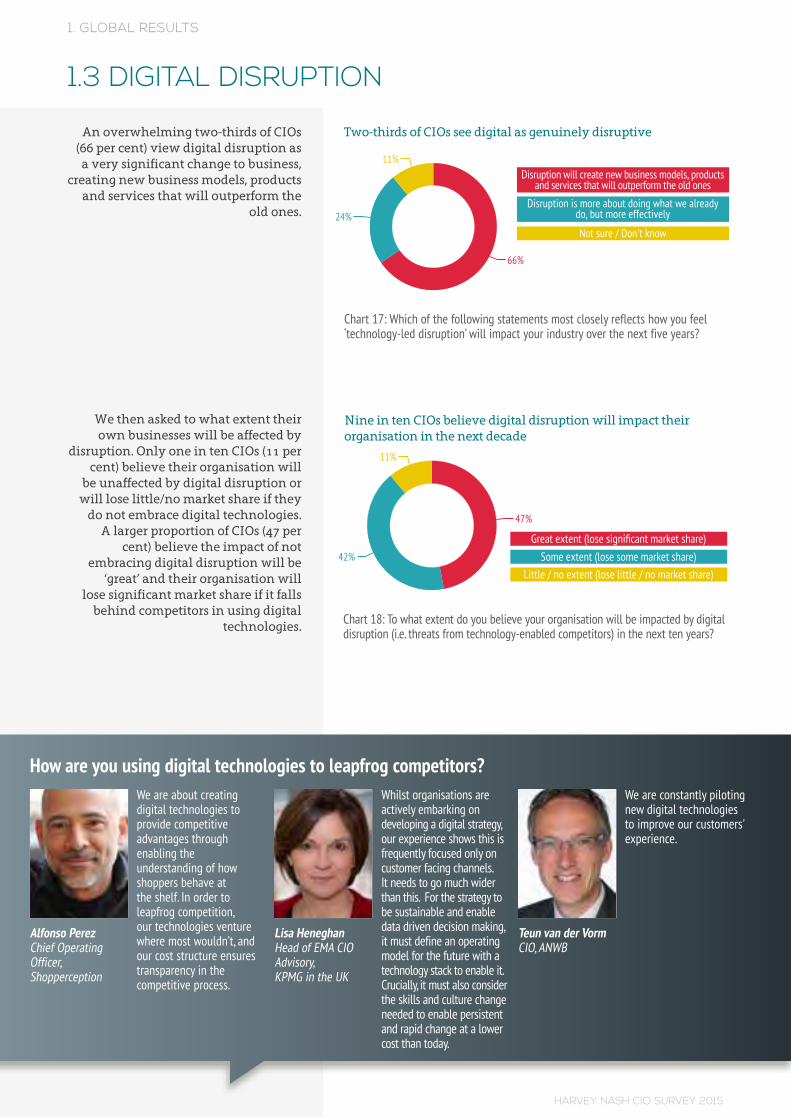
An overwhelming two-thirds of CIOs (66 per cent) view digital disruption as
a very significant change to business, creating new business models, products
and services that will outperform the old ones.
We then asked to what extent their own businesses will be affected by
disruption. Only one in ten CIOs (11 per cent) believe their organisation will
be unaffected by digital disruption or will lose little/no market share if they
do not embrace digital technologies. A larger proportion of CIOs (47 per
cent) believe the impact of not embracing digital disruption will be
‘great’ and their organisation will lose significant market share if it falls
behind competitors in using digital technologies.
Two-thirds of CIOs see digital as genuinely disruptive
Nine in ten CIOs believe digital disruption will impact their organisation in the next decade
Chart 17: Which of the following statements most closely reflects how you feel ‘technology-led disruption’ will impact your industry over the next five years?
Chart 18: To what extent do you believe your organisation will be impacted by digital disruption (i.e. threats from technology-enabled competitors) in the next ten years?
1.3 DIGITAL DISRUPTION
66%
24%
11%
Disruption is more about doing what we already do, but more effectively
Not sure / Don't know
Disruption will create new business models, products and services that will outperform the old ones
47%
42%
11%
reat e tent lose significant ar et share o e e tent lose so e ar et share ittle / no e tent lose little / no ar et share
Chart 8: Does the skills shortage prevent your organisation from keeping up with the pace of change? 2005 - 2014
We are constantly piloting new digital technologies to improve our customers' experience.
Whilst organisations are actively embarking on developing a digital strategy, our experience shows this is frequently focused only on customer facing channels. It needs to go much wider than this. For the strategy to be sustainable and enable data driven decision making, it must define an operating model for the future with a technology stack to enable it. Crucially, it must also consider the skills and culture change needed to enable persistent and rapid change at a lower cost than today.
We are about creating digital technologies to provide competitive advantages through enabling the understanding of how shoppers behave at the shelf. In order to leapfrog competition, our technologies venture where most wouldn’t, and our cost structure ensures transparency in the competitive process.
How are you using digital technologies to leapfrog competitors?
Alfonso PerezChief OperatingOfficer,Shopperception
Lisa HeneghanHead of EMA CIO Advisory,KPMG in the UK
Teun van der VormCIO, ANWB
HARVEY NASH CIO SURVEY 201523
1. GLOBAL RESULTS
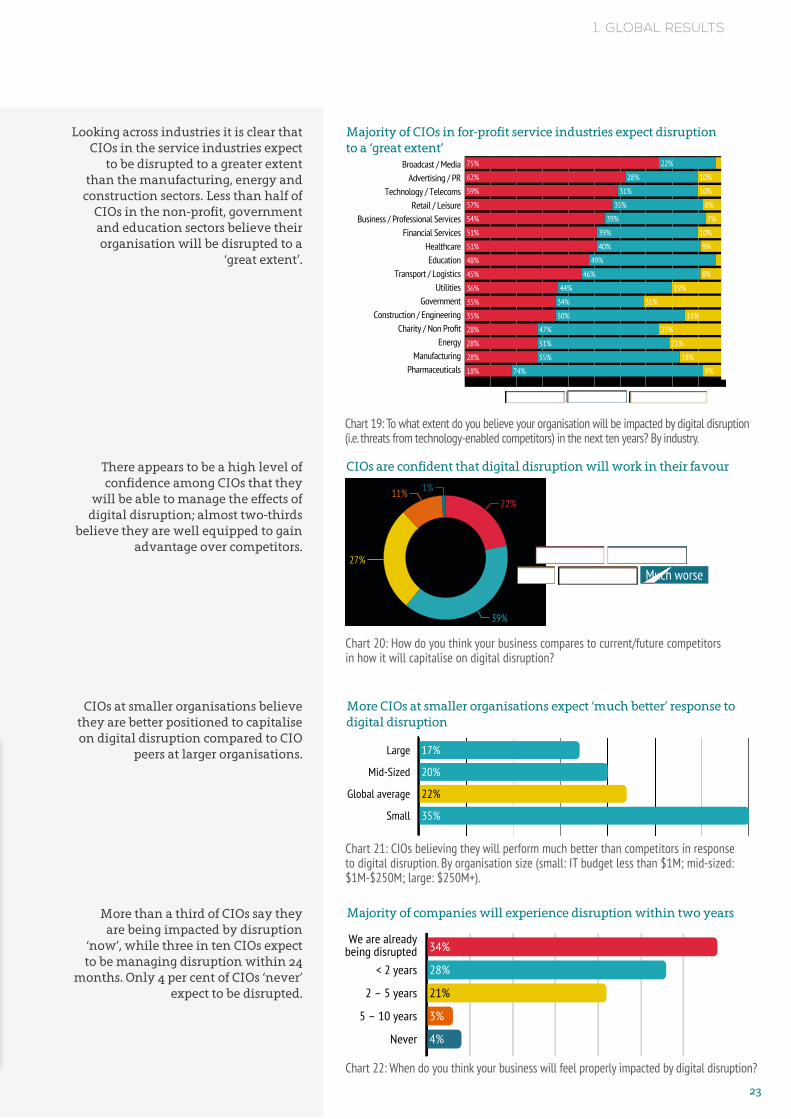
Majority of CIOs in for-profit service industries expect disruption to a ‘great extent’
Chart 19: To what extent do you believe your organisation will be impacted by digital disruption (i.e. threats from technology-enabled competitors) in the next ten years? By industry.
CIOs are confident that digital disruption will work in their favour
More CIOs at smaller organisations expect ‘much better’ response to digital disruption
Majority of companies will experience disruption within two years
Chart 20: How do you think your business compares to current/future competitors in how it will capitalise on digital disruption?
Chart 21: CIOs believing they will perform much better than competitors in response to digital disruption. By organisation size (small: IT budget less than $1M; mid-sized: $1M-$250M; large: $250M+).
Chart 22: When do you think your business will feel properly impacted by digital disruption?
Looking across industries it is clear that CIOs in the service industries expect
to be disrupted to a greater extent than the manufacturing, energy and
construction sectors. Less than half of CIOs in the non-profit, government and education sectors believe their organisation will be disrupted to a
‘great extent’.
There appears to be a high level of confidence among CIOs that they
will be able to manage the effects of digital disruption; almost two-thirds
believe they are well equipped to gain advantage over competitors.
CIOs at smaller organisations believe they are better positioned to capitalise on digital disruption compared to CIO
peers at larger organisations.
More than a third of CIOs say they are being impacted by disruption
‘now’, while three in ten CIOs expect to be managing disruption within 24
months. Only 4 per cent of CIOs ‘never’ expect to be disrupted.
Great extent Som e extent Little / no extent
0 10 20 30 40 50 60 70 80 90
75% 22%
62% 28% 10%
59% 31% 10%
57% 35% 8%
54% 39% 7%
51% 39% 10%
51% 40% 9%
48% 49%
45% 46% 8%
36% 44% 19%
35% 34% 31%
35% 50% 15%
28% 47% 25%
28% 51% 21%
28% 55% 18%
18% 74% 9%
Broadcast / MediaAdvertising / PR
Technology / TelecomsRetail / Leisure
Business / Professional ServicesFinancial Services
HealthcareEducation
Transport / LogisticsUtilities
GovernmentConstruction / Engineering
Charity / Non ProfitEnergy
ManufacturingPharmaceuticals
Large
Mid-Sized
Global average
Small
0 5 10 15 20 25 30 35
17%
20%
22%
35%
We are already being disrupted
< 2 years
2 – 5 years
5 – 10 years
Never
34%
28%
21%
3%
4%
Much better Slightly betterSame Slightly worse Much worse
22%
39%
27%
11% 1%
HARVEY NASH CIO SURVEY 201524
1. GLOBAL RESULTS
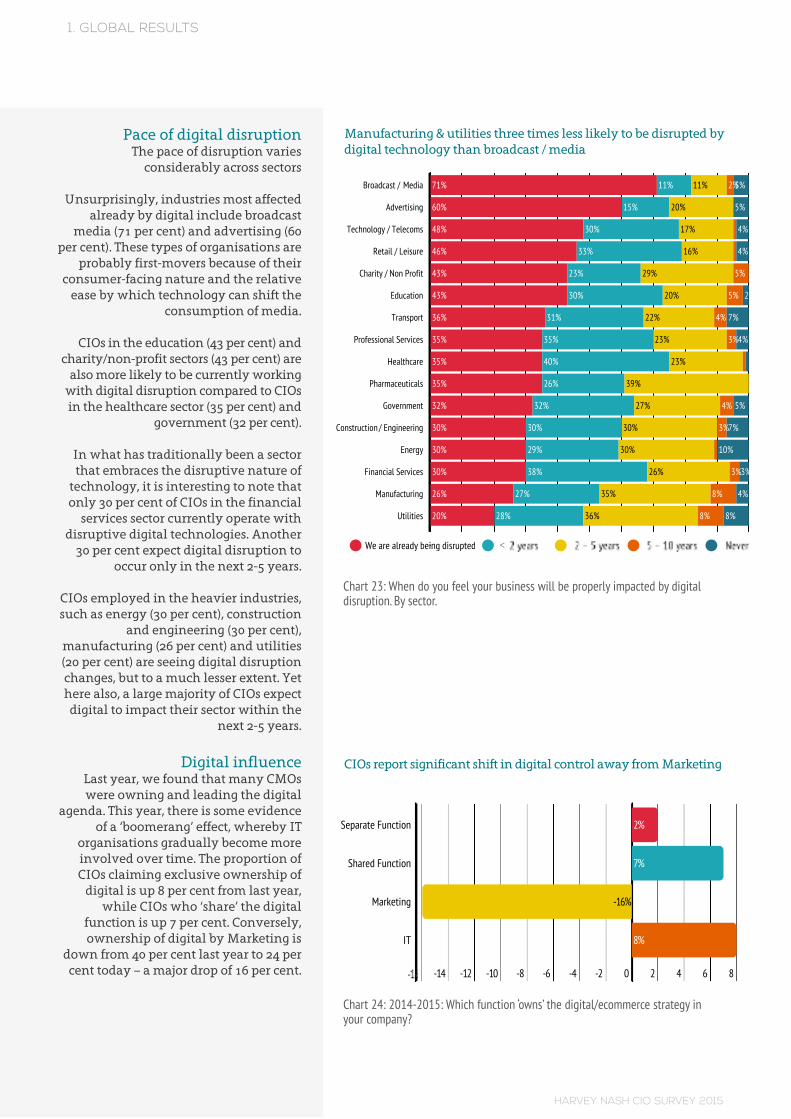
Pace of digital disruptionThe pace of disruption varies
considerably across sectors
Unsurprisingly, industries most affected already by digital include broadcast
media (71 per cent) and advertising (60 per cent). These types of organisations are
probably first-movers because of their consumer-facing nature and the relative
ease by which technology can shift the consumption of media.
CIOs in the education (43 per cent) and charity/non-profit sectors (43 per cent) are
also more likely to be currently working with digital disruption compared to CIOs in the healthcare sector (35 per cent) and
government (32 per cent).
In what has traditionally been a sector that embraces the disruptive nature of
technology, it is interesting to note that only 30 per cent of CIOs in the financial
services sector currently operate with disruptive digital technologies. Another
30 per cent expect digital disruption to occur only in the next 2-5 years.
CIOs employed in the heavier industries, such as energy (30 per cent), construction
and engineering (30 per cent), manufacturing (26 per cent) and utilities (20 per cent) are seeing digital disruption changes, but to a much lesser extent. Yet here also, a large majority of CIOs expect
digital to impact their sector within the next 2-5 years.
Digital influenceLast year, we found that many CMOs were owning and leading the digital
agenda. This year, there is some evidence of a ‘boomerang’ effect, whereby IT
organisations gradually become more involved over time. The proportion of CIOs claiming exclusive ownership of
digital is up 8 per cent from last year, while CIOs who ‘share’ the digital
function is up 7 per cent. Conversely, ownership of digital by Marketing is
down from 40 per cent last year to 24 per cent today – a major drop of 16 per cent.
Manufacturing & utilities three times less likely to be disrupted by digital technology than broadcast / media
CIOs report significant shift in digital control away from Marketing
Chart 23: When do you feel your business will be properly impacted by digital disruption. By sector.
Chart 24: 2014-2015: Which function ‘owns’ the digital/ecommerce strategy in your company?
Broadcast / Media
Advertising
Technology / Telecoms
Retail / Leisure
Charity / Non Profit
Education
Transport
Professional Services
Healthcare
Pharmaceuticals
Government
Construction / Engineering
Energy
Financial Services
Manufacturing
Utilities
0 10 20 30 40 50 60 70 80 90 100
71% 11% 11% 2%5%
60% 15% 20% 5%
48% 30% 17% 4%
46% 33% 16% 4%
43% 23% 29% 5%
43% 30% 20% 5% 2%
36% 31% 22% 4% 7%
35% 35% 23% 3%4%
35% 40% 23%
35% 26% 39%
32% 32% 27% 4% 5%
30% 30% 30% 3%7%
30% 29% 30% 10%
30% 38% 26% 3%3%
26% 27% 35% 8% 4%
20% 28% 36% 8% 8%
We are already being disrupted <
Separate Function
Shared Function
Marketing
IT
-2-4-6-8-10-12-14 0 2 4 6 8
2%
7%
-16%
8%
HARVEY NASH CIO SURVEY 201525
1. GLOBAL RESULTS
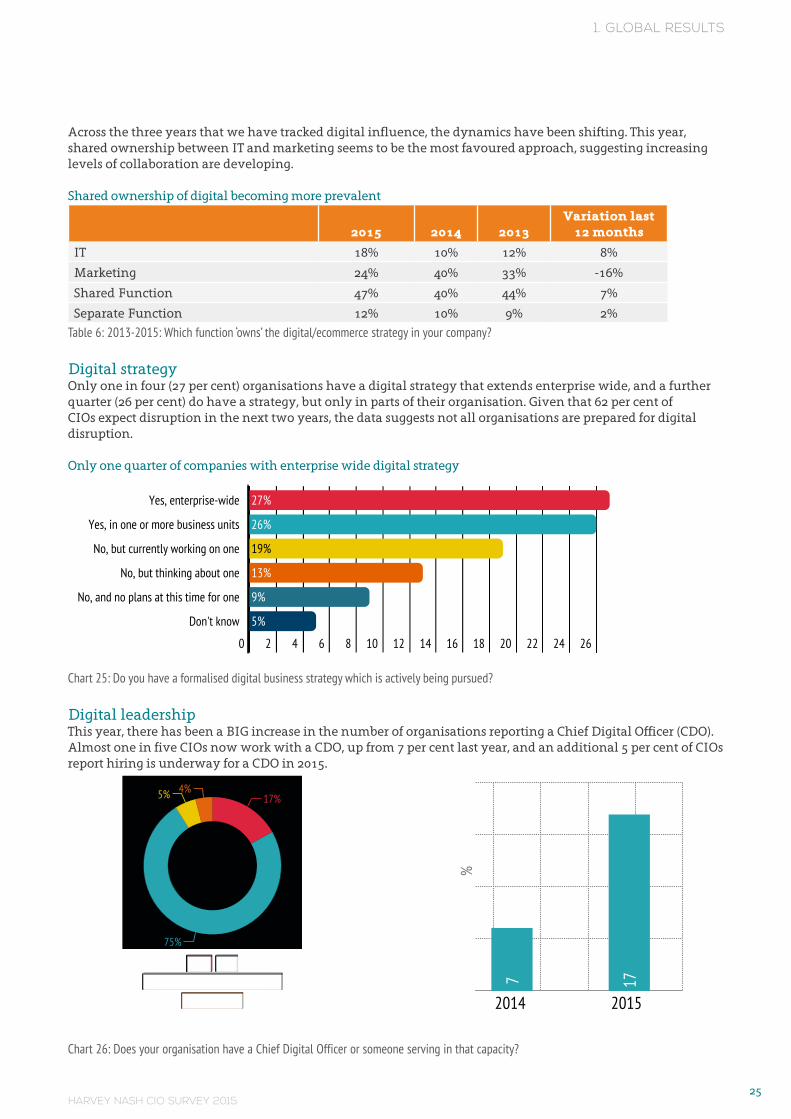
Across the three years that we have tracked digital influence, the dynamics have been shifting. This year, shared ownership between IT and marketing seems to be the most favoured approach, suggesting increasing levels of collaboration are developing.
Shared ownership of digital becoming more prevalent
2015 2014 2013Variation last
12 months
IT 18% 10% 12% 8%
Marketing 24% 40% 33% -16%
Shared Function 47% 40% 44% 7%
Separate Function 12% 10% 9% 2%
Table 6: 2013-2015: Which function ‘owns’ the digital/ecommerce strategy in your company?
Digital strategyOnly one in four (27 per cent) organisations have a digital strategy that extends enterprise wide, and a further quarter (26 per cent) do have a strategy, but only in parts of their organisation. Given that 62 per cent of CIOs expect disruption in the next two years, the data suggests not all organisations are prepared for digital disruption.
Only one quarter of companies with enterprise wide digital strategy
Chart 25: Do you have a formalised digital business strategy which is actively being pursued?
Digital leadershipThis year, there has been a BIG increase in the number of organisations reporting a Chief Digital Officer (CDO). Almost one in five CIOs now work with a CDO, up from 7 per cent last year, and an additional 5 per cent of CIOs report hiring is underway for a CDO in 2015.
Chart 26: Does your organisation have a Chief Digital Officer or someone serving in that capacity?
0-10% 11%-25% 26%-50% 51%-75% 76%-100%
42%
28%
19%
8%3%
%
Over 50% Flex
2011 2012 2013 2014 2015
10
8
9%10%
9% 9%
11%
6
4
20
2015 2014
%
0-10% 11%-25% 26%-50% 51%-75% 76%-100%
50
40
30
20
10
0 41 29 19 8 3 243 31 17 7
Disruption will create new busin... Disruption is more about doing w...Not sure / Don't know
66%
24%
11%
Great extent (lose significant m... Some extent (lose some market sh...Little / no extent (lose little ...
47%
42%
11%
Great extent Som e extent Little / no extent
0 10 20 30 40 50 60 70 80 90
75% 22%
62% 28% 10%
59% 31% 10%
57% 35% 8%
54% 39% 7%
51% 39% 10%
51% 40% 9%
48% 49%
45% 46% 8%
36% 44% 19%
35% 34% 31%
35% 50% 15%
28% 47% 25%
28% 51% 21%
28% 55% 18%
18% 74% 9%
Much better Slightly better Same Slightly worse Much worse
22%
39%
27%
11%1%
Large
Mid-Sized
Global average
Small
0 5 10 15 20 25 30 35
17%
20%
22%
35%
We are already being disrupted
< 2 years
2 – 5 years
5 – 10 years
Never
0 5 10 15 20 25 30
34%
28%
21%
3%
4%
Separate Function
Shared Function
Marketing
IT
-2-4-6-8-10-12-14 0 2 4 6 8
2%
7%
-16%
8%
Yes, enterprise-wide
Yes, in one or more business units
No, but currently working on one
No, but thinking about one
No, and no plans at this time for one
Don't know
0 2 4 6 8 10 12 14 16 18 20 22 24 26
27%
26%
19%
13%
9%
5%
2014 2015
Yes No No, but planning to have one Don't Know
100
90
80
70
60
50
40
30
20
10
0 7 9017 75
CEO
CFO
CIO
COO
CMO
0 5 10 15 20 25 30
7%
12%
14%
26%
34%
Leading it Involved a lot Involved a little Not involved
CDO
CIO
CMO
CEO
COO
CFO
0 10 20 30 40 50 60 70 80 90
47% 31% 8% 14%
35% 50% 13%
30% 49% 16% 5%
20% 39% 32% 9%
12% 44% 32% 12%
4% 30% 45% 21%
0 10 20 30 40 50 60 70 80 90
56% 31% 13%
56% 39% 5%
54% 36% 10%
49% 44% 7%
42% 43% 15%
32% 55% 13%
21% 42% 37%
14% 39% 47%
Lack of vision
Lack of funding
Poor understanding of impact
Lack of critical skills
Cultural resistance
No sense of urgency
Limitations of IT systems
Lack of belief that the threat is real
Lack of support from business leaders
Lack of support from the C suite
Fear cannibalisation of existing business
Lack of support from IT
0 5 10 15 20 25 30
34%
30%
29%
29%
26%
24%
23%
14%
14%
12%
11%
4%
Broadcast / MediaAdvertising / PR
Technology / TelecomsRetail / Leisure
Business / Professional ServicesFinancial Services
HealthcareEducation
Transport / LogisticsUtilities
GovernmentConstruction / Engineering
Charity / Non ProfitEnergy
ManufacturingPharmaceuticals
Broadcast / Media
Advertising
Technology / Telecoms
Retail / Leisure
Charity / Non Profit
Education
Transport
Professional Services
Healthcare
Pharmaceuticals
Government
Construction / Engineering
Energy
Financial Services
Manufacturing
Utilities
0 10 20 30 40 50 60 70 80 90 100
71% 11% 11% 2%5%
60% 15% 20% 5%
48% 30% 17% 4%
46% 33% 16% 4%
43% 23% 29% 5%
43% 30% 20% 5% 2%
36% 31% 22% 4% 7%
35% 35% 23% 3%4%
35% 40% 23%
35% 26% 39%
32% 32% 27% 4% 5%
30% 30% 30% 3%7%
30% 29% 30% 10%
30% 38% 26% 3%3%
26% 27% 35% 8% 4%
20% 28% 36% 8% 8%
Having IT infrastructure thatallows greater innovation / agility
Creating new revenue streamsthrough digital technology
Using mobile platforms /apps to engage with customers
Using technology to reduceoperational costs
Using Big Data / Analytics tounderstand customers
Using social media toengage with customers
Using the Internet of Things
Using Enterprise App Stores to change how software is deployed internally
Essential, vision will not be achieved without it Important, but not essential Not important
<
Yes NoNo, but planning to have one
Don't Know
17%
75%
5% 4% 20
15
10
5
0 7 17
2014 2015
%

HARVEY NASH CIO SURVEY 201526
1. GLOBAL RESULTS
Digital leadershipIn organisations where there is no
CDO it is the CMO who is most likely to lead the shaping and executing of the digital business strategy (34 per cent),
followed by the COO (26 per cent) and then the CIO (14 per cent). It appears
that in the collaborative approach we are seeing, the CMO shapes the goals
of the strategy with the CIO and the IT team building the infrastructure and
tools to support it.
Surprisingly, when a CDO is in place, the top digital officer is not involved
in shaping the digital strategy in 14 per cent of organisations, and they are involved only ‘a little’ in 8 per cent of cases. CDOs contribute ‘a lot’ – but are not in the lead – in developing digital
strategy 31 per cent of the time, and they lead the shaping/executing in less than half (47 per cent) of organisations
where they are present. These mixed messages suggest that the CDO role, still in its infancy, is evolving in its
positioning in organisations – possibly much like the CIO role did two decades
ago.
No CDO in place; it is the CMO who is most often relied upon to lead digital business strategy
When in place, the CDO leads digital strategy ahead of other C-level roles, but not always
Chart 27: Who leads the shaping and / or executing of the digital strategy?
Chart 28: How involved were the following executives (if you have them) in shaping and / or executing the digital business strategy?
CEO
CFO
CIO
COO
CMO
0 5 10 15 20 25 30
7%
12%
14%
26%
34%CD
OCI
OCM
OCE
OCO
OCF
O
47% 31% 8% 14%
35% 50% 13%
30% 49% 16% 5%
20% 39% 32% 9%
12% 44% 32% 12%
4% 30% 45% 21%
Leading it Involved a lot Involved a little Not involved
0 10 20 30 40 50 60 70 80 90
HARVEY NASH CIO SURVEY 201527
1. GLOBAL RESULTS
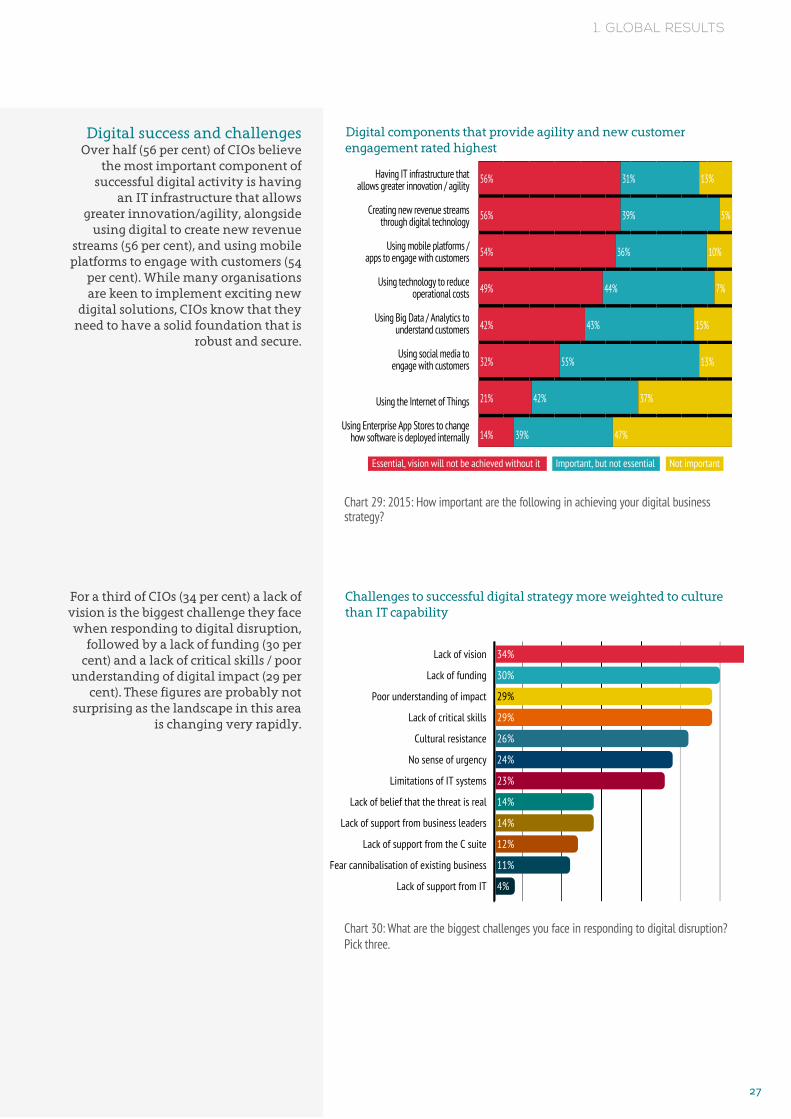
Digital components that provide agility and new customer engagement rated highest
Challenges to successful digital strategy more weighted to culture than IT capability
Chart 29: 2015: How important are the following in achieving your digital business strategy?
Chart 30: What are the biggest challenges you face in responding to digital disruption? Pick three.
Digital success and challengesOver half (56 per cent) of CIOs believe
the most important component of successful digital activity is having
an IT infrastructure that allows greater innovation/agility, alongside
using digital to create new revenue streams (56 per cent), and using mobile platforms to engage with customers (54
per cent). While many organisations are keen to implement exciting new
digital solutions, CIOs know that they need to have a solid foundation that is
robust and secure.
For a third of CIOs (34 per cent) a lack of vision is the biggest challenge they face when responding to digital disruption,
followed by a lack of funding (30 per cent) and a lack of critical skills / poor
understanding of digital impact (29 per cent). These figures are probably not
surprising as the landscape in this area is changing very rapidly.
56% 31% 13%
56% 39% 5%
54% 36% 10%
49% 44% 7%
42% 43% 15%
32% 55% 13%
21% 42% 37%
14% 39% 47%
Having IT infrastructure thatallows greater innovation / agility
Creating new revenue streamsthrough digital technology
Using mobile platforms /apps to engage with customers
Using technology to reduceoperational costs
Using Big Data / Analytics tounderstand customers
Using social media toengage with customers
Using the Internet of Things
Using Enterprise App Stores to change how software is deployed internally
Essential, vision will not be achieved without it Important, but not essential Not important
Lack of vision
Lack of funding
Poor understanding of impact
Lack of critical skills
Cultural resistance
No sense of urgency
Limitations of IT systems
Lack of belief that the threat is real
Lack of support from business leaders
Lack of support from the C suite
Fear cannibalisation of existing business
Lack of support from IT
34%
30%
29%
29%
26%
24%
23%
14%
14%
12%
11%
4%
HARVEY NASH CIO SURVEY 201528
1. GLOBAL RESULTS
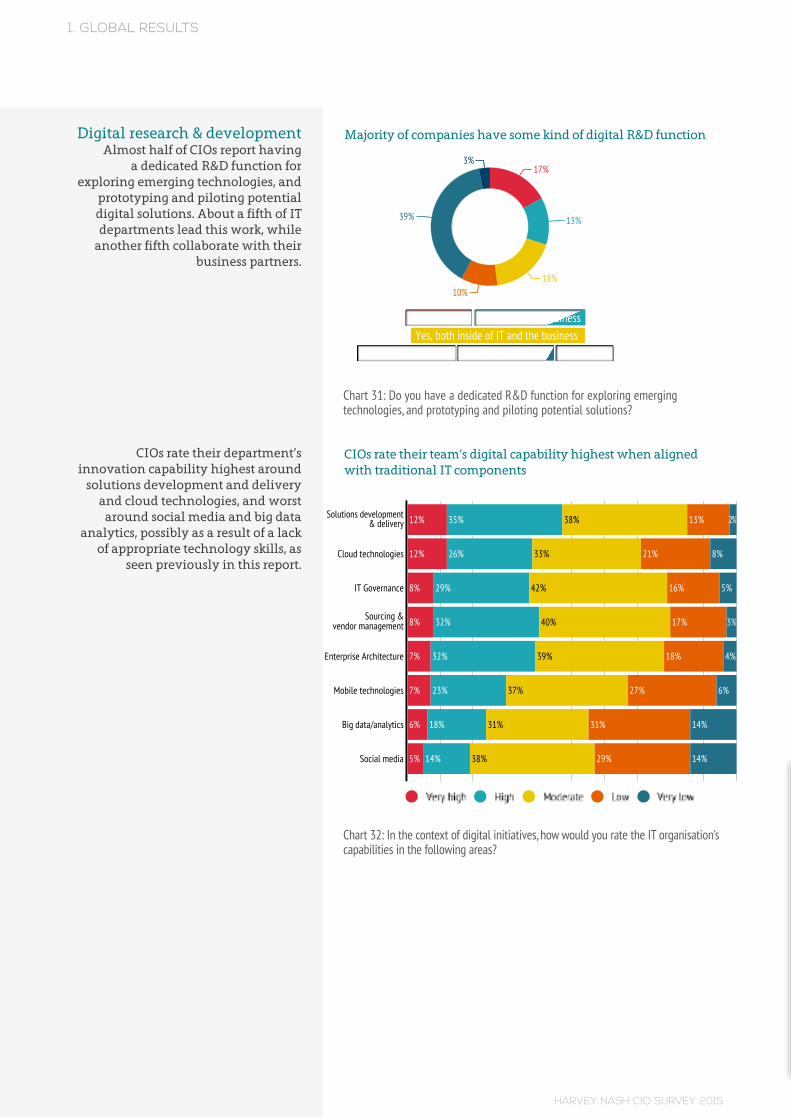
Digital research & developmentAlmost half of CIOs report having
a dedicated R&D function for exploring emerging technologies, and
prototyping and piloting potential digital solutions. About a fifth of IT departments lead this work, while
another fifth collaborate with their business partners.
CIOs rate their department’s innovation capability highest around
solutions development and delivery and cloud technologies, and worst
around social media and big data analytics, possibly as a result of a lack
of appropriate technology skills, as seen previously in this report.
Majority of companies have some kind of digital R&D function
CIOs rate their team’s digital capability highest when aligned with traditional IT components
Chart 31: Do you have a dedicated R&D function for exploring emerging technologies, and prototyping and piloting potential solutions?
Chart 32: In the context of digital initiatives, how would you rate the IT organisation’s capabilities in the following areas?
Yes, within IT Yes, within the businessYes, both inside of IT and the business
No, but planning one No plans at this time Don't know
17%
13%
18%10%
39%
3%
Solutions development & delivery
Cloud technologies
IT Governance
Sourcing & vendor management
Enterprise Architecture
Mobile technologies
Big data/analytics
Social media
0 10 20 30 40 50 60 70 80 90 100
12% 35% 38% 13% 2%
12% 26% 33% 21% 8%
8% 29% 42% 16% 5%
8% 32% 40% 17% 3%
7% 32% 39% 18% 4%
7% 23% 37% 27% 6%
6% 18% 31% 31% 14%
5% 14% 38% 29% 14%
HARVEY NASH CIO SURVEY 201529
1. GLOBAL RESULTS
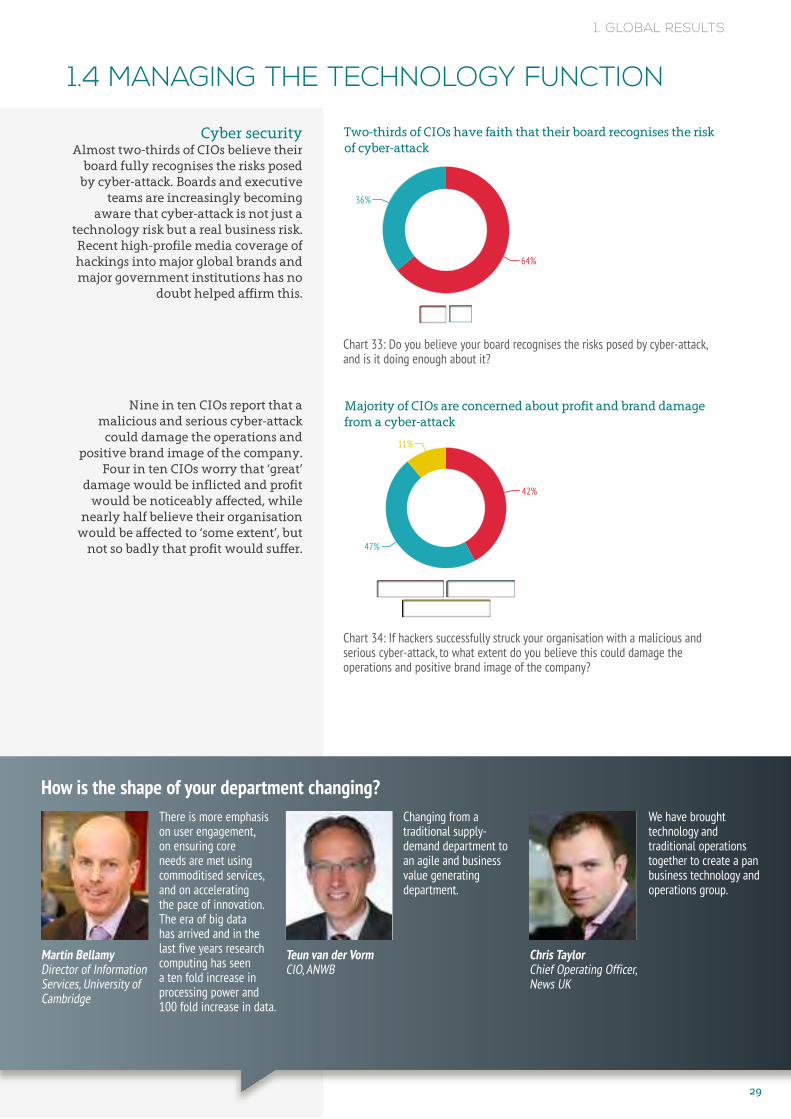
Two-thirds of CIOs have faith that their board recognises the risk of cyber-attack
Majority of CIOs are concerned about profit and brand damage from a cyber-attack
Chart 33: Do you believe your board recognises the risks posed by cyber-attack, and is it doing enough about it?
Chart 34: If hackers successfully struck your organisation with a malicious and serious cyber-attack, to what extent do you believe this could damage the operations and positive brand image of the company?
Cyber securityAlmost two-thirds of CIOs believe their
board fully recognises the risks posed by cyber-attack. Boards and executive
teams are increasingly becoming aware that cyber-attack is not just a
technology risk but a real business risk. Recent high-profile media coverage of hackings into major global brands and major government institutions has no
doubt helped affirm this.
Nine in ten CIOs report that a malicious and serious cyber-attack
could damage the operations and positive brand image of the company.
Four in ten CIOs worry that ‘great’ damage would be inflicted and profit
would be noticeably affected, while nearly half believe their organisation
would be affected to ‘some extent’, but not so badly that profit would suffer.
Yes No
64%
36%
Great extent Some extentLittle / no extent
42%
47%
11%
1.4 MANAGING THE TECHNOLOGY FUNCTION
Chart 41: 2014-2015: How long, from this point onwards, do you expect to
Chart 8: Does the skills shortage prevent your organisation from keeping up with the pace of change? 2005 - 2014
We have brought technology and traditional operations together to create a pan business technology and operations group.
Changing from a traditional supply-demand department to an agile and business value generating department.
There is more emphasis on user engagement, on ensuring core needs are met using commoditised services, and on accelerating the pace of innovation. The era of big data has arrived and in the last five years research computing has seen a ten fold increase in processing power and 100 fold increase in data.
How is the shape of your department changing?
Martin Bellamy Director of Information Services, University of Cambridge
Teun van der VormCIO, ANWB
Chris TaylorChief Operating Officer, News UK
HARVEY NASH CIO SURVEY 201530
1. GLOBAL RESULTS
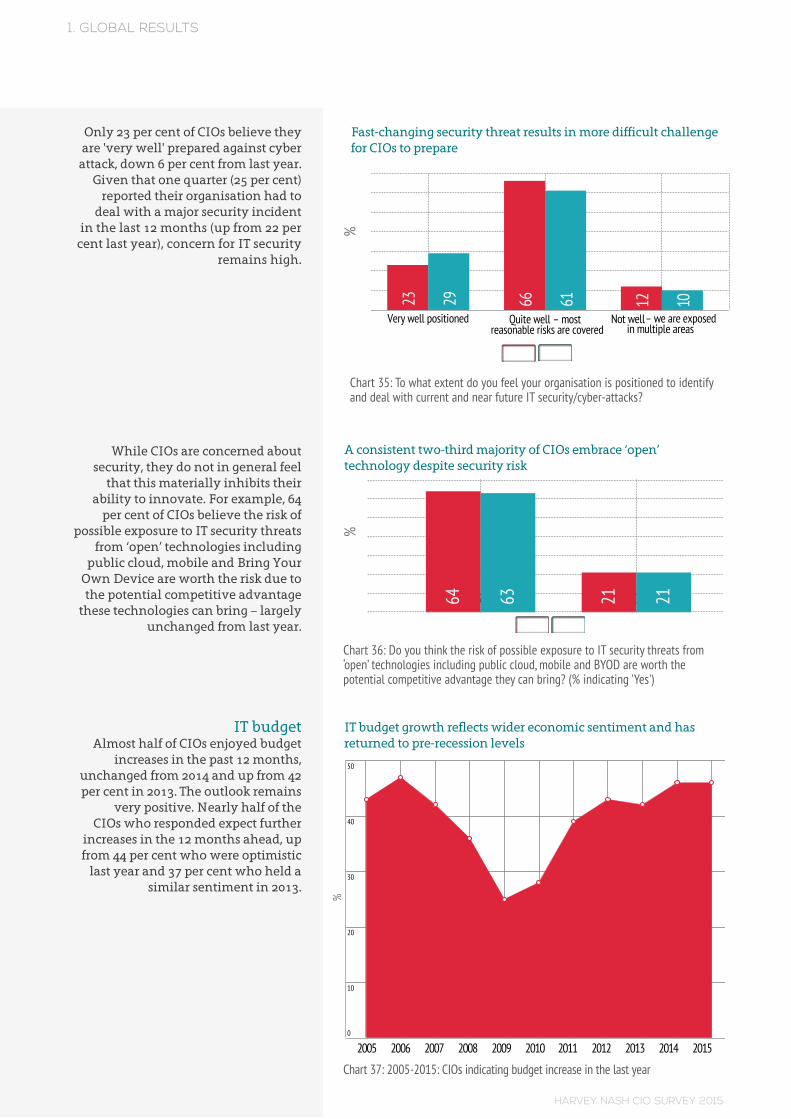
Only 23 per cent of CIOs believe they are 'very well' prepared against cyber
attack, down 6 per cent from last year. Given that one quarter (25 per cent)
reported their organisation had to deal with a major security incident
in the last 12 months (up from 22 per cent last year), concern for IT security
remains high.
While CIOs are concerned about security, they do not in general feel
that this materially inhibits their ability to innovate. For example, 64
per cent of CIOs believe the risk of possible exposure to IT security threats
from ‘open’ technologies including public cloud, mobile and Bring Your
Own Device are worth the risk due to the potential competitive advantage
these technologies can bring – largely unchanged from last year.
IT budgetAlmost half of CIOs enjoyed budget
increases in the past 12 months, unchanged from 2014 and up from 42 per cent in 2013. The outlook remains
very positive. Nearly half of the CIOs who responded expect further
increases in the 12 months ahead, up from 44 per cent who were optimistic
last year and 37 per cent who held a similar sentiment in 2013.
A consistent two-third majority of CIOs embrace ‘open’ technology despite security risk
IT budget growth reflects wider economic sentiment and has returned to pre-recession levels
Chart 36: Do you think the risk of possible exposure to IT security threats from ‘open’ technologies including public cloud, mobile and BYOD are worth the potential competitive advantage they can bring? (% indicating 'Yes')
Chart 37: 2005-2015: CIOs indicating budget increase in the last year
2015 2014
Yes No64 2163 21
2005 2006 2007 2008 2009 2010 2011 2012 2013 2014 2015
50
40
30
20
10
0
%%
%
Fast-changing security threat results in more difficult challenge for CIOs to prepare
Chart 35: To what extent do you feel your organisation is positioned to identify and deal with current and near future IT security/cyber-attacks?
2015 2014
Very well positioned Quite well
–
most reasonable risks are covered
Not
well – we are
exposed in multiple areas
23 66 1229 61 10
HARVEY NASH CIO SURVEY 201531
1. GLOBAL RESULTS
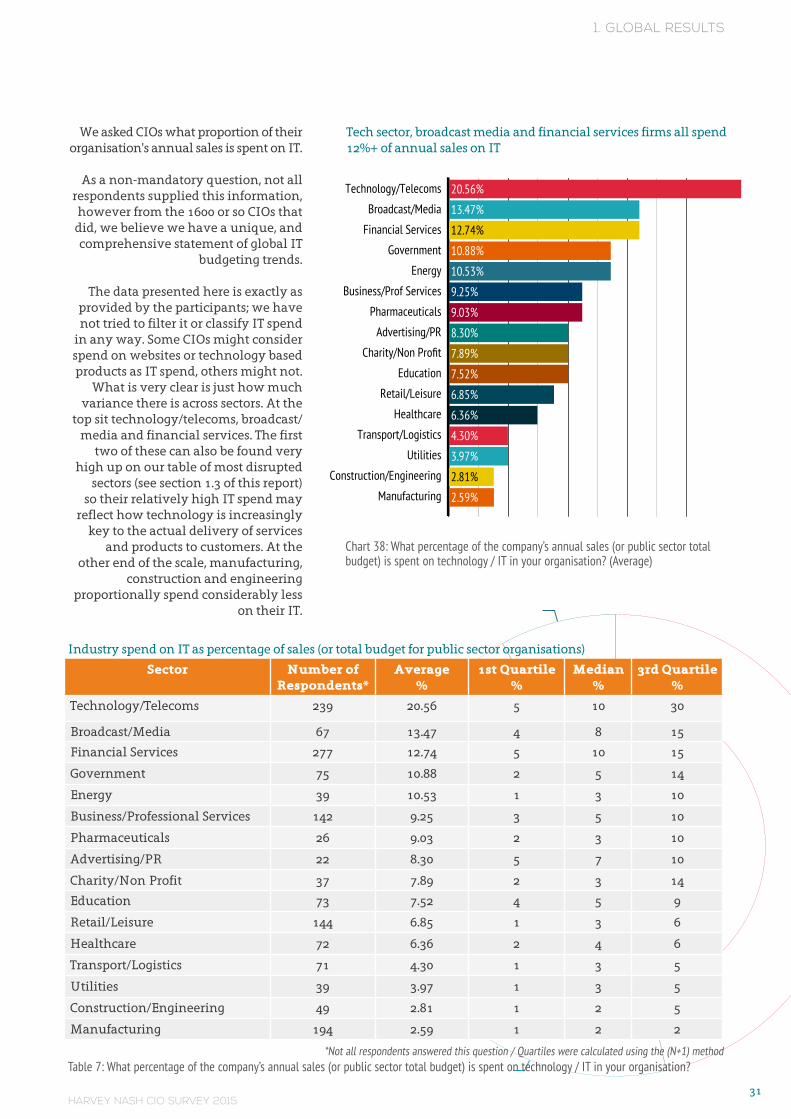
Tech sector, broadcast media and financial services firms all spend 12%+ of annual sales on IT
Chart 38: What percentage of the company’s annual sales (or public sector total budget) is spent on technology / IT in your organisation? (Average)
We asked CIOs what proportion of their organisation's annual sales is spent on IT.
As a non-mandatory question, not all respondents supplied this information, however from the 1600 or so CIOs that
did, we believe we have a unique, and comprehensive statement of global IT
budgeting trends.
The data presented here is exactly as provided by the participants; we have not tried to filter it or classify IT spend
in any way. Some CIOs might consider spend on websites or technology based products as IT spend, others might not.
What is very clear is just how much variance there is across sectors. At the
top sit technology/telecoms, broadcast/media and financial services. The first
two of these can also be found very high up on our table of most disrupted
sectors (see section 1.3 of this report) so their relatively high IT spend may
reflect how technology is increasingly key to the actual delivery of services
and products to customers. At the other end of the scale, manufacturing,
construction and engineering proportionally spend considerably less
on their IT.
Solutions development & delivery
Cloud technologies
IT Governance
Sourcing & vendor management
Enterprise Architecture
Mobile technologies
Big data/analytics
Social media
0 10 20 30 40 50 60 70 80 90 100
12% 35% 38% 13% 2%
12% 26% 33% 21% 8%
8% 29% 42% 16% 5%
8% 32% 40% 17% 3%
7% 32% 39% 18% 4%
7% 23% 37% 27% 6%
6% 18% 31% 31% 14%
5% 14% 38% 29% 14%
Yes No
64%
36%
Great extent Some extent Little / no extent
42%
47%
11%
2015 2014
%
Very well positioned Quite well
–
most reasonable risks are covered
Not
well – we are
exposed in multiple areas
70
60
50
40
30
20
10
0 23 66 1229 61 10
2015 2014
%
Yes No
70
60
50
40
30
20
100 64 2163 21
Increased
2005 2006 2007 2008 2009 2010 2011 2012 2013 2014 2015
50
40
30
20
10
0
0 2 4 6 8 10 12 14 16
20.56%
13.47%
12.74%
10.88%
10.53%
9.25%
9.03%
8.30%
7.89%
7.52%
6.85%
6.36%
4.30%
3.97%
2.81%
2.59%
Less than 5% 5 – 10% 11 – 25% 26 – 50% More than 50%
46%
19%
15%
11%
8%
Software Application Development
Software Application Maintenance
Systems Integration
Data Centers
Networks
Service Desk / Help Desk
IT BPO
HR BPO
KPO
IT Infrastructure
IT Department
Other, please specify
0 5 10 15 20 25 30 35 40 45 50
53.1%
44.7%
19.8%
52.8%
40.2%
42.4%
6.6%
14.1%
1.6%
42.0%
7.3%
6.6%
%
Frees up resources to focus on core business
Provides access to skills not available in-house
Improves flexibility in use of resources
Improves our ability to innovate
Saves money
0 10 20 30 40 50 60 70 80 90 100
50% 43% 7%
50% 41% 9%
46% 48% 6%
40% 48% 12%
25% 52% 23%
Large Mid-Sized Small
50403020100
Saves money
Frees up resourcesto focus on core
business
Improves our abilityto innovate
Provides access toskills not available
in-house
Improves flexibilityin use of resources
30%
25%
26%
44%
50%
56%
35%
42%
43%
36%
52%
52%
34%
48%
47%
Increase Decrease Stay the same Don't know
46%
15%
36%
4%
2015 2014
Less than 1 year 1 - 2 years 2 - 5 years 5 - 10 years More than 10 years
40
30
20
10
0 12 17 29 22 1914 16 30 21 20
2015 2014
Less than 1 year 1 - 2 years 2 - 5 years 5 - 10 years More than 10 years
40
30
20
10
0 24 24 31 12 925 25 32 12 6
2015 2014
Very fulfilling Quite fulfilling Not very fulfilling Not at all fulfilling
50
40
30
20
10
0 33 47 17 433 45 17 5
Large
Global Av.
Mid-Sized
CFO Report
Small
CEO Report
Ex. Co Member
0 10 20 30 40 50 60 70 80
75%
80%
81%
82%
83%
84%
85%
2015 2014
Actively seeking & applying
Would take
call from head hunter
Keeping
an
eye on the market
Would not consider any roles presented
50
40
30
20
10
0 22 38 30 1121 40 28 11
Staying in IT Chief Digital Officer role Senior non technology based role... Consultancy
52%
13%
22%
13%
Decreased Stayed same Increased 10%
3%
62%
31%
Technology / Telecoms
Pharmaceuticals
Retail / Leisure
Utilities
Charity / Non Profit
Construction / Engineering
Broadcast Media
Energy
Healthcare
Global Average
Advertising
Manufacturing
Financial Services
Professional Services
Education
Transport
Government
0 5 10 15 20 25 30 35 40
41%
38%
37%
37%
36%
34%
32%
31%
31%
31%
30%
30%
29%
28%
27%
25%
20%
0%
10%
20%
30%
40%
50%
75%
100%
150%
200%>
0 5 10 15 20 25 30
28%
31%
16%
10%
4%
4%
2%
2%
1%
2%
Yes No No, but planning to have one Don't Know
17%
75%
5%4%
Create infographics
%%
%%
%
Technology/Telecoms
Broadcast/Media
Financial Services
Government
Energy
Business/Prof Services
Pharmaceuticals
Advertising/PR
Charity/Non Profit
Education
Retail/Leisure
Healthcare
Transport/Logistics
Utilities
Construction/Engineering
Manufacturing
Industry spend on IT as percentage of sales (or total budget for public sector organisations)
Sector Number of Respondents*
Average%
1st Quartile %
Median %
3rd Quartile %
Technology/Telecoms 239 20.56 5 10 30
Broadcast/Media 67 13.47 4 8 15
Financial Services 277 12.74 5 10 15
Government 75 10.88 2 5 14
Energy 39 10.53 1 3 10
Business/Professional Services 142 9.25 3 5 10
Pharmaceuticals 26 9.03 2 3 10
Advertising/PR 22 8.30 5 7 10
Charity/Non Profit 37 7.89 2 3 14
Education 73 7.52 4 5 9
Retail/Leisure 144 6.85 1 3 6
Healthcare 72 6.36 2 4 6
Transport/Logistics 71 4.30 1 3 5
Utilities 39 3.97 1 3 5
Construction/Engineering 49 2.81 1 2 5
Manufacturing 194 2.59 1 2 2
*Not all respondents answered this question / Quartiles were calculated using the (N+1) methodTable 7: What percentage of the company’s annual sales (or public sector total budget) is spent on technology / IT in your organisation?
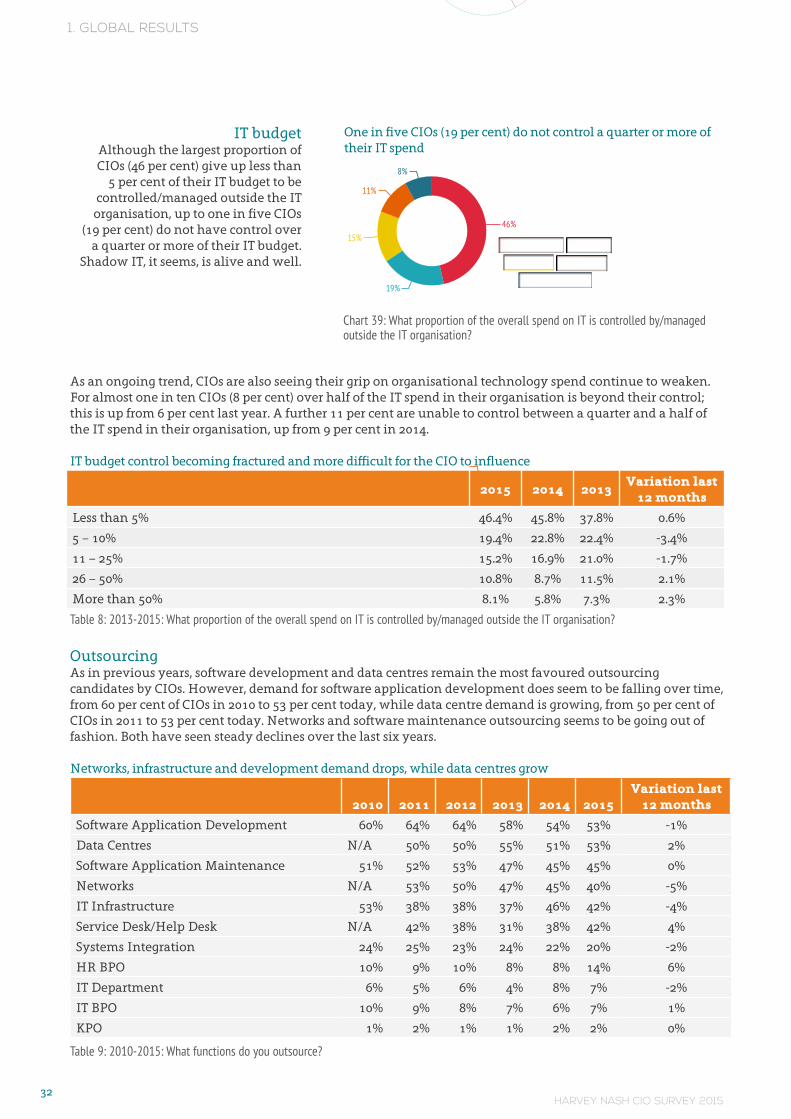
HARVEY NASH CIO SURVEY 201532
1. GLOBAL RESULTS
IT budget Although the largest proportion of CIOs (46 per cent) give up less than
5 per cent of their IT budget to be controlled/managed outside the IT
organisation, up to one in five CIOs (19 per cent) do not have control over
a quarter or more of their IT budget. Shadow IT, it seems, is alive and well.
One in five CIOs (19 per cent) do not control a quarter or more of their IT spend
Chart 39: What proportion of the overall spend on IT is controlled by/managed outside the IT organisation?
Yes No
59%
41%
0-10% 11%-25% 26%-50%51%-75% 76%-100%
42%
28%
19%
8%3%
66%
24%
11%
47%
42%
11%
Much better Slightly betterSame Slightly worse Much worse
22%
39%
27%
11% 1%
Yes, within IT Yes, within the businessYes, both inside of IT and the business
No, but planning one No plans at this time Don't know
17%
13%
18%10%
39%
3%
Yes No
64%
36%
Great extent Some extentLittle / no extent
42%
47%
11%
Less than 5% 5 – 10%11 – 25% 26 – 50%
More than 50%
46%
19%
15%
11%
8%
Increase DecreaseStay the same Don't know
46%
15%
36%
4%
Staying in ITChief Digital Officer role
Senior non technology based role...Consultancy
52%
13%
22%
13%
Decreased Stayed sameIncreased 10%
3%
64%
33%
Disruption is more about doing what we already do, but more effectively
Not sure / Don't know
reat e tent lose significant ar et share o e e tent lose so e ar et share ittle / no e tent lose little / no ar et share
Disruption will create new business models, products and services that will outperform the old ones
`B�
As an ongoing trend, CIOs are also seeing their grip on organisational technology spend continue to weaken. For almost one in ten CIOs (8 per cent) over half of the IT spend in their organisation is beyond their control; this is up from 6 per cent last year. A further 11 per cent are unable to control between a quarter and a half of the IT spend in their organisation, up from 9 per cent in 2014.
IT budget control becoming fractured and more difficult for the CIO to influence
2015 2014 2013Variation last
12 months
Less than 5% 46.4% 45.8% 37.8% 0.6%
5 – 10% 19.4% 22.8% 22.4% -3.4%
11 – 25% 15.2% 16.9% 21.0% -1.7%
26 – 50% 10.8% 8.7% 11.5% 2.1%
More than 50% 8.1% 5.8% 7.3% 2.3%
Table 8: 2013-2015: What proportion of the overall spend on IT is controlled by/managed outside the IT organisation?
OutsourcingAs in previous years, software development and data centres remain the most favoured outsourcing candidates by CIOs. However, demand for software application development does seem to be falling over time, from 60 per cent of CIOs in 2010 to 53 per cent today, while data centre demand is growing, from 50 per cent of CIOs in 2011 to 53 per cent today. Networks and software maintenance outsourcing seems to be going out of fashion. Both have seen steady declines over the last six years.
Networks, infrastructure and development demand drops, while data centres grow
2010 2011 2012 2013 2014 2015Variation last
12 months
Software Application Development 60% 64% 64% 58% 54% 53% -1%
Data Centres N/A 50% 50% 55% 51% 53% 2%
Software Application Maintenance 51% 52% 53% 47% 45% 45% 0%
Networks N/A 53% 50% 47% 45% 40% -5%
IT Infrastructure 53% 38% 38% 37% 46% 42% -4%
Service Desk/Help Desk N/A 42% 38% 31% 38% 42% 4%
Systems Integration 24% 25% 23% 24% 22% 20% -2%
HR BPO 10% 9% 10% 8% 8% 14% 6%
IT Department 6% 5% 6% 4% 8% 7% -2%
IT BPO 10% 9% 8% 7% 6% 7% 1%
KPO 1% 2% 1% 1% 2% 2% 0%
Table 9: 2010-2015: What functions do you outsource?
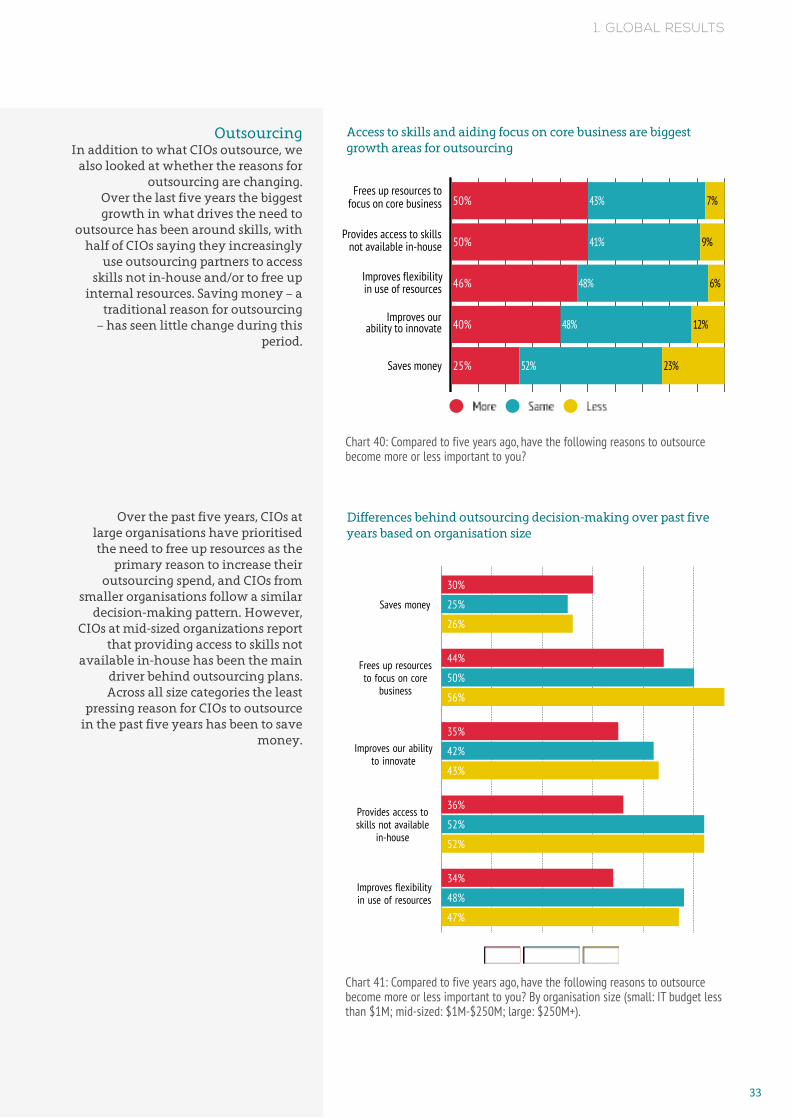
HARVEY NASH CIO SURVEY 201533
1. GLOBAL RESULTS
OutsourcingIn addition to what CIOs outsource, we
also looked at whether the reasons for outsourcing are changing.
Over the last five years the biggest growth in what drives the need to
outsource has been around skills, with half of CIOs saying they increasingly
use outsourcing partners to access skills not in-house and/or to free up
internal resources. Saving money – a traditional reason for outsourcing
– has seen little change during this period.
Over the past five years, CIOs at large organisations have prioritised the need to free up resources as the
primary reason to increase their outsourcing spend, and CIOs from
smaller organisations follow a similar decision-making pattern. However,
CIOs at mid-sized organizations report that providing access to skills not
available in-house has been the main driver behind outsourcing plans. Across all size categories the least
pressing reason for CIOs to outsource in the past five years has been to save
money.
Access to skills and aiding focus on core business are biggest growth areas for outsourcing
Differences behind outsourcing decision-making over past five years based on organisation size
Chart 40: Compared to five years ago, have the following reasons to outsource become more or less important to you?
Chart 41: Compared to five years ago, have the following reasons to outsource become more or less important to you? By organisation size (small: IT budget less than $1M; mid-sized: $1M-$250M; large: $250M+).
Frees up resources to focus on core business
Provides access to skills not available in-house
Improves flexibility in use of resources
Improves our ability to innovate
Saves money
0 10 20 30 40 50 60 70 80 90 100
50% 43% 7%
50% 41% 9%
46% 48% 6%
40% 48% 12%
25% 52% 23%
Large Mid-Sized Small
50403020100
Saves money
Frees up resourcesto focus on core
business
Improves our abilityto innovate
Provides access toskills not available
in-house
Improves flexibilityin use of resources
30%
25%
26%
44%
50%
56%
35%
42%
43%
36%
52%
52%
34%
48%
47%
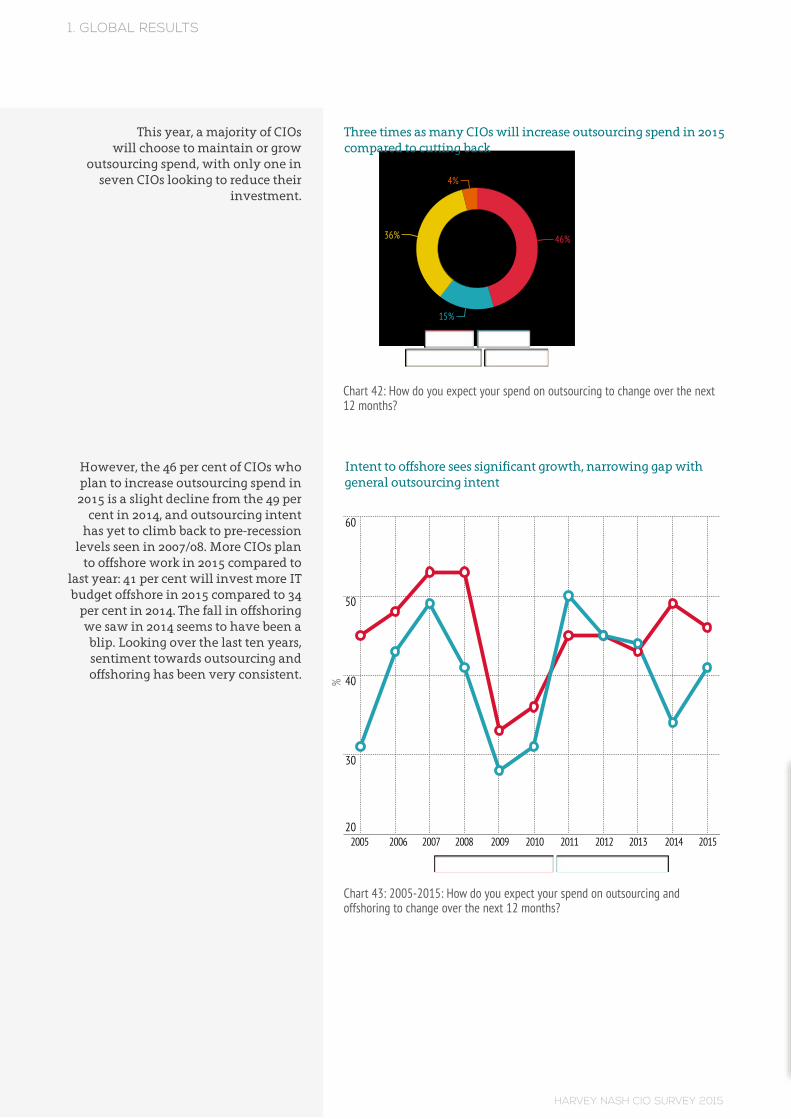
HARVEY NASH CIO SURVEY 201534
1. GLOBAL RESULTS
This year, a majority of CIOs will choose to maintain or grow
outsourcing spend, with only one in seven CIOs looking to reduce their
investment.
However, the 46 per cent of CIOs who plan to increase outsourcing spend in 2015 is a slight decline from the 49 per
cent in 2014, and outsourcing intent has yet to climb back to pre-recession
levels seen in 2007/08. More CIOs plan to offshore work in 2015 compared to
last year: 41 per cent will invest more IT budget offshore in 2015 compared to 34
per cent in 2014. The fall in offshoring we saw in 2014 seems to have been a blip. Looking over the last ten years, sentiment towards outsourcing and offshoring has been very consistent.
Increase DecreaseStay the same Don't know
46%
15%
36%
4%
Three times as many CIOs will increase outsourcing spend in 2015 compared to cutting back
Chart o o yo e pect yo r spen on o tso rcing to change o er the ne t 12 months?
Intent to offshore sees significant growth, narrowing gap with general outsourcing intent
Chart 43: 2005-2015: How do you expect your spend on outsourcing and offshoring to change over the next 12 months?
Outsourcing to Increase Offshoring to Increase
%
2005 2006 2007 2008 2009 2010 2011 2012 2013 2014 2015
60
50
40
30
20
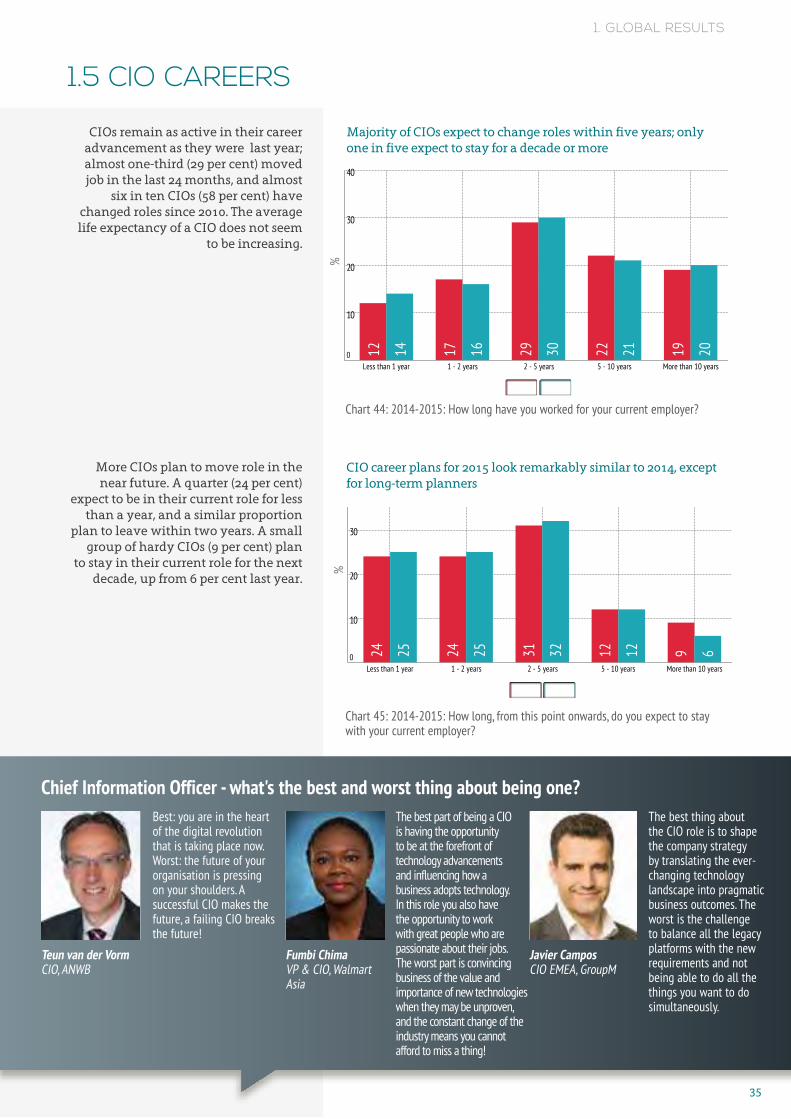
HARVEY NASH CIO SURVEY 201535
1. GLOBAL RESULTS
Majority of CIOs expect to change roles within five years; only one in five expect to stay for a decade or more
CIO career plans for 2015 look remarkably similar to 2014, except for long-term planners
Chart 44: 2014-2015: How long have you worked for your current employer?
Chart 45: 2014-2015: How long, from this point onwards, do you expect to stay with your current employer?
Chart 41: 2014-2015: How long, from this point onwards, do you expect to stay with your current
CIOs remain as active in their career advancement as they were last year; almost one-third (29 per cent) moved job in the last 24 months, and almost
six in ten CIOs (58 per cent) have changed roles since 2010. The average life expectancy of a CIO does not seem
to be increasing.
More CIOs plan to move role in the near future. A quarter (24 per cent)
expect to be in their current role for less than a year, and a similar proportion
plan to leave within two years. A small group of hardy CIOs (9 per cent) plan
to stay in their current role for the next decade, up from 6 per cent last year.
1.5 CIO CAREERS
2015 2014
Less than 1 year 1 - 2 years 2 - 5 years 5 - 10 years More than 10 years
40
30
20
10
0 12 17 29 22 1914 16 30 21 20
%
2015 2014
Less than 1 year 1 - 2 years 2 - 5 years 5 - 10 years More than 10 years
30
20
10
0 24 24 31 12 925 25 32 12 6
%
Chart 8: Does the skills shortage prevent your organisation from keeping up with the pace of change? 2005 - 2014
The best thing about the CIO role is to shape the company strategy by translating the ever-changing technology landscape into pragmatic business outcomes. The worst is the challenge to balance all the legacy platforms with the new requirements and not being able to do all the things you want to do simultaneously.
The best part of being a CIO is having the opportunity to be at the forefront of technology advancements and influencing how a business adopts technology. In this role you also have the opportunity to work with great people who are passionate about their jobs. The worst part is convincing business of the value and importance of new technologies when they may be unproven, and the constant change of the industry means you cannot afford to miss a thing!
Best: you are in the heart of the digital revolution that is taking place now. Worst: the future of your organisation is pressing on your shoulders. A successful CIO makes the future, a failing CIO breaks the future!
Chief Information Officer - what's the best and worst thing about being one?
Teun van der VormCIO, ANWB
Fumbi ChimaVP & CIO, Walmart Asia
Javier CamposCIO EMEA, GroupM
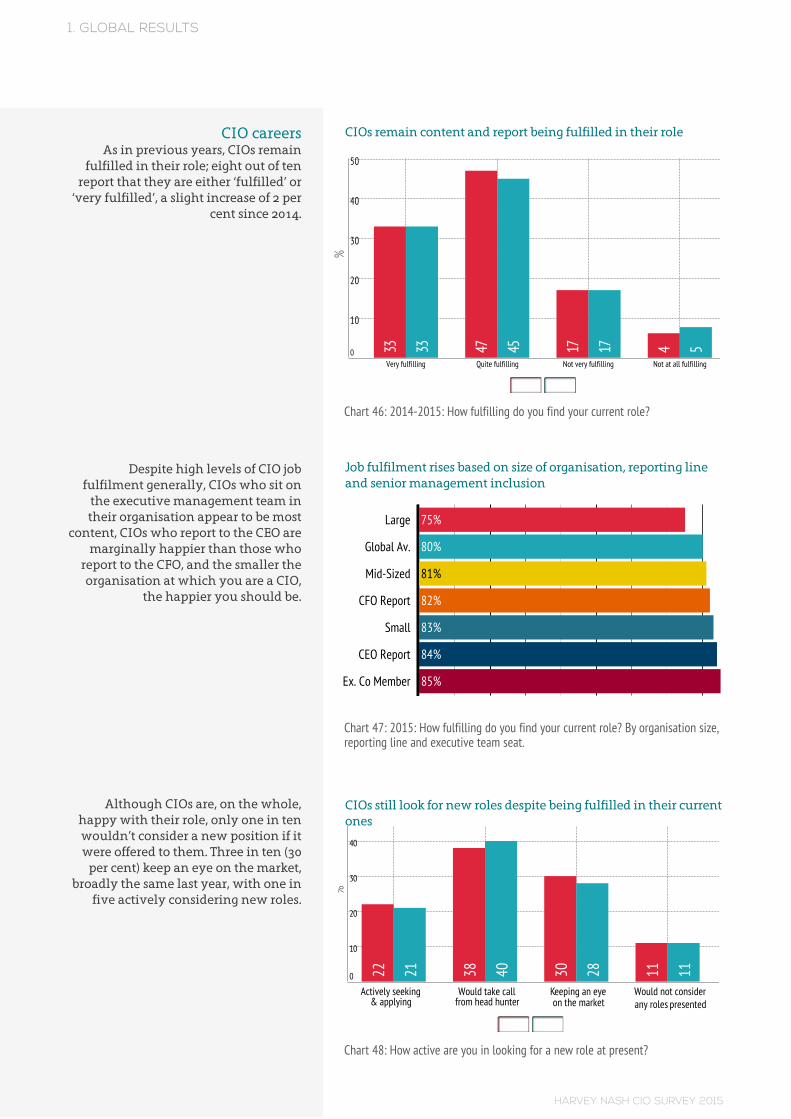
HARVEY NASH CIO SURVEY 201536
1. GLOBAL RESULTS
CIO careersAs in previous years, CIOs remain
fulfilled in their role; eight out of ten report that they are either ‘fulfilled’ or
‘very fulfilled’, a slight increase of 2 per cent since 2014.
Despite high levels of CIO job fulfilment generally, CIOs who sit on
the executive management team in their organisation appear to be most
content, CIOs who report to the CEO are marginally happier than those who
report to the CFO, and the smaller the organisation at which you are a CIO,
the happier you should be.
Although CIOs are, on the whole, happy with their role, only one in ten wouldn’t consider a new position if it were offered to them. Three in ten (30
per cent) keep an eye on the market, broadly the same last year, with one in
five actively considering new roles.
CIOs remain content and report being fulfilled in their role
Job fulfilment rises based on size of organisation, reporting line and senior management inclusion
CIOs still look for new roles despite being fulfilled in their current ones
Chart 46: 2014-2015: How fulfilling do you find your current role?
Chart 47: 2015: How fulfilling do you find your current role? By organisation size, reporting line and executive team seat.
Chart 48: How active are you in looking for a new role at present?
2015 2014
Very fulfilling Quite fulfilling Not very fulfilling Not at all fulfilling
50
40
30
20
10
0 33 47 17 433 45 17 5
%
2015 2014
Actively seeking & applying
Would take
call from head hunter
Keeping
an
eye on the market
Would not consider any roles presented
40
30
20
10
0 22 38 30 1121 40 28 11
%
Large
Global Av.
Mid-Sized
CFO Report
Small
CEO Report
Ex. Co Member
75%
80%
81%
82%
83%
84%
85%
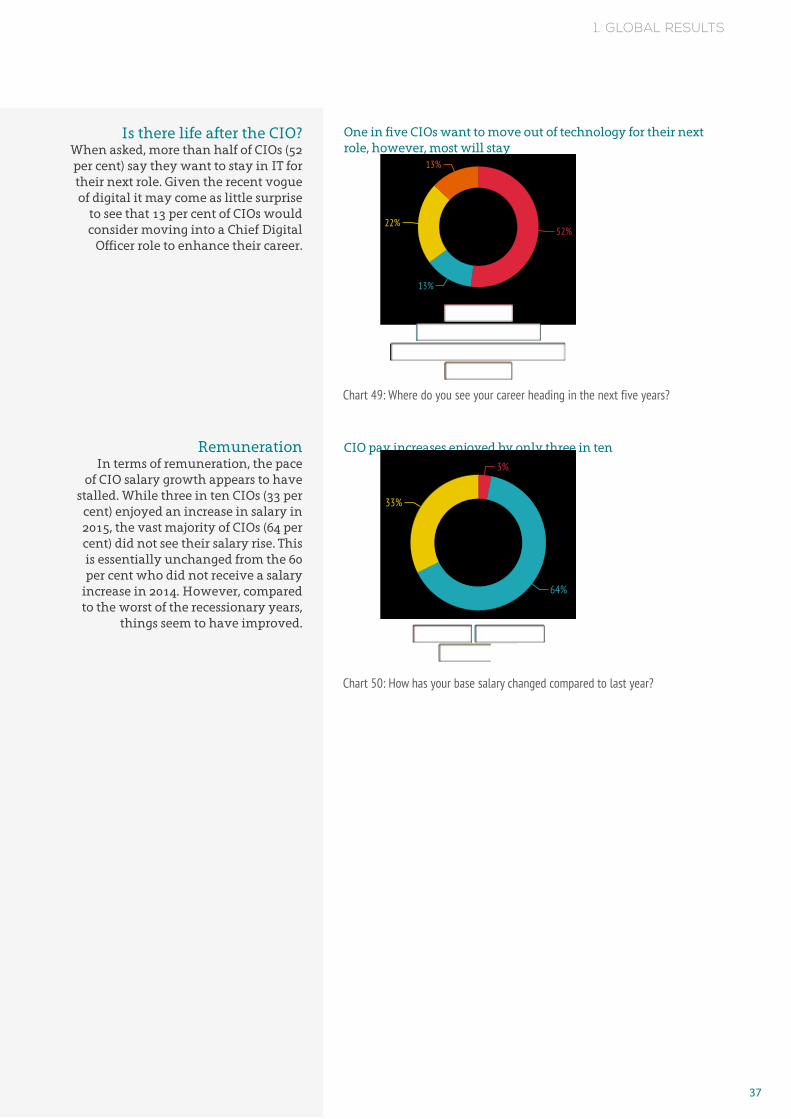
HARVEY NASH CIO SURVEY 201537
1. GLOBAL RESULTS
One in five CIOs want to move out of technology for their next role, however, most will stay
CIO pay increases enjoyed by only three in ten
Chart 49: Where do you see your career heading in the next five years?
Chart 50: How has your base salary changed compared to last year?
Is there life after the CIO?When asked, more than half of CIOs (52 per cent) say they want to stay in IT for their next role. Given the recent vogue of digital it may come as little surprise
to see that 13 per cent of CIOs would consider moving into a Chief Digital
Officer role to enhance their career.
RemunerationIn terms of remuneration, the pace
of CIO salary growth appears to have stalled. While three in ten CIOs (33 per
cent) enjoyed an increase in salary in 2015, the vast majority of CIOs (64 per cent) did not see their salary rise. This is essentially unchanged from the 60 per cent who did not receive a salary
increase in 2014. However, compared to the worst of the recessionary years,
things seem to have improved.
Staying in ITChief Digital Officer role
Senior non technology based role...Consultancy
52%
13%
22%
13%
Decreased Stayed sameIncreased 10%
3%
64%
33%
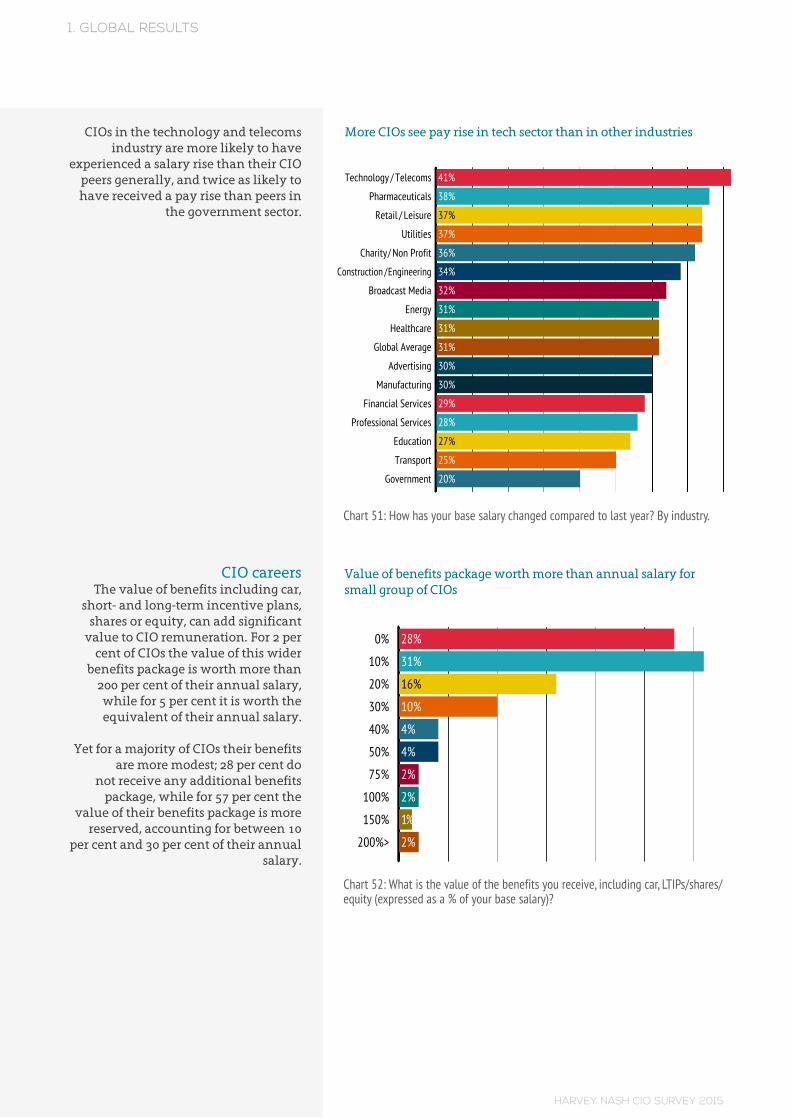
HARVEY NASH CIO SURVEY 201538
1. GLOBAL RESULTS
CIOs in the technology and telecoms industry are more likely to have
experienced a salary rise than their CIO peers generally, and twice as likely to have received a pay rise than peers in
the government sector.
CIO careersThe value of benefits including car,
short- and long-term incentive plans, shares or equity, can add significant
value to CIO remuneration. For 2 per cent of CIOs the value of this wider
benefits package is worth more than 200 per cent of their annual salary, while for 5 per cent it is worth the equivalent of their annual salary.
Yet for a majority of CIOs their benefits are more modest; 28 per cent do
not receive any additional benefits package, while for 57 per cent the
value of their benefits package is more reserved, accounting for between 10
per cent and 30 per cent of their annual salary.
More CIOs see pay rise in tech sector than in other industries
Value of benefits package worth more than annual salary for small group of CIOs
Chart 51: How has your base salary changed compared to last year? By industry.
Chart 52: What is the value of the benefits you receive, including car, LTIPs/shares/equity (expressed as a % of your base salary)?
Technology / Telecoms
Pharmaceuticals
Retail / Leisure
Utilities
Charity / Non Profit
Construction / Engineering
Broadcast Media
Energy
Healthcare
Global Average
Advertising
Manufacturing
Financial Services
Professional Services
Education
Transport
Government
41%
38%
37%
37%
36%
34%
32%
31%
31%
31%
30%
30%
29%
28%
27%
25%
20%
0%
10%
20%
30%
40%
50%
75%
100%
150%
200%>
0 5 10 15 20 25 30
28%
31%
16%
10%
4%
4%
2%
2%
1%
2%

HARVEY NASH CIO SURVEY 201539
1. GLOBAL RESULTS
2. REGIONAL RESULTS
JOIN THE CONVERSATION...• DOWNLOAD THE FULL SURVEY• REGISTER FOR EVENTS ACROSS THE WORLD• VIEW VIDEOS, BLOGS, PHOTOS
WWW.HARVEYNASH.COM/CIOSURVEY

HARVEY NASH CIO SURVEY 201540
2. REGIONAL PROFILES
ASIA-PACIFIC (APAC) REGION
Compared to the global average, a CIO from APAC is…
More likely to have received a pay rise58 per cent received a pay rise in the past year, 27 per cent more than the global average (31 per cent)
Equally strategic in outlook69 per cent see the role of the CIO becoming more strategic, the same percentage as the global average (69 per cent)
Less able to secure the right skills71 per cent believe a skills shortage will have an impact, 12 per cent higher than the global average (59 per cent)
Equally likely to increase headcount
46 per cent plan to increase IT headcount, similar to the global average (45 per cent)
Less affected by digital
disruption29 per cent believe they are already being disrupted by digital, 6 per cent less than the global average (35 per cent)
Equally likely to have a Chief Digital Officer18 per cent currently have a Chief Digital Officer, similar to the global average (17 per cent)
Less safe from IT security attack35 per cent have faced a major IT security attack in the last year, 10 per cent higher than the global average (25 per cent)
Equally likely to outsource45 per cent expect to increase outsourcing, similar to the global average (46 per cent)
Less diverse IT leadership7 per cent of respondents are female IT leaders, 2 per cent lower than the global average (9 per cent)
NOTE: The APAC region for the 2015 Harvey Nash CIO Survey includes insight from CIOs in China, Hong Kong, India, Japan, Singapore, Thailand and Vietnam.
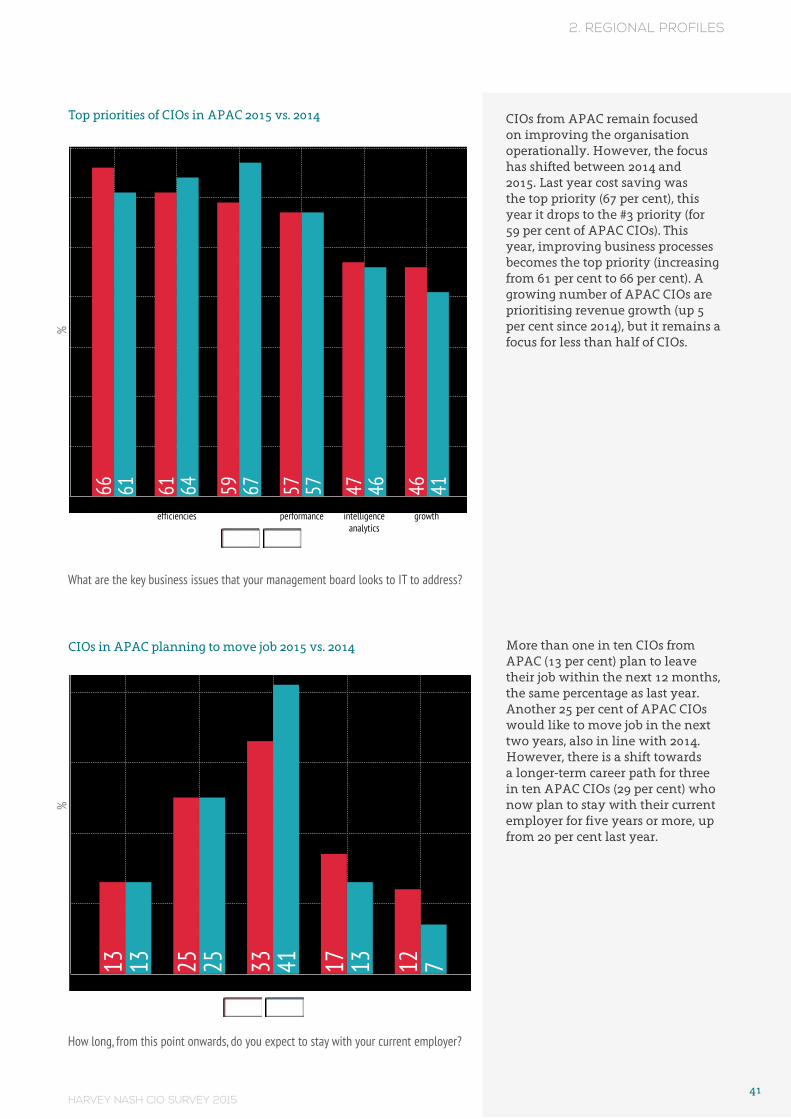
HARVEY NASH CIO SURVEY 201541
2. REGIONAL PROFILES
CIOs from APAC remain focused on improving the organisation operationally. However, the focus has shifted between 2014 and 2015. Last year cost saving was the top priority (67 per cent), this year it drops to the #3 priority (for 59 per cent of APAC CIOs). This year, improving business processes becomes the top priority (increasing from 61 per cent to 66 per cent). A growing number of APAC CIOs are prioritising revenue growth (up 5 per cent since 2014), but it remains a focus for less than half of CIOs.
More than one in ten CIOs from APAC (13 per cent) plan to leave their job within the next 12 months, the same percentage as last year. Another 25 per cent of APAC CIOs would like to move job in the next two years, also in line with 2014. However, there is a shift towards a longer-term career path for three in ten APAC CIOs (29 per cent) who now plan to stay with their current employer for five years or more, up from 20 per cent last year.
Top priorities of CIOs in APAC 2015 vs. 2014
CIOs in APAC planning to move job 2015 vs. 2014
2015 2014
%
Business processes Operationalefficiencies
Saving costs Stable ITperformance
Businessintelligence
analytics
Driving revenuegrowth
70
60
50
40
30
20
10
0 66 61 59 57 47 4661 64 67 57 46 41
2015 2014
%
Less than 1 year 1 - 2 years 2 - 5 years 5 - 10 years More than 10 years
40
30
20
10
0 13 25 33 17 1213 25 41 13 7
What are the key business issues that your management board looks to IT to address?
How long, from this point onwards, do you expect to stay with your current employer?
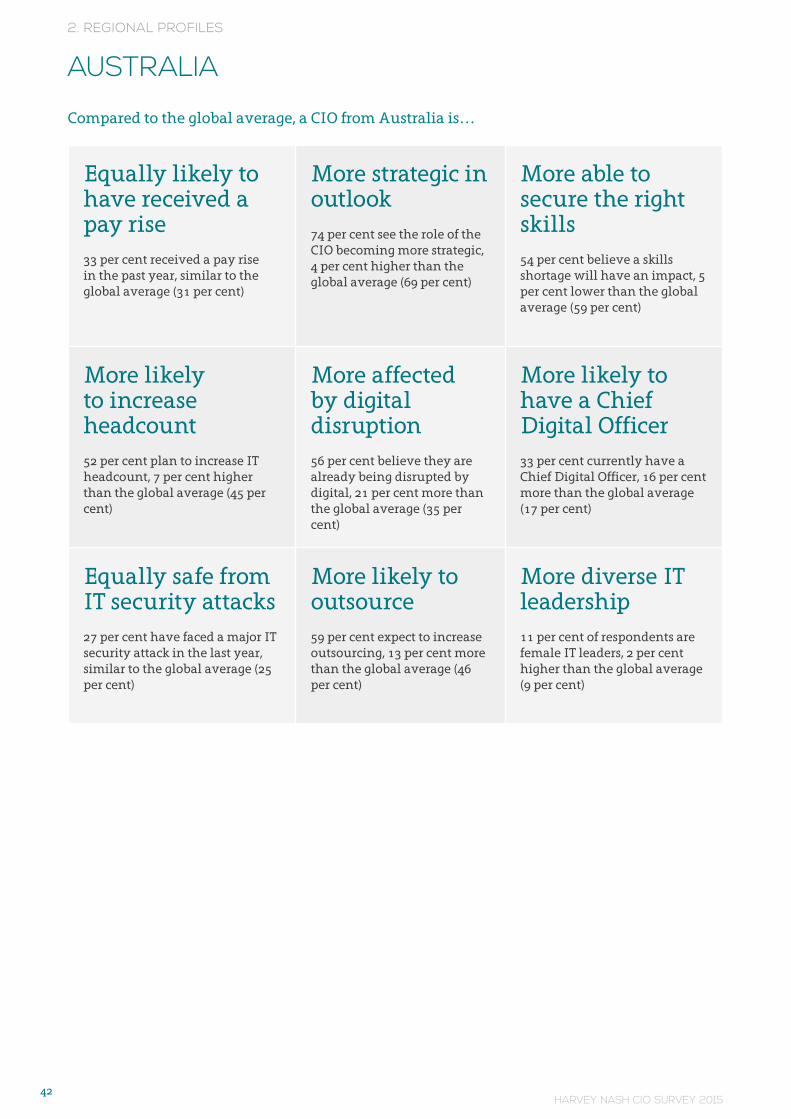
HARVEY NASH CIO SURVEY 201542
2. REGIONAL PROFILES
AUSTRALIA
Compared to the global average, a CIO from Australia is…
Equally likely to have received a pay rise33 per cent received a pay rise in the past year, similar to the global average (31 per cent)
More strategic in outlook74 per cent see the role of the CIO becoming more strategic, 4 per cent higher than the global average (69 per cent)
More able to secure the right skills
54 per cent believe a skills shortage will have an impact, 5 per cent lower than the global average (59 per cent)
More likely to increase headcount 52 per cent plan to increase IT headcount, 7 per cent higher than the global average (45 per cent)
More affected by digital disruption56 per cent believe they are already being disrupted by digital, 21 per cent more than the global average (35 per cent)
More likely to have a Chief Digital Officer33 per cent currently have a Chief Digital Officer, 16 per cent more than the global average (17 per cent)
Equally safe from IT security attacks27 per cent have faced a major IT security attack in the last year, similar to the global average (25 per cent)
More likely to outsource59 per cent expect to increase outsourcing, 13 per cent more than the global average (46 per cent)
More diverse IT leadership11 per cent of respondents are female IT leaders, 2 per cent higher than the global average (9 per cent)
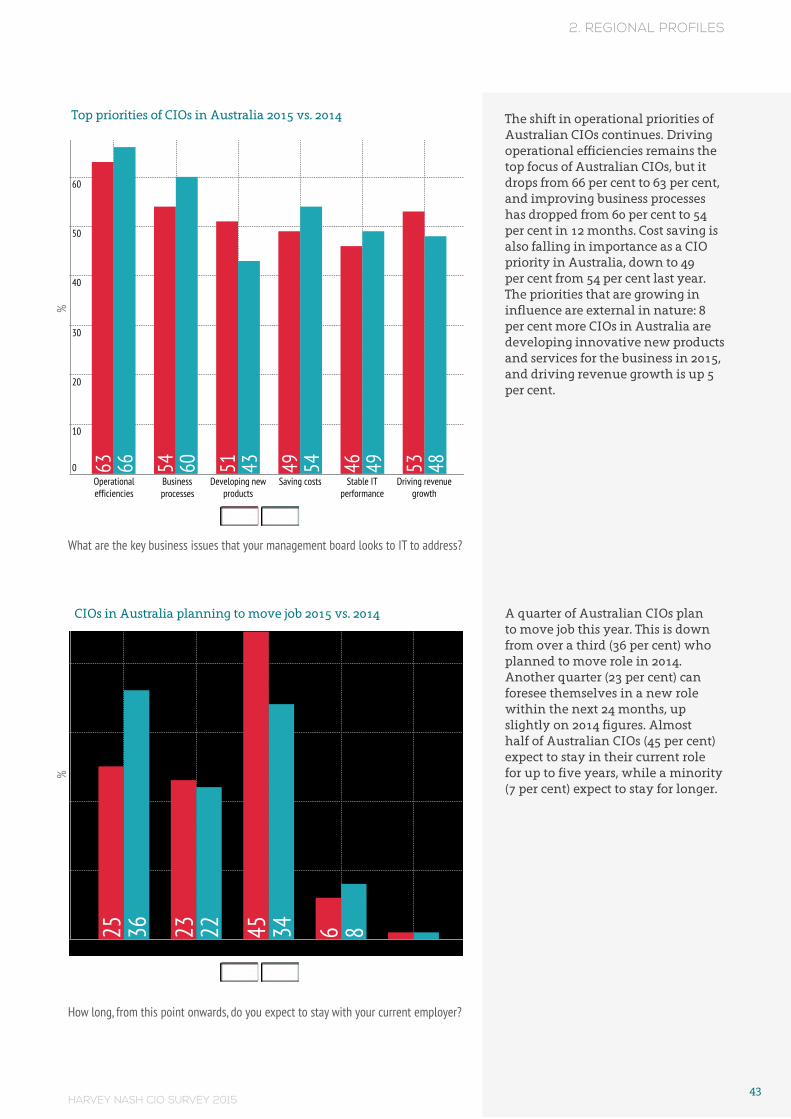
HARVEY NASH CIO SURVEY 201543
2. REGIONAL PROFILES
The shift in operational priorities of Australian CIOs continues. Driving operational efficiencies remains the top focus of Australian CIOs, but it drops from 66 per cent to 63 per cent, and improving business processes has dropped from 60 per cent to 54 per cent in 12 months. Cost saving is also falling in importance as a CIO priority in Australia, down to 49 per cent from 54 per cent last year. The priorities that are growing in influence are external in nature: 8 per cent more CIOs in Australia are developing innovative new products and services for the business in 2015, and driving revenue growth is up 5 per cent.
A quarter of Australian CIOs plan to move job this year. This is down from over a third (36 per cent) who planned to move role in 2014. Another quarter (23 per cent) can foresee themselves in a new role within the next 24 months, up slightly on 2014 figures. Almost half of Australian CIOs (45 per cent) expect to stay in their current role for up to five years, while a minority (7 per cent) expect to stay for longer.
Top priorities of CIOs in Australia 2015 vs. 2014
CIOs in Australia planning to move job 2015 vs. 2014
2015 2014
%
Operationalefficiencies
Business processes
Developing newproducts
Saving costs Stable ITperformance
Driving revenuegrowth
70
60
50
40
30
20
10
0 63 54 51 49 46 5366 60 43 54 49 48
2015 2014
%
Less than 1 year 1 - 2 years 2 - 5 years 5 - 10 years More than 10 years
40
30
20
10
0 25 23 45 636 22 34 8
What are the key business issues that your management board looks to IT to address?
How long, from this point onwards, do you expect to stay with your current employer?
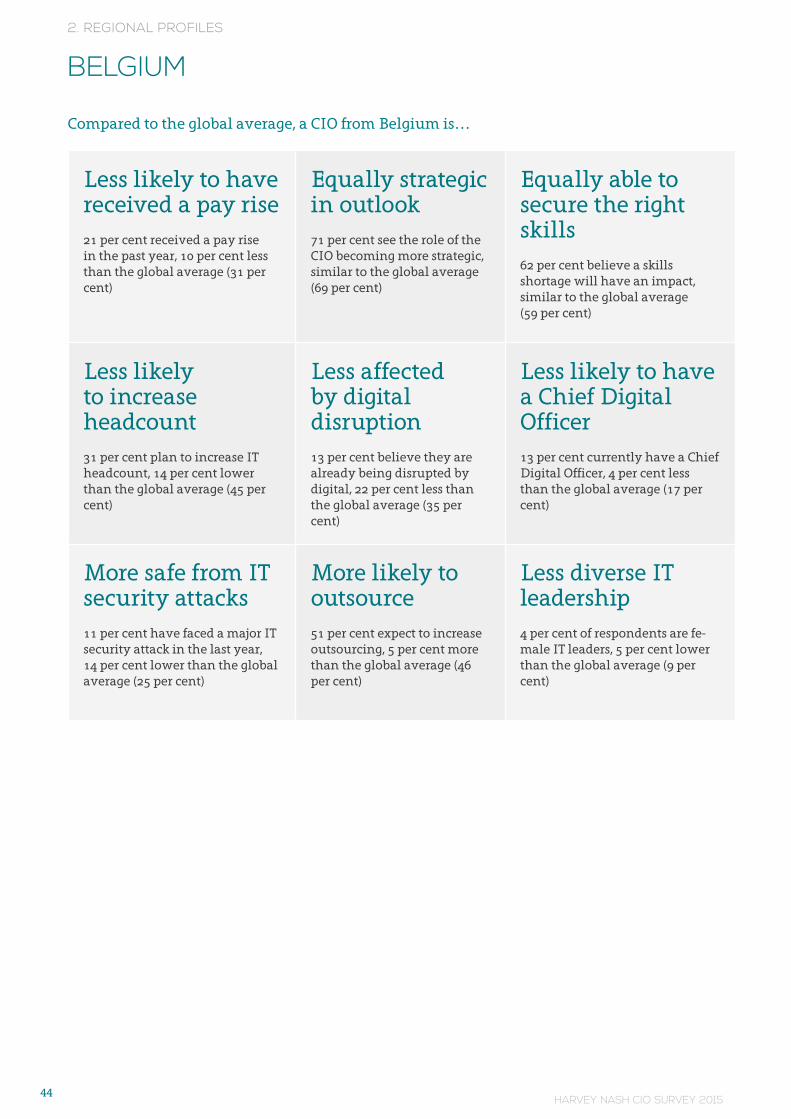
HARVEY NASH CIO SURVEY 201544
2. REGIONAL PROFILES
BELGIUM
Compared to the global average, a CIO from Belgium is…
Less likely to have received a pay rise21 per cent received a pay rise in the past year, 10 per cent less than the global average (31 per cent)
Equally strategic in outlook71 per cent see the role of the CIO becoming more strategic, similar to the global average (69 per cent)
Equally able to secure the right skills62 per cent believe a skills shortage will have an impact, similar to the global average (59 per cent)
Less likely to increase headcount 31 per cent plan to increase IT headcount, 14 per cent lower than the global average (45 per cent)
Less affected by digital disruption13 per cent believe they are already being disrupted by digital, 22 per cent less than the global average (35 per cent)
Less likely to have a Chief Digital Officer13 per cent currently have a Chief Digital Officer, 4 per cent less than the global average (17 per cent)
More safe from IT security attacks11 per cent have faced a major IT security attack in the last year, 14 per cent lower than the global average (25 per cent)
More likely to outsource51 per cent expect to increase outsourcing, 5 per cent more than the global average (46 per cent)
Less diverse IT leadership4 per cent of respondents are fe-male IT leaders, 5 per cent lower than the global average (9 per cent)
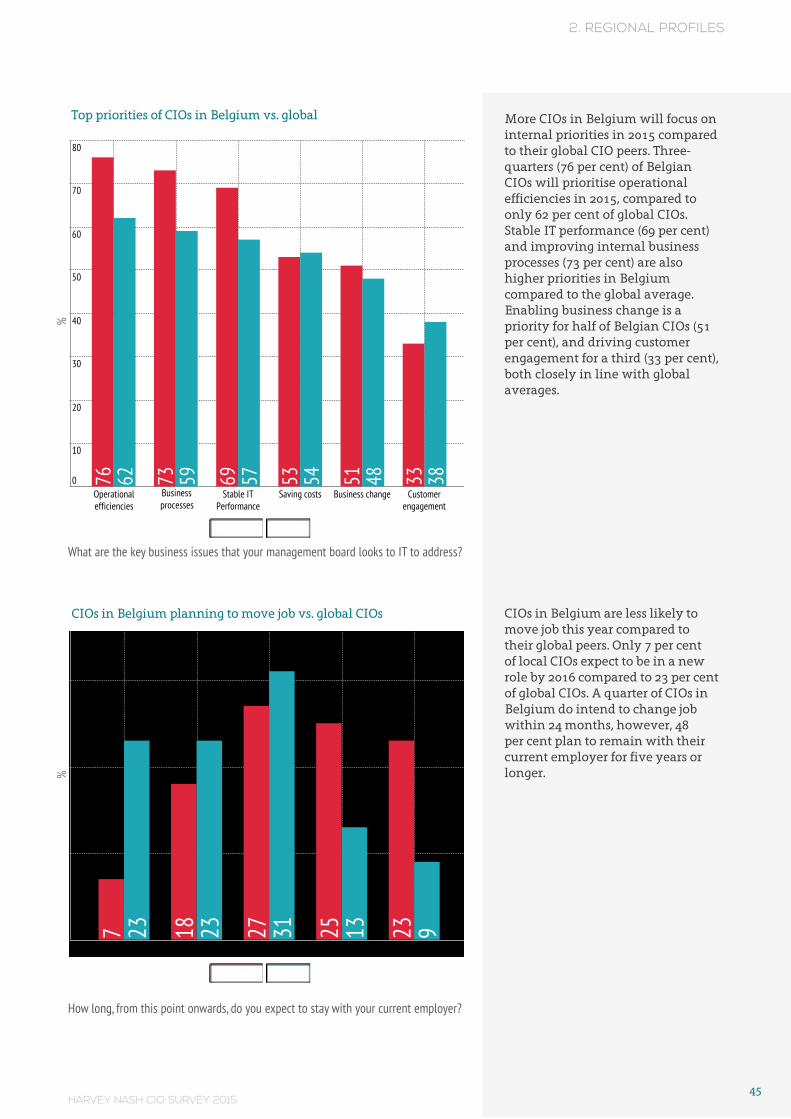
HARVEY NASH CIO SURVEY 201545
2. REGIONAL PROFILES
More CIOs in Belgium will focus on internal priorities in 2015 compared to their global CIO peers. Three-quarters (76 per cent) of Belgian CIOs will prioritise operational efficiencies in 2015, compared to only 62 per cent of global CIOs. Stable IT performance (69 per cent) and improving internal business processes (73 per cent) are also higher priorities in Belgium compared to the global average. Enabling business change is a priority for half of Belgian CIOs (51 per cent), and driving customer engagement for a third (33 per cent), both closely in line with global averages.
CIOs in Belgium are less likely to move job this year compared to their global peers. Only 7 per cent of local CIOs expect to be in a new role by 2016 compared to 23 per cent of global CIOs. A quarter of CIOs in Belgium do intend to change job within 24 months, however, 48 per cent plan to remain with their current employer for five years or longer.
Top priorities of CIOs in Belgium vs. global
CIOs in Belgium planning to move job vs. global CIOs
Belgium Global
%
Operationalefficiencies
Stable ITPerformance
Saving costs Business change Customerengagement
80
70
60
50
40
30
20
10
0 76 73 69 53 51 3362 59 57 54 48 38
Business processes
Belgium Global
%
Less than 1 year 1 - 2 years 2 - 5 years 5 - 10 years More than 10 years
30
20
10
0 7 18 27 25 2323 23 31 13 9
What are the key business issues that your management board looks to IT to address?
How long, from this point onwards, do you expect to stay with your current employer?
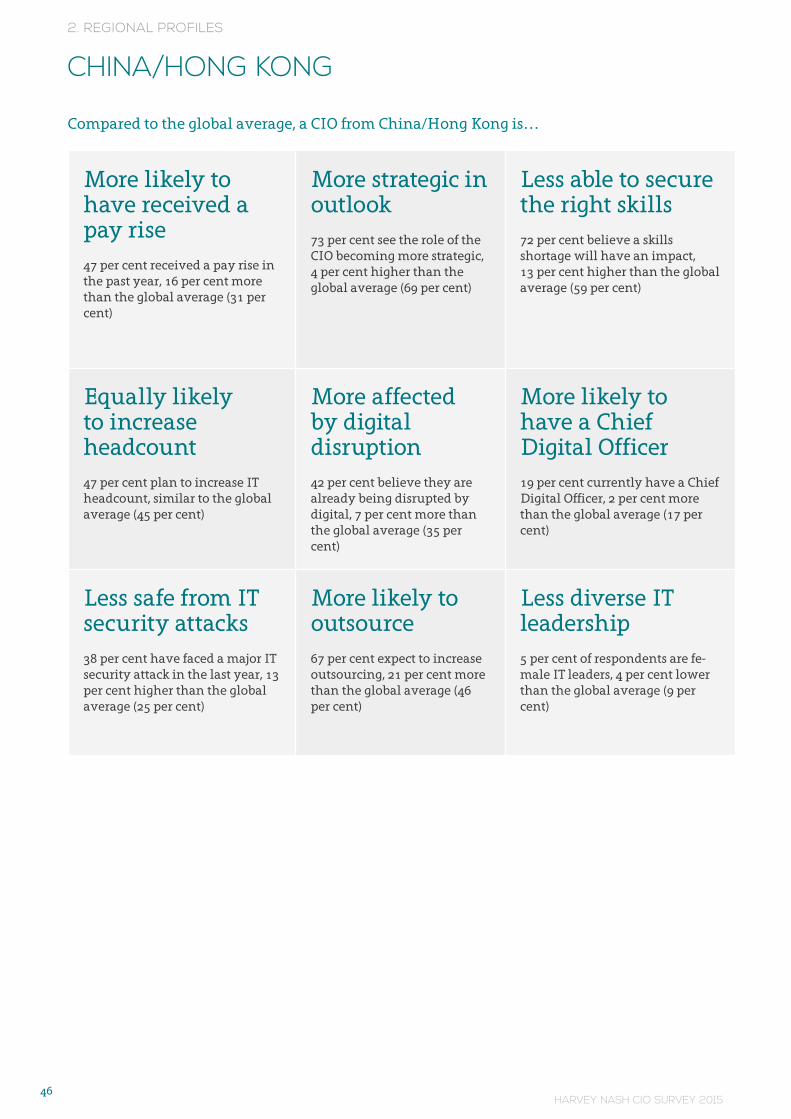
HARVEY NASH CIO SURVEY 201546
2. REGIONAL PROFILES
Compared to the global average, a CIO from China/Hong Kong is…
More likely to have received a pay rise47 per cent received a pay rise in the past year, 16 per cent more than the global average (31 per cent)
More strategic in outlook73 per cent see the role of the CIO becoming more strategic, 4 per cent higher than the global average (69 per cent)
Less able to secure the right skills72 per cent believe a skills shortage will have an impact, 13 per cent higher than the global average (59 per cent)
Equally likely to increase headcount 47 per cent plan to increase IT headcount, similar to the global average (45 per cent)
More affected by digital disruption42 per cent believe they are already being disrupted by digital, 7 per cent more than the global average (35 per cent)
More likely to have a Chief Digital Officer19 per cent currently have a Chief Digital Officer, 2 per cent more than the global average (17 per cent)
Less safe from IT security attacks38 per cent have faced a major IT security attack in the last year, 13 per cent higher than the global average (25 per cent)
More likely to outsource67 per cent expect to increase outsourcing, 21 per cent more than the global average (46 per cent)
Less diverse IT leadership5 per cent of respondents are fe-male IT leaders, 4 per cent lower than the global average (9 per cent)
CHINA/HONG KONG
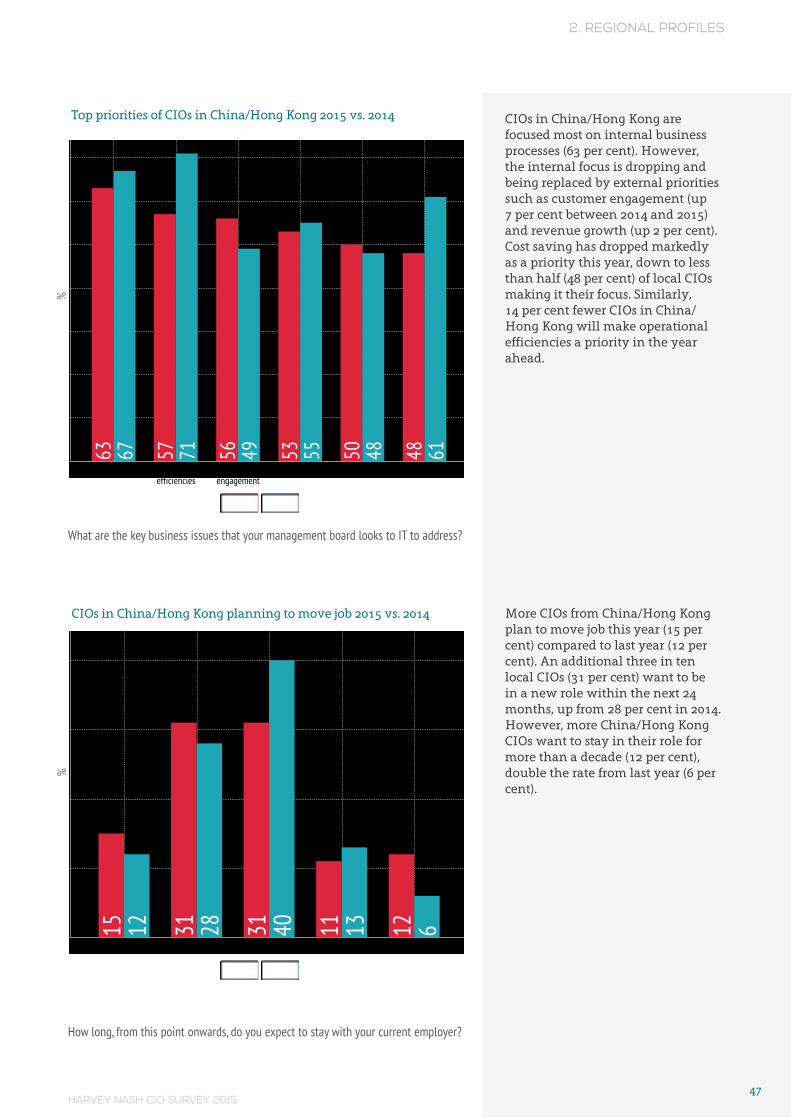
HARVEY NASH CIO SURVEY 201547
2. REGIONAL PROFILES
CIOs in China/Hong Kong are focused most on internal business processes (63 per cent). However, the internal focus is dropping and being replaced by external priorities such as customer engagement (up 7 per cent between 2014 and 2015) and revenue growth (up 2 per cent). Cost saving has dropped markedly as a priority this year, down to less than half (48 per cent) of local CIOs making it their focus. Similarly, 14 per cent fewer CIOs in China/Hong Kong will make operational efficiencies a priority in the year ahead.
More CIOs from China/Hong Kong plan to move job this year (15 per cent) compared to last year (12 per cent). An additional three in ten local CIOs (31 per cent) want to be in a new role within the next 24 months, up from 28 per cent in 2014. However, more China/Hong Kong CIOs want to stay in their role for more than a decade (12 per cent), double the rate from last year (6 per cent).
Top priorities of CIOs in China/Hong Kong 2015 vs. 2014
CIOs in China/Hong Kong planning to move job 2015 vs. 2014
2015 2014
%
Business processes Operationalefficiencies
Customerengagement
Business change Revenue growth Saving costs
70
60
50
40
30
20
10
0 63 57 56 53 50 4867 71 49 55 48 61
2015 2014
%
Less than 1 year 1 - 2 years 2 - 5 years 5 - 10 years More than 10 years
40
30
20
10
0 15 31 31 11 1212 28 40 13 6
What are the key business issues that your management board looks to IT to address?
How long, from this point onwards, do you expect to stay with your current employer?
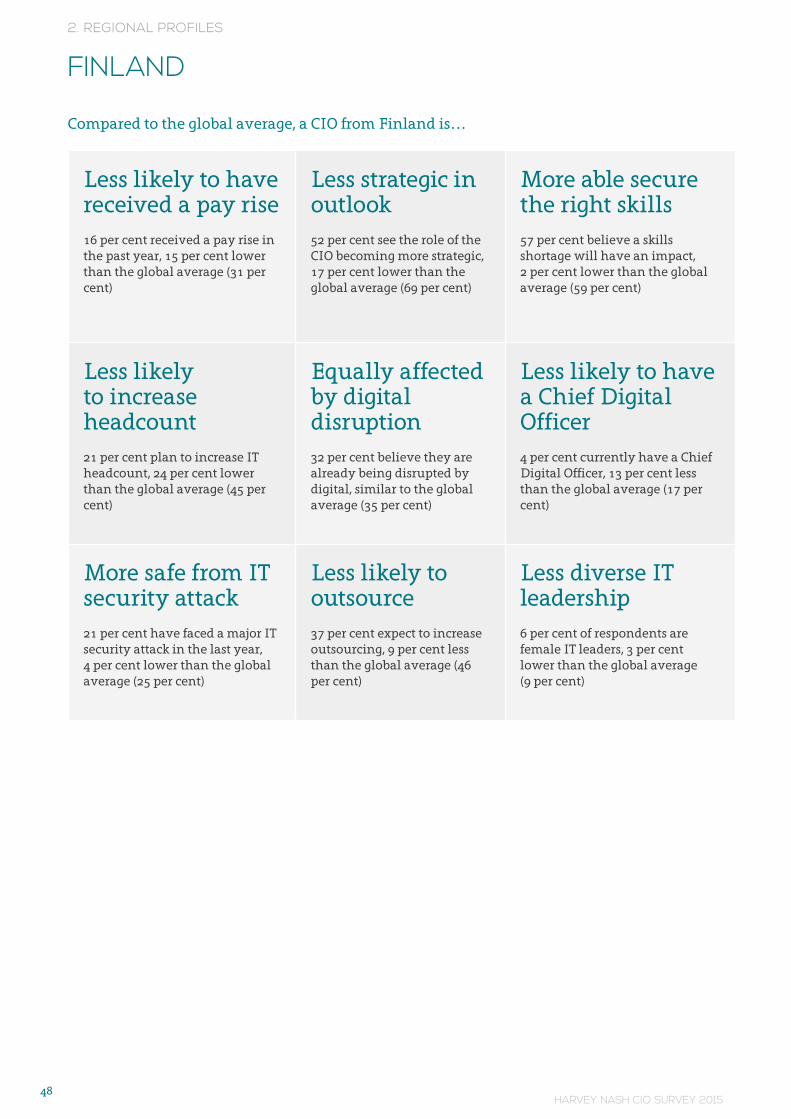
HARVEY NASH CIO SURVEY 201548
2. REGIONAL PROFILES
Compared to the global average, a CIO from Finland is…
Less likely to have received a pay rise16 per cent received a pay rise in the past year, 15 per cent lower than the global average (31 per cent)
Less strategic in outlook52 per cent see the role of the CIO becoming more strategic, 17 per cent lower than the global average (69 per cent)
More able secure the right skills57 per cent believe a skills shortage will have an impact, 2 per cent lower than the global average (59 per cent)
Less likely to increase headcount 21 per cent plan to increase IT headcount, 24 per cent lower than the global average (45 per cent)
Equally affected by digital disruption32 per cent believe they are already being disrupted by digital, similar to the global average (35 per cent)
Less likely to have a Chief Digital Officer4 per cent currently have a Chief Digital Officer, 13 per cent less than the global average (17 per cent)
More safe from IT security attack21 per cent have faced a major IT security attack in the last year, 4 per cent lower than the global average (25 per cent)
Less likely to outsource37 per cent expect to increase outsourcing, 9 per cent less than the global average (46 per cent)
Less diverse IT leadership6 per cent of respondents are female IT leaders, 3 per cent lower than the global average (9 per cent)
FINLAND
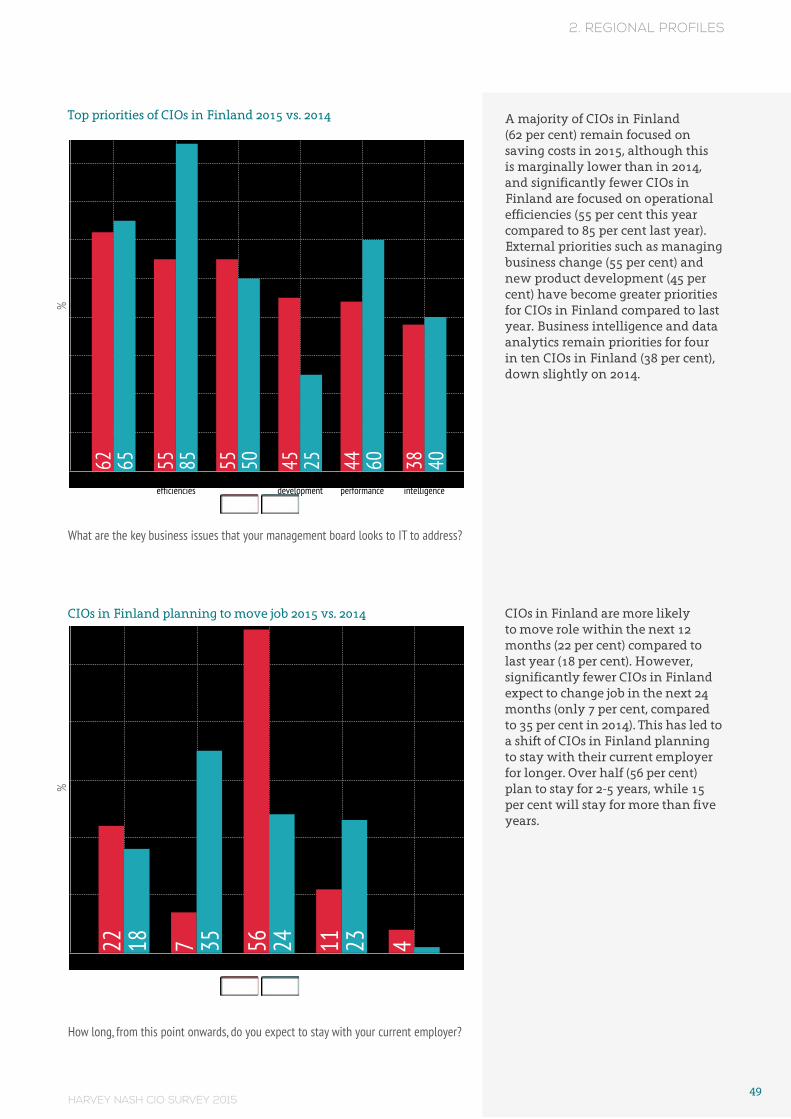
HARVEY NASH CIO SURVEY 201549
2. REGIONAL PROFILES
A majority of CIOs in Finland (62 per cent) remain focused on saving costs in 2015, although this is marginally lower than in 2014, and significantly fewer CIOs in Finland are focused on operational efficiencies (55 per cent this year compared to 85 per cent last year). External priorities such as managing business change (55 per cent) and new product development (45 per cent) have become greater priorities for CIOs in Finland compared to last year. Business intelligence and data analytics remain priorities for four in ten CIOs in Finland (38 per cent), down slightly on 2014.
CIOs in Finland are more likely to move role within the next 12 months (22 per cent) compared to last year (18 per cent). However, significantly fewer CIOs in Finland expect to change job in the next 24 months (only 7 per cent, compared to 35 per cent in 2014). This has led to a shift of CIOs in Finland planning to stay with their current employer for longer. Over half (56 per cent) plan to stay for 2-5 years, while 15 per cent will stay for more than five years.
Top priorities of CIOs in Finland 2015 vs. 2014
CIOs in Finland planning to move job 2015 vs. 2014
2015 2014
%
Saving costs Operationalefficiencies
Business change New productdevelopment
Stable ITperformance
Businessintelligence
80
70
60
50
40
30
20
10
0 62 55 55 45 44 3865 85 50 25 60 40
2015 2014
%
Less than 1 year 1 - 2 years 2 - 5 years 5 - 10 years More than 10 years
50
40
30
20
10
0 22 7 56 11 418 35 24 23
What are the key business issues that your management board looks to IT to address?
How long, from this point onwards, do you expect to stay with your current employer?
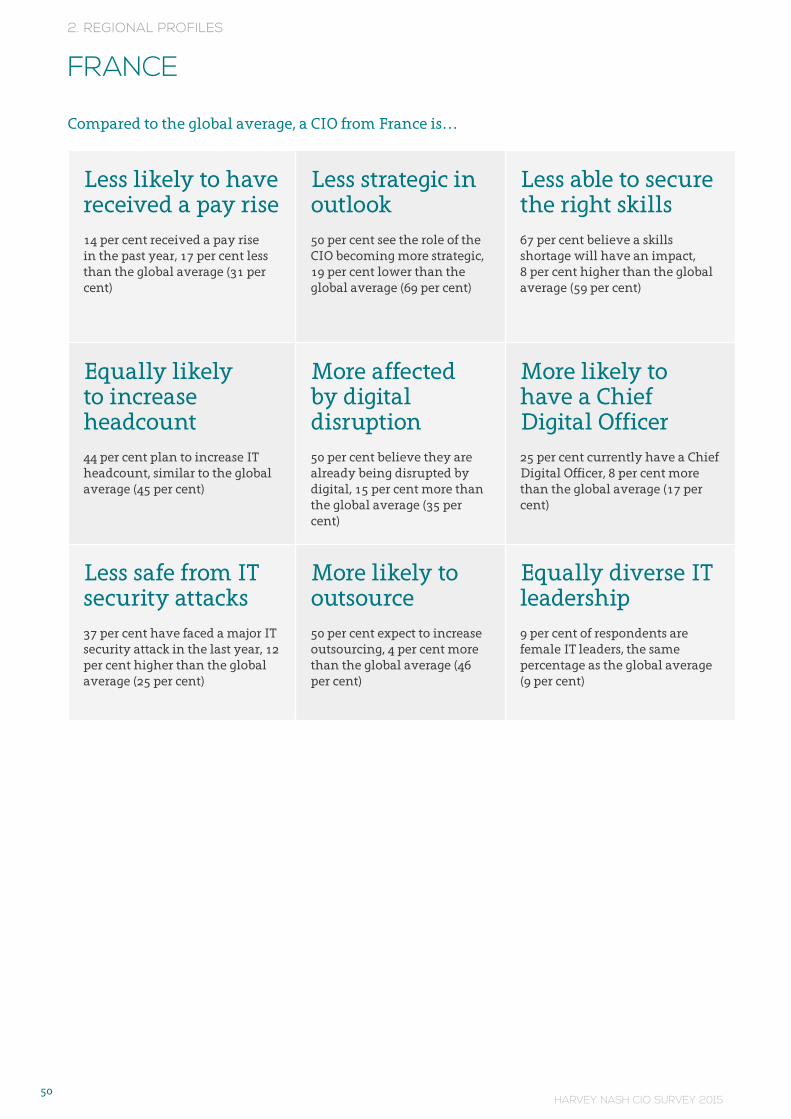
HARVEY NASH CIO SURVEY 201550
2. REGIONAL PROFILES
Compared to the global average, a CIO from France is…
Less likely to have received a pay rise14 per cent received a pay rise in the past year, 17 per cent less than the global average (31 per cent)
Less strategic in outlook50 per cent see the role of the CIO becoming more strategic, 19 per cent lower than the global average (69 per cent)
Less able to secure the right skills67 per cent believe a skills shortage will have an impact, 8 per cent higher than the global average (59 per cent)
Equally likely to increase headcount 44 per cent plan to increase IT headcount, similar to the global average (45 per cent)
More affected by digital disruption50 per cent believe they are already being disrupted by digital, 15 per cent more than the global average (35 per cent)
More likely to have a Chief Digital Officer25 per cent currently have a Chief Digital Officer, 8 per cent more than the global average (17 per cent)
Less safe from IT security attacks37 per cent have faced a major IT security attack in the last year, 12 per cent higher than the global average (25 per cent)
More likely to outsource50 per cent expect to increase outsourcing, 4 per cent more than the global average (46 per cent)
Equally diverse IT leadership9 per cent of respondents are female IT leaders, the same percentage as the global average (9 per cent)
FRANCE

HARVEY NASH CIO SURVEY 201551
2. REGIONAL PROFILES
Saving costs remains the top priority of CIOs in France. Seven in ten local CIOs (70 per cent) make this a top priority compared to 71 per cent last year. The biggest change between 2014 and 2015 is the focus of French CIOs on operational efficiencies (down to 53 per cent compared to 79 per cent last year). Focus appears to be shifting towards playing a greater role in new product development (up to 62 per cent from 58 per cent in 2014).
More CIOs in France plan to move job in 2015 compared to 2014. A quarter (25 per cent) expect to be in a new role within 12 months compared to only 14 per cent who planned a similar move last year. This shift in CIO career planning is as a result of the significantly fewer French CIOs who plan to stay with their current employer for 2-5 years. Many of these CIOs now plan to move job sooner, although 24 per cent do still plan to stay in their current role for five years or more.
Top priorities of CIOs in France 2015 vs. 2014
CIOs in France planning to move job 2015 vs. 2014
What are the key business issues that your management board looks to IT to address?
2015 2014
%
Saving costs New productdevelopment
Operationalefficiencies
Stable ITperformance
Driving revenuegrowth
Businessintelligence
80
70
60
50
40
30
20
10
0 70 62 53 50 41 2971 58 79 50 46 33
2015 2014
%
Less than 1 year 1 - 2 years 2 - 5 years 5 - 10 years More than 10 years
30
20
10
0 25 37 14 14 1014 36 32 9 9
How long, from this point onwards, do you expect to stay with your current employer?
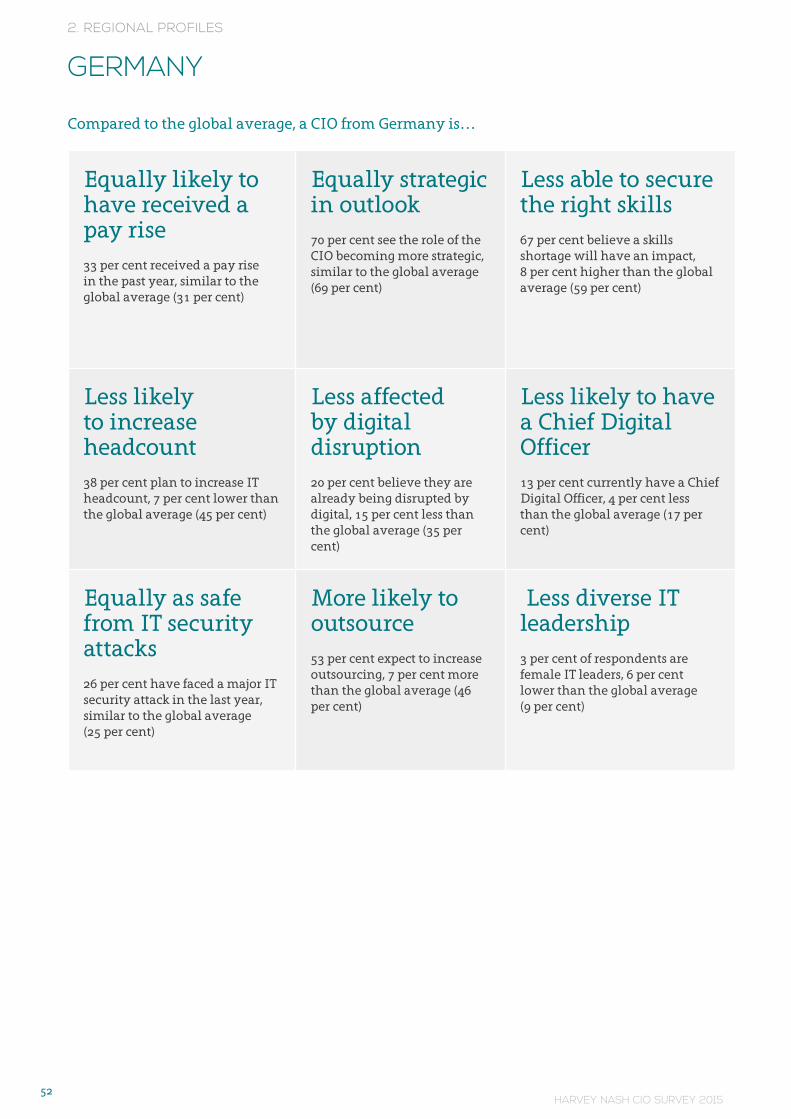
HARVEY NASH CIO SURVEY 201552
2. REGIONAL PROFILES
Compared to the global average, a CIO from Germany is…
Equally likely to have received a pay rise33 per cent received a pay rise in the past year, similar to the global average (31 per cent)
Equally strategic in outlook70 per cent see the role of the CIO becoming more strategic, similar to the global average (69 per cent)
Less able to secure the right skills 67 per cent believe a skills shortage will have an impact, 8 per cent higher than the global average (59 per cent)
Less likely to increase headcount
38 per cent plan to increase IT headcount, 7 per cent lower than the global average (45 per cent)
Less affected by digital disruption20 per cent believe they are already being disrupted by digital, 15 per cent less than the global average (35 per cent)
Less likely to have a Chief Digital Officer13 per cent currently have a Chief Digital Officer, 4 per cent less than the global average (17 per cent)
Equally as safe from IT security attacks26 per cent have faced a major IT security attack in the last year, similar to the global average (25 per cent)
More likely to outsource53 per cent expect to increase outsourcing, 7 per cent more than the global average (46 per cent)
Less diverse IT leadership3 per cent of respondents are female IT leaders, 6 per cent lower than the global average (9 per cent)
GERMANY

HARVEY NASH CIO SURVEY 201553
2. REGIONAL PROFILES
CIOs in Germany remain intently focused on the operational priorities that were dominating their attention in 2014 and 2013. Enhancing business processes remains the #1 priority for 58 per cent of German CIOs (compared to 59 per cent last year). Similarly, saving costs (56 per cent), delivering stable IT performance (53 per cent) and driving operational efficiencies (49 per cent) are all broadly in line with 2014. The priorities growing most rapidly, however, are more external. Improving time to market for new products/services and enabling business change are both up 11 per cent in the last 12 months.
The proportion of German CIOs planning to move role within the next 12 months (22 per cent) is unchanged from 2014. Another one in five German CIOs (20 per cent) expect to be in a new job within 24 months, marginally lower than in 2014, while a bigger proportion (28 per cent) do not plan to leave for another 2-5 years. German CIOs planning for a longer-term stay with their current employer are almost unchanged from 2014; 29 per cent intend to stay until 2020 or beyond, compared to 30 per cent who had similar ambitions last year.
Top priorities of CIOs in Germany 2015 vs. 2014
CIOs in Germany planning to move job 2015 vs. 2014
What are the key business issues that your management board looks to IT to address?
2015 2014
%
Business processes Saving costs Stable ITperformance
Operationalefficiencies
Improving time to market
Enabling businesschange
60
50
40
30
20
10
0 58 56 53 49 39 3959 54 54 50 28 28
2015 2014
%
Less than 1 year 1 - 2 years 2 - 5 years 5 - 10 years More than 10 years
25
20
15
10
5
0 22 20 28 13 1622 22 27 14 16
How long, from this point onwards, do you expect to stay with your current employer?

HARVEY NASH CIO SURVEY 201554
2. REGIONAL PROFILES
Compared to the global average, a CIO from Ireland is…
Equally likely to have received a pay rise29 per cent received a pay rise in the past year, similar to the global average (31 per cent)
Equally strategic in outlook68 per cent see the role of the CIO becoming more strategic, similar to the global average (69 per cent)
Equally able to secure the right skills58 per cent believe a skills shortage will have an impact, similar to the global average (59 per cent)
More likely to increase headcount
64 per cent plan to increase IT headcount, 19 per cent higher than the global average (45 per cent)
More affected by digital disruption45 per cent believe they are already being disrupted by digital, 10 per cent more than the global average (35 per cent)
More likely to have a Chief Digital Officer20 per cent currently have a Chief Digital Officer, 3 per cent more than the global average (17 per cent)
More safe from IT security attack17 per cent have faced a major IT security attack in the last year, 8 per cent lower than the global average (25 per cent)
Equally likely to outsource46 per cent expect to increase outsourcing, the same percentage as the global average (46 per cent)
More diverse IT leadership11 per cent of respondents are fe-male IT leaders, 2 per cent higher than the global average (9 per cent)
IRELAND
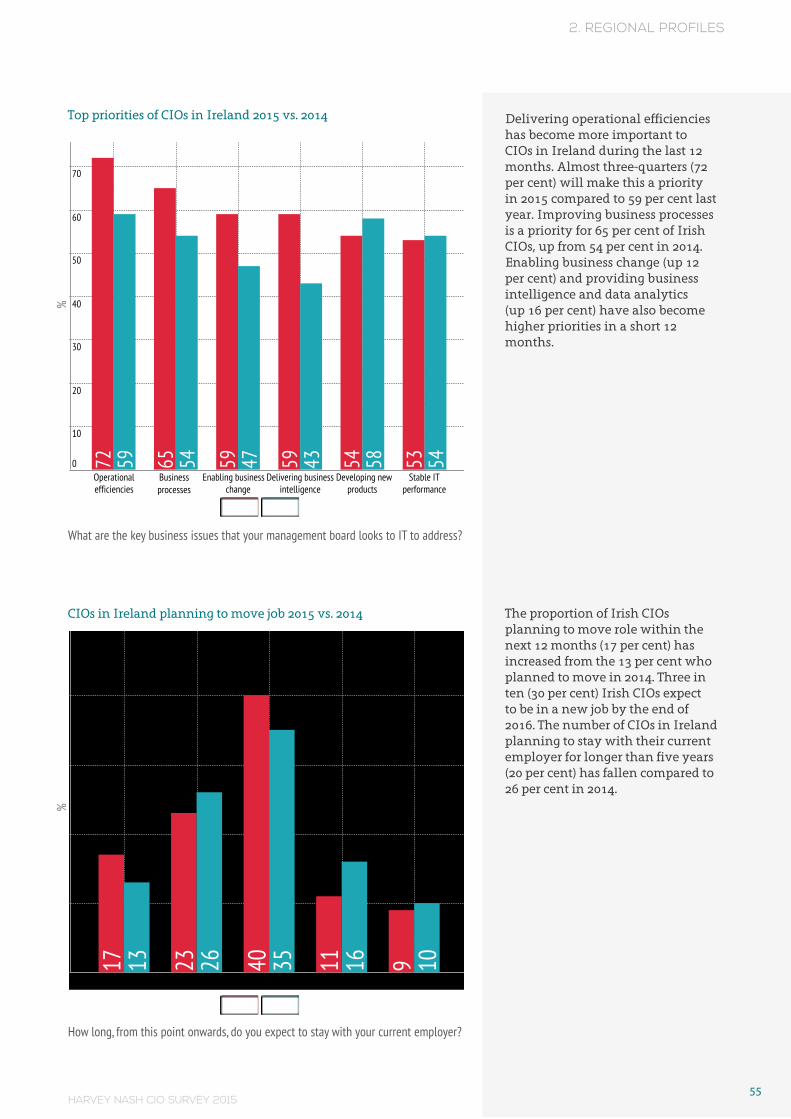
HARVEY NASH CIO SURVEY 201555
2. REGIONAL PROFILES
Delivering operational efficiencies has become more important to CIOs in Ireland during the last 12 months. Almost three-quarters (72 per cent) will make this a priority in 2015 compared to 59 per cent last year. Improving business processes is a priority for 65 per cent of Irish CIOs, up from 54 per cent in 2014. Enabling business change (up 12 per cent) and providing business intelligence and data analytics (up 16 per cent) have also become higher priorities in a short 12 months.
The proportion of Irish CIOs planning to move role within the next 12 months (17 per cent) has increased from the 13 per cent who planned to move in 2014. Three in ten (30 per cent) Irish CIOs expect to be in a new job by the end of 2016. The number of CIOs in Ireland planning to stay with their current employer for longer than five years (20 per cent) has fallen compared to 26 per cent in 2014.
Top priorities of CIOs in Ireland 2015 vs. 2014
CIOs in Ireland planning to move job 2015 vs. 2014
What are the key business issues that your management board looks to IT to address?
2015 2014
%
Operationalefficiencies
Business processes
Enabling businesschange
Delivering businessintelligence
Developing newproducts
Stable ITperformance
70
60
50
40
30
20
10
0 72 65 59 59 54 5359 54 47 43 58 54
How long, from this point onwards, do you expect to stay with your current employer?
2015 2014
%
Less than 1 year 1 - 2 years 2 - 5 years 5 - 10 years More than 10 years
50
40
30
20
10
0 17 23 40 11 913 26 35 16 10
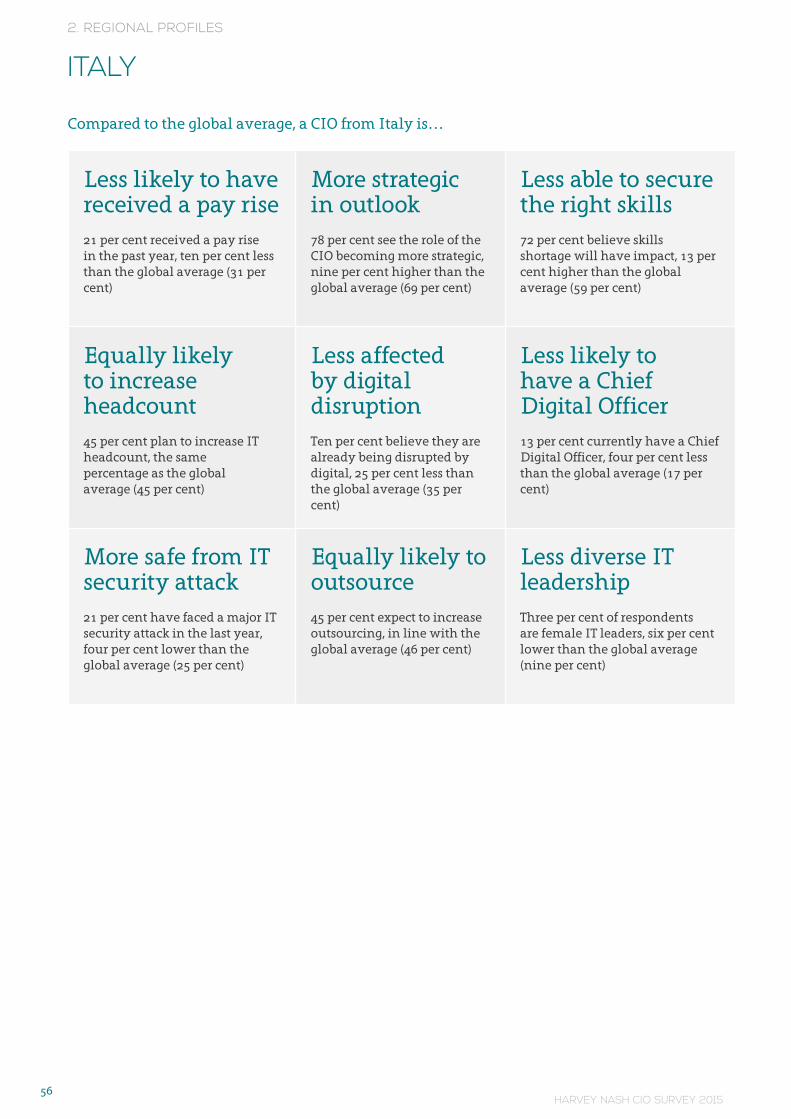
HARVEY NASH CIO SURVEY 201556
2. REGIONAL PROFILES
Compared to the global average, a CIO from Italy is…
Less likely to have received a pay rise21 per cent received a pay rise in the past year, ten per cent less than the global average (31 per cent)
More strategic in outlook78 per cent see the role of the CIO becoming more strategic, nine per cent higher than the global average (69 per cent)
Less able to secure the right skills72 per cent believe skills shortage will have impact, 13 per cent higher than the global average (59 per cent)
Equally likely to increase headcount
45 per cent plan to increase IT headcount, the same percentage as the global average (45 per cent)
Less affected by digital disruptionTen per cent believe they are already being disrupted by digital, 25 per cent less than the global average (35 per cent)
Less likely to have a Chief Digital Officer13 per cent currently have a Chief Digital Officer, four per cent less than the global average (17 per cent)
More safe from IT security attack21 per cent have faced a major IT security attack in the last year, four per cent lower than the global average (25 per cent)
Equally likely to outsource45 per cent expect to increase outsourcing, in line with the global average (46 per cent)
Less diverse IT leadershipThree per cent of respondents are female IT leaders, six per cent lower than the global average (nine per cent)
ITALY

HARVEY NASH CIO SURVEY 201557
2. REGIONAL PROFILES
More CIOs in Italy are focused on saving costs in 2015 compared to their global CIO peers. Two-thirds (66 per cent) of CIOs in Italy will prioritise operational efficiencies in 2015, compared to only 62 per cent of global CIOs. However, ensuring stable IT performance is a priority for only four in ten CIOs in Italy (41 per cent) compared to 57 per cent of global CIOs. CIOs in Italy are also more focused on developing new products and services (53 per cent) compared to only 42 per cent of global CIOs.
CIOs in Italy are less likely to move job this year compared to their global peers. Only eight per cent of local CIOs expect to be in a new role by 2016 compared to 23 per cent of global CIOs. One in five (20 per cent) of CIOs in Italy do intend to change job within 24 months, however, 28 per cent plan to remain with their current employer for five years or longer.
Top priorities of CIOs in Italy vs. global
CIOs in Italy planning to move job vs. global CIOs
What are the key business issues that your management Board are looking for IT to address?
Italy Global
%
Saving costs Operationalefficiencies
Business processes Newproducts/services
Enabling businesschange
Stable ITperformance
70
60
50
40
30
20
10
0 66 66 63 53 47 4154 62 59 42 48 57
Italy Global
%
Less than 1 year 1 - 2 years 2 - 5 years 5 - 10 years More than 10 years
50
40
30
20
10
0 8 20 44 16 1223 23 31 13 9
How long, from this point onwards, do you expect to stay with your current employer?

HARVEY NASH CIO SURVEY 201558
2. REGIONAL PROFILES
Compared to the global average, a CIO from the Netherlands is…
Less likely to have received a pay rise24 per cent received a pay rise in the past year, 7 per cent less than the global average (31 per cent)
More strategic in outlook77 per cent see the role of the CIO becoming more strategic, 8 per cent higher than the global average (69 per cent)
Equally able to secure the right skills
60 per cent believe a skills shortage will have an impact, similar to the global average (59 per cent)
Less likely to increase headcount
36 per cent plan to increase IT headcount, 9 per cent lower than the global average (45 per cent)
Less affected by digital disruption24 per cent believe they are already being disrupted by digital, 11 per cent less than the global average (35 per cent)
More likely to have a Chief Digital Officer19 per cent currently have a Chief Digital Officer, 2 per cent more than the global average (17 per cent)
Equally safe from IT security attack24 per cent have faced a major IT security attack in the last year, similar to the global average (25 per cent)
More likely to outsource51 per cent expect to increase outsourcing, 5 per cent more than the global average (46 per cent)
Less diverse IT leadership7 per cent of respondents are female IT leaders, 2 per cent lower than the global average (9 per cent)
THE NETHERLANDS
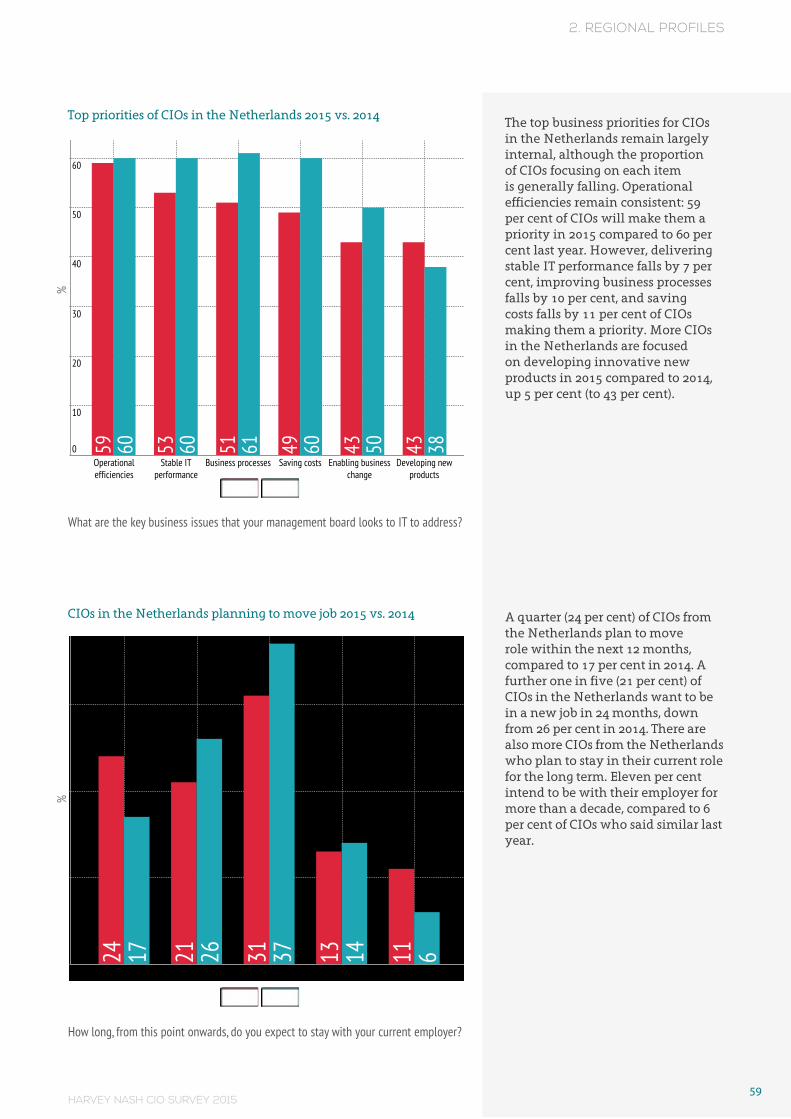
HARVEY NASH CIO SURVEY 201559
2. REGIONAL PROFILES
The top business priorities for CIOs in the Netherlands remain largely internal, although the proportion of CIOs focusing on each item is generally falling. Operational efficiencies remain consistent: 59 per cent of CIOs will make them a priority in 2015 compared to 60 per cent last year. However, delivering stable IT performance falls by 7 per cent, improving business processes falls by 10 per cent, and saving costs falls by 11 per cent of CIOs making them a priority. More CIOs in the Netherlands are focused on developing innovative new products in 2015 compared to 2014, up 5 per cent (to 43 per cent).
A quarter (24 per cent) of CIOs from the Netherlands plan to move role within the next 12 months, compared to 17 per cent in 2014. A further one in five (21 per cent) of CIOs in the Netherlands want to be in a new job in 24 months, down from 26 per cent in 2014. There are also more CIOs from the Netherlands who plan to stay in their current role for the long term. Eleven per cent intend to be with their employer for more than a decade, compared to 6 per cent of CIOs who said similar last year.
Top priorities of CIOs in the Netherlands 2015 vs. 2014
CIOs in the Netherlands planning to move job 2015 vs. 2014
What are the key business issues that your management board looks to IT to address?
How long, from this point onwards, do you expect to stay with your current employer?
2015 2014
%
Operationalefficiencies
Stable ITperformance
Business processes Saving costs Enabling businesschange
Developing newproducts
60
50
40
30
20
10
0 59 53 51 49 43 4360 60 61 60 50 38
2015 2014
%
Less than 1 year 1 - 2 years 2 - 5 years 5 - 10 years More than 10 years
30
20
10
0 24 21 31 13 1117 26 37 14 6

HARVEY NASH CIO SURVEY 201560
2. REGIONAL PROFILES
Compared to the global average, a CIO from the Nordics is…
Less likely to have received a pay rise20 per cent received a pay rise in the past year, 11 per cent less than the global average (31 per cent)
Less strategic in outlook63 per cent see the role of the CIO becoming more strategic, 6 per cent lower than the global average (69 per cent)
More able to secure the right skills56 per cent believe a skills shortage will have an impact, 3 per cent lower than the global average (59 per cent)
Less likely to increase headcount 32 per cent plan to increase IT headcount, 13 per cent lower than the global average (45 per cent)
Less affected by digital disruption29 per cent believe they are already being disrupted by digital, 6 per cent less than the global average (35 per cent)
Less likely to have a Chief Digital Officer12 per cent currently have a Chief Digital Officer, 5 per cent less than the global average (17 per cent)
More safe from IT security attacks20 per cent have faced a major IT security attack in the last year, 5 per cent lower than the global average (25 per cent)
More likely to outsource50 per cent expect to increase outsourcing, 4 per cent more than the global average (46 per cent)
Less diverse IT leadership7 per cent of respondents are female IT leaders, 2 per cent lower than the global average (9 per cent)
NOTE: The Nordics region for the 2015 Harvey Nash CIO Survey includes insight from CIOs in Denmark, Finland, Norway and Sweden.
NORDICS
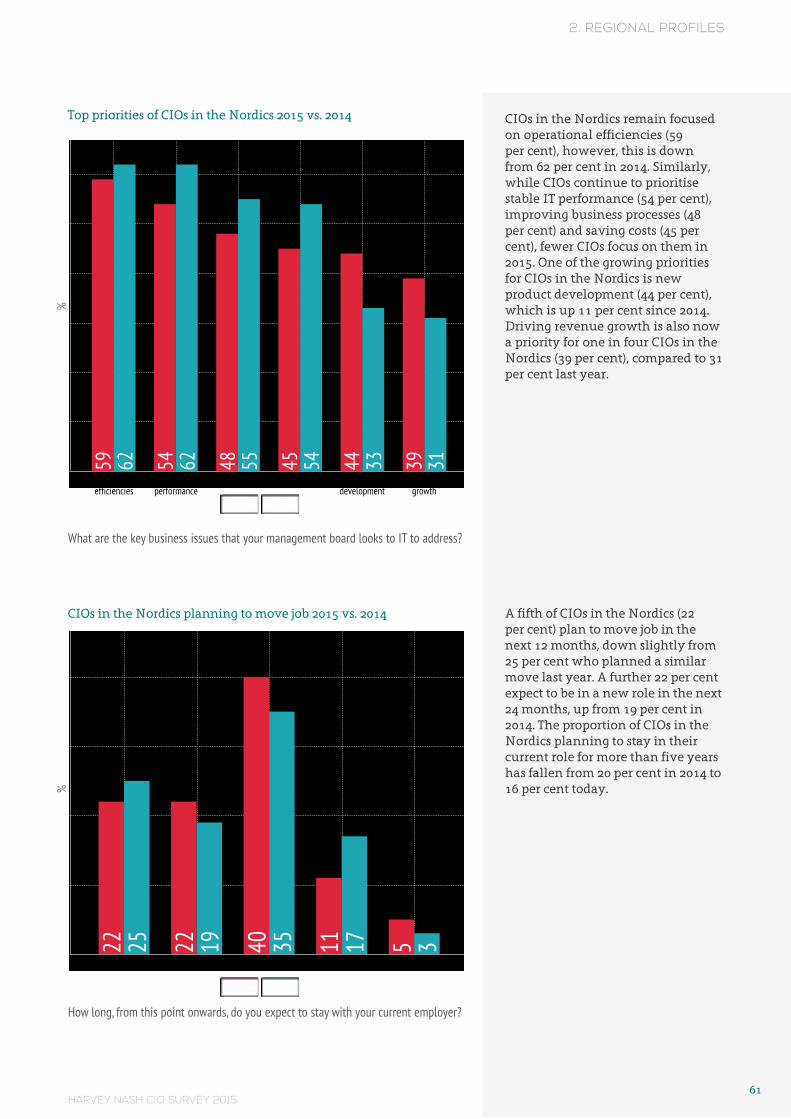
HARVEY NASH CIO SURVEY 201561
2. REGIONAL PROFILES
CIOs in the Nordics remain focused on operational efficiencies (59 per cent), however, this is down from 62 per cent in 2014. Similarly, while CIOs continue to prioritise stable IT performance (54 per cent), improving business processes (48 per cent) and saving costs (45 per cent), fewer CIOs focus on them in 2015. One of the growing priorities for CIOs in the Nordics is new product development (44 per cent), which is up 11 per cent since 2014. Driving revenue growth is also now a priority for one in four CIOs in the Nordics (39 per cent), compared to 31 per cent last year.
A fifth of CIOs in the Nordics (22 per cent) plan to move job in the next 12 months, down slightly from 25 per cent who planned a similar move last year. A further 22 per cent expect to be in a new role in the next 24 months, up from 19 per cent in 2014. The proportion of CIOs in the Nordics planning to stay in their current role for more than five years has fallen from 20 per cent in 2014 to 16 per cent today.
Top priorities of CIOs in the Nordics 2015 vs. 2014
CIOs in the Nordics planning to move job 2015 vs. 2014
What are the key business issues that your management board looks to IT to address?
How long, from this point onwards, do you expect to stay with your current employer?
2015 2014
%
Operationalefficiencies
Stable ITperformance
Business processes Saving costs New productdevelopment
Driving revenuegrowth
60
50
40
30
20
10
0 59 54 48 45 44 3962 62 55 54 33 31
2015 2014
%
Less than 1 year 1 - 2 years 2 - 5 years 5 - 10 years More than 10 years
40
30
20
10
0 22 22 40 11 525 19 35 17 3

HARVEY NASH CIO SURVEY 201562
2. REGIONAL PROFILES
NORWAY
Compared to the global average, a CIO from Norway is…
Less likely to have received a pay rise25 per cent received a pay rise in the past year, 6 per cent less than the global average (31 per cent)
More strategic in outlook74 per cent see the role of the CIO becoming more strategic, 5 per cent higher than the global average (69 per cent)
Less able to secure the right skills63 per cent believe a skills shortage will have an impact, 4 per cent higher than the global average (59 per cent)
More likely to increase headcount 53 per cent plan to increase IT headcount, 8 per cent higher than the global average (45 per cent)
Equally affected by digital disruption37 per cent believe they are already being disrupted by digital, similar to the global average (35 per cent)
More likely to have a Chief Digital Officer26 per cent currently have a Chief Digital Officer, 9 per cent more than the global average (17 per cent)
More safe from IT security attack21 per cent have faced a major IT security attack in the last year, 4 per cent lower than the global average (25 per cent)
More likely to outsource65 per cent expect to increase outsourcing, 19 per cent more than the global average (46 per cent)
Less diverse IT leadershipNo respondents are female IT leaders, 9 per cent lower than the global average (9 per cent)
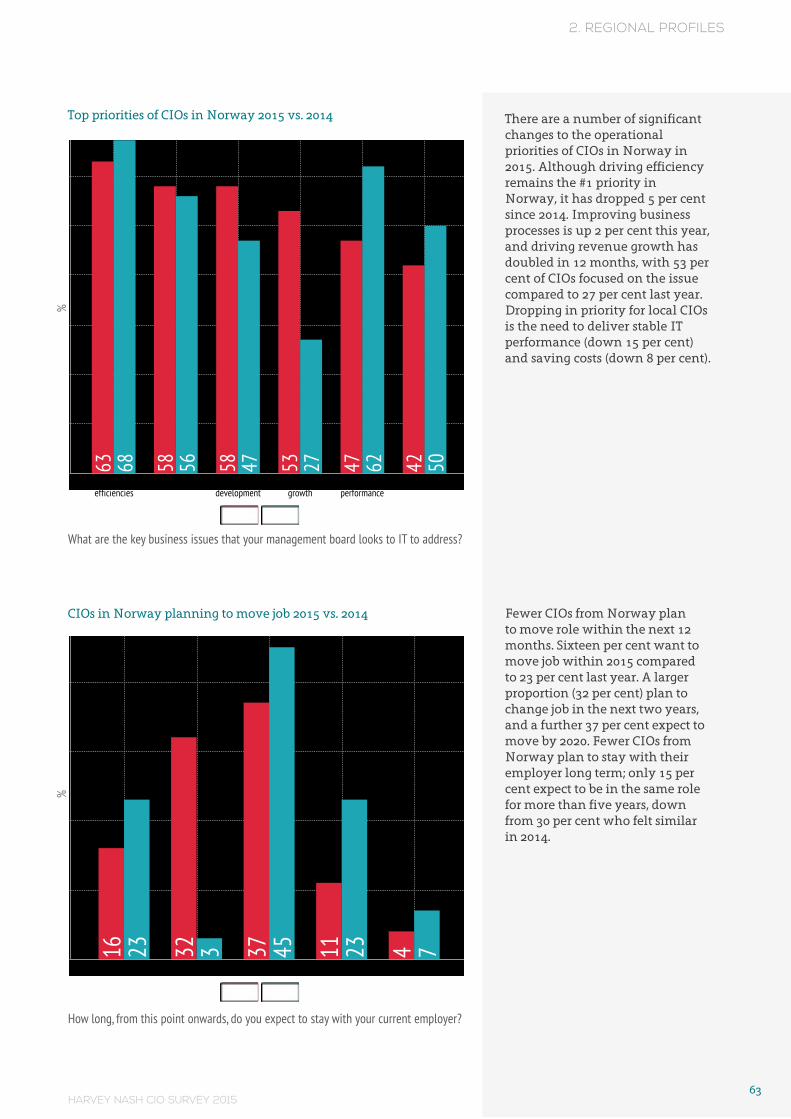
HARVEY NASH CIO SURVEY 201563
2. REGIONAL PROFILES
There are a number of significant changes to the operational priorities of CIOs in Norway in 2015. Although driving efficiency remains the #1 priority in Norway, it has dropped 5 per cent since 2014. Improving business processes is up 2 per cent this year, and driving revenue growth has doubled in 12 months, with 53 per cent of CIOs focused on the issue compared to 27 per cent last year. Dropping in priority for local CIOs is the need to deliver stable IT performance (down 15 per cent) and saving costs (down 8 per cent).
Fewer CIOs from Norway plan to move role within the next 12 months. Sixteen per cent want to move job within 2015 compared to 23 per cent last year. A larger proportion (32 per cent) plan to change job in the next two years, and a further 37 per cent expect to move by 2020. Fewer CIOs from Norway plan to stay with their employer long term; only 15 per cent expect to be in the same role for more than five years, down from 30 per cent who felt similar in 2014.
Top priorities of CIOs in Norway 2015 vs. 2014
CIOs in Norway planning to move job 2015 vs. 2014
What are the key business issues that your management board looks to IT to address?
How long, from this point onwards, do you expect to stay with your current employer?
2015 2014
%
Operationalefficiencies
Business processes New productdevelopment
Driving revenuegrowth
Stable ITperformance
Saving costs
70
60
50
40
30
20
10
0 63 58 58 53 47 4268 56 47 27 62 50
2015 2014
%
Less than 1 year 1 - 2 years 2 - 5 years 5 - 10 years More than 10 years
40
30
20
10
0 16 32 37 11 423 3 45 23 7
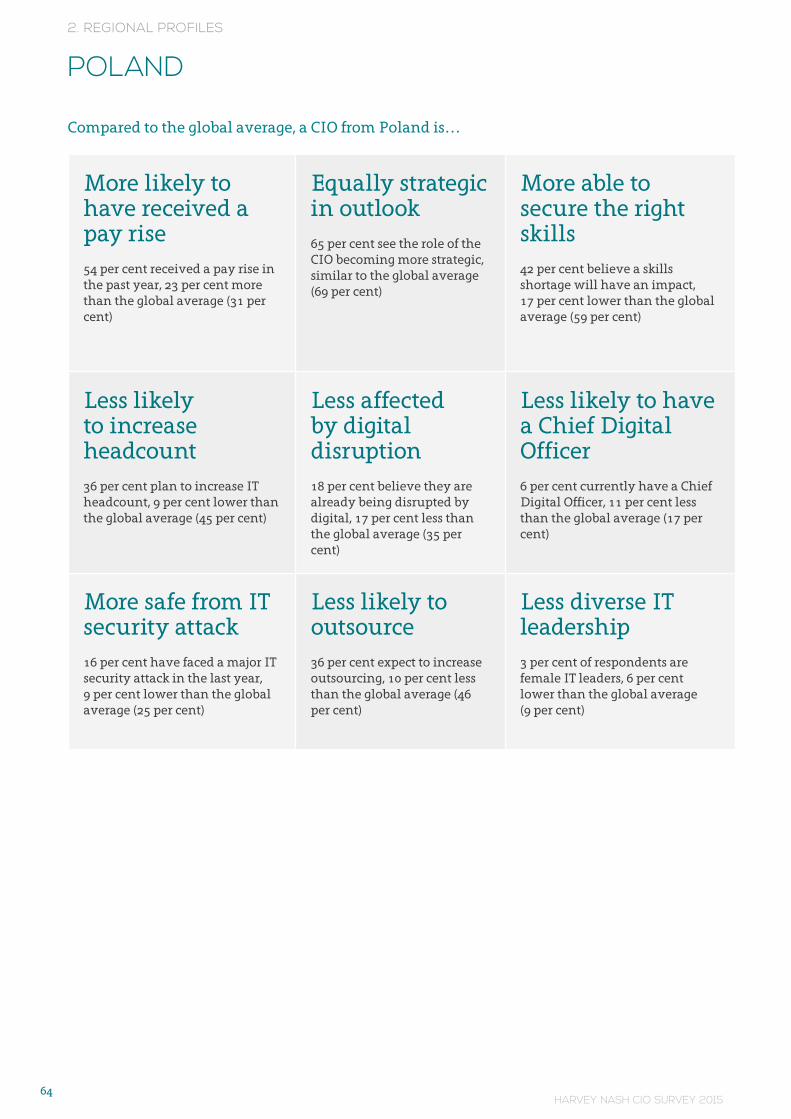
HARVEY NASH CIO SURVEY 201564
2. REGIONAL PROFILES
POLAND
Compared to the global average, a CIO from Poland is…
More likely to have received a pay rise54 per cent received a pay rise in the past year, 23 per cent more than the global average (31 per cent)
Equally strategic in outlook65 per cent see the role of the CIO becoming more strategic, similar to the global average (69 per cent)
More able to secure the right skills
42 per cent believe a skills shortage will have an impact, 17 per cent lower than the global average (59 per cent)
Less likely to increase headcount 36 per cent plan to increase IT headcount, 9 per cent lower than the global average (45 per cent)
Less affected by digital disruption18 per cent believe they are already being disrupted by digital, 17 per cent less than the global average (35 per cent)
Less likely to have a Chief Digital Officer6 per cent currently have a Chief Digital Officer, 11 per cent less than the global average (17 per cent)
More safe from IT security attack16 per cent have faced a major IT security attack in the last year, 9 per cent lower than the global average (25 per cent)
Less likely to outsource36 per cent expect to increase outsourcing, 10 per cent less than the global average (46 per cent)
Less diverse IT leadership3 per cent of respondents are female IT leaders, 6 per cent lower than the global average (9 per cent)
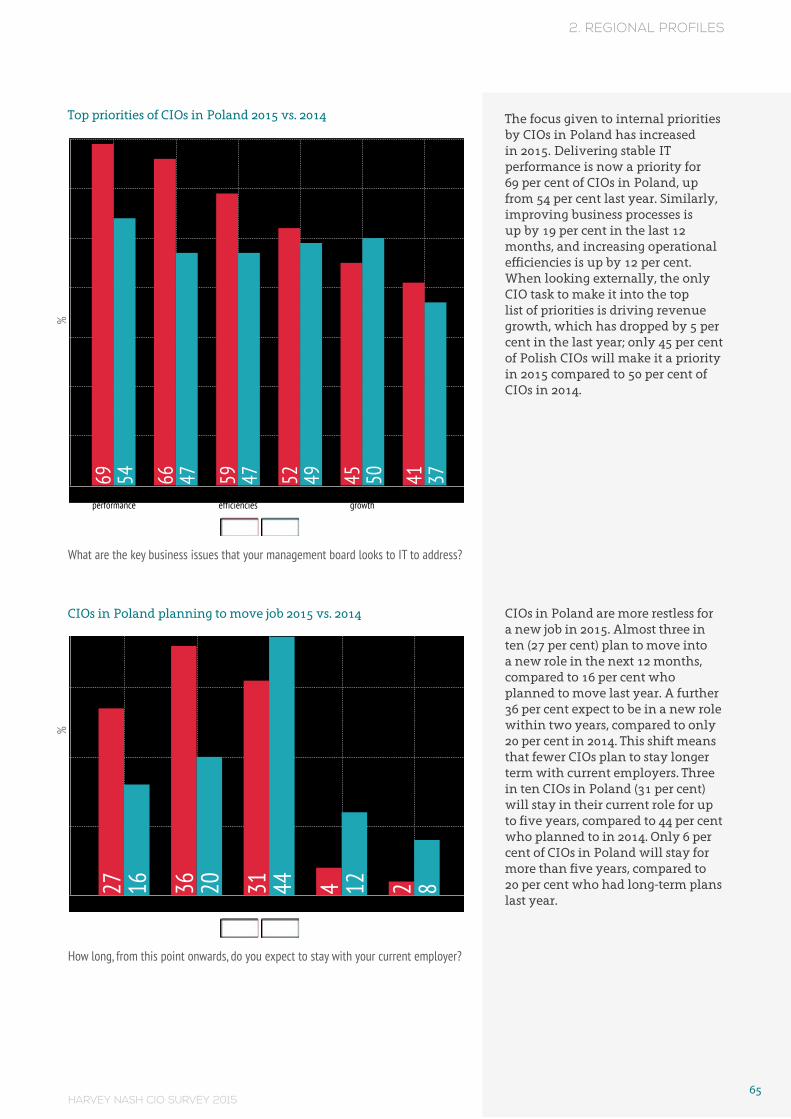
HARVEY NASH CIO SURVEY 201565
2. REGIONAL PROFILES
The focus given to internal priorities by CIOs in Poland has increased in 2015. Delivering stable IT performance is now a priority for 69 per cent of CIOs in Poland, up from 54 per cent last year. Similarly, improving business processes is up by 19 per cent in the last 12 months, and increasing operational efficiencies is up by 12 per cent. When looking externally, the only CIO task to make it into the top list of priorities is driving revenue growth, which has dropped by 5 per cent in the last year; only 45 per cent of Polish CIOs will make it a priority in 2015 compared to 50 per cent of CIOs in 2014.
CIOs in Poland are more restless for a new job in 2015. Almost three in ten (27 per cent) plan to move into a new role in the next 12 months, compared to 16 per cent who planned to move last year. A further 36 per cent expect to be in a new role within two years, compared to only 20 per cent in 2014. This shift means that fewer CIOs plan to stay longer term with current employers. Three in ten CIOs in Poland (31 per cent) will stay in their current role for up to five years, compared to 44 per cent who planned to in 2014. Only 6 per cent of CIOs in Poland will stay for more than five years, compared to 20 per cent who had long-term plans last year.
Top priorities of CIOs in Poland 2015 vs. 2014
CIOs in Poland planning to move job 2015 vs. 2014
What are the key business issues that your management board looks to IT to address?
How long, from this point onwards, do you expect to stay with your current employer?
2015 2014
%
Stable ITperformance
Business processes Operationalefficiencies
Saving costs Driving revenuegrowth
Business change
70
60
50
40
30
20
10
0 69 66 59 52 45 4154 47 47 49 50 37
2015 2014
%
Less than 1 year 1 - 2 years 2 - 5 years 5 - 10 years More than 10 years
30
20
10
0 27 36 31 4 216 20 44 12 8
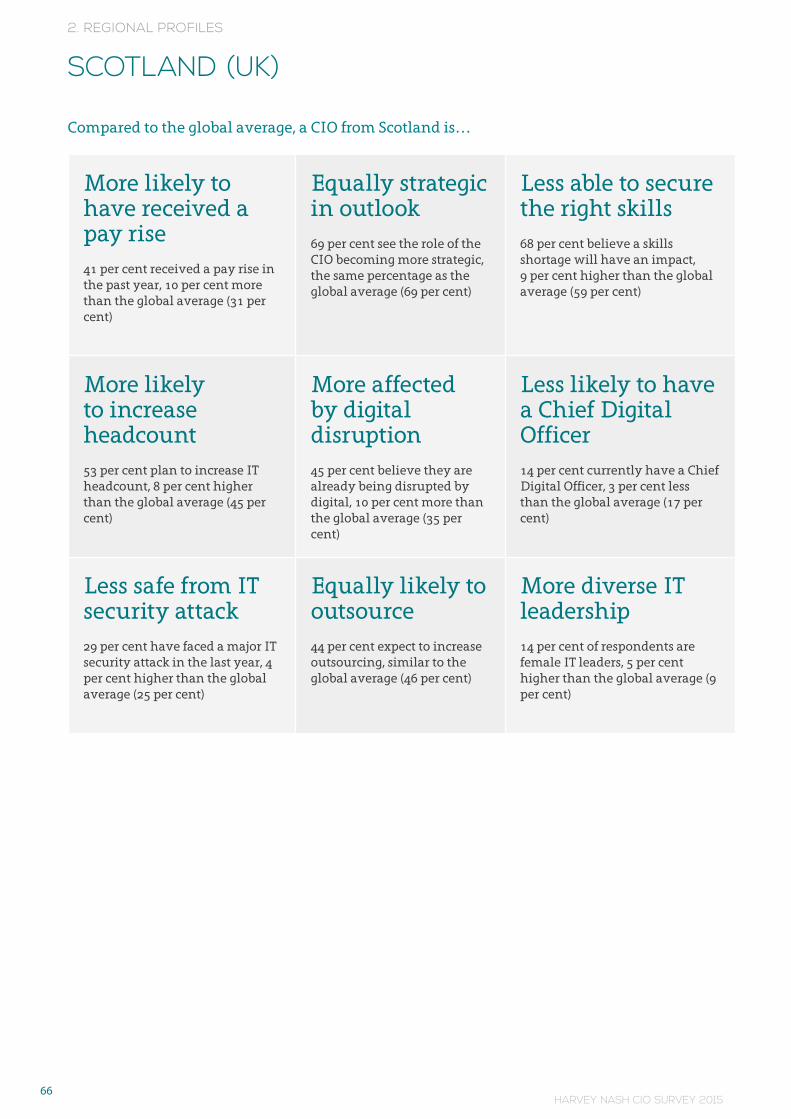
HARVEY NASH CIO SURVEY 201566
2. REGIONAL PROFILES
SCOTLAND (UK)
Compared to the global average, a CIO from Scotland is…
More likely to have received a pay rise41 per cent received a pay rise in the past year, 10 per cent more than the global average (31 per cent)
Equally strategic in outlook69 per cent see the role of the CIO becoming more strategic, the same percentage as the global average (69 per cent)
Less able to secure the right skills68 per cent believe a skills shortage will have an impact, 9 per cent higher than the global average (59 per cent)
More likely to increase headcount 53 per cent plan to increase IT headcount, 8 per cent higher than the global average (45 per cent)
More affected by digital disruption45 per cent believe they are already being disrupted by digital, 10 per cent more than the global average (35 per cent)
Less likely to have a Chief Digital Officer14 per cent currently have a Chief Digital Officer, 3 per cent less than the global average (17 per cent)
Less safe from IT security attack29 per cent have faced a major IT security attack in the last year, 4 per cent higher than the global average (25 per cent)
Equally likely to outsource44 per cent expect to increase outsourcing, similar to the global average (46 per cent)
More diverse IT leadership14 per cent of respondents are female IT leaders, 5 per cent higher than the global average (9 per cent)
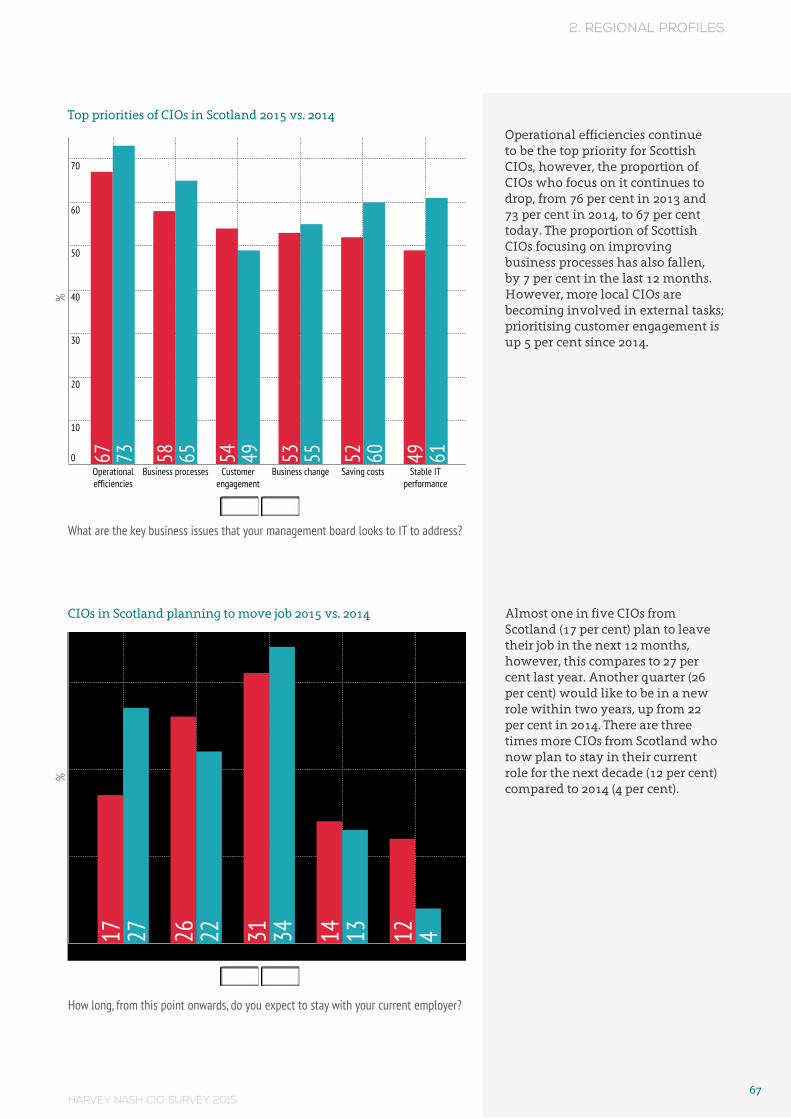
HARVEY NASH CIO SURVEY 201567
2. REGIONAL PROFILES
Operational efficiencies continue to be the top priority for Scottish CIOs, however, the proportion of CIOs who focus on it continues to drop, from 76 per cent in 2013 and 73 per cent in 2014, to 67 per cent today. The proportion of Scottish CIOs focusing on improving business processes has also fallen, by 7 per cent in the last 12 months. However, more local CIOs are becoming involved in external tasks; prioritising customer engagement is up 5 per cent since 2014.
Almost one in five CIOs from Scotland (17 per cent) plan to leave their job in the next 12 months, however, this compares to 27 per cent last year. Another quarter (26 per cent) would like to be in a new role within two years, up from 22 per cent in 2014. There are three times more CIOs from Scotland who now plan to stay in their current role for the next decade (12 per cent) compared to 2014 (4 per cent).
Top priorities of CIOs in Scotland 2015 vs. 2014
CIOs in Scotland planning to move job 2015 vs. 2014
What are the key business issues that your management board looks to IT to address?
How long, from this point onwards, do you expect to stay with your current employer?
2015 2014
%
Operationalefficiencies
Business processes Customerengagement
Business change Saving costs Stable ITperformance
70
60
50
40
30
20
10
0 67 58 54 53 52 4973 65 49 55 60 61
2015 2014
%
Less than 1 year 1 - 2 years 2 - 5 years 5 - 10 years More than 10 years
30
20
10
0 17 26 31 14 1227 22 34 13 4
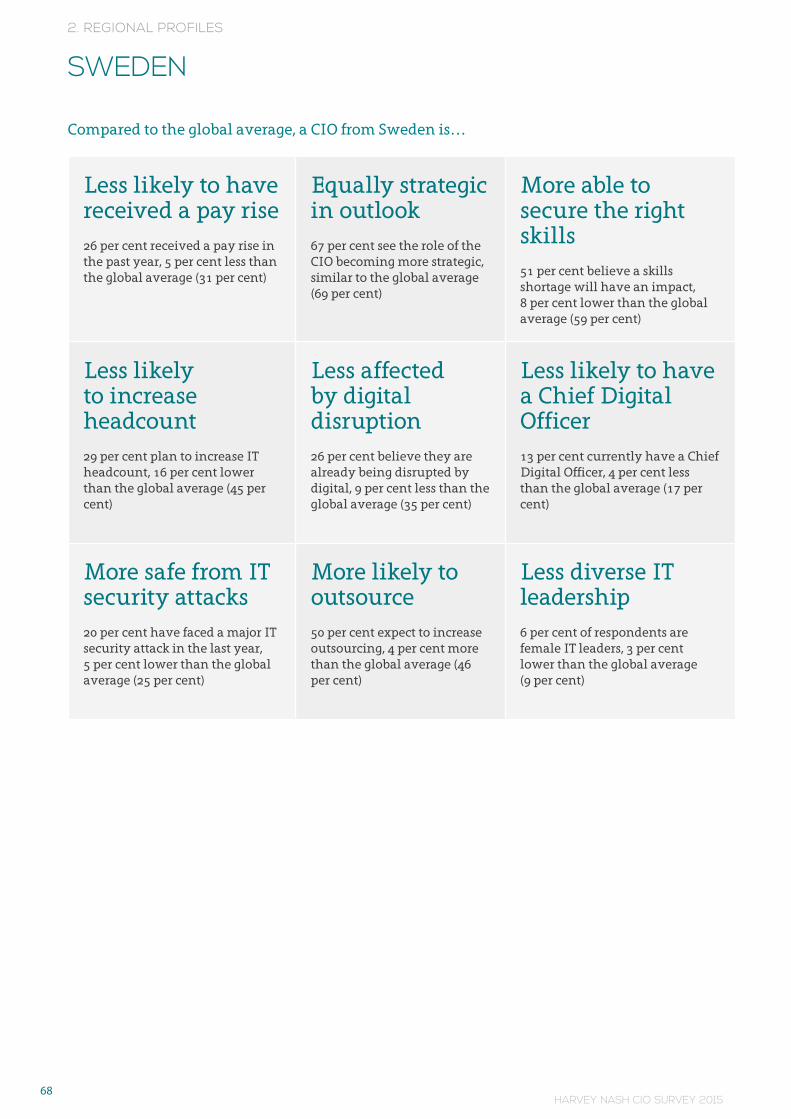
HARVEY NASH CIO SURVEY 201568
2. REGIONAL PROFILES
SWEDEN
Compared to the global average, a CIO from Sweden is…
Less likely to have received a pay rise26 per cent received a pay rise in the past year, 5 per cent less than the global average (31 per cent)
Equally strategic in outlook67 per cent see the role of the CIO becoming more strategic, similar to the global average (69 per cent)
More able to secure the right skills 51 per cent believe a skills shortage will have an impact, 8 per cent lower than the global average (59 per cent)
Less likely to increase headcount
29 per cent plan to increase IT headcount, 16 per cent lower than the global average (45 per cent)
Less affected by digital disruption26 per cent believe they are already being disrupted by digital, 9 per cent less than the global average (35 per cent)
Less likely to have a Chief Digital Officer13 per cent currently have a Chief Digital Officer, 4 per cent less than the global average (17 per cent)
More safe from IT security attacks20 per cent have faced a major IT security attack in the last year, 5 per cent lower than the global average (25 per cent)
More likely to outsource50 per cent expect to increase outsourcing, 4 per cent more than the global average (46 per cent)
Less diverse IT leadership6 per cent of respondents are female IT leaders, 3 per cent lower than the global average (9 per cent)

HARVEY NASH CIO SURVEY 201569
2. REGIONAL PROFILES
Delivering stable IT performance remains the top priority for more than two-thirds (67 per cent) of Swedish CIOs, up from 63 per cent who were focused on this issue in 2014. Also growing in focus is the need to increase operational efficiencies, up 12 per cent in the past 12 months, and new product development which is up 8 per cent. However, the need to save costs is falling; only 38 per cent of CIOs in Sweden will make it a priority in 2015, compared to 54 per cent who did so in 2014.
A quarter of CIOs in Sweden (26 per cent) plan to be in a new role within 12 months, down from 29 per cent in 2014. However, another quarter (26 per cent) will move job in 2016. The proportion of CIOs in Sweden who plan to stay in the job for more than a decade has risen, from only 2 per cent in 2014 to 5 per cent today.
Top priorities of CIO in Sweden 2015 vs. 2014
CIOs in Sweden planning to move job 2015 vs. 2014
What are the key business issues that your management board looks to IT to address?
How long, from this point onwards, do you expect to stay with your current employer?
2015 2014
%
Stable ITperformance
Operationalefficiencies
Business processes
Enabling businesschange
Saving costs New productdevelopment
60
50
40
30
20
10
0 67 62 53 40 38 3763 50 54 39 54 29
2015 2014
%
Less than 1 year 1 - 2 years 2 - 5 years 5 - 10 years More than 10 years
30
20
10
0 26 26 33 10 529 27 31 12 2
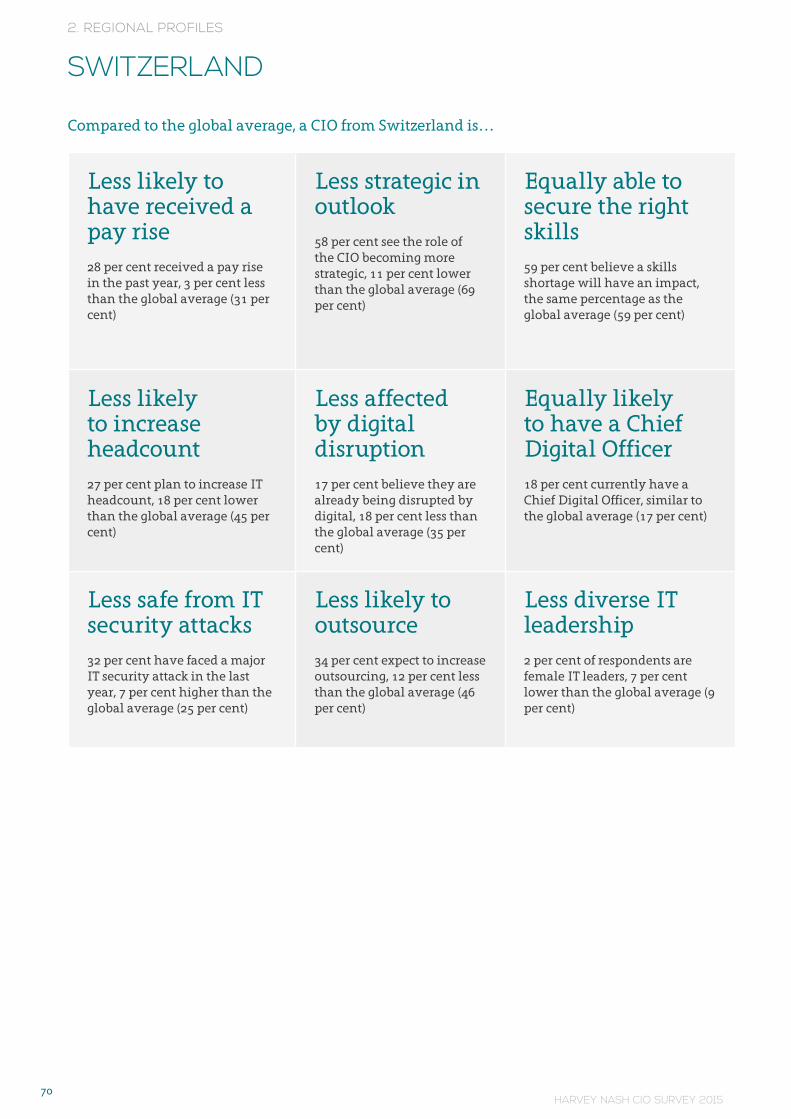
HARVEY NASH CIO SURVEY 201570
2. REGIONAL PROFILES
SWITZERLAND
Compared to the global average, a CIO from Switzerland is…
Less likely to have received a pay rise28 per cent received a pay rise in the past year, 3 per cent less than the global average (31 per cent)
Less strategic in outlook58 per cent see the role of the CIO becoming more strategic, 11 per cent lower than the global average (69 per cent)
Equally able to secure the right skills59 per cent believe a skills shortage will have an impact, the same percentage as the global average (59 per cent)
Less likely to increase headcount
27 per cent plan to increase IT headcount, 18 per cent lower than the global average (45 per cent)
Less affected by digital disruption17 per cent believe they are already being disrupted by digital, 18 per cent less than the global average (35 per cent)
Equally likely to have a Chief Digital Officer18 per cent currently have a Chief Digital Officer, similar to the global average (17 per cent)
Less safe from IT security attacks32 per cent have faced a major IT security attack in the last year, 7 per cent higher than the global average (25 per cent)
Less likely to outsource34 per cent expect to increase outsourcing, 12 per cent less than the global average (46 per cent)
Less diverse IT leadership2 per cent of respondents are female IT leaders, 7 per cent lower than the global average (9 per cent)
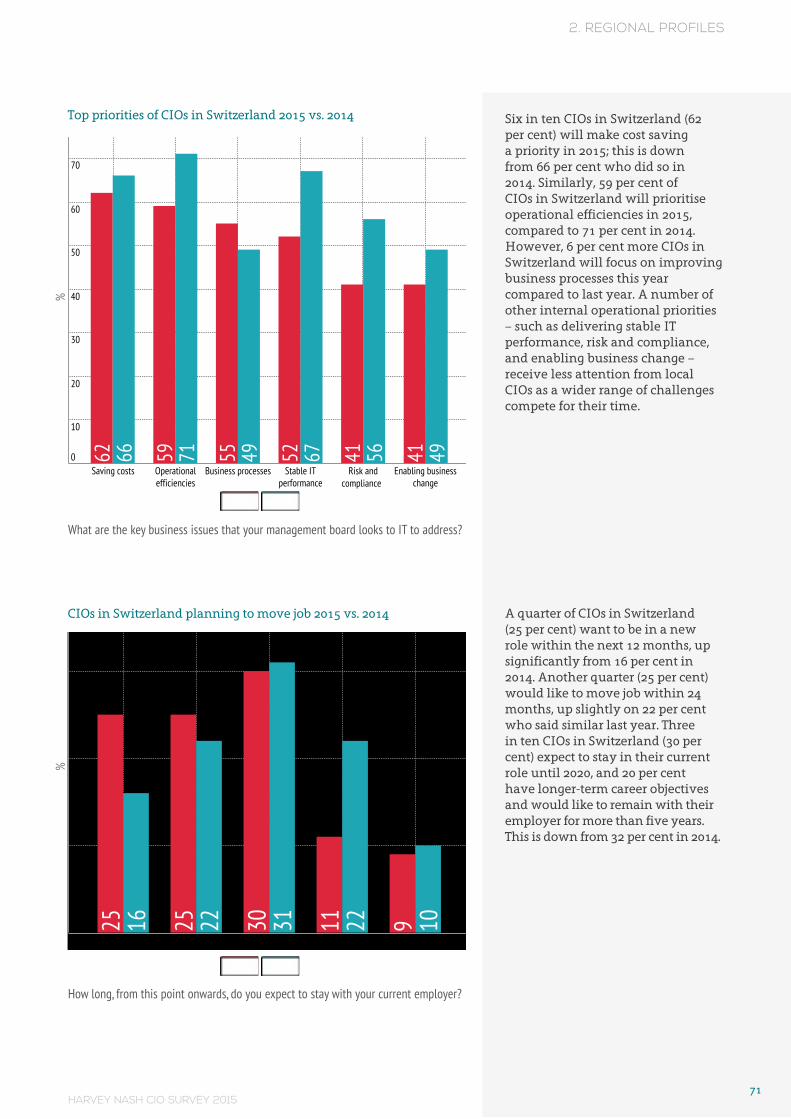
HARVEY NASH CIO SURVEY 201571
2. REGIONAL PROFILES
Six in ten CIOs in Switzerland (62 per cent) will make cost saving a priority in 2015; this is down from 66 per cent who did so in 2014. Similarly, 59 per cent of CIOs in Switzerland will prioritise operational efficiencies in 2015, compared to 71 per cent in 2014. However, 6 per cent more CIOs in Switzerland will focus on improving business processes this year compared to last year. A number of other internal operational priorities – such as delivering stable IT performance, risk and compliance, and enabling business change – receive less attention from local CIOs as a wider range of challenges compete for their time.
A quarter of CIOs in Switzerland (25 per cent) want to be in a new role within the next 12 months, up significantly from 16 per cent in 2014. Another quarter (25 per cent) would like to move job within 24 months, up slightly on 22 per cent who said similar last year. Three in ten CIOs in Switzerland (30 per cent) expect to stay in their current role until 2020, and 20 per cent have longer-term career objectives and would like to remain with their employer for more than five years. This is down from 32 per cent in 2014.
Top priorities of CIOs in Switzerland 2015 vs. 2014
CIOs in Switzerland planning to move job 2015 vs. 2014
What are the key business issues that your management board looks to IT to address?
How long, from this point onwards, do you expect to stay with your current employer?
2015 2014
%
Saving costs Operationalefficiencies
Business processes Stable ITperformance
Risk
and compliance
Enabling businesschange
70
60
50
40
30
20
10
0 62 59 55 52 41 4166 71 49 67 56 49
2015 2014
%
Less than 1 year 1 - 2 years 2 - 5 years 5 - 10 years More than 10 years
30
20
10
0 25 25 30 11 916 22 31 22 10

HARVEY NASH CIO SURVEY 201572
2. REGIONAL PROFILES
UNITED KINGDOM
Compared to the global average, a CIO from the United Kingdom is…
More likely to have received a pay rise34 per cent received a pay rise in the past year, 3 per cent more than the global average (31 per cent)
Equally strategic in outlook69 per cent see the role of the CIO becoming more strategic, the same percentage as the global average (69 per cent)
Equally able to secure the right skills 57 per cent believe a skills shortage will have an impact, similar to the global average (59 per cent)
More likely to increase headcount 50 per cent plan to increase IT headcount, 5 per cent higher than the global average (45 per cent)
More affected by digital disruption43 per cent believe they are already being disrupted by digital, 8 per cent more than the global average (35 per cent)
Equally likely to have a Chief Digital Officer18 per cent currently have a Chief Digital Officer, similar to the global average (17 per cent)
More safe from IT security attack19 per cent have faced a major IT security attack in the last year, 6 per cent lower than the global average (25 per cent)
Equally likely to outsource43 per cent expect to increase outsourcing, similar to the global average (46 per cent)
Less diverse IT leadership8 per cent of respondents are female IT leaders, 1 per cent lower than the global average (9 per cent)
NOTE: The United Kingdom region for the 2015 Harvey Nash CIO Survey includes insight from CIOs in England, Scotland, Wales and Northern Ireland.
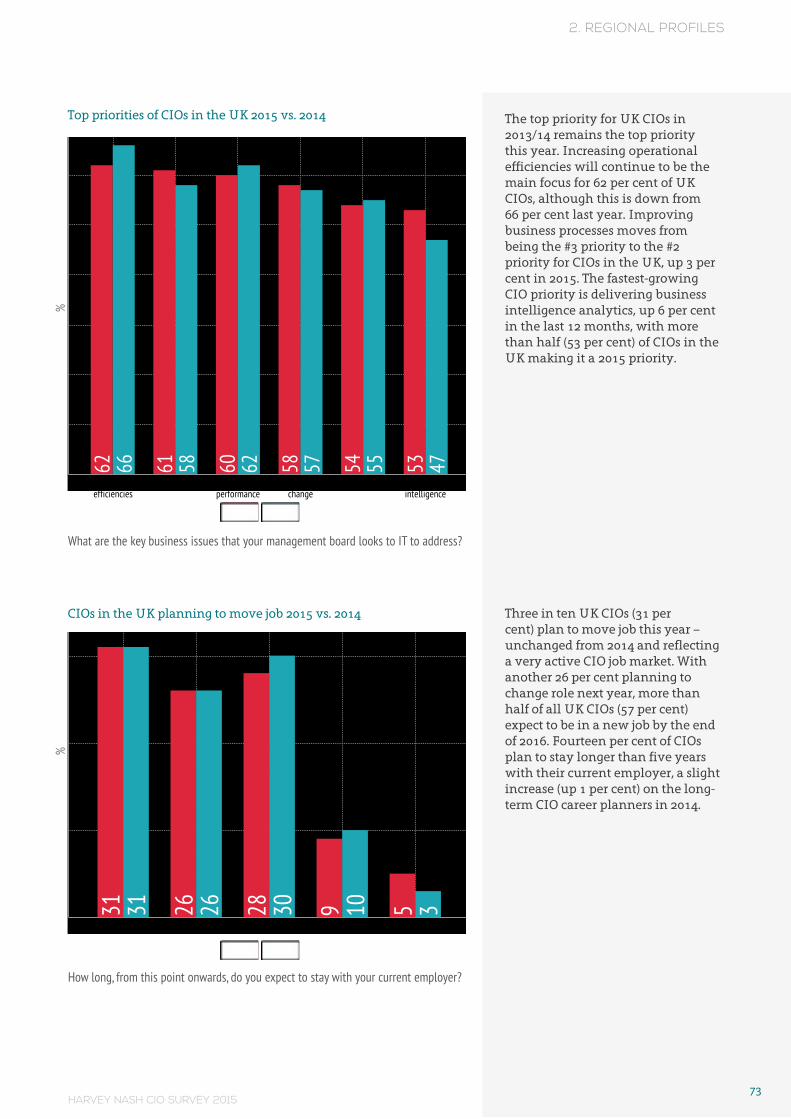
HARVEY NASH CIO SURVEY 201573
2. REGIONAL PROFILES
The top priority for UK CIOs in 2013/14 remains the top priority this year. Increasing operational efficiencies will continue to be the main focus for 62 per cent of UK CIOs, although this is down from 66 per cent last year. Improving business processes moves from being the #3 priority to the #2 priority for CIOs in the UK, up 3 per cent in 2015. The fastest-growing CIO priority is delivering business intelligence analytics, up 6 per cent in the last 12 months, with more than half (53 per cent) of CIOs in the UK making it a 2015 priority.
Three in ten UK CIOs (31 per cent) plan to move job this year – unchanged from 2014 and reflecting a very active CIO job market. With another 26 per cent planning to change role next year, more than half of all UK CIOs (57 per cent) expect to be in a new job by the end of 2016. Fourteen per cent of CIOs plan to stay longer than five years with their current employer, a slight increase (up 1 per cent) on the long-term CIO career planners in 2014.
Top priorities of CIOs in the UK 2015 vs. 2014
CIOs in the UK planning to move job 2015 vs. 2014
What are the key business issues that your management board looks to IT to address?
How long, from this point onwards, do you expect to stay with your current employer?
2015 2014
%
Operationalefficiencies
Business processes Stable ITperformance
Enabling businesschange
Saving costs Businessintelligence
70
60
50
40
30
20
10
0 62 61 60 58 54 5366 58 62 57 55 47
2015 2014
%
Less than 1 year 1 - 2 years 2 - 5 years 5 - 10 years More than 10 years
30
20
10
0 31 26 28 9 531 26 30 10 3
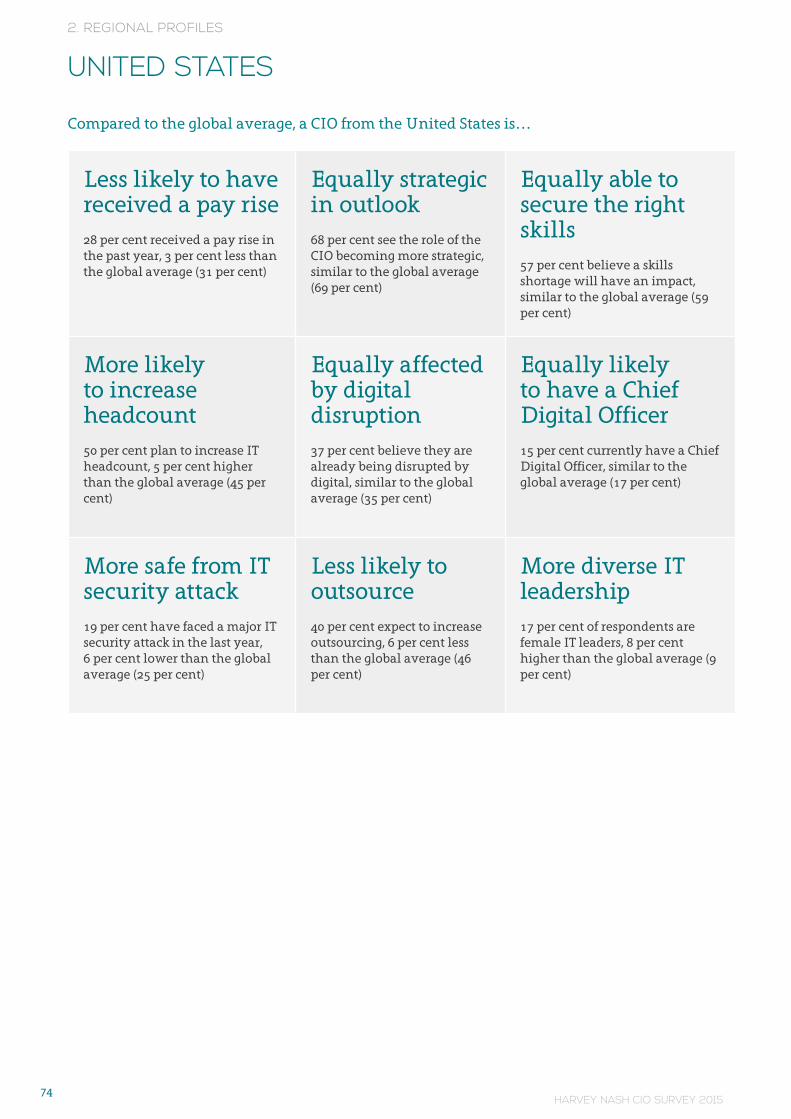
HARVEY NASH CIO SURVEY 201574
2. REGIONAL PROFILES
Compared to the global average, a CIO from the United States is…
Less likely to have received a pay rise28 per cent received a pay rise in the past year, 3 per cent less than the global average (31 per cent)
Equally strategic in outlook68 per cent see the role of the CIO becoming more strategic, similar to the global average (69 per cent)
Equally able to secure the right skills57 per cent believe a skills shortage will have an impact, similar to the global average (59 per cent)
More likely to increase headcount
50 per cent plan to increase IT headcount, 5 per cent higher than the global average (45 per cent)
Equally affected by digital disruption37 per cent believe they are already being disrupted by digital, similar to the global average (35 per cent)
Equally likely to have a Chief Digital Officer15 per cent currently have a Chief Digital Officer, similar to the global average (17 per cent)
More safe from IT security attack19 per cent have faced a major IT security attack in the last year, 6 per cent lower than the global average (25 per cent)
Less likely to outsource40 per cent expect to increase outsourcing, 6 per cent less than the global average (46 per cent)
More diverse IT leadership17 per cent of respondents are female IT leaders, 8 per cent higher than the global average (9 per cent)
UNITED STATES

HARVEY NASH CIO SURVEY 201575
2. REGIONAL PROFILES
Operational efficiencies remain the top priority for CIOs in the US; 62 per cent will make this a focus in 2015, although this is down slightly compared to 65 per cent in 2014. Delivering stable IT performance is a growing priority for US CIOs, up 4 per cent. Providing business intelligence via analytics is also becoming more important, up 6 per cent since 2014. Focusing on these priorities comes at the expense of cost saving, which has dropped 6 per cent, and improving business processes which has dropped 5 per cent. Risk and compliance continues to be a priority, but now for less than half (46 per cent) of US CIOs.
The proportion of US CIOs who plan to move job in the next 12 months is 19 per cent, down from 23 per cent in 2014. However, almost one in four US CIOs (39 per cent) expect to be in a new role by the end of 2016. More US CIOs are looking at a longer-term commitment to their current employers, with 32 per cent planning to stay in their role for more than five years, up from 25 per cent last year.
Top priorities of CIOs in the US 2015 vs. 2014
US CIOs planning to move job 2015 vs. 2014
What are the key business issues that your management board looks to IT to address?
How long, from this point onwards, do you expect to stay with your current employer?
2015 2014
%
Operationalefficiencies
Stable ITperformance
Businessintelligence
Business processes Saving costs Risk and compliance
60
50
40
30
20
10
0 62 59 56 56 55 4665 55 50 61 61 50
2015 2014
%
Less than 1 year 1 - 2 years 2 - 5 years 5 - 10 years More than 10 years
30
20
10
0 19 20 29 20 1223 18 35 15 10
HARVEY NASH CIO SURVEY 201576
2. REGIONAL PROFILES
Compared to the global average, a CIO from Vietnam is…
More likely to have received a pay rise70 per cent received a pay rise in the past year, 39 per cent more than the global average (31 per cent)
Equally strategic in outlook70 per cent see the role of the CIO becoming more strategic, similar to the global average (69 per cent)
Less able to secure the right skills 73 per cent believe a skills shortage will have an impact, 14 per cent higher than the global average (59 per cent)
More likely to increase headcount
59 per cent plan to increase IT headcount, 14 per cent higher than the global average (45 per cent)
Less affected by digital disruption19 per cent believe they are already being disrupted by digital, 16 per cent lower than the global average (35 per cent)
Equally likely to have a Chief Digital Officer16 per cent currently have a Chief Digital Officer, similar to the global average (17 per cent)
Less safe from IT security attack40 per cent have faced a major IT security attack in the last year, 15 per cent higher than the global average (25 per cent)
Equally likely to outsource44 per cent expect to increase outsourcing, similar to the global average (46 per cent)
Less diverse IT leadership6 per cent of respondents are female IT leaders, 3 per cent lower than the global average (9 per cent)
VIETNAM
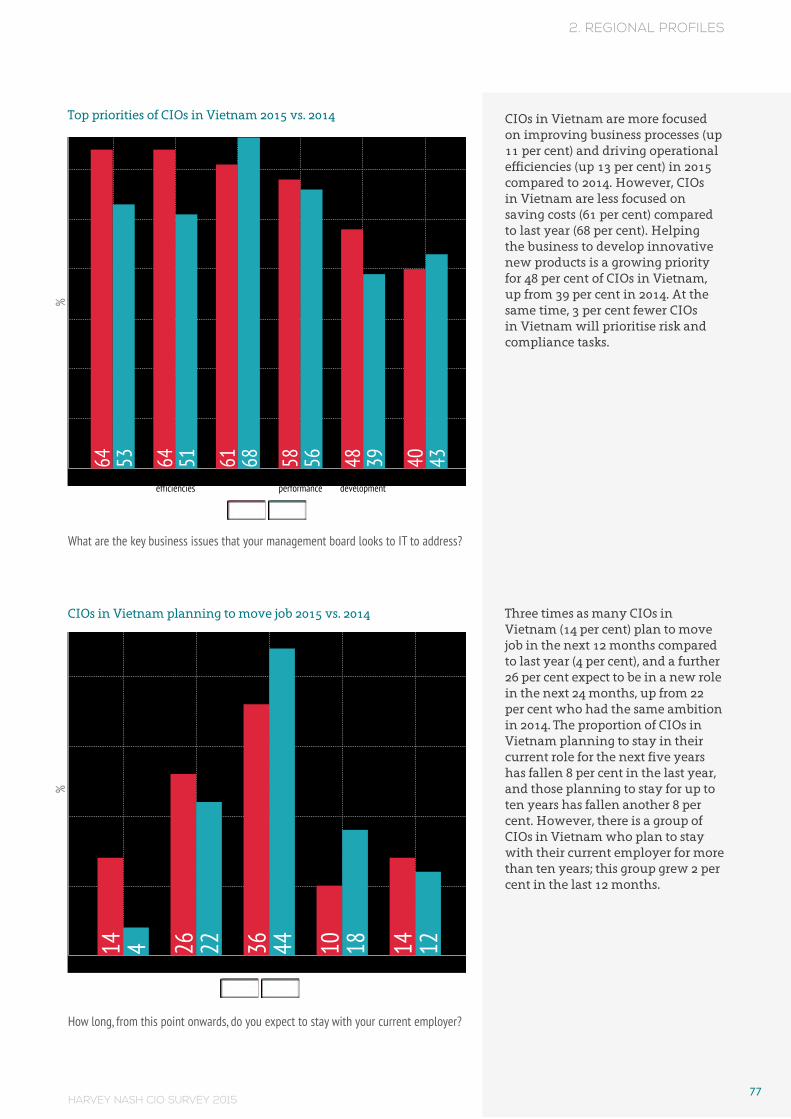
HARVEY NASH CIO SURVEY 201577
2. REGIONAL PROFILES
CIOs in Vietnam are more focused on improving business processes (up 11 per cent) and driving operational efficiencies (up 13 per cent) in 2015 compared to 2014. However, CIOs in Vietnam are less focused on saving costs (61 per cent) compared to last year (68 per cent). Helping the business to develop innovative new products is a growing priority for 48 per cent of CIOs in Vietnam, up from 39 per cent in 2014. At the same time, 3 per cent fewer CIOs in Vietnam will prioritise risk and compliance tasks.
Three times as many CIOs in Vietnam (14 per cent) plan to move job in the next 12 months compared to last year (4 per cent), and a further 26 per cent expect to be in a new role in the next 24 months, up from 22 per cent who had the same ambition in 2014. The proportion of CIOs in Vietnam planning to stay in their current role for the next five years has fallen 8 per cent in the last year, and those planning to stay for up to ten years has fallen another 8 per cent. However, there is a group of CIOs in Vietnam who plan to stay with their current employer for more than ten years; this group grew 2 per cent in the last 12 months.
Top priorities of CIOs in Vietnam 2015 vs. 2014
CIOs in Vietnam planning to move job 2015 vs. 2014
What are the key business issues that your management board looks to IT to address?
How long, from this point onwards, do you expect to stay with your current employer?
2015 2014
%
Business processes Operationalefficiencies
Saving costs Stable ITperformance
New productdevelopment
Risk and compliance
60
50
40
30
20
10
0 64 64 61 58 48 4053 51 68 56 39 43
2015 2014
%
Less than 1 year 1 - 2 years 2 - 5 years 5 - 10 years More than 10 years
40
30
20
10
0 14 26 36 10 144 22 44 18 12
HARVEY NASH CIO SURVEY 201578
CONCLUSION BY KPMG
The digital CIOThere is no instruction book on how to deliver a successful digital strategy.
It's not surprising then that the CIO Survey shows a wide range of approaches taken by organisations. Some have Chief Digital Officers, others don't; some have enterprise-wide digital strategies, others local strategies, and others no formal strategy at all. It is perhaps indicative of just how unique the nature of digital is, that over one third of organisations that don't have a company-wide approach still expect to outperform competitors in digital. It all further affirms how different digital really is, and how many organisations are still coming to terms with how to capitalise on it.
Despite this vast array of responses to digital, one thing is clear: digital matters. Two-thirds of CIOs say it is something that will fundamentally change their business, and one third are feeling that impact right now.
Not tomorrow, not in a few years’ time, but right now.
CIOs have a well-earned reputation for objectivity in the board room (too many have lived through the dot com bubble in 2000 to be blinded by gimmicks or fads), so to have so many saying that digital is impacting them is something to listen to.
Delivering digital But how do you respond? Well, whilst there is no instruction manual for digital strategies, it is remarkable just how similar organisations are that make a success of it. KPMG member firms have helped many organisations realise the opportunities for digital and a number of factors seem to unite those that are really successful:
1. A clear digital strategy. The digital strategy needs to articulate how to truly support the business and enable it to achieve its strategic goals. Three quarters of businesses in the survey have or are working on a formalised digital strategy but the biggest challenge faced in response to digital disruption is a lack of vision.
2. An impassioned and committed CEO. Central to the success of digital is ensuring that ownership of the strategy is both understood and championed at the highest level. Too often ownership is split between multiple parties with fragmented relationships which can hinder the embedding of digital change within the organisation
3. An innovative and flexible culture. Change is now a constant: old fixed mind-sets won’t do. Adopting an agile approach and putting innovation front and centre is critical. Governance and operating models need to evolve to embrace other functions, specifically marketing, enabling CIOs to effectively manage new areas of digital demand.
4. A digitally proficient workforce. Digital is a separate skill set from old IT; savvy CIOs will be bringing in the right talent as quickly as they can. A combination of up-skilling existing teams and bringing in talent from new areas that are not traditionally IT will be required to ensure success.
Lisa Heneghan, Head of EMA CIO Advisory, KPMG in the UK
HARVEY NASH CIO SURVEY 201579
The CIOSo, what of the role of the CIO? Some commentators talk about CIOs risking being side-lined in the ‘battle for digital’. But that’s not the whole truth – the fact is that everyone risks being side lined. Whether you are a CFO, CEO, CMO or CIO, digital is capable of disrupting all job roles just as much as it disrupts the businesses those jobs are part of.
But the CIO does have a unique perspective on all this. It is only the CIO who touches every part of the business. It is only the CIO who really understands the implications of system integration. And it is often only the CIO who truly has the relationships within the business, understanding of the external supplier market and depth of technological expertise required to cajole, persuade, organise and influence the disparate set of stakeholders needed to achieve the digital goal.
CIOs are key to making digital happen.

Harvey Nash Group plcwww.harveynash.com