Harrison Assessments Talent Solutions Capabilities … · · 2015-01-22The bi-polar method...
35
Copyright © 2007-2015 Harrison Assessments Int’l, Ltd. │ 800-798-5826 │ www.harrisonassessments.com Harrison Assessments Talent Solutions® Capabilities Overview
Transcript of Harrison Assessments Talent Solutions Capabilities … · · 2015-01-22The bi-polar method...

Copyright © 2007-2015 Harrison Assessments Int’l, Ltd. │ 800-798-5826 │ www.harrisonassessments.com
Harrison Assessments Talent Solutions®
Capabilities Overview


Harrison Assessments Talent Solutions® Table of Contents
Topic Page Suitability Questionnaire ........................................................................................ 5
Paradox Technology ............................................................................................. 5
Enjoyment Performance Theory ............................................................................ 7
Validity ................................................................................................................... 8
Talent Acquisition Solutions ................................................................................. 10
Applicant Tracking Features ................................................................................. 11
Employment Reports ............................................................................................ 12
Talent Development Solutions/Reports ................................................................ 15
Team Solutions Reports ....................................................................................... 18
Career Solutions .................................................................................................. 20
Succession Solutions ........................................................................................... 22
Behavioral Competency Solutions ....................................................................... 25
Customized Behavioral Competencies ................................................................. 27
Leadership Behavioral Competencies .................................................................. 28
Management Tools............................................................................................... 30
Job Benchmarking Process .................................................................................. 32
Page 3


HARRISON ASSESSMENTS TALENT SOLUTIONS® (HATS) The Suitability Questionnaire The instrument uses a questionnaire, which has sixteen groups of eight items (descriptive phrases) in each group. The person answering the questionnaire ranks the items in each group in order, according to which describes him/her the most. Items are repeated in different groups, which enable the scores to be analyzed for consistency and greater accuracy of scoring. The suitability questionnaire contains equally attractive and positive statements which are ranked by the applicant. Consequently, it is difficult to know how to manipulate the results. Suitability is evaluated differently for each job using unique suitability criteria which is unknown to the applicant. Traits have paradoxical relationships which are completely unknown to the applicants and are used to detect counter-productive characteristics and help assess the applicant’s level of suitability. Each statement appears in a second section in relationship to different statements. (Applicants cannot return to the first section to review their answers.) Computer cross-referencing which is unknown to the applicants identifies even small inconsistencies in the answers and determines the degree of consistency of the answers. Applicants are given only one chance to pass the minimum consistency level unless the interviewer decides to risk further attempts for highly eligibility applicants. Efficiency • Measures a comprehensive set of 175 job success factors in 20 minutes. • Provides the equivalent of a full day of multiple-choice testing equal to 2700+ multiple choice
questions.
• Determines eligibility questions based on answers to previous eligibility questions, minimizing test time.
• Provides 8200+ comparisons of suitability answers as a result of cross-referencing technology.
Methods of Suitability Analysis – Paradox Technology Each personality component is measured separately (not on a bipolar scale) and is positioned and analyzed in relationship to its complementary opposite. This system of analysis is called Complementary Traits Analysis. It provides detailed information related to various characteristics, which may be either productive or counter-productive based on the following principle. If the individual has strong characteristics (high scores) on both items of a pair of compliments it will be a particularly strong ability with regard to that dimension. If the individual has weak characteristics (low scores) on both items of a pair of compliments, it will be a significant weakness with regard to that dimension. If one item is significantly stronger than its complementary items of a pair, the strength of that characteristic will become a weakness.
Most behavioral assessments fail to provide this insight because they rely on a traditional bipolar approach of measurement, which assumes an either/or relationship between traits by placing two related positive traits on either end of a scale. For example, Diplomatic and Frank are traits that are typically used in this manner. By placing Diplomatic and Frank on either end of the same scale, the bipolar approach assumes that the more Diplomatic you are, the less Frank you are and vice versa. This is not a correct assumption. You can be both Frank and Diplomatic or neither.
Page 5

The bi-polar method attempts to overcome potential deception by forcing people to choose between two complementary positive traits. However, in doing so, it sacrifices the most important insight. For example, Acme Industries is hiring a Director of Communications and they require someone who is a good communicator. They have two candidates: Doug and Cheryl. When measured on bipolar scales, both appear to be in the middle, which incorrectly indicates that they are balanced in communication and thus they are both potentially good candidates.
Harrison Assessments takes a different approach by measuring each of the complementary traits independently. When measured on Harrison’s paradox scale, a clear picture emerges. When viewed on a paradox scale, it would be clear that Doug lacks both Frankness and Diplomacy and is a poor communicator. On the other hand, it is clear that Cheryl is both Frank and Diplomatic an d is an excellent communicator. HA takes a different approach by measuring each of the complementary traits independently. When measured on HA’s paradox scale, a clear picture emerges. When viewed on a paradox scale, it is clear that Doug lacks both Frankness and Diplomacy and is a poor communicator. On the other hand, it is clear that Cheryl is both Frank and Diplomatic and is an excellent communicator. Thus, the traditional bi-polar approach only provides a superficial and often inaccurate view of communication style and fails to identify the behavioral issues that are critical to job success. Paradox Technology provides this vital information without sacrificing its ability to prevent deception. It is highly effective at identifying negative traits because it is based on the principle that each trait has the potential to be either productive or counter-productive, depending upon other balancing traits. For example, we would normally consider Frankness to be a positive trait. However, if it is not combined with Diplomacy, it actually becomes Bluntness which can be counter-productive. On the other hand, Diplomacy is also normally a positive trait, but without Frankness, it can be counter-productive, taking the form of evasiveness. This depth of information is critical for making the right hiring decisions and optimizing the performance of your existing employees. For example, we would normally consider Frankness to be a positive trait. However, if it is not combined with Diplomacy, it actually becomes Bluntness which can be counter-productive. On the other hand, Diplomacy is also normally a positive trait, but without Frankness, it can be counter-
Page 6

productive, taking the form of evasiveness. This depth of information is critical for making the right hiring decisions and optimizing the performance of your existing employees
Paradox Technology analyzes and determines a broad spectrum of potential counter-productive traits without the person having the slightest idea it is happening. This is vitally important since negative traits usually account for60-75% of the factors that determine job success. Harrison Assessments’ ParadoxTechnology™ produces the most accurate, complete and reliable picture of a person and overcomes the deficiencies of traditional bi-polar measurement. It prevents deception while at the same time provides deep insight into potential counter-productive behavior. Paradox Technology analyzes and determines a broad spectrum of potential counter-productive traits without the person having the slightest idea it is happening. This is vitally important since negative traits usually account for 60-75% of the factors that determine job success.
Enjoyment Performance Theory Harrison Assessments methodology considers three key issues related to work satisfaction and retention: They are: 1) The degree to which a person’s preferred tasks fit the job, 2) The degree to which a person’s interests fit the job, and 3) The degree to which a person’s work environment preferences fit the job.
Enjoyment and Performance are linked because the level of enjoyment that an employee has while performing a particular activity is directly related to the level of their performance relative to that activity. When people enjoy a task, they tend to do it more, and get better at it. Good performance creates acknowledgement and/or positive self-regard which then cause them to enjoy the task even more.
Harrison Assessments predicts performance, work satisfaction and retention. It also enables companies to motivate people and increase their performance by assigning the roles and responsibilities that give them the highest degree of work satisfaction.
Page 7

VALIDITY Harrison Assessments has researched, documented and validated the instrument during the past 24 years and ranks among the highest in the industry for construct, face, criterion, and test-retest validity. There are several “types” of validity, and all must be seriously considered for use of an assessment. Face validity refers to what the test appears to measure. If a test has face validity it "looks valid" to the applicants or employees who take it, the HR professionals who choose it, and the recruiters or line managers who use it. Face validity refers to assessment questions that are work-related and report results that appear to relate to the requirements of the specific job. Questions that are job-related will make a much better impression on applicants and employees and will more likely enable the test to predict job success. Reports that are job-specific and provide an overall score will help recruiters to make better employment decisions and help coaches to more effectively guide employees to better performance. Behavioral assessments that focus on job-related questions (especially preferences) also provide the benefit of making the assessment more easily transfer across cultures because generalized personality questions nearly always have culturally influenced significance that makes answers to such questions quite different across cultures. Having strong face validity also has a big advantage of helping to protect against lawsuits and greatly reduces the burden of having to prove that an organization is not unfairly discriminating against specific races, genders or age groups.
Criterion validity is generally considered to be the most important aspect of validity for employment assessments. It indicates the degree to which a set of scores from test results relate to job performance. A strong relationship indicates that the assessment is likely to predict job success for that job. It is important to note that it is only related to the test when used to assess for a specific job and not the test in general. Criterion-related validity for one job does not necessarily indicate criterion-related validity for another job, because a test that can reasonably predict success for one may not do so for different jobs. As previously discussed, if the test does not produce an overall score related to specific jobs, there is no way to determine if it predicts job success and thus there is no way to show (or know) if the test has criterion validity.
Criterion validity is determined using correlation coefficients, which show the degree of relationship between tests results (overall score) and job performance. A correlation coefficient of 1.0 indicates a perfect correlation in which the overall score of the test matches perfectly with the performance scores of the employees. This is nearly impossible to achieve since performance scores themselves are not perfect and there is no need for the test to predict the exact level of performance. For example, a test result of 95% is close enough if the performance is 90%. Being reasonably close in the large majority of cases is considered quite useful and will generally be achieved by a 0.5 correlation. A correlation coefficient of 0 indicates that there is no correlation whatsoever between the assessment score and performance.
Extensive research has shown that structured interviews without any assessment have a correlation of 0.2 and therefore any assessment should have a correlation of at least 0.2 in order to be useful. A correlation coefficient of 0.5 will generally predict performance quite well and thus is considered a strong correlation.
Page 8

Keep in mind that most assessments are only intended to measure part of the factors related to job success and thus the most important measure is how all assessment components, including the interview, combine to predict job performance. Knowing the degree that each assessment segment predicts success (correlation coefficient) enables you to know how much weight (if any) to put on the various assessment segments. For example, if one uses a behavioral assessment that has an independent 0.5 correlation, greater weight should be placed on the behavioral assessment than the interview results. However, keep in mind that the sample size is also important.
Criterion-related validity is vitally important because it tells us how well the assessment works. Due to modern computer technology, criterion-related validity is much easier to determine and should be routinely evaluated for jobs in which you have more than thirty employees.
Construct validity examines the question: Are the assessment method and results consistent with the related theory or concept the assessment intends to measure? Construct validity methods are very complex and technical and are used during test construction. To evaluate employment tests, construct validity is similar to evaluating the quality of the engine of a race car as compared to criterion-related validity, which is like timing the race car in a race. The important and reliable means to determine the value of an employment assessment is criterion-related validity.
Construct validity does not necessarily indicate that the test is effective for employment purposes. Some of the oldest and most popular personality style tests have extensive construct validity but do not predict job success. In many countries those tests are not legal to use for recruitment but, unfortunately, they are still used in many cases. While they have the benefit of stimulating discussion related to teams, it would be far better to use assessments that stimulate reflection and discussion on real performance issues related to teams and individuals.
Test-retest is a method to determine the reliability of tests. It is determined by testing a group of people and then retesting them after a period of time (generally three months to one year later) to determine the consistency of the results. This can be a useful measure to confirm that an assessment consistently produces the same results. However, it does not have nearly the importance as criterion-related validity because it is extremely unlikely that a test that has low reliability will predict job success. Many personality tests measure only general personality patterns, or personality types, which tend to change very little over time and thus they have strong test-retest results. However, many of these tests have no predictive accuracy for specific jobs. Having a strong test-retest correlation does provide some confidence that the results are measuring something that stays reasonably constant.
Page 9
TALENT ACQUISITION SOLUTIONS
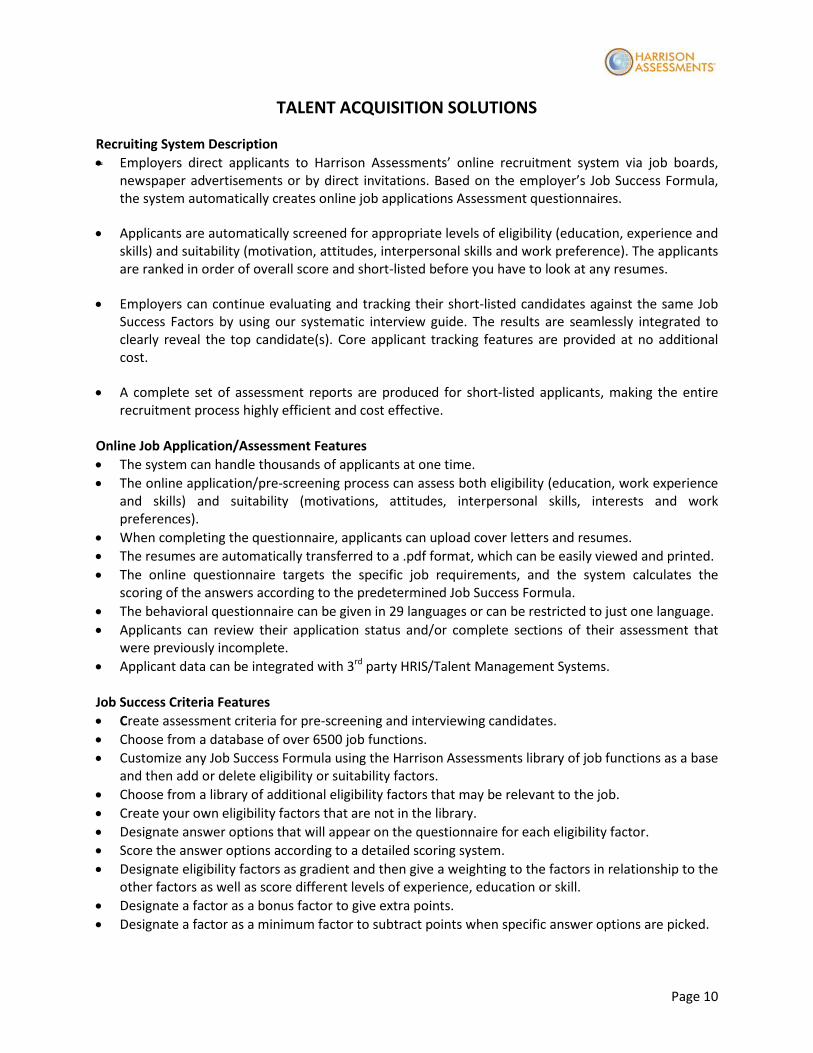
Recruiting System Description • Employers direct applicants to Harrison Assessments’ online recruitment system via job boards,
newspaper advertisements or by direct invitations. Based on the employer’s Job Success Formula, the system automatically creates online job applications Assessment questionnaires.
• Applicants are automatically screened for appropriate levels of eligibility (education, experience and skills) and suitability (motivation, attitudes, interpersonal skills and work preference). The applicants are ranked in order of overall score and short-listed before you have to look at any resumes.
• Employers can continue evaluating and tracking their short-listed candidates against the same Job Success Factors by using our systematic interview guide. The results are seamlessly integrated to clearly reveal the top candidate(s). Core applicant tracking features are provided at no additional cost.
• A complete set of assessment reports are produced for short-listed applicants, making the entire recruitment process highly efficient and cost effective.
Online Job Application/Assessment Features • The system can handle thousands of applicants at one time. • The online application/pre-screening process can assess both eligibility (education, work experience
and skills) and suitability (motivations, attitudes, interpersonal skills, interests and work preferences).
• When completing the questionnaire, applicants can upload cover letters and resumes. • The resumes are automatically transferred to a .pdf format, which can be easily viewed and printed. • The online questionnaire targets the specific job requirements, and the system calculates the
scoring of the answers according to the predetermined Job Success Formula. • The behavioral questionnaire can be given in 29 languages or can be restricted to just one language. • Applicants can review their application status and/or complete sections of their assessment that
were previously incomplete. • Applicant data can be integrated with 3rd party HRIS/Talent Management Systems. Job Success Criteria Features • Create assessment criteria for pre-screening and interviewing candidates. • Choose from a database of over 6500 job functions. • Customize any Job Success Formula using the Harrison Assessments library of job functions as a base
and then add or delete eligibility or suitability factors. • Choose from a library of additional eligibility factors that may be relevant to the job. • Create your own eligibility factors that are not in the library. • Designate answer options that will appear on the questionnaire for each eligibility factor. • Score the answer options according to a detailed scoring system. • Designate eligibility factors as gradient and then give a weighting to the factors in relationship to the
other factors as well as score different levels of experience, education or skill. • Designate a factor as a bonus factor to give extra points. • Designate a factor as a minimum factor to subtract points when specific answer options are picked.
Page 10

• Create compound factors that allow you to group eligibility factors and take the highest score or the lowest score from those factors.
• Designate eligibility factors as interview only so they will not appear on the applicant questionnaire. (You can score them at the interview.)
• Weight the different types of assessments, including eligibility, suitability, interview suitability or other optional assessments.
• Designate behavioral traits required for the position. • Access a database of traits that have been shown to correlate with performance for particular job
functions. • Weight the traits according to your custom requirements. • Range checking ensures that your reweighting of traits is not counter to the available research. • Add other traits in the HA library of traits (over 100 available traits). • Delete any traits from the recommended trait list for any job function when permitted by the range
checking. • Include other assessments, such as cognitive tests, and integrate the results with the other
assessment types. • Weight the assessment types in relationship to each other. • Determine whether candidate attempts to deceive, has poor concentration, or a lack of literacy
when taking the suitability questionnaire with our automated reliability check. • Designate the minimum level of consistency for the suitability. • Store all the position requirements in the system, and a Recruitment Campaign can be easily
launched at any time there is a vacancy. HATS Additional Applicant Tracking Features • Applicants are automatically ranked according to their overall assessment score (highest to lowest). • There is no need to review resumes for applicants who have lower scores because the pre-screening
has already determined that they don’t fit the job requirements as well as the ones with higher scores.
• Applicants can be ranked according to their suitability scores, eligibility scores or overall scores. • All scores are visible on screen in relationship to the entire group of applicants. • Resumes and cover letters are available for easy viewing at every stage of the recruitment process
and can be printed. • Applicants can be short-listed according to their scores and resumes. • You can immediately mark an applicant as declined or pending. • You can short-list applicants and receive a full assessment report for each short- listed applicant. • The full assessment report compares the applicant to the exact Job Success Factors, showing the
impact of each factor on potential job success. This includes eligibility and suitability. • The full assessment report provides an interview worksheet that guides the interviewer to evaluate
the eligibility factors designated in the Job Success Formula and suggests behavioral interviewing questions.
• The full assessment report includes a section that tells you what would make a specific applicant want to work for you, enabling you to better convince a top candidate to work for your company.
• You can enter the results of the interview assessment, including rescoring the eligibility factors and independently assessing the suitability traits.
• You can assess an applicant for other related jobs by selecting from a list of over 6000 job functions as well as any custom Job Success Formulas you have in your system.
• You can ask the interview-only questions, score them and enter the results.
Page 11

• You can give additional assessments to short-listed candidates and have them seamlessly integrated in order to provide an overall quantified assessment score.
• You can add notes to the interview. • Multiple interviewers can score applicants on the their own copy of the interview worksheet against
the predetermined Job Success Formula creating consistency, focus and the ability to compare specific evaluations among interviewers. The final consensus among the interviewers can then be entered back into the system.
• After the interview ratings are entered into the system, the system recalculates the applicants’ scores against the Job Success Formula.
• You can reprint the assessment reports, showing the final results that include the interview and other assessments, the scores given and the completed job analysis after the final evaluations.
• You can send notification emails to the applicants based on their applicant status. • Each applicant status has a related email template that enables you to customize it for each status. • Each notification e-mail can be customized by adding an optional first paragraph. • You can bulk send declined e-mails to all applicants under a designated overall score. • You can bulk send status e-mails to all marked applicants. • You can review prior notifications sent to any applicant. • All of the data for each recruitment campaign is held in a separate section of the system, enabling
you to keep the information easily accessible. Employment Reports HATS provides employment reports that analyze personality traits, interests and work environment preferences as well as eligibility (education, experience and skills) as applied to different employment positions. The reports can be used for staff selection, team development, staff development, training needs assessment, conflict resolution, career counseling and other similar human resource development functions. The following reports constitute the Product, which is generated by the Harrison Assessment system: Job Analysis Comparison This report compares a person to a position using graphs. The graph shows the person’s overall percentage of requirements met and the likelihood of success for the selected requirements template. This report includes the person’s suitability as measured by the HA Suitability Assessment, eligibility (your eligibility criteria and questions are designated in the HA system), and interviewing results (your interviewing questions are designated in HA system. Each of the above assessment methods is weighted in relationship to each other in order in order to achieve the Overall Score of percentage of requirements met. Each assessment method is also given an overall score which is displayed at the top of that section of the report. The person’s scores are graphically compared against each of the requirements for each of the assessment methods. The requirements for each assessment method are listed in order of importance. The box to the right of each requirement indicates the range of the potential impact that requirement can have on the overall score for that assessment method. The ball within that box indicates the impact of the person’s score on the overall requirements for that assessment method. This report also provides a narrative description integrated with the graph related to the comparison of the person and the position. It explains the person’s behavior in relationship to each suitability requirement, as well as the likely impact of that behavior on his/her success. The Job Comparison Narrative focuses on the suitability aspect of the assessment and is organized according to the traits required for the position, starting with the most important trait. Each trait is a section of the report,
Page 12

which contains three paragraphs. The first paragraph shows the score of the person for that trait. The second paragraph explains the meaning of that score in behavioral terms. The third and most important paragraph explains the likely overall impact the person’s level of that particular trait will have on performance for that position. Group Screening The Group Screening Report enables you to view or print a group of candidates against a template. The traits are listed vertically at the top of each page. The first page is related to the Essential Traits, the next page is related to the Desirable Traits, and the last page is related to the Traits to Avoid. The applicants receive points depending on their HA Suitability Assessment score on that particular trait. These points are listed in a cell of the table that corresponds to the person’s name and the trait. The columns under the SCORES further to the right show each person’s Consistency Score, Interviewing Score, Eligibility Score, Suitability Score, Overall Score, and Performance Score. When generating this report, you can order the list of persons by selecting one of the above options from the Order By drop-down list next to the Group Screening option. The MAX row contains the maximum possible points available for each trait. The numbers in the columns adjacent to the names are the points the person received on that trait. Interviewing Guide The Interviewing Guide Report provides specific behaviorally based interviewing questions for each candidate, formulated to meet the specific requirements of the position template. The questions are ordered according to the importance of each requirement as well as the importance of the question as determined by the HA Suitability Assessment. The Interviewing Guide also includes the eligibility questions for the position and the person’s answers to those questions. How to Attract This Candidate The How to Attract This Candidate report identifies the key leverage points that will help you to convince a top candidate to accept your employment offer. Through understanding the person’s key values, you can position your company that can show the candidate how your organization can meet his/her needs. The report is organized into three categories: Essential issues, Important issues, and Other Possible issues. Engagement & Retention Analysis This reports focus on eight areas related to engagement and retention. It identifies candidate expectations as well as behaviors that relate to the shared responsibility of achieving those expectations. The report can be used in the selection process to identify how well aligned the candidate’s expectations, passions, and motivators are with the organization’s needs and work environment.
Page 13

TALENT ACQUISITION REPORT EXAMPLES
Page 14

TALENT DEVELOPMENT SOLUTIONS Developing Position Traits The Developing Position Traits report identifies the two traits that would be most valuable to develop for an individual in relationship to a selected position. It provides a development plan for each of the traits. The traits are selected according to the two traits that would have the greatest positive impact on success if they were developed. The person’s lowest traits are not necessarily selected as they may not have as much impact on performance for that position. Developing Success Traits The Developing Success Traits Report enables you to get a practical development plan for any of the traits listed for an individual independent of any position. There is a drop-down list below the Development by Trait report label enabling you to select the trait for which you want to develop. Paradox Graph The Paradox Graph Report provides a graphical view of the person’s behavior relative to each of the paradoxical traits. The Paradox portrayal enables you to understand the person’s behavior under normal conditions as well as under stress conditions. It is a unique way to understand the human psyche based on this key proven psychological concept. The 12 paradoxes are: Certain and Open, Analytical and Intuitive, Authoritative and Collaborative, Persistent and Experimenting, Frankness and Diplomacy, Assertiveness and Helpfulness, Self-Motivated and Stress Management, Warmth and Enforcing, Self-Accepting and Self Improvement, Optimistic and Analyzes Pitfalls, Risking and Analyzing Pitfalls, and Flexible and Organized. Paradox Narrative The Paradox Narrative provides a detailed explanation of each paradox and the individual’s scores related to that paradox. This gives an in-depth dynamic understanding of the person’s behavioral tendencies. The Paradox portrayal enables you to understand the person’s behavior under normal conditions as well as under stress conditions. It is a unique way to understand the human psyche based on this key proven psychological concept. Traits and Definitions The Traits and Definitions report lists the person’s scores on each trait and gives definition of each trait. This enables you to see a hierarchy of the candidate’s tendencies and provides a clear definition of each trait. The traits are listed in categories including basic traits, HATS preferences, work environment preferences, interests, behavioral competencies and traits to avoid. Each category of traits lists the related traits from the strongest trait of that person to the weakest trait. Summary and Keywords The Summary and Keywords report provides key single words that describe the individual. The keywords are divided into three columns: Strongest Traits, Strong Traits and Fairly Strong Traits. The Strongest Traits are traits that the person scores 10 out of 10 or 2 or less out of 10. This indicates that the trait is extreme and thus will be the person’s strongest characteristic. Strong Traits are traits in which the person scores 9 out of 10 or 3 out of 10, indicating the traits will be strong due to its presence or absence. Fairly Strong Traits are traits in which the person scores 8 out of 10 or 4 out of 10, indicating the trait will be fairly strong due to its presence or important due to its absence. The Summary Descriptions provides narrative paragraphs that describe the person’s behavior further.
Page 15

Main Graph The Main Graph report shows the individual scores on the main traits using graphical representations. The Main Graph is used to gain deeper insight into the person by enabling the interpreter to see a complete system of traits. By studying this graphical system, the interpreter can learn to understand the interrelationship between traits. The report is organized into nine Quadrants. In each Quadrant there are four traits, one on each side of a quadrant. Two days training is required to effectively begin to interpret the Main Graph. Main Graph Interpretation Report The Main Graph Interpretation Report provides an interpretation of all the items on the Main Graph. Engagement & Retention Analysis This reports focus on eight areas related to engagement and retention. It identifies candidate expectations as well as behaviors that relate to the shared responsibility of achieving those expectations. The report can be used in the coaching process to ensure alignment of the employee’s expectations, passions, and motivators are with the organization’s needs and work environment.
Page 16

TALENT DEVELOPMENT REPORT EXAMPLES
Page 17

TEAM SOLUTIONS Team Main Graph The Team Main Graph shows the average scores for a team in relationship to the Main Graph. It enables you to see the general average scores of a team in relationship to the Main Graph. Trait Export The Trait Export report enables you to export all the scores from all the traits for any or all of the profiles in the system. The Trait Export shows all the individual scores as well as the averages for every trait in the HATS system. This report is useful for analyzing performance factors or organizational culture. This report can be printed, or can be saved in Excel or as a CSV file. Team Paradox Graph The Team Paradox Graph shows a group of persons plotted against each of the twelve paradoxes and the paradox trait scores. This report is particularly useful for teambuilding. Each person’s scores on the paradox is represented by a letter and thus the individual scores can be displayed anonymously is you wish. The paradoxes are the same as the Paradox Graph. The last page of the report contains all the code letters for each person. Engagement & Retention Analysis This reports focus on eight areas related to engagement and retention. It identifies team/group expectations as well as behaviors that relate to the shared responsibility of achieving those expectations. The report can be used in team development to ensure alignment of the employee’s expectations, passions, and motivators are with the organization’s needs and work environment.
Page 18

TEAM/GROUP SOLUTIONS REPORT EXAMPLES
Page 19

CAREER SOLUTIONS Career Options The Career Options report provides a list of careers that are most suitable for an individual. The careers are listed starting with the careers that are most suitable for that person. The system searches on more than 600 careers and identifies the careers that best match the person's HATS preferences, interests, work environment preferences and personality patterns. The report can be restricted to careers related to specific levels of education. Career Development The Career Development report gives detailed guidance related to an individual’s career development. It includes the following topics: HATS Preferences, Interests, Preferred Work Environment, Interpersonal Skills, Motivation, Decision Making, and Leadership. Career Enjoyment Analysis The Career Enjoyment Analysis report compares an individual to the specific requirements of a particular career, identifying the specific traits that would either support or detract from personal fulfillment and success in this career. It provides a narrative description of the contents of the graph, expanding on the meaning of each point as well as providing additional information that may be relevant to the person as related to this career. Your Greatest Strengths The Your Greatest Strengths report describes your greatest strengths. Some of the strengths described are paradoxical pairs of traits where two strengths seem to be opposite or contradictory, but in fact are complementary or synergistic. Paradoxical strengths describe a unique ability which enables you to be more versatile and to respond more effectively to a variety of different situations in your life or in your work.
Page 20

CAREER SOLUTIONS REPORT EXAMPLES
Page 21

SUCCESSION SOLUTIONS Integrating Succession and Career Planning The Harrison Talent Readiness System™ enables you to fully engage your employees through integrated career and succession planning while simultaneously providing comprehensive decision analytics to manage your qualified talent pools. Career Planning Employees access a personal career planning portal that ranks internal jobs according to their likely enjoyment and engagement preferences. In addition, employees can view reports related to their strengths and areas to develop. Talent Pool Analytics Management accesses up-to-date talent pipelines that rank high potentials according to their qualifications and behavioral competencies and suitability related to job opportunities. Benefits Employees benefit from having involvement in their career planning process and access to personalized development reports. Management accesses a Talent Readiness Dashboard that objectively ranks employees for positions according to job specific qualifications and behavioral competencies, as well as current job performance. Talent pools are kept up-to-date by employees and Human Resources only needs to access the current talent pipeline for any position.
Page 22
Talent Readiness System Create Talent Capability Pipelines
Qualifications (eligibility) and fit (suitability) for specific jobs Integrate performance level and interest in development All on one “analytics” dashboard
Automate Assessment-Based Employee Career Planning
Employee driven Fully customizable
Drive Employee Engagement and Retention by Enabling Employees to Explore:
Job match to determine jobs they would enjoy most Required qualifications for each job Their greatest strengths How to develop their careers Express interest in specific jobs & locations Productive manager/employee developmental discussions The Career Options report provides a list of careers that are most suitable for an individual.
Page 23

SUCCESSION SOLUTIONS REPORT EXAMPLES
Page 24

BEHAVIOURAL COMPETENCY SOLUTIONS
Standard Behavioral Competencies Harrison Assessments provides standard behavioral competencies that enable you to compare employees or applicants behavioral tendencies to the standard behavioral competencies. Behavioral competencies can also be customized to reflect your specific core values or core competencies. JUDGMENT (STRATEGIC) – The tendency to have a balance of traits necessary to discern pertinent information, and formulate an effective strategy. Essential traits: Analytical, Analyzes Pitfalls, Research/Learning, Intuitive, Collaborative, Self-improvement, Systematic. Desirable traits: Experimenting, Persistent, Certain, Pressure Tolerance, Optimistic, Planning, Self-Acceptance, Relaxed and Open/Reflective. Traits to avoid: Blindly Optimistic, Impulsive, Skeptical, Defensive, Dogmatic, Easily Influenced, Fast but Imprecise and Precise but Slow. DOESN'T NEED STRUCTURE – The tendency to manifest the traits that would enable one to occupy a position that does not have much structure (assuming sufficient job related knowledge). Essential traits: Takes Initiative, a low score on Tolerance of Structure (lack of desire for structure), Authoritative, Wants Autonomy. Desirable traits: Wants Challenge, Experimenting, Open /Reflective, Enthusiastic. Traits to avoid: Rebellious Autonomy, Blindly Optimistic, and Impulsiveness. EFFECTIVE ENFORCING – The tendency to skillfully correct others when they are violating rules or performing poorly. Essential traits: Enforcing, Assertive, Frank, Diplomatic, Influencing, Tolerance of Bluntness. Desirable traits: Authoritative, Flexible, Optimistic, Self-Acceptance, Warmth/Empathy, Helpful, Open/Reflective, Relaxed. Traits to avoid: Blunt, Defensive, Dogmatic, Evasive, Forceful Enforcing, Permissive, Self-Sacrificing, Harsh and Authoritarian. INNOVATIVE – The tendency to create new and more effective ways of doing things. Essential traits: Experimenting, Persistent, Takes Initiative, Enthusiastic, Open/Reflective, Research/Learning, Analytical, Optimistic. Desirable trait: Collaborative. PROVIDES DIRECTION – The tendency to manifest the traits necessary for a leadership role. Essential traits: Wants to Lead, Influencing, Takes Initiative, Wants Challenge, Enthusiastic, Self-Improvement, Planning, Persistent, Pressure Tolerance, Public Speaking, Self-Acceptance. Desirable traits: Experimenting, Flexible, Frank, Handles Conflict, Helpful, Precise, Organized, Relaxed, Risking, Systematic, Tolerance of Bluntness, Warmth/Empathy. INTERPERSONAL SKILLS – The tendency to have a balance of traits that relate to effective interaction with others. Essential traits: Diplomatic, Helpful, Optimistic, Outgoing, Assertive, Frank, Influencing, Self-Acceptance, Self-Improvement, Warmth Empathy, Tolerance of Bluntness. Desirable traits: Flexible, Collaborative, Open/Reflective, Manages Stress Well, Relaxed. Traits to avoid: Defensive, Blunt, Dogmatic, Harsh, Dominating, Authoritarian and Permissive. HANDLES CONFLICT – The tendency to skillfully face discord or strife, and the interpersonal skills necessary to deal with it effectively. Essential traits: Comfort with Conflict, Diplomatic, Helpful, Warmth/Empathy and Assertive. Desirable traits: Collaborative, Self-Acceptance, Self-Improvement.
Page 25

Traits to avoid: Defensive, Authoritarian, Blunt, Dogmatic, Dominating, Harsh, Self-Critical, Wants Diplomacy. RECEIVES CORRECTION – The tendency to accept guidance intended to improve performance. Essential traits: Self-Improvement, Interpersonal Skills, Self-Acceptance. Traits to avoid: Defensive, Dogmatic, Ego-defensive. PEOPLE ORIENTED – The tendency to have a balance of traits that would enable one to positively interact with others. Essential traits: Warmth/Empathy, Helpful, Outgoing, Team (wants), Public Contact, Enthusiastic. Desirable trait: Self-Acceptance. Traits to avoid: Defensive, Dogmatic, Harsh, Dominating. ORGANIZATIONAL COMPATIBILITY – The tendency to work co-operatively with others (assuming sufficient job related knowledge and team compatibility). Essential traits: Takes Initiative, Self-Improvement, Manages Stress Well, Diplomatic, Helpful, Warmth/Empathy, Optimistic, Team (wants) and Tolerance of Bluntness. Desirable traits: Tolerance of Structure, Self-Motivated, COACHING – Is designed for people in positions who predominantly do coaching. Essential traits: Self-improvement, Diplomatic, Enlist Cooperation, Enthusiastic, Helpful, Optimistic, Warmth/Empathy. Desirable traits: Collaborative, Self-acceptance, Takes Initiative, Wants Challenge, Experimenting, Cause Motivated, Analytical, Frank, Manages Stress Well, Open/Reflective, Relaxed, Influencing, Outgoing, Teaching, Tolerance of Bluntness. Traits to avoid: Defensive, Dogmatic, Harsh, Blunt, Dominating and Permissive. HANDLES AUTONOMY – The tendency to have the motivation and self-reliance necessary for a significant amount of independence from immediate supervision (does not indicate the necessary job related knowledge). Essential traits: Takes Initiative, Authoritative, Self-Motivated, Wants Autonomy, Persistent. Desirable trait: Optimistic. Trait to avoid: Rebellious Autonomy. TOLERANCE OF EVASIVENESS – The level of comfort related to dealing with people who are indirect or lacking in frankness. Essential traits: Warmth/Empathy, Wants Diplomacy and Diplomatic. Desirable traits: Manages Stress Well, Relaxed. Traits to avoid: Blunt, Defensive, Dominating, Harsh. SELF-EMPLOYED – The tendency to enjoy activities that would be required for self-employment (does not necessarily indicate sufficient business related knowledge). Essential traits: Authoritative, Takes Initiative, Wants Autonomy, Wants Challenge, Enthusiastic, Organized, Persistent, Analytical. Traits to avoid: Blindly Optimistic, Impulsive. NEGOTIATING – The tendency to bargain in order to reach a beneficial agreement. Essential traits: Influencing, Interpersonal Skills, Diplomatic, Effective Enforcing, Assertive, Certain, Comfort with Conflict, Open/Reflective. Desirable traits: Frank, Experimenting. Traits to avoid: Permissive, Defensive, Self-Sacrificing, Blunt, Dogmatic and Harsh.
Page 26

Customized Behavioral Competencies Behavior competency/core value templates are extremely useful to capture an organization’s competencies and/or core values. Each employee can assess themselves against the appropriate behavioral competencies to obtain a clear understanding of his/her behavior patterns in relationship to that competency. This will enable the employee to see more clearly how to proceed in order to obtain that competency or core value. The development reports can also be used in conjunction with this process in order to help guide the employee to a development plan and cultivate the particular traits that will support the required behavioral competencies or core values. You can also use a behavioral competency/core value template for screening as part of the selection process. First, it is important to obtain an overview of how you might benefit from developing behavioral competency/core value templates. In general, there are two things you need to decide before developing behavioral competency or core value templates:
1. How are you going to use it – to which roles, position levels or organizational units do you
want to apply it? 2. Do you wish to create a single template with traits that capture all the related behavioral
competencies or core values for a role/level, or do you wish to create individual competencies using the different trait options and then use the “sub-competencies” or “sub-values” themselves as part of an overall behavioral competency template?
When making a behavior competency or core value template, you need to consider how it will be used. If the template will be used for different levels of the organization, you probably need to make at least two corresponding templates for that same behavioral competency or core value. You may even need to make one for each of five or six job families if you wish to apply it to all employees. There are some cases where you may be able to create a behavioral competency/core value for managers that will also apply to professional or sales positions. For example, a template that focuses on initiative, achievement, or “results orientation” can usually be applied to management, professional, and sales, because in most cases a strong achievement orientation is necessary for each of those roles. However, that same template will probably not apply well to administrative or customer service positions. There are many behavioral competency/core value templates for managers that will not apply well for any other role. For example, behavioral competency templates that relate to strategic orientation or leadership usually do not apply well to other roles. While the same behavioral competency or core value may apply to all, different job families may require different degrees of that competency/core value and variations of the competency/core value. For example, all employees need to show leadership, at least leadership of self. However, management needs a much greater degree of “leadership”. Furthermore, the leadership needs to be applied not just to self, but to other people. Thus, it requires a different calibration to obtain the appropriate degree of leadership and the appropriate kind of leadership. Therefore, if you wish to use a behavioral competency or core value template for all levels of the organization, you will usually need to make variations of the template for the major role categories.
Page 27

If you have a set of behavioral competencies or core values, there are two ways to create templates. 1.) The first is to build them all into a single template to be used for a specific role or roles. 2.) The second is to create each competency or core value separately and then create an overall
behavioral competency or core value that uses each of the sub-competencies instead of traits.
Although this is more effort, it will enable you to have a template (and report) that includes the names of each of your own behavioral competencies or core values in the template (and report) rather than merely the title of the template. In addition, it will also allow an employee to compare themselves against each of the sub-competencies or core values as well as the overall set of competencies. This reinforces the particular concepts of competencies or core values that you have already developed, and helps employees to focus themselves toward those competencies or core values. Leadership Behavioral Competencies The Leadership Behavioral Competencies provide a Summary Report and Behavioral Success Analysis Reports for each competency. These include:
• Leadership Master (Summary Report) 1. Communicator 2. Drive for Results 3. Impact & Influence 4. Innovation 5. Leading People 6. Learning Agility 7. People Energizer 8. Problem Solver 9. Resilience & Perseverance 10. Strategic Thinker
Page 28

BEHAVIOURAL COMPETENCIES REPORT EXAMPLES
Page 29

MANAGEMENT TOOLS Engagement and Retention Analysis This reports focus on eight areas related to engagement and retention. It identifies employee expectations as well as behaviors that relate to the shared responsibility of achieving those expectations. The report can be generated for individuals or groups.
How to Manage, Develop and Retain The How to Manage, Develop and Retain Report identifies the key leverage points that help you to manage, develop or retain a particular employee. This report helps you to understand the person’s strengths and well as how to use them more effectively. It also helps you to understand a person’s weaknesses and take measures to prevent them from creating problems in the organization. This report is organized into three categories: Essential factors, Important factors, and Other Possible Factors.
Traits and Definitions The Traits and Definitions report lists the person’s scores on each trait and gives definition of each trait. This enables you to see a hierarchy of the candidate’s tendencies and provides a clear definition of each trait. The traits are listed in categories including basic traits, HATS preferences, work environment preferences, interests, behavioral competencies and traits to avoid. Each category of traits lists the related traits from the strongest trait of that person to the weakest trait. Managers can find helpful information to coach, engage, and motivate employees, in addition to information found in the Engagement & Retention Analysis report.
Page 30

MANAGEMENT TOOLS EXAMPLE REPORTS
Page 31

JOB BENCHMARKING PROCESS The Harrison Assessments Benchmarking Process:
• Identifies key success factors that contribute to job success • Formulates critical job success factors and a comprehensive set of derailers • Provides information to improve job performance and determine what and where improvements
need to be made • Identifies traits that differentiate high performers from moderate and low performers.
The objective of Performance Benchmarking is to:
• Identify traits related to success for a specific job. • Identify how the traits are related to success.
Outcome: A Job Success Formula that is customized to the job requirement that can be used to consistently identify high performers.
Phases of Performance Benchmarking
Phase 1: Data Gathering & Review
1. Performance Criteria – gather from SMEs at focus group meeting with consultants on-site in Chicago in late Aug. or early Sept
2. Length of time in job – I incumbents at various performance levels selected for inclusion in the study; LeadingRE staff to collect this information and enter on a spreadsheet.
Page 32

3. Performance Ratings – depending on the final set of KPIs, this data will be collected by LeadingRE for each incumbent selected for participation in the study and entered on the spreadsheet with length of time in job above.
4. Job Description – current job description collected from LeadingRE (if this needs updating or more work, consultant can work with LeadingRE on this).
5. HA reviews data -- all of the above is submitted to the consultants who will organize it, input to the Harrison system and submit to Dr. Dan Harrison to run the analytics.
More about Performance Criteria and Performance Ratings
Performance Criteria – This initial step is the most critical. Since this research method involves the correlation of performance ratings/data with test scores (assessment results), the “wild card” factor in this formula is performance since the assessment results speak for themselves. That is, what makes for top performance in this role? Answering this question determines the ultimate success of the project and the utility of the resulting Job Success Formula.
How to measure job performance?
Most organizations continue to grapple with this question year-after-year and do not have comprehensive, objective and consistent performance evaluation systems in place. Often, management takes the attitude of “I know good performance when I see it,” and gives regional and HQ leaders the leeway to make subjective judgments that are usually based on some objective criteria (i.e. sales targets, earnings, other “hard” data related to profitability) plus other quite subjective criteria (i.e. employee and customer complaints, legal or ethical calls or challenges, reputation, likeability, etc.). The problem with this general approach for the purposes of this study is that it lacks the rigor needed for statistical correlation analysis.
Defining Key Performance Indicators (leading to Performance Ratings)
The key to determining performance criteria is first to acknowledge that performance is likely based on multiple factors, such as financial performance + some other factors related to employee development + perhaps work quality + customer service metrics + others (?). That is, we need to break down performance into its component parts for this particular role across the organization.
To do this well, we propose using Subject-Matter Experts (SMEs) to brainstorm, collaborate and help us define the various elements of good performance; that is, Key Performance Indicators (KPIs) of success. This discussion is led by the facilitators and is a free-flow of ideas within a focus group format on-site and is usually accomplished within a 3-4 hour session.
In advance of the focus group session, selected SME’s should be advised to think carefully about how they, personally, measure performance currently, what might be a more ideal way to evaluate performance, and bring any sales and other financial metrics with them to the session to help with the discussion.
Page 33

The session will result in some consensus from the SME’s about KPI’s that consultants will take-away and fine-tune after the session and later present to the executive team as the performance data that will be used to collect performance ratings from the field for the group of incumbents included in the study.
The KPI formula is likely to be a weighted composite something like the following:
• Sales (define) = 60% of overall rating • Employee development (define) = 30% of overall rating • Quality / customer satisfaction (define) = 10% of overall rating
Total = 100%
The resulting KPIs will be used inserted into a table such as the following for collection of performance ratings:
Rating Description KPI formula (insert formula at the various levels) 95% Excellent (e.g. sales at 100% of target or above + X + Y) 85% Very good (e.g. sales at 90% of target + X + Y) 75% High average Etc. 70% Low average “ 65% Poor “
Harrison Assessments need roughly equal groups of incumbents in each rating group above to run the study.
Phase 2: HA Profiling and Input: Steps from Chart above summarized
1. Complete the HA questionnaire – Links are sent out by either LeadingRE or consultants with instructions on completing the questionnaire and completion date (typically 7 -10 days).
2. Enter the Data into the HATS System – Consultants work with Dr. Harrison on data collection leading to data analysis.
More about Step 2
This step is fairly routine. The communication to the participating incumbents is important to plan and phrase carefully so as to minimize suspicions about how the information will be used, where it will be stored, who will have access to it (including individual managers, executive management, etc.), etc. A decision needs to be made about whether to give participants a Harrison report in appreciation for their participation and for their own professional development. Reports that could be used for this if desired are those without numerical values, such as reports: How to Manage, Develop and Retain, Your Greatest Strengths, Summary and Keywords, and/or Career Development Report. Running reports in this phase incurs additional cost, so this decision needs to be worked out with the consultants prior to sending out links.
Page 34

The other activities in Step 2 are follow-up on incomplete or missing questionnaires and dealing with low consistency scores. These activities are generally shared between the company (LeadingRE) and consultants.
Phase 3: Analysis and Presentation: Steps from Chart summarized
1. Conduct Job Benchmarking Analysis and Findings 2. Presentation of Results
After meeting with the executive team and sharing the results of the study, the Job Success Formula will be ready to implement company-wide.
Page 35