Harnessing multiomic single cell analysis for immunology ...
14
Multiomic Cytometry Harnessing multiomic single cell analysis for immunology research Explore the power of Multiomic Cytometry
Transcript of Harnessing multiomic single cell analysis for immunology ...

Multiomic Cytometry
Harnessing multiomic single cell analysis for immunology researchExplore the power of Multiomic Cytometry
Harnessing multiomic single cell analysis for immunology research Harnessing multiomic single cell analysis for immunology research
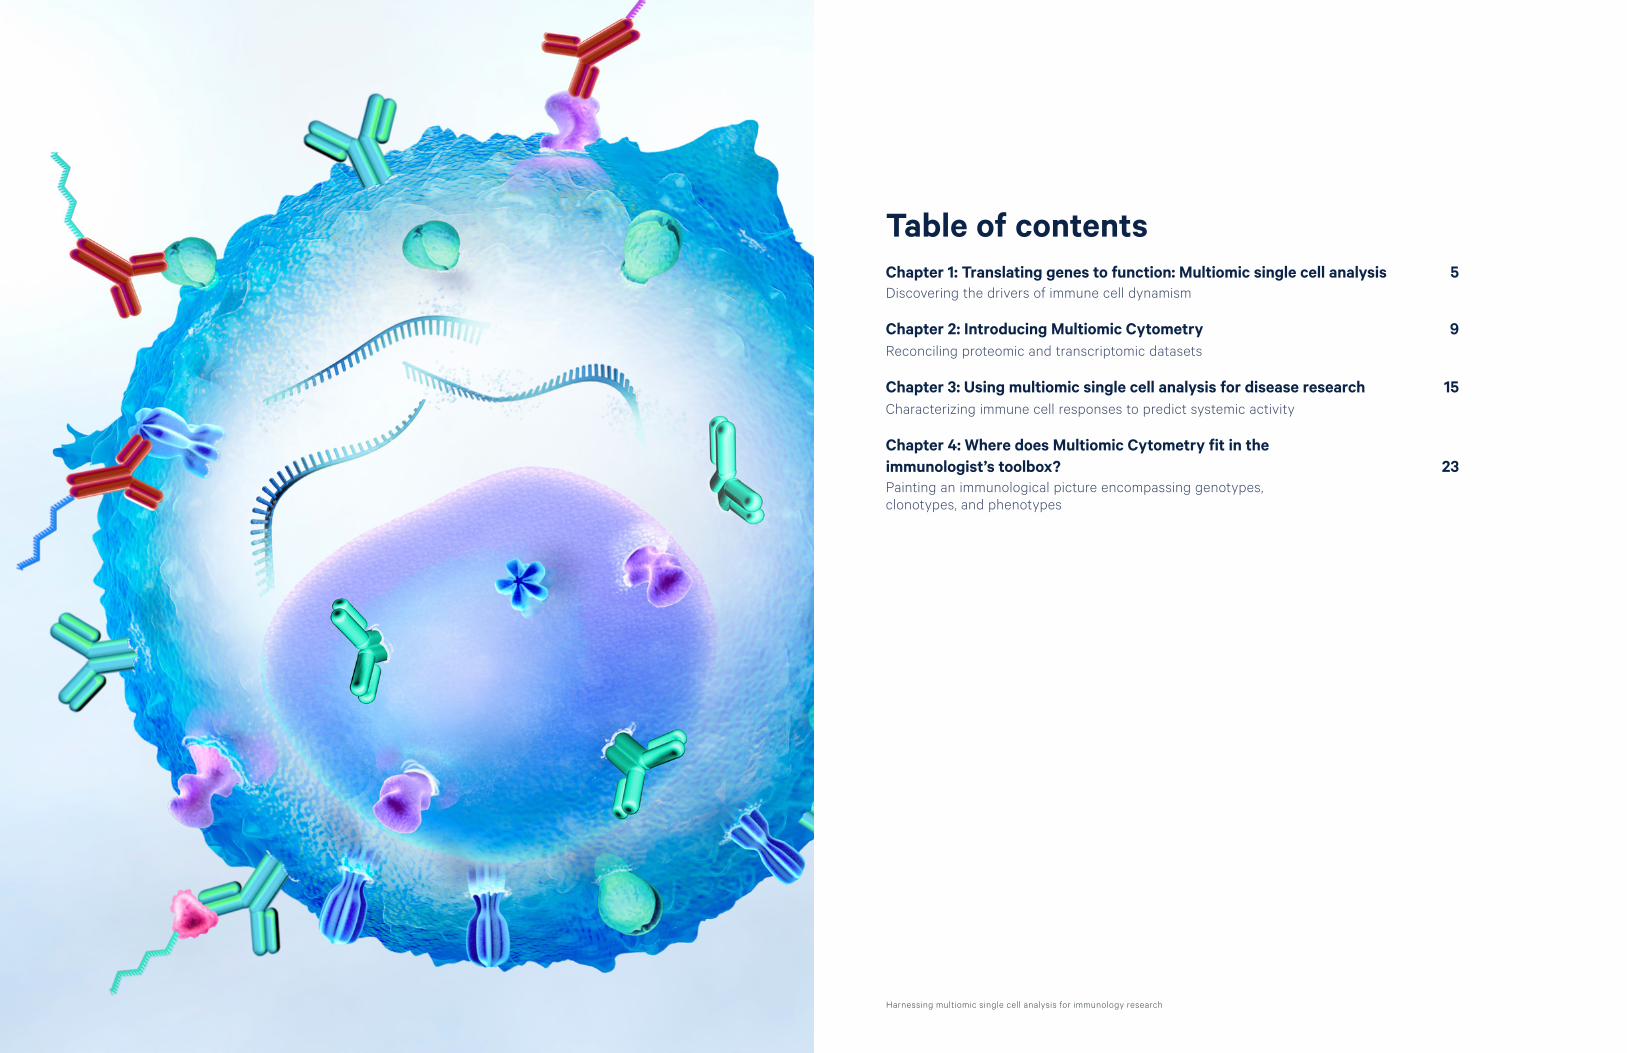
Table of contentsChapter 1: Translating genes to function: Multiomic single cell analysis 5Discovering the drivers of immune cell dynamism
Chapter 2: Introducing Multiomic Cytometry 9Reconciling proteomic and transcriptomic datasets
Chapter 3: Using multiomic single cell analysis for disease research 15Characterizing immune cell responses to predict systemic activity
Chapter 4: Where does Multiomic Cytometry fit in theimmunologist’s toolbox? 23Painting an immunological picture encompassing genotypes, clonotypes, and phenotypes

Harnessing multiomic single cell analysis for immunology research 5
Chapter 1
Translating genes to function: Multiomic single cell analysis
Immune cells possess incredible diversity and versatility, giving the immune system the flexibility that it needs to defend against a wide range of environmental and internal threats. This creates a population of cells that is highly heterogeneous genetically, phenotypically, and functionally (1,2). Single cell approaches have proven instrumental for capturing the nuances of immune cell trajectories in contrast to bulk assays (1). A vast array of single cell approaches now exist, ranging from protein-centric assays like high-parameter flow cytometry to deep genomic and transcriptomic sequencing (2). These approaches have demonstrated that considerable heterogeneity exists even in well-defined cellular subgroups, and continued advances in this area will help clarify and quantify immune system heterogeneity and reveal the processes that guide them (3). Understanding the dynamics and trajectories of these processes and how they can be modified to impact human health is a central goal of immunology (1).
Traditional immune cell cytometry Many of the foundational insights into immune cells and immune system functions came from protein expression–based cytometry. For decades, researchers leaned heavily upon flow cytometry for its ability to simultaneously interrogate multiple parameters on individual cells with relatively high throughput (2). Today, high-parameter cytometry using fluorescent conjugated antibodies can typically study ~25 different antigens at single cell resolution in a given experiment (1,2). The advent of mass cytometry, where heavy-metal isotopes are used instead of fluorophores, takes this number as high as 40 (2). Ultimately, while flow cytometry can profile cellular phenotypes, it cannot capture the underlying processes that drive protein expression, and therefore cannot encapsulate the full biological complexity present in immune cells (2).
7
Return to table of contents
Harnessing Multiomic Single Cell Analysis for Immunology Research6 10x Genomics
Next-generation sequencingImmune cell protein expression heterogeneity is driven by diversity at the DNA and RNA levels. For example, somatic recombination—a process that only occurs in T and B cells—allows T cells to generate 107 distinct T-cell receptors and B cells to do likewise for B-cell receptors (3). Researchers now have access to this genetic information thanks to next-generation sequencing (NGS). In particular, single cell RNA-sequencing (scRNA-seq) provides a way to augment existing protein-based profiling information and explore relationships between the transcriptome and the proteome.
Since publication of the first single cell whole transcriptome sequencing data in 2009, scRNA-seq technology has advanced dramatically. Originally limited to hundreds of cells, throughput has increased to tens of thousands of cells thanks to droplet-based microfluidics and nucleic acid barcoding (1,2). scRNA-seq offers a comprehensive and relatively unbiased measurement of cellular transcriptomes, allowing individual cells to be clustered based on genetic similarities to reveal novel transitional or endpoint populations (1,2).
References
1. Kunz DJ, et al. Immune cell dynamics unfolded by single-cell technologies. Front Immunol 9: 1435, 2018.
2. Gibellini L, et al. Single-cell approaches to profile the response to immune checkpoint inhibitors. Front Immunol 11: 490, 2020.
3. Proserpio V & Mahata B. Single-cell technologies to study the immune system.Immunology 147(2): 133–140, 2016.
4. Gomes T, et al. Immunology driven by large-scale single-cell sequencing. Trends Immunol 40(11): 1011–1021, 2019.
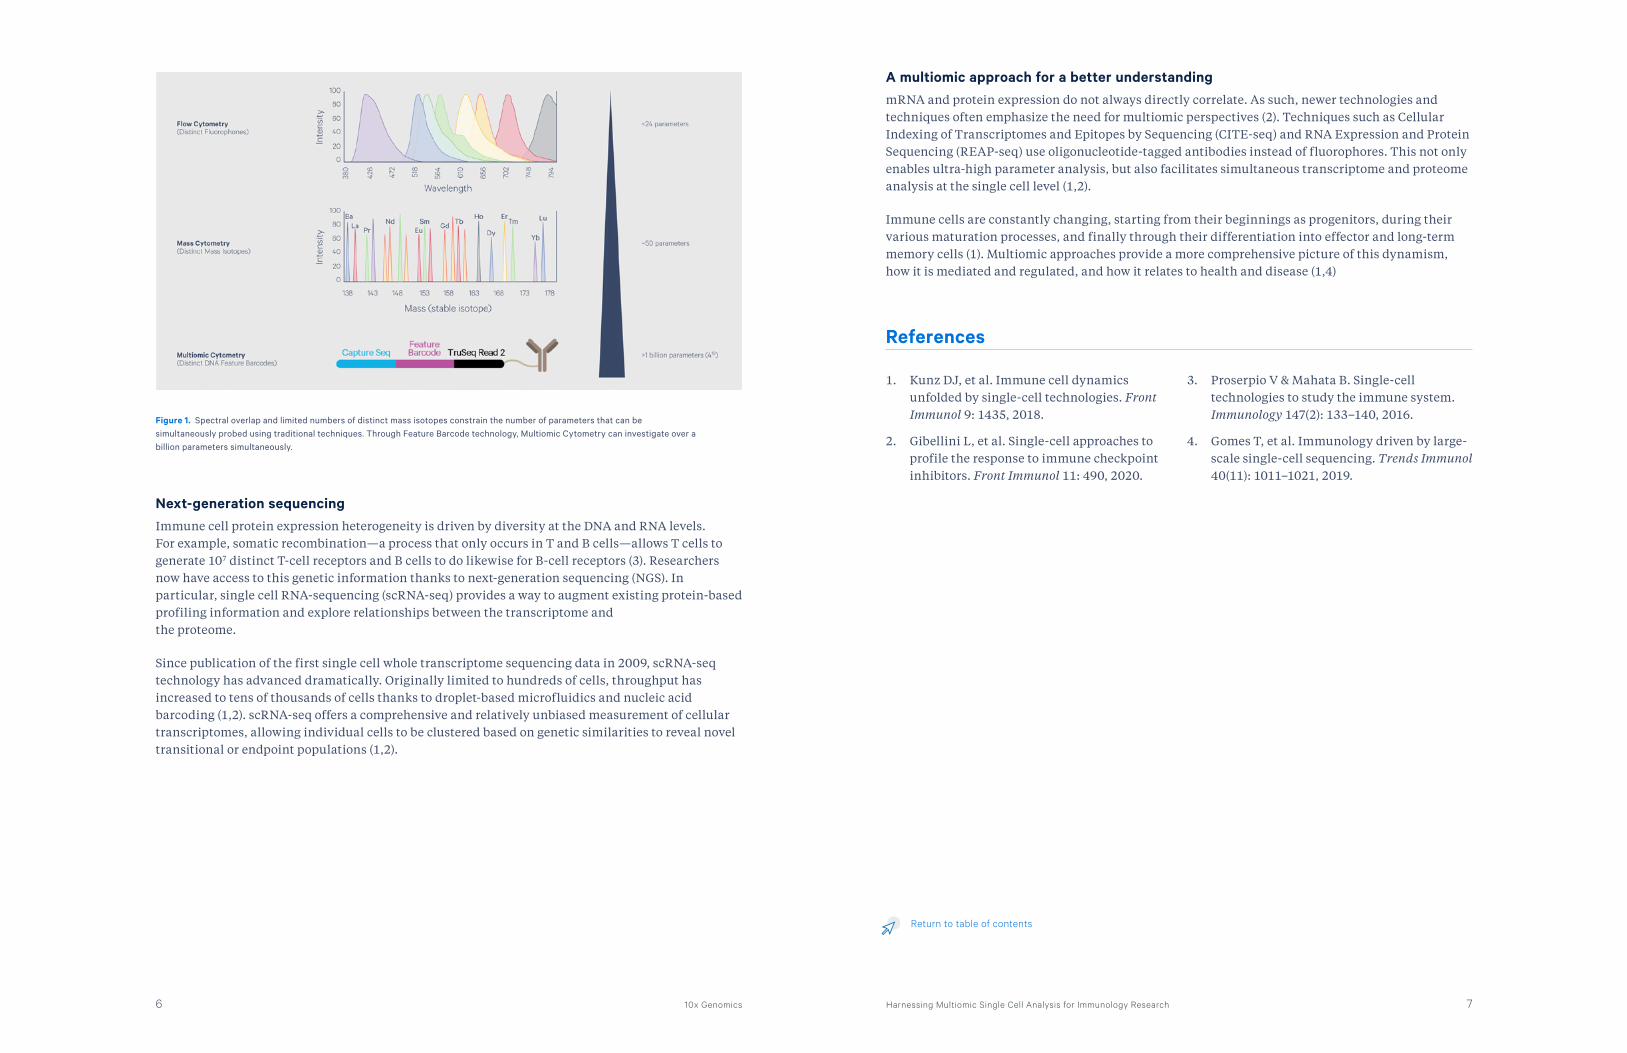
Figure 1. Spectral overlap and limited numbers of distinct mass isotopes constrain the number of parameters that can be simultaneously probed using traditional techniques. Through Feature Barcode technology, Multiomic Cytometry can investigate over a billion parameters simultaneously.
A multiomic approach for a better understanding mRNA and protein expression do not always directly correlate. As such, newer technologies and techniques often emphasize the need for multiomic perspectives (2). Techniques such as Cellular Indexing of Transcriptomes and Epitopes by Sequencing (CITE-seq) and RNA Expression and Protein Sequencing (REAP-seq) use oligonucleotide-tagged antibodies instead of fluorophores. This not only enables ultra-high parameter analysis, but also facilitates simultaneous transcriptome and proteome analysis at the single cell level (1,2).
Immune cells are constantly changing, starting from their beginnings as progenitors, during their various maturation processes, and finally through their differentiation into effector and long-term memory cells (1). Multiomic approaches provide a more comprehensive picture of this dynamism, how it is mediated and regulated, and how it relates to health and disease (1,4)

9Harnessing multiomic single cell analysis for immunology research8 10x Genomics
Chapter 2
Introducing Multiomic Cytometry
Properly reconciling proteomic and transcriptomic datasets is a challenge for immunologists. Bulk-level data is easier to integrate; the expression level of a given gene can be tethered to the abundance of the protein that it encodes. However, this association provides limited information about the underlying mechanisms responsible for the observed phenomenon. With this approach, it is impossible to pinpoint specific cell types being activated or to identify any potential compensatory reactions to the phenomenon of interest. In contrast, single cell data offers all of this information, but it is impossible to link proteomic and transcriptomic information from a given individual cell unless the two are captured simultaneously.
What is Multiomic Cytometry? Multiomic Cytometry combines antibody-based immunoassay principles with next-generation sequencing technology to generate proteomic and transcriptomic data simultaneously. Multiomic Cytometry allows researchers to better understand how gene-level changes manifest at the protein level, something that has proven vital for recombination-driven processes like T-cell receptor and B-cell receptor expression. Multiomic Cytometry is driven by 10x Genomics Feature Barcode technology, which has made the technique more accessible to researchers around the world.
How does Multiomic Cytometry work? Multiomic Cytometry, enabled by Feature Barcode technology from 10x Genomics, is a validated end-to-end workflow. In Multiomic Cytometry, cells are first incubated with antibodies conjugated to oligonucleotides. These oligonucleotides are read during downstream sequencing, and their presence and/or abundance serves as an analog for their corresponding proteins. This is similar to how antibody-conjugated fluorophores are used in flow cytometry and immunohistochemistry— fluorophore signal is detected and used as an indicator of protein abundance.

11Harnessing multiomic single cell analysis for immunology research10 10x Genomics
of heavy metal isotopes in existence (1). Even if a conjugated antibody or a specific protein is not available, scientists can create custom conjugations, either through services offered by life science companies or by using commercially available kits. All of this means that Multiomic Cytometry users can characterize the cells within their samples at greater depths and in more detail—a considerable advantage when it comes to unraveling complex immune mechanisms driven by immune cell heterogeneity and plasticity. Finally, ultra-high parameter cytometry enables unbiased discovery by enabling a broad analysis of the immune system with marker combinations not reliant on a priori knowledge or decisions.
Analyzing Multiomic Cytometry dataThe 10x Genomics Cloud Analysis platform is designed to make modern life science research more accessible by simplifying and accelerating single cell analysis. Cloud Analysis allows researchers to run a set of analysis pipelines on the 10x Genomics Cloud for each uploaded 10x dataset at no additional cost.1 Operating through a simple web interface, Cloud Analysis eliminates the need to spend time setting up infrastructure or learning advanced command line operations. The platform also creates output files for downstream analysis in standard formats. These can be visualized using 10x Genomics interactive visualization software Loupe Browser or other third-party software applications.
Within the Chromium Controller, an advanced microfluidics instrument, antibody-labeled cells are introduced to 10x Barcoded Gel Beads coated with millions of primer oligonucleotides containing capture primer sequences specifically designed to hybridize either cellular mRNAs or antibody-bound oligos. This results in the formation of GEMs (Gel Beads-in-emulsions), aqueous droplets containing cells, gel beads, and reverse transcription (RT) reagents surrounded by oil. GEMs are partitions, each containing a single cell and a single bead, that encapsulate each micro-reaction that occurs within the Chromium Controller. Because each partition, through its bead, contains a unique identifying barcode, downstream analysis can associate sequences with the GEM—and therefore the cell—that it came from. After partitioning, cells are lysed to release bound oligonucleotide-conjugated antibodies and intracellular mRNA. At the same time, the beads are dissolved to release their primer oligonucleotides, which can now hybridize with antibody-conjugated and cell-origin oligonucleotides for amplification. The processed GEMs are collected and undergo reverse transcription to generate cDNA, creating a single cell library that can be sequenced using a short-read sequencer and subsequently analyzed.
Greater capabilities lead to greater researchMultiomic Cytometry represents not just the logistical advantages from streamlining multiple workflows into one, but also a generational leap in the breadth and depth of information now accessible to immunologists. With Multiomic Cytometry, since oligonucleotide tags have essentially infinite sequence diversity, there is no limit on the number of parameters that can be investigated per experiment. By contrast, flow cytometry is limited by the number of fluorescent emission spectra that can be included before they begin overlapping, and mass cytometry is restricted by the number
Figure 2. Multiomic single cell analysis for immunology lets researchers access multiple types of information at once for hundreds to tens of thousands of single cells.
1 See our Billing support site page for details.
Figure 3. The Cloud Analysis platform streamlines and accelerates the interpretation of data generated from 10x Genomics assays.
13
Return to table of contents
Harnessing multiomic single cell analysis for immunology research12 10x Genomics
Loupe Browser is a desktop application that allows scientists to quickly identify cells of interest, determine genes that characterize clusters, and characterize or explore cellular subtypes and subgroups. Loupe Browser is fully compatible with both single cell gene expression data and Feature Barcode data on protein expression. Of specific interest to immunologists, Loupe Browser can overlay V(D)J clonotype information on top of single cell gene expression data. Finally, Loupe Browser makes sharing single cell data simple by allowing users to easily capture screenshots, save genes of interest, and export data tables.
“Multiomic Cytometry also enables scientists to simultaneously profile proteomic and transcriptomic information within the same cell on large scales—into the tens of thousands of individual cells—in relatively short timeframes. This gives them the direct ability to establish links between protein-based phenotypes and gene modulations, and to pinpoint these relationships to specific cellular phenotypes.”
How Multiomic Cytometry stacks upIt is always important to compare new innovations to previously established gold standard techniques, and Multiomic Cytometry is no exception. Several research groups have extensively compared Multiomic Cytometry–generated proteomic data to high-performance flow cytometry results, and found high consistency in terms of major cell types identified and expression levels for individual proteins (2,3). Along these lines, a recent study by Martin Prlic’s group at the University of Washington showed that Multiomic Cytometry using 10x Genomics Chromium reagent kits matched flow cytometry when it came to identifying immune cell subsets in human PMBC samples. Both datasets clearly contained low-abundance cell populations such as CD1c+ conventional dendritic cells and cells expressing the CD45 splice variants CD45RO and CD45RA—important T-cell subset delineators that cannot be distinguished through transcriptomic analysis alone (4).
Peeling away the unknowns surrounding immunity and diseaseThe ability to connect transcriptomic and proteomic data at a single cell level allows immunologists to better see how the immune system operates in health and disease. With the capacity to investigate more markers and parameters per experiment, Multiomic Cytometry unveils novel cell types and subtypes with key functions in diseases such as cancer (5,6). This information not only reveals new insights into the relationship between immune responses and disease progression, it also potentially provides new biomarkers with predictive and/or diagnostic value (7). Finally, Multiomic Cytometry is proving its worth in the fight against COVID-19 by helping researchers characterize how the immune system reacts to SARS-CoV-2 infection and determine how the nature of the response affects disease and symptom severity (8,9).
References
1. Stoeckius M, et al. Simultaneous epitope and transcriptome measurement in single cells. Nat Methods 14(9): 865–868, 2017.
2. Peterson VM, et al. Multiplexed quantification of proteins and transcripts in single cells. Nat Biotechnol 35(10): 936–939, 2017.
3. Gadalla R, et al. Validation of CyTOF against flow cytometry for immunological studies and monitoring of human cancer clinical trials. Front Oncol 9: 415, 2019.
4. Mair F, et al. A targeted multi-omic analysis approach measures protein expression and low-abundance transcripts on the single-cell level. Cell Rep 31(1): 107499, 2020.
5. Granja JM, et al. Single-cell multiomic analysis identifies regulatory programs in mixed-phenotype acute leukemia. Nat Biotechnol 37(12): 1458–1465, 2019.
6. Mimitou EP, et al. Multiplexed detection of proteins, transcriptomes, clonotypes and CRISPR perturbations in single cells. Nat Methods 16(5): 409–412, 2019.
7. Wu TD, et al. Peripheral T cell expansion predicts tumour infiltration and clinical response. Nature 579(7798): 274–278, 2020.
8. Arunachalam PS, et al. Systems biological assessment of immunity to mild versus severe COVID-19 infection in humans. Science 369(6508): 1210–1220, 2020.
9. Zhao Y, et al. Clonal expansion and activation of tissue-resident memorylike Th17 cells expressing GM-CSF in the lungs of severe COVID-19 patients. Sci Immunol 6(56): eabf6692, 2021.

15Harnessing multiomic single cell analysis for immunology research14 10x Genomics
Chapter 3
Using multiomic single cell analysis for disease researchMultiomic single cell analysis not only ties the genetic and protein aspects of physiological mechanisms together, it helps immunologists better understand how immune system responses to stimuli can result in pathogenesis. Researchers have used multiomic single-cell analysis in various key pathology areas—including infectious disease, cancer, and autoimmune disease—in efforts to characterize cell types that drive pathology, determine how immune cells respond to therapeutic approaches, and identify ways to predict immune system activity.
How the immune system drives COVID-19 clinical severityIndividuals infected with SARS-CoV-2 present a wide range of clinical phenotypes, ranging from completely asymptomatic to severe disease requiring hospitalization. The exact reasons for this broad spectrum of outcomes are unclear. However, the nature of the immune response against SARS-CoV-2 likely plays a large role, and understanding the immunological mechanisms underlying COVID-19 clinical presentation is crucial for designing therapeutic strategies (1).
The role of immune cells in tumor microenvironments (TME) is as complex as the immune system itself (1). While some immune cells play a critical role in immunosurveillance, or rejection of cells recognized as malignant tumor cells, chronic inflammation has been linked to the promotion of tumor cell growth, survival, and angiogenesis (2). Our growing understanding of the communication between tumor and immune cells, such as immune checkpoint pathways, underlying these diverse functions has been critical to revolutionizing cancer treatment with immunotherapies.
With this aim, a multi-center collaborative study headed by Bali Pulendran at Stanford University used a multiomic approach to examine immune responses in 76 COVID-19 patients and 69 healthy individuals from Hong Kong and Atlanta. Their work, published in September 2020 in Science, employed single cell RNA-sequencing (scRNA-seq) alongside an array of single cell and bulk assays to find common immune mechanisms especially prevalent in COVID-19 patients (1).

17Harnessing multiomic single cell analysis for immunology research16 10x Genomics
Characterizing a distinct and targetable responseAltogether, these findings revealed the downregulation of genes encoding IFN and pro-inflammatory cytokines in COVID-19 patients, which aligned well with mass cytometric and flow cytometric data. It also highlighted elevated ISG expression linked to the presence of plasma IFN-α, consistent with bulk RNA sequencing analysis and high-sensitivity ELISA. Finally, it showed impaired HLA-DR gene and protein expression linked to upregulation of S100A12, a finding also supported by mass cytometry. These results, in tandem with data from other cytometric and immunoassays, present a picture of a distinctive inflammatory program characterized by tissue-released cytokines coupled with peripheral innate immune system suppression. These results also highlight molecules such as EN-RAGE or TNFSF14, as well as their receptors, that could present therapeutic targets against COVID-19 (1).
Peripheral T-cell clonotype can predict tumor infiltration and clinical responseT-cell behavior in cancer is critical to tumor development and progression as well as the efficacy of various therapeutic approaches. However, relatively little is known about the origin and fate of T cells in tumor immunity. Jane Grogan’s research team recently addressed that topic in an article published in Nature. They performed deep single cell RNA and T-cell receptor (TCR) sequencing to profile T-cell and TCR populations in tumors, normal adjacent tissue (NAT), and peripheral blood, sequencing 330 million mRNA transcripts in 141,623 T cells from 14 treatment-naïve patients across four different types of cancer (2).
Reconciling T-cell clonotype with phenotype using single cell sequencingComplementarity determining regions (CDRs) on T-cell receptors form antigen-binding sites, and are therefore crucial to T-cell functional heterogeneity. To study TCR diversity in T cells from cancer patients, Grogan’s team performed single cell TCR sequencing (scTCR-seq) using 10x Genomics technology. They first enriched cellular samples for T cells using fluorescence-activated cell sorting (FACS), and then further enriched the resulting amplified DNA for V, D, and J gene segments prior to library construction (2).
Using traditional cytometry to identify immune behavior Pulendran’s group used a double-pronged approach. First, they used mass cytometry and flow cytometry to identify which cell types responded most to SARS-CoV-2 infection, along with a multiplexed immunoassay for detecting key cytokines (1). Mass cytometric analysis of peripheral mononuclear blood cells (PMBCs) showed elevated plasmablast and effector CD8 T-cell populations, as well as fewer plasmacytoid dendritic cells (pDC), in COVID-19-infected patients relative to age/sex-matched healthy controls. Based on linear modeling, the study authors determined that these three features could be used to distinguish healthy from infected individuals (1).
Mass cytometry also revealed that the mTOR activator pS6 (phosphorylated ribosomal protein S6) was downregulated in COVID-19 patients, indicating that interferon-α (IFN-α) production from pDCs was impaired. Indeed, flow cytometry confirmed lower pDC IFN-α and TNF-α production in infected individuals when the cells were stimulated ex vivo with toll-like receptor (TLR) ligands. Flow cytometry also uncovered impaired responses to TLR ligand stimulation in myeloid dendritic cells (mDCs) and CD14+ monocytes. That said, multiplex cytokine screening found a broad spectrum of inflammatory cytokines in the plasma of infected patients. In particular, three proteins—TNFSF14, EN-RAGE, and oncostatin M—were significantly enhanced in COVID-19 patients and strongly correlated with clinical severity (1).
Finding the drivers of the anti-SARS-CoV-2 immune responseWith this information as a foundation, Pulendran’s team next used the 10x Genomics Chromium system to investigate the molecular and cellular processes leading to this distinctive response. After quality control, the authors obtained a final dataset containing 57,669 high-quality transcriptomes, sequencing a median of ~4,781 cells from each patient sample and 1,803 individual genes per cell. They identified several clusters that appeared mainly in COVID-19 patients, including populations of plasmablasts, platelets, red blood cells, granulocytes, T cells, and monocytes. Interestingly, T-cell and monocyte clusters characterized by the expression of interferon-stimulated genes (ISGs) emerged only in COVID-19 patient samples; this was confirmed by bulk RNA sequencing. When the researchers looked at differentially expressed genes (DEGs) between COVID-19 patients and healthy controls in single cells, they found that ISG upregulation in monocytes and DCs in infected individuals drove the induction of antiviral gene pathways (1).
However, the same analysis showed no IFN-α and -β gene expression in any cell type and modest IFN-y expression only in T and NK cells—a finding that was consistent with flow cytometric data showing impaired IFN production in pDCs and myeloid cells and confirmed by bulk RNA sequencing. This raised the possibility that tissue-origin IFNs may be circulating in the plasma and inducing ISG expression in PBMCs, which was confirmed by high-sensitivity ELISA. Importantly, there was a strong temporal correlation between ISG expression levels and ELISA-obtained IFN-α plasma concentrations (1). Analysis also revealed significant decreases in the expression of myeloid cell antigen presentation genes and proteins in infected individuals. In particular, decreased monocyte and mDC expression of human leukocyte antigen class DR (HLA-DR), a key inducer of T-helper cell responses, was most pronounced in subjects with severe COVID-19 infection. Furthermore, HLA-DR downregulation was linked with upregulation of S100A12, the gene encoding EN-RAGE, showing further alignment between CITE-seq and mass cytometry results (1).
Systems biological assessment of immunity to mild versus severe COVID-19 infection in humans
In this study, the authors analyzed COVID-19 patients and healthy individuals to identify distinctions in immune response between the two groups that could be related to disease severity and clinical parameters. Their work indicates that COVID-19 patients present a distinctive inflammatory program characterized by tissue-released cytokines coupled with peripheral innate immune system suppression.
Read more about this study

19Harnessing multiomic single cell analysis for immunology research18 10x Genomics
scTCR-seq yielded information for at least one α- or β-chain CDR3 in 99,788 individual cells. This allowed the researchers to group these cells into 56,975 distinct clonotypes. Clonotypes were categorized as “dual-expanded”—present in both the tumor and surrounding NAT—or “singletons”—found in only one compartment. Looking at the abundance of individual clonotypes, the authors uncovered a diverse array of clonal expansion behaviors. Moreover, they learned that dual-expansion clones were frequently found in peripheral blood (2).
Grogan and her research group further explored how TCR heterogeneity affected T-cell function by using scRNA-seq to generate transcriptional profiles of individual T cells. scRNAseq data allowed them to cluster T cells into T effector cells, T effector memory cells, and regulatory T cells, as well as three resident memory T-cell subclusters and several additional clusters without matching published reference gene signatures, which were subsequently characterized through gene set enrichment analysis. By linking T-cell phenotypes with the blood expansion patterns of their parent clones, the authors found that T effector memory cells and regulatory T cells in tumors or blood—but not the NAT—shared clonotypes with blood-expanded T effector cell clonal lineages. This indicates that blood-expanded T effector cell differentiation may yield numerous T-cell subtypes in blood and tumors (2).
A new understanding of T-cell behavior and a new way to track itCombining scTCR-seq and scRNA-seq showed that T cells in the tumor are supplied from peripheral sources, and the properties of these cells may determine treatment efficacy. Importantly, this model represents an alternative to the idea that immune checkpoint blockade reverses an “exhausted” state in chronically stimulated T cells. Instead, the authors suggest that checkpoint inhibition exerts its clinical benefits by directly acting on effector T cells or other non-exhausted T cells, or by promoting the production or effectiveness of committed anti-tumoral T cells—but only in patients possessing an
ongoing T-cell response and continued replenishment of tumor-infiltrating lymphocytes. The link established by this study between peripheral and tumoral T-cell populations potentially offers clinicians a way to take liquid biopsies for characterizing tumor T cells without invasive procedures (2).
Linking immune response signatures with vaccine responsiveness and disease activityImmune responses, whether to vaccination or disease, vary widely between individuals. Beneficial and deleterious immune responses overlap, as some vaccine-elicited protective mechanisms also mediate disease activity in autoimmune disease. John Tsang and his research group from the NIH Center for Human Immunology hypothesized that characterizing the elements that drive these common mechanisms would create a “signature” that could predict immune system responsiveness and be manipulated for therapeutic benefit (3).
Tsang’s team had previously found a CD20+CD38++ B-cell signature (CBSig) that predicted antibody response to influenza vaccination (4). From there, they identified ten genes that correlated with CD20+CD38++ B-cell frequency, forming a transcriptional surrogate signature (TGSig) documented in a study published in Nature Medicine. TGSig, like CBSig, also showed good predictive power for the immune response to influenza vaccination, as well as yellow fever vaccination. Interestingly, TGSig also predicted disease activity in lupus patients with plasmablast-associated flares. In the same way, independently derived gene signatures based on transcriptomic datasets from lupus patients (SLE-Sig and IFN-I-DCact) predicted influenza vaccine responses (3).
Multiomic Cytometry links gene signatures with cells of interestThe researchers proceeded to investigate what T cells were responsible for these gene signatures. After bulk RNA sequencing did not reveal a link between CD20+CD38++ B cell–expressed genes of interest and TGSig or SLE-Sig, Tsang’s team simultaneously profiled protein and mRNA of PMBCs from healthy individuals presenting either a high or low response to influenza vaccination. They performed ultra high-parameter molecular cytometry on 53,201 single cells, obtaining transcriptomes and profiling 82 surface proteins for each. After clustering based on surface marker expression, the authors evaluated TGSig and SLE-Sig differences between high and low responders within cell clusters. Significant differences in TGSig gene average expression were found in pDCs, while SLE-Sig gene expression was elevated in a broad number of cell types (3).
These findings led Tsang’s team to propose a model of heightened pDC activation leading to elevated type I IFN production. In turn, broad systemic exposure to IFN would result in the observed changes in the genes comprising SLE-Sig. Furthermore, activated pDCs activate T cells that then stimulate B cells via CD40L, a mechanism that Tsang and his researchers confirmed by deriving a CD40
Peripheral T cell expansion predicts tumor infiltration and clinical response
In this study, the authors investigated T-cell clonotype behavior in cancer patients. They used deep single cell sequencing of both RNA and T-cell receptors to profile T-cell populations in cancer patients' tumors, normal adjacent tissue, and peripheral blood. Their work indicates that T cells in the tumor are supplied from peripheral sources, and the properties of these cells may determine treatment efficacy.
Read more about this study

21
Return to table of contents
Harnessing multiomic single cell analysis for immunology research20 10x Genomics
activation gene signature (CD40act) from already existing datasets (3,5,6). By applying this signature to their data, the authors found that CD40act was, as hypothesized, increased in high responder B cells. In addition, B-cell CD40 activation status also correlated with CD20+CD38++ B-cell frequency, and removing both the CD4+ memory and CD8+ naive T-cell clusters rendered TGSig no longer informative of the immune response (3).
Predicting—and perhaps modulating—immune responses based on gene signaturesAll of this indicates that although TGSig is only a ten gene signature derived originally based on the CD20+CD38++ B-cell population, it can capture the responsiveness-predicting states of multiple other cell subsets in peripheral blood, including T cells. This study not only characterizes a baseline state that helps predict immune responses, it also raises the prospect that modulating such immune baseline states may improve vaccine responsiveness and mitigate undesirable autoimmune disease activity (3).
References
1. Arunachalam PS, et al. Systems biological assessment of immunity to mild versus severe COVID-19 infection in humans. Science 369(6508): 1210–1220, 2020.
2. Wu TD, et al. Peripheral T cell expansion predicts tumour infiltration and clinical response. Nature 579(7798): 274–278, 2020.
3. Kotliarov Y, et al. Broad immune activation underlies shared set point signatures for vaccine responsiveness in healthy individuals and disease activity in patients with lupus. Nat Med 26: 618–629, 2020.
4. Tsang JS, et al. Global analyses of human immune variation reveal baseline predictors of postvaccination responses. Cell 157(2): 499–513, 2014.
5. Gricks CS, et al. Differential regulation of gene expression following CD40 activation of leukemic compared to healthy B cells. Blood 104(13): 4002–9, 2004.
6. Shimabukuro-Vornhagen A, et al. Inhibition of protein geranylgeranylation specifically interferes with CD40-dependent B cell activation, resultingin a reduced capacity to induce T cell immunity. J Immunol 193(10): 5294–305, 2014.
Broad immune activation underlies shared set point signatures for vaccine responsiveness in healthy individuals and disease activity in patients with lupus
In this study, the authors looked at why vaccination and disease responses vary widely across individuals. They found baseline blood transcriptional signatures predictive of antibody responses to both pathogenic and vaccination stimuli. These signatures also correlated with disease activity in patients with systemic lupus erythematosus with plasmablast-associated flares. Their work suggests that modulating these immune baseline states may improve vaccine responsiveness and mitigate autoimmune disease activity.
Read more about this study

23Harnessing multiomic single cell analysis for immunology research22 10x Genomics
Chapter 4
Where does Multiomic Cytometry fit in the immunologist’s toolbox?
Cytometric data is important for characterizing physiological and pathological immune function. However, both protein- and genetic-level information is necessary to understand the mechanisms driving immune responses and identify predictive indicators for immune system behavior. Traditionally, researchers turned to different techniques for protein-level and genetic-level data. However, not only is this resource and time intensive, but it was impossible to pair protein and gene data at the single cell level.
An accessible workflow to make the most out of your experiment Multiomic Cytometry offers the capacity to acquire proteomic and transcriptomic data simultaneously. This not only allows researchers to tether together protein and genetic information at single cell resolution, but also allows them to do so for tens of thousands of cells at a time. Multiomic Cytometry facilitates the coalescence of disparate cytometric and sequencing workflows together into something more integrated, seamless, and simple. The end result is something that gives scientists access to more in-depth information with less bias, and allows them to reconcile immune cell phenotypic dynamism with clonotypic presentations (1,2).
In order for Multiomic Cytometry to fully recognize its potential, it must be accessible. As mentioned earlier, a comprehensive library of Multiomic Cytometry–compatible oligonucleotide- or DNA-conjugated antibodies is commercially available from BioLegend®. These TotalSeqTM antibodies are categorized based on their compatibility with specific protocols, whether generic applications involving the simultaneous detection of protein and mRNA or 10x Genomics–specific workflows. BioLegend TotalSeqTM antibodies enable experiments featuring tremendous amounts of multiplexing: a recent study used TotalSeqTM and 10x Genomics Chromium technology to profile 192 surface protein markers simultaneously in PBMCs from COVID-19 patients—while also capturing transcriptomic and TCR/BCR clonotype information at the same time (3)!

25
Return to table of contents
Harnessing multiomic single cell analysis for immunology research24 10x Genomics
References
1. Kunz DJ, et al. Immune cell dynamics unfolded by single-cell technologies. Front Immunol 9: 1435, 2018.
2. Wu TD, et al. Peripheral T cell expansion predicts tumour infiltration and clinical response. Nature 579(7798): 274–278, 2020.
3. Su Y, et al. Multi-omics resolves a sharp disease-state shift between mild and moderate COVID-19. Cell 183(6): 1479–1495.e20, 2020.
Additionally, researchers with trusted homebrewed or pre-validated antibodies for rare targets can create custom oligo-conjugated antibodies compatible with the 10x Genomics workflows. Here, scientists can turn to BioLegend’s custom conjugation services or perform their own custom conjugations using Abcam’s 5’ Feature Barcode Antibody Conjugation Kit - Lightning-Link®, which contains both the necessary reagents and oligos for custom conjugation.
An integral part of a flow cytometry core laboratoryCell-sorting technologies like fluorescence-activated cell sorting (FACS) link well with Multiomic Cytometry. The ability to isolate purified cell populations for subsequent analysis helps researchers attain increased sample sizes and depth of data for rare cellular phenotypes or subsets. As a result, many flow cytometry core laboratories now also maintain and operate Chromium technology alongside flow cytometers and FACS instrumentation. Having Chromium technology within a flow cytometry core facility makes it possible to sort, barcode, sequence, and analyze a sample within the same room, using a largely-automated workflow.
Painting a more complete pictureMultiomic Cytometry not only offers a high-resolution view of immune cell heterogeneity and dynamism, it also generates data that pairs well with data from other -omics centered on cellular function such as secretomics and metabolomics. Altogether, immunologists now have the tools to paint a picture that encompasses cellular genotypes, clonotypes, and both marker-based and function-based phenotypes. It is this depth of information that will give them what they need to answer key questions surrounding cancer, infectious disease, and other major health issues involving the immune system.
Figure 4. Multiomic Cytometry allows researchers to profile cells in genomic, transcriptomic, proteomic, and functional contexts. This depth of information enables insights into the mechanisms underlying health and disease.

ResourcesImmunology Gateway 10xgenomics.com/s/immunology-gateway
Multiomic Cytometry 10xgenomics.com/products/multiomic-cytometry
Essential Guide Download the guide
Immunology Applications 10xgenomics.com/research-areas/immunology
Contact us 10xgenomics.com | [email protected] © 2021 10x Genomics, Inc. FOR RESEARCH USE ONLY. NOT FOR USE IN DIAGNOSTIC PROCEDURES.LIT000140 - Rev A - eBook - Harnessing multiomic single cell analysis for immunology research