Harmful Algal Bloom Action Plan Putnam Lake · for swimming, fishing and boating. In addition,...
77
www.dec.ny.gov HARMFUL ALGAL BLOOM ACTION PLAN PUTNAM LAKE
Transcript of Harmful Algal Bloom Action Plan Putnam Lake · for swimming, fishing and boating. In addition,...

www.dec.ny.gov
HARMFUL ALGAL BLOOM ACTION PLAN PUTNAM LAKE
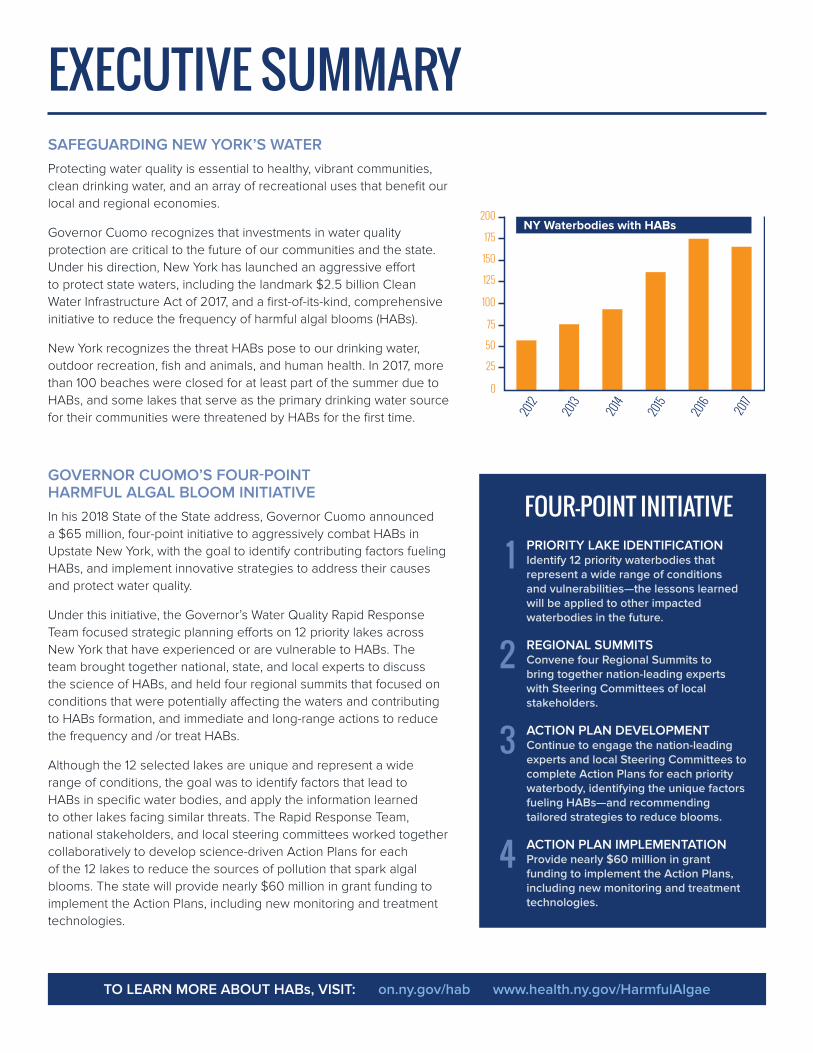
EXECUTIVE SUMMARYSAFEGUARDING NEW YORK’S WATER Protecting water quality is essential to healthy, vibrant communities, clean drinking water, and an array of recreational uses that benefit our local and regional economies.
Governor Cuomo recognizes that investments in water quality protection are critical to the future of our communities and the state. Under his direction, New York has launched an aggressive effort to protect state waters, including the landmark $2.5 billion Clean Water Infrastructure Act of 2017, and a first-of-its-kind, comprehensive initiative to reduce the frequency of harmful algal blooms (HABs).
New York recognizes the threat HABs pose to our drinking water, outdoor recreation, fish and animals, and human health. In 2017, more than 100 beaches were closed for at least part of the summer due to HABs, and some lakes that serve as the primary drinking water source for their communities were threatened by HABs for the first time.
GOVERNOR CUOMO’S FOUR-POINT HARMFUL ALGAL BLOOM INITIATIVE In his 2018 State of the State address, Governor Cuomo announced a $65 million, four-point initiative to aggressively combat HABs in Upstate New York, with the goal to identify contributing factors fueling HABs, and implement innovative strategies to address their causes and protect water quality.
Under this initiative, the Governor’s Water Quality Rapid Response Team focused strategic planning efforts on 12 priority lakes across New York that have experienced or are vulnerable to HABs. The team brought together national, state, and local experts to discuss the science of HABs, and held four regional summits that focused on conditions that were potentially affecting the waters and contributing to HABs formation, and immediate and long-range actions to reduce the frequency and /or treat HABs.
Although the 12 selected lakes are unique and represent a wide range of conditions, the goal was to identify factors that lead to HABs in specific water bodies, and apply the information learned to other lakes facing similar threats. The Rapid Response Team, national stakeholders, and local steering committees worked together collaboratively to develop science-driven Action Plans for each of the 12 lakes to reduce the sources of pollution that spark algal blooms. The state will provide nearly $60 million in grant funding to implement the Action Plans, including new monitoring and treatment technologies.
FOUR-POINT INITIATIVEPRIORITY LAKE IDENTIFICATION Identify 12 priority waterbodies that represent a wide range of conditions and vulnerabilities—the lessons learned will be applied to other impacted waterbodies in the future.
REGIONAL SUMMITS Convene four Regional Summits to bring together nation-leading experts with Steering Committees of local stakeholders.
ACTION PLAN DEVELOPMENT Continue to engage the nation-leading experts and local Steering Committees to complete Action Plans for each priority waterbody, identifying the unique factors fueling HABs—and recommending tailored strategies to reduce blooms.
ACTION PLAN IMPLEMENTATION Provide nearly $60 million in grant funding to implement the Action Plans, including new monitoring and treatment technologies.
1
2
3
4
200
150
125
100
75
50
25
0
175NY Waterbodies with HABs
2012
2017
2016
2015
2014
2013
TO LEARN MORE ABOUT HABs, VISIT: on.ny.gov/hab www.health.ny.gov/HarmfulAlgae
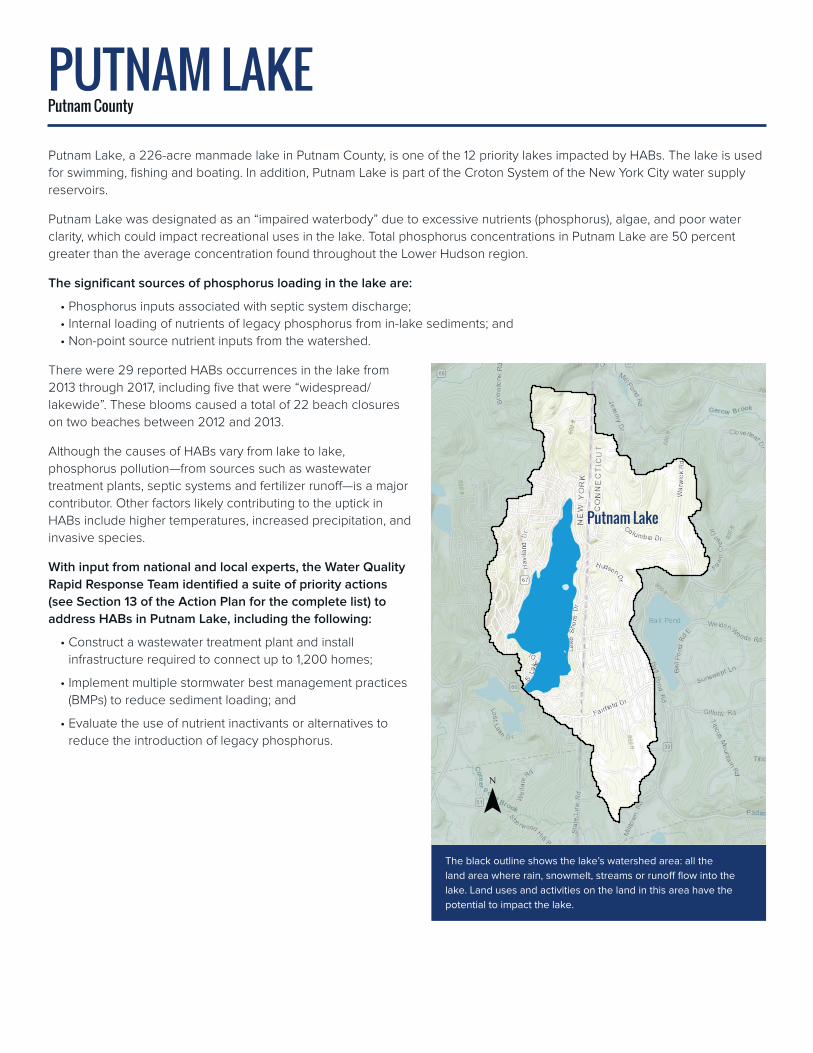
Putnam Lake, a 226-acre manmade lake in Putnam County, is one of the 12 priority lakes impacted by HABs. The lake is used for swimming, fishing and boating. In addition, Putnam Lake is part of the Croton System of the New York City water supply reservoirs.
Putnam Lake was designated as an “impaired waterbody” due to excessive nutrients (phosphorus), algae, and poor water clarity, which could impact recreational uses in the lake. Total phosphorus concentrations in Putnam Lake are 50 percent greater than the average concentration found throughout the Lower Hudson region.
The significant sources of phosphorus loading in the lake are:
• Phosphorus inputs associated with septic system discharge;• Internal loading of nutrients of legacy phosphorus from in-lake sediments; and• Non-point source nutrient inputs from the watershed.
There were 29 reported HABs occurrences in the lake from 2013 through 2017, including five that were “widespread/lakewide”. These blooms caused a total of 22 beach closures on two beaches between 2012 and 2013.
Although the causes of HABs vary from lake to lake, phosphorus pollution—from sources such as wastewater treatment plants, septic systems and fertilizer runoff—is a major contributor. Other factors likely contributing to the uptick in HABs include higher temperatures, increased precipitation, and invasive species.
With input from national and local experts, the Water Quality Rapid Response Team identified a suite of priority actions (see Section 13 of the Action Plan for the complete list) to address HABs in Putnam Lake, including the following:
• Construct a wastewater treatment plant and install infrastructure required to connect up to 1,200 homes;
• Implement multiple stormwater best management practices (BMPs) to reduce sediment loading; and
• Evaluate the use of nutrient inactivants or alternatives to reduce the introduction of legacy phosphorus.
PUTNAM LAKEPutnam County
The black outline shows the lake’s watershed area: all the land area where rain, snowmelt, streams or runoff flow into the lake. Land uses and activities on the land in this area have the potential to impact the lake.
¯
Putnam Lake

NEW YORK STATE RESOURCES
Drinking Water Monitoring and Technical Assistance:
The state provides ongoing technical assistance for public water suppliers to optimize drinking water treatment when HABs and toxins might affect treated water. The U.S. EPA recommends a 10-day health advisory level of 0.3 micrograms per liter for HAB toxins, called microcystins, in drinking water for young children.
Public Outreach and Education:
The Know It, Avoid It, Report It campaign helps educate New Yorkers about recognizing HABs, taking steps to reduce exposure, and reporting HABs to state and local agencies. The state also requires regulated beaches to close swimming areas when HABs are observed and to test water before reopening.
Research, Surveillance, and Monitoring:
Various state agencies, local authorities and organizations, and academic partners are working together to develop strategies to prevent and mitigate HABs. The state tracks HAB occurrences and illnesses related to exposure.
Water Quality and Pollution Control:
State laws and programs help control pollution and reduce nutrients from entering surface waters. State funding is available for municipalities, soil and water conservation districts, and non-profit organizations to implement projects that reduce nutrient runoff.
NEW YORK’S COMMITMENT TO PROTECTING OUR WATERS FROM HABS
New York is committed to addressing threats related to HABs, and will continue to monitor conditions in Putnam Lake while working with researchers, scientists, and others who recognize the urgency of action to protect water quality.
Governor Cuomo is committed to providing nearly $60 million in grants to implement the priority actions included in these Action Plans, including new monitoring and treatment technologies. The New York State Water Quality Rapid Response Team has established a one-stop shop funding portal and stands ready to assist all partners in securing funding and expeditiously implementing priority projects. A description of the various funding streams available and links for applications can be found here: https://on.ny.gov/HABsAction.
This Action Plan is intended to be a ‘living document’ for Putnam Lake and interested members of the public are encouraged to submit comments and ideas to [email protected] to assist with HABs prevention and treatment moving forward.
Pea soup appearance
Floating dots or clumps
Spilled paint appearance
Streaks on the water’s surface
CONTACT WITH HABs CAN CAUSE HEALTH EFFECTS
Exposure to HABs can cause diarrhea, nausea, or vomiting; skin, eye or throat irritation; and allergic
reactions or breathing difficulties.
PUTNAM LAKE CONTINUED

1 | HABS ACTION PLAN - PUTNAM LAKE
Contents List of Tables ................................................................................................................... 3
List of Figures .................................................................................................................. 3
1. Introduction ................................................................................................................. 5
1.1 Purpose .......................................................................................................... 5
1.2 Scope, Jurisdiction and Audience ................................................................... 5
1.3 Background ..................................................................................................... 6
2. Lake Background ........................................................................................................ 7
2.1 Geographic Location ....................................................................................... 7
2.2 Basin Location ................................................................................................ 7
2.3 Morphology ..................................................................................................... 8
2.4 Hydrology ........................................................................................................ 9
2.5 Lake Origin ..................................................................................................... 9
3. Designated Uses ......................................................................................................... 9
3.1 Water Quality Classification – Lake and Major Tributaries .............................. 9
3.2 Potable Water Uses ...................................................................................... 10
3.3 Public Bathing Uses ...................................................................................... 12
3.4 Recreation Uses ........................................................................................... 12
3.5 Fish Consumption/Fishing Uses ................................................................... 13
3.6 Aquatic Life Uses .......................................................................................... 13
4. User and Stakeholder Groups ................................................................................... 13
5. Monitoring Efforts ...................................................................................................... 14
5.1 Lake Monitoring Activities ............................................................................. 14
5.2 Tributary Monitoring Activities ....................................................................... 15
6. Water Quality Conditions ........................................................................................... 15
6.1 Physical Conditions ....................................................................................... 16
6.2 Chemical Conditions ..................................................................................... 19
6.3 Biological Conditions ..................................................................................... 24
6.4 Other Conditions ........................................................................................... 26
7. Summary of HABs ..................................................................................................... 27
7.1 HABs History ................................................................................................ 28

2 | HABS ACTION PLAN - PUTNAM LAKE
7.2 Drinking Water and Swimming Beach HABs History .................................... 32
8. Waterbody Assessment ............................................................................................ 34
8.1 WI/PWL Assessment .................................................................................... 34
8.2 Source Water Protection Program (SWPP) .................................................. 35
8.3 CSLAP Scorecard ......................................................................................... 35
9. Conditions triggering HABs ....................................................................................... 36
10. Sources of Pollutants .............................................................................................. 39
10.1 Land Uses ..................................................................................................... 39
10.2 External Pollutant Loadings .......................................................................... 42
10.3 Internal Pollutant Loadings ........................................................................... 43
10.4 Summary of Priority Land Uses and Land Areas .......................................... 43
11. Lake Management / Water Quality Goals ................................................................ 43
12. Summary of Management Actions to Date .............................................................. 44
12.1 Local Management Actions ........................................................................... 44
12.2 Funded Projects ............................................................................................ 44
12.3 NYSDEC Issued Permits .............................................................................. 44
12.4 Research Activities ....................................................................................... 45
12.5 Clean Water Plans (TMDL, 9E, or Other Plans) ........................................... 45
13. Proposed Harmful Algal Blooms (HABs) Actions .................................................... 46
13.1 Overarching Considerations ......................................................................... 46
13.1.1 Phosphorus Forms ...................................................................................... 46
13.1.2 Climate Change .......................................................................................... 47
13.2 Priority Project Development and Funding Opportunities ............................. 48
13.3 Putnam Lake Priority Projects ....................................................................... 51
13.3.1 Priority 1 Projects ........................................................................................ 51
13.3.2 Priority 2 Projects ........................................................................................ 53
13.4 Additional Watershed Management Actions ................................................. 53
13.5 In-Lake Management Actions ....................................................................... 54
13.6 Monitoring Actions ........................................................................................ 54
13.7 Research Actions .......................................................................................... 55
13.8 Coordination Actions ..................................................................................... 56
13.9 Long-term Use of Action Plan ....................................................................... 57

3 | HABS ACTION PLAN - PUTNAM LAKE
14. References .............................................................................................................. 59Appendix A. Wind and Wave Patterns .......................................................................... 64
Appendix B. Waterbody Classifications ......................................................................... 66
Appendix C. WI/PWL Summary .................................................................................... 68
Appendix D. NYSDEC Water Quality Monitoring Programs .......................................... 71
Appendix E. Road Ditches ............................................................................................ 72
List of Tables Table 1. Regional summary of surface total phosphorus (TP) concentrations (mg/L, ± standard error) for New York State lakes (2012-2017, CSLAP and LCI), and the average TP concentration (± standard error) in Putnam Lake (2013-2017). ................. 16
Table 2. New York State criteria for trophic classifications (NYSFOLA 2009) compared to averages for Putnam Lake, 2013-2017. .................................................................... 16
Table 3. History of HABs in Putnam Lake, 2013-2017. ................................................. 29
Table 4. Measured toxin and cyanobacteria (BGA) chlorophyll-a concentrations for bloom events (2013-2017, CSLAP). .............................................................................. 30
Table 5. Dominant algal taxa during documented bloom events. .................................. 31
Table 6. HABs guidance criteria. ................................................................................... 33
List of FiguresFigure 1. Location of Putnam Lake within New York State. ............................................. 7
Figure 2. Political boundaries within the Putnam Lake watershed. ................................. 8
Figure 3. Beach locations in Putnam Lake. ................................................................... 12
Figure 4. Putnam Lake transparency, measured as Secchi depth (m), in 2003 (LCI) and 2013 to 2017 (CSLAP). ................................................................................................. 18
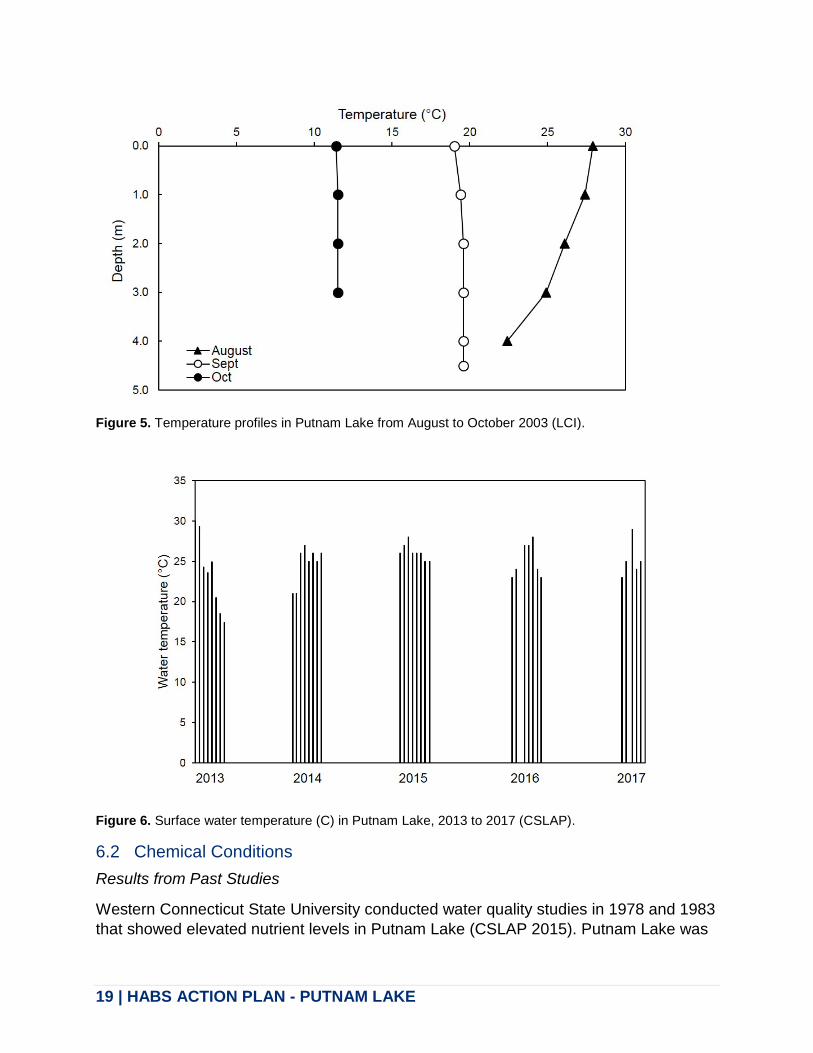
Figure 5. Temperature profiles in Putnam Lake from August to October 2003 (LCI). ... 19
Figure 6. Surface water temperature (C) in Putnam Lake, 2013 to 2017 (CSLAP). ...... 19
Figure 7. Total phosphorus (TP) concentrations (mg/L) in Putnam Lake from 2003 (LCI), and 2013 to 2017 (CSLAP). .......................................................................................... 21
Figure 8. Total nitrogen (TN), ammonia, and nitrogen oxide concentrations (mg/L) in Putnam Lake from 2013 to 2017 (CSLAP). ................................................................... 22
Figure 9. Ratios of total nitrogen (TN) to total phosphorus (TP) in Putnam Lake from 2013 to 2017 (CSLAP). ................................................................................................. 23

4 | HABS ACTION PLAN - PUTNAM LAKE
Figure 10. Dissolved oxygen (DO) concentrations (mg/L) in the water column of Putnam Lake, measured from August to October, 2003 (LCI). ................................................... 24
Figure 11. Chlorophyll-a concentrations (extracted, mg/L) in Putnam Lake from 2003 (LCI), and 2013 to 2017 (CSLAP). ................................................................................ 26
Figure 12. HAB event in Putnam Lake on September 12, 2015. ................................... 27
Figure 13. Number of days of beach closures on Putnam Lake due to the presence of HABs, 2012 and 2013 (NYSDOH)................................................................................. 34
Figure 14. Putnam Lake 2017 CSLAP scorecard. ......................................................... 36
Figure 15. Average 5-day air temperature (°C, ± standard error) preceding a reported HAB event (green bar) and during sampling when a bloom was not reported (blue bar) (p = 0.09). ...................................................................................................................... 39
Figure 16. Land uses and percentages in the Putnam Lake watershed. ....................... 40
Figure 17. (a) Watershed land use and (b) septic system density in the Putnam Lake watershed. ..................................................................................................................... 41
5 | HABS ACTION PLAN - PUTNAM LAKE
1. Introduction 1.1 Purpose New York State's aquatic resources are among the best in the country. State residents benefit from the fact that these resources are not isolated, but can be found from the eastern tip of Long Island to the Niagara River in the west, and from the St. Lawrence River in the north to the Delaware River in the south.
These resources, and the plants and animals they harbor, provide both the State and the local communities a wealth of public health, economic, and ecological benefits including potable drinking water, tourism, water-based recreation, and other ecosystem services. Harmful algal blooms (HABs), primarily within lakes and ponds of New York State, have become increasingly prevalent in recent years and have impacted the values and services that these resources provide.
This HABs Action Plan for Putnam Lake has been developed by the New York State Water Quality Rapid Response Team (WQRRT) to:
• Describe the Lake’s physical and biological conditions • Summarize the research conducted to date and the data it has produced • Identify the potential causative factors contributing to HABs • Provide specific recommendations to minimize the frequency, duration, and
intensity of HABs to protect the health and livelihood of its residents and wildlife.
This Action Plan represents a key element in New York State’s efforts to combat HABs now and into the future.
1.2 Scope, Jurisdiction and Audience The New York State HABs monitoring and surveillance program was developed to evaluate conditions for waterbodies with a variety of uses (public, private, public water supplies (PWSs), non-PWSs) throughout the State. The Governor’s HABs initiative focuses on waterbodies that possess one or more of the following elements:
• Serve as a public drinking water supply • Are publicly accessible • Have regulated bathing beaches.
Based on these criteria, the Governor’s HABs initiative has selected 12 New York State waterbodies that are representative of waterbody types, lake conditions, and vulnerability to HABs throughout the State. Putnam Lake, with its bathing beaches, recreational opportunities, and proximity to the New York City drinking water supply, was selected as one of the priority waterbodies, and is the subject of this HABs Action Plan.

6 | HABS ACTION PLAN - PUTNAM LAKE
The intended audiences for this Action Plan are as follows:
• Members of the public interested in background information about the development and implications of the HABs program
• New York State Department of Environmental Conservation (NYSDEC), New York State Department of Health (NYSDOH), and New York State Department of Agriculture and Markets (NYSDAM) officials associated with the HABs initiative
• State agency staff who are directly involved in implementing or working with the NYS HABs monitoring and surveillance program
• Local and regional agencies involved in the oversight and management of Putnam Lake (e.g., Putnam County Soil and Water Conservation District [SWCD], Departments of Health [DOHs], New York City Department of Environmental Protection [NYCDEP], the Town of Patterson, and the Putnam Lake Park District)
• Lake residents, managers, consultants, and others that are directly involved in the management of HABs in Putnam Lake.
Analyses conducted in this Action Plan provide insight into the processes that potentially influence the formation of HABs in Putnam Lake, and their spatial extents, durations, and intensities. Implementation of the mitigation actions recommended in this HABs Action Plan are expected to reduce blooms in Putnam Lake.
1.3 Background Harmful algal blooms in freshwater generally consist of visible patches of cyanobacteria, also called blue-green algae (BGA). Cyanobacteria are naturally present in low numbers in most marine and freshwater systems. Under certain conditions, including adequate nutrient (e.g., phosphorus) availability, warm temperatures, and calm winds, cyanobacteria may multiply rapidly and form blooms that are visible on the surface of the affected waterbody. Several types of cyanobacteria can produce toxins and other harmful compounds that can pose a public health risk to people and animals through ingestion, skin contact, or inhalation. The NYSDEC has documented the occurrence of HABs in Putnam Lake, and has produced this Action Plan to identify the primary factors triggering HAB events, and to facilitate decision-making to minimize the frequency, intensity, and duration of HABs.

7 | HABS ACTION PLAN - PUTNAM LAKE
2. Lake Background 2.1 Geographic Location Putnam Lake is a 226-acre man-made lake located in the Town of Patterson in Putnam County, approximately 60 miles north of New York City, and bordering the New York/ Connecticut state line (Figures 1 and 2). Putnam Lake and its surrounding parkland are currently managed by the Town of Patterson for the surrounding residents and their guests with deeded lake rights (Putnam Lake Park District 2018).
2.2 Basin Location Putnam Lake is located within the Lower Hudson River basin in southeastern New York, which includes most of Westchester, Putnam, Orange, Ulster, Columbia and Albany Counties, much of western and central Dutchess, eastern Greene, and southern Rensselaer Counties, and smaller parts of New York (Manhattan), Bronx, Rockland, Sullivan, Schoharie and Schenectady Counties (NYSDEC 2018b). Putnam Lake is also part of the Croton watershed which consists of 375 square miles within Putnam, Dutchess, and Westchester counties.
Figure 1. Location of Putnam Lake within New York State.
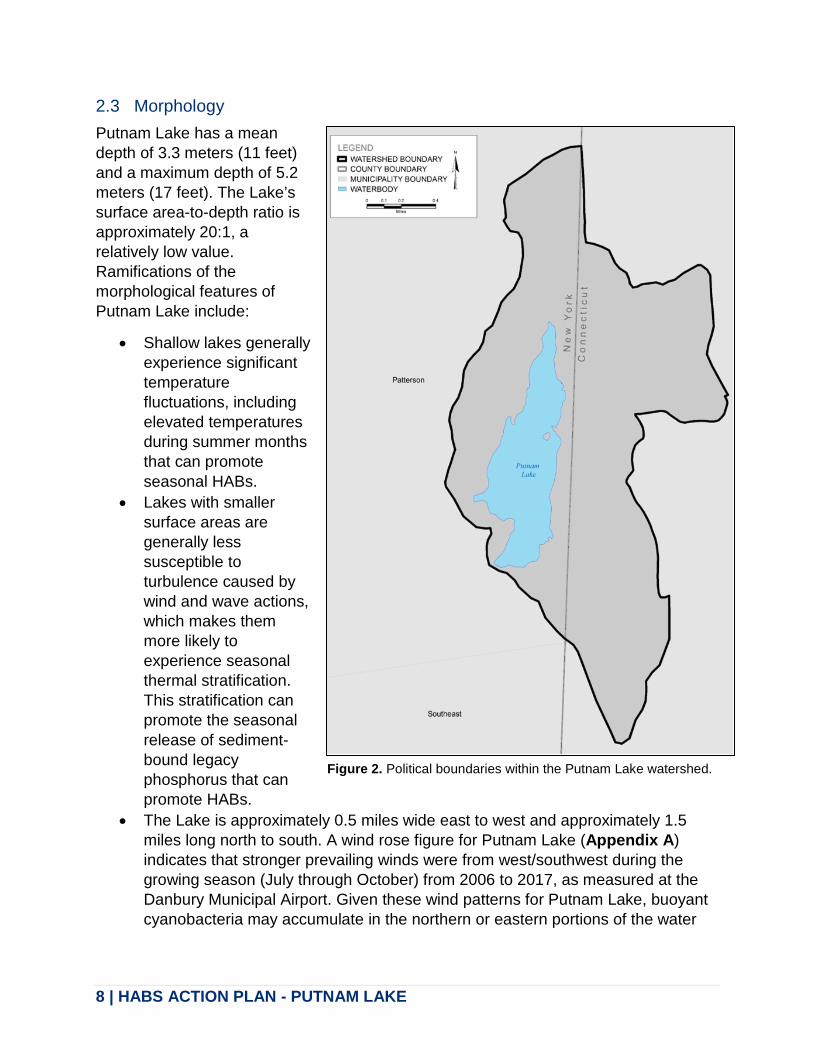
8 | HABS ACTION PLAN - PUTNAM LAKE
2.3 Morphology Putnam Lake has a mean depth of 3.3 meters (11 feet) and a maximum depth of 5.2 meters (17 feet). The Lake’s surface area-to-depth ratio is approximately 20:1, a relatively low value. Ramifications of the morphological features of Putnam Lake include:
• Shallow lakes generally experience significant temperature fluctuations, including elevated temperatures during summer months that can promote seasonal HABs.
• Lakes with smaller surface areas are generally less susceptible to turbulence caused by wind and wave actions, which makes them more likely to experience seasonal thermal stratification. This stratification can promote the seasonal release of sediment-bound legacy phosphorus that can promote HABs.
• The Lake is approximately 0.5 miles wide east to west and approximately 1.5 miles long north to south. A wind rose figure for Putnam Lake (Appendix A) indicates that stronger prevailing winds were from west/southwest during the growing season (July through October) from 2006 to 2017, as measured at the Danbury Municipal Airport. Given these wind patterns for Putnam Lake, buoyant cyanobacteria may accumulate in the northern or eastern portions of the water
Figure 2. Political boundaries within the Putnam Lake watershed.
9 | HABS ACTION PLAN - PUTNAM LAKE
body (potentially impacting bathing beaches and other recreational uses along the east shore, see Figure 3).
• Putnam Lake has an estimated volume of about 2,486 acre-ft, and the drainage-to-surface area ratio is 7.6. This relatively low ratio is indicative of the limited runoff entering, and outflow leaving, the lake. This ratio contributes to a relatively low turnover rate of water within the system which allows for the accumulation of nutrients and elevated temperatures that can promote HABs.
The contributing watershed area is 1,717 acres of predominantly residentially developed land and forest with some open water and wetlands (CSLAP 2016). Agricultural land use in the watershed is limited.
2.4 Hydrology Putnam Lake’s hydraulic retention time, or the amount of time it takes water to pass through the lake, is generally 9 months. As noted above, this relatively high hydraulic retention time (i.e., low turnover rate) allows for the accumulation of nutrients and elevated temperatures that can promote HABs. Surface water inputs include Morlock Brook and three unnamed tributaries. Outflow from Putnam Lake via the dam spillway at the south end of the lake flows to Bog Brook, Lost Lake, East Branch Croton River, East Branch Reservoir, the Lower Hudson River, and reservoirs, including the New Croton Reservoir, via a network of tributaries (CSLAP 2015).
2.5 Lake Origin Putnam Lake was created through the damming of Morlock Brook, a small tributary to the Croton River, with a 295-foot-long by 24-foot-high earthen dam in 1931. In the early 1930s, the lake was primarily used for seasonal (i.e., summer) cottages and as a water supply for firefighting (CSLAP 2015). The land was divided into 20-foot by 100-foot lots, each of which was equipped with a hand-dug well and an outhouse. By 1932, two thousand homes had been constructed (Town of Patterson 2017), and the lake supported a variety of recreational uses, including boating, swimming, and fishing. As the area transitioned from a farming community to a bedroom community, these summer cottages were converted to year-round residences or demolished and replaced by larger homes. Outhouses were replaced by small septic systems, and drinking water wells were installed (Town of Patterson 2017).
3. Designated Uses 3.1 Water Quality Classification – Lake and Major Tributaries Putnam Lake is a Class B waterbody under the New York Codes, Rules, and Regulations (6NYCRR Part 864.6), meaning it is best intended for contact recreation (i.e., swimming and bathing), non-contact recreation (i.e., boating and fishing), aesthetics, and aquatic life. The primary uses of Putnam Lake are described in the

10 | HABS ACTION PLAN - PUTNAM LAKE
following sections, and the New York State classification system is provided in Appendix B.
Morlock Brook and the three unnamed tributaries to Putnam Lake are Class C waterbodies, indicating these waters are best used for fishing, fish propagation, and survival. Class C waterbodies are also suitable for primary and secondary contact recreation, assuming other factors do not limit the use for these purposes.
Lost Lake is a Class B waterbody, and Bog Brook and East Branch Croton River are Class C. East Branch Reservoir is Class AA, meaning it is a source of water supply for drinking and culinary or food processing purposes, and is suitable for primary and secondary contact recreation, fishing, fish propagation and survival. If subjected to approved treatments, Class AA waterbodies will be considered safe and satisfactory for drinking water purposes. The Lower Hudson River is classified as SB, meaning it is suitable for swimming and other recreation, including fishing. (NYSDEC 2018a, NYSDEC 2008). The HABs conditions in Putnam Lake represent a potential threat to water quality within these downstream uses, particularly those associated with the resources that serve as potable water sources for the New York City Watershed. Additional discussion is provided in Sections 3.2 and 3.7.
The existing dam has a NYSDEC hazard classification of "C" or "High Hazard" per 6NYCRR Part 673: "A dam failure may result in widespread or serious damage to home(s); damage to main highways, industrial or commercial buildings, railroads, and/or important utilities, including water supply, sewage treatment, fuel, power, cable or telephone infrastructure; or substantial environmental damage; such that the loss of human life or widespread substantial economic loss is likely."
3.2 Potable Water Uses Putnam Lake is part of the Croton System of the New York City water supply reservoirs. The Croton System supplies the City with approximately 10% of its drinking water (NYC Water 2013). A watershed agreement is in place between the NYCDEP and Croton communities (including the Putnam Lake area) to provide programs and funding for watershed protection (NYSDEC 2008). This connection between Putnam Lake and the New York City water supply reservoirs contributed to Putnam Lake’s inclusion in the Governor’s HABs initiative that led to the development of this HABs Action Plan.
While Putnam Lake is not used as a source of potable drinking water, the United States Environmental Protection Agency (USEPA) sets health advisories to protect people from being exposed to contaminants in drinking water for those waterbodies that are used for such purposes. As described by the USEPA: “The Safe Drinking Water Act provides the authority for the USEPA to publish health advisories for contaminants not subject to any national primary drinking water regulation. Health advisories describe non-regulatory concentrations of drinking water contaminants at or below which adverse health effects are not anticipated to occur over specific exposure durations (e.g., one-day, 10-days, several years, and a lifetime). Health advisories are not legally
11 | HABS ACTION PLAN - PUTNAM LAKE
enforceable federal standards and are subject to change as new information becomes available.”
Health advisories are not bright lines between drinking water levels that cause health effects and those that do not. Health advisories are set at levels that consider animal studies, human studies, vulnerable populations, and the amount of exposure from drinking water. This information is used to establish a health protective advisory level that provides a wide margin of protection because it is set far below levels that cause health effects. When a health advisory is exceeded, it raises concerns not because health effects are likely to occur, but because it reduces the margin of protection provided by the health advisory. Consequently, exceedance of the health advisory serves as an indicator to reduce exposure, but it does not mean health effects will occur.
In 2015, the USEPA developed two 10-day drinking water health advisories for the HAB toxin microcystin: 0.3 micrograms per liter (μg/L) for infants and children under the age of 6, and 1.6 μg/L for older children and adults (USEPA 2015). The 10-day health advisories are protective of exposures over a 10-day exposure period to microcystin in drinking water, and are set at levels that are 1,000-fold lower than levels that caused health effects in laboratory animals. The USEPA's lower 10-day health advisory of 0.3 μg/L is protective of people of all ages, including vulnerable populations such as infants, children, pregnant women, nursing mothers, and people with pre-existing health conditions. The NYSDOH has used the health advisory of 0.3 μg/L as the basis for recommendations, and a do not drink recommendation will be issued upon confirmation that microcystin levels exceed this level in the finished drinking water delivered to customers.
In 2015, the USEPA also developed 10-day health advisories for the HAB toxin cylindrospermopsin. (USEPA 2015). Although monitoring for cylindrospermopsin continues, it has not been detected in any of the extensive sampling performed in New York State. New York State HAB response activities have focused on the blooms themselves and microcystin given it is by far the most commonly HAB toxin found.
Water system operators should conduct surveillance of their source water on a daily basis. If there is a sign of a HAB, they should confer with NYSDOH and NYSDEC as to whether a documented bloom is known. The water system operator, regardless of whether there is a visual presence of a bloom, should also be evaluating the daily measurements of their water system. If there is any evidence—such as an increase in turbidity, chlorine demand, and chlorophyll—then the water system operator should consult with the local health department about the need to do toxin measurement. The local health department should consult with NYSDOH central office on the need to sample and to seek additional guidance, such as how to optimize existing treatment to provide removal of potential toxins. If toxin is found then the results are compared to the USEPA 10-day health advisory of 0.3 µ/L, and that the results of any testing be immediately shared with the public. NYSDOH also recommends that if a concentration

12 | HABS ACTION PLAN - PUTNAM LAKE
greater than the 0.3 µg/L is found in finished water, then a recommendation be made to not drink the water. NYSDOH has templates describing these recommendations that water system operators and local officials can use to share results with customers. Additionally, public water systems that serve over 3,300 people are required to submit Vulnerability Assessment /Emergency Response Plans (VA/ERP); in situations where a water system is using surface waters with a documented history of HABs, NYSDOH will require water system operators to account for HABs in their VA/ERP (which must be updated at least every five years).
3.3 Public Bathing Uses There are currently two regulated beaches that are open for swimming during the summer months - Jackson Beach on the southeast shore across from Jackson Road, and Warren Beach on the western shore on Waterford Road (Figure 3). Combined, these two beaches provide more than 20,000 square feet of beach area for all Putnam Lake Park District residents to use (Putnam Lake Park District 2018).
Given the prevailing wind patterns in Putnam Lake (see Appendix A), Jackson Beach along the eastern shoreline may be most susceptible to beach closures and negative effects on public health based on the potential for HABs to accumulate in this portion of the lake from westerly winds. However, as noted above, the small surface area and fetch for the lake may minimize bloom accumulations in any portion of the lake, including swimming beaches or common recreational areas.
3.4 Recreation Uses The entire lake shoreline is designated as parkland for use by Putnam Lake residents, and includes beaches, park areas, boat launches, and boat storage. The Putnam Lake Park District offers a boat registration program for boaters wishing to utilize the lake. Two boat launches are available (North Launch and South Launch) for vessels that are registered with the Park District, and registered vessels may also be carried across parklands to the water’s edge to
Figure 3. Beach locations in Putnam Lake.

13 | HABS ACTION PLAN - PUTNAM LAKE
launch by hand (Putnam Lake Park District 2018).
3.5 Fish Consumption/Fishing Uses Statewide fishing regulations are applicable to Putnam Lake for both regular fishing and ice fishing. Putnam Lake does not have lake-specific fish consumption advisories (New York State Department of Health 2018).
While reliable data of the fish populations in Putnam Lake are not known to be available, the fish species assemblage reported in the lake and the absence of observable impairment to the aquatic life use (based on the 2017 CSLAP scorecard), suggests that the fish species assemblage is not a driver for HABs formations in Putnam Lake. However, it is possible that certain species may be a contributing factor to the formation of HABs. Grass carp (Ctenopharyngodon idella), an invasive cyprinid species, can increase sediment suspension and associated nutrients in the water column based on its feeding behavior. The increased suspended sediment liberated by this species’ benthic foraging behavior contains nutrients that may be utilized by BGA (see Section 6.3).
3.6 Aquatic Life Uses As a Class B waterbody, Putnam Lake is suitable for fish propagation and survival. The lake supports a warm water fishery including largemouth bass (Micropterus salmoides), smallmouth bass (Micropterus dolomieu), bluegill (Lepomis macrochirus), black crappie (Pomoxis nigromaculatus), yellow perch (Perca flavescens), and others. Water chemistry data, physical measurements, and anecdotal data for Putnam Lake suggest that aquatic life may be stressed by elevated pH, and possibly impaired by road salt runoff, invasive plants, and HABs.
4. User and Stakeholder Groups The Putnam Lake Park District is a special improvement district created by the Town of Patterson Board at the request of its residents. The District was created to provide a funding source for the management of Putnam Lake and to provide recreational opportunities for its residents. It was established in 2011 when a community petition was presented to the Town of Patterson to, “manage, maintain, and improve the proposed park district property herein described, and to make necessary improvements to the lake water for the use, convenience, and enjoyment of the residents of such park district” (Patterson Planning Department 2011). The boundaries of the district were determined by the properties that have deeded rights to use the lake, and were contained on 13 maps of the Putnam Lake Subdivision submitted with the petition (Putnam Lake Park District 2018, Patterson Planning Department 2011).
Before the Park District was established, the property was owned and maintained by the Putnam Lake Community Council (PLCC), which included the maintenance of five beaches, a ballfield, parklands, and a boathouse. Residents paid PLCC membership
14 | HABS ACTION PLAN - PUTNAM LAKE
dues, which were used for property maintenance and operation, and access to the lake was reserved for PLCC members and those with deeded access rights (Patterson Planning Department 2011). Currently, parkland surrounding Putnam Lake is open to all lake residents and their guests for recreational use, including beaches, park areas, boat launches, storage areas, existing docks, and pathways.
The Putnam Lake Park District operates with funding provided by those properties benefitted by the District. However, the Putnam Lake Park District is part of the overall Town of Patterson Budget and is subject to the overall 2% tax cap for the Town (Putnam Lake Park District 2018).
With the title transfer of parkland property from the PLCC to the Town of Patterson, the Patterson Town Board approved a new section of Town Code for the District. A Park Advisory Board was appointed to advise on the needs of Putnam Lake residents and assist in managing the Park District land, water, and facilities (Putnam Lake Park District 2018).
5. Monitoring Efforts 5.1 Lake Monitoring Activities Putnam Lake has reportedly experienced increased aquatic vegetation and algal growth in recent years, which impairs recreational use and aesthetics (Putnam Lake Park District 2018). Several studies have been conducted on Putnam Lake to identify potential factors that may be contributing to the perceived decrease in water quality. The following is a summary of the studies that have occurred between 1978 and 2017 (CSLAP 2015).
• Putnam Lake was first sampled as part of the Citizens Statewide Lake Assessment Program (CSLAP) in 2013, and CSLAP sampling has been conducted each year through 2017. Section 6 details the physical, chemical, and biological condition of Putnam Lake based on data collected through the CSLAP program. HABs monitoring has been conducted through CSLAP since 2013.
• The Park District hired an independent contractor to conduct water quality monitoring in 2013 to complement the CSLAP program (Putnam Lake Park District 2018). A planned aquatic plant survey was not conducted due to a lack of significant plant growth in the lake in 2013. However, a preliminary aquatic plant survey was conducted.
• SUNY Purchase conducted a bathymetric survey of the lake in 2011. Depth profiles collected by SUNY Purchase in 2013 suggested depletion of dissolved oxygen at depth.
• Putnam Lake was sampled by the NYSDEC as part of a Lake Classification and Inventory (LCI) survey in August, September, and October of 2003.

15 | HABS ACTION PLAN - PUTNAM LAKE
• The Town of Patterson conducted a 2001 nutrient and aquatic plant study of the lake.
• The lake was sampled in 1987 as part of an Adirondack Lake Survey Corporation (ALSC) study of approximately 1,600 high elevation lakes in New York State, including a number in the Lower Hudson River basin. This sampling including an evaluation of the chemical and biological condition of the lake.
• Water quality studies were conducted by Western Connecticut State University in 1978 and 1983.
5.2 Tributary Monitoring Activities None of the tributaries to the lake, nor the outlet of the lake, have been monitored through the NYSDEC Rotating Intensive Basins (RIBS) or stream biomonitoring programs.
6. Water Quality Conditions Trends in water quality were assessed using data from 2013 to 2017 collected by CSLAP. Statistical significance of time trends was evaluated with Kendall’s tau trend test using annual average values. This non-parametric correlation coefficient determines if trends over time were significantly different than zero, or there was no trend. A significant difference was assumed for p-values less than 0.05. Water quality data used in this analysis were limited to those that were collected under a State-approved Quality Assurance Project Plan (QAPP), and analyzed at an Environmental Laboratory Accredited Program (ELAP) certified laboratory. Note that long-term trends presented below are intended to provide an overview of water quality conditions, and that continued sampling will better inform trend analyses over time.
Table 1 provides a regional summary of surface total phosphorus (TP) concentrations (mg/L) from Putnam Lake compared to New York State lakes. In freshwater lakes, phosphorus is typically the nutrient that limits plant growth; therefore, when excess phosphorus becomes available from point sources or nonpoint sources, primary production can continue unchecked leading to algal blooms. The form of phosphorus is an important consideration when evaluating management alternatives (Section 13).

16 | HABS ACTION PLAN - PUTNAM LAKE
Table 1. Regional summary of surface total phosphorus (TP) concentrations (mg/L, ± standard error) for New York State lakes (2012-2017, CSLAP and LCI), and the average TP concentration (± standard error) in Putnam Lake (2013-2017).
Region
Number of Lakes
Average TP
(mg/L)
Average TP Putnam Lake
(mg/L) 2013-2017
NYS 521 0.034 (± 0.003) - NYC-LI 27 0.123 (± 0.033) - Lower Hudson 49 0.040 (± 0.005) 0.06 (± 0.002) Mid-Hudson 53 0.033 (± 0.008) - Mohawk 29 0.040 (± 0.009) - Eastern Adirondack 112 0.010 (± 0.0004) - Western Adirondack 88 0.012 (± 0.001) - Central NY 60 0.024 (± 0.005) - Finger Lakes region 45 0.077 (± 0.022) - Finger Lakes 11 0.015 (± 0.003) - Western NY 47 0.045 (± 0.008) -
Regionally, the data provided in Table 1 indicate that the average TP concentration in Putnam Lake is 50% greater than the average concentration found throughout the Lower Hudson region. Further, the average TP concentration is almost three times greater than the New York State water quality guidance value of 0.02 mg/L, which suggests that future management actions to protect water quality should likely focus on reducing TP concentrations.
Water clarity (based on Secchi depth, m), TP (mg/L), and chlorophyll-a (µg/L) concentrations are used to assess trophic state using New York State criteria (Table 2) – throughout 2016 and 2017 water quality sampling, these indicators reflected eutrophic (high productivity) conditions.
Table 2. New York State criteria for trophic classifications (NYSFOLA 2009) compared to averages for Putnam Lake, 2013-2017.
Parameter Oligotrophic Mesotrophic Eutrophic Putnam Lake Transparency (m) >5 2-5 <2 1.3 (± 0.07)
TP (mg/L) <0.010 0.010-0.020 >0.020 0.06 (± 0.002)
Chlorophyll a (µg/L) <2 2-8 >8 33.7 (± 3.6)
6.1 Physical Conditions Water clarity can be related to the amount of suspended material in the water column including sediment, algae and cyanobacteria. Putnam Lake has lower water clarity and higher nutrient and algae levels than other lakes in the Lower Hudson region (CSLAP 2016). Specific factors that appear to have contributed to this condition are provided in the following sections.
Appendix A includes estimated wave heights in Putnam Lake from January 2006 to December 2017 which indicate that the height of waves was generally greater in the northern and southern portions of the lake. Note that most estimated wave heights in Putnam Lake over this time were less than or equal to 0.2 meters. Based on these
17 | HABS ACTION PLAN - PUTNAM LAKE
estimates, an evaluation of the potential for re-suspension of lakebed sediments by waves indicated that for water depths greater than 1.2 meters (4 feet), re-suspension is unlikely to occur in an average year. Thus, most of the lake bed is generally not susceptible to re-suspension by waves.
Water clarity, as represented by Secchi depth, has generally increased (τ = 0.600) in Putnam Lake over time (Figure 4), although this trend was not statistically significant (p = 0.142). The limited LCI sampling in 2003 showed water clarity similar to, and perhaps slightly more degraded than, those recently measured through CSLAP (CSLAP 2015) with average (± standard deviation) Secchi disk readings in 2003 (August, October, and November) of 0.88 m (± 0.5) compared to 1.43 m (± 0.4) from 2013 through 2017 (CSLAP). The minimum Secchi depth, or the shallowest recorded value for a given year, has significantly increased from 2013 to 2017 (p = 0.023, τ = 0.949), further suggesting water clarity has increased, with recent summer average approaching mesotrophic (moderate productivity) conditions (Figure 4). The data in Figure 4 also indicate that Secchi depth generally exceeds the New York State Public Health Law guideline for siting new bathing beaches of 1.2 m (4 feet).
This increase in water clarity may be attributable to a reduction in the amount of suspended material in the water column, including sediment and/or algae. Chlorophyll-a, which is a photosynthetic pigment common to all algae and cyanobacteria, has also generally decreased over time (see Section 6.3). However, the increase in water clarity and decline in chlorophyll-a likely reflects the recent lake treatments with algaecide which reduces the amount of algae in the water, both improving water clarity and reducing chlorophyll-a concentrations. Cutrine (a copper-based algaecide) treatment was performed in Putnam Lake in mid-July of 2014 and early and mid-summer in 2015 and early summer in 2016, affecting both open water and shoreline algae levels (CSLAP 2015). Cutrine or Cutrine Plus treatments also occurred in June and July of 2017.

18 | HABS ACTION PLAN - PUTNAM LAKE
Figure 4. Putnam Lake transparency, measured as Secchi depth (m), in 2003 (LCI) and 2013 to 2017 (CSLAP).
Available water temperature (°C) data indicate that Putnam Lake stratifies weakly (i.e., only a slight temperature gradient from top to bottom) during summer months (CSLAP 2016). In addition, a temperature profile from August 2003 similarly suggests that Putnam Lake experiences weak thermal stratification (Figure 5). The limited number of years of water temperature data do not provide sufficient information to assign trends in the temperature regime, and future data collected in Putnam Lake could be informative to compare to previously measured temperature profiles. However, the temperature dynamics (i.e., average and ranges) appear to be consistent with other New York State lakes with similar dimensions and retention times. Summer average temperature showed a non-significant (p = 0.327) increasing trend over time from 2013 to 2017 (τ = 0.400, Figure 6). Understanding temperature changes within a waterbody seasonally, as well as annually, is important in understanding HABs. Most cyanobacteria taxa grow better at higher temperatures than other phytoplankton which give them a competitive advantage at higher temperatures (typically above 25°C) (Paerl and Huisman 2008).
19 | HABS ACTION PLAN - PUTNAM LAKE
Figure 5. Temperature profiles in Putnam Lake from August to October 2003 (LCI).
Figure 6. Surface water temperature (C) in Putnam Lake, 2013 to 2017 (CSLAP).
6.2 Chemical Conditions Results from Past Studies
Western Connecticut State University conducted water quality studies in 1978 and 1983 that showed elevated nutrient levels in Putnam Lake (CSLAP 2015). Putnam Lake was

20 | HABS ACTION PLAN - PUTNAM LAKE
assessed as part of the 1987 ALSC study that showed lower phosphorus and higher water clarity readings compared to the 2013 CSLAP analysis, suggesting some degradation in water quality over the last 15 to 25 years. Calcium levels indicated a susceptibility to zebra mussel infestations (although none have been reported), and elevated chloride levels indicate the potential for impacts associated with road salting operations, although no impacts have been documented (CSLAP 2015).
The limited LCI sampling in 2003 showed water quality conditions similar to, and perhaps slightly more degraded than, those recently measured through CSLAP (CSLAP 2015). For example, total phosphorus (TP) concentrations in 2003 (0.07 mg/L ± 0.001) were comparable to the more recent measurements from 2013 to 2017 (0.06 mg/L ± 0.01).
Data from the CSLAP 2015 sampling indicate very high algae levels associated with elevated nutrient levels, particularly along the shoreline, and a high percentage of cyanobacteria within the algal community. These data may suggest that increasing nutrient levels contribute to a high susceptibility to HABs in both the open water and along the shoreline of Putnam Lake (CSLAP 2015).
Current Analysis
Based on total phosphorus (TP) concentrations, Putnam Lake can be characterized as eutrophic (highly productive) (Figure 7). Total phosphorus concentrations in Putnam Lake generally followed a seasonal pattern, with mid-season increased concentrations of phosphorus. Trends of annual average TP concentrations suggest a decline from 2013 to 2017 (τ = -0.738), although this trend was not significant (p = 0.077). Additional monitoring of TP concentrations in Putnam Lake could better inform long-term trends indicative of water quality and future evaluation of within-year patterns may help better understand long term trends.

21 | HABS ACTION PLAN - PUTNAM LAKE
Figure 7. Total phosphorus (TP) concentrations (mg/L) in Putnam Lake from 2003 (LCI), and 2013 to 2017 (CSLAP).
Like phosphorus, total nitrogen (TN) concentrations in Putnam Lake are suggestive of eutrophic conditions (> 0.6 mg/L, Canfield et al. 1983) (Figure 8). Annual average TN concentrations suggest a non-significant decrease over time (p = 0.142, τ = -0.600) from 2013 to 2017. Note that the June 2014 TN concentration was almost three times higher than other yearly maximum values. The reason for this spike is unknown, but may be related to local weather patterns causing an increase in total nitrogen – the previous 10-day rainfall amount was approximately 150 mm. However, the observed increase in TN was not observed in the TP result (Figure 7).
Ammonia concentrations (mg/L) in Putnam Lake show a non-significant decreasing trend over time (p = 0.142, τ = -0.600) from 2013 to 2017 (Figure 8). Further, the annual maximum ammonia concentration, or the highest ammonia value recorded over a year, has significantly decreased with time (p = 0.05, τ = -0.800). NOx (mg/L), which is a measure of the sum of nitrate (NO-3) and nitrite (NO-2), has also decreased in annual average concentration (τ = -0.200) (Figure 8), although this trend of lower concentrations over time for NOx was not statistically significant (p = 0.624).

22 | HABS ACTION PLAN - PUTNAM LAKE
Figure 8. Total nitrogen (TN), ammonia, and nitrogen oxide concentrations (mg/L) in Putnam Lake from 2013 to 2017 (CSLAP).
Ratios of total nitrogen (TN) to total phosphorus (TP) in lakes can be used as a suitable index to determine if algae growth is limited by the availability of nitrogen or phosphorus (Lv et al. 2011). Cyanobacteria blooms are typically rare in lakes where mass based TN:TP ratios are greater than 29:1 (Filstrup et al. 2016, Smith 1983). This is thought to occur because cyanobacteria can take up and use nitrogen more efficiently than algae and thus be more competitive when nitrogen becomes limiting. This ratio is higher than the ratio when nitrogen is the limiting nutrient (TN:TP <10) because phosphorus and other micronutrients are required by cyanobacteria to perform nitrogen fixation (nitrogenase, the N-fixing enzyme requires relatively high concentrations of P to operate) (Mantzouki et al. 2016). Further, while phosphorus availability contributes to blooms, nitrogen availability during the bloom can encourage the toxicity of the bloom (Gobler et al. 2016).
Ratios (by mass) of TN:TP in Putnam Lake from 2013 to 2017 typically ranged between 10 and 20 (Figure 9). These TN:TP values indicate that algal biomass (including cyanobacteria) may be limited by nitrogen (TN:TP < 10) for short periods during the growing season, but phosphorus concentrations likely limit algal growth for much of this period (Figure 9). Trends of annual TN:TP in Putnam Lake suggest a significant decline in TN:TP ratios over time (p = 0.05, τ = -0.800).

23 | HABS ACTION PLAN - PUTNAM LAKE
Figure 9. Ratios of total nitrogen (TN) to total phosphorus (TP) in Putnam Lake from 2013 to 2017 (CSLAP).
A dissolved oxygen (DO) profile from 2003 suggests that Putnam Lake experienced anoxic conditions (e.g., no oxygen) at depth in August (Figure 10). This condition is common to small, sheltered waterbodies. While limited to one year of data, this combination of weak temperature stratification (Figure 6, above) coupled with low DO concentrations at depth suggests a high level of productivity in Putnam Lake, with biotic respiration consuming available oxygen in deeper water. Decreased dissolved oxygen in bottom waters can result in internal loading of legacy phosphorus from sediments, which can then be an important source of available phosphorus for algal growth when Putnam Lake mixes. By September and October, thermal stratification was no longer apparent in 2003 (Figure 6, above), indicating that the lake had mixed to depth, which likely resulted in released phosphorus from sediments to be available for algal growth in the epilimnion (upper waters) during the end of the 2003 growing season. Further data collection of the temperature and dissolved oxygen profiles in Putnam Lake will provide insight into internal loading dynamics over time and indicate if this pattern observed in 2003 is typical.

24 | HABS ACTION PLAN - PUTNAM LAKE
Figure 10. Dissolved oxygen (DO) concentrations (mg/L) in the water column of Putnam Lake, measured from August to October, 2003 (LCI).
The CSLAP data also indicate that chloride levels are above the 75th percentile of New York State lakes (CSLAP 2016). High levels of chloride could potentially impact aquatic life, although no impacts have been documented in Putnam Lake. Road salt operations have been associated with high lake chloride levels (Novotny et al. 2008; Findlay and Kelly 2011), however, the influence of chloride concentrations leading to HAB events is unclear. Nevertheless, conductance (µS/cm) has significantly increased in Putnam Lake (p = 0.05, τ = 0.800) from 2013 to 2017.
6.3 Biological Conditions Results from Past Studies
Preliminary aquatic plant monitoring performed by the Park District’s contractor in 2013 found two exotic plant species - curly leafed pondweed, and water chestnut. While algal density was considered low at two of the three sites, one site was dominated by the green algae Gloeocystis, and the other was dominated by the green algae Staurastrum. The third site with moderate algal density was also dominated by Staurastrum (Allied Biological 2013).

25 | HABS ACTION PLAN - PUTNAM LAKE
The 2001 study of the lake by the Town of Patterson found elevated nutrient and algae levels and dense growth of Eurasian watermilfoil, another invasive aquatic plant. This study recommended stocking grass carp to control excessive weed growth. However, grass carp can suspend nearshore sediment and associated nutrients through their feeding activity, thus increasing nutrient availability for algae. The addition of grass carp into Putnam Lake may have unintended negative consequences for HABs management.
The ALSC study in 1987 found a fisheries community dominated by bluegill, yellow perch, largemouth bass, yellow bullhead (Ameiurus natalis), rock bass (Ambloplites rupestris), and white perch. Using a fish index for biotic integrity (IBI) developed by the state of Minnesota, the quality of the fish community in 1987 would have been identified as “good”. There were at least 11 plant species (3 submergent, 2 floating leaf, and 6 emergent species) found in the lake in 1987, but no invasive species were found, indicating that the quality of the aquatic plant community per the IBI was “fair” (ALSC 1987).
Current Analysis
Concentrations of chlorophyll-a (photosynthetic pigment present in algae, including cyanobacteria) suggest that Putnam Lake is eutrophic (highly productive) (Figure 11). Chlorophyll-a concentrations generally follow a seasonal pattern, with increased concentrations during the mid- to late-growing season (Figure 11). Annual trends suggest a non-significant decrease in chlorophyll-a concentrations (p = 0.142, τ = -0.600) from 2013 to 2017.
Thus, the available data suggest the amount of algae in Putnam Lake may be declining over time, and as mentioned in Section 6.1 is likely due to the application of an algaecide. However, it is not known if the relative abundance of cyanobacteria has changed. Additional monitoring of chlorophyll-a concentrations will supplement the relatively limited temporal coverage of the water quality data for the lake, and can be used to evaluate the effectiveness of recommended actions (see Section 13).

26 | HABS ACTION PLAN - PUTNAM LAKE
Figure 11. Chlorophyll-a concentrations (extracted, mg/L) in Putnam Lake from 2003 (LCI), and 2013 to 2017 (CSLAP).
6.4 Other Conditions An evaluation of the benthic macroinvertebrate community suggests that macroinvertebrates are “threatened”, consistent with the eutrophic conditions and elevated chloride levels in the lake.
Non-native mute swan (Cygnus olor) have been reported in Putnam Lake, per a September 2011 observation in the iMapInvasives database. Mute swans’ foraging behavior has been shown to uproot and reduce the biomass of submerged aquatic plants (Swift et al. 2013), thereby reducing the standing biomass of aquatic plants and increasing nutrient availability for algae. Mute swans also typically defecate in the water rather than on land which provides a direct input of nutrients (in contrast to other waterfowl species such as Canada geese which often release waste products on land, Swift et al. 2013). Thus, an abundant population of mute swans may directly contribute to decreased water quality.

27 | HABS ACTION PLAN - PUTNAM LAKE
7. Summary of HABs New York State possesses one of, if not the most comprehensive HABs monitoring and notification programs in the country. The NYSDEC and NYSDOH collaborate to document and communicate with New Yorkers regarding HABs. Within the NYSDEC, staff in the Division of Water, Lake Monitoring and Assessment Section oversee HAB monitoring and surveillance activities, identify bloom status, communicate public health risks, and conduct outreach, education, and research regarding HABs. The NYSDEC HABs Program has adopted a combination of visual surveillance, algal concentration measurements, and toxin concentration to determine bloom status. This process is unique to New York State and has been used consistently since 2012.
The NYSDEC HABs Program has established four levels of bloom status:
• No Bloom: evaluation of a bloom report indicates low likelihood that a cyanobacteria bloom (HAB) is present
• Suspicious Bloom: NYSDEC staff determined that conditions fit the description of a HAB, based on visual observations and/or digital photographs. Laboratory analysis has not been done to confirm if this is a HAB. It is not known if there are toxins in the water.
• Confirmed Bloom: Water sampling results have confirmed the presence of a HAB which may produce toxins or other harmful compounds (BGA chlorophyll levels ≥ 25 μg/L and/or microscopic confirmation that majority of sample is cyanobacteria and present in bloom-like densities). For the purposes of evaluating HABs sample, chlorophyll-a is quantified with a Fluoroprobe (bbe Moldaenke) which can effectively differentiate relative contributions to total chlorophyll-a by phytoplankton taxonomic group (Kring et al. 2014). BGA chlorophyll-a concentrations (attributed to most types of cyanobacteria) are utilized by the NYSDEC HABs Program for determining bloom status. This method provides an accurate assessment of cyanobacteria density and can be accomplished more quickly and cost effectively than traditional cell counts.
Figure 12. HAB event in Putnam Lake on September 12, 2015.

28 | HABS ACTION PLAN - PUTNAM LAKE
• Confirmed with High Toxins Bloom: Water sampling results have confirmed that there are toxins present in sufficient quantities to potentially cause health effects if people and animals come in contact with the water through swimming or drinking (microcystin ≥ 20 μg/L (shoreline samples) or microcystin ≥ 10 μg/L (open water samples).
The spatial extent of HABs are categorized as follows:
• Small Localized: Bloom affects a small area of the waterbody, limited from one to several neighboring properties.
• Large Localized: Bloom affects many properties within an entire cove, along a large segment of the shoreline, or in a specific region of the waterbody.
• Widespread/Lakewide: Bloom affects the entire waterbody, a large portion of the lake, or most to all of the shoreline.
• Open Water: Sample was collected near the center of the lake and may indicate that the bloom is widespread and conditions may be worse along shorelines or within recreational areas.
7.1 HABs History Putnam Lake is eutrophic and exhibits regular shoreline blooms and periodic open water blooms of cyanobacteria taxa including Microcystis, Dolichospermum, Aphanizomenon, and Woronichinia. HABs have been documented from July 2013 through September 2017 (from late June through mid-October of any given year) through the CSLAP program, but anecdotal evidence suggests that blooms have been increasing over the past several decades. The shoreline blooms periodically exhibit high toxin levels, although toxin concentrations were low in 2015 and 2016 (CSLAP 2016). Less frequent HABs in the fall of 2014 and in 2015 may have been due to the Cutrine (a copper-based algaecide) treatment in mid-July of 2014 and early and mid-summer in 2015 and early summer in 2016, affecting both open water and shoreline algae levels (CSLAP 2015). Open water blooms typically have moderate to low toxin levels (CSLAP 2016).
The CSLAP data indicate that of the 29 samples of blooms on record (2013-2017), 4 were small and localized (‘few properties”), 3 were large and localized (“many properties”), and 5 were widespread/lakewide (Table 3). Thirty-four percent of the open water samples had toxin concentrations that exceeded NYSDEC thresholds. Of the samples with confirmed blooms, 12 were open water and 17 were shoreline blooms. It is likely that many additional (un-sampled) blooms have occurred in Putnam Lake since 2013.

29 | HABS ACTION PLAN - PUTNAM LAKE
Table 3. History of HABs in Putnam Lake, 2013-2017.
Date Bloom extent Bloom
location Chl-a (µg/L)
Daily avg. air
temp (°C)
Water temp (°C)
Daily rainfall (mm)
10-day total
rainfall (mm)
Max daily wind speed
(m/s) Water
quality data
July 9, 2013 Not reported Shoreline 1536.3 24.4 30 0.5 20.8 4.1 Available
July 22, 2013 Not reported Shoreline 1208 23 29.3 0 14.7 3.6 Available Not reported Open water 30.8
August 5, 2013 Not reported Shoreline 1664.5 17.6 24.3 0 25.4 6.2 Available Large localized Open water 27.8
August 19, 2013 Not reported Shoreline 25037 19.6 23.6 0.3 4.9 2.1 Available
September 3, 2013 Not reported Shoreline 78420 21.4 24.9 4.4 36 3.6 Available Widespread/lakewide Open water 36.9
September 17, 2013 Not reported Shoreline 18650 12.3 20.5 0 27 5.7 Available Widespread/lakewide Open water 45.2
September 30, 2013 Not reported Open water 42.6 13.3 18.5 0 28.6 2.1 Available
October 3, 2013 Not reported Shoreline 29087.5 16.3 Not available 0 0.3 2.6 Not available
October 14, 2013 Not reported Shoreline 43407.5 10.4 17.4 0 7.9 4.1 Available Not reported Open water 40.4
June 29, 2014 Widespread/lakewide Shoreline 30.00 21.1 26 0 4.9 5.7 Available Not reported Open water 38.2a
July 13, 2014 Not reported Open water 31.8a 23.1 27 0 9.9 6.7 Available
July 14, 2014 Widespread/lakewide Shoreline 135.7 23.1 Not available 20.6 20.6 6.2 Not available
August 10, 2014 Small localized Shoreline 71.4 20.6 26 0 7.1 3.6 Available
August 24, 2014 Small localized Shoreline 33.6 19.2 25 0 1.5 5.1 Available Not reported Open water 25.5a
July 26, 2015 Not reported Open water 27.4 22.9 26 4.3 4.6 5.1 Available
September 7, 2015 Small localized Shoreline 38.5 22 25 0 0 5.7 Available
July 24, 2016 Not reported Shoreline 36.9 25.9 27 0 8.9 5.7 Available
September 5, 2016 Large localized Shoreline 30.2 17.7 24 0 12.4 6.7 Available
September 18, 2016 Large localized Shoreline 165.3 21.2 23 0 0.3 4.6 Available Not reported Open water 62.6a
September 4, 2017 Small localized Shoreline 34.6 18.8 22 0 26.5 7.7 Available Widespread/lakewide Open water 57.8
a Extracted chlorophyll-a; fluoroprobe otherwise

30 | HABS ACTION PLAN - PUTNAM LAKE
Some cyanobacteria taxa also produce toxins (cyanotoxins) that are harmful to people and pets. As a result, several different toxins are monitored during blooms. Table 4 provides the measured toxin concentrations for bloom events recorded by CSLAP between 2014 and 2017. For comparison, the USEPA has developed draft ambient water quality criteria for human health recreation, which recommends a swimming advisory when microcystin concentrations are > 4 µg/L (USEPA 2016). Sample results below this threshold value are consistent with what is currently prescribed by NYSDOH guidance to allow a regulated bathing beach to reopen. The NYSDEC and NYSDOH believe that all cyanobacteria blooms should be avoided, even if measured microcystin levels are less than the recommended threshold level. Other toxins may be present, and illness is possible even in the absence of toxins.
Table 4. Measured toxin and cyanobacteria (BGA) chlorophyll-a concentrations for bloom events (2013-2017, CSLAP). Microcystin (µg/L) Cyanobacteria (BGA) chl-a (µg/L) Status Min Max # of samples Min Max # of samples Confirmed 1.3 13.3 19 25.2 170056 19 Confirmed, High Toxins 70 613 10 13.9 73,700 10
Table 5 provides the dates and dominant taxa observed during the bloom events documented by CSLAP between 2014 and 2017. According to these data, each confirmed bloom (e.g., confirmed or confirmed with high toxins) is dominated by multiple taxa of cyanobacteria, and no clear pattern exists to indicate cyanobacteria decline in dominance seasonally.
The identification of dominant cyanobacteria taxa (i.e., those that are most often present) in Putnam Lake can help to target species management strategies at the key functional traits of those dominant taxa to limit their proliferation (see Section 13). The following dominant taxa were identified, from qualitative microscopy, during sampling and should be the primary subjects of control efforts in Putnam Lake:
• Microcystis and Aphanizomenon = 30% of samples, each • Woronichinia = 22% of samples
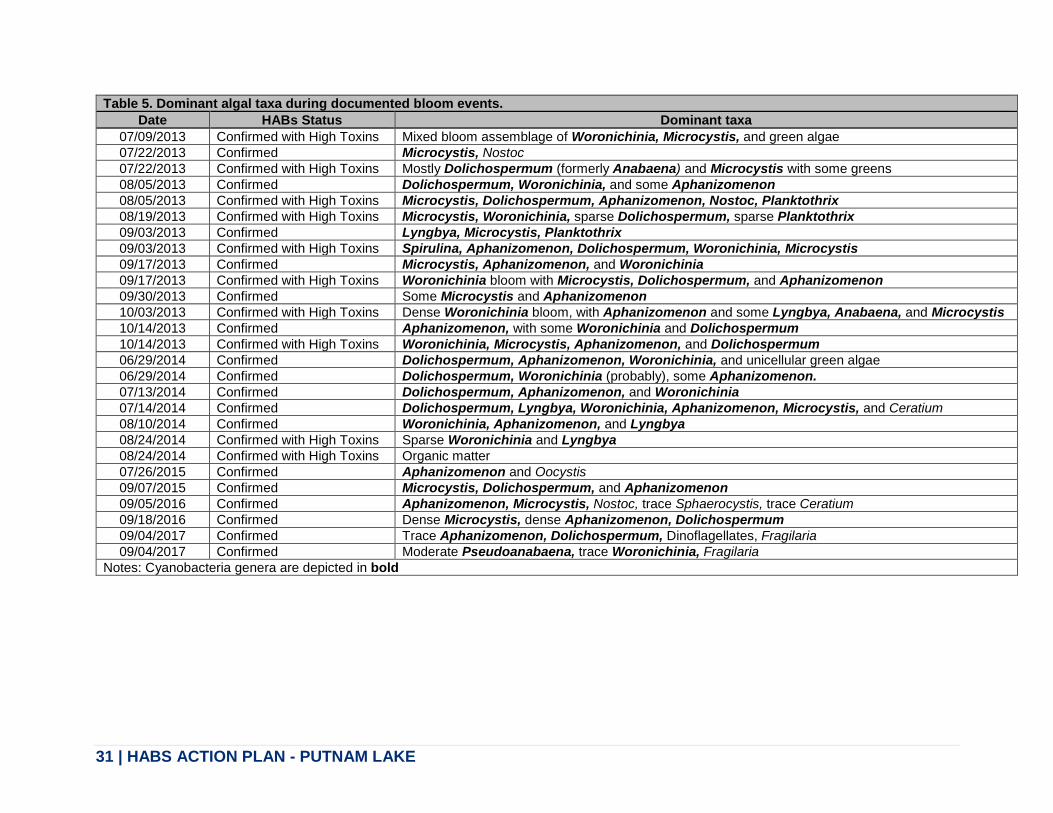
31 | HABS ACTION PLAN - PUTNAM LAKE
Table 5. Dominant algal taxa during documented bloom events. Date HABs Status Dominant taxa
07/09/2013 Confirmed with High Toxins Mixed bloom assemblage of Woronichinia, Microcystis, and green algae 07/22/2013 Confirmed Microcystis, Nostoc 07/22/2013 Confirmed with High Toxins Mostly Dolichospermum (formerly Anabaena) and Microcystis with some greens 08/05/2013 Confirmed Dolichospermum, Woronichinia, and some Aphanizomenon 08/05/2013 Confirmed with High Toxins Microcystis, Dolichospermum, Aphanizomenon, Nostoc, Planktothrix 08/19/2013 Confirmed with High Toxins Microcystis, Woronichinia, sparse Dolichospermum, sparse Planktothrix 09/03/2013 Confirmed Lyngbya, Microcystis, Planktothrix 09/03/2013 Confirmed with High Toxins Spirulina, Aphanizomenon, Dolichospermum, Woronichinia, Microcystis 09/17/2013 Confirmed Microcystis, Aphanizomenon, and Woronichinia 09/17/2013 Confirmed with High Toxins Woronichinia bloom with Microcystis, Dolichospermum, and Aphanizomenon 09/30/2013 Confirmed Some Microcystis and Aphanizomenon 10/03/2013 Confirmed with High Toxins Dense Woronichinia bloom, with Aphanizomenon and some Lyngbya, Anabaena, and Microcystis 10/14/2013 Confirmed Aphanizomenon, with some Woronichinia and Dolichospermum 10/14/2013 Confirmed with High Toxins Woronichinia, Microcystis, Aphanizomenon, and Dolichospermum 06/29/2014 Confirmed Dolichospermum, Aphanizomenon, Woronichinia, and unicellular green algae 06/29/2014 Confirmed Dolichospermum, Woronichinia (probably), some Aphanizomenon. 07/13/2014 Confirmed Dolichospermum, Aphanizomenon, and Woronichinia 07/14/2014 Confirmed Dolichospermum, Lyngbya, Woronichinia, Aphanizomenon, Microcystis, and Ceratium 08/10/2014 Confirmed Woronichinia, Aphanizomenon, and Lyngbya 08/24/2014 Confirmed with High Toxins Sparse Woronichinia and Lyngbya 08/24/2014 Confirmed with High Toxins Organic matter 07/26/2015 Confirmed Aphanizomenon and Oocystis 09/07/2015 Confirmed Microcystis, Dolichospermum, and Aphanizomenon 09/05/2016 Confirmed Aphanizomenon, Microcystis, Nostoc, trace Sphaerocystis, trace Ceratium 09/18/2016 Confirmed Dense Microcystis, dense Aphanizomenon, Dolichospermum 09/04/2017 Confirmed Trace Aphanizomenon, Dolichospermum, Dinoflagellates, Fragilaria 09/04/2017 Confirmed Moderate Pseudoanabaena, trace Woronichinia, Fragilaria
Notes: Cyanobacteria genera are depicted in bold

32 | HABS ACTION PLAN - PUTNAM LAKE
7.2 Drinking Water and Swimming Beach HABs History Drinking water
Across New York, NYSDOH first sampled ambient water for toxin measurement in 2001, and raw and finished drinking water samples beginning in 2010. Two public water supplies were sampled in a 2012 pilot study that included both fixed interval and bloom based event criteria. While microcystin has been detected in pre-treatment water occasionally, rarely have any detects been found in finished water. To date, no samples of finished water have exceeded the 0.3 μg/L microcystin health advisory limit (HAL). Many different water systems using different source waters have been sampled, and drinking water HABs toxin sampling has increased substantially since 2015 when the USEPA released the microcystin and cylindrospermopsin HALs. The information gained from this work and a review of the scientific literature was used to create the current NYSDOH HABs drinking water response protocol. This document contains background information on HABs and toxins, when and how water supplies should be sampled, drinking water treatment optimization, and steps to be taken if health advisories are exceeded (which has not yet occurred in New York State).
In 2018 the USEPA started monitoring for their Unregulated Contaminant Monitoring Rule 4 (UCMR 4) which includes several HAB toxins. In 2018 the USEPA will sample 32 public water systems in New York State. The UCMR 4 is expected to bring further attention to this issue leading to a greater demand for monitoring at PWSs. To help with the increasing demand for laboratory analysis of microcystin, the NYSDOH Environmental Laboratory Approval Program (ELAP) is offering certification for laboratories performing HAB toxin analysis, starting in spring 2018, and public water supplies should only use ELAP certified labs and consult with local health departments (with the support of NYSDOH) prior to beginning HAB toxin monitoring and response actions.
As recommended by the NYSDOH, it is never advisable to drink water from a surface source unless it has been treated by a public drinking water system regardless of the presence HABs. Surface waters may contain other bacteria, parasites or viruses that can cause illness. If you choose to explore in-home treatment systems, you are living with some risk of exposure to blue-green algae and their toxins and other contaminants. Those who desire to use an intake for non-potable use, and treat their water for contaminants including HABS, should work with a water treatment professional who should evaluate for credible third-party certifications such as National Sanitation Foundation standards (NSF P477; NYSDOH 2017).
Putnam Lake is not directly used as a drinking water source but is located within the New York City watershed and is a tributary to reservoirs that supply potable water to NYC residents. NYSDOH does not recommend use of any unauthorized water intakes for potable water on any waterbody. Thus, HABs do not pose a direct threat to Putnam Lake residents through regulated drinking water sources.

33 | HABS ACTION PLAN - PUTNAM LAKE
Swimming
Bathing beaches are regulated by NYSDOH District Offices, County Health Departments and the New York City Department of Health and Mental Hygiene in accordance with the State Sanitary Code (SSC). The SSC contains qualitative water quality requirements for protection from HABs. NYSDOH developed an interactive intranet tool that provides guidance to County, City and State District DOH staff to standardize the process for identifying blooms, closing beaches, sampling, reopening beaches and reporting activities. The protocol uses a visual assessment to initiate beach closures as it affords a more rapid response than sampling and analysis. Beaches are reopened when a bloom dissipates (visually) and samples collected the following day confirm the bloom has dissipated and show toxin levels are below the latest guidance value for microcystins. Sample analysis is performed by local health departments, the Wadsworth Laboratory in Albany or academic institutions. Table 6 provides a summary of the guidance criteria that the NYSDEC and NYSDOH use to advise local beach operators.
Table 6. HABs guidance criteria. NYSDEC Bloom Categories Confirmed
Confirmed w/ high toxins Suspicious Open water Shoreline
[BGA Chlorophyll-a] >25 μg/L
[Microcystin] > 10 μg/L [Microcystin] > 20 μg/L Visual evidence w/out sampling results
NYSDOH Guidelines Closure Re-open Visual evidence (sampling results not needed).
Bloom has dissipated (based on visual evidence); confirmatory samples 1 day after dissipation w/ microcystin < 10 µg/l or < 4 µg/l (USEPA, 2016) in 2017
Putnam Lake has two beaches open for swimming by Lake District members: Warren Beach and Jackson Beach (see Figure 3). Putnam Lake beaches have been closed in the past due to the visual presence of cyanobacteria (Putnam Lake Park District 2018). Sampling at public beaches has revealed occasional elevated fecal coliform levels (NYSDEC 2008), but not sufficiently high to result in swimming closures. This is indirectly linked to HABs, as fecal coliforms may indicate input from septic systems which contribute nutrients that may contribute to HAB events.
In 2012, Jackson Beach was closed for two days starting on October 20th. In 2013, both bathing beaches on Putnam Lake were closed (Jackson Beach – 7 days; Warren Beach – 13 days) in mid to late August due to reported HABs (Figure 13).
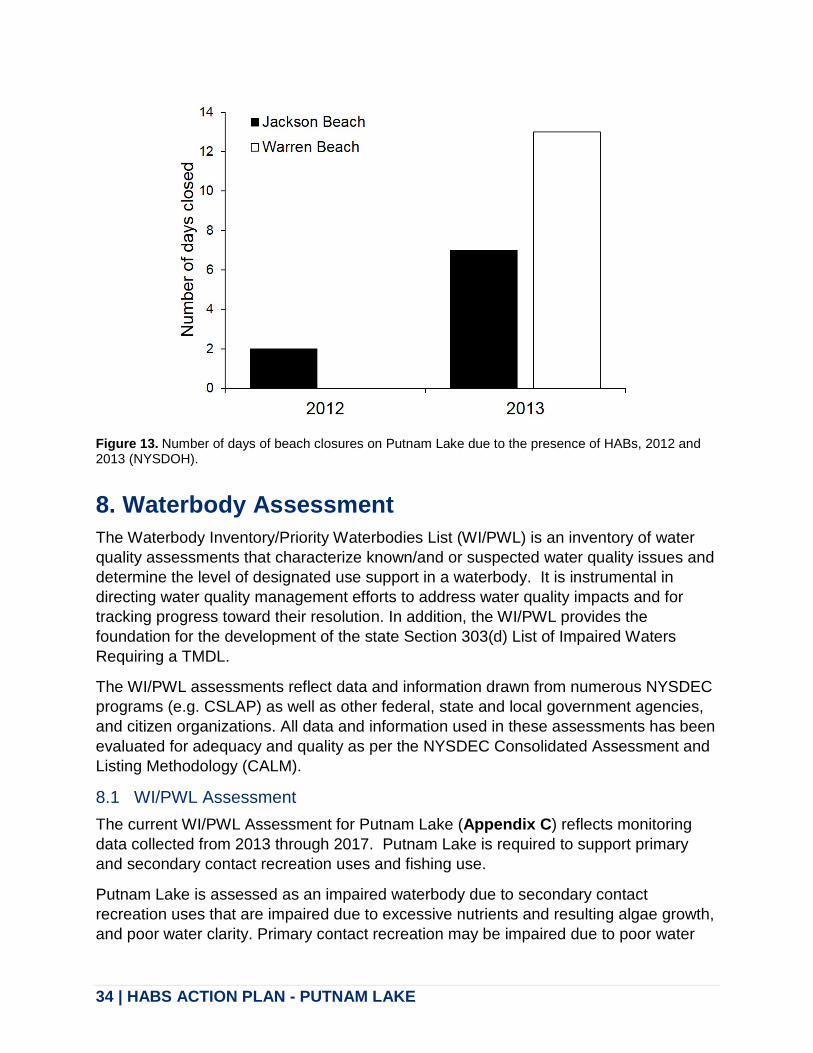
34 | HABS ACTION PLAN - PUTNAM LAKE
Figure 13. Number of days of beach closures on Putnam Lake due to the presence of HABs, 2012 and 2013 (NYSDOH).
8. Waterbody Assessment The Waterbody Inventory/Priority Waterbodies List (WI/PWL) is an inventory of water quality assessments that characterize known/and or suspected water quality issues and determine the level of designated use support in a waterbody. It is instrumental in directing water quality management efforts to address water quality impacts and for tracking progress toward their resolution. In addition, the WI/PWL provides the foundation for the development of the state Section 303(d) List of Impaired Waters Requiring a TMDL.
The WI/PWL assessments reflect data and information drawn from numerous NYSDEC programs (e.g. CSLAP) as well as other federal, state and local government agencies, and citizen organizations. All data and information used in these assessments has been evaluated for adequacy and quality as per the NYSDEC Consolidated Assessment and Listing Methodology (CALM).
8.1 WI/PWL Assessment The current WI/PWL Assessment for Putnam Lake (Appendix C) reflects monitoring data collected from 2013 through 2017. Putnam Lake is required to support primary and secondary contact recreation uses and fishing use.
Putnam Lake is assessed as an impaired waterbody due to secondary contact recreation uses that are impaired due to excessive nutrients and resulting algae growth, and poor water clarity. Primary contact recreation may be impaired due to poor water
35 | HABS ACTION PLAN - PUTNAM LAKE
clarity but there have not been public beach closures since 2013. Based on the landscape of the watershed, onsite septic systems are likely the major contributing sources of elevated nutrients in the waterbody.
Putnam Lake is not included on the current (2016) NYS Section 303(d) List of Impaired Waters Requiring a TMDL however the 2018 WI/PWL assessment suggests that it is appropriate to include this waterbody on the next update of the list.
8.2 Source Water Protection Program (SWPP) The NYSDOH Source Waters Assessment Program (SWAP) was completed in 2004 to compile, organize, and evaluate information regarding possible and actual threats to the quality of public water supply (PWS) sources based on information available at the time. Each assessment included a watershed delineation prioritizing the area closest to the PWS source, an inventory of potential contaminant sources based on land cover and the regulated potential pollutant source facilities present, a waterbody type sensitivity rating, and susceptibility ratings for contaminant categories. The information included in these analyses included: GIS analyses of land cover, types and location of facilities, discharge permits, Concentrated Animal Feeding Operations (CAFOs), NYSDEC WI/PWL listings, local health department drinking water history and concerns, and existing lake/watershed reports. Putnam Lake is not utilized as a potable water source, so it has not been evaluated as part of the SWAP.
8.3 CSLAP Scorecard Results from CSLAP activities are forwarded to the New York State Federation of Lake Associations (NYSFOLA) and NYSDEC and are combined into a scorecard detailing potential lake use impact levels and stresses. The scorecards represent a preliminary assessment of one source of data, in this case CSLAP. The WI/PWL updates include the evaluation of multiple data sources, including the CSLAP scorecard preliminary evaluations.
Based on the 2017 CSLAP data, Figure 14 is Putnam Lake’s 2017 scorecard. According to this information, algae levels impact recreation (swimming and boating) and the aesthetic condition of Putnam Lake.

36 | HABS ACTION PLAN - PUTNAM LAKE
Figure 14. Putnam Lake 2017 CSLAP scorecard.
9. Conditions triggering HABs Resilience is an important factor in determining an ecosystem’s ability to respond to and overcome negative impacts (Zhou et al. 2010), including the occurrence and prevalence of HABs. Certain lakes may not experience HABs even though factors hypothesized to be “triggers” (e.g., elevated P concentrations) are realized (Mantzouki et al. 2016), and conversely, lakes that have historically been subject to HABs may still be negatively affected even after one or more triggers have been reduced. Thus, phytoplankton dynamics may cause the presence of HABs to lag behind associated triggers (Faassen et al. 2015). Further, unusual climatic events (e.g., high TP input from spring runoff and hot calm weather in fall) may create unique conditions that contribute to a HAB despite implementation of management strategies to prevent them (Reichwaldt and Ghadouani 2012).
Ecosystems often exhibit a resistance to change that can delay outcomes associated with HABs management. This system resilience demands that prevention and management of these triggers be viewed long-term through a lens of both watershed and in-lake action. It may take significant time following implementation of recommended actions for the frequency, duration, and intensity of HABs to be reduced.
A dataset spanning 2012 to 2017 of 163 waterbodies in New York State has been compiled to help understand the potential triggers of HABs at the state-scale (CSLAP data). This dataset includes information on several factors that may be related to the occurrence of HABs, e.g., lake size and orientation (related to fetch length, or the

37 | HABS ACTION PLAN - PUTNAM LAKE
horizontal distance influenced by wind); average total phosphorus and total nitrogen concentrations; average surface water temperatures; as well as the presence of invasive zebra and quagga mussels (i.e., dreissenid mussels). This data set has been analyzed systematically, using a statistical approach known as logistic regression, to identify the minimum number of factors that best explain the occurrences of HABs in NYS. A minimum number of factors are evaluated to provide the simplest possible explanation of HABs occurrences (presence or absence) and to provide a basis for potential targets for management. One potential challenge to note with this data set is that lakes may have unequal effort regarding HABs observations which could confound understanding of underlying processes of HABs evaluated by the data analysis.
Across New York, four of the factors evaluated were sufficiently correlated with the occurrence of HABs, namely, average total phosphorus levels in a lake, the presence of dreissenid mussels, the maximum lake fetch length and the lake compass orientation of that maximum length. The data analysis shows that for every 0.01 mg/L increase in total phosphorus levels, the probability that a lake in New York will have a HAB in a given year increases by about 10% to 18% (this range represents the 95% confidence interval based on the parameter estimates of the statistical model). The other factors, while statistically significant, entailed a broad range of uncertainty given this initial analysis. The presence of dreissenid mussels is associated with an increase in the annual HAB probability of 18% to 66%. Lakes with long fetch lengths are associated with an increased occurrence of HABs; for every mile of increased fetch length, lakes are associated with up to a 20% increase in the annual probability of HABs. Lastly, lakes with a northwest orientation along their longest fetch length are 10% to 56% more likely to have a HAB in a given year. Each of these relationships are bounded, i.e., the frequency of blooms cannot exceed 100%, meaning that as the likelihood of blooms increases the marginal effect of these variables decreases. While this preliminary evaluation will be expanded as more data are collected on HABs throughout New York, these results are supported by prior literature. For example, phosphorus has long known to be a limiting nutrient in freshwater systems and a key driver of HABs, however the potential role of nitrogen should not be overlooked as HABs mitigation strategies are contemplated (e.g., Conley et al. 2009). Similarly, dreissenid mussels favor HABs by increasing the bioavailability of phosphorus and selectively filtering organisms that may otherwise compete with cyanobacteria (Vanderploeg et al. 2001). The statistically-significant association of fetch length and northwest orientation with HABs may suggest that these conditions are particularly favorable to wind-driven accumulation of cyanobacteria and/or to wind-driven hydrodynamic mixing of lakes leading to periodic pulses of nutrients. While each of these potential drivers of HABs deserve more evaluation, the role of lake fetch length and orientation are of interest and warrant additional study.
There is continuing interest in the possible role of nitrogen in the occurrence and toxicity of HABs (e.g., Conley et al. 2009), and preliminary analysis of this statewide data set suggests that elevated total N and total P concentrations are both statistically significant
38 | HABS ACTION PLAN - PUTNAM LAKE
associates with the occurrence of toxic blooms. When total N and total P concentrations are not included in the statistical model, elevated inorganic nitrogen (NH4 and NOx) concentrations are also positively associated with toxic blooms. The significant association of inorganic N forms with toxic blooms may provide a more compelling association than total N, which may simply be a redundant measure of the biomass associated with toxins.
Of the factors described above, Putnam Lake possesses high phosphorus readings. To evaluate if lake-specific HABs triggers, in addition to those observed at the state scale, were important in Putnam Lake, additional statistical analyses were performed with data spanning from 2013 to 2017. All available HABs observations (bloom/no bloom) were aligned by date with CSLAP water quality data and meteorological data from the Danbury, CT station. Estimated maximum wave heights were calculated from wind speed and direction data, fetch distances across the lake, and water depths along the fetch length. The fetches were measured in 10 degree increments along the compass rose, taking the longest distance across the lake. Using this data, an hourly wave hindcast covering the duration of the wind field measurements was generated (Donelan 1980). As with the statewide data analysis, logistic regression was used to test whether certain variables (e.g., water quality and/or meteorological variables) could explain the occurrences of HABs. Because water quality variables hypothesized to influence HABs are often self-correlated (e.g., total phosphorus and total nitrogen concentrations can often increase or decrease together), the logistic regression was performed in two ways: (1) using the original water quality and meteorological data as possible explanatory variables and (2) by first performing a Principal Components Analysis (PCA) on the explanatory variables and using the PCA axes as explanatory variables in the logistic regression. Principal components analysis is helpful when evaluating data sets with correlated variables because it can recast the original data as an uncorrelated set of “axes” (i.e., linear equations) that are representative of the original input data.
Both approaches to the logistic regression indicated that water quality variables were not significantly correlated with the presence of HABs in Putnam Lake. Often phosphorus is considered the limiting nutrient to phytoplankton growth in freshwater (Schindler 1977); however, it is possible that the number of HABs presence/absence samples included in the dataset did not vary across phosphorus concentrations to observe a statistical relationship. Additionally, a statistical model that included only Julian day (the null model) was the best model based on Akaike information criteria (AIC), which is a measure of the relative quality of a statistical model. This result suggests that when elevated nutrients are present in a system such as Putnam Lake (see Section 6), seasonality (Julian day) may be most important in explaining the presence of HABs. The effect of Julian day simply captures the amalgam of ecological processes that typically play out over the course of a year, such as typical increases in water and air temperature and phytoplankton community dynamics. Continued monitoring of water quality variables in Putnam Lake, coupled with HABs observations (both presence and absence), will facilitate additional analyses to evaluate HAB drivers.
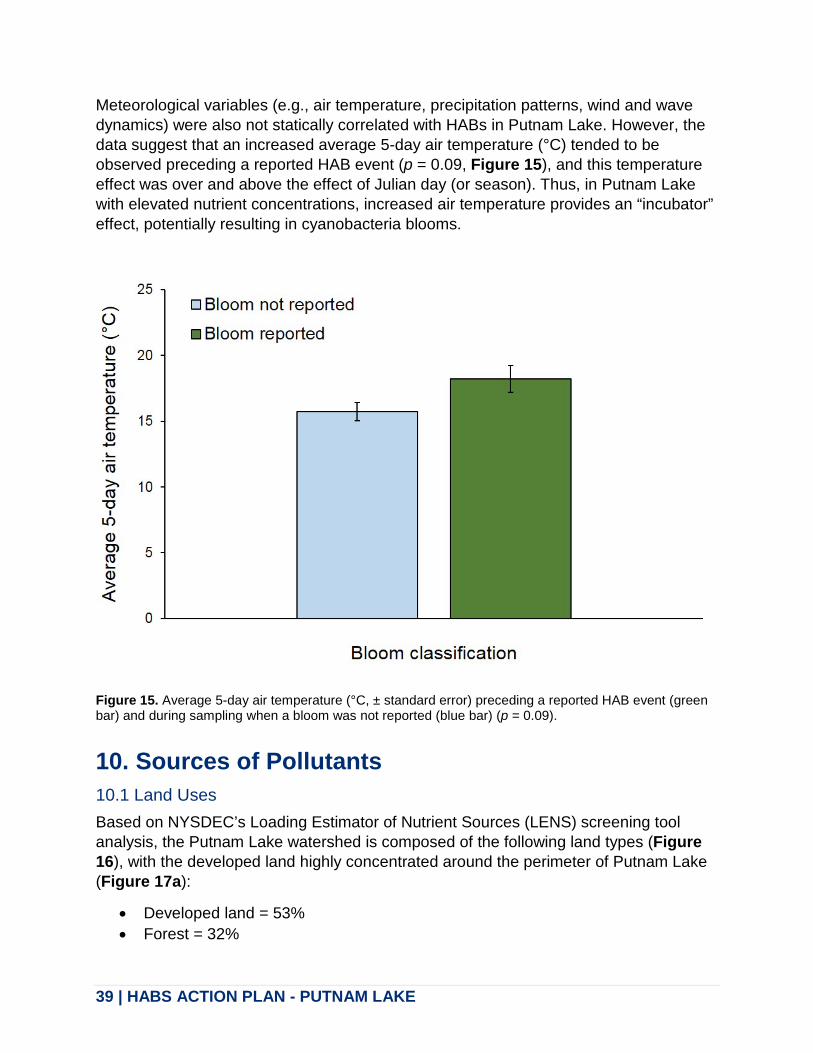
39 | HABS ACTION PLAN - PUTNAM LAKE
Meteorological variables (e.g., air temperature, precipitation patterns, wind and wave dynamics) were also not statically correlated with HABs in Putnam Lake. However, the data suggest that an increased average 5-day air temperature (°C) tended to be observed preceding a reported HAB event (p = 0.09, Figure 15), and this temperature effect was over and above the effect of Julian day (or season). Thus, in Putnam Lake with elevated nutrient concentrations, increased air temperature provides an “incubator” effect, potentially resulting in cyanobacteria blooms.
Figure 15. Average 5-day air temperature (°C, ± standard error) preceding a reported HAB event (green bar) and during sampling when a bloom was not reported (blue bar) (p = 0.09).
10. Sources of Pollutants 10.1 Land Uses Based on NYSDEC’s Loading Estimator of Nutrient Sources (LENS) screening tool analysis, the Putnam Lake watershed is composed of the following land types (Figure 16), with the developed land highly concentrated around the perimeter of Putnam Lake (Figure 17a):
• Developed land = 53% • Forest = 32%

40 | HABS ACTION PLAN - PUTNAM LAKE
• Open water = 13% • Wetlands = 2%
The primary land use within the watershed is developed land. Areas with a higher percentage of developed land (e.g., residential), have a greater likelihood for concentrated runoff and associated stream bank erosion. However, developed land and streambank inputs contribute small(er) percentages of phosphorus loading to Putnam Lake compared to nearshore phosphorus inputs from septic systems (see Section 10.2 below).
NYSDEC’s LENS model analysis was used to identify land use proportions, as indicated above. The external loadings are based on a MapShed analysis and internal pollutant loading was calculated using the Vollenweider equation (Sections 10.2 and 10.3).
Figure 16. Land uses and percentages in the Putnam Lake watershed.

41 | HABS ACTION PLAN - PUTNAM LAKE
Figure 17. (a) Watershed land use and (b) septic system density in the Putnam Lake watershed.

42 | HABS ACTION PLAN - PUTNAM LAKE
10.2 External Pollutant Loadings NYSDEC’s LENS tool is a simple watershed model that uses average, assumed meteorological conditions, estimated average annual loading rates from nonpoint sectors based on accepted literature values, and estimates of point source contribution. It employs the most recent data from the National Land Cover Dataset, septic density information collected by NYS Office of Real Property and Tax, and State Pollution Discharge Elimination System (SPDES) permits. LENS is a screening tool, used by the NYSDEC, intended to assess the relative load contributions by watershed source to help determine the most appropriate watershed management approach (i.e., a TMDL or 9E plan; https://www.dec.ny.gov/docs/water_pdf/dowvision.pdf) and, for purposes of this Action Plan, support prioritization of water quality improvement projects and allocation of associated resources to mitigate HABs (presented in Section 13).
LENS is not designed to be a comprehensive watershed analysis and does not include all data requirements for a Total Maximum Daily Load (TMDL) or Nine Element (9E) Plan. Although LENS output has shown to be consistent with more comprehensive watershed analyses in New York State, there is uncertainty in the watershed loading estimates presented in this Action Plan. For example, LENS does not take into consideration: (1) other potential contributors of nutrients to the lake such as groundwater, consistently underperforming septic systems, and streambank erosion, (2) internal sources of nutrients (e.g., sediments, dreissenid mussels), and (3) existing best management practices (BMPs) and other nutrient reduction measures being implemented by the municipalities, agricultural community, Soil and Water Conservation Districts, and other stakeholders.
Therefore, LENS results discussed here and in subsequent sections should be considered a preliminary approximation of external nutrient sources to the lake. Precise quantification of nutrient sources from the watershed is needed and should be determined through: (1) a detailed inventory of nutrient sources – from all suspected sectors within the watershed, (2) complete a detailed analysis of nutrient load and budget that includes critical factors not accounted for in LENS, (3) the development of a robust land-side nutrient loading model, and (4) completion or update of a NYSDEC approved clean water plan.
This Action Plan should be considered the first step of an adaptive management approach to HABs in Putnam Lake. Any completed TMDL or 9E plan developed for Putnam Lake will supplement the loading assessment included in this report. At that time, this Action Plan can be updated to reflect current and better understanding of Putnam Lake.
Phosphorus load sources within the watershed, estimated using MapShed, can be broken down by contributor type as follows:
• Developed land = 12% • Forest = 1% • Streambank = 22%
43 | HABS ACTION PLAN - PUTNAM LAKE
• Groundwater = 12% • Septic load = 25% • Total external P load: 72%
Nearly half of the phosphorus load to Putnam Lake is attributable to septic loadings and streambank erosion. Septic density surrounding Putnam Lake, which is immediately adjacent to the lake shoreline, is relatively high (Figure 17b). It is important to note that phosphorus attributable to streambank erosion is generally in the form of particulate-bound phosphorus that is less biologically available than dissolved phosphorus associated with septic system effluent. Figure 17b illustrates how the concentrated development around the perimeter of Putnam Lake corresponds with the higher density of septic systems.
10.3 Internal Pollutant Loadings Putnam Lake's relatively high depth-to-area ratio (small, deep lake) limits lake water mixing and likely contributes to seasonal anoxic conditions (lack of dissolved oxygen in the bottom waters, Figure 10). This seasonal anoxia can cause the release of significant amounts of phosphorus from sediments. Internal loading of legacy phosphorus associated with the historical external nutrient loading (e.g., agriculture, untreated wastewater entering lake) has been estimated to be an important source of phosphorus (28% of the annual TP load), and likely contributes to HABs in Putnam Lake.
10.4 Summary of Priority Land Uses and Land Areas Internal loading from legacy phosphorus (28%), septic systems (25%), and tributary loadings (particularly streambank erosion, 22%) are estimated to be the leading contributors of phosphorus to the system.
11. Lake Management / Water Quality Goals The overarching goal of this Putnam Lake Harmful Algal Bloom Action Plan is to minimize the spatial and temporal extent of HABs in Putnam Lake through well planned, targeted nutrient reduction management strategies from all contributing sectors.
Based on the analyses conducted in Section 9, both elevated phosphorus concentrations and meteorological conditions (increased temperature and calm wind conditions) are associated with HABs in Putnam Lake. Thus, management actions focused on reducing phosphorus loading to the lake should be evaluated and implemented to achieve both near- and long-term water quality goals.
44 | HABS ACTION PLAN - PUTNAM LAKE
12. Summary of Management Actions to Date 12.1 Local Management Actions Algaecide treatment of Putnam Lake was conducted in mid-July 2014, early and mid-summer 2015, and early summer 2016 in an effort to reduce the amount of algae in the lake. This treatment affected both open water and shoreline algae levels (CSLAP 2015).
The Putnam Lake Park District is conducting an independent study of the lake to complement the CSLAP program and develop a comprehensive lake and watershed management plan for Putnam Lake. This effort is aimed at improving water quality and balancing ecological sustainability with recreational opportunity. The study is planned to be completed in three phases (Putnam Lake Park District 2018):
1. Aquatic macrophyte survey: Identify aquatic macrophytes and algae taxa and their locations and densities.
2. In-lake monitoring survey: Perform water quality sampling in early spring, mid-summer, and early fall to supplement the CSLAP data.
3. Bathymetry survey: Utilize the SUNY Purchase 2011 bathymetric survey to guide and inform potential management alternatives.
12.2 Funded Projects Limited information exists on projects funded to improve water quality in Putnam Lake or its watershed (see Section 5 for an overview of previous monitoring actions).
The State’s Agricultural Environmental Management (AEM) and Agricultural Nonpoint Source Abatement and Control (ANSACP) programs provides resources for the planning and implementation of best management practices on farms to protect water quality. There are twenty-three farms in Putnam County that have implemented nearly forty types of best management practice associated with agricultural operations, however, none of these farms are within the boundaries of the Putnam Lake watershed. Additional work has been performed by Watershed Agricultural Council in the East of Hudson Watershed.
12.3 NYSDEC Issued Permits Article 17 of New York’s Environmental Conservation Law (ECL) entitled “Water Pollution Control" was enacted to protect and maintain the state’s surface water and groundwater resources. Under Article 17, the State Pollutant Discharge Elimination System (SPDES) program was authorized to maintain reasonable standards of purity for state waters.
The NYSDEC has issued Individual SPDES Permits within the Town of Patterson (NYSDEC SPDES Permit Program, undated). For more information about NYSDEC’s SPDES program and to view Individual SPDES permits issued visit http://www.dec.ny.gov/permits/6054.html.

45 | HABS ACTION PLAN - PUTNAM LAKE
12.4 Research Activities Limited information exists on current research activities that focus on Putnam Lake’s water quality condition. Section 5 provides an overview of the previous monitoring and research activities for the lake.
12.5 Clean Water Plans (TMDL, 9E, or Other Plans) Clean water plans are a watershed-based approach to outline a strategy to improve or protect water quality. TMDL and 9E Plans are examples of clean water plans; these plans document the pollution sources, pollutant reduction goals and recommend strategies/actions to improve water quality:
• A TMDL calculates the maximum amount of a single pollutant that a waterbody can receive and still meet water quality standards. TMDLs are developed by determining the amount that each source of a pollutant can discharge into the waterbody and the reductions from those sources needed to meet water quality standards. A TMDL is initiated by NYSDEC for waterbodies that are on the 303d impaired waters list with a known pollutant.
• 9E Watershed Plans are consistent with the USEPA's framework to develop watershed-based plans. USEPA's framework consists of nine key elements that are intended to identify the contributing causes and sources of nonpoint source pollution, involve key stakeholders in the planning process, and identify restoration and protection strategies that will address the water quality concerns. The nine minimum elements to be included in these plans include:
A. Identify and quantify sources of pollution in watershed. B. Identify water quality target or goal and pollutant reductions needed to
achieve goal. C. Identify the BMPs that will help to achieve reductions needed to meet water
quality goal/target. D. Describe the financial and technical assistance needed to implement BMPs
identified in Element C. E. Describe the outreach to stakeholders and how their input was incorporated
and the role of stakeholders to implement the plan. F. Estimate a schedule to implement BMPs identified in plan. G. Describe the milestones and estimated time frames for the implementation of
BMPs. H. Identify the criteria that will be used to assess water quality improvement as
the plan is implemented. I. Describe the monitoring plan that will collect water quality data need to
measure water quality improvement (criteria identified in Element H).

46 | HABS ACTION PLAN - PUTNAM LAKE
9E Plans are best suited for waterbodies where the pollutant of concern is well understood and nonpoint sources are likely a significant part of the pollutant load; the waterbody does not need to be on the 303d impaired waters list to initiate a 9E Plan.
As discussed in Section 10.1, NYSDEC used several appropriate tools to assess the potential sources, nutrient loadings, and estimation of reductions needed to achieve water quality standards for impaired or potentially impaired New York waters. The NYSDEC completed a Phase I TMDL in 1997 for phosphorus within the contributing basins and sub-basins to the twelve East of Hudson reservoirs. The Phase II TMDL was completed in 2000 and a Phase II Implementation Plan was issued in 2009. The NYCDEP has also adopted a TMDL for phosphorus within the contributing basins and sub-basins to the eight impaired East of Hudson reservoirs.
13. Proposed Harmful Algal Blooms (HABs) Actions13.1 Overarching Considerations When selecting projects intended to reduce the frequency and severity of HABs, lake and watershed managers may need to balance many factors. These include budget, available land area, landowner willingness, planning needs, community priorities or local initiatives, complementary projects or programs, water quality impact or other environmental benefit (e.g., fish/habitat restoration, flooding issues, open space).
Additional important considerations include (1) the types of nutrients, particularly phosphorus, involved in triggering HABs, (2) confounding factors including climate change, and (3) available funding sources (discussed in Section 13.2).
13.1.1 Phosphorus Forms As described throughout this Action Plan, a primary factor contributing to HABs in the waterbody is excess nutrients, in particular, phosphorus. Total phosphorus (TP) is a common metric of water quality and is often the nutrient monitored for and targeted in watershed and lake management strategies to prevent or mitigate eutrophication (Cooke et al. 2005).
However, TP consists of different forms (Dodds 2003) that differ in their ability to support algal growth. There are two major categories of phosphorus: particulate and dissolved (or soluble). The dissolved forms of P are more readily bioavailable to phytoplankton than particulate forms (Auer et al. 1998, Effler et al. 2012, Auer et al. 2015, Prestigiacomo et al. 2016). Phosphorus bioavailability is a term that refers to the usability of specific forms of phosphorus by phytoplankton and algae for assimilation and growth (DePinto et al. 1981, Young et al. 1982).
Because of the importance of dissolved P forms affecting receiving waterbody quality, readers of the Action Plan should consider the source and form of P, in addition to project-specific stakeholder interest(s), when planning to select and implement the
47 | HABS ACTION PLAN - PUTNAM LAKE
recommended actions, best management practices or management strategies in the Action Plan. Management of soluble P is an emerging research area; practices designed for conservation of soluble phosphorus are recommended in Sonzogni et al. 1982, Ritter and Shiromohammadi 2000, and Sharpley et al. 2006.
13.1.2 Climate Change
Climate change is also an important consideration when selecting implementation projects. There is still uncertainty in the understanding of BMP responses to climate change conditions that may influence best management practice efficiencies and effectiveness. More research is needed to understand which BMPs will retain their effectiveness at removing nutrient and sediment pollution under changing climate conditions, as well as which BMPs will be able to physically withstand changing conditions expected to occur because of climate change.
Where possible, selection of BMPs should be aligned with existing climate resiliency plans and strategies (e.g., floodplain management programs, fisheries/habitat restoration programs, or hazard mitigation programs). When selecting BMPs, it is also important to consider seasonal, inter-annual climate or weather conditions and how they may affect the performance of the BMPs. For example, restoration of wetlands and riparian forest buffers not only filter nutrients and sediment from overland surface flows, but also slow runoff and absorb excessive water during flood events, which are expected to increase in frequency due to climate change. These practices not only reduce disturbance of the riverine environment but also protect valuable agricultural lands from erosion and increase resiliency to droughts.
In New York State, ditches parallel nearly every mile of our roadways and in some watersheds, the length of these conduits is greater than the natural watercourses themselves. Although roadside ditches have long been used to enhance road drainage and safety, traditional management practices have been a significant, but unrecognized contributor to flooding and water pollution, with ditch management practices that often enhance rather than mitigate these problems. The primary objective has been to move water away from local road surfaces as quickly as possible, without evaluating local and downstream impacts. As a result, elevated discharges increase peak stream flows and exacerbate downstream flooding. The rapid, high volumes of flow also carry nutrient-laden sediment, salt and other road contaminants, and even elevated bacteria counts, thus contributing significantly to regional water quantity and quality concerns that can impact biological communities. All of these impacts will be exacerbated by the increased frequency of high intensity storms associated with climate change. For more information about road ditches, see Appendix E.
For more information about climate change visit NYSDEC’s website (https://www.dec.ny.gov/energy/44992.html) and the Chesapeake Bay Climate

48 | HABS ACTION PLAN - PUTNAM LAKE
Resiliency Workgroup Planning Tools and Resources website (https://www.chesapeakebay.net/documents/Resilient_BMP_Tools_and_Resources_November_20172.pdf).
13.2 Priority Project Development and Funding Opportunities The priority projects listed below have been developed by an interagency team and local steering committee that has worked cooperatively to identify, assess feasibility and costs, and prioritize both in-lake and watershed management strategies aimed at reducing HABs in Putnam Lake.
Steering committee members:
• Lori Emery, NYCDEP• Jennifer Clifford, NYSDAM• Bob Capowski, NYCDEC• Shohreh Karimipour, NYSDEC• Tom Snow, NYSDEC• Lauri Taylor, Putnam County Department of Planning• Michael Nesheiwat, Putnam County Health Department• Lauri Taylor, Putnam County Soil and Water Conservation Districts (SWCD)• Hank Earle, Putnam Lake Park District• William Wegner, Riverkeeper• Richard Williams Sr., Town of Patterson• Paul Heisig, United States Geological Survey (USGS)• Gibson Dunford, Watershed Agricultural Council (East of Hudson)
These projects have been assigned priority rankings based on the potential for each individual action to achieve one of two primary objectives of this HABs Action Plan:
1. In-lake management actions: Minimize the internal stressors (e.g., nutrientconcentrations, dissolved oxygen levels, temperature) that contribute to HABswithin Putnam Lake.
2. Watershed management actions: Address watershed inputs that influence in-lakeconditions that support HABs.
As described throughout this HABs Action Plan, the primary factors that contribute to HABs in Putnam Lake include:
• Phosphorus inputs associated with septic system discharge.• Internal loading of legacy phosphorus from in-lake sediments.• Nonpoint source nutrient inputs from the contributing watershed.
The management actions identified below have been prioritized to address these sources. Projects were prioritized based on the following cost-benefit and project readiness criteria: local support or specific recommendation by steering committee members, eligibility under existing funding mechanisms, and expected water quality

49 | HABS ACTION PLAN - PUTNAM LAKE
impacts as determined by the interagency team. Additionally, nutrient forms and the impacts of climate change were considered in this prioritization as described above.
The implementation of the actions outlined in this Action Plan is contingent on the submittal of applications (which may require, for example, landowner agreements, feasibility studies, funding match, or engineering plans), award of funding, and timeframe to complete implementation. Due to these contingencies, recommended projects are organized into broad implementation schedules: short-term (3 years), mid-term (3-5 years), and long-term (5-10 years).
Funding Programs
The recommended actions outlined in this Section may be eligible for funding from the many state, federal and local/regional programs that help finance implementation of projects in New York State (see https://on.ny.gov/HABsAction). The New York State Water Quality Rapid Response Team stands ready to assist all partners in securing funding. Some of the funding opportunities available include:
The New York State Environmental Protection Fund (EPF) was created by the state legislation in 1993 and is financed primarily through a dedicated portion of real estate transfer taxes. The EPF is a source of funding for capital projects that protect the environment and enhance communities. Several NYS agencies administer the funds and award grants, including NYSDAM, NYSDEC, and Department of State. The following two grant programs are supported by the EPF to award funding to implement projects to address nonpoint source pollution:
The Agricultural Nonpoint Source Abatement and Control Program (ANSACP), administered by the NYSDAM and the Soil and Water Conservation Committee, is a competitive financial assistance program for projects led by the Soil and Water Conservation Districts that involves planning, designing, and implementing priority BMPs. It also provides cost-share funding to farmers to implement BMPs. For more information visit https://www.nys-soilandwater.org/aem/nonpoint.html.
The Water Quality Improvement Program (WQIP), administered by the NYSDEC Division of Water, is a competitive reimbursement program for projects that reduce impacted runoff, improve water quality, and restore habitat. Eligible applicants include municipalities, municipal corporations, and Soil and Water Conservation Districts.
The Environmental Facilities Corporation (EFC) is a public benefit corporation which provides financial and technical assistance, primarily to municipalities through low-cost financing for water quality infrastructure projects. EFC’s core funding programs are the Clean Water State Revolving Fund and the Drinking Water State Revolving Fund. EFC administers both loan and grant programs, including the Green Innovation Grant Program (GIGP), Engineering Planning Grant Program (EPG), Water Infrastructure Improvement Act (WIIA), and the Septic System Replacement Program. For more information about the programs and application process visit https://www.efc.ny.gov/.

50 | HABS ACTION PLAN - PUTNAM LAKE
Wastewater Infrastructure Engineering Planning Grant is available to municipalities with median household income equal to or less than $65,000 according to the United States Census 2015 American Community Survey or equal to or less than $85,000 for Long Island, NYC and Mid-Hudson Regional Economic Development Council (REDC) regions. Priority is usually given to smaller grants to support initial engineering reports and plans for wastewater treatment repairs and upgrades that are necessary for municipalities to successfully submit a complete application for grants and low interest financing.
Clean Water Infrastructure Act (CWIA) Septic Program funds county-sponsored and administered household septic repair grants. This program entails repair and/or replacement of failing household septic systems in hot-spot areas of priority watersheds. Grants are channeled through participating counties.
CWIA Inter-Municipal Grant Program funds municipalities, municipal corporations, as well as soil and water conservation districts for wastewater treatment plant construction, retrofit of outdated stormwater management facilities, as well as installation of municipal sanitary sewer infrastructure.
CWIA Source Water Protection Land Acquisition Grant Program funds municipalities, municipal corporations, soil and water conservation districts, as well as not-for-profits (e.g., land trusts) for land acquisition projects providing source water protection. This program is administered as an important new part of the Water Quality Improvement Project program.
Consolidated Animal Feeding Operation Waste Storage and Transfer Program Grants fund soil and water conservation districts to implement comprehensive nutrient management plans through the completion of agricultural waste storage and transfer systems on larger livestock farms.
Water Infrastructure Improvement Act Grants funds municipalities to perform capital projects to upgrade or repair wastewater treatments plants and to abate combined sewer overflows, including projects to install heightened nutrient treatment systems.
Green Innovation Grant Program provides municipalities, state agencies, private entities, as well as soil and water conservation districts with funds to install transformative green stormwater infrastructure.
Readers of this Action Plan that are interested in submitting funding applications are encouraged to reference this Action Plan and complementary planning documents (i.e., TMDLs or 9E Plans) as supporting evidence of the potential for their proposed projects to improve water quality. However, applicants must thoroughly review each funding program’s eligibility, match, and documentation requirements before submitting applications to maximize their potential for securing funding.

51 | HABS ACTION PLAN - PUTNAM LAKE
There may be recommended actions that are not eligible for funding through existing programs, however, there may be opportunities to implement actions through watershed programs (https://www.dec.ny.gov/chemical/110140.html) or other mechanisms.
13.3 Putnam Lake Priority Projects 13.3.1 Priority 1 Projects Priority 1 projects are considered necessary to manage water quality and reduce HABs in Putnam Lake, and implementation should be evaluated to begin as soon as possible.
Short-term (3 years)
1. Evaluate the use of nutrient inactivants to address internal nutrient loading. If this evaluation determines that inactivants can be safely and effectively applied to the lake and is likely to reduce phosphorus release from lake sediment, apply nutrient inactivant to approximately 200 acres of Putnam Lake to sequester the legacy phosphorus within the bottom sediments.
a. Note that New York State is developing an approach for safely and legally using nutrient inactivants, and until that process is completed, the use of any inactivants in Putnam Lake is prohibited.
b. Prior to implementation, an engineering study as well as regulatory approvals from the NYCDEP, NYSDEC, USACE, and other agencies, will be needed.
Mid-term (3 to 5 years)
1. Construct a wastewater treatment plant (WWTP) and install infrastructure required to connect up to 1,200 houses within the New York State portion of Putnam Lake watershed, thereby removing up to 240,000 gallons/day of sanitary effluent from Putnam Lake.
a. Prior to implementation, the following will need to be completed:
i. Prepare an Engineering Report (expected in June 2018) to evaluate the potential to install a wastewater treatment system. The Engineering Report should also include an evaluation of the potential to install alternative septic systems (e.g., cluster systems that provide on-site wastewater treatment to multiple residences) through a revolving loan and grant program if installation of a wastewater treatment system is infeasible.
ii. Receive project approval from the Town of Patterson and/or approval of a referendum for long-term funding.
iii. Apply for and receive regulatory approvals from the NYCDEP, NYSDEC, and other agencies.

52 | HABS ACTION PLAN - PUTNAM LAKE
2. Implement multiple stormwater BMPs to reduce sediment loading into Putnam Lake.
a. Acquire land and/or establish conservation easements on high-priority, water quality sensitive lands within the watershed.
b. Preserve hillside integrity with vegetation or other stabilizing material to minimize runoff. Utilize natural depressions and sediment catches in roadside ditches, particularly along steep slopes to limit nonpoint source nutrient loads from within the watershed.
c. Implement roadside ditch improvement projects that are likely to contribute the greatest reduction in erosion. Best management practices could include:
i. timing of cleanout to minimize vegetative loss.
ii. check dams to reduce water velocity and erosion potential.
iii. properly sizing culverts and stream channels to avoid incision, downcutting, aggradation and other erosion.
iv. use of vegetative cover to assist in ditch bank stabilization.
d. If streams within the Putnam Lake watershed are contributing to high nutrient loads, install stormwater management basins or wetlands or enhance existing wetlands at Lake inlets or along the tributaries. Such work should be supported by a strategic assessment to identify best locations to situate projects.
e. Install retrofits to replace existing stormwater management facilities that were installed prior to the promulgation of Article 17, Titles 7, 8, and Article 70 of the New York State Environmental Conservation Law. Approaches may include green roofs, permeable pavement, rain gardens, vegetated riparian buffers, sediment traps, water and sediment control basins (WASCoBs), and urban treescapes in developed areas.
Long-term (5 to 10 years)
1. If nutrient inactivant application proves infeasible, bottom sediment could be dredged and disposed of off-site to reduce re-sedimentation and periodic introduction of legacy phosphorus into the water column.
a. Prior to implementation, an engineering study and regulatory approvals from the NYCDEP, NYSDEC, USACE, and other agencies would be needed.

53 | HABS ACTION PLAN - PUTNAM LAKE
13.3.2 Priority 2 Projects Priority 2 projects are considered necessary, but may not have a similar immediate need as Priority 1 projects.
Short-term (3 years)
1. Purchase a street sweeping vacuum truck to prevent sediment and organic debris from entering storm drains, ditches, tributaries, and Putnam Lake. A joint application request by multiple municipalities is recommended so equipment can be used through a shared services agreement. Note that the Town of Patterson owns one street sweeping vacuum truck and one street sweeping truck that are used in the spring and periodically as needed. These resources should be considered when evaluating additional equipment needs and scheduling usage.
Mid-term (3 to 5 years)
1. Stabilize riparian habitat through funding conservation easements and installing vegetative plantings and stream stabilization structures (e.g., rock or log vanes, rock or log revetments). A landscape analysis to identify priority locations needs to be completed prior to implementation.
a. Establish vegetated riparian buffers to inhibit or restrict nutrient-rich stormwater runoff and eroded soil from reaching the lake or tributary streams.
b. Rehabilitate degraded vegetated buffers to improve riparian habitat function.
Long-term (5 to 10 years)
1. Install a deep-water aeration system to maintain aerobic conditions within the bottom waters of Putnam Lake and minimize the release of legacy phosphorus from sediments during stratification. Additional analysis will need to be completed to determine if deep water aeration is feasible and will be effective at addressing HABs.
13.4 Additional Watershed Management Actions In addition to the priority actions identified above by the steering committee, the following watershed management actions could be considered:
1. Restore and/or maintain wetland and floodplains targeted at sediment and nutrient reduction.
2. Develop an inspection, monitoring, reporting, and improvement program to educate and enlist the support of its members to maximize the functionality of its septic systems and minimize phosphorus contribution to the lake. This program should be consistent with the MS4 General Permit.

54 | HABS ACTION PLAN - PUTNAM LAKE
3. Emphasize phosphorus source control in stormwater management plans, targeting areas with high levels of phosphorus runoff. Emphasis should be placed on locations within the Putnam Lake watershed that have a combination of relatively high percentages of impervious cover, small lot sizes, and/or compacted soils.
4. Evaluate locations where animal wastes are concentrated (e.g., pet stores and animal care/boarding facilities) for illicit connections and exposure to stormwater, and provide them with tailored education and outreach materials.
5. Evaluate locations where yard or food wastes are stored (e.g., “dumpsters” serving restaurants and grocery stores, yard waste composting and disposal areas) for illicit connections and exposure to stormwater and provide them with tailored education and outreach materials.
6. Implement an educational outreach program to inform landowners of stewardship actions that could improve lake quality. Topics could include how the use of fertilizers and the discharge from septic systems influences water quality. Demonstration projects should be completed to illustrate actions that homeowners can duplicate on their property (e.g. raingardens).
7. Develop curriculum for K-12 to educate students about water resources, nutrient pollution, harmful algal blooms, and personal and community actions that can help reduce nutrient pollution to waterbodies.
13.5 In-Lake Management Actions Reductions in phosphorus loading from external point and nonpoint sources should be the primary objective to reduce the amount of phosphorus entering the lake. Second, in-lake management actions can be used to minimize the mobilization of legacy phosphorus from lake sediments, thereby minimizing concentrations that are likely contributing to HABs. Controlled use of an algaecide could continue to be employed to reduce HABs until these other actions become more effective, though this action will not reduce phosphorus within the system.
13.6 Monitoring Actions To help determine the stresses that lead to potential HABs in Putnam Lake and to assess improvements associated with management actions, the following monitoring actions are recommended for evaluation:
Short-term
1. Continue annual CSLAP sampling in order to evaluate long-term trends in nutrient loading and occurrences of HABs. In addition, collect seasonal temperature and dissolved oxygen profiles to further understanding of mixing dynamics and to refine estimates of internal loading in Putnam Lake.

55 | HABS ACTION PLAN - PUTNAM LAKE
2. Continue to collect toxin concentration data during HAB events, particularly when large or lakewide blooms occur. This information will be critical to protect public health, issue advisories, and in conjunction with water quality measurements, provide insight into conditions that lead to blooms with undesirable toxin concentrations. Note that toxin analysis should be accompanied by continued surveillance, documentation, and reporting of the blooms themselves, either through CSLAP or through an independent monitoring network within the lake community that looks for and reports blooms to a local outreach coordinator.
3. Collect data regarding the taxa of cyanobacteria and toxin concentrations within Putnam Lake during early summer months (i.e., prior to bloom season) to better understand the lake dynamics.
4. Analyze water quality samples for soluble forms of phosphorus to better understand how much is available to algae for growth, relative to total phosphorus concentrations (e.g., particulate phosphorus).
13.7 Research Actions To help minimize the stresses that lead to HABs, the following research actions may be considered:
Short-term
1. Evaluate upstream sources of nutrients and measure nutrient levels in tributaries where they enter Putnam Lake to fully characterize watershed inputs. Empirically quantifying the watershed nonpoint source loadings through tributary water quality analyses will inform the effectiveness and benefit of stream stabilization projects relative to septic systems and in-lake management actions.
2. Measure phosphorus concentrations within lake sediments to evaluate the potential for internal loading during periodic anoxia.
3. Evaluate the potential to utilize functional traits of dominant cyanobacteria in Putnam Lake to implement strategies aimed at successfully controlling and managing their abundance. In Putnam Lake, the two dominant cyanobacteria that have been documented include Microcystis and Woronichinia. These two genera are known to regulate their buoyancy within the water column, rising towards the surface to capture adequate sunlight needed for photosynthesis and growth.
a. Evaluate the effectiveness of artificial mixing to potentially overcome the buoyancy ability of Microcystis and Woronichinia. Altering the mixing regime in Putnam Lake may limit the competitive advantage of dominant cyanobacteria to stay within the upper waters, photosynthesize, and become abundant.
4. Evaluate the impact of traditional copper algaecides on:
56 | HABS ACTION PLAN - PUTNAM LAKE
a. toxin liberation, thereby subjecting recreational users to toxins after treatment outside of bathing beaches
b. zooplankton populations
c. other lake biota
5. Evaluate the use of alternatives to Cutrine, including other chelated copper formulations and hydrogen peroxide.
6. Complete a study to evaluate the influence of groundwater and septic inputs on phosphorus concentrations within Putnam Lake. This study should be consistent with the study completed by the USGS in 2000 for the Croton Watershed (USGS 2000).
NYSDEC should support research to better understand how to target dissolved phosphorus with traditional and innovative nonpoint source best management practices. The NYSDEC should continue to coordinate with local organizations and research groups to maximize the efficacy of research efforts with the shared goal of maintaining the water quality within Putnam Lake. Specifically, the role of nitrogen concentrations in the production of toxins by cyanobacteria should be studied and management actions targeted at optimizing the nutrient levels to minimize the production of toxins associated with HABs.
The NYSDEC should support research to better understand how to target dissolved phosphorus with traditional and innovative nonpoint source best management practices. This applied research would guide selection of appropriate BMPs to target dissolved phosphorus in the future.
The NYSDEC should support research to understand and identify which best management practices will retain their effectiveness at removing nutrient and sediment pollution under changing climate conditions, as well as which BMPs will be able to physically withstand changing conditions expected to occur as a result of climate change. This applied research would guide selection of appropriate BMPs in the future and determination of the likely future effectiveness of existing BMPs.
The NYSDEC should support research to investigate the role of climate change on lake metabolism, primary production, nutrient cycling, and carbon chemistry.
13.8 Coordination Actions The following actions are opportunities for stakeholders, general public, steering committee members, federal state, and local partners to collaborate, improve project or program integration, enhance communication and increase implementation. The actions are intended to increase collaboration and cooperation in the overall advancement of this HABs Action Plan. These actions will likely change or expand as the Action Plan is

57 | HABS ACTION PLAN - PUTNAM LAKE
implemented and/or research is completed, or when opportunities for coordination are identified.
Short-term
1. Encourage public participation in initiatives for reducing phosphorus anddocumenting/tracking HABs, such as volunteer monitoring networks and/orincreasing awareness of procedures to report HABs to NYSDEC.
2. Improve coordination between NYSDEC and owners of highway infrastructure(state, county, municipal) to address road ditch management; including, identifypractices, areas of collaboration with other stakeholder groups, and evaluation ofcurrent maintenance practices.
3. Continue to support and provide targeted training (e.g., ditch management,emergency stream intervention, sediment and erosion controls, prescribedgrazing, conservation skills, etc.) to municipal decision makers, SWCDs, andpersonnel in order to underscore the importance of water quality protection aswell as associated tools and strategies.
Long-term
1. Identify opportunities to encourage best management practice implementationthrough financial incentives and alternative cost-sharing options.
2. Coordinate with Department of Health to support the local health departments toimplement onsite septic replacement and inspection activities.
3. Identify areas to improve efficiency of existing funding programs that will benefitthe application and contracting process. For example, develop technicalresources to assist with application process and BMP selection, identify financialresources needed by applicants for engineering and feasibility studies.
4. Support evaluation of watershed rules and regulations.
13.9 Long-term Use of Action Plan This Action Plan is intended to be an adaptive document that may require updates and amendments, or evaluation as projects are implemented, research is completed, new conservation practices are developed, implementation projects are updated, or priority areas within the watershed are better understood.
Local support and implementation of each plan’s recommended actions are crucial to successfully preventing and combatting HABs. The New York State Water Quality Rapid Response Team has established a one-stop shop funding portal and stands ready to assist all localities in securing funding and expeditiously implementing priority projects.

58 | HABS ACTION PLAN - PUTNAM LAKE
Communities and watershed organizations are encouraged to review the plan for their lake, particularly the proposed actions, and work with state and local partners to implement those recommendations. Individuals can get involved with local groups and encourage their communities or organizations to take action.
Steering committee members are encouraged to coordinate with their partners to submit funding applications to complete implementation projects. For more information on these funding opportunities, please visit https://on.ny.gov/HABsAction.

59 | HABS ACTION PLAN - PUTNAM LAKE
14. References Allied Biological. 2013. Putnam Lake Water Quality Report.
http://www.putnamlakeparkdistrict.com/docs/WaterQualityResults053013.pdf.http://www.putnamlakeparkdistrict.com/docs/WaterQualityResults053013.pdf.
Auer, M.T., K.A. Tomasoski, M.J. Babiera, M. Needham, S.W. Effler, E.M. Owens, and J.M. Hansen, 1998. Phosphorus Bioavailability and P-Cycling in Cannonsville Reservoir. Lake and Reservoir Management 14:278-289.
Auer, M.T., Downer, B.E., Kuczynski, A., Matthews, D.A., and S.W. Effler. 2015. Bioavailable Phosphorus in River and Wastewater Treatment Plane Discharges to Cayuga Lake. 28 p.
Baker, D. B., Confesor, R., Ewing, D. E., Johnson, L. T., Kramer, J. W., and Merryfield, B. J. 2014. Phosphorus loading to Lake Erie from the Maumee, Sandusky and Cuyahoga rivers: The importance of bioavailability. Journal of Great Lakes Research, 40(3), 502-517.
Canfield, et al. 1983. Trophic State Classification of Lakes with Aquatic Macrophytes. Canadian Journal of Fisheries and Aquatic Sciences 40(10): 1713-1718.
Citizen Statewide Lake Assessment Program (CSLAP). 2015. CSLAP 2015 Lake Water Quality Summary: Putnam Lake.
Citizen Statewide Lake Assessment Program (CSLAP). 2016. CSLAP 2016 Lake Water Quality Summary: Putnam Lake.
Conley, D. J., H.W. Paerl, R.W. Howarth, D.F. Boesch, S.P. Seitzinger, K.E. Havens, C. Lancelot, and G.E. Likens. 2009. Controlling eutrophication: nitrogen and phosphorus. Science, 323(5917), 1014-1015.
Cooke, G.D., E.B. Welch, S.A. Peterson, and S.A. Nichols, 2005. Restoration and Management of Lakes and Reservoirs. Taylor and Francis, CRC Press, Boca Raton, Florida.
DePinto, J.V., 1982. An Experimental Apparatus for Evaluating Kinetics of Available Phosphorous Release from Aquatic Particulates. Water Research 16:1065-1070.
Dodds, W.K.. 2003. Misuse of Inorganic N and Soluble Reactive P Concentrations to Indicate Nutrient Status of Surface Waters. Journal of North American Benthological Society 22:171-181.
Donelan, M.A. 1980. Similarity theory applied to the forecasting of wave heights, periods and directions. In: Proceedings of Canadian Coastal Conference. National Research Council of Canada, pp. 47-61.
Effler, S.W., M.T. Auer, F. Peng, M.G. Perkins, S.M. O’Donnell, A.R. Prestigiacomo, D.A. Matthews, P.A. DePetro, R.S. Lambert, and N.M. Minott, 2012. Factors

60 | HABS ACTION PLAN - PUTNAM LAKE
Diminishing the Effectiveness of Phosphorus Loading from Municipal Waste Effluent: Critical Information for TMDL Analyses. Water Environment Research 84:254-264.
Evans, B.M. and K.J. Corradini. 2012. MapShed Version 1.5 User Guide. http://www.mapshed.psu.edu/Downloads/MapShedManual.pdf.
Faassen, E.J., Veraart, A.J., Van Nes, E.H., Dakos, V., Lurling, M., and Scheffer, M. 2015. Hysteresis in an experimental phytoplankton population. Oikos 124: 1617-1623.
Filstrup, C.T., A.J Heathcote, D.L. Kendall, and J.A. Downing. 2016. Phytoplankton taxonomic compositional shifts across nutrient and light gradients in temperate lakes. Inland Waters 6:234-249.
Findlay, S.E.G., and V.R. Kelly. 2011. Emerging indirect and long-term road salt effects on ecosystems. Annals of the New York Academy of Sciences 1223(1): 58-68.
Forsberg, C. and S.O. Ryding. 1980. Eutrophication parameters and trophic state indices in 30 Swedish waste-receiving lakes. Arch. Hydrobiol. 89: 189-207.
Gobler, C.J., Burkholder, J.M., Davis, T.W., Harke, M.J., Johengen, T., Stow, C.A., and Van de Waal, D.B. 2016. The dual role of nitrogen supply in controlling the growth and toxicity of cyanobacterial blooms. Harmful Algae 54: 87-97.
Kleinman, P. J., Sharpley, A. N., McDowell, R. W., Flaten, D. N., Buda, A. R., Tao, L., and Zhu, Q. (2011). Managing agricultural phosphorus for water quality protection: principles for progress. Plant and soil, 349(1-2), 169-182.
Kring, S.A., Figary, S.E., Boyer, G.E., Watson, S.B., and Twiss, M.R. 2014. Rapid in situ measures of phytoplankton communities using the bbe FluoroProbe: evaluation of spectral calibration, instrument intercompatibility, and performance range. Can. J. Fish. Aquat. Sci. 71(7): 1087-1095.
Lee, G. F., Jones, R. A., and Rast, W. 1980. Availability of phosphorus to phytoplankton and its implications for phosphorus management strategies. Phosphorus Management Strategies for Lakes, 259, 308.
Logan, T. J., and Adams, J. R. 1981. The Effects of Reduced Tillage on Phosphate Transport from Agricultural Land. OHIO STATE UNIV COLUMBUS DEPT OF AGRONOMY.
Lv, J., Wu, H. and Chen, M., 2011. Effects of nitrogen and phosphorus on phytoplankton composition and biomass in 15 subtropical, urban shallow lakes in Wuhan, China. Limnologica-Ecology and Management of Inland Waters, 41(1), pp.48-56.
Mantzouki, E., Visser, P.M., Bormans, M., and Ibelings, B.W. 2016. Understanding the key ecological traits of cyanobacteria as a basis for their management and control in changing lakes. Aquatic Ecology 50(3): 333-350.
61 | HABS ACTION PLAN - PUTNAM LAKE
New York State Department of Environmental Conservation (NYSDEC). 2008. Lower Hudson River Waterbody Inventory/Priority Waterbodies List. East Branch Croton River Watershed: Lost Lake, Putnam Lake (1302-0053). Revised July 11, 2008.
New York State Department of Environmental Conservation (NYSDEC). 2018a. Environmental Resource Mapper. http://www.dec.ny.gov/gis/erm/.http://www.dec.ny.gov/gis/erm/.
New York State Department of Environmental Conservation (NYSDEC). 2018b. Lower Hudson Watershed. http://www.dec.ny.gov/lands/48367.html.http://www.dec.ny.gov/lands/48367.html.
New York State Department of Environmental Conservation (NYSDEC). State Pollutant Discharge Elimination System (SPDES) Permit Program. https://www.dropbox.com/sh/hz3spt98h4d88ue/AADmNLcYxcpZQFeWUNAxGMi9a?dl=0
New York State Department of Health (NYSDOH). 2017. Harmful Blue-green Algae Blooms: Understanding the Risks of Piping Surface Water into Your Home. https://health.ny.gov/publications/6629.pdf.
New York State Department of Health (NYSDOH). 2018. New York State Health Advice on Eating Fish You Catch. https://www.health.ny.gov/environmental/outdoors/fish/health_advisories/.https://www.health.ny.gov/environmental/outdoors/fish/health_advisories/.
New York State Federation of Lake Associations (NYSFOLA). 2009. Diet for a Small Lake - The Expanded Guide to New York State Lake and Watershed Management. Second Edition, 2009.
Novotny, E.V., Murphy, D., and H.G. Stefan. 2008. Increase of urban lake salinity by road deicing salt. Science of the Total Environment 406: 131-144.
Paerl, H., and J. Huisman. 2008. Blooms like it hot. Science 320:57-58.
Patterson Planning Department. 2011. Report on the Creation of the Putnam Lake Park District. http://www.pattersonny.org/PlanningBoard/PDFs/PutLakeParkPlan.pdf.http://www.pattersonny.org/PlanningBoard/PDFs/PutLakeParkPlan.pdf.
Prestigiacomo, A. R., Effler, S. W., Gelda, R. K., Matthews, D. A., Auer, M. T., Downer, B. E., and Walter, M. T. 2016. Apportionment of bioavailable phosphorus loads entering Cayuga Lake, New York. JAWRA Journal of the American Water Resources Association, 52(1), 31-47.
Putnam Lake Park District. 2018. Town of Patterson, District Website. http://putnamlake.weebly.com/.http://putnamlake.weebly.com/.
62 | HABS ACTION PLAN - PUTNAM LAKE
Reichwaldt, E.S. and Ghadouani, A. 2012. Effects of rainfall patterns on toxic cyanobacterial blooms in a changing climate: Between simplistic scenarios and complex dynamics. Water Research 46: 1372-1393.
Ritter, W. F., and Shirmohammadi, A. (Eds.). 2000. Agricultural nonpoint source pollution: watershed management and hydrology. CRC Press. 342p.
Schindler, D.W. Evolution of phosphorus limitation in lakes. Science 195: 260-262.
Sharpley, A. N., Daniel, T., Gibson, G., Bundy, L., Cabrera, M., Sims, T., ... and Parry, R. 2006. Best management practices to minimize agricultural phosphorus impacts on water quality.
Smith, V.H. 1983. Low nitrogen to phosphorus ratios favor dominance by blue-green algae in lake phytoplankton. Science 221(4611): 669-671.
Sonzogni, W. C., Chapra, S. C., Armstrong, D. E., and Logan, T. J. 1982. Bioavailability of phosphorus inputs to lakes. Journal of Environmental Quality, 11(4), 555-563.
Swift, B.L., K.J. Clarke, R.A. Holevinski, and E.M. Cooper. 2013. Status and Ecology of Mute Swans in New York State, Draft Final Report, NYSDEC, December 2013.
Town of Patterson. 2017. Historic Patterson, New York. http://www.historicpatterson.org/Exhibits/ExhPutLake.php.http://www.historicpatterson.org/Exhibits/ExhPutLake.php.
United States Environmental Protection Agency (USEPA). 2015. Drinking Water Health Advisory for Cyanobacterial Microcystin Toxins. EPA-820R15100. https://www.epa.gov/sites/production/files/2017-06/documents/microcystins-report-2015.pdf
United States Environmental Protection Agency (USEPA). 2016. Draft Human Health Recreational Ambient Water Quality Criteria or Swimming Advisories for Microcystins and Cylindrospermopsin. EPA Document Number: 822-P-16-002. December 2016.
United States Geological Survey (USGS). 2000. Effects of Residential and Agricultural Land Uses on the Chemical Quality of Baseflow of Small Streams in the Croton Watershed, Southeastern New York. WRIR 99-4173.
Vanderploeg, H. A., Liebig, J. R., Carmichael, W. W., Agy, M. A., Johengen, T. H., Fahnenstiel, G. L., and Nalepa, T. F. 2001. Zebra mussel (Dreissena polymorpha) selective filtration promoted toxic Microcystis blooms in Saginaw Bay (Lake Huron) and Lake Erie. Canadian Journal of Fisheries and Aquatic Sciences 58: 1208-1221.
Visser, P., B. Ibelings, B. van der Veer, J. Koedood, and R. Mur. 1996. Artificial mixing prevents nuisance blooms of the cyanobacterium Microcystis in Lake Nieuwe Meer, the Netherlands. Freshwater Biology 36: 435-450.

63 | HABS ACTION PLAN - PUTNAM LAKE
Young, T.C., J.V. DePinto, S.E. Flint, S.M. Switzenbaum, and J.K. Edzwald. 1982. Algal Availability of Phosphorus in Municipal Wastewater. Journal of Water Pollution Control Federation 54:1505-1516.
Zhou, H., Wang, J., Wan, J. and Jia, H. 2010. Resilience to natural hazards: A geographic perspective. Natural Hazards. 53. 21-41.
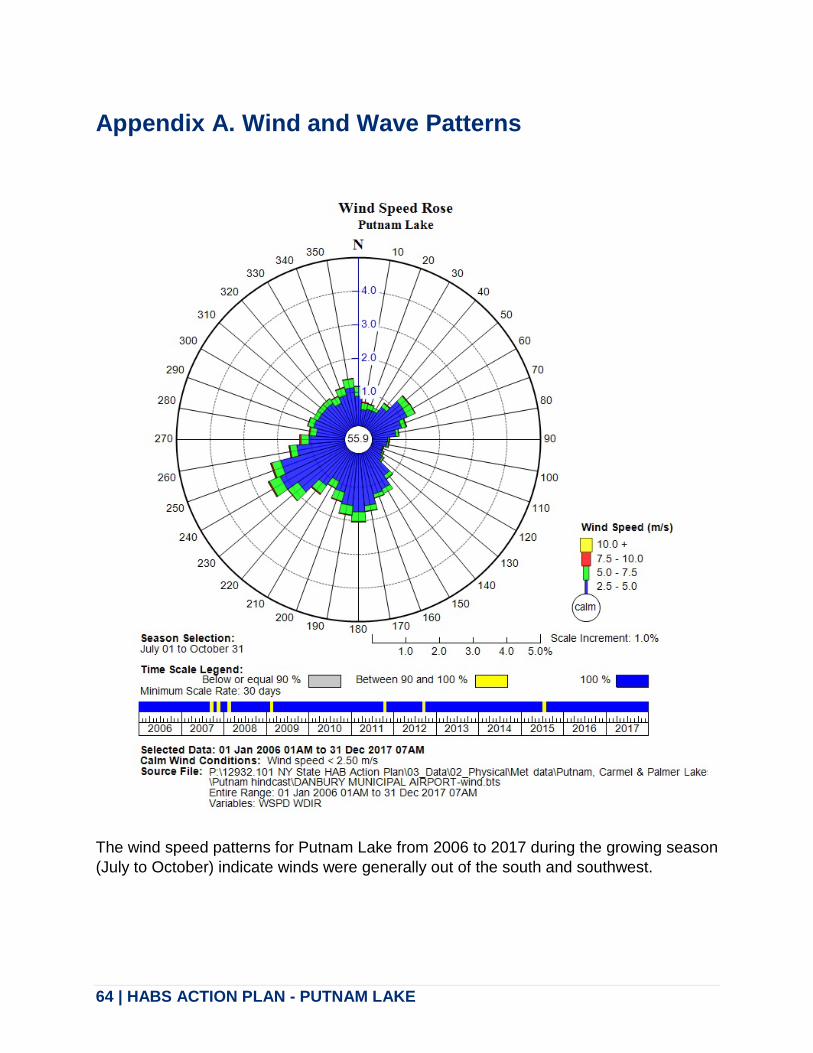
64 | HABS ACTION PLAN - PUTNAM LAKE
Appendix A. Wind and Wave Patterns
The wind speed patterns for Putnam Lake from 2006 to 2017 during the growing season (July to October) indicate winds were generally out of the south and southwest.

65 | HABS ACTION PLAN - PUTNAM LAKE
Estimated wave heights in Putnam Lake from 2006 to 2017 during the growing season (July to October) indicate greater wave heights in the northern and southern end of the lake.

66 | HABS ACTION PLAN - PUTNAM LAKE
Appendix B. Waterbody Classifications Class N: Enjoyment of water in its natural condition and where compatible, as
source of water for drinking or culinary purposes, bathing, fishing and fish propagation, recreation and any other usages except for the discharge of sewage, industrial wastes or other wastes or any sewage or waste effluent not having filtration resulting from at least 200 feet of lateral travel through unconsolidated earth. These waters should contain no deleterious substances, hydrocarbons or substances that would contribute to eutrophication, nor shall they receive surface runoff containing any such substance.
Class AAspecial: Source of water supply for drinking, culinary or food processing purposes; primary and secondary contact recreation; and fishing. These waters shall be suitable for fish propagation and survival, and shall contain no floating solids, settleable solids, oils, sludge deposits, toxic wastes, deleterious substances, colored or other wastes or heated liquids attributable to sewage, industrial wastes or other wastes. There shall be no discharge or disposal of sewage, industrial wastes or other wastes into these waters. These waters shall contain no phosphorus and nitrogen in amounts that will result in growths of algae, weeds and slimes that will impair the waters for their best usages.
Class Aspecial: Source of water supply for drinking, culinary or food processing purposes; primary and secondary contact recreation; and fishing. These waters shall be suitable for fish propagation and survival. These international boundary waters, if subjected to approved treatment equal to coagulation, sedimentation, filtration and disinfection, with additional treatment if necessary to remove naturally present impurities, will meet New York State Department of Health drinking water standards and will be considered safe and satisfactory for drinking water purposes
Class AA: Source of water supply for drinking, culinary or food processing purposes; primary and secondary contact recreation; and fishing. These waters shall be suitable for fish propagation and survival. These waters, if subjected to approved disinfection treatment, with additional treatment if necessary to remove naturally present impurities, will meet New York State Department of Health drinking water standards and will be considered safe and satisfactory for drinking water purposes
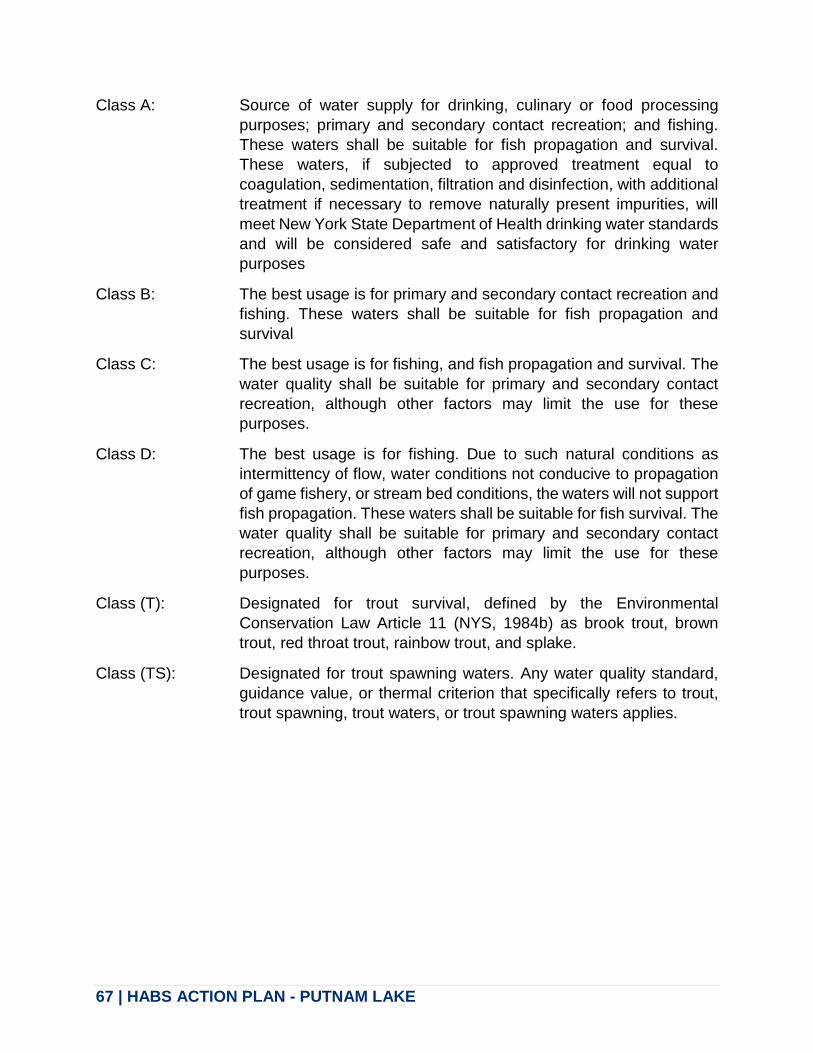
67 | HABS ACTION PLAN - PUTNAM LAKE
Class A: Source of water supply for drinking, culinary or food processing purposes; primary and secondary contact recreation; and fishing. These waters shall be suitable for fish propagation and survival. These waters, if subjected to approved treatment equal to coagulation, sedimentation, filtration and disinfection, with additional treatment if necessary to remove naturally present impurities, will meet New York State Department of Health drinking water standards and will be considered safe and satisfactory for drinking water purposes
Class B: The best usage is for primary and secondary contact recreation and fishing. These waters shall be suitable for fish propagation and survival
Class C: The best usage is for fishing, and fish propagation and survival. The water quality shall be suitable for primary and secondary contact recreation, although other factors may limit the use for these purposes.
Class D: The best usage is for fishing. Due to such natural conditions as intermittency of flow, water conditions not conducive to propagation of game fishery, or stream bed conditions, the waters will not support fish propagation. These waters shall be suitable for fish survival. The water quality shall be suitable for primary and secondary contact recreation, although other factors may limit the use for these purposes.
Class (T): Designated for trout survival, defined by the Environmental Conservation Law Article 11 (NYS, 1984b) as brook trout, brown trout, red throat trout, rainbow trout, and splake.
Class (TS): Designated for trout spawning waters. Any water quality standard, guidance value, or thermal criterion that specifically refers to trout, trout spawning, trout waters, or trout spawning waters applies.

68 | HABS ACTION PLAN - PUTNAM LAKE
Appendix C. WI/PWL Summary Lost Lake, Putnam Lake (1302-0053) Impaired
Waterbody Location Information Revised: 05/01/2018 Water Index No:H- 31-P44-24-17-P93a,P93b Water Class: B Hydro Unit Code: East Branch Croton River (0203010102) Drainage Basin: Lower Hudson River Water Type/Size: Lake/Reservoir 222.1 Acres Reg/County: 3/Putnam (40) Description: total area of both lakes Water Quality Problem/Issue Information Uses Evaluated Severity Confidence
Water Supply N/A - Public Bathing Impaired Unconfirmed Recreation Impaired Known Aquatic Life Unassessed - Fish Consumption Unassessed -
Conditions Evaluated Habitat/Hydrology Unknown Aesthetics Poor
Type of Pollutant(s) (CAPS indicate Major Pollutants/Sources that contribute to an Impaired/Precluded Uses) Known: NUTRIENTS (PHOSPHORUS) Suspected: Algal/Plant Growth Unconfirmed: ---
Source(s) of Pollutant(s) Known: Onsite Septic Systems Suspected: --- Unconfirmed: ---
Management Information
Management Status: Restoration/Protection Strategy Needed Lead Agency/Office: DOW/BWAM IR/305(b) Code: PROPOSED - Impaired Water Requiring a TMDL (IR Category 5)
Further Details Overview Lost Lake and Putnam Lake are assessed as an impaired waterbody segment due to primary and secondary contact recreation uses that are known to be impaired by elevated nutrients (phosphorus) and poor water clarity (secchi readings). Use Assessment

69 | HABS ACTION PLAN - PUTNAM LAKE
This segement is a Class B waterbody, required to support and protect the best use of primary and secondary contact recreation, and fishing. Secondary contact recreation is considered to be impaired due to elevated nutrients (phosphorus), excessive algae, and poor water clarity. Primary contact recreation may be impaired due to poor water clarity but Putnam Lake beach closures have not been issued by Putnam County Health Departments since 2013. Fish Consumption use is considered to be unassessed. There are no health advisories limiting the consumption of fish from this waterbody (beyond the general advice for all waters). However due to the uncertainty as to whether the lack of a waterbody-specific health advisory is based on actual sampling, fish consumption use is noted as unassessed. (NYSDOH Health Advisories and NYSDEC/DOW, BWAM, April 2018) Water Quality Information Water quality sampling of this segement has been conducted through the Citizens Statewide Lake Assessment Program (CSLAP) from 2013 through 2017. Results of this sampling indicate that the lake is best characterized as eutrophic or highly productive. Chlorophyll/algal levels most always exceed criteria corresponding to impaired recreational uses and phosphorus concentrations most always exceed the 20µg/L NYSDEC guidance value. Lake clarity measurements indicate water transparency frequently fail to meet the recommended minimum criteria for swimming beaches. Readings of pH typically fall within the range established in state water quality standards for protection of aquatic life. Water clarity readings have increased over the last five years, in repsonse to decreasing algae levels, although this may be in response to active management of algae blooms with copper-based algacides. Conductivity readings have also increased over the same period, but it is not known if this has otherwise affected water quality conditions in the lake. The NYSDEC HABs Notification program confirmed the presence of HABs in Putnam Lake during the recreational seasons of 2013 through 2017. In 2013, the year with the most frequent HABs occurrences, Putnam Lake was on the HABS Notification List for 16 weeks. The blooms observed in 2013 were localized and did become widespread at certain times. The densest open water (center of lake) blooms have been dominated by Aphanizomenon, Microcystis and Dolichospermum, cyanobacteria capable of producing toxins, although most open water toxin readings are low to undetectable. Shoreline blooms are common and usually dominated by high levels of Microcystis. Elevated levels of Microcystin were found in 2013, but most recent blooms have exhibited undetectable toxin levels (DEC/DOW, BWAM/LMAS, February 2018) Source Assessment Based on the surrounding land use and other knowledge of the Lost Lake and Putnam Lake, onsite septic systems are likely the major contributing sources of elevated nutrients to the waterbody. Management Actions This waterbody is considered a highly-valued water resource. The lake is a multi–use waterbody for swimming, boating, and fishing. On December 21, 2017, New York State Governor Andrew Cuomo announced a $65 million initiative to combat harmful algal blooms in Upstate New York. Putnam Lake was identified for inclusion in this initiative as it is vulnerable to HABs. Putnam Lake is managed by the Town of Patterson for the surrounding residents, and is served by the Putnam Lake Park District. Two bathing beaches on Putnam Lake are open for residents with deeded lake rights. Putnam Lake is tributary to the Croton System of New York City water supply reservoirs (see New Croton Reservoir, Segment 1302–0010). A Watershed Agreement is in place between NYCDEP and the Croton Watershed communities which sets forth programs and funding for watershed protection. In addition, NYCDEP has developed a phosphorus TMDL for the entire Croton System Watershed to aid in the management of nutrients. The NYSDEC finalized its Croton Watershed Phase II Phosphorus TMDL Implementation Plan in January 2009. Since then, NYSDEC has been actively working with its partners to implement a number of programmatic initiatives contained in the Implementation Plan. Examples includes the East of Hudson Stormwater Retrofit and Septic Maintenance Programs. The Stormwater Retrofit Program has installed over 200 stormwater best management

70 | HABS ACTION PLAN - PUTNAM LAKE
practices in the East of Hudson watershed, resulting in over 600 kg of phosphorus reductions. The Septic Maintenance Program requires homeowners to pump out their septic system at least once every five years. Section 303(d) Listing This waterbody segement is not included on the current (2016) NYS Section 303(d) List of Impaired/TMDL Waters. However this updated assessment suggests that it is appropriate to include this waterbody on the next update of the lists. It is recommended that this waterbody be added to Part 1 of the List as an impaired waterbody requiring a TMDL for phosphorus. Segment Description This segement includes the total area of both lakes.

71 | HABS ACTION PLAN - PUTNAM LAKE
Appendix D. NYSDEC Water Quality Monitoring Programs Information about NYSDEC’s water quality monitoring program, CSLAP, can be found at: http://www.dec.ny.gov/chemical/81576.html
72 | HABS ACTION PLAN - PUTNAM LAKE
Appendix E. Road Ditches In New York State, ditches parallel nearly every mile of our roadways and in some watersheds, the length of these conduits is greater than the natural watercourses themselves. Although roadside ditches have long been used to enhance road drainage and safety, traditional management practices have been a significant, but unrecognized contributor to flooding and water pollution, with ditch management practices that often enhance rather than mitigate these problems. The primary objective has been to move water away from local road surfaces as quickly as possible, without evaluating local and downstream impacts. As a result, elevated discharges increase peak stream flows and exacerbate downstream flooding. The rapid, high volumes of flow also carry nutrient-laden sediment, salt and other road contaminants, and even elevated bacteria counts, thus contributing significantly to regional water quantity and quality concerns that can impact biological communities. All of these impacts will be exacerbated by the increased frequency of high intensity storms associated with climate change. Continued widespread use of outdated road maintenance practices reflects a break-down in communications among scientists, highway managers, and other relevant stakeholders, as well as tightening budgets and local pressures to maintain traditional road management services. Although road ditches can have a significant impact on water quality, discharges of nutrients and sediment from roadways can be mitigated with sound management practices.
Road Ditch Impacts Roadside ditch management represents a critical, but overlooked opportunity to help meet watershed and clean water goals in the Putnam Lake watershed by properly addressing the nonpoint sources of nutrients and sediment entering the New York waters from roadside ditches. The three main impacts of roadside ditch networks are: (1) hydrological modification, (2) water quality degradation, and (3) biological impairment.
Mitigation Strategies to Reduce Impacts Traditional stormwater management focused on scraping or armoring ditches to collect and rapidly transport water downstream. The recommended mitigation strategies described below focus on diffusing runoff to enhance sheet flow, slowing velocities, and increasing infiltration and groundwater recharge. This approach reduces the rapid transfer of rainwater out of catchments and helps to restore natural hydrologic conditions and to reduce pollution while accommodating road safety concerns.
These strategies can be divided into three broad, but overlapping categories:
1. Practices designed to hold or redirect stormwater runoff to minimize downstream flooding.
• Redirect the discharges to infiltration or detention ponds. • Restore or establish an intervening wetland between the ditch and the
stream.

73 | HABS ACTION PLAN - PUTNAM LAKE
• Divert concentrated flow into manmade depressions oriented perpendicular to flow using level lip spreader systems.
• Modify the road design to distribute runoff along a ditch, rather than a concentrated direct outflow.
2. Practices designed to slow down outflow and filter out contaminants. • Reshape ditches to shallow, trapezoidal, or rounded profiles to reduce
concentrated, incisive flow and the potential for erosion. • Optimize vegetative cover, including hydroseeding and a regular mowing
program, instead of mechanical scraping. Where scraping is necessary, managers should schedule roadside ditch maintenance during late spring or early summer when hydroseeding will be more successful.
• Build check dams, or a series of riprap bars oriented across the channel perpendicular to flow, to reduce channel flow rates and induce sediment deposition while enhancing ground water recharge.
• Reestablish natural filters, such as bio-swales, compound or “two-stage” channels, and level lip spreaders.
3. Practices to improve habitat. • Construct wetlands for the greatest potential to expand habitat. • Reduce runoff volumes to promote stable aquatic habitat.
The Upper Susquehanna Coalition (USC) is developing a technical guidance document in the form of a Ditch Maintenance Program Guide that can be used by any local highway department. The guide will include an assessment program to determine if the ditch needs maintenance and what is necessary to stabilize the ditch. It will also contain a group of acceptable and proven management guidelines and practices for ditch stabilization. In addition, the USC is developing a broad-based education and outreach program to increase awareness and provide guidance to stakeholder groups. This program will take advantage of existing education programs, such as the NY’s Emergency Stream Intervention (ESI) Training program, USC, Cornell University and the Cornell Local Roads program. This new program will be adaptable in all watersheds.