HANSON ECONOMIC DEVELOPMENT PLAN
89
FXM Associates HANSON ECONOMIC DEVELOPMENT PLAN Prepared for Town of Hanson Prepared by FXM Associates July 2019
Transcript of HANSON ECONOMIC DEVELOPMENT PLAN

FXM Associates
HANSON ECONOMIC DEVELOPMENT PLAN
Prepared for
Town of Hanson
Prepared by
FXM Associates
July 2019

FXM Associates
Hanson Economic Development Plan ii
CONTENTS Introduction .................................................................................................. 1
Summary Observations and Findings ................................................................ 2
Demographic and Economic Characteristics and Trends .................................... 2
Market Conditions and Trends ....................................................................... 3
Fiscal Comparisons ...................................................................................... 6
South Hanson MBTA Rail Station Development Strategy ................................... 8
Demographic and Economic Characteristics ....................................................... 9
Population and Households ........................................................................... 9
Workforce Characteristics ........................................................................ 11
Housing ................................................................................................. 16
Business Characteristics .......................................................................... 18
Market Conditions and Trends ........................................................................ 22
Employment Trends ................................................................................... 22
Projected Space Demand Through 2022 .......................................................... 36
Retail Opportunity Gap/Surplus...................................................................... 37
Commercial Space Market Overview ............................................................... 43
Office Space Market Trends ..................................................................... 44
Industrial Space Market Trends ................................................................ 48
Retail Space Market Trends ..................................................................... 52
Rental Housing Demand and Supply Trends ..................................................... 56
Prices and Sizes of Recently Available Rentals ............................................ 67
Rental Housing Supply Trends .................................................................. 69
Summary of the Residential Market Assessment ............................................ 74
Fiscal Comparison ........................................................................................ 75
Tax Rates ................................................................................................. 75
Residential and Commercial Property as Percent of Total Assessed Valuation and Tax Levy ............................................................................................... 76
Revenue by Source ................................................................................. 77
Appendix A: Development Constraints South Hanson Train Station……………………….78

FXM Associates
Hanson Economic Development Plan iii
List of Figures and Tables Figure 1. Incomes Compared 2019 ............................................................................. 11 Figure 2. Occupations Compared ................................................................................ 13 Figure 3. Hanson Commuters Destinations .................................................................. 14 Figure 4. Owner-Occupied Housing 2019 ..................................................................... 17 Figure 5. Housing Values 2019 Median ........................................................................ 18 Figure 6. compare 2007 and 2017 employment by sector .............................................. 20 Figure 7. Average Annual Wages by Industry Hanson, Plymouth County, State of
Massachusetts, 2018 .......................................................................................... 21 Figure 8. Town of Hanson and Plymouth County: Total All Industries .............................. 23 Figure 9. Town of Hanson and Plymouth County Employment: ....................................... 25 Figure 10. Town of Hanson and Plymouth County Employment: ..................................... 26 Figure 11. Town of Hanson and Plymouth County Employment: Real Estate and Rental &
Leasing, 2006-2022 ........................................................................................... 27 Figure 12. Town of Hanson and Plymouth County Employment: Professional and Technical
Services, 2006-2022 .......................................................................................... 28 Figure 13. Town of Hanson and Plymouth County Employment: Administrative and Support
Services, 2006-2022 .......................................................................................... 29 Figure 14. Town of Hanson and Plymouth County Employment: Retail Trade 2006-2022 ... 30 Figure 15. Town of Hanson and Plymouth County Employment: Accommodation and Food
Services, 2006-2022 .......................................................................................... 31 Figure 16. Town of Hanson and Plymouth County Employment: Construction, 2006-2022 . 32 Figure 17. Town of Hanson and Plymouth County Employment; Manufacturing, 2006-2022
....................................................................................................................... 33 Figure 18. Town of Hanson and Plymouth County Employment: Health Care and Social
Assistance, 2006-2022 ....................................................................................... 34 Figure 19. Town of Hanson and Plymouth County Employment: Wholesale Trade, 2006-2022
....................................................................................................................... 35 Figure 20. Town of Hanson and Plymouth County Employment: Other Services (Except
Public Administration), 2006-2022 ....................................................................... 36 Figure 21. 5-Minute Drive Time Map ........................................................................... 39 Figure 22. 10-Minute Drive Time Map ......................................................................... 40 Figure 23. 15-Minute Drive Time Map ......................................................................... 41 Figure 24. Office Space Inventory: Hanson & Submarket ............................................. 44 Figure 25. Office Space Vacancies, Hanson & Submarket ............................................... 45 Figure 26. Office Space Vacancy Rates, Hanson & Submarket ........................................ 46 Figure 27. Office Space Occupancies, Hanson & Submarket ........................................... 47 Figure 28. Office Space Gross Rents, Hanson & Submarket............................................ 47 Figure 29. Industrial Space Inventory SF, Hanson & Submarket ..................................... 49 Figure 30. Vacant Industrial Space SF, Hanson & Submarket ......................................... 50 Figure 31. Industrial Space Vacancy Rates, Hanson & Submarket ................................... 50 Figure 32. Industrial Space Occupancies, Hanson & Submarket ...................................... 51 Figure 33. Industrial Space Rent SF/year, Hanson & Submarket ..................................... 52 Figure 34. Retail Space Inventory SF, Hanson & Submarket .......................................... 53 Figure 35. Vacant Retail Space SF, Hanson & Submarket .............................................. 54 Figure 36. Retail Space Vacancy Rates, Hanson & Submarket ........................................ 54 Figure 37. Retail Space Occupancy SF, Hanson & Submarket ......................................... 55

FXM Associates
Hanson Economic Development Plan iv
Figure 38. Retail Space Rent/SF/Year, Hanson & Submarket .......................................... 56 Figure 39. 20-Minute Market Area .............................................................................. 59 Figure 40. Average annual demand for rentals: all age groups hanson market area, 2019-
2024 ................................................................................................................ 60 Figure 41. Average annual demand for rentals: market area, hanson, estimated potential
new rentals capture ............................................................................................ 62 Figure 42. Average annual demand for rentals by affordable rent and age group, hanson
market area 2019-2024 ...................................................................................... 62 Figure 43. Average annual demand for selected monthly rents by age group hanson market
area 2019-2024 ................................................................................................. 63 Figure 44. Change in number of households by age and income hanson market area 2019-
2024 ................................................................................................................ 65 Figure 45. Average annual demand by affordable rent 2019-2024 householders under age
35 and ages 55-74 hanson market area ................................................................ 67 Figure 46. Available Units by Number of Bedrooms ....................................................... 68 Figure 47. Inventory and Occupancy of Multi-Family Rental Units (All BRs) Hanson &
Surrounding Communities ................................................................................... 69 Figure 48. Net Absorption of Multifamily Rental Units .................................................... 70 Figure 49. Average Monthly Rents (All BRs), Hanson & Surrounding Communities ............ 71 Figure 50. Rental Units by Number of Bedrooms (BR) ................................................... 72 Figure 51. Average Monthly Rents by Number of Bedrooms ........................................... 73 Figure 52. Tax rates per $1,000 valuation fy 2019 ....................................................... 75 Figure 53. Sector % of assessed value fy 2019 ............................................................ 76 Figure 54. Revenues by source fy 2019 ....................................................................... 77 Table 1. Hanson Households Compared to Plymouth County and State Overall ................. 10 Table 2. Workforce Characteristics 2019 ..................................................................... 12 Table 3. Housing Characteristics ................................................................................ 16 Table 4. Employment Sectors for the Town of Hanson ................................................... 19 Table 5. Wages by sector 2018 .................................................................................. 21 Table 6. Hanson projected space demand through 2022 based on historical emloyment
trends ............................................................................................................... 37 Table 7. Overview of Hanson retail market analysis ...................................................... 42 Table 8. Retail opportunities in the Hanson MBTA retail market area: 2019 ..................... 43 Table 9. Housing demand context 20-minute market area ............................................. 58 Table 10. Potential Annual Demand for Rental Housing in Hanson, 2019-2024 ................. 61 Table 11. Average rental listings, Hanson 20-minute area ............................................. 68 Table 12. Multifamily rental units in Hanson & surrounding towns ................................... 72

FXM Associates INTRODUCTION FXM Associates has been retained by the Town of Hanson to assess market conditions and trends that can affect economic development and to assist their preparation of an economic development plan. As stated in the scope of services:
Understanding realistic market-driven development opportunities is a crucial first step in creating an effective economic development strategy. The market analysis also needs to address Hanson’s competitive strengths and weaknesses, so that the Town can consider appropriate ways local government can build upon existing commercial enterprises and market trends and improve the Town’s business climate to attract additional commercial and residential investment. Data developed in the market analysis can be used to recruit business and residential development investors.
Accordingly, FXM analyzed market conditions and trends by industry sector in Hanson and surrounding communities; projected employment and potential space demand for office, industrial/warehouse, and retail uses; undertook a comprehensive site visit with the Town Administrator and Town Planner; and conducted confidential interviews with a selection of local business and property owners, OCPC and local economic development and planning officials, to gain additional understanding of market dynamics and other conditions affecting economic development. Using secondary data sources, FXM prepared social, economic, fiscal, and business profiles of Hanson; analyzed trends in local industries; estimated future demand for commercial space, identified retail growth potential; and projected demand for market-rate rental housing, a potentially significant component of mixed-use development. On the latter issue, Hanson officials and others interviewed in the course of work were clear that they considered potential mixed-use commercial and residential development in the vicinity of the MBTA commuter rail station in South Hanson to be a priority economic development initiative for Hanson to be addressed in the FXM study. In addition to the overall assessment of potential demand for office, retail, and residential uses that might be appropriate for development in this target area, FXM also conducted a retail opportunity/gap analysis to identify existing sales leakages that might be captured in a mixed-use development in this area. Regulatory and environmental constraints that will need to be overcome to realize market-driven development potential in the vicinity of the South Hanson MBTA station are discussed in Appendix A.1
1 This special assessment was conducted for FXM by Judy Barrett, Barrett Planning Group, who recently examined town-wide zoning as part of their Town of Hanson Housing Production Plan, March 2019. A prior study of Transit Oriented Development (TOD) potential in South Hanson identified ownership and

FXM Associates
Hanson Economic Development Plan 2
SUMMARY OBSERVATIONS AND FINDINGS Demographic and Economic Characteristics and Trends Hanson’s population increased by 6% between 2010 and 2019, to an
estimated 10,188, and is projected to increase by another 4% by 2024, to about 11,250 persons. Both the recent historical and projected growth rates are higher than those for Plymouth County or Massachusetts overall. Similarly, households grew by 8% since 2010 to an estimated 3,750 in 2019, and are projected to grow another 5%, to about 3,900, by 2024. As with total population, household growth rates in Hanson have and are projected to exceed those of Plymouth County and Massachusetts overall. Implicit in these relative growth numbers is that Hanson is doing modestly better than the broader region and state in retaining and attracting people who want to live in Town. The projected growth is also key to future economic growth.
In 2019, the average annual income in Hanson ($123,450) is 18% higher than average incomes for Plymouth County ($104,884), and 7% higher than the rest of the Commonwealth ($115,037). The estimated median income ($106,436) is over $27,000 higher than that of Plymouth County, and $24,800 higher than that for the State of Massachusetts. Hanson’s poverty rate is much lower than that of Plymouth County (2% versus 6%) and of the state as a whole (2% versus 8%). There is also a low proportion of Families Below Poverty with Children (1%) versus that of the county (5%) and the state (6%).
The great majority of Hanson residences, 88%, are owner-occupied, higher than the 76% of Plymouth County residents who own, and higher than the 62% of State residents who own. The estimated 2019 median value of owner-occupied structures in Hanson ($376,000) is 5% lower than in the county ($397,000) and 8% lower than in the state ($409,000). The largest proportion of Hanson’s housing is valued in the $300,000 to $399,999 range as are both the county and state housing values.
The characteristics of Hanson’s workforce differ slightly compared to the
county and state averages -- the proportion of residents aged 25+ with a bachelor’s degree or higher for the Town of Hanson is 4 percentage points less (32%) than for Plymouth County (36%) and 10 percentage points less than for the Commonwealth overall (42%). The Town of Hanson has a slightly higher percentage of service and blue-collar workers when compared
parcelization issues that are not further examined in this report. See: South Hanson Transit Oriented Development (TOD) Study, Old Colony Planning Council (OCPC), October 2005.

FXM Associates
Hanson Economic Development Plan 3
to both the County and the Commonwealth. Interestingly, Hanson has a higher number of employed persons per household on average (1.58) than the average for Plymouth County (1.34) and Massachusetts overall (1.28) and this may account in part for the relatively high average and median incomes of Hanson residents.
Between 2007 and 2017, jobs in Hanson decreased by 1% compared to 14%
growth for Plymouth County and 15% growth statewide. During this period, job losses were greatest in manufacturing, retail trade, health care and social assistance, and finance and insurance. Employment in accommodation & food services showed a significant gain, as did jobs in construction, wholesale trade, professional & technical services and administrative services. Noteworthy in the comparison of historical employment trends is that overall jobs in Hanson bottomed out in 2011, at 1,474 jobs. Between 2011 and 2017 Hanson gained approximately 300 jobs, a 21% increase, showing jobs growth in all sectors except manufacturing and health care. The greatest gains were in professional & technical services, which continues to trend upward and is an important potential generator of demand for office space.
At $39,000 on average for all jobs, average annual wages paid in Hanson are 77% of those for Plymouth County overall and 58% of the statewide average. This difference may in part be attributable to the relatively large number of jobs in Hanson in Retail Trade and Accommodation & Food Services, which are relatively low wage occupations.
Market Conditions and Trends FXM employs two complementary approaches to assessing potential market
demand for commercial development. The first considers historical trends in jobs by industry sector, projects these trends forward, and then converts projected numbers of jobs into potential demand for space using space per employee norms. The second approach examines historical trends in the inventory, occupancies, vacancies, net absorption, and lease rates for each of the major types of space – office, industrial/warehouse, and retail. The table below summarizes the results of these two approaches. The differences in forecasts reflect the typical range found when using two distinctly different data sources and projection methods, but provides greater confidence in whether the overarching trends are positive or negative for each type of space as well as in the range of likely outcomes. Plymouth County is a broader geographic area than the submarket used for the supply analysis, but because of data limitations is more reliable for employment projections. In the case of both projection methods, and notwithstanding land and development costs, zoning, and other factors affecting potential development at specific sites, the results of the commercial market analysis clearly

FXM Associates
Hanson Economic Development Plan 4
suggest that there is market support for additional development in Hanson. With success overcoming development constraints in the vicinity of the MBTA commuter rail station in South Hanson, and aggressive outreach by local property owners, brokers, and developers, Hanson could capture a greater share of projected regional and submarket growth in each of the space types analyzed. The absorption trends are specially promising. The defined “submarket” includes only Hanson and surrounding communities.2 Occupancies have been increasing, vacancies are extremely low, and rents have been steadily rising.
In addition to the trends projections for potential retail space demand
community-wide, a Retail Opportunity Gap/Surplus analysis was done to estimate the types and numbers of stores and potential square footage of space that might be captured in the South Hanson MBTA commuter rail station area. The Gap analysis measures sales “leakage” within given drive-time markets, wherein consumer expenditures are not now being captured by stores within those market areas. The result is a snapshot of current sales leakage rather than projection of future demand. The technique is commonly used by major retail developers to aid their recruitment of tenants. In the case of the South Hanson MBTA rail station area, current sales leakages suggest a potential to capture about 98,000 additional square feet of retail and restaurant uses (see details in Table 6).
Rental housing is increasingly considered an important asset to economic development, particularly as it enables a community to attract and/or retain its younger labor force, empty nesters and early retirees who may want to sell an existing single-family residence but remain in the community, and others not interested in or able to afford homeownership. Rental housing development can complement office, retail, and recreational uses and lend
2 Defined by local real estate brokers as the area directly competitive with Hanson for development, the “submarket” includes Hanson, Rockland, Hanover, Whitman, East Bridgewater, Pembroke, and Halifax.
Type of SpaceHanson Plymouth Cty Hanson Submarket
SF SF SF SFOffice 5,000 120,000 500 24,000Industrial/Warehouse 2,000 40,000 3,000 93,000Retail/Restaurant 3,000 38,000 1,500 55,000Sources: MDOL ES202; BEA REIS; CoStar Property Information System ; and FXM Associates, 2019
Average Annual Projected Demand through 2022
Based on Projected Jobs Based on Absorption Trends

FXM Associates
Hanson Economic Development Plan 5
scale to achieve feasible development. In the case of a potential mixed-use development in the vicinity of the South Hanson MBTA rail station, it also represents an opportunity to upgrade underutilized commercial properties. To estimate demand for rental housing in Hanson FXM employed its proprietary Housing Demand Model which projects over the next five years the average annual demand for rental housing by age group, income and affordable rental rates. In addition to assessing the demand for rental housing FXM also analyzed historical trends in the inventory, absorption, and monthly rents for units within the Hanson market area. The graph below shows average annual demand and potential absorption of new rental units in Hanson, while the subsequent table displays supply characteristics and trends.
Source: FXM Associates’ Housing Demand Model, 2019

FXM Associates
Hanson Economic Development Plan 6
Source: CoStar Property Information System, April 2019, and FXM Associates
The picture that emerges from the assessment of demand for and supply of multi-family rental housing in Hanson and the local market area is one in which expected demand – driven by household mobility as well as net new growth – dramatically exceeds the current supply which has grown very modestly over the past ten years. There are virtually no vacancies within the current supply. Even in this context of limited supply, Hanson is especially underrepresented in its expected share of rental housing.3 On the higher end, the rentals that are available in conventional listings are priced above thresholds needed to support rehabilitation and new construction costs for market rate (unsubsidized) housing. Multi-family rental housing that includes opportunities for below-market rentals can also aid Hanson in achieving its housing production goals.4
Fiscal Comparisons Hanson’s residential and commercial tax rates are slightly below the average of surrounding communities, as shown in the following graph. Only Pembroke has a commercial tax rate that might be considered a competitive advantage over Hanson. Hanson derives the lowest percentage of its property tax revenues from commercial uses – 8% -- compared to an average 12% commercial for the surrounding communities.
3 Based on estimated 2019 population and households, Hanson currently has about half as many multi-family rental units as the average of other communities within the 20-minute drive time market area. 4 Town of Hanson Housing Production Plan, March 2019, Barrett Planning Group for the Town of Hanson and Hanson Housing Authority,
Units in 2019 % of Units
Ave Unit Size (SF)
Ave Annual Increase in Units:
2010-2019
Monthly Rent in 2019
Ave Annual Increase in Rent:
2010-2019Ave Rent
per sfStudio 46 2% 368 0 $785 2.2% $2.13 1 BR 711 38% 704 7 $1,456 3.2% $2.07 2 BR 841 45% 1,007 10 $1,815 4.2% $1.80 3 BR 115 6% 1,158 3 $1,875 3.6% $1.62 ALL BRs 1,850 93% 877 20 $1,652 3.8% $1.88
Multifamily Rental Units in Hanson & Surrounding Towns

FXM Associates
Hanson Economic Development Plan 7
$17.56
$17.47
$17.38
$14.60
$17.92
$15.38
$15.53
$16.55
$17.56
$17.47
$16.41
$14.60
$17.92
$15.38
$15.53
$16.41
$- $2.00 $4.00 $6.00 $8.00 $10.00 $12.00 $14.00 $16.00 $18.00 $20.00
East Bridgewater
Halifax
Hanover
Pembroke
Rockland
Whitman
Hanson
AVERAGE
Tax Rates per $1,000 Valuation FY 2019
Residential Personal Property Commercial/Industrial

FXM Associates
Hanson Economic Development Plan 8
South Hanson MBTA Rail Station Development Strategy As noted in the introduction, from the outset of this study town officials, regional economic development professionals, and private businesses interviewed in the course of research directed that FXM’s work be focused on opportunities for advancing a long-standing objective to develop additional commercial and residential uses in the vicinity of the MBTA commuter rail station in South Hanson. A fundamental issue underlying such prospective development is whether and to what extent current and foreseeable market conditions could support private investment in new and/or rehabilitated space in this area. Such new development is expected to provide the Town of Hanson with additional tax revenues, job opportunities, and housing that could satisfy multiple economic development objectives. The analyses conducted for this study clearly support a conclusion that, at least conceptually, current and foreseeable market conditions could support office, retail/restaurant, and multi-family rental housing, ideally as a mixed-use project to take advantage of scale needed to overcome potential cost liabilities for site assembly and environmental constraints. In addition to potential market support, property ownership, existing uses, zoning, and environmental constraints have for many years been identified as key constraints to realizing the potential of transit oriented development in this area. While FXM’s scope of services did not include addressing these constraints, Appendix A is a discussion of zoning and environmental regulations and issues that will need to be addressed if development potential is to be realized. In particular, current zoning must be amended to allow a higher density of uses and flexibility for dealing with wastewater issues. The findings of this study should provide further incentive for public and private stakeholders to advance development prospects knowing that the market can support such efforts, providing new revenues to owner/investors and the Town of Hanson, and that long-standing economic development objectives of the community can be realized.

FXM Associates
Hanson Economic Development Plan 9
DEMOGRAPHIC AND ECONOMIC CHARACTERISTICS Population and Households In terms of elements key to economic growth, i.e., population growth and income, Hanson compares favorably to both Plymouth County and the State of Massachusetts. As shown in Table 1, the estimated population of the Town of Hanson was 10,188 residents in 2019. The Town has gained 648 residents since 2010 (an increase of 6%), while Plymouth County has grown by 5%, and the State of Massachusetts has grown by about 6%. Hanson’s population grew by 8% between 2000 and 2010, also a period of growth, albeit lesser, for both Plymouth County (5%) and the State (3%). Although Hanson’s population growth has slowed in recent years, as has that of Plymouth County, this growth is important to its economic health, which depends to a large extent on a growing population’s demand for goods and services as well as a potential source of new businesses and of labor for town businesses. Projections for the next five years show continued growth for the Town of Hanson at 5%, greater than the projected growth for both Plymouth County (3%) and the State (4%). The estimated 3,750 households in the Town of Hanson experienced a gain of 10% in the decade between 2000 and 2010, followed by another significant gain of 8% since 2010, and are projected grow at 5% as the population rises to 2024. Average household size in Hanson is 2.4 persons, similar to both Plymouth County (2.6) and that of the State (2.5). As shown in Table 1, the average annual income in Hanson ($123,450) is 18% higher than average incomes for Plymouth County ($104,884), and 7% higher than the rest of the Commonwealth ($115,037). The estimated median income ($106,436) is over $27,000 higher than that of Plymouth County, and $24,800 higher than that for the State of Massachusetts. Consistent with these income measures, Hanson’s poverty rate is much lower than that of Plymouth County (2% versus 6%) and of the state as a whole (2% versus 8%). There is also a low proportion of Families Below Poverty with Children (1%) versus that of the county (5%) and the state (6%).

FXM Associates
TABLE 1. HANSON HOUSEHOLDS COMPARED TO PLYMOUTH COUNTY AND STATE OVERALL
Figure 1 illustrates the relative annual incomes among Hanson, Plymouth County, and State of Massachusetts households.
Population 2024 Projection 11,251 535,770 7,131,739 2019 Estimate 10,836 519,639 6,916,527 2010 Census 10,188 494,919 6,547,629 2000 Census 9,564 472,497 6,349,100Projected Growth 2019 - 2024 4% 3% 3%Estimated Growth 2010 - 2019 6% 5% 6% Growth 2000 - 2010 7% 5% 3%2019 Estimated Average Age 43.3 41.1 40.6 Households 2024 Projection 3,920 200,709 2,804,920 2019 Estimate 3,750 193,463 2,710,577 2010 Census 3,464 181,126 2,547,075 2000 Census 3,150 168,231 2,443,572Projected Growth 2019 - 2024 5% 4% 3%Estimated Growth 2010 - 2019 8% 5% 6% Growth 2000 - 2010 10% 8% 4%2019 Average Household Size 2.4 2.6 2.5 2019 Estimated Household Income 3,750 193,473 2,682,402 Income Less than $15,000 132 4% 12,834 7% 249,280 9% Income $15,000 - $24,999 139 4% 11,843 6% 197,422 7% Income $25,000 - $34,999 182 5% 11,449 6% 177,436 7% Income $35,000 - $49,999 282 8% 19,069 10% 263,460 10% Income $50,000 - $74,999 482 13% 28,495 15% 376,903 14% Income $75,000 - $99,999 531 14% 23,037 12% 320,387 12% Income $100,000 - $124,999 472 13% 21,097 11% 271,919 10% Income $125,000 - $149,000 418 11% 17,873 9% 216,612 8% Income $150,000 - $199,999 603 16% 20,712 11% 262,249 10% Income $200,000 - $249,999 294 8% 10,461 5% 137,018 5% Income $250,000 - $499,999 176 5% 11,053 5% 151,232 6% Income $500,000 and over 39 1% 5,550 3% 86,659 3%Household Income Less than $25,000 271 7% 24,677 13% 446,702 19%Household income more than $150,000 1,112 30% 47,776 25% 637,099 19%
2019 Families by Poverty Status 2019 Families Below Poverty 62 2% 7,777 6% 140,682 8% 2019 Families Below Poverty with Children 31 1% 6,171 5% 106,439 6%
2019 Estimated Average Household Income 123,450$ 104,884$ 115,037$ 2019 Estimated Median Household Income 106,436$ 79,189$ 81,674$ Source: EnvironicsAnalytics, 2019 and FXM Associates
Town of Hanson Plymouth County State of MA
Population & Households Compared

FXM Associates
Hanson Economic Development Plan 11
FIGURE 1. INCOMES COMPARED 2019
Source: EnvironicsAnalytics, 2019 and FXM Associates Workforce Characteristics The data in Tables 2 and 3 show that the proportion of residents aged 25+ with a bachelor’s degree or higher for the Town of Hanson is 4 percentage points less than for Plymouth County and 10 percentage points less than for the Commonwealth. The Town of Hanson has a higher percentage of service, farm and blue-collar workers when compared to both the County and the Commonwealth. The proportion of households in Hanson that do not own a vehicle (3%) is significantly less than that of the county (6%) and the state (13%) but households in Hanson are also slightly more likely to have three or more vehicles (30%) than in the county (21%) or state (15%). Travel times to work for those in Hanson are shorter than for the county and state: 30 minutes, compared to 36 and 33 minutes at the county and state levels respectively.
$123,450
$106,436 $104,884
$79,189
$115,037
$81,674
$0
$20,000
$40,000
$60,000
$80,000
$100,000
$120,000
$140,000
2019 Average Household Income 2019 Median Household Income
Ann
ual H
ouse
hold
Inc
ome
2019 Household Incomes for Hanson, Plymouth County, and State of Massachusetts
Town of Hanson Plymouth County State of MA

FXM Associates
Hanson Economic Development Plan 12
TABLE 2. WORKFORCE CHARACTERISTICS 2019
Figure 2 shows the occupations of employed residents in Hanson compared to those in Plymouth County and Massachusetts overall. A measurably higher proportion of Hanson residents are employed in construction, installation/maintenance/repair, office/administrative support, and sales/related occupations compared to residents of Plymouth County and Massachusetts overall. A relatively lower proportion of Hanson residents hold occupations in building/grounds cleaning/maintenance, community/social services, healthcare practitioner/technician, and management fields than the overall residents of Plymouth County and the State of Massachusetts.
Education (Pop. Age 25+) 7,542 356,216 4,766,815 Less than 9th grade 78 1% 10,237 3% 220,451 5% Some High School, no diploma 315 4% 17,035 5% 248,368 5% High School Graduate (or GED) 2,376 32% 106,062 29% 1,188,929 25% Some College, no degree 1,510 20% 65,930 18% 753,381 16% Associate Degree 826 11% 33,500 9% 372,047 8% Bachelor's Degree 1,631 22% 83,006 23% 1,135,958 24% Master's Degree 668 9% 35,225 10% 633,236 13% Professional School Degree 123 2% 7,583 2% 141,317 3% Doctorate Degree 15 0% 3,687 1% 127,174 3%
Less than high school diploma 393 5% 27,272 8% 468,819 10% Bachelor's Degree or higher 2,437 32% 129,501 36% 2,037,685 42%
Occupation Classfication (Pop. Age 16+) 6,198 268,280 3,584,409 Blue Collar 1,401 20% 47,090 18% 544,368 15% White Collar 3,795 55% 167,912 63% 2,398,182 67% Service and Farm 1,002 25% 53,278 20% 641,859 18%
Type of Worker (Civ. Employed Pop. 16+) 6,198 268,280 3,584,409 For-Profit Private Workers 4,550 73% 182,870 68% 2,382,663 66% Non-Profit Private Workers 591 10% 27,601 10% 451,630 13% Local Government Workers 444 7% 19,897 7% 245,505 7% State Government Workers 180 3% 10,085 4% 128,385 4% Federal Government Workers 47 1% 3,872 1% 57,543 2% Self-Emp Workers 381 6% 23,537 9% 314,176 9% Unpaid Family Workers 5 0% 418 0% 4,507 0%2019 Est. Households by Number of Vehicles
3,750 190,870 2,710,577
No Vehicles 121 3% 11,854 6% 339,251 13% 1 Vehicle 832 22% 59,531 31% 964,924 36% 2 Vehicles 1,659 44% 80,519 42% 982,077 36% 3 Vehicles 780 21% 27,964 15% 305,986 11% 4 Vehicles 268 7% 8,657 5% 88,841 3% 5 or more Vehicles 90 2% 2,345 1% 29,498 1%
Average Travel Time to Work (minutes) 30 36 33
Source: EnvironicsAnalytics, 2019 and FXM Associates
Town of Hanson Plymouth County State of MA
Workforce Characteristics for Hanson, Plymouth County, and State of MA

FXM Associates
Hanson Economic Development Plan 13
FIGURE 2. OCCUPATIONS COMPARED
Figures 3 and 3A show the commuting origin and destination patterns for work trips out of (Figure 3) and into Hanson (Figure 3A). The blue columns represent numbers of commuters by town, and the orange line is the cumulative percentage. The principal destinations for Hanson workers are Hanson (14%), Boston (11%), Hanover (7%), Brockton (5%), and Pembroke (5%). The major origins for work trips into Hanson are Hanson (39%), Pembroke (7%), Halifax (7%), Whitman (6%), and Carver (6%).
0.0 2.0 4.0 6.0 8.0 10.0 12.0 14.0 16.0
Farming/Fishing/ForestryLife/Physical/Social Science
LegalArchitecture/Engineering
Arts/Design/Entertainment/Sports/MediaCommunity/Social Services
Healthcare SupportBuilding/Grounds Cleaning/Maintenance
Protective ServicesComputer/Mathematical
Personal Care/ServiceInstallation/Maintenance/Repair
ProductionEducation/Training/Library
Business/Financial OperationsTransportation/Material Moving
Healthcare Practitioner/TechnicianFood Preparation/Serving Related
Construction/ExtractionManagementSales/Related
Office/Administrative Support
% of residents employed
Resident OccupationsHanson, Plymouth County, Massachusetts
Massachusetts
Plymouth County
Hanson

FXM Associates
Hanson Economic Development Plan 14
FIGURE 3. HANSON COMMUTERS DESTINATIONS

FXM Associates
Hanson Economic Development Plan 15
Figure 3A: Origin of Commuters to Hanson

FXM Associates Housing Table 3 summarizes housing characteristics in Hanson, Plymouth County, and the State of Massachusetts.
TABLE 3. HOUSING CHARACTERISTICS
The great majority of Hanson residences, 88%, are owner-occupied, higher than the 76% of Plymouth County residents who own, and higher than the 62% of State residents who own, as illustrated in Figure 4. The average length of residence for both owner-occupied and renter-occupied units in Hanson is about the same duration as those in the county and the state.
Tenure (Occupied Housing Units) 3,750 193,463 2,710,577 Owner Occupied 3,314 88% 147,560 76% 1,683,516 62% Renter Occupied 436 12% 45,903 24% 1,027,061 38%
Avg. Length of Residence (yrs) Owner Occupied 19 18 18.5 Renter Occupied 7 8 7.5
Owner-Occupied Housing Values 3,314 147,560 1,683,516 Value Less than $20,000 6 0.2% 1,159 0.8% 15,971 0.9% Value $20,000 - $39,999 27 0.8% 1,167 0.8% 9,994 0.6% Value $40,000 - $59,999 18 0.5% 831 0.6% 7,424 0.4% Value $60,000 - $79,999 3 0.1% 735 0.5% 6,639 0.4% Value $80,000 - $99,999 3 0.1% 1,462 1.0% 10,775 0.6% Value $100,000 - $149,999 21 1% 3,148 2% 53,288 3% Value $150,000 - $199,999 79 2% 5,783 4% 106,284 6% Value $200,000 - $299,999 604 18% 26,495 18% 287,827 17% Value $300,000 - $399,999 1,168 35% 33,883 23% 316,724 19% Value $400,000 - $499,999 845 25% 26,888 18% 269,421 16% Value $500,000 - $749,999 432 13% 27,164 18% 319,144 19% Value $750,000 - $999,999 62 2% 11,264 8% 151,219 9% Value $1,000,000 or more 46 1% 7,581 5% 128,806 8%
Median Value $376,432 $397,257 $409,078
2019 Est. Housing Units by Year Structure Built 3,874 212,869 2,981,030
Built 2014 or Later 283 7% 11,888 6% 162,368 5%Built 2010 to 2013 49 1% 3,281 2% 33,636 1%Built 2000 to 2009 332 9% 20,494 10% 218,917 7%Built 1990 to 1999 394 10% 18,520 9% 219,328 7%Built 1980 to 1989 429 11% 24,136 11% 312,007 10%Built 1970 to 1979 577 15% 31,111 15% 333,056 11%Built 1960 to 1969 574 15% 23,669 11% 289,154 10%Built 1950 to 1959 386 10% 22,493 11% 319,161 11%Built 1940 to 1949 130 3% 10,328 5% 163,458 5%Built 1939 or Earlier 720 19% 46,949 22% 929,945 31%2019 Est. Median Year Structure Built 1972 1971 1962
Source: EnvironicsAnalytics, 2019 and FXM Associates
Plymouth CountyTown of Hanson State of MA
Housing Characteristics

FXM Associates
Hanson Economic Development Plan 17
FIGURE 4. OWNER-OCCUPIED HOUSING 2019
Source: EnvironicsAnalytics, 2019 and FXM Associates Figure 5 compares median housing values for Hanson, Plymouth County, and the State of Massachusetts for 2019. The median value of owner-occupied structures in Hanson ($376,000) is 5% lower than in the county ($397,000) and 8% lower than in the state ($409,000). The largest proportion of Hanson’s housing is valued in the $300,000 to $399,999 range as are both the county and state housing values. About 19% the housing stock in Hanson was built before 1939, with a median construction year of 1972, making its stock newer than that of the state and slightly newer than the that of the county.
88%
76%
62%
0%10%20%30%40%50%60%70%80%90%
100%
Hanson Plymouth County State of MA
Owner-Occupied Housing, 2019

FXM Associates
Hanson Economic Development Plan 18
FIGURE 5. HOUSING VALUES 2019 MEDIAN
Source: EnvironicsAnalytics, 2019 and FXM Associates
Business Characteristics Table 4, below, lists the total number of employees and sales by major industry for 2007 and 2017 (the most recent year for which REIS data are available). The sectors with the highest number of employees in 2017 are Retail Trade, Accommodation and Food Services, Construction, and Professional and Technical Services. The sectors with the highest employment growth rates were Accommodation and Food Services (61%), and Construction (58%). The biggest drops in employment between 2007 and 2017 were experienced in the Manufacturing (-66%), Health Care and Social Assistance (-37%), and Finance and Insurance (-34%).
$376,432$397,257 $409,079
$0
$50,000
$100,000
$150,000
$200,000
$250,000
$300,000
$350,000
$400,000
$450,000
Hanson Plymouth County State of MA
Housing Values, 2019 Median

FXM Associates
Hanson Economic Development Plan 19
TABLE 4. EMPLOYMENT SECTORS FOR THE TOWN OF HANSON
Figure 6 illustrates graphically the relative changes in employment by sector between 2007 and 2017 shown in Table 4. Sectors are ranked by number of 2017 jobs. Noteworthy in the comparison of historical employment trends is that overall jobs in Hanson bottomed out in 2011, at 1,474 jobs. Between 2011 and 2017 Hanson gained approximately 300 jobs, a 21% increase, showing jobs growth in all sectors except Manufacturing and Health Care. The greatest gains were in Professional & Technical Services, which continues to trend upward and is an important potential generator of demand for office space.

FXM Associates
Hanson Economic Development Plan 20
FIGURE 6. COMPARE 2007 AND 2017 EMPLOYMENT BY SECTOR
Table 5 shows average annual wages by industry in Hanson, Plymouth County, and the State of Massachusetts for 2018. Average wages paid to persons working in Hanson are comparable to the county and statewide average annual wages for Manufacturing, Retail Trade, Transportation and Warehousing. They lag averages in all other sectors except Wholesale Trade where wages paid in Hanson substantially exceed the county and statewide averages. At $39,000 on average for all jobs, average annual wages paid in Hanson are 77% of those for Plymouth County overall and 58% of the statewide average. This difference may in part be attributable to the relatively large number of jobs in Hanson in Retail Trade and Accommodation & Food Services, which are relatively low wage occupations. Figure 7 shows the same information graphically.

FXM Associates
Hanson Economic Development Plan 21
TABLE 5. WAGES BY SECTOR 2018
FIGURE 7. AVERAGE ANNUAL WAGES BY INDUSTRY HANSON, PLYMOUTH COUNTY, STATE OF MASSACHUSETTS, 2018
Sectors Hanson Town as % of County
Town as % of State
Plymouth County
State of Massachusetts
23 - Construction $56,940 78% 76% $73,060 $75,14031-33 - Manufacturing $58,292 96% 71% $60,424 $82,26442 - Wholesale Trade $109,460 128% 116% $85,748 $94,48444-45 - Retail Trade $32,812 99% 94% $33,020 $34,78848-49 - Transportation and Warehousing $46,592 99% 86% $47,164 $54,08052 - Finance and Insurance $49,660 58% 41% $86,268 $121,00453 - Real Estate and Rental and Leasing $46,800 83% 63% $56,056 $74,77654 - Professional and Technical Services $59,904 76% 48% $78,468 $124,90456 - Administrative and Waste Services $39,936 81% 82% $49,400 $48,67262 - Health Care and Social Assistance $40,872 87% 74% $47,112 $55,48472 - Accommodation and Food Services $14,456 68% 57% $21,112 $25,53281 - Other Services, Except Public Administration $19,968 64% 52% $31,200 $38,376 Average All Industries $39,052 77% 58% $50,700 $67,860Scource: MA Executive office of Labor and Workforce Development (EOLWD),ES202 Data, 2018, 3rd Quarter; and FXM Associates
Wages by Sector, 2018, Hanson, Plymouth County, and State of Massachusetts
$0 $40,000 $80,000 $120,000
23 - Construction
31-33 - Manufacturing
42 - Wholesale Trade
44-45 - Retail Trade
48-49 - Transportation and Warehousing
52 - Finance and Insurance
53 - Real Estate and Rental and Leasing
54 - Professional and Technical Services
56 - Administrative and Waste Services
62 - Health Care and Social Assistance
72 - Accommodation and Food Services
81 - Other Services, Except Public…
Average All Industries
Hanson. Plymouth County, Massachusetts Wages Compared
State of Massachusetts Plymouth County Hanson

FXM Associates MARKET CONDITIONS AND TRENDS This part of the report focuses on potential for growth in those parts of the economy which are likely targets for Hanson’s real estate and economic development. The discussion includes:
• an analysis of historical trends in employment by sector; • potential space demand based on historical employment trends; • current opportunities to capture retail sales leakage; and • analysis of trends in the inventory, vacancies, occupancy, and lease rates for
office, industrial, and retail space in Hanson as well as in the surrounding submarkets for each type of space.
Employment Trends The measure most widely used for market trends analyses is employment because historical and projected jobs are a good indicator of the current status and future direction of a given industry. Increasing employment indicates industries that are growing, whether through expansion of existing businesses or opening of new ones, and therefore are most likely to provide future employment opportunities in the community. Also, reasonably reliable historic data are readily available and can be used to project future employment opportunities. The two sources used here for the employment trends graphs are the ES202 reports from the Massachusetts Department of Labor and Workforce Development, modified by the more inclusive (because they include self-employment data) reports from the Regional Economic Information System (REIS) of the U.S. Department of Commerce, Bureau of Economic Analysis. The following graphs display trends and projections for the Town of Hanson and Plymouth County. Note that because of the size differences between town and county, the graphs should be read on two axes, the county on the right and Hanson on the left. Figure 8 shows total employment trends for all industries. The R2 values for the projections for Hanson and Plymouth County are high enough to suggest generally upward trends for Plymouth County and Hanson since the recession.5 5 The method chosen to project near-term future employment is a linear auto-regression of the time series data of employment categories from the sources above. This method assumes that the overall economic factors influencing employment growth (or decline) in the recent past will continue into the near future, and that the observed trends in employment will continue in a roughly straight-line fashion for the next few years. The statistic used to signify the confidence in a given projection is called the coefficient of determination (R2) calculation and is presented alongside each projection

FXM Associates
Hanson Economic Development Plan 23
FIGURE 8. TOWN OF HANSON AND PLYMOUTH COUNTY:
TOTAL ALL INDUSTRIES 2006-2022
Office-using industries are a potential target for more growth and development. For the purposes of this analysis FXM has defined office-using sectors by NAICS codes: Professional Offices, Non-medical 51–Information 52-Finance and Insurance
given below. The closer the R2 value is to 1, the better the predictive value of linear analysis of past performance. A limiting factor on the level of confidence in the projections is the influence of the 2008-9 recession, which is still being felt in some sectors and which may also affect the accuracy of a linear trendline projection. For example, a sector might be showing strong growth since 2011 but the volatility introduced by the recession could pull down the projected future growth and also lower the R2 value of the projection. Therefore, the historical trendlines may be adjusted to account for a shift in the level of employment due to the recession, or a rapid post-recession recovery to the previous longer-term trend. Meanwhile, it is still too soon to know whether and how post-recession growth will be sustained. Over the next several years other factors, whose quantitative effects are not foreseeable at this time, will affect the projections shown, including the impact of tariffs and other international trade policies, the real estate cycle (currently approaching 10 years, which is unusually long), and inflation/interest rate policies – all of which can influence business practices.

FXM Associates
Hanson Economic Development Plan 24
53-Real Estate and Rental & Leasing 54–Professional, Scientific, and Technical Services 55–Management of Companies and Enterprises 56-Administrative and Support Services and Waste Management &
Remediation There is no graph for the Information sector, as there has been no employment in this sector in Hanson since 2006, and the sector is projected to lose jobs in Plymouth County over the next five years. There are also no jobs in Management of Companies and Enterprises in Hanson, so no graph is displayed. Figure 9 shows trends and projections for all office-using industries in Hanson and in Plymouth County. The projection for Plymouth County office-using employment is sound, with an R2 value above 0.92 indicating a promising and reliable upward trend. Observations in Hanson are more variable and hence the trendline has a lower predictive value based on historic growth, an R2 of only 0.13. Consequently, it is difficult to know with any confidence whether these sectors as a group have potential for growth by interpreting data from the past ten years that include the recession. Focusing on the past four years, Hanson has experienced more consistent growth and has more closely mirrored trends of Plymouth County.

FXM Associates
Hanson Economic Development Plan 25
FIGURE 9. TOWN OF HANSON AND PLYMOUTH COUNTY EMPLOYMENT: TOTAL OFFICE-USING INDUSTRIES,
2006-2022
Trends in Finance and Insurance are shown in Figure 10. Although both projections have a high level of confidence, employment is expected to increase in Plymouth County but has been losing jobs in Hanson and will likely continue to do so; however, it is a relatively small sector for the town.

FXM Associates
Hanson Economic Development Plan 26
FIGURE 10. TOWN OF HANSON AND PLYMOUTH COUNTY EMPLOYMENT: FINANCE AND INSURANCE,
2006-2022
Employment in Real Estate and Rental and Leasing is projected to grow in Plymouth County and to hold fairly steady in Hanson. Both projections, for town and county, are positive, with strong R2.

FXM Associates
Hanson Economic Development Plan 27
FIGURE 11. TOWN OF HANSON AND PLYMOUTH COUNTY EMPLOYMENT: REAL ESTATE AND RENTAL & LEASING,
2006-2022
The Professional and Technical Services sector is one of the larger employers and is expected to grow in both locations, though at a higher level of confidence for Plymouth County than for the Hanson. Nevertheless, some county growth might be captured by Hanson.

FXM Associates
Hanson Economic Development Plan 28
FIGURE 12. TOWN OF HANSON AND PLYMOUTH COUNTY EMPLOYMENT: PROFESSIONAL AND TECHNICAL SERVICES,
2006-2022
Although trends at both county and town level have been quite volatile, trends in Administrative and Support Services are upwards for both Hanson and the county, and at sufficient levels of reliability to warrant optimism. These jobs, however, are not high-paying.

FXM Associates
Hanson Economic Development Plan 29
FIGURE 13. TOWN OF HANSON AND PLYMOUTH COUNTY EMPLOYMENT: ADMINISTRATIVE AND SUPPORT SERVICES,
2006-2022
The following figures show historical and projected trend lines for the three largest employment sectors in Hanson: Retail Trade, Accommodation and Food Services, and Construction.

FXM Associates
Hanson Economic Development Plan 30
FIGURE 14. TOWN OF HANSON AND PLYMOUTH COUNTY EMPLOYMENT: RETAIL TRADE 2006-2022
The Retail Trade trend lines show the sharp dip from the 2008 recession. While the sector shows recovery at both town and county levels, the overall trend projected for Hanson is downward, while Plymouth County is upward, but at a very low level of reliability (R2 0.166). It may take several more years to get beyond the volatility introduced by the recession for more stable trends to appear. The Accommodation and Food Services trends are both upward, with reasonably reliable projections, particularly for Plymouth County, suggesting that there may be opportunities for Hanson to attract more of this sector’s activity.

FXM Associates
Hanson Economic Development Plan 31
FIGURE 15. TOWN OF HANSON AND PLYMOUTH COUNTY EMPLOYMENT: ACCOMMODATION AND FOOD SERVICES,
2006-2022
Although both trend lines and projections are positive for the Construction sector, the R2 values are very low, meaning that it will be difficult to predict future employment in this sector based on historic performance.

FXM Associates
Hanson Economic Development Plan 32
FIGURE 16. TOWN OF HANSON AND PLYMOUTH COUNTY EMPLOYMENT: CONSTRUCTION,
2006-2022
The next graphs show trends and projections for two sectors expected to experience job losses over the five-year period between 2017 and 2022: Manufacturing and Health and Social Assistance. Figure 17 shows employment in Manufacturing in Hanson virtually plummeting by 2020, with relatively fewer losses at the county level.

FXM Associates
Hanson Economic Development Plan 33
FIGURE 17. TOWN OF HANSON AND PLYMOUTH COUNTY EMPLOYMENT: MANUFACTURING,
2006-2022
Figure 18 bears a special note because the Health Care and Social Assistance sector is a growth industry in most parts of Massachusetts, as it is in Plymouth County, at a very high level of reliability. The projected losses for Hanson also have a very high R2 value, as the historic trend has been downward for some time, but particularly since 2014.

FXM Associates
Hanson Economic Development Plan 34
FIGURE 18. TOWN OF HANSON AND PLYMOUTH COUNTY EMPLOYMENT: HEALTH CARE AND SOCIAL ASSISTANCE,
2006-2022
Figures 19 and 20 following show trends and projections in the other sectors of Hanson employment: Wholesale Trade and Other Services. (There are no data for Transportation and Warehousing in Hanson after 2008). Wholesale Trade has shown strong growth over the past 10 years and is expected to grow in Hanson over the next five, with a strong R2.

FXM Associates
Hanson Economic Development Plan 35
FIGURE 19. TOWN OF HANSON AND PLYMOUTH COUNTY EMPLOYMENT: WHOLESALE TRADE,
2006-2022
Repairs and maintenance services make up the majority of employees in the Other Services Except Public Administration category. Figure 20 shows historical trends and projections, which are not at all predictive for Hanson.

FXM Associates
Hanson Economic Development Plan 36
FIGURE 20. TOWN OF HANSON AND PLYMOUTH COUNTY EMPLOYMENT: OTHER SERVICES (EXCEPT PUBLIC ADMINISTRATION),
2006-2022
PROJECTED SPACE DEMAND THROUGH 2022 The above employment projections, with their relevant caveats regarding reliability, can be translated into estimates of future demand for commercial space using industry norms for square foot per employee. Table 6 compiles these projections. (Zeros are shown for sectors in which job losses are projected.)

FXM Associates
Hanson Economic Development Plan 37
TABLE 6. HANSON PROJECTED SPACE DEMAND THROUGH 2022
BASED ON HISTORICAL EMLOYMENT TRENDS
In the table, office-using industries are grouped together since they require similar kinds of space. Note that net job growth for Hanson in office-using industries is expected to be positive and is anticipated to add 52 jobs and demand 13,000 square feet of office-space over the next few years. Based on trends in office using industries since 2011, an additional 12,000 square feet of space would be projected, bringing potential office space demand driven by projected employment growth to 25,000 square feet through 2022. Accommodation and Food Service Jobs are also projected to grow; however, they, along with Administrative and Support jobs, are relatively low-paying. RETAIL OPPORTUNITY GAP/SURPLUS The retail opportunity gap analysis is a tool used by major retailers and chain restaurants to gauge market demand and competition within a specified geographic area. It presents a snapshot of the current consumer spending on various retail categories within a specified geographic area alongside actual retail store sales in those same categories within the same geographic area. Where expenditures by households in the market area exceed sales in that market area, a gap or opportunity exists for stores within the market area to “capture” more of those household expenditures. (This loss of potential sales is also called “leakage”.)
SectorProjected New Jobs
Projected Space Demand (SF)
Projected New Jobs
Projected Space Demand (SF)
42 - Wholesale Trade 11 5,272 0 048-49 Transportation and Warehousing 0 0 495 247,259
Office-using51- Information 0 0 0 052-Finance & Insurance 0 0 1,577 394,26753- Real Estate and Rental Leasing 4 993 1,245 311,26954 - Professional, Scientific, & Technical 8 1,965 915 228,79456-Administrative & Support 40 9,949 459 114,626
Subtotal Office-using 52 12,907 4,196 1,048,957
62-Health care and Social Assistance 0 0 4,899 1,959,70671-Arts, Entertainment, and Recreation 0 0 449 179,44372 - Accommodation & Food Services 37 6,543 1,263 222,27181- Other Services (Except Pub Admin) 0 0 639 127,881
TOTAL NEW JOBS 99 24,722 11,941 3,785,518Scource: Massachusetts Department of Labor and Workforce Development, ES202 reports (adjusted by REIS); FXM Associates
Plymouth CountyHanson
Hanson Projected Space Demand Through 2022 Based on Historical Employment Trends

FXM Associates
Hanson Economic Development Plan 38
Conversely, where market area household expenditures are less than actual sales categories, it indicates that stores in that retail category in the market area already attract consumer dollars from outside the market area and opportunities for additional retail activity would be more limited. The retail gap analysis is a picture of current opportunities for retailers to newly locate or expand facilities based on a well-established principle drawn from many empirical studies. This analysis shows that people will usually purchase goods and services within the shortest available walking or drive time from where they live. The principle applies to comparable and competitive goods, services, and pricing: there is no guarantee of success based strictly on location advantage, which simply presents the opportunity. Retailers typically define market areas in terms of drive times, with a 15-minute drive time considered the maximum time consumers would be willing to drive for all but the largest stores and store types. Market support within a 5-minute drive time is considered the maximum time consumers would be willing to drive to smaller, convenience type retailers, and market demand within a 10-minute drive time is considered essential for most medium sized stores and restaurants. In the case of Hanson, 10- and 15-minute drive times were selected as the most likely area from which to draw additional retail activity. The center of the drive time radii is the MBTA commuter rail station on Main St./Rte. 27. The 5-, 10-, and 15-minute drive times are shown in Figures 21, 22, and 23.

FXM Associates
Hanson Economic Development Plan 39
FIGURE 21. 5-MINUTE DRIVE TIME MAP
Source: Claritas LLC 2019 (https://en.environicsanalytics.ca/Envision/About/3/2019

FXM Associates
Hanson Economic Development Plan 40
FIGURE 22. 10-MINUTE DRIVE TIME MAP
Source: Claritas LLC 2019 (https://en.environicsanalytics.ca/Envision/About/3/2019

FXM Associates
Hanson Economic Development Plan 41
FIGURE 23. 15-MINUTE DRIVE TIME MAP
Source: Claritas LLC 2019 (https://en.environicsanalytics.ca/Envision/About/3/2019

FXM Associates
Hanson Economic Development Plan 42
Table 7 below shows the total population, in come, retail expenditures (demand), retail sales (supply), and the total gap within the 5-, 10-, and 15-minute drive times defining the market areas.
TABLE 7. OVERVIEW OF HANSON RETAIL MARKET ANALYSIS
In the market area defined by the 5-minute drive time, a relatively small area, businesses are selling more than the resident population is spending, indicating fewer opportunities to capture additional sales from surrounding areas. In the 10- and 15-minute areas, however, merchants are selling less than the resident population is spending, with expenditures “leaking” into nearby areas. The sector level shows which types of spending businesses within these two areas might attract more resident spending. Data in Table 8 summarize FXM’s analysis of those sectors in which current consumer expenditures (demand) exceed actual store sales (supply) within the local retail market areas. The analysis shows where the gaps between supply and demand are sufficiently large to indicate some opportunities to capture sales leakages, either by new stores or expansion of existing businesses. The market areas for these sectors are within 10- and 15-minute drive time limits.
5-Minute Drive Time
10-Minute Drive time
15-Minute Drive Time
Population 1,882 25,240 75,608Median Income 105,436$ 99,452$ 97,384$
Total Retail Expenditures* 39,876,791$ 509,306,351$ 1,530,176,310$ Total Retail Sales* 51,106,652$ 314,160,680$ 1,037,524,876$ Total Opportunity Gap (11,229,861)$ 195,145,671$ 492,651,434$ *includes restaurantsSource: EnvironicsAnalytics Spotlight Reports and FXM Associates, 2019
Overview of Hanson Retail Market Areas

FXM Associates
Hanson Economic Development Plan 43
TABLE 8. RETAIL OPPORTUNITIES IN THE HANSON MBTA RETAIL MARKET AREA: 2019
According to the estimates used in the calculations for the table, resident spending within Hanson’s market area could support six additional stores, or the corresponding square footage of existing store expansion, and three additional restaurants, two of those full-service facilities, for a total of 98,600 additional square feet of retail/restaurant activity. The difference between the “Supportable SF” and “Potentially Captured SF” columns represents an estimate of how much of the square footage supported by new business potential might reasonably be captured by Hanson. A capture rate of 30% is used for all store types except electronics stores (50%) and supermarkets (100%). The final column in the table shows estimated growth rates for the retail categories over the next five years. Note that the retail gap calculations are based on 10- and 15-minute drive times, selected as the most appropriate limits on the market areas for the selected business categories. The growth rate estimates are for those business types in the Town of Hanson only, but, as shown in the table, the variation among the projections is not great, and all the retail sectors in which meaningful gaps exist are projected to grow between 2% and 3% annually over the next five years.

FXM Associates COMMERCIAL REAL ESTATE MARKET OVERVIEW This section assesses historical conditions and trends in the inventory, vacancies, occupancies, and pricing of office, industrial, and retail space in Hanson and surrounding communities. The quantitative analysis is based on data collected by CoStar, a subscription commercial real estate information service, widely used by real estate professionals, developers, and financial institutions in evaluating market potential and values. Office Space Market Trends FXM analyzed trends in the supply, vacancies, occupancies, and pricing of office space within Hanson and surrounding communities, which were defined by real estate professionals interviewed for this project as the broader area of competitive supply. The surrounding communities “submarket” includes Hanson, Rockland, Hanover, Whitman, East Bridgewater, Pembroke, and Halifax. Figure 24 shows trends in the inventory of office space in Hanson and the Submarket overall between 2010 and the second quarter of 2019. The current inventory of office space in Hanson and surrounding towns is reported by CoStar to be 1,654,000 square feet. Over the past 10 years the inventory (gross leasable area) of office space increased by only 1,000 square feet in the Submarket overall with no additions to the office space supply in Hanson during this period. In fact, there has been no change in the supply of office space in Hanson, according to CoStar, over the past 30 years.
FIGURE 24. OFFICE SPACE INVENTORY: HANSON & SUBMARKET
Source: Co Star Property Information System,2019, and FXM Associates
0
5,000
10,000
15,000
20,000
25,000
30,000
35,000
1,650,0001,650,5001,651,0001,651,5001,652,0001,652,5001,653,0001,653,5001,654,0001,654,500
2010201120122013201420152016201720182019
Han
son
SF
Sub
mar
ket
SF
OFFICE Space Inventory SF Hanson & Submarket
Submarket Inventory SF Hanson Inventory SF

FXM Associates
Hanson Economic Development Plan 45
Figure 25 shows no vacancies in office space in Hanson and 71,000 vacant square feet in the Submarket overall in the second quarter of 2019. Vacancies declined from a high of about 2,000 square feet in Hanson in 2015 and from a high of 238,000 square feet in the submarket overall in 2010. Figure 26 shows the same trends as a percent of total supply – vacancy rates – which are currently 0% in Hanson and 4.3% in the submarket overall. Clearly, the supply of office space available in Hanson and surrounding towns is extremely limited. The longer-term trend in office space utilization (Figure 27) is also favorable. The ten-year trend forecast predicts an average annual increase in office space occupancies of 24,000 square feet per year in the Submarket overall through 2024, virtually exhausting the current vacant inventory within 3 years should the trend continue. Figure 28 graphs historical trends in office space gross lease rates (per SF per year), which have been increasing by 1.4% per year in the Submarket overall and 3.7% per year in Hanson on average over the past 10 years.
FIGURE 25. OFFICE SPACE VACANCIES, HANSON & SUBMARKET
Source: Co Star Property Information System,2019, and FXM Associates
0
500
1000
1500
2000
2500
0
50,000
100,000
150,000
200,000
250,000
2010 2011 2012 2013 2014 2015 2016 2017 2018 2019
Han
son
Vac
ant
SF
Sub
mar
ket
Vac
ant
SF
OFFICE Space Vacant SFHanson & Submarket
Submarket Vacant SF Hanson Vacant SF

FXM Associates
Hanson Economic Development Plan 46
FIGURE 26. OFFICE SPACE VACANCY RATES, HANSON & SUBMARKET
Source: Co Star Property Information System,2019, and FXM Associates
1.6
0
14.4
4.3
0
2
4
6
8
10
12
14
16
2010 2011 2012 2013 2014 2015 2016 2017 2018 2019
% V
acan
tOFFICE Space Vacancy %
Hanson & Submarket
Hanson Vacant % Submarket Vacant %

FXM Associates
Hanson Economic Development Plan 47
FIGURE 27. OFFICE SPACE OCCUPANCIES, HANSON & SUBMARKET
Source: Co Star Property Information System, 2019, and FXM Associates
FIGURE 28. OFFICE SPACE GROSS RENTS, HANSON & SUBMARKET
Source: Co Star Property Information System, 2019, and FXM Associates
28,500
29,000
29,500
30,000
30,500
31,000
31,500
32,000
32,500
1,300,000
1,350,000
1,400,000
1,450,000
1,500,000
1,550,000
1,600,000
2010201120122013201420152016201720182019
Han
son
Occ
upan
cy S
F
Sub
mar
ket
Occ
upan
cy S
FOFFICE Space Occupancy SF
Hanson & Submarket
$14.07
$19.23
$0.00
$5.00
$10.00
$15.00
$20.00
$25.00
2010 2011 2012 2013 2014 2015 2016 2017 2018 2019
OFFICE Space Gross Rent Hanson & Submarket
Hanson Office Gross Rent Overall
Submarket Office Gross Rent Overall

FXM Associates
Hanson Economic Development Plan 48
An increasingly important prospect for conversion of existing low performing office spaces, and for potential new development, is shared workspaces. These include incubators, makerspaces, co-working space and other specialty types that essentially allow multiple tenants to share equipment, conference areas, kitchen and fitness facilities, and other services and amenities alongside individual workstations. They not only provide relatively low-cost rental opportunities to small businesses but also the opportunity for commuters to spend more time close to home. With the availability of commuter rail service there are likely market supportable opportunities now. While large firms that are now acquiring conventional office buildings for conversion to shared workspaces in both major cities and suburban areas are unlikely to find the limited market demand in Hanson and surrounding communities attractive for investment, individual property owners could make such conversions of existing underperforming assets and newly construct co-working office space. The $19 per square foot average rent for office space in Hanson is another favorable market indicator for additions to the current supply—as such rents could support new construction or rehabilitation of existing space -- as well as the lack of available office space. Industrial Space Market Trends Figure 29 shows trends in the inventory of industrial space (primarily distribution & warehousing but also including manufacturing) in Hanson and the surrounding communities competitive Submarket. The supply of industrial space in Hanson currently stands at 487,000 square feet, a decline of -82,000 square feet (-14%) over the past 10 years. At 4,700,000 square feet the supply of industrial space in the Submarket overall has also declined since 2010, by -114,000 square feet (-2%). Hanson thus accounts for over 70% of the lost industrial space over this period. However, since 2015 the inventory of industrial space has increased by 3,400 square feet in Hanson and 93,000 square feet in the submarket overall.

FXM Associates
Hanson Economic Development Plan 49
FIGURE 29. INDUSTRIAL SPACE INVENTORY SF, HANSON & SUBMARKET
Source: Co Star Property Information System, 2019, and FXM Associates
Vacancies have declined precipitously in both Hanson and the Submarket since 2010, as shown in Figure 30. By the 2nd quarter of 2019 industrial space vacancies in Hanson were reported to be zero by CoStar and less than 180,000 square feet in the Submarket overall. Figure 31 shows these as a percentage of the inventory. The current vacancy rates are 0% in Hanson and 3.8% in the Submarket overall. Only a portion of the decline in vacancies is attributable to a loss of industrial space inventory compared to increased occupancies, as shown in Figure 32. Since 2010 over 29,000 square feet of industrial space have been absorbed (newly occupied) in Hanson and 769,000 square feet in the Submarket overall. Based on the recent 10-year historical trends, occupancies of industrial space in the Submarket overall are projected to increase by 463,000 square feet, an average of 93,000 square feet per year. At this rate of growth, the current supply of vacant industrial space would be exhausted in 2 years.
440,000
460,000
480,000
500,000
520,000
540,000
560,000
580,000
4,450,000
4,500,000
4,550,000
4,600,000
4,650,000
4,700,000
4,750,000
4,800,000
4,850,000
2010201120122013201420152016201720182019
Han
son
SF
Sub
mar
ket
SF
Axis Title
INDUSTRIAL Space Inventory SFHanson & Submarket
Submarket Inventory SF Hanson Inventory SF

FXM Associates
Hanson Economic Development Plan 50
FIGURE 30. VACANT INDUSTRIAL SPACE SF, HANSON & SUBMARKET
Source: Co Star Property Information System, 2019, and FXM Associates
FIGURE 31. INDUSTRIAL SPACE VACANCY RATES, HANSON & SUBMARKET
Source: Co Star Property Information System, 2019, and FXM Associates
0
20,000
40,000
60,000
80,000
100,000
120,000
0
200,000
400,000
600,000
800,000
1,000,000
1,200,000
2010 2011 2012 2013 2014 2015 2016 2017 2018 2019
Han
son
SF
Sub
mar
ket
SF
INDUSTRIAL Space Vacant SF Hanson & Submarket
Submarket Vacant SF Hanson Vacant SF
19.4
0
22.1
3.8
0
5
10
15
20
25
2010 2011 2012 2013 2014 2015 2016 2017 2018 2019
Vac
ant
%
INDUSTRIAL Space Vacant % Hanson & Submarket
Hanson Vacant % Submarket Vacant %

FXM Associates
Hanson Economic Development Plan 51
FIGURE 32. INDUSTRIAL SPACE OCCUPANCIES, HANSON & SUBMARKET
Source: Co Star Property Information System, 2019, and FXM Associates
The very low vacancy rates and projected continued increase in occupancies bode well for expanding the supply of industrial space (with concomitant gains in tax base and jobs) in Hanson and the broader Submarket, assuming developable industrially zoned land is available. Additionally, favorable from a potential development perspective has been the persistent increase in rents for industrial space, as shown in Figure 33. Rents have increased by an average of 5.8% per year in Hanson and 8.4% per year in the Submarket overall. At the current overall Submarket rent of $7.78 per square foot per year, expansion of existing buildings or new buildings to accommodate projected demand appears feasible for the owners of developable, industrially zoned land.
440,000
445,000
450,000
455,000
460,000
465,000
470,000
475,000
480,000
485,000
490,000
0
500,000
1,000,000
1,500,000
2,000,000
2,500,000
3,000,000
3,500,000
4,000,000
4,500,000
5,000,000
2010 2011 2012 2013 2014 2015 2016 2017 2018 2019
Han
son
Occ
upan
cy S
F
Sub
mar
ket
Occ
upan
cy S
F
INDUSTRIAL Space Occupancy SFHanson & Submarket
Submarket Occupancy SF Hanson Occupancy SF

FXM Associates
Hanson Economic Development Plan 52
FIGURE 33. INDUSTRIAL SPACE RENT SF/YEAR, HANSON & SUBMARKET
Source: Co Star Property Information System, 2019, and FXM Associates
Retail Space Market Trends Figure 34 shows trends in the inventory of retail space in Hanson and the surrounding Submarket, defined as Hanson and the surrounding communities (Rockland, Hanover, Whitman, East Bridgewater, Pembroke, and Halifax). Conditions and trends in a larger geographic area would not be considered competitive as retail serves a local and regional consumer market -- typically a 15-minute drive time for a regional center, and less for community center and local, neighborhood-serving stores. High quality restaurants may draw from a larger area, as will highly specialized national retailers and major discount furniture stores, but the supply of such spaces is small in comparison to the overall retail mix. Immediate prospects for capturing sales currently leaking out of these drive-time market areas are addressed in the previous retail opportunity gap/surplus section of the report, while this section addresses longer-term conditions and trends in the supply of retail space. As shown in Figure 34 there has been no change in the inventory of retail space in Hanson, which has stood at approximately 300,000 square feet since 2010. The
$3.80
$5.78 $4.43
$7.78
$0.00
$1.00
$2.00
$3.00
$4.00
$5.00
$6.00
$7.00
$8.00
$9.00
2010 2011 2012 2013 2014 2015 2016 2017 2018 2019
INDUSTRIAL Space Rent per SF per Year Hanson & Submarket
Hanson All Service Type Rent Submarket All Service Type Rent

FXM Associates
Hanson Economic Development Plan 53
Submarket overall gained 182,000 square feet of retail space – a net increase of 3% over the 2010 supply -- and in the 2nd quarter of 2019 stands at about 5,744,000 square feet.
FIGURE 34. RETAIL SPACE INVENTORY SF, HANSON & SUBMARKET
Source: Co Star Property Information System, 2019, and FXM Associates
Figure 35 shows trends in vacancies in retail space, which declined significantly in Hanson over the past 4 years and in the 2nd quarter of 2019 stood at slightly over 2,000 square feet (0.7% of the inventory). Vacancies in retail space within the overall Submarket declined by over 50% since 2010 and are now 156,000 square feet (2.7% of the inventory). Vacancy rate trends are shown in Figure 36.
0
50,000
100,000
150,000
200,000
250,000
300,000
350,000
5,450,000
5,500,000
5,550,000
5,600,000
5,650,000
5,700,000
5,750,000
5,800,000
Han
son
SF
Sub
mar
ket
SF
RETAIL Space Inventory SFHanson & Submarket
Submarket Inventory SF Hanson Inventory SF

FXM Associates
Hanson Economic Development Plan 54
FIGURE 35. VACANT RETAIL SPACE SF, HANSON & SUBMARKET
Source: Co Star Property Information System and FXM Associates
FIGURE 36. RETAIL SPACE VACANCY RATES, HANSON & SUBMARKET
Source: Co Star Property Information System and FXM Associates
0
5,000
10,000
15,000
20,000
25,000
30,000
35,000
40,000
0
50,000
100,000
150,000
200,000
250,000
300,000
350,000
400,000
Han
son
SF
Sub
mar
ket
SF
RETAIL Space Vacant SF Hanson & Submarket
Submnarket Vacant SF Hanson Vacant SF
5.1
0.7
6.4
2.7
0
2
4
6
8
10
12
14
2010 2011 2012 2013 2014 2015 2016 2017 2018 2019
Vac
ancy
%
RETAIL Space Vacancy % Hanson & Submarket
Hanson Vacant % Submarket Vacant %
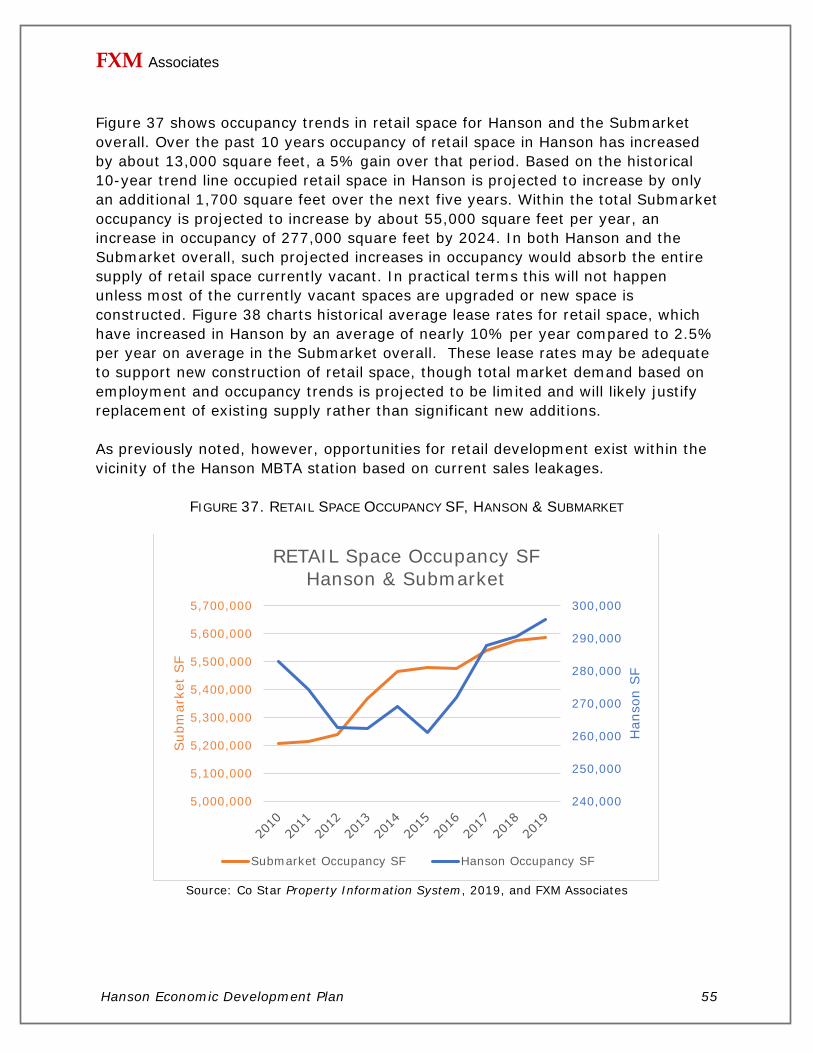
FXM Associates
Hanson Economic Development Plan 55
Figure 37 shows occupancy trends in retail space for Hanson and the Submarket overall. Over the past 10 years occupancy of retail space in Hanson has increased by about 13,000 square feet, a 5% gain over that period. Based on the historical 10-year trend line occupied retail space in Hanson is projected to increase by only an additional 1,700 square feet over the next five years. Within the total Submarket occupancy is projected to increase by about 55,000 square feet per year, an increase in occupancy of 277,000 square feet by 2024. In both Hanson and the Submarket overall, such projected increases in occupancy would absorb the entire supply of retail space currently vacant. In practical terms this will not happen unless most of the currently vacant spaces are upgraded or new space is constructed. Figure 38 charts historical average lease rates for retail space, which have increased in Hanson by an average of nearly 10% per year compared to 2.5% per year on average in the Submarket overall. These lease rates may be adequate to support new construction of retail space, though total market demand based on employment and occupancy trends is projected to be limited and will likely justify replacement of existing supply rather than significant new additions. As previously noted, however, opportunities for retail development exist within the vicinity of the Hanson MBTA station based on current sales leakages.
FIGURE 37. RETAIL SPACE OCCUPANCY SF, HANSON & SUBMARKET
Source: Co Star Property Information System, 2019, and FXM Associates
240,000
250,000
260,000
270,000
280,000
290,000
300,000
5,000,000
5,100,000
5,200,000
5,300,000
5,400,000
5,500,000
5,600,000
5,700,000
Han
son
SF
Sub
mar
ket
SF
RETAIL Space Occupancy SF Hanson & Submarket
Submarket Occupancy SF Hanson Occupancy SF

FXM Associates
Hanson Economic Development Plan 56
FIGURE 38. RETAIL SPACE RENT/SF/YEAR, HANSON & SUBMARKET
Source: Co Star Property Information System, 2019, and FXM Associates
RENTAL HOUSING DEMAND AND SUPPLY TRENDS Rental housing is increasingly considered an important asset to economic development, particularly as it enables a community to attract and/or retain its younger labor force and others not interested in, or able to, afford homeownership in traditional single-family neighborhoods. To the extent that rental housing development can complement mixed uses in older downtown and neighborhood commercial centers, it also represents an opportunity to upgrade underutilized properties. Younger households and empty nesters are also able and willing, and often prefer, to live in areas that enable them to walk to restaurants, retail shops, recreational opportunities and even jobs that might not be suitable for traditional family housing. Employers are increasingly looking to communities that will enable their current and prospective employees to live and work close to the business location.
$9.26
$17.40
$12.97 $15.92
$0.00
$2.00
$4.00
$6.00
$8.00
$10.00
$12.00
$14.00
$16.00
$18.00
$20.00
2010 2011 2012 2013 2014 2015 2016 2017 2018 2019
RETAIL Space Rents per SF per YearHanson & Submarket
Hanson All Service Type Rent Submarket All Service Type Rent

FXM Associates
Hanson Economic Development Plan 57
The residential component of a mixed-use project can make or break its financial feasibility,6 especially when trying to upgrade older downtown/village centers where retail/commercial rents are not adequate to support rehabilitation. FXM’s Housing Demand Model projects over the next five years the average annual demand for rental housing by age group, income and affordable rental rates. FXM’s model is distinctive in that it captures mobility within the market area as well as net new growth. Over 90% of expected demand for rental housing in most market areas in New England is generated by households already residing in the area, who are looking to change from owners to renters, upsize or downsize from the current unit, or change location for family or work reasons. FXM’s model explicitly accounts for propensity to own or rent and frequency of moving by householder age and income. In addition to assessing average annual demand based on householder characteristics and tendencies, this section also analyzes recently available rental units within the market area by unit size, number of bedrooms, and rental rates; and analyzes historical trends in the inventory, vacancy rates, and monthly rents for rental units by number of bedrooms. The objective of the analytic exercise is to assist planners and developers understanding residential development potential, and to target types of rental units, in terms of cost and size and amenities, to various age groups of potential renters. For the purposes of this analysis the market area is defined as the area within a 20-minute drive time of 542 Liberty Street in Hanson. The 20-minute drive time area is consistent with the generally accepted view of the primary geographic area within which communities offer similar economic development attributes and constitute the competitive region for attracting jobs and households. This market area is shown graphically in Figure 39. For this geographic area, FXM obtained proprietary data from EnvironicsAnalytics Spotlight Reports, estimating the number of households by age of householder and income ranges in 2019 and projected to 2024. Data in Table 9 provide an overview of population, households, and renters within this market area.
6 Virtually all the major real estate developments recently completed, currently underway or proposed, in greater Boston’s superheated real estate market involve residential, retail/restaurant, and office components rather than stand-alone single uses.

FXM Associates
Hanson Economic Development Plan 58
TABLE 9. HOUSING DEMAND CONTEXT 20-MINUTE MARKET AREA
The following demand assessment is segmented by age and affordable rents. Rent levels needed to support rehabilitation or new construction will vary depending upon the development costs of a specific project, which may include tax credits, favorable financing terms, land write-downs and other mechanisms to assure feasibility.
Households within the under 35 and 55 to 74 age groups are the ones frequently targeted by developers for urban and specialty rental housing, such as re-use of formerly commercial and institutional structures, because they are less likely to have school age children and therefore more open to units with fewer bedrooms in locations that are not necessarily ideal environments for children. They are also likely to be attracted to denser urban environments that allow walking distances to restaurants and retail shops. Households in other age groups, however, also generate demand for housing within the market area, and this analysis assesses potential demand for all age groups.
Population 154,891Households 56,817Renter Households 12,068
% Renters 21%Renters Moving in Average Year 2,222% of All Households 4%Median Household Income 87,519$
Source: EnvironicsAnalytics, Spotlight. 2019 estimates, and FXM Associates
Housing Demand Context20-Minute Market Area

FXM Associates
Hanson Economic Development Plan 59
FIGURE 39. 20-MINUTE MARKET AREA
Source: Claritas LLC 2019 (https://en.environicsanalytics.ca/Envision/About/3/2019

FXM Associates
Hanson Economic Development Plan 60
As previously noted, FXM’s proprietary Housing Demand Model incorporates data on mobility rates by age of householder, propensities to own or rent by age of householder, current and projected number of households by age and income, and the qualifying income standards of commercial rental management companies. Finally, model results for potential rental demand are compared to a sampling of market area units currently listed for rent. Finally, trends in the supply of rental units are analyzed, including numbers and average monthly rents for 1, 2, and 3 BR units. Figure 40 shows the average annual demand for all rentals by all age groups in the Hanson Market Area, taking into consideration affordability, propensity to move in any given year, and propensity to rent. FIGURE 40. AVERAGE ANNUAL DEMAND FOR RENTALS: ALL AGE GROUPS HANSON MARKET AREA,
2019-2024
Source: FXM Housing Demand Model, 2019

FXM Associates
Hanson Economic Development Plan 61
For example, of the total number of households, 1,809, expected to move to rental housing each year within the 20-minute market area and able to afford at least $900 per month rent, approximately 1,317 would be able to afford monthly rents of up to $1,800; 1,190 would be able to afford $2,100; 973 would be able to afford $2,700, and so forth. As shown in Table 10 below, based on Hanson’s current share of rental housing in the market area and recent absorption rates in comparable projects, an estimated 23 households able to afford up to $2,400 a month rent might be absorbed by additional rental development in a competitive rental property in Hanson each year. Table 10 presents these estimates for each of the rental points shown in Figure 40. (Note that the figures in the demand columns are not additive. They are cumulative, with the “Rentals @ $900” figure representing total estimated average annual demand in both Figure 40 and Table 10.) The same data are shown graphically in Figure 41.
TABLE 10. POTENTIAL ANNUAL DEMAND FOR RENTAL HOUSING IN HANSON, 2019-2024
Source: Environicsanalytics Spotlight Reports, 2019; and FXM Associates
Total Average Annual Demand in Market Area
Total Average Annual Demand in
Hanson
Potential New Rentals Capture
by Hanson Rentals @ $900 1,809 65 39 Rentals @ $1,200 1,608 58 35 Rentals @ $1,500 1,466 53 32 Rentals @ $1,800 1,317 48 29 Rentals @ $2,100 1,190 43 26 Rentals @ $2,400 1,071 39 23 Rentals @ $2,700 973 35 21 Rentals @ $3,000 849 31 18

FXM Associates
Hanson Economic Development Plan 62
FIGURE 41. AVERAGE ANNUAL DEMAND FOR RENTALS: MARKET AREA, HANSON, ESTIMATED POTENTIAL NEW RENTALS CAPTURE
Source: FXM Housing Demand Model, 2019 The actual number of units that might be captured at these rental prices in a development or redevelopment project in Hanson would depend on the quality and size of the units, site and building amenities, pricing, marketing and other factors. The information in Figure 40 and Table 10 can be further broken down into age groups, which may be useful to marketing efforts based on the relative numbers of households by age group. Figure 42 presents these data by age group.
FIGURE 42. AVERAGE ANNUAL DEMAND FOR RENTALS BY AFFORDABLE RENT AND AGE GROUP, HANSON MARKET AREA 2019-2024

FXM Associates
Hanson Economic Development Plan 63
Source: FXM Associates, Housing Demand Model, 2019 The graph reflects the greater propensity of younger households to rent and the frequency of their moving compared to older households, as well as the sensitivity of levels of demand to varying rental prices. Figure 43 offers the same kind of analysis, but with the data for rents in the upper ranges only.
FIGURE 43. AVERAGE ANNUAL DEMAND FOR SELECTED MONTHLY RENTS BY AGE GROUP HANSON MARKET AREA

FXM Associates
Hanson Economic Development Plan 64
2019-2024
Source: FXM Associates, Housing Demand Model, 2019 Figure 44 shows another dimension to the estimation of future rental demand: the changes projected over the next five years in numbers of households by age and income. The incomes chosen are in the upper ranges, since these households could afford the rents necessary to support rehabilitated or newly constructed housing.

FXM Associates
Hanson Economic Development Plan 65
FIGURE 44. CHANGE IN NUMBER OF HOUSEHOLDS BY AGE AND INCOME HANSON MARKET AREA 2019-2024
Source: FXM Associates, Housing Demand Model, 2019 Particularly striking is the projection of changes in age cohorts in the market area over the next five years: the greatest gains across all four income categories are estimated to be in the age 55 to 74 cohorts, while the age category 45 to 54, typically a population segment at peak earning capacity, would lose households in all categories of income selected above, except for those making over $120,000 per year. The age cohort 24 to 34 is projected to also have strong increases in the upper income categories. Households with incomes of over $72,000 can afford $1,800 a month rents; those with incomes over $84,000 can afford $2,100 a month rents. These households are projected to lose population in the age 45 to 54 cohort over the next five years. These projections, if they prove to be accurate, provide an indication of robust ability to afford reasonable rents, except for the 45 to 54 age group. Households in the income category over $120,000 – who could afford rents up to $3,000 per

FXM Associates
Hanson Economic Development Plan 66
month – gain population and households in all age categories, indicating a future demand for high quality rental housing for a variety of lifestyles. Some developers in recent years have targeted rental units, especially within urbanized areas, to households under age 35 and age 55 to 74, who often mix well within the same developments. Both groups show a higher propensity to live within walking distance of retail stores, restaurants, and transit if possible. The households under age 35 are more mobile on average and more likely to rent, so they comprise a relatively large share of potential demand. The number of younger households, however, is projected to experience modest growth over the next five years. Conversely, as shown by the data in Figure 44 above, the baby boom generation households are growing in number within the 55 and older age categories, and these households have shown an increasing propensity to rent in recent years as they become empty nesters and sell their single-family homes for smaller, more manageable units. Others want to cash in the equity of their former dwellings because they need liquid income in the absence of the pensions enjoyed by prior generations of retirees. Many also continue to work part time. Data in Figure 45 show the average annual demand by selected rental rates for the under 35 and 55- to 74-year old householders, and their combined demand.

FXM Associates
Hanson Economic Development Plan 67
FIGURE 45. AVERAGE ANNUAL DEMAND BY AFFORDABLE RENT 2019-2024 HOUSEHOLDERS UNDER AGE 35 AND AGES 55-74
HANSON MARKET AREA
Source: FXM Associates, Housing Demand Model, 2019
Prices and Sizes of Recently Available Rentals In order to get a sense of the sizes and prices of units actually on the market, FXM sampled listings of rental units in apartment complexes in towns approximately within the 20-minute drive time of central Hanson. The listings were gathered in April 2019. Available rental units were one- to three-bedroom units, and rents averaged around $1,600 for one-bedroom units and $1,900 for three-bedrooms. Studios and larger units were very scarce. Table 11 shows these results. Figure 43 is a frequency distribution by number of bedrooms.

FXM Associates
Hanson Economic Development Plan 68
TABLE 11. AVERAGE RENTAL LISTINGS, HANSON 20-MINUTE AREA
FIGURE 46. AVAILABLE UNITS BY NUMBER OF BEDROOMS

FXM Associates
Hanson Economic Development Plan 69
Rental Housing Supply Trends A further component of the residential market assessment is analysis of trends in the inventory, occupancy, vacancy rates, and monthly rents of multi-family rental7 properties within Hanson and the competitive supply market area (distinct from the market demand catchment area), defined by local brokers as Hanson and surrounding communities of Rockland, Hanover, Whitman, East Bridgewater, Pembroke, and Halifax. Figure 47 shows trends in the inventory and occupancy of multi-family rental housing in Hanson and surrounding communities. Within this market area overall, 182 rental units have been added since 2010 as of the 2nd quarter of 2019. Based on the ten-year historical trends, occupancy of multi-family rental units within Hanson and surrounding communities is projected to increase by 13% through 2024, an average annual increase of 26 units.
FIGURE 47. INVENTORY AND OCCUPANCY OF MULTI-FAMILY RENTAL UNITS (ALL BRS)
HANSON & SURROUNDING COMMUNITIES
7 These data are from CoStar which includes only commercial rentals and not those in homeowner-occupied properties.

FXM Associates
Hanson Economic Development Plan 70
Source: Co Star Property Information System, 2019, and FXM Associates
Figure 48 shows annual net absorption for multi-family rental units in Hanson and surrounding communities, averaging 27 units per year over the past 10 years. Each of the years positive net absorption is mostly attributable to increases in the inventory of multifamily housing – new inventory is completely absorbed within one year or less of its coming on market. The large difference between hypothetical demand for move ins within the market area (see Tables 9 and 10) and actual net absorption is a dramatic indicator of pent-up demand for rental housing, even at the higher price points likely supportable by new construction. Figure 49 shows trends in average monthly rent for all multi-family rental units in Hanson and surrounding communities reported by CoStar. Rents increased in the overall by an average of 3.8% per year between 2010 and 2019.
FIGURE 48. NET ABSORPTION OF MULTIFAMILY RENTAL UNITS
1,668
1,850
1,583
1,795
1,400
1,500
1,600
1,700
1,800
1,900
2010 2011 2012 2013 2014 2015 2016 2017 2018 2019
Multifamily Housing Inventory & Occupancies Hanson & Surrounding
Towns
Inventory Units Occupancy Units

FXM Associates
Hanson Economic Development Plan 71
Source: Co Star Property Information System,2019, and FXM Associates
FIGURE 49. AVERAGE MONTHLY RENTS (ALL BRS), HANSON & SURROUNDING COMMUNITIES
Source: Co Star Property Information System,2019, and FXM Associates
Finally, FXM has broken down trends in the supply of rental housing within Hanson and surrounding communities by number of bedrooms (Figure 50) and rents (Figure 51) by number of bedrooms. The largest increase in multifamily rental units were in 2 bedrooms (90 since 2010) and 1-bedroom units (64 since 2010). In 2019, average monthly rents are highest at $1,875 per month for 3-bedroom units
-20
-10
0
10
20
30
40
50
60
70
80
2010 2011 2012 2013 2014 2015 2016 2017 2018 2019
Net Absorption of Multifamily UnitsHanson & Surrounding Towns
$1,235
$1,652
$0
$200
$400
$600
$800
$1,000
$1,200
$1,400
$1,600
$1,800
2010 2011 2012 2013 2014 2015 2016 2017 2018 2019
Multifamily Housing Average Rent Per UnitHanson & Surrounding Towns

FXM Associates
Hanson Economic Development Plan 72
(increasing by an average 3.6% per year since 2010), while average rents for the more available 2-bedroom units are only slightly lower at $1,815 per month (increasing by an average of 4.2% per year since 2010). Data in Table 12 summarize multifamily rental units’ characteristics and trends.
TABLE 12. MULTIFAMILY RENTAL UNITS IN HANSON & SURROUNDING TOWNS
Source: Co Star Property Information System, 2019, and FXM Associates
FIGURE 50. RENTAL UNITS BY NUMBER OF BEDROOMS (BR)
Units in 2019 % of Units
Ave Unit Size (SF)
Ave Annual Increase in Units:
2010-2019
Monthly Rent in 2019
Ave Annual Increase in Rent:
2010-2019Ave Rent
per sfStudio 46 2% 368 0 $785 2.2% $2.13 1 BR 711 38% 704 7 $1,456 3.2% $2.07 2 BR 841 45% 1,007 10 $1,815 4.2% $1.80 3 BR 115 6% 1,158 3 $1,875 3.6% $1.62 ALL BRs 1,850 93% 877 20 $1,652 3.8% $1.88
Multifamily Rental Units in Hanson & Surrounding Towns

FXM Associates
Hanson Economic Development Plan 73
Source: Co Star Property Information System, 2019, and FXM Associates
FIGURE 51. AVERAGE MONTHLY RENTS BY NUMBER OF BEDROOMS
Source: Co Star Property Information System, 2019, and FXM Associates
647711
751
841
87 115
0
100
200
300
400
500
600
700
800
900
2010 2011 2012 2013 2014 2015 2016 2017 2018 2019
Multifamily Units by Number of Bedrooms Hanson & Surrounding Communities
Studio Units 1 BR Units 2 BR Units 3 BR Units
$785
$1,456
$1,815
$1,875
$0$200$400$600$800
$1,000$1,200$1,400$1,600$1,800$2,000
2010 2011 2012 2013 2014 2015 2016 2017 2018 2019
Multifamily Units by Rent and BedroomsHanson & Surrounding Communities
Studio Rent Per Unit 1 BR Rent Per Unit
2 BR Rent Per Unit 3 BR Rent Per Unit

FXM Associates
Hanson Economic Development Plan 74
Summary of the Residential Market Assessment The picture that emerges from the assessment of demand for and supply of multi-family rental housing in Hanson and the local market area is one in which expected demand – driven by household mobility as well as net new growth – dramatically exceeds the current supply which has grown very modestly over the past ten years. There have been healthy – from a prospective developer’s perspective -- increases in average rents and few vacancies. New additions to the inventory of multifamily rental units are absorbed within a year or less of coming online. Many of the rentals shown in the CoStar inventory of Hanson and surrounding towns, as well as within the broader 20-minute market catchment area, appear to be priced above thresholds needed to support rehabilitation and new construction costs for market rate (unsubsidized) housing. The demand analysis indicates that there is at least hypothetical market support for units priced higher than the average listings, based on the incomes of householders looking to move into rental housing over the next five years. This means that in order to attract such households who can support higher rents, developers will need to have products offering superior unit attributes (attractive and unusual layouts, interior finishes, storage space), on-site amenities (fitness facilities, recreation trails, meeting space, and so forth), and desirable location (best when within walking distance of stores, restaurants, waterfront and beaches, other amenities). As part of a mixed-use development within walking distance of the Hanson MBTA station, rental housing could be especially attractive to prospective developers. There are environmental and zoning issues that will need to be addressed, as discussed in Appendix A of this report.

FXM Associates
Hanson Economic Development Plan 75
FISCAL COMPARISON This section presents an analysis of where Hanson stands in terms of its existing tax policy compared to that of surrounding communities: Whitman, Rockland, Pembroke, Hanover, Halifax, and East Bridgewater. Tax rates and tax policies are competitive factors for both business and resident location decisions. Tax Rates As shown in Figure 52, Hanson’s 2019 commercial/industrial tax rate and residential tax rate are the third lowest of the seven communities. Only Whitman and Pembroke have lower rates. FIGURE 52. TAX RATES PER $1,000 VALUATION FY 2019
Source: Mass Department of Revenue, Divison of Local Services, Municpal Data Bank, 2019, and FXM Associates
$17.56
$17.47
$17.38
$14.60
$17.92
$15.38
$15.53
$16.55
$17.56
$17.47
$16.41
$14.60
$17.92
$15.38
$15.53
$16.41
$- $2.00 $4.00 $6.00 $8.00 $10.00 $12.00 $14.00 $16.00 $18.00 $20.00
East Bridgewater
Halifax
Hanover
Pembroke
Rockland
Whitman
Hanson
AVERAGE
Tax Rates per $1,000 Valuation FY 2019
Residential Personal Property Commercial/Industrial

FXM Associates
Hanson Economic Development Plan 76
Residential and Commercial Property as Percent of Total Assessed Valuation and Tax Levy As shown in chart below, 8% of the assessed value of all property in Hanson is commercial. In this measure, Hanson at approximately the same level as Halifax, with both towns having the lowest proportion of commercial/industrial/personal property assessed values. Rockland has the highest proportion of its assessed value classified as commercial.
FIGURE 53. SECTOR % OF ASSESSED VALUE FY 2019
Source: Mass Department of Revenue, Divison of Local Services, Municpal Data Bank, 2019, and FXM Associates The proportion of total tax levies that come from commercial and residential properties is the same as the proportion of assessed values.
11%
9%
15%
12%
20%
11%
8%
12%
89%
91%
84%
87%
80%
89%
92%
88%
0% 10% 20% 30% 40% 50% 60% 70% 80% 90% 100%
East Bridgewater
Halifax
Hanover
Pembroke
Rockland
Whitman
Hanson
AVERAGE
Sector % of Assessed Value FY 2019
Residential Property Commercial and Personal Property

FXM Associates
Hanson Economic Development Plan 77
Revenue by Source Figure 54 shows the proportions of total municipal revenue by source (adding to 100%). As shown in the graph, Whitman is the most reliant on property tax receipts, Pembroke the least, among the other communities shown. With 59% of its revenues from property and other taxes, Hanson ranks slightly less than the 7-community average of 61%. Hanson is second most reliant on state aid, behind East Bridgewater and Pembroke.
FIGURE 54. REVENUES BY SOURCE FY 2019
Source: Mass Department of Revenue, Divison of Local Services, Municpal Data Bank, 2019, and FXM Associates
59%
22%
14%
4%
61%
16% 16%
7%
0%
10%
20%
30%
40%
50%
60%
70%
80%
Tax Levy State Aid Local Receipts Other
Revenues by Source FY 2019
East Bridgewater Halifax
Hanover Hanson
Pembroke Rockland
Whitman AVERAGE

FXM Associates
Hanson Economic Development Plan 78
Appendix A
Regulatory and Environmental Development Constraints South Hanson Train Station
When the MBTA reactivated passenger train service on the Old Colony Line in 1997, it opened the door to the potential for reinvestment in South Hanson. The present train station, situated off Main Street, attracts some 473 weekday riders, virtually all of whom commute the full 24.1 miles to Boston’s South Station.8 While providing a potentially desirable location for new residential and mixed-use development, the area around the train station presents regulatory, infrastructure, and environmental constraints. These conditions have an impact on the South Hanson real estate market. Zoning and Land Use Hanson’s Zoning Bylaw divides the town into six traditional use districts and a “flexible zone” intended to spur development in preferred locations (Map 1). Most of the land in the vicinity of the train station is in the Commercial-Industrial zoning district, but as Route 27 transitions through South Hanson from south (Pembroke) to north (East Bridgewater), the land use pattern along the corridor generally moves from residential development with pockets of commercial uses to a mix of nonresidential and residential uses, and quite a bit of vacant land (Map 2). In general, the Route 27 land use pattern lacks coherence and contains nodes of disinvestment. The study area also has numerous nonconforming lots, i.e., lots that do not meet Hanson’s minimum dimensional requirements.9 Nonresidential Districts The Business and Commercial-Industrial Districts are intended to create employment opportunities and diversify Hanson’s tax base, but there are important differences between them. While the Business District provides for consumer goods and services, the Commercial-Industrial District promotes research laboratories, office buildings, and light industry. Together, these districts include roughly 12 percent of the town and most of the area immediately surrounding the train station. When the Flexible Zone also applies, some residential uses are allowed, too. Table 1 describes the dimensional regulations that control most of the commercial and industrial development in this part of town. 8 Massachusetts Bay Transportation Authority, Ridership and Service Statistics, 14th Ed. (2014), 4.4, 4.7-4.8. 9 The Old Colony Planning Council provided a GIS shapefile of Hanson’s zoning map. The shapefile does not include the Flexible Overlay Zone.

FXM Associates
Hanson Economic Development Plan 79
Table 1. Dimensional Regulations in the Nonresidential Districts Regulation B C-I Flex-B/Flex-C-I Minimum Lot 44,000 44,000 35,000 Min. Upland 36,000 36,000 31,500 Min. Frontage 150’ 200’ 150 Min. Yard (F/S/R) 50/15/15 50/25/25 35/20/15 Building Coverage 15% 15% 20% Total Coverage 60% 60% 75% Max. Height 40’ 40’ 40’ Note: very small projects may not have to comply with all of these requirements.
Residential Districts Approximately 88 percent of the town is residentially zoned, and 60 percent of the residentially zoned areas are subject to rules prescribing low-density single-family development. The most limiting district, the Agricultural-Recreation (A-R) district, places significant constraints on lot coverage (maximum: 10 percent) in order to protect wetlands, streams, and surface waters. Residence AA, which controls some of the parcels near the train station, is almost identical to the AR district in terms of basic lot regulations except for lot coverage (maximum: 30 percent). Table 2. Density & Dimensional Regulations, Residential Zoning in Hanson* Regulation A-R Res-AA Res-A Res-B** Flex-R Minimum Lot 40,000 40,000 30,000 30,000 35,000 Min. Upland 36,000 36,000 27,000 27,000 31,500 Min. Frontage
175’ 175 150 150 150
Min. Yard (F/S/R)
50/25/50 50/25/50 50/20/40 50/20/40 35,20/15
Building Coverage
---- ---- ---- ---- 20%
Total Coverage
10% 30% 30% 30% 75%
Max. Height 40’ 40’ 40’ 40’ 40’ *Additional requirements apply to some uses. **For multifamily dwellings, the minimum lot is 60,000 sq. ft. for four units and 5,000 sq. ft. per unit for each unit over four.

FXM Associates
Hanson Economic Development Plan 80
The AR District provides for a limited selection of land uses: single-family homes on large lots associated with an agricultural use, or by special permit, single-family homes not associated with an agricultural use and Adult Retirement Villages. The Residence A and AA districts provide for single-family homes on relatively large lots and owner-occupied homes with up to four boarders. The Zoning Board of Appeals (ZBA) has authority to grant special permits for rest homes, Adult Retirement Villages, so-called “in-law” apartments, and conversion of existing single-family homes to two-family homes. South Hanson includes about 110 acres of the Residence B district around the train station. The regulations for Residence B allow a somewhat higher density than the other residential zones as well as a broader mix of residential uses. Notably, Residence B is the only use district that provides for multi-family housing. Nevertheless, the Residence B dimensional regulations will not work for many projects because they place significant constraints on scale and density. Flexible Zoning/Special District The Flexible District functions as an overlay district by “targeting” certain uses and greater intensity of use in selected portions of the underlying Commercial-Industrial, Business, or Residential district. It is designed to accommodate a mix of residential, agricultural, business, and industrial uses, and mixed uses (more than one type use on a lot). In South Hanson, it runs along Main Street from High Street to the East Bridgewater town line. The Flexible District and Residence B are the only districts in Hanson that allow multifamily housing. Much like the Residence B district, the Flexible Overlay is located near public transportation, major roads, and commercial uses, so it makes sense to allow greater density. Unlike Residence B, the Flexible District does not put stricter dimensional standards on multi-family development. However, the entire Flexible District lies within the Aquifer and Well Protection district, which supersedes all of the underlying use districts and places more constraints on what a landowner can do in the Flexible District. Split Lots and Nonconforming Lots Hanson’s Zoning Map is based almost entirely on a metes and bounds method of drawing district boundaries. Zones such as the Business District and Commercial-Industrial District seem to follow the once-popular convention of measuring from the centerline of roadways. Sometimes a natural feature such as a perennial stream determines a district boundary, especially for the Agricultural-Recreation District. There is very little relationship between the boundaries of Hanson’s zoning districts and the boundaries of parcels. Split lots abound in Hanson. The Zoning Bylaw

FXM Associates
Hanson Economic Development Plan 81
provides a limited remedy for these situations (Section III.D), whereby uses allowed in the less restrictive district can extend into the more restrictive district, but only by 30 feet and only if lot has frontage on a street in the less residential district. Just as split lots abound in Hanson, so do nonconforming lots (Map 3). They are especially prevalent in South Hanson, where the historic development pattern is characterized by lots that pre-date zoning. Both the Zoning Act and Hanson’s Zoning Bylaw provide some options for extending or altering structures on nonconforming lots. However, the reality is that for uses and structures on small lots to evolve over time – that is, before market conditions are strong enough to facilitate parcel assembly – the use and dimensional regulations need to make sense and they need to be relatively barrier-free. It would make sense for Hanson to revisit the rules that govern land use along Route 27 and determine whether some smaller-lot zoning would help to stimulate reinvestment. Protective Regulations Hanson has a fairly typical Floodplain District and an Aquifer and Well Protection District with four sub-districts, including two with identical use regulations (Zone II and Zone IIIA). Many of the restrictions in this district relate to high-risk activities such as hazardous and solid waste storage and disposal, junk yards, auto repair, and so forth. However, the Aquifer and Well Protection District has two other provisions that can substantially limit development around the train station. First, the bylaw it imposes a cap on impervious surfaces: a maximum of 15 percent of the lot area unless the applicant provides an artificial recharge system, in which case the impervious coverage cap increases to just 30 percent. For a use like multifamily housing, the reduction really matters because in the Residence B district total coverage can be as high as 40 percent. This aspect of Hanson’s zoning mirrors state requirements for activity in Zone II of a drinking water supply, Second, the Town’s Aquifer and Well Protection District use regulations appear to prohibit wastewater treatment facilities requiring a Groundwater Discharge Permit (GDP), though a privately owned wastewater treatment facility (PWTF) may be allowed if the Board of Appeals grants a special permit for it.10 The Department of Environmental Protection (DEP) has authority to grant GDPs, and its regulations place additional requirements on wastewater facilities in a Zone II. The Town could
10 The Zoning Bylaw is unclear. At ZBL Section VI.F(3), the use regulations provide, in part: “If the Department of Environmental Protection amends 314 CMR 5.00 on the basis of the Final Generic Environmental Impact Report (FGEIR) on Privately Owned Sewage Treatment Facilities (PSTFs) privately owned sewage treatment facilities permitted in accordance with 314 CMR 5.00 as amended.” In fact, DEP’s Groundwater Discharge Permit regulations (310 CMR 5.00) do include special rules for private wastewater facilities in Zone II/Interim Wellhead Protection Areas.

FXM Associates
Hanson Economic Development Plan 82
simply leave the wastewater decision in DEP’s hands instead of adding a layer of review (and potential risk) by requiring a special permit from the Board of Appeals. Wetlands In addition to zoning, the vicinity of the Hanson train station has extensive wetlands and floodplains. Permitting for new development in this part of town will almost certainly trigger the Massachusetts Wetlands Protection Act, G.L. c.131, § 40, as suggested by the wetland extent depicted in Map 3. Due to the presence of perennial streams as well, portions of the study area also have to comply with the 200’ minimum setback requirements of the Rivers Protection Act.

FXM Associates
Hanson Economic Development Plan 83

FXM Associates
Hanson Economic Development Plan 84

FXM Associates
Hanson Economic Development Plan 85