
HANITA KADIR SHAHAR NUR ADIANA HIAU ABDULLAHrepo.uum.edu.my/16/1/Nur_Adiana_Hiau_bt_Abdullah.pdf ·...
21
DOES PRICE REACT TO FIXED PRICE TENDER OFFER SHARE BUYBACK ANNOUNCEMENT? HANITA KADIR SHAHAR NUR ADIANA HIAU ABDULLAH Faculty of Finance and Banking Universiti Utara Malaysia ABSTRACT This paper investigates stock market reactions to share buyback announcements, specifically with the fixed price tender offer mechanism. An event study methodology was used to examine stock price reaction of 30 observations involving 21 listed companies surrounding the announcement dates. Two models, namely market adjusted return (MAR) and the single index market models (SIMM) were utilised to compute abnormal returns. Eventhough most literature in the western market found positive abnormal returns, this study reveals that investors gain zero abnormal returns out of these announcements. The post announcement result shows a zero abnormal return which implies that the Malaysian stock market is semi-strongly efficient due to this announcement. Finally, evidence also shows that none of the implications forwarded in the theories could be supported in this study. ABSTRAK Artikel ini mengkaji reaksi pasaran saham terhadap pengumuman pembelian balik saham secara spesifiknya menggunakan mekanisma tawaran tender harga tetap. Metodologi kajian peristiwa digunakan untuk meneliti reaksi harga ke atas 30 pemerhatian yang melibatkan 21 syarikat pada sekitar tarikh pengumuman. Dua kaedah iaitu pulangan terlaras pasaran (MAR) dan model pasaran indeks tunggal (SIMM) digunakan untuk mengira pulangan luar biasa. Walaupun kebanyakan literatur di pasaran barat menemui pulangan luar biasa yang positif, kajian ini mendapati pelabur-pelabur memperoleh pulangan luar biasa sifar daripada pengumuman ini. Keputusan selepas pengumuman mendapati pulangan luar biasa sifar memberi gambaran bahawa pasaran saham Malaysia adalah efisien separa kuat. Akhir sekali, bukti menunjukkan bahawa tiada satu pun implikasi yang diketengahkan oleh teori dapat disokong dalam kajian ini. IJMS 14 (1), 39-59 (2007)
Transcript of HANITA KADIR SHAHAR NUR ADIANA HIAU ABDULLAHrepo.uum.edu.my/16/1/Nur_Adiana_Hiau_bt_Abdullah.pdf ·...

IJMS 14 (1), 39-59 (2006) 39
DOES PRICE REACT TO FIXED PRICE TENDEROFFER SHARE BUYBACK ANNOUNCEMENT?
HANITA KADIR SHAHARNUR ADIANA HIAU ABDULLAH
Faculty of Finance and BankingUniversiti Utara Malaysia
ABSTRACT
This paper investigates stock market reactions to share buybackannouncements, specifically with the fixed price tender offer mechanism. Anevent study methodology was used to examine stock price reaction of 30observations involving 21 listed companies surrounding the announcementdates. Two models, namely market adjusted return (MAR) and the singleindex market models (SIMM) were utilised to compute abnormal returns.Eventhough most literature in the western market found positive abnormalreturns, this study reveals that investors gain zero abnormal returns out ofthese announcements. The post announcement result shows a zero abnormalreturn which implies that the Malaysian stock market is semi-strongly efficientdue to this announcement. Finally, evidence also shows that none of theimplications forwarded in the theories could be supported in this study.
ABSTRAK
Artikel ini mengkaji reaksi pasaran saham terhadap pengumuman pembelianbalik saham secara spesifiknya menggunakan mekanisma tawaran tender hargatetap. Metodologi kajian peristiwa digunakan untuk meneliti reaksi harga keatas 30 pemerhatian yang melibatkan 21 syarikat pada sekitar tarikhpengumuman. Dua kaedah iaitu pulangan terlaras pasaran (MAR) dan modelpasaran indeks tunggal (SIMM) digunakan untuk mengira pulangan luarbiasa. Walaupun kebanyakan literatur di pasaran barat menemui pulanganluar biasa yang positif, kajian ini mendapati pelabur-pelabur memperolehpulangan luar biasa sifar daripada pengumuman ini. Keputusan selepaspengumuman mendapati pulangan luar biasa sifar memberi gambaran bahawapasaran saham Malaysia adalah efisien separa kuat. Akhir sekali, buktimenunjukkan bahawa tiada satu pun implikasi yang diketengahkan oleh teoridapat disokong dalam kajian ini.
IJMS 14 (1), 39-59 (2007)w
ww
.ijm
s.uu
m.e
du.m
y

40 IJMS 14 (1), 39-59 (2006)
INTRODUCTION
Share buyback is an activity to reacquire a company’s previously issuedshares. In a common stocks buyback, the repurchasing companiesdistribute cash of its shareholders and in exchange acquire a fractionof its outstanding equity. In general, a cash buyback changes thecomposition of assets held by listed companies, revises the ownershipproportion of each of its shareholders and distributes cash by meansof a transaction that is taxed differently than an equivalent amountdistributed as dividends. A repurchase can also signal informationabout the company’s value to investors. An examination of a sharebuyback provides evidence that it has potential implications on severalmajor issues in corporate finance including the differences in taxationof a firm’s cash distribution on the valuation of share. In addition, theevidence also includes the effect of altering a firm’s investment and/or financing decision æ the means by which new information isdisseminated to investors and the conflict of interest between acompany’s shareholders and the owners of other securities may arise.Fixed price tender offer of share buyback announcement is selected tocheck whether the market reacts positively to this type ofannouncement in Malaysia. In this mechanism, announcing companieswill specify a single purchase price, numbers of shares sought, and anexpiration date. A market adjusted return and single index marketmodels are adopted to examine market reactions. The effect wouldthen enable us to check the efficiency of the Malaysian stock market.
The justification of the share buyback program have been extensivelyresearched in the US and other developed markets. The most commonreason stated in these studies is that share buyback is associated withstock undervaluation (Vermaelen, 1981). In Malaysia however, due tothe relative newness, we are only aware of two studies by Lim andObiyathullah (2002) and another study by Mohd and Chin (2001) whoused the sample of companies which had announced and executedthe stock buyback program through open market repurchase. By usingthis mechanism, the repurchasing is done through Bursa Malaysia. Ourstudy however, concentrated on a fixed price tender offer mechanism.The reason why fixed price was chosen over other mechanisms ismotivated by the research findings by Nohel and Tarhan (1998) whorevealed that tender offer repurchase provides a better signal ofundervaluation of stock prices by the management as compared to anopen market share buyback. Unlike an open market repurchase, whichcarries uncertainties with respect to the magnitude and timing2, tenderoffer commits itself to the distribution of cash over a short time span.Another tender offer of share buyback is known as the Dutch auctionw
ww
.ijm
s.uu
m.e
du.m
y

IJMS 14 (1), 39-59 (2006) 41
tender offer. This mechanism specifies a range of prices within whichthe tendering shareholders can choose a minimum acceptable sellingprice. Each shareholder informs the offering companies of the shareshe or she is willing to sell and his or her minimum acceptable pricewhich is within the price range offered. This type of tender offer isalso not selected in the sample of this study due to the argument madeby Person (1990), who found that the signal in fixed price tender offeris stronger than the signal coming from a Dutch auction. In Malaysia,however, no Dutch auction tender offers were implemented duringthe sample period. Thus, our sample, focused on share repurchasingcompanies which had announced and executed the sales their shareswithin a day at a fixed price.
By examining the market reaction, this study would be able toinvestigate the efficiency of the Malaysian stock market. Specifically,two research questions were formulated by using the market adjustedreturn model (MAR) and the single index market model (SIMM): (1)“does the period of observation around the fixed priced trading sharerepurchase announcement indicate differences in abnormal returns?”and (2) “does the fixed price tender offer share buyback announcementagrees with the semi-strong efficiency form of the Malaysian stockmarket?”
THEORETICAL BACKGROUND AND EMPIRICAL EVIDENCE
Several theories have been discussed to explain market reactions toshare buyback announcements. In the US, most studies documenteda positive price reaction. Even Though several explanations have beenput forth in the literature, only two hypotheses appear to be the mostcommonly cited. The relevant hypotheses are classified intoinformation signaling and free cash flow.
Information signaling argues that a company’s willingness to pay apremium to purchase its own shares sends a strong signal to lessinformed outside investors that the company’s future prospects areimproving. It states that the management undertakes repurchases tosignal undervaluation of share prices. This hypothesis relies on theassumption that managers have better information on their companiesand they distribute cash through buyback when they are optimisticabout the prospects of the companies. Consequently, investors associatethis as good news for investors. It argues that managers would normallybuy back their own shares when they consider their company’s stockas an attractive investment. Several studies have confirmed thisw
ww
.ijm
s.uu
m.e
du.m
y
42 IJMS 14 (1), 39-59 (2006)
proposition such as those by Dann (1981), Vermaelen (1981) andComment and Jerell (1991) who generally found that share buyback isassociated with significantly positive abnormal returns. Normally,share buyback is preceded by poor performance (Comment & Jarell,1991) and followed by good earnings and stock price performance(Vermaelen, 1981).
Another hypothesis that could explain the increase in a company’svalue after repurchase announcement is the free cash flow hypothesis.Free cash flow is the remaining cash flow after all positive net presentvalue (NPV) projects which are undertaken. The free cash flowhypothesis argues that companies with excess cash and poorinvestment opportunities will face sizable agency cost if the excessmoney is not distributed to shareholders. Barring such distribution,managers have incentives to invest the excess cash in wasteful ornegative NPV projects. Share buyback allows companies to distributeits excess free cash flow, thereby eliminating the incentive for wastefulinvestment. The implication then is share buyback would have apositive effect on shares of companies that have excess cash flow.
In this hypothesis, Jensen (1986) found that if companies sufferdecreased market value from principal-agent problems, then arepurchase could increase the value. He predicted that stock priceswould increase if there is an unexpected stock repurchaseannouncement, which would reduce the companies’ free cash flow.On the contrary, stock price will decrease if an unexpected increase indemand for funds is announced by companies experiencing positivefree cash flow. This hypothesis is in line with the finding reported byStephen and Weisback (1998) in the late 90s. In their research, theyfound that US companies that had announced stock repurchases weremore likely to buy back shares if they had high free cash flows andvice versa.
Several empirical studies had been out, carried especially in thedeveloped markets to determine the stock market reaction to sharebuyback announcements. These studies were done in different settingsand most of them concluded that the announcement gave a positiveexcess return to the shareholders.
Market reaction can be observed in a study that compares stocks thathave dividends with those that have tender offer stock repurchase.Chhachhi and Davidson (1997), in their sample of US corporationsbetween January 1978 and September 1989, found that there was adifference between the two. The findings revealed that even afterw
ww
.ijm
s.uu
m.e
du.m
y

IJMS 14 (1), 39-59 (2006) 43
controlling for transaction size and frequency, the stock market reactedmore positively to tender offer share repurchases than the speciallydesignated dividends. They argued that this was because sharebuyback has lower capital gain tax rates and thus, make it morevaluable than the specially designated dividend.
A study was done to examine the differences of two types ofmechanisms which are fixed price tender offer and Dutch auctiontender offer. An average positive excess return of 11% in the fixed priceas compared to only 8% of excess return in the Dutch auction wasfound in the work by Comment and Jarrell (1991). The finding wasthat Dutch auction elicits lower positive stock returns than fixed pricetender offer. They concluded that the results were consistent with thesignaling hypothesis that Dutch auction is less effective as stock undervaluation signals as compared to fixed price.
Another examination of market reaction was carried out to see theextent to which the announcement of share buyback programmeaffected the valuation of competing companies in the same industry(Erwin & Miller, 1998). On average, although companies announcingopen market share buyback experience a significantly positive stockprice reaction during the announcement, a negative stock price reactionis experienced by the portfolio of rival firms in the same industry. Thissuggests that perceived changes in competitive positions ofrepurchasing occur at the expense of rival firms and dominates anysignals of favourable industry condition.
In the Malaysian context, there are two recent studies done inexamining market reactions on share buyback announcement. A studyby Lim and Obiyathulla (2002) examined listed companies that,announced repurchases over four years. Of the 131 observations ofMain Board and Second Board companies, 43 companies followedthrough with the stock buyback and the other 88 companies onlyannounced the program but they did not execute the buyback. Theresults showed that in the case of Main board companies, theannouncement appears to have been more important than actualrepurchase. For example for the t=0 to t+2 (0,+2) and t=0 to t+60 (0,+60)windows, the CAAR for the companies which only announce is 2.97%and 14.31%, whereas companies with actual repurchase is 2.29%, and9.03%. Respectively on the other hand, for the second board, therepurchase action has a much greater impact than just theannouncement. The 15, 30 and 60 day post event windows all havesignificantly higher price reactions (42.31%) when compared to thesituation on when only an announcement is made, which is 31.33%.w
ww
.ijm
s.uu
m.e
du.m
y

44 IJMS 14 (1), 39-59 (2006)
Another study by Mohd and Chin (2001) used the signaling argumentin explaining the Malaysian stock price reactions. They examined 34listed companies in the main board to avoid small firm bias in theirstudy. This is because they claimed that most of the companies on thesecond board have smaller market capitalisation. Their result shows apositive market response shortly after the repurchase announcement(CAAR of 1.53% one day after the announcement). They segregatedthe sample into companies that only announced and those that followedthrough the repurchase programme. Companies that did not followthrough with the repurchase programme would see its CAAR diminishsoon after the announcement. After the CAAR gain of 1.23% wasrecorded, it suddenly dropped to a negative value. Its magnitude wasalso smaller than the announcing companies that actually followedthrough with the repurchase programme. The CAAR continued torise until the fourth day after the announcement, and diminished onday seven to day eight before it started to pick up again after day nine.However, the gains made one day after the announcement weretemporary and relatively small. On the other hand, companies thatfollowed through with the repurchase programme earned larger andpositive CAAR after the announcement. The CAAR measured for theevent windows of t=-2 to +2 (-2,2), t=0 to+1(0,1), and t=0 to t+2 (0,2)periods were 6.48%, 3.75%, and 4.65% respectively and thecorresponding t-statistics for all of these event windows werestatistically significant. This implies that the stock market reacts onlyto companies that they believe will follow through with the repurchaseprogramme.
METHOD
A total population of 568 share buyback announcements through thefixed price trading mechanism were made over the period January1999 to July 2002. This population was identified from the sharebuyback catalogue published by Bursa Malaysia and the reconfirmationof the exact date of announcements were done by referring to the BursaMalaysia website and the Bursa Malaysia Daily Diary to ensure a cleanannouncement was used. The total population of 568 was then reducedwhen several criteria were used to ensure robustness, such as: (1)volume bought back of RM 50,000 and more and (2) cleanannouncement for day t=-1 to day t=+1. In order to avoid the multipleannouncements effect, only the first announcement was selected fromthe companies that announced more than one fixed price tender offershare buyback. This had reduced the sample to 33 observations.However, three observations had been removed from the list due tothe fact that the announcements were made by financial or bankinginstitutions.w
ww
.ijm
s.uu
m.e
du.m
y

IJMS 14 (1), 39-59 (2006) 45
The sample was selected from seven Bursa Malaysia sectorclassifications, which are plantations, consumer products, industrialproducts, trading/services, technologies, constructions, andinfrastructure projects. The largest observations came from industrialproducts and trading/services with 23.4% for each sector. This wasfollowed by consumer products that comprised 16.7% of the totalobservations.
Most of the observations were listed on the Main Board of the BursaMalaysia except for two counters that were listed on the Second Board.This would mean that 93.3 % of the sample was selected from the MainBoard and 6.6% from the Second Board. The two observations listedon the Second Board have smaller market capitalisation as comparedto the rest of the observations.
An analysis of market capitalisation is shown in Table 1. During theperiod of 1999 to 2002, the sample exhibited an average company sizeof RM1,632,757,517.30. This figure was then used to segregate theobservation samples into two groups, where one group includedobservations having a market capitalisation lower than average (asindicated by an asterisk) and the other group consisted of observationsthat were having above average market capitalisation. It was foundthat 19 observations form the first group, while 11 observations belongto the second group. In other words, 63.3% of the samples were stockswith below average size and 36.6% were those classified as havingabove average size. The smallest market capitalisation security is HunzaConsolidation, which happened to be a Second Board company (RM57,165,360), while the largest market capitalisation was owned byBerjaya Sports Toto (RM 3,737,375,342).
Table 1List of Observations with Their Respective Market Capitalisation
No. Name of companies Date Marketof obs. announced Capitalisation (RM)
1 KLKepong 14/1/02 3,776,335,478.002 Asia File Corporation 14/1/02 * 220,044,660.003 Choo Bee Metal 25/8/99 * 99,437,000.004 Hunza Consolidation 21/9/99 * 57,165,360.005 Mulpha International 7/8/01 * 488,044,350.006 DNP Holdings 11/9/01 * 236,000,349.007 AIC Corp Berhad 11/7/01 * 307,207,557.008 Paragon’ Union 11/4/01 * 69,650,000.009 Oriental Holdings 29/9/00 1,677,434,573.00
10 Hong Leong Industries 27/9/00 1,998,373,960.00ww
w.ij
ms.
uum
.edu
.my

46 IJMS 14 (1), 39-59 (2006)
(continued)
11 YTL Power 13/9/00 7,232,182,515.0012 31/7/01 6,431,151,890.0013 Jaya Tiasa Holding 11/7/00 1,963,573,068.0014 31/1/02 *590,484,563.0015 Berjaya Sports Toto 27/1/00 3,737,375,342.0016 25/3/02 2,936,367,106.0017 IOI corporation 9/10/01 2,162,110,876.0018 IOI Properties 1/3/00 *551,409,092.0019 Nanyang Press Holding 3/5/02 * 331,317,378.0020 10/4/01 * 305,960,350.0021 OYL Industries 3/11/99 * 1,285,231,678.0022 2/5/01 1,705,222,827.0023 Hume Industries 2/10/00 * 297,338,196.0024 30/9/99 * 255,215,285.0025 Chemical Co Of
Malaysia Bhd 4/7/01 * 701,845,397.0026 3/8/99 * 445,323,455.0027 Malaysian Pacific Industry 22/6/99 * 1,089,996,024.0028 11/8/00 5,135,558,190.0029 Hap Seng Consoli. 14/4/99 * 1,432,118,000.0030 3/4/01 * 1,463,251,000.00
* Market capitalisation lower than average (RM1,632,757,577.30)
Estimation of abnormal returns
This study focuses on a standard event study methodology thatinvolves the estimation of abnormal returns surrounding the eventdate. Two benchmarks were used to examine the effect of sharebuyback announcement. They are the market adjusted return (MAR)and the single index market model (SIMM).
Market adjusted return (MAR)
MAR is a simpler method where it assumes that a model of equilibriumexpected returns exists where alpha (a) is equal to zero and the averagesystematic risk is equal to one. This implies that there is no estimationof systematic risk or a is required. This model had been regularly usedby previous researchers, namely Dennis and McConell (1986) and Nur-Adiana (1999). The computation of the MAR is based on the followingprocedures:
The return of a company’s share for a particular time t, is derived bytaking the difference of the share price from day t and t-1 as in thefollowing formula:w
ww
.ijm
s.uu
m.e
du.m
y

IJMS 14 (1), 39-59 (2006) 47
(1)
where Ri,t is the daily stock return, Pi,t is the stock price at day t, andPi,t-1 is the stock price at day t-1. The stock returns are calculated fromday –60 to day +60. Similarly, the market return is calculated in thesame manner.
(2)
where R m,t is the market return on day t, Cit is the Bursa Malaysiacomposite index on day t and Cit – 1 is the composite index on day t-1.
After obtaining the paired values for the stock return and market returnfor each event day, the daily abnormal return for each day t is calculatedas:
ARi,t= Ri,t -Rm,t (3)
The next step is to compute the daily cross sectional average abnormalreturns (AARt) for a specific day, t. This is done by summing all thedaily abnormal returns for the event day t and dividing the figurewith the number of observations.
AARt= ∑ ARi, t /Nt, (4)
where Nt is the number of observations on event day t
The next step, is to sum the cross sectional average of abnormal returns.
CAAR t = ∑ AARt (5)
where T is the number of event days prior to day t
To test the null hypothesis that the daily average abnormal returns onevent day t are equal to zero, a t-statistic is calculated. This test willdetermine whether the individual stock returns are statistically differentfrom zero given their distribution about the average. The test is also toindicate whether there is a significant change in stock prices due to theshare buyback announcement. The t-test for AAR is shown in theequation:
Ri,t = Pi,t-1
Pi,t - Pi,t-1
Rm,t = Ci,t-1
Ci,t - Ci,t-1
i = 1
N
t
k = t-T
ww
w.ij
ms.
uum
.edu
.my
48 IJMS 14 (1), 39-59 (2006)
where where i=1,2,3…N, (6)
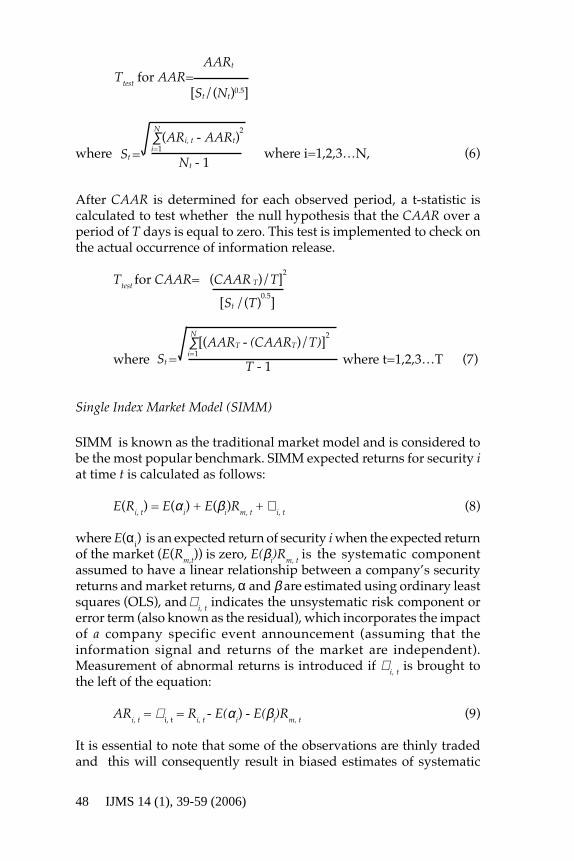
After CAAR is determined for each observed period, a t-statistic iscalculated to test whether the null hypothesis that the CAAR over aperiod of T days is equal to zero. This test is implemented to check onthe actual occurrence of information release.
Ttest for CAAR=
where where t=1,2,3…T (7)
Single Index Market Model (SIMM)
SIMM is known as the traditional market model and is considered tobe the most popular benchmark. SIMM expected returns for security iat time t is calculated as follows:
E(Ri, t) = E(α i) + E(βi)Rm, t + ∈ i, t (8)
where E(αi) is an expected return of security i when the expected returnof the market (E(Rm,t)) is zero, E(βi)Rm, t is the systematic componentassumed to have a linear relationship between a company’s securityreturns and market returns, α and β are estimated using ordinary leastsquares (OLS), and ∈ i, t indicates the unsystematic risk component orerror term (also known as the residual), which incorporates the impactof a company specific event announcement (assuming that theinformation signal and returns of the market are independent).Measurement of abnormal returns is introduced if ∈ i, t is brought tothe left of the equation:
ARi, t = ∈ i, t = Ri, t - E(αi) - E(βi)Rm, t (9)
It is essential to note that some of the observations are thinly tradedand this will consequently result in biased estimates of systematic
Ttest for AAR=
[St/(Nt)0.5]
AARt
St =∑(ARi, t
- AARt)2N
i=1
Nt - 1
(CAAR T)/T]2
[St /(T)0.5
]
St =∑[(AART
- (CAART)/T)]2N
i=1
T - 1
ww
w.ij
ms.
uum
.edu
.my
IJMS 14 (1), 39-59 (2006) 49
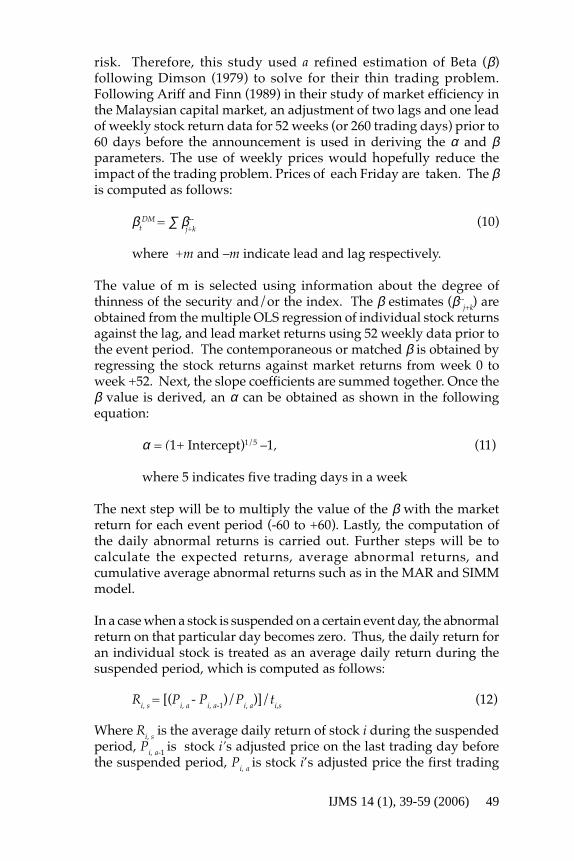
risk. Therefore, this study used a refined estimation of Beta (β)following Dimson (1979) to solve for their thin trading problem.Following Ariff and Finn (1989) in their study of market efficiency inthe Malaysian capital market, an adjustment of two lags and one leadof weekly stock return data for 52 weeks (or 260 trading days) prior to60 days before the announcement is used in deriving the α and βparameters. The use of weekly prices would hopefully reduce theimpact of the trading problem. Prices of each Friday are taken. The βis computed as follows:
βtDM = ∑ β-- (10)
where +m and –m indicate lead and lag respectively.
The value of m is selected using information about the degree ofthinness of the security and/or the index. The β estimates (β-- ) areobtained from the multiple OLS regression of individual stock returnsagainst the lag, and lead market returns using 52 weekly data prior tothe event period. The contemporaneous or matched β is obtained byregressing the stock returns against market returns from week 0 toweek +52. Next, the slope coefficients are summed together. Once theβ value is derived, an α can be obtained as shown in the followingequation:
α = (1+ Intercept)1/5 –1, (11)
where 5 indicates five trading days in a week
The next step will be to multiply the value of the β with the marketreturn for each event period (-60 to +60). Lastly, the computation ofthe daily abnormal returns is carried out. Further steps will be tocalculate the expected returns, average abnormal returns, andcumulative average abnormal returns such as in the MAR and SIMMmodel.
In a case when a stock is suspended on a certain event day, the abnormalreturn on that particular day becomes zero. Thus, the daily return foran individual stock is treated as an average daily return during thesuspended period, which is computed as follows:
Ri, s = [(Pi, a - Pi, a-1)/Pi, a)]/ti,s (12)
Where Ri, s is the average daily return of stock i during the suspendedperiod, Pi, a-1 is stock i’s adjusted price on the last trading day beforethe suspended period, Pi, a is stock i’s adjusted price the first trading
j+k
j+k
ww
w.ij
ms.
uum
.edu
.my
50 IJMS 14 (1), 39-59 (2006)
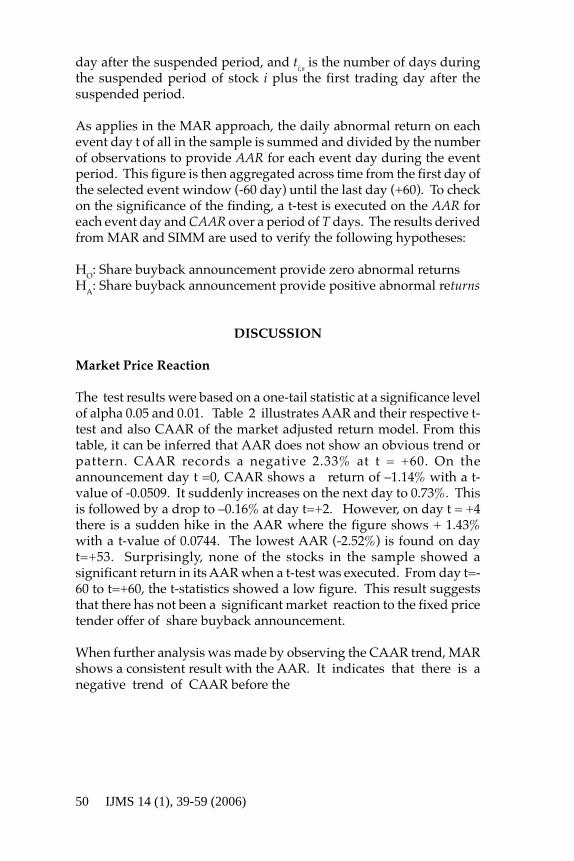
day after the suspended period, and ti,s is the number of days duringthe suspended period of stock i plus the first trading day after thesuspended period.
As applies in the MAR approach, the daily abnormal return on eachevent day t of all in the sample is summed and divided by the numberof observations to provide AAR for each event day during the eventperiod. This figure is then aggregated across time from the first day ofthe selected event window (-60 day) until the last day (+60). To checkon the significance of the finding, a t-test is executed on the AAR foreach event day and CAAR over a period of T days. The results derivedfrom MAR and SIMM are used to verify the following hypotheses:
HO: Share buyback announcement provide zero abnormal returnsHA: Share buyback announcement provide positive abnormal returns
DISCUSSION
Market Price Reaction
The test results were based on a one-tail statistic at a significance levelof alpha 0.05 and 0.01. Table 2 illustrates AAR and their respective t-test and also CAAR of the market adjusted return model. From thistable, it can be inferred that AAR does not show an obvious trend orpattern. CAAR records a negative 2.33% at t = +60. On theannouncement day t =0, CAAR shows a return of –1.14% with a t-value of -0.0509. It suddenly increases on the next day to 0.73%. Thisis followed by a drop to –0.16% at day t=+2. However, on day t = +4there is a sudden hike in the AAR where the figure shows + 1.43%with a t-value of 0.0744. The lowest AAR (-2.52%) is found on dayt=+53. Surprisingly, none of the stocks in the sample showed asignificant return in its AAR when a t-test was executed. From day t=-60 to t=+60, the t-statistics showed a low figure. This result suggeststhat there has not been a significant market reaction to the fixed pricetender offer of share buyback announcement.
When further analysis was made by observing the CAAR trend, MARshows a consistent result with the AAR. It indicates that there is anegative trend of CAAR before the
ww
w.ij
ms.
uum
.edu
.my

IJMS 14 (1), 39-59 (2006) 51
Table 2Daily Average Abnormal Returns surrounding share buyback
announcement for 30 observations (1999-2002)using MAR approach.
Suspended period are treated as having zero abnormal return
Day AAR AARt- CAAR Day AAR AARt- CAARtest test
-60 0.0039 0.0349 0.0039 0 -0.0114 -0.0509 -0.0169-59 0.0051 0.0322 0.0089 1 0.0073 0.0469 -0.0095-58 -0.0023 -0.0149 0.0066 2 -0.0016 -0.0100 -0.0111-57 0.0011 0.0064 0.0077 3 0.0109 0.0565 -0.0002-56 0.0077 0.0518 0.0154 4 0.0143 0.0744 0.0141-55 -0.0044 -0.0247 0.0110 5 -0.0051 -0.0309 0.0090-54 -0.0064 -0.0415 0.0046 6 -0.0060 -0.0336 0.0030-53 0.0068 0.0433 0.0114 7 -0.0027 -0.0187 0.0003-52 -0.0024 -0.0200 0.0090 8 -0.0048 -0.0230 -0.0045-51 0.0048 0.0328 0.0138 9 0.0013 0.0088 -0.0032-50 0.0071 0.0415 0.0210 10 -0.0047 -0.0258 -0.0079-49 -0.0049 -0.0207 0.0161 11 0.0003 0.0026 -0.0076-48 0.0014 0.0070 0.0175 12 0.0027 0.0219 -0.0049-47 -0.0095 -0.0428 0.0080 13 -0.0070 -0.0370 -0.0119-46 0.0006 0.0035 0.0086 14 -0.0010 -0.0067 -0.0129-45 -0.0056 -0.0333 0.0030 15 -0.0046 -0.0337 -0.0175-44 0.0036 0.0254 0.0066 16 0.0082 0.0551 -0.0093-43 -0.0056 -0.0637 0.0009 17 -0.0020 -0.0182 -0.0114-42 0.0092 0.0506 0.0101 18 0.0003 0.0026 -0.0110-41 0.0015 0.0103 0.0115 19 -0.0083 -0.0585 -0.0193-40 -0.0012 -0.0093 0.0104 20 0.0072 0.0414 -0.0121-39 0.0014 0.0090 0.0118 21 -0.0087 -0.0611 -0.0208-38 -0.0017 -0.0098 0.0101 22 0.0006 0.0047 -0.0201-37 -0.0091 -0.0591 0.0010 23 -0.0003 -0.0033 -0.0205-36 -0.0042 -0.0191 -0.0032 24 -0.0001 -0.0006 -0.0205-35 0.0036 0.0188 0.0003 25 0.0064 0.0405 -0.0142-34 -0.0025 -0.0146 -0.0022 26 -0.0054 -0.0439 -0.0195-33 -0.0006 -0.0060 -0.0028 27 -0.0034 -0.0231 -0.0230-32 0.0054 0.0411 0.0026 28 0.0018 0.0158 -0.0212-31 0.0000 -0.0003 0.0026 29 -0.0028 -0.0155 -0.0240-30 -0.0054 -0.0414 -0.0028 30 0.0020 0.0116 -0.0220-29 0.0073 0.0527 0.0045 31 0.0015 0.0089 -0.0205-28 -0.0066 -0.0508 -0.0021 32 0.0016 0.0081 -0.0189-27 0.0010 0.0074 -0.0011 33 -0.0002 -0.0015 -0.0191-26 -0.0037 -0.0235 -0.0047 34 0.0007 0.0047 -0.0185-25 0.0009 0.0063 -0.0039 35 -0.0096 -0.0360 -0.0281-24 -0.0031 -0.0197 -0.0069 36 0.0124 0.0483 -0.0157-23 0.0041 0.0299 -0.0029 37 -0.0090 -0.0419 -0.0247-22 -0.0121 -0.0910 -0.0150 38 0.0006 0.0052 -0.0241-21 0.0048 0.0349 -0.0102 39 0.0070 0.0528 -0.0171w
ww
.ijm
s.uu
m.e
du.m
y

52 IJMS 14 (1), 39-59 (2006)
announcement day. The CAAR at day t=-60 begins with a positivevalue of 0.39% until it reaches -0.322% at day -36. A negative trend ofCAAR continues on until day t=+60. In between those days, the CAARprovides a positive figure as at day t=-7, -6,-5, and +4 to +7. Figure 1plots the CAAR for the sample companies that enabled the examinationof the stock price movement of the repurchasing companies’ stock overthe entire event period (-60 to +60).
From this figure, it is observed that there is a downward trend beforethe share buyback announcement. After the announcement, CAARbegins to increase slowly before it reaches its peak at 1.41% on thefourth day. However, it declines soon after that. A sharp decline canbe observed at day t=+53 with a CAAR of -4.29%. When a t-statistic isrun to check on the cumulative average abnormal return (CAAR)surrounding the fixed price share buyback announcement in differentevent windows, the results are not statistically significant (refer to Table3).
(continued)
-20 0.0035 0.0231 -0.0067 40 0.0015 0.0115 -0.0156-19 -0.0002 -0.0018 -0.0070 41 -0.0010 -0.0070 -0.0166-18 0.0001 0.0004 -0.0069 42 -0.0031 -0.0150 -0.0197-17 -0.0037 -0.0230 -0.0106 43 0.0022 0.0174 -0.0175-16 -0.0017 -0.0122 -0.0122 44 -0.0095 -0.0726 -0.0270-15 0.0041 0.0329 -0.0081 45 0.0077 0.0499 -0.0193-14 0.0013 0.0075 -0.0068 46 -0.0041 -0.0331 -0.0234-13 0.0011 0.0098 -0.0057 47 0.0004 0.0041 -0.0230-12 -0.0064 -0.0406 -0.0121 48 0.0045 0.0298 -0.0185-11 -0.0063 -0.0302 -0.0184 49 0.0049 0.0442 -0.0136-10 0.0053 0.0355 -0.0131 50 -0.0031 -0.0161 -0.0167-9 0.0024 0.0156 -0.0106 51 -0.0041 -0.0244 -0.0208-8 0.0093 0.0855 -0.0014 52 0.0031 0.0224 -0.0177-7 0.0026 0.0179 0.0012 53 -0.0252 -0.0523 -0.0429-6 0.0011 0.0087 0.0023 54 0.0124 0.0563 -0.0304-5 -0.0002 -0.0015 0.0020 55 0.0028 0.0155 -0.0276-4 -0.0065 -0.0474 -0.0044 56 -0.0019 -0.0145 -0.0295-3 -0.0027 -0.0153 -0.0071 57 -0.0041 -0.0303 -0.0337-2 -0.0006 -0.0038 -0.0077 58 0.0083 0.0381 -0.0253
ww
w.ij
ms.
uum
.edu
.my

IJMS 14 (1), 39-59 (2006) 53
Table 3CAAR in Different Event Windows Employed in MAR
INTERVAL CAAR T-TEST
Days t=-60 to -1 -0.5508% -0.025Days t= -60 to+60 -2.329% -0.367Days t= -40 to+40 -2.7123% -0.567Days t= -1 to 30 -0.9149% -0.489Days t= 0 to +1 -0.4020% -0.215Days t= 0 to +30 -1.6458% -0.498Days t = 0 to +60 -1.7783% -0.383Days t= + 1 to +53 -2.5987% -0.548Days t=+4 to +60 -4.265% -0.589
Table 4 shows the SIMM daily average abnormal return (AAR) andcumulative average abnormal returns (CAAR) as well as their
respective t-tests. Similar to the MAR model, there exists a mixtureof positive and negative average abnormal returns throughout theevent window. No specific patterns could be identified before the
announcement. Overall, the AAR records the lowest percentage of –2.6% at day t=+53 to the highest percentage of 1.685% at day t=+4.
CAAR
Figure 1CAAR for Market Adjusted Model (MAR) and
Single Index Market Model (SIMM)
ww
w.ij
ms.
uum
.edu
.my

54 IJMS 14 (1), 39-59 (2006)
Table 4Daily Average Abnormal Returns surrounding share buyback
announcement for 30 observations (1999- 2002) using SIMM andDimson’s adjustment of thintrading
Day AAR AARt- CAAR Day AAR AARt- CAARtest test
-60 0.0012 0.0089 0.0012 0 -0.0093 -0.0499 0.0102-59 0.0074 0.0441 0.0085 1 0.0078 0.0570 0.0180-58 -0.0022 -0.0144 0.0063 2 -0.0026 -0.0158 0.0154-57 0.0020 0.0106 0.0082 3 0.0137 0.0699 0.0292-56 0.0054 0.0362 0.0136 4 0.0168 0.0599 0.0460-55 -0.0040 -0.0213 0.0096 5 -0.0067 -0.0284 0.0394-54 -0.0058 -0.0406 0.0038 6 -0.0062 -0.0309 0.0332-53 0.0068 0.0402 0.0106 7 -0.0068 -0.0428 0.0264-52 -0.0018 -0.0152 0.0088 8 -0.0069 -0.0243 0.0195-51 0.0051 0.0291 0.0139 9 0.0045 0.0144 0.0240-50 0.0047 0.0283 0.0186 10 -0.0065 -0.0274 0.0175-49 -0.0044 -0.0191 0.0142 11 -0.0019 -0.0122 0.0157-48 0.0018 0.0083 0.0159 12 0.0055 0.0365 0.0211-47 -0.0143 -0.0655 0.0016 13 -0.0088 -0.0429 0.0124-46 -0.0008 -0.0049 0.0008 14 -0.0020 -0.0123 0.0103-45 -0.0043 -0.0244 -0.0035 15 -0.0032 -0.0194 0.0071-44 0.0034 0.0232 -0.0001 16 0.0093 0.0611 0.0165-43 -0.0072 -0.0820 -0.0073 17 -0.0031 -0.0248 0.0134-42 0.0110 0.0539 0.0036 18 0.0022 0.0179 0.0156-41 0.0015 0.0103 0.0051 19 -0.0059 -0.0385 0.0098-40 -0.0020 -0.0141 0.0031 20 0.0052 0.0269 0.0150-39 0.0004 0.0026 0.0035 21 -0.0060 -0.0424 0.0090-38 -0.0013 -0.0072 0.0022 22 0.0008 0.0061 0.0097-37 -0.0120 -0.0735 -0.0097 23 0.0007 0.0062 0.0105-36 -0.0006 -0.0026 -0.0103 24 0.0040 0.0369 0.0145-35 0.0026 0.0135 -0.0077 25 0.0033 0.0204 0.0178-34 -0.0005 -0.0025 -0.0082 26 -0.0052 -0.0414 0.0126-33 0.0043 0.0347 -0.0038 27 -0.0046 -0.0280 0.0080-32 0.0038 0.0264 0.0000 28 -0.0010 -0.0075 0.0069-31 0.0012 0.0087 0.0012 29 0.0025 0.0121 0.0095-30 -0.0040 -0.0295 -0.0028 30 -0.0043 -0.0252 0.0052-29 0.0027 0.0188 -0.0001 31 0.0056 0.0360 0.0108-28 -0.0027 -0.0187 -0.0028 32 -0.0037 -0.0180 0.0071-27 -0.0039 -0.0251 -0.0066 33 0.0023 0.0164 0.0094-26 0.0025 0.0146 -0.0041 34 -0.0003 -0.0018 0.0091-25 -0.0041 -0.0269 -0.0082 35 -0.0038 -0.0143 0.0054-24 0.0027 0.0260 -0.0055 36 0.0090 0.0361 0.0144-23 0.0048 0.0316 -0.0007 37 -0.0121 -0.0570 0.0023-22 -0.0088 -0.0637 -0.0095 38 -0.0001 -0.0007 0.0022-21 0.0051 0.0344 -0.0044 39 0.0072 0.0569 0.0094-20 0.0022 0.0140 -0.0023 40 0.0030 0.0209 0.0124w
ww
.ijm
s.uu
m.e
du.m
y

IJMS 14 (1), 39-59 (2006) 55
(continued)
-19 0.0035 0.0217 0.0012 41 -0.0002 -0.0018 0.0122-18 0.0025 0.0146 0.0037 42 -0.0045 -0.0204 0.0077-17 -0.0048 -0.0356 -0.0011 43 0.0033 0.0251 0.0110-16 -0.0002 -0.0016 -0.0013 44 -0.0080 -0.0608 0.0030-15 0.0027 0.0211 0.0014 45 0.0074 0.0460 0.0103-14 0.0027 0.0152 0.0041 46 -0.0034 -0.0260 0.0069-13 0.0000 0.0002 0.0041 47 0.0010 0.0091 0.0079-12 -0.0043 -0.0274 -0.0002 48 0.0039 0.0273 0.0118-11 -0.0033 -0.0139 -0.0035 49 0.0033 0.0296 0.0151-10 0.0033 0.0228 -0.0002 50 -0.0014 -0.0076 0.0137-9 0.0039 0.0256 0.0037 51 -0.0053 -0.0335 0.0085-8 0.0103 0.1010 0.0140 52 0.0045 0.0310 0.0130-7 0.0031 0.0204 0.0170 53 -0.0266 -0.0550 -0.0136-6 0.0042 0.0279 0.0212 54 0.0143 0.0639 0.0006-5 0.0003 0.0012 0.0215 55 0.0028 0.0161 0.0035-4 -0.0083 -0.0458 0.0132 56 0.0006 0.0043 0.0041-3 -0.0011 -0.0059 0.0121 57 -0.0072 -0.0421 -0.0032-2 0.0038 0.0220 0.0159 58 0.0112 0.0506 0.0081-1 0.0036 0.0183 0.0195 59 0.0015 0.0079 0.0095
60 0.0017 0.0101 0.0112
On the announcement day, AAR shows a negative figure of -0.93%with an insignificant t-value of –0.0499, while CAAR shows a figureclose to zero at 1.02%, and again it is found to be statisticallyinsignificant. An inconsistent trend of negative and positive abnormalreturns continues on after the announcement day. This is consistent towhat was found on the CAAR. At day t=-60, the CAAR begins with apositive value of 0.12% and slowly increases until it reaches 1.02% onthe announcement day 0. From table 4, it is also observed that there isa dominant positive trend of CAAR after the announcement date withthe exception of day +53 and +57. However, when a test of CAAR ona specified event period is executed, a similar result is found. None ofthe event period from this model was found to be significantly differentfrom zero. This implies that there have not been significant marketreactions to the share buyback announcement even when a SIMMmodel was used to analyse such announcements.
Discussion on post announcement period implies that the Malaysianstock market is consistent with the semi-strong form efficient markethypothesis since there exists zero abnormal returns due to the sharebuyback announcement. By referring to the pattern of CAAR, we cansee that CAAR increases from –1.69% and +1.02% at day t=0 for theMAR and SIMM approach respectively, to +1.41% and +4.61% an t=+4.The increase in values is nonetheless insignificant with a t-value of –0.589 and –0.3459 for the respective MAR and SIMM model.w
ww
.ijm
s.uu
m.e
du.m
y

56 IJMS 14 (1), 39-59 (2006)
Table 5CAAR in Different Event Window Employed in SIMM
INTERVAL CAAR T-TEST
Days t=-60 to -1 1.953% 0.501Days t= -60 to+60 1.124% 0.169Days t= -40 to+40 0.729% 0.148Days t= -1 to+0 -0.570% -0.439Days t= 0 to +1 -0.0154% -0.090Days t= 0 to +30 -0.0144% -0.394Days t = 0 to +60 -0.0828% -0.150Days t=1 to +53 -2.3838% -0.473Days t=4 to +60 -1.7928% -0.346
At day t =+53, CAAR reaches its lowest return of - 4.29% (MARapproach) and -1.36% (SIMM approach). When a t-statistic iscomputed over the 53 day interval after the buyback announcement,it was still found that both the MAR and SIMM models presentedinsignificant values of –0.548 and –0.473 respectively (refer to Table 3and Table 5).
In short, two models have been used to compute abnormal returns.The first model (MAR) assumes that the systematic risk is equal toone and the second model (SIMM) requires the estimation of beta (b).However, both models failed to prove that there exist positive abnormalreturns from this announcement.
MARKET REACTION WITH CORPORATE FINANCETHEORIES’ IMPLICATIONS
Two main corporate financial theories are highlighted to explain marketreactions on share buyback announcement. They are compared to thefinding of this study. As discussed above, the results show that zeroabnormal return exists. This infers that the Malaysian stock market issemi-strongly efficient because no market participant is able to makeeconomic profits out of the announcement. During the event periodof t=–60 to t=+60, MAR records a negative CAAR value of –2.3291%,but since the t-value shows a low figure, the return is not significant.In contrast, a positive but insignificant CAAR value of 1.1247% (t-value= 0.0101) is found from the SIMM approach. The results found fromthese approaches are then considered in light of the signaling theoryand free cash flow theory.w
ww
.ijm
s.uu
m.e
du.m
y

IJMS 14 (1), 39-59 (2006) 57
The signaling theory hypothesised that a company’s decision to buyback its own shares might send signals to investors that the companyis expanding. Thus, in general, investors are willing to pay a premiumto purchase the company’s shares. This theory expects a positive pricereaction should be observed due to this announcement. However, itmay not be applicable in this study, as zero abnormal returns are foundfrom the result for both the MAR and SIMM models where all eventwindows show insignificant abnormal returns/losses. This couldprobably imply that market participants pay less attention to such anannouncement as it might not add value to their wealth.
Another theory that could explain the market reaction of a share buyback announcement is free cash flow. In this theory, two differentexpectations of a price effect have been discussed. As theorised byJensen (1986), managers would use the free cash flow to support thebuyback programme and the possibility to mismanage the cash flowwill not exist. Likewise, higher free cash flow might lead to themismanagement of free cash flow. Thus, it is expected that rationalinvestors should react positively in the market. Similarly, if a companyhas high level of free cash flows and it does not repurchase its ownstock, a negative price reaction is expected. The results in this studyagain show that it is inconsistent with the implication stated in thistheory as zero abnormal return is found from the result for both theMAR and SIMM models where all event windows show insignificantabnormal returns/losses.
CONCLUSION
Zero abnormal returns are observed during the event period for asample of 30 share buyback announcements. The contradicting resultsof this study with the previous local research are perhaps due to thetypes of mechanisms in buying back shares and also larger marketcapitalisation of the sample which could possibly contribute to theinsignificant results. The finding is consistent with the hypothesis thatsecurity returns adjust rapidly to reflect new information. The existenceof zero abnormal returns for both the MAR and SIMM models provideevidence that the Malaysian stock market is semi-strongly efficient.Furthermore, none of the corporate financial theories could predictthe sign of the share buyback announcement thus they could not besupported.
ww
w.ij
ms.
uum
.edu
.my

58 IJMS 14 (1), 39-59 (2006)
END NOTES
1 Buyback and repurchase are used interchangeably. In most ofthe literature in the developed market, the term “repurchase” iswidely used. However, in Malaysia, the literature available usethe word “buyback” to represent a similar activity.
2 In an open market repurchase, companies may discontinue itsrepurchasing plan and they may take months or years tocomplete the programme. Hence, it is not suitable to be used inthis study.
REFERENCES
Ariff, M., & Finn, F. J. (1989). Announcement effect and marketefficiency: An empirical application to the Singapore equitymarket. Asia Pacific Journal of Management, 6(2), 243-265.
Chhachhi, S., & Davidson, W. (1997). A comparison of market reactionto specially designated dividends and tender offer stockrepurchase. Financial Management, 26, 89- 96
Comment, R., & Jarell, G. (1991). The relative signaling power of DutchAuction and Fixed Price Self Tender Offers and Open MarketShare repurchases. Journal Of Finance, XV1 (4).
Dann, L. Y. (1981). Common stock repurchases: An Analysis of returnsto Bondholders and Shareholders. Journal of Financial Economics,113-138.
Dennis & McConnell, (1986). Additional evidence on equity ownershipand Corporate Value. Journal of Financial Economics, 27, 595- 612.
Dimson, E. (1979). Risk measurement when shares are subject toinfrequent trading. Journal of Financial Economics, 7, 197-226.
Erwin, G., & Miller M. (1998). The intra industry effects of Open MarketShare Repurchases: Contagion or Competitive. The Journal ofFinancial Research, XX1 (4), 389-406.
Jensen, M. (1986). Agency cost of Free Cash Flow, Corporate Financeand The Take-overs. American Economic Review, 76, 323-329.
Lim, E. H.,s & Obiyathulla, I. B. (2002). Price reaction to stockrepurchases: Evidence from the Bursa Malaysia. Capital MarketReview, 10(1), 139-177.
Mohd, J., & Chin, Y. F. (2001).The effect of share buyback announcementin the Kuala Lumpur Stock Exchange paper presented at theMalaysian Finance Association 3rd. Annual Symposium, KualaLumpur.
Nohel, T., & Tarhan, V. (1998). Share repurchases and firm performance:New evidence on the agency costs of free cash flow. Journal ofww
w.ij
ms.
uum
.edu
.my

IJMS 14 (1), 39-59 (2006) 59
Financial Economics, 4, 187-222Nur-Adiana, H. A. (1999). An empirical investigation of the effect of
Rights Issue announcements on share returns and thedeterminants of abnormal returns on the Bursa Malaysia.Unpublished doctoral dissertation, Aston University.
Person, J. C. (1990). Dutch auction repurchases: Coping withuncertainty about shareholder response to tender offers.Working paper. University of Chicago.
Stephen, C. P., & Weisbach, M. S. (1998). Actual share acquisition inOpen Market repurchase program. The Journal of Finance, 313 –333.
Vermaelen, T. (1981). Common stock repurchase and market signaling.Journal of Financial Economics, 9,149-183.
ww
w.ij
ms.
uum
.edu
.my


