Hanford Site Tank 241-C-108 Residual Waste Contaminant Release ...

A-6002-767 (REV 3)
RPP-RPT-54915, Rev. 0
Hanford Single-Shell Tank Leak Causes and Locations - 241-U Farm
C.L. Girardot, D.G. Harlow
Washington River Protection Solutions
Richland, WA 99352 U.S. Department of Energy Contract DE-AC27-08RV14800
EDT/ECN: DRF UC: N/A
Cost Center: 2KE00 Charge Code: 201334
B&R Code: N/A Total Pages:
Key Words: leak location, leak cause, tank, integrity assessment, U Farm, U-104, U-110, U-112, leak
assessment
Abstract: This document identifies 241-U Tank Farm (U Farm) leak causes and locations for the 100
series leaking tanks (241-U-104, 241-U-110, and 241-U-112) identified in RPP-RPT-50097, Rev. 0,
Hanford 241-U Farm Leak Inventory Assessment Report. This document satisfies the U Farm portion of
the target (T04) in the Hanford Federal Facility Agreement and Consent Order milestone M-045-91F.
TRADEMARK DISCLAIMER. Reference herein to any specific commercial product, process, or service by trade name, trademark, manufacturer, or otherwise, does not necessarily constitute or imply its endorsement, recommendation, or favoring by the United States Government or any agency thereof or its contractors or subcontractors.
Release Approval Date Release Stamp
Approved For Public Release
132 JDA 12/2/13
By Janis D. Aardal at 10:59 am, Dec 02, 2013
Dec 02, 2013DATE:
RPP-RPT-54915, Rev. 0
i
EXECUTIVE SUMMARY
This document identifies 241-U Tank Farm (U Farm) leak causes and locations for the 100-series
leaking tanks in U Farm. The leak causes and locations report for all of the 100-series single-
shell leaking tanks is one of the targets, M-045-91-T04 (T04), in the Hanford Federal Facility
Agreement and Consent Order milestone M-045-91F. The T04 target requires that the DOE
provide to State of Washington, Department of Ecology (Ecology) a report on the 100-series
single-shell tanks which have been or will be identified as having leaked in RPP-32681, Rev. 0
(Rev. 1), Process to Assess Tank Farm Leaks in Support of Retrieval and Closure Planning, leak
assessment reports.
The leak assessment report for U Farm, RPP-RPT-50097, Rev. 0, Hanford 241-U Farm Leak
Inventory Assessment Report, identified three 100-series leaking tanks in U Farm, 241-U-104 (U-
104), 241-U-110 (U-110), and 241-U-112 (U-112). All of the other nine 100-series tanks in U
Farm are classified as “sound” or are identified in RPP-RPT-50097 as requiring re-assessment of
their classification per TFC-ENG-CHEM-D-42, Tank Leak Assessment Process. The TFC-ENG-
CHEM-D-42 assessments are not part of the M-045-91-T04 target.
This U Farm leak causes and locations document is part of a series of tank farm reports that
identify leak causes and locations for 100-series leaking tanks. A summary and conclusions
document will be issued, RPP-RPT-54909, Hanford Single-Shell Tank Leak Causes and
Locations – Summary, that compiles the results from all of the leak causes and locations tank
farm reports when they have been issued which will fulfill the T04 target requirements.
The identification of U Farm tank leak locations focused on the possible vertical indication of a
liner leak from liquid level decreases, radial transport in the soil indicated by radiation detected
in drywells, and other factors such as liner bulging. All three leaking U Farm tanks experienced
leaking liners at or near the base of the tanks. The tank U-104 five foot bottom liner bulge and
the depth of radioactivity detected in tank U-104, U-110, and tank U-112 drywells all point to a
liner leak near the bottom of the tank.
Tank U-104 experienced a five foot bulge in the bottom liner which was detected while
completing sluicing of the second batch of metal waste (MW). The liner bulge was probably the
result of temperature rate of rise especially during the second filling of the tank with MW. This
could have set up a situation where vapor pressure under the bottom liner was greater than the
hydrostatic pressure. The bulge probably weakened the bottom liner to the point of failure which
was confirmed by subsequent leak testing and drywell radioactivity.
Both tank U-110 and U-112 experienced liner failures that were detected by a liquid level
decrease and subsequently confirmed by the detection of drywell radioactivity in one of the
drywells surrounding each of the tanks. Corrosion may have been a factor in each case as both
tank U-110 and U-112 stored REDOX waste which is conducive to pitting and stress corrosion
cracking (SCC). Tank U-110 also stored several hundred thousand gallons of unknown
laboratory waste which may have influenced corrosion. Tank U-112 may have experienced
deformation of the bottom liner during construction which may have resulted in stressing and
weakening of the plates and welds.
RPP-RPT-54915, Rev. 0
ii
There appears to be very little contribution from tank design and construction temperatures.
However, some or all of the factors can act serially or together to contribute to tank failure.
Basic information on the leaking and sound U Farm tanks was reviewed to try and identify any
differences between leaking and sound tanks related to liner failure. A number of the sound
tanks contained REDOX waste which was thought to have caused the corrosion that resulted in
the tank U-110 and tank U-112 liner leaks. However, some other unknown factor influencing
corrosion rate or other condition may have prevented a liner leak in the sound tanks.

RPP-RPT-54915, Rev. 0
iii
TABLE OF CONTENTS
1.0 Introduction ...................................................................................................................... 1-1
2.0 U Farm Background ......................................................................................................... 2-1
3.0 U Farm Commonalities .................................................................................................... 3-1
Tank Design/Construction ............................................................................................ 3-1 3.1
3.1.1 Tank Design ......................................................................................................... 3-1
3.1.2 Tank Construction Conditions ............................................................................. 3-2
In-Tank Data For Leaking U Farm Tanks ..................................................................... 3-3 3.2
3.2.1 Liquid Level ......................................................................................................... 3-3
3.2.2 Temperature ......................................................................................................... 3-4
3.2.3 Liner Observations ............................................................................................... 3-5
3.2.4 Chemistry ............................................................................................................. 3-5
3.2.5 Photographs.......................................................................................................... 3-7
Ex-Tank Data For Leaking U Farm Tanks ................................................................... 3-8 3.3
3.3.1 Laterals ................................................................................................................. 3-8
3.3.2 Drywells ............................................................................................................... 3-8
Liner Leak Locations .................................................................................................... 3-9 3.4
Possible Liner Leak Cause(s) ...................................................................................... 3-10 3.5
4.0 Tank 241-U-104 Segment ................................................................................................ 4-1
5.0 Tank 241-U-110 Segment ................................................................................................ 5-1
6.0 Tank 241-U-112 Segment ................................................................................................ 6-1
7.0 Conclusions ...................................................................................................................... 7-1
8.0 References ........................................................................................................................ 8-1
Appendices
Appendix A Meeting Minutes ................................................................................................... A-1

RPP-RPT-54915, Rev. 0
iv
LIST OF FIGURES
Figure 2-1. U Farm and Associated Drywells ............................................................................ 2-2
Figure 3-1. B C T U Tank Farm Knuckle Configuration with Three Ply Waterproofing
(BPF-73550, Sheet B5) ............................................................................................ 3-1
Figure 3-2. U Farm Construction Photograph June 24, 1944 (P3496 N1585573) .................... 3-2
LIST OF TABLES
Table 2-1. Leaking U Farm Tanks with Waste Type .................................................................. 2-3
Table 3-1. ARH-1601 Specifications 1973 ................................................................................. 3-7
Table 7-1. U Farm Leaking Tanks .............................................................................................. 7-2
Table 7-2. U Farm Sound Tanks ................................................................................................. 7-2

RPP-RPT-54915, Rev. 0
v
Acronyms and Abbreviations
221-B B Plant
221-T T Plant
241-U U Farm
ALC air lift circulator
BGS below grade surface
BiPO4 bismuth phosphate
cpm counts per minute
c/s, cps counts per second
DE diatomaceous earth
DST(s) double-shell tank(s)
ECOLOGY State of Washington, Department of Ecology
ENRAF Pg 3-7
FIC Food Instrument Corporation
GM Geiger-Mueller probe
LL liquid level
MT manual tape
NaI sodium-iodide
NO2–
nitrite
NO3–
nitrate
OCP open circuit potential
OH–
hydroxide
ORP Office of River Protection
PCSACS PC Surveillance Analysis Computer System
QI questionable integrity
REDOX Reduction Oxidation Plant
SCC stress corrosion cracking
SGLS Spectral Gamma Logging System
SP scintillation probe
SST(s) single-shell tank(s)
WRPS Washington River Protection Solutions, LLC
Units
°C degrees Centigrade
Ci curie
°F degrees Fahrenheit
ft feet
gal gallon
K 1000
kgal kilogallon (103 gallons)
in inches
M moles per liter
mm millimeter
mR/hr milliRoentgen Per Hour
pCi picocurie (10-12
curies)

RPP-RPT-54915, Rev. 0
vi
pCi/g picocurie per gram
ppm parts per million
yr year
Waste Type Abbreviations
1C first cycle decontamination waste (form fuels reprocessing plant)
CPLX complexed waste
CW coating waste
DW decontamination waste
EB Evaporator Bottoms
Evap Evaporator feed (post 1976)
HLW high-level waste
LW 222-S Laboratory waste
MW Metal waste
NCPLX non-complexed waste
PNF partial neutralization feed
R REDOX HLW
Resid Residual evaporator liquor
TBP Tri-butyl phosphate waste
RPP-RPT-54915, Rev. 0
1-1
1.0 INTRODUCTION
The Hanford Federal Facility Agreement and Consent Order target M-045-91F-T04 indicated
that part of the RPP-32681, Process to Assess Tank Farm Leaks in Support of Retrieval and
Closure Planning, reporting would include leak causes and locations reports for all of the 100-
series single-shell leaking tanks. This document is part of a series of documents that identifies
leak causes and locations of 100-series single-shell leaking tanks that have been identified in the
individual RPP-32681 tank farm leak assessments. An overall leak causes and locations
summary and conclusions document will be prepared along with background and common tank
farm information when all of the 100-series single-shell leaking tanks have been addressed
(RPP-RPT-54909, Hanford Single-Shell Tank Leak Causes and Locations – Summary and
Conclusion, to be issued). The information from RPP-RPT-54909 will be incorporated into the
summary conclusions report on leak integrity for the Hanford Federal Facility Agreement and
Consent Order milestone M-045-91F.
The 241-U Tank Farm (U Farm) tanks with a leak loss are addressed in this document. The U
Farm assessment in RPP-RPT-50097, Rev. 0, Hanford 241-U Farm Leak Inventory Assessment
Report, reported a leak loss for tanks 241-U-104 (U-104), 241-U-110 (U-110), and 241-U-112
(U-112) and recommended that tank 241-U-101 (U-101) be further assessed using TFC-ENG-
CHEM-D-42, Tank Leak Assessment Process. The TFC-ENG-CHEM-D-42 assessments are not
part of the M-045-91-T04 target.
The identification of U Farm tank leak locations focused on the first indication of radiation
detected in drywells as well as liquid level decreases as appropriate. Leak detection laterals were
not installed underneath the U Farm tanks.
The U Farm leak causes were identified as chemistry-corrosion and in the case of tank U-104,
thermal conditions which likely resulted in the liner bulging upward. There appears to be very
little contribution from tank design and construction temperatures. However, some or all of the
factors can act serially or together to contribute to tank failure.
Three meetings were held to review status of tanks U-104, U-110, and U-112 with the Office of
River Protection (ORP) and the State of Washington, Department of Ecology (Ecology)
personnel. A review on June 25, 2013, covered the information that had been generated on the
location of the tank U-104 leak and supporting data. A second meeting on August 6, 2013,
provided a review of the tank U-110 leak causes and locations document. A third meeting on
September 10, 2013, provided a review of the tank U-112 leak causes and locations document
along with a comparison of the available information on the other U Farm tanks. Comments
were received, responses developed, and additions/revisions were made to the document (see
Appendix A).

RPP-RPT-54915, Rev. 0
2-1
2.0 U FARM BACKGROUND
The U Farm was constructed between 1943 and 1944 and is located west of Camden Avenue and
north of 14th
Street in the 200 West Area. The farm includes twelve 100-series dish bottom
design SSTs. The tanks are 75-ft in diameter with an operating capacity of 530,000 gallons
(WHC-SD-WM-ER-325, Rev. 1, Supporting Document for the Historical Tank Content Estimate
for U-Tank Farm). A typical 100 series tank in U Farm contains 10 to 12 risers ranging in size
from 4-in to 42-in in diameter that provide grade-level access to the underground tank.
Normally, there is one riser in the center of the tank dome and four or five each on opposite sides
of the dome. The tanks are arranged in four rows of three tanks forming a cascade. The cascade
overflow height is ~15.9-ft from the tank knuckle bottom and 2.0-ft below the top of the steel
liner.
Figure 2-1 shows a schematic of the U Farm tanks with location of the drywells.

RPP-RPT-54915, Rev. 0
2-2
Figure 2-1. U Farm 100-Series Tanks and Associated Drywells
(RPP-35485, Rev. 0)
* Tank U-101 was recommended to be assessed using the TFC-ENG-CHEM-D-42 procedure as identified in
RPP- RPT-50097. Therefore, tank U-101 was not evaluated in this document.
*

RPP-RPT-54915, Rev. 0
2-3
Tanks U-104, U-110, and U-112 contained various waste types throughout operation which are
listed in Table 2-1. The following sections describe some of the important common tank features
and conditions that could affect tank leak causes and locations. This is followed by the
individual tank analyses of the possible leak locations and causes and a comparison of leaking
and non-leaking tanks in the conclusion section. The sections contain excerpts from RPP-RPT-
50097, Rev. 0.
Table 2-1. Leaking U Farm Tanks with Waste Type
Tank Waste Type1
U-104 MW, water
U-110 1C, CW, R, LW
U-112 1C, CW, R Note: Waste types are listed in the List of Terms

RPP-RPT-54915, Rev. 0
3-1
3.0 U FARM COMMONALITIES
TANK DESIGN/CONSTRUCTION 3.1
3.1.1 Tank Design
The U Farm SSTs are constructed of 1-ft thick reinforced concrete with a 0.25-in thick mild
carbon steel liner (ASTM A7-39) on the bottom and sides with knuckle plates 0.3125-in thick
and a 1.25-ft thick domed concrete top. The tanks have a dished bottom with a 4-ft radius
knuckle.
The tanks are set on a reinforced concrete foundation. A three-ply waterproofing was applied
over the foundation and then coated with a 2-in thick layer of grout reinforced with wire mesh.
A three-ply waterproof membrane was applied directly to the outside of the steel surface up the
sidewalls. Four coats of primer paint were sprayed on all exposed interior tank surfaces. Tank
ceiling domes were covered with three applications of magnesium zincfluorosilicate wash. Lead
flashing was used to protect the joint where the steel liner meets the concrete dome. Asbestos
gaskets were used to seal the access holes in the tank dome. Each tank was covered with ~5.6 to
7.2-ft of overburden.
The tanks have four process spare inlet nozzles located ~16.5-ft from the tank knuckle bottom,
~0.6-ft above the cascade overflow line and 1.4-ft below the top of the steel liner. The steel
bottom of the U Farm tanks intersects the sidewall on a 4-ft radius (BPF-73550, Drawings D-2
and D-3, Specification for Construction of Composite Storage Tanks (B, C, T, and U Tank
Farms)).
Figure 3-1 shows the detail of the knuckle liner to the grout, and three-ply asphaltic waterproof
membranes between the bottom and sidewall intersection (BPF-73550, Sheet D5).
Figure 3-1. B C T U Tank Farm Knuckle Configuration with Three-Ply Waterproofing
(BPF-73550, Sheet D5)

RPP-RPT-54915, Rev. 0
3-2
3.1.2 Tank Construction Conditions
The U Farm construction temperatures were examined to determine if the tank liner fabrication
occurred at or below the metal ductile-to-brittle temperature transition. The photograph in
Figure 3-2 shows the U Farm under construction on June 24, 1944.
Figure 3-2. U Farm Construction Photograph June 24, 1944
(P3496 N1585573)
The metallurgical factors that limited carbon steel’s ability to resist impact at low temperature
were perhaps not well understood when U Farm was constructed and were not specified for the
0.25-in thick ASTM A7-39, American Society for Testing and Materials, Standard Specifications
for Steel for Bridges and Buildings, mild carbon steel liner at the time. Current standards for
construction of pressure vessels, ASME Boiler & Pressure Vessel Code (B&PVC), Section VIII,
Rules for Construction of Pressure Vessels, provide requirements for vessels constructed of
carbon and low alloy steels with respect to minimum design metal temperatures. That standard
does not identify ASTM A7-39, as a material type but it does identify ASTM A283, Standard
Specification for Low and Intermediate Tensile Strength Carbon Steel Plates. Early versions of
ASTM A283 were similar to ASTM A7-39 because they identified the same chemical
composition requirements as ASTM A7-39, and ASTM A283 steel plate and ASTM A7-39 steel
plate had the same required tensile strength range, minimum yield point, and bending properties.
Current B&PVC Section VIII requirements specify, for ASTM A283 material of nominal
thickness 10-mm (0.394-in), a minimum design metal temperature of 18°F. For the purposes
of this report, it will be assumed that the 18°F design temperature is applicable to the fabrication
of ASTM A7-39 carbon steel.

RPP-RPT-54915, Rev. 0
3-3
Boxes from the list of Vendor Information Reports for U Farm were searched for any Chemical
and Physical Test Reports for the tank steel plates used in the farm but none were found. No
other construction information for U Farm was found during the search.
A review of toughness and the ductile-to-brittle transition temperature for carbon steels
(designated as “impact transition temperature”) in Mark’s Standard Handbook for Mechanical
Engineers, Tenth Edition, indicates that carbon content can have a significant effect. Decreased
carbon content not only raises the propagation energy needed for crack growth but also lowers
the temperature for transition from ductile-to-brittle behavior (reference Fig 6.2.11 in Marks),
suggesting that the B&PVC Section VIII low temperature service limit may be lower than what
could be expected for steel of the vintage used in U Farm construction. The concentrations of
carbon and trace impurities and their effect on this property are not specifically known, and low
temperature impact resistance could only be determined reliably by impact testing of actual tank
specimens.
Below the transition temperature, the metal loses its ability to absorb forces such as induced
loads, or the impact of falling objects without fracturing. In this circumstance it is possible for
micro-fissures or hairline cracks to be created. Later, when the metal is subjected to high stress,
it might be possible for the cracks to propagate through the metal, or possibly subject the
weakened areas to increased corrosion.
Any low temperatures experienced during construction at or less than the 18°F allowable
temperature where impact loading (e.g. a dropped tool or piece of equipment from scaffolding)
had the potential for creating micro-fissures may have triggered fissures in the steel liner (see
Sections 4.3.2, 5.3.2, and 6.3.2).
Design, fabrication, and erection of the tank steel lining were required to be in accordance with
current “Standards Specifications for Elevated Steel Water Tanks, Standpipes and Reservoirs” as
promulgated by the “American Water Works Association” (BPF-73550). Welding and
inspection requirements were to conform to the American Welding Society’s “Code for Arc and
Gas Welding in Building Construction”, Section 4.
The possible variability of liner steel from either different runs from the same supplier, or
because of multiple suppliers could affect the resistance to low temperatures.
IN-TANK DATA FOR LEAKING U FARM TANKS 3.2
The general information in this section is further developed and applied to the leaking tanks in
Sections 4.4, 5.4, and 6.4 for tanks U-104, U-110, and U-112, respectively, to understand
implications of the conditions that could affect liner leaks and identify possible liner leak
locations.
3.2.1 Liquid Level
The following is an excerpt from RPP-ENV-39658 (Hanford SX-Farm Leak Assessments
Report):
RPP-RPT-54915, Rev. 0
3-4
“Originally liquid levels were measured using pneumatic dip tubes (HW-10475-C,
Hanford Technical Manual Section C, page 908). This practice was later replaced and a
manual tape with a conductivity electrode was used to detect the liquid surface
(H-2-2257, Conductor Reel for Liquid Level Measurement). The biggest limitations of
the manual tape measurements were failures of the electrodes, solids forming on the
electrode and measurement precision. The statistical accuracy of the manual tape and
electrode measurement technique was 0.75 in. (~2,060 gal), as determined in July 1955
(HW-51026, Leak Detection – Underground Storage Tanks, page 4). Later, liquid-level
determinations were automated in many of the SSTs to provide more accurate and
reliable measurements”.
It was stated in RPP-RPT-43704 (Hanford BY-Farm Leak Assessments Report) that the accuracy
for the manual tape can vary from 0.25-in to 2-in for different tanks depending on surface
conditions (liquid/solids), boiling, air lift circulator (ALC) operation, and conductivity.
The in-tank repeatability limits for FIC liquid level gauges are + 0.25-in (Letter 72730-80-097,
“Review of Classification of Six Hanford Single-Shell “Questionable Integrity (QI)” Tanks”).
Transfer discrepancies of greater than 1.5-in (4,125 gal) measured at the first hour and every two
hours thereafter with an FIC, manual tape, or flowmeter required an orderly and immediate
shutdown, investigation, and notification. The 1.5-in discrepancy requirement was a
specification limit in ARH-1601, Section D, Specifications and Standards for the Operation of
Radioactive Waste Tank Farms and Associated Facilities.
Liquid level measured by manual tape (MT) is calculated for B, C, T, and U Farm tanks with the
formula: volume = (MT Reading X 2750 gal/in) + 12,500 gal (LET-082172, H.N. Raymond to
C.J. Francis, August 21, 1972, Maximum Operating Levels and Cascade Levels in 200-West area
Tank Farms [IDMS Accession D196208887]). Even though the letter title indicates only west
area, the above formula for the B, C, T, and U Farm tanks is found on the last page of the letter.
The formula was confirmed to have been used as late as 1980 in RHO-CD-896, Review of
Classification of Nine Hanford Single-Shell “Questionable Integrity” Tanks, page 76, for the
then current tank T-111 volume (488,000 gal) and MT reading (173-in) which verified use of the
formula. All half yearly and quarterly report ending volumes in this document were calculated
with this formula. Original MT readings and the MT readings in PCSACS are all measured from
the lower knuckle of the above tanks which is 12-in above the bottom inside center of the tanks.
The ENRAF liquid level readings in PCSACS have been converted to read from the bottom
inside center of the tank. Therefore, for the same reported liquid level the ENRAF reading is 12-
in greater than the MT reading.
3.2.2 Temperature
Limited temperature data is available for the U Farm tanks until the 1970s. Available waste
temperatures starting in the 1970s can be found in WHC-SD-WM-ER-325, Rev. 0, RHO-CD-
1172, Survey of the Single-Shell Tank Thermal Histories, and in PCSACS. Historical documents
in the following two paragraphs can be used to infer probable tank temperatures for the storage
of waste in the U Farm tanks (see Sections 4.4.2, 5.4.2, and 6.4.2 for individual tank waste
temperature).

RPP-RPT-54915, Rev. 0
3-5
The U Farm tank construction specifications indicated the temperature of the liquid contents
would be (up to) 220°F (HW-1946, Specifications for Composite Storage Tanks – Buildings
#241 at Hanford Engineering Works). The condensers on the B, C, T, and U Farm tanks 101
through 106 were reported to be adequate for the waste temperatures and vapor loads for the
original operations at approximately 180°F for supernatant and sludge (WHC-MR-0132, A
History of the 200 Area Tank Farms).
The earliest operation limitations found for U Farm are addressed in ARH-951, Limitations for
Use of Underground Waste Tanks. The ARH-951 document was issued December 18, 1969 and
indicated that tank temperatures for should be held below 230°F with a 5°F per day rise for liquid
temperatures below 180°F and a 3°F per day rise for liquid temperatures above 180°F during
waste addition to the tank.
3.2.3 Liner Observations
A bulge, typically caused by rapid vaporization of moisture under the tank liner, may result in
the direct failure of the liner or cause enough stress or thinning on the steel liner plates and welds
that they become more susceptible to the effects of corrosion without producing a permanent
bulge. Experience indicates that bulging tends to be a dynamic phenomenon, and it is possible
that a tank with no measured bulge at one point in time may actually have had a displaced liner
that was not detected at another time.
3.2.4 Chemistry
The types of corrosion that may occur in the Hanford Site SSTs include uniform corrosion, stress
corrosion cracking (SCC), pitting, crevice, and liquid-air interface corrosion which were
identified in PNNL-13571, Expert Panel Recommendations for Hanford Double-Shell Tank Life
Extension.
Uniform corrosion rates for SSTs are reported to be generally less than 1 mil/year (HNF-3018,
Rev. 0, Single-Shell Tank Sluicing History and Failure Frequency) for the SSTs. Carbon steel
exposed to alkaline solutions has a low general corrosion rate (PNL-5488, Prediction Equations
for Corrosion Rates of A-537 and A-516 Steels in Double Shell Slurry). However, the presence
of the nitrate ion may induce various forms of localized attack (i.e., SCC, pitting, etc.).
Nitrate Ion-Induced Stress Corrosion Cracking
Stress corrosion cracking is the growth of cracks in a corrosive environment. It can lead to
unexpected sudden failure of normally ductile metals subjected to a tensile stress, especially at
elevated temperatures. Stress corrosion cracking is highly chemically specific in that certain
alloys are likely to undergo SCC only when exposed to a small number of chemical
environments. The chemical environment that causes SCC for a given alloy is often one which
is only mildly corrosive to the metal otherwise.
Nitrate ion-induced SCC is the predominant threat to the integrity of the steel liners in the SSTs
and DSTs at the Hanford Site and many investigations have been performed to establish the
parameters under which the tanks can be protected from this threat. This work, together with the
RPP-RPT-54915, Rev. 0
3-6
efforts of many others, led to the adoption of the waste chemistry control limits for SCC
prevention in 1983 (OSD-T-151-00017, Operating Specifications for the Aging Waste
Operations in Tank Farms 241-AY and 241-AZ).
The factors governing the rates of nitrate ion-induced SCC cracking by Hanford Site DST wastes
were recently reviewed (RPP-RPT-47337, Specifications for the Minimization of the Stress
Corrosion Cracking Threat in Double-Shell Tank Wastes). In brief, the test results led to the
conclusion that the rates of nitrate ion-induced SCC depended on the properties of the steel, the
applied potential versus the open circuit potential (OCP), the temperature and the concentrations
of aggressive substances such as nitrate ion, and the potential inhibitors such as hydroxide and
nitrite ion.
The technical work has shown that SCC is promoted by high temperatures, high nitrate ion
concentrations, low hydroxide ion concentrations, low nitrite ion concentrations, and low nitrite
ion/nitrate ion concentration ratios. Tanks with maximum temperatures less than 122°F would
not be expected to experience significant SCC damage regardless of waste types (HNF-3018,
Rev. 0). Tanks with the maximum temperatures above 122°F and a ratio of nitrate concentration
to the sum of nitrite and hydroxide concentrations greater than 2.5 would be expected to suffer
SCC-related damage (HNF-3018, Rev. 0). The concentration of nitrate and temperature are
parameters that have the most effect on SCC. However, the pH (hydroxide) and nitrite can
inhibit SCC. The current double-shell tank operating specifications for chemistry are reported in
OSD-T-151-00007, Rev. 10, Operating Specifications for the Double-Shell Storage Tanks.
While the chemistry specifications stated in this document were prepared for the DSTs, corrosion
mechanisms and corrosion protection mechanisms applicable to DST primary tank metal liners
are equally applicable to the older SST metal liners.
Localized Corrosion: Crevice, Pitting, and Liquid-Air Interface Corrosion
Crevice corrosion can occur in regions where a small volume of solution cannot readily mix with
the bulk solution such as under deposits, between metal flanges, and other confined areas. Once
initiated, crevice corrosion proceeds by the same mechanism as pitting corrosion (RPP-RPT-
33306, IQRPE Integrity Assessment Report for the 242-A Evaporator Tank System).
Pitting corrosion is the localized corrosion of a metal surface confined to a point or small area
that takes the form of cavities. Pitting corrosion in dilute solutions (NO3- < 1M) of waste has
been studied at the Savannah River Site (SRS). Pitting has been determined to not be a problem
at hydroxide concentrations greater than 1M for any of the diluted waste solutions tested
(WSRC-TR-90-512, Effect of Temperature on the Nitrite Requirement to Inhibit Washed
Sludge; Oblath and Congdon 1987, Inhibiting Localized Corrosion during Storage of Dilute
Waste). Nitrate ion was determined to be the usual controlling aggressive species when its
concentrations ranged between 0.01M and 1M (WSRC-TR-90-512). The presence of hydroxide
ion and nitrite ion has shown to inhibit pitting corrosion due to the aggressive nitrate ion. This
work led to the conservative recommendation that the concentration of nitrite ion be greater than
0.033M for the avoidance of pitting in dilute solutions of nitrate ion at pH 10 and 40°C (104°F)
(RPP-ASMT-53793, Rev. 0, Tank 241-AY-102 Leak Assessment Report).
RPP-RPT-54915, Rev. 0
3-7
The chemical compositions required for prevention of pitting corrosion can also be applied as
limits for prevention of liquid-air interface corrosion at the surface of the supernatant.
Crevice, pitting, and liquid-air interface corrosion are types of localized corrosion possible in the
SSTs; however, historically SCC is the more predominant type of corrosion of concern.
Historical Corrosion Control
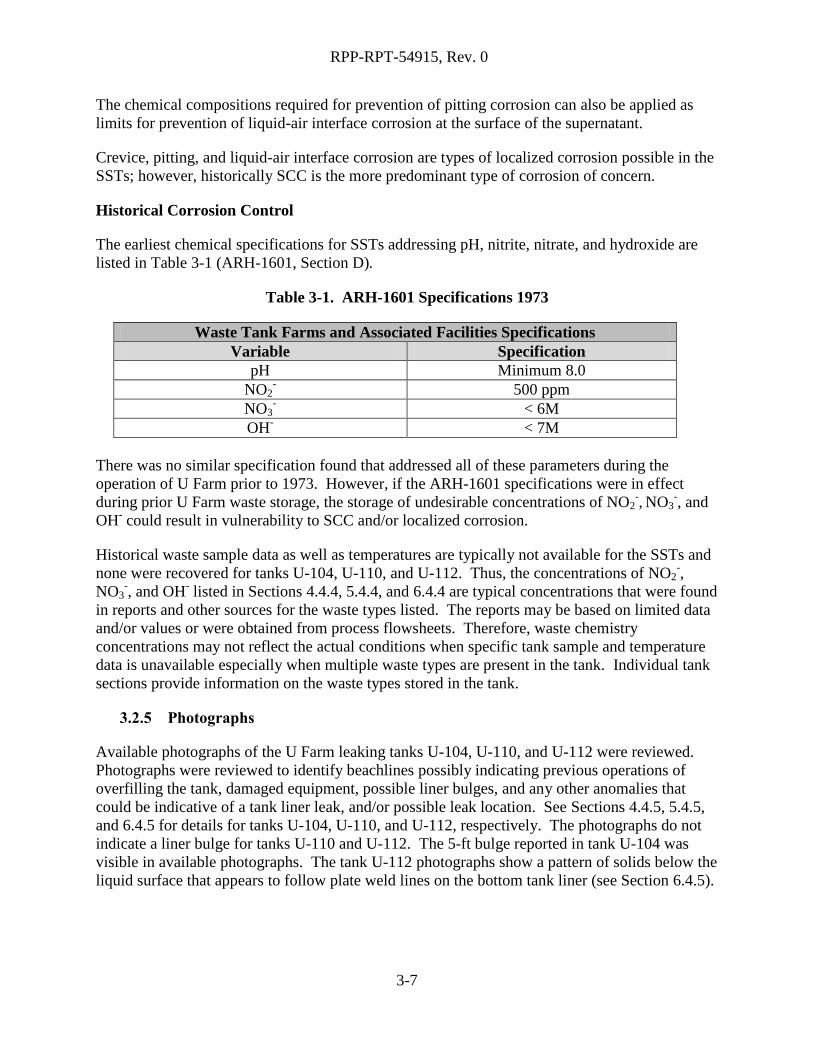
The earliest chemical specifications for SSTs addressing pH, nitrite, nitrate, and hydroxide are
listed in Table 3-1 (ARH-1601, Section D).
Table 3-1. ARH-1601 Specifications 1973
Waste Tank Farms and Associated Facilities Specifications
Variable Specification
pH Minimum 8.0
NO2
- 500 ppm
NO3
- < 6M
OH
- < 7M
There was no similar specification found that addressed all of these parameters during the
operation of U Farm prior to 1973. However, if the ARH-1601 specifications were in effect
during prior U Farm waste storage, the storage of undesirable concentrations of NO2-, NO3
-, and
OH- could result in vulnerability to SCC and/or localized corrosion.
Historical waste sample data as well as temperatures are typically not available for the SSTs and
none were recovered for tanks U-104, U-110, and U-112. Thus, the concentrations of NO2-,
NO3-, and OH
- listed in Sections 4.4.4, 5.4.4, and 6.4.4 are typical concentrations that were found
in reports and other sources for the waste types listed. The reports may be based on limited data
and/or values or were obtained from process flowsheets. Therefore, waste chemistry
concentrations may not reflect the actual conditions when specific tank sample and temperature
data is unavailable especially when multiple waste types are present in the tank. Individual tank
sections provide information on the waste types stored in the tank.
3.2.5 Photographs
Available photographs of the U Farm leaking tanks U-104, U-110, and U-112 were reviewed.
Photographs were reviewed to identify beachlines possibly indicating previous operations of
overfilling the tank, damaged equipment, possible liner bulges, and any other anomalies that
could be indicative of a tank liner leak, and/or possible leak location. See Sections 4.4.5, 5.4.5,
and 6.4.5 for details for tanks U-104, U-110, and U-112, respectively. The photographs do not
indicate a liner bulge for tanks U-110 and U-112. The 5-ft bulge reported in tank U-104 was
visible in available photographs. The tank U-112 photographs show a pattern of solids below the
liquid surface that appears to follow plate weld lines on the bottom tank liner (see Section 6.4.5).

RPP-RPT-54915, Rev. 0
3-8
EX-TANK DATA FOR LEAKING U FARM TANKS 3.3
The general information in this section is further developed and applied to the leaking tanks in
Sections 4.5, 5.5, and 6.5 for tanks U-104, U-110, and U-112, respectively, to understand
implications of the conditions that could affect liner leaks and identify possible liner leak
locations.
3.3.1 Laterals
Leak detection laterals were installed approximately 10-ft underneath some of the tanks
containing self-boiling waste in 241-A and 241-SX Farms. Each lateral is a 3-in pneumatic
stainless steel tubing enclosed in 4-in carbon steel pipe. Probes were driven to the end of the
lateral with compressed air then slowly withdrawn to gather a radiation profile below the bottom
of the tank. Lateral leak detection systems were not installed under the U Farm tanks.
3.3.2 Drywells
Six drywells are located around tanks U-104 and U-112 and seven drywells are located around
tank U-110. The earliest tank specific drywells were installed in 1970 through 1976; later four
direct pushes were installed in 2007. All of the radiation readings in drywells are assumed to be
maximum or peak readings unless otherwise noted. Drywells were drilled vertically from the
surface and drywell coordinates and detailed drywell information, e.g., pipe dimensions and
configuration, for tanks U-104, U-110, and U-112 are addressed in references cited in the
individual tank segments. Drywells will not be useful to detect releases that enter the soil from
the tank unless the volume released is sufficiently large to facilitate lateral transport to a drywell
typically to within ~1-ft of the drywell. The vertical height of a tank liner leak may not be
directly related to the point of detection in the drywell. This is especially true for small leaks
that may flow downward some distance before encountering a drywell.
The “00” series drywells (drywell 60-00-05, U Farm) were installed shortly after tank
construction, usually around the periphery of the farm and most extend to 150-ft below grade
surface (BGS). Others with tank numbers embedded in the drywell number (60-04-01, tank U-
104) were constructed later, sometimes after tank operations had ceased and generally to 100-ft
BGS, with a few deeper than 100-ft BGS. The usual number of drywells surrounding a tank is
one to four. If there are more, then there likely was some concern regarding a release which was
being investigated. The last number corresponds to the clocked position of the drywell with
respect to due north.
Four gamma ray probe types were used to monitor gamma in drywells to detect leaks (RPP-
8321, Analysis and Summary Report of Historical Dry Well Gamma Logs for the 241-C Tank
Farm 200 East Area). The most widely used probe was the unshielded gross gamma sodium-
iodide (NaI) probe (or probe 04; the shielded NaI probe was referred to as probe 14). The NaI
probe (04) is very sensitive and able to record gamma ray activity from 30 counts per second
(cps) up to about 40,000 cps (15mR/hr) before the data becomes unreliable (RHO-RE-EV-4P,
Supporting Information for the Scientific Basis for Establishing Dry Well Monitoring
Frequencies. The next most commonly used probe was the Red-GM (or probe 02) which is less
sensitive but can reliably record gross gamma at much higher levels of activity (up to ~500R/hr).

RPP-RPT-54915, Rev. 0
3-9
Operation of these and other probes are discussed in HNF-3136, Analysis Techniques and
Monitoring Results, 241-SX Drywell Surveillance Logs. A scintillation probe (SP) was also used
to measure low levels of radiation in the drywells. Leak location identification is primarily
focused on the first indication of a leak and is therefore typically concerned with the lower levels
of gross gamma detection and initial migration.
Drywell sections (see Sections 4.5.1, 5.5.1, and 6.5.1) contain gross gamma figures taken from
RPP-7729, Analysis and Summary Report of Historical Drywell Gamma Logs for 241-U Tank
Farm – 200 West, showing continuing or new contamination in the drywells based on BGS depth
from 1975 to 1994. Some of these gross gamma figures show anomalous data that appear to be
unexplained detections that do not reflect radioactivity in the soil. In 1996, a baseline
characterization of the gamma-ray-emitting radionuclides distributed in the vadose zone
sediments beneath and around U Farm was performed using spectral gamma logs (SGLS) and
documented in GJO-HAN-8, Vadose Zone Characterization Project at the Hanford Tank Farms
U Tank Farm Report. Individual vadose zone characterization summary data reports were issued
in 1996 for the U Farm tanks with results reported in the leaking tank segments. The gross
gamma and the SGLS can detect equivalent Cs-137 at concentrations down to ~10 pCi/g and
~0.1 pCi/g respectively. Therefore, radioactivity < 10 pCi/g does not appear on the gross gamma
figures (GJO-HAN-8). SGLS logging can confirm both Cs-137 and/or Co-60 radioactivity
which can assist in the leak location analysis, and the SGLS data is weighted more heavily on
interpreting drywells. SGLS documents refer to processed U-235/U-238 which refers to
irradiated isotopic distribution versus naturally occurring uranium found in the soil. The criteria
for drywell monitoring are defined in RHO-ST-34, A Scientific Basis for Establishing Drywell-
Monitoring Frequencies, with the monitoring frequency found in SD-WM-TI-356, Waste
Storage Tank Status and Leak Detection Criteria.
All of the radiation readings in drywells are assumed to be maximum or peak readings unless
otherwise noted and are from the Red-GM probe unless otherwise indicated. The individual tank
segments report the available drywell data in the drywell section and in some cases the more
recent direct pushes installed to locate detailed soil radioactivity. The drywell summary section
provides the analyses of the associated drywells and any direct pushes with the tank that is of
concern.
LINER LEAK LOCATIONS 3.4
Drywell radioactivity when first detected can indicate a radial or depth location of a tank leak,
migration of the tank leak, or the possible migration of an adjacent tank leak. The radial drywell
radioactivity is also dependent on any possible flow paths from the actual tank liner leak location
to the drywell itself as well as the waste viscosity and distance to the drywell. Drywells can also
indicate the tank liner sidewall leak vertical location but the indication needs to be analyzed
relative to non-tank liner leaks associated with pipe lines or other sources.
Liquid level decreases can be used for sidewall as well as bottom liner leaks but need to be
analyzed in relationship with the vertical level of the tank drywell radioactivity, evaporation, and
drywell contamination from pipe line leaks and other non-tank sources.
RPP-RPT-54915, Rev. 0
3-10
A liner leak may have penetrated the waterproof membrane at any location and followed
concrete cracks or construction joints to a different location including the top of the tank footing.
Therefore, the point of waste egress from the tank liner may not be the point of entry of the
leaking waste to the soil. Later indications of radioactivity in the drywells with improved
detector capabilities could indicate additional leakage but the location of the leak could not be
pinpointed without some additional information.
The lack of radioactivity above background in a drywell indicates that if there was a liner leak it
either occurred at another location, the leak flow was insufficient to reach the effective radius of
the probes used in the drywell, or was not able to adequately detect the specific radioisotope with
the gamma probe. When there is no radioactivity detected in a drywell or no recoverable data for
a drywell it is not included as part of the leak location analysis.
POSSIBLE LINER LEAK CAUSE(S) 3.5
Analysis of the U Farm commonalities which centered on tank design/construction, in-tank data,
and ex-tank data indicates that there was essentially one condition, chemistry-corrosion, that was
the most likely to have contributed to a possible tank failed liner for tanks U-110 and U-112. In
the case of tank U-104, waste thermal conditions likely resulted in the reported liner bulge.
There appears to be very little contribution from tank design (no inherent flaws have been
documented in the literature reviewed), construction temperatures, and waste thermal conditions.
However, some or all of the factors can act serially or together to contribute to tank liner failure.
The following sections provide a tank U-101, U-110, and U-112 review of these conditions as
they relate to liner leak causes.
Other general tank construction factors such as the quality of materials and fabrication could also
contribute to tank liner failure. Because no evidence has been found to substantiate quality
defects, these are not included as a leak cause.

RPP-RPT-54915, Rev. 0
4-1
4.0 TANK 241-U-104 SEGMENT
TABLE OF CONTENTS
Tank U-104 Background History .................................................................................. 4-4 4.1
Tank U-104 Operations Summary ................................................................................ 4-5 4.2
Tank Design/Construction ............................................................................................ 4-8 4.3
4.3.1 Tank Design ......................................................................................................... 4-8
4.3.2 Tank Construction Conditions ............................................................................. 4-8
Tank U-104 In-Tank Data ............................................................................................. 4-8 4.4
4.4.1 Liquid Level ......................................................................................................... 4-8
4.4.2 Temperature ....................................................................................................... 4-10
4.4.3 Liner Observations ............................................................................................. 4-11
4.4.4 Chemistry-Corrosion.......................................................................................... 4-13
4.4.5 Photographs........................................................................................................ 4-13
Tank U-104 Ex-Tank Data .......................................................................................... 4-13 4.5
4.5.1 Drywells ............................................................................................................. 4-13
4.5.1.1 Drywell 60-04-03 ............................................................................................. 4-14
4.5.1.2 Drywell 60-07-01 ............................................................................................. 4-15
4.5.1.3 Drywell 60-07-11 ............................................................................................. 4-16
4.5.1.4 Drywell 60-04-08 ............................................................................................. 4-17
4.5.1.5 Drywell 60-04-10 ............................................................................................. 4-18
4.5.1.6 Drywell 60-04-12 ............................................................................................. 4-19
4.5.1.7 2007 Direct Pushes ........................................................................................... 4-20
4.5.1.8 Drywell Summary ............................................................................................ 4-20
Possible Tank U-104 Liner Leak Location(s) ............................................................. 4-20 4.6
4.6.1 Leak Detected in 1974-1976 .............................................................................. 4-21
4.6.2 Leak Detected in 2007 ....................................................................................... 4-23
4.6.3 Leak Location Summary .................................................................................... 4-24
Possible Tank U-104 Liner Leak Cause(s) ................................................................. 4-26 4.7
4.7.1 Tank Design ....................................................................................................... 4-26
4.7.2 Thermal Conditions ........................................................................................... 4-26
RPP-RPT-54915, Rev. 0
4-2
4.7.3 Chemistry-Corrosion.......................................................................................... 4-26
4.7.4 Liner Observations ............................................................................................. 4-26
4.7.5 Tank Construction Temperature ........................................................................ 4-26
Tank U-104 Conclusions............................................................................................. 4-27 4.8
Appendices
Appendix A1 Tank U-104 Non-Boiling Waste Operational History ...................................... A1-1
Appendix B1 Tank U-104 Gross Gamma Drywell Data ......................................................... B1-1
LIST OF FIGURES
Figure 4-1. Tank U-104 Associated Drywells ............................................................................ 4-4
Figure 4-2. Operational Leak History of Tank U-104 ................................................................ 4-7
Figure 4-3. Tank U-104 End of Quarter Surface Level .............................................................. 4-9
Figure 4-4. Tank U-104 Liquid Level April 1957 through March 1961 .................................. 4-10
Figure 4-5. Tank U-104 Bulged Bottom Liner August 15, 1956.............................................. 4-12
Figure 4-6. Tank U-104 Drywell 60-04-03 (RPP-7729) .......................................................... 4-14
Figure 4-7. Tank U-104 Drywell 60-07-01 (RPP-7729) .......................................................... 4-15
Figure 4-8. Tank U-104 Drywell 60-07-11 (RPP-7729) .......................................................... 4-16
Figure 4-9. Tank U-104 Drywell 60-04-08 (RPP-7729) .......................................................... 4-17
Figure 4-10. Tank U-104 Drywell 60-04-10 (RPP-7729) ........................................................ 4-18
Figure 4-11. Tank U-104 Drywell 60-04-12 (RPP-7729) ........................................................ 4-19
Figure 4-12. Tank U-104 Possible Leak Location (1974-1976) ............................................... 4-22
Figure 4-13. Tank U-104 Possible Leak Location (2007) ........................................................ 4-23
Figure 4-14. Tank U-104 Possible Radial Leak Locations ....................................................... 4-25

RPP-RPT-54915, Rev. 0
4-3
LIST OF TABLES
Table 4-1. Tank U-104 Waste Storage Chronology ................................................................. 4-13
Table 4-2. Waste Chemistries for Waste Types Stored in Tank U-104.................................... 4-13
Table A1-1. ARH-R-43 Waste Tank Leak Experience Table ................................................. A1-2
Table B1-1. Tank U-104 Drywell Radioactivity (K counts per minute) (April 1974
through November 1986) ..................................................................................... B1-2

RPP-RPT-54915, Rev. 0
4-4
TANK U-104 BACKGROUND HISTORY 4.1
This section provides information on the historical waste loss event associated with Single-Shell
Tank (SST) 241-U-104 (U-104). There are six drywells located around tank U-104 with
specified distances from the drywell to the tank footing shown in Figure 4-1: 60-04-03, 60-07-
11, 60-04-08, 60-04-10, and 60-04-12, installed in 1974, and 60-07-01, installed in 1976. Two
nearby direct pushes were installed in 2007.
The bottom of the tank footing is ~38-ft 4-in Below Grade Surface (BGS) with ~6.5-ft soil cover
over the dome (WHC-SD-WM-TI-665, Soil Load above Hanford Waste Storage Tanks; BPF-
73550).
Figure 4-1. Tank U-104 Associated Drywells
Tank inner ring is steel liner; outer ring is outer edge of tank footing
RPP-RPT-54915, Rev. 0
4-5
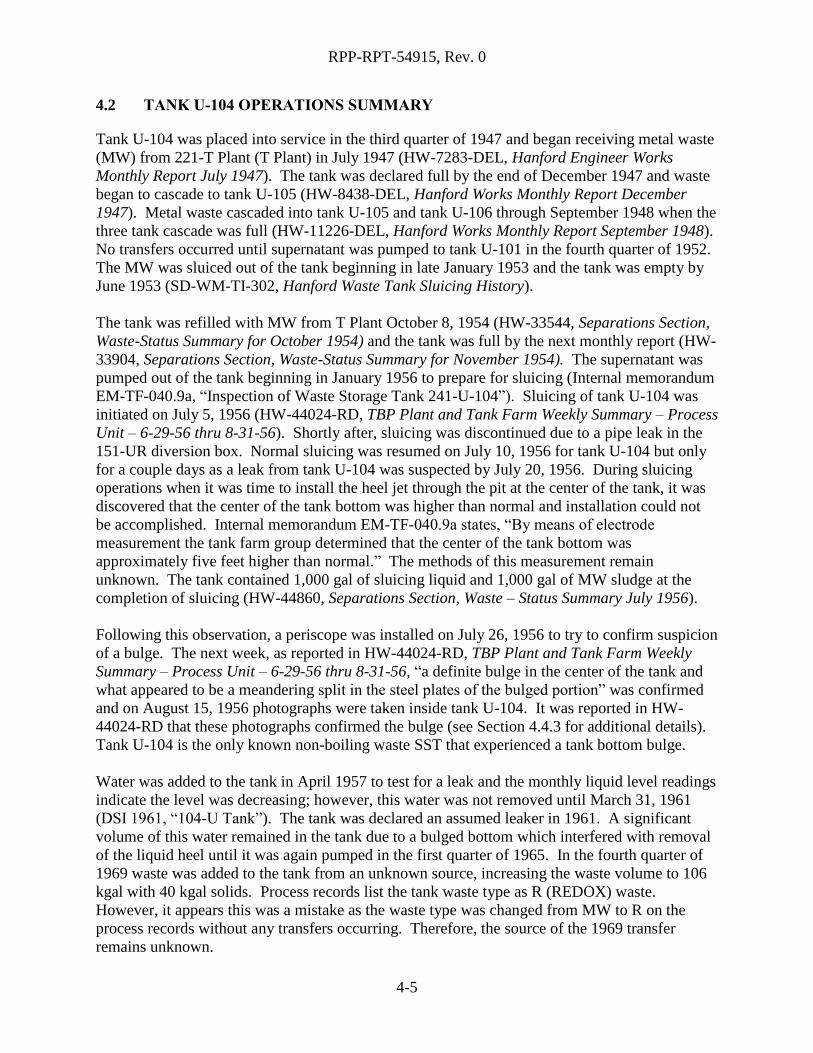
TANK U-104 OPERATIONS SUMMARY 4.2
Tank U-104 was placed into service in the third quarter of 1947 and began receiving metal waste
(MW) from 221-T Plant (T Plant) in July 1947 (HW-7283-DEL, Hanford Engineer Works
Monthly Report July 1947). The tank was declared full by the end of December 1947 and waste
began to cascade to tank U-105 (HW-8438-DEL, Hanford Works Monthly Report December
1947). Metal waste cascaded into tank U-105 and tank U-106 through September 1948 when the
three tank cascade was full (HW-11226-DEL, Hanford Works Monthly Report September 1948).
No transfers occurred until supernatant was pumped to tank U-101 in the fourth quarter of 1952.
The MW was sluiced out of the tank beginning in late January 1953 and the tank was empty by
June 1953 (SD-WM-TI-302, Hanford Waste Tank Sluicing History).
The tank was refilled with MW from T Plant October 8, 1954 (HW-33544, Separations Section,
Waste-Status Summary for October 1954) and the tank was full by the next monthly report (HW-
33904, Separations Section, Waste-Status Summary for November 1954). The supernatant was
pumped out of the tank beginning in January 1956 to prepare for sluicing (Internal memorandum
EM-TF-040.9a, “Inspection of Waste Storage Tank 241-U-104”). Sluicing of tank U-104 was
initiated on July 5, 1956 (HW-44024-RD, TBP Plant and Tank Farm Weekly Summary – Process
Unit – 6-29-56 thru 8-31-56). Shortly after, sluicing was discontinued due to a pipe leak in the
151-UR diversion box. Normal sluicing was resumed on July 10, 1956 for tank U-104 but only
for a couple days as a leak from tank U-104 was suspected by July 20, 1956. During sluicing
operations when it was time to install the heel jet through the pit at the center of the tank, it was
discovered that the center of the tank bottom was higher than normal and installation could not
be accomplished. Internal memorandum EM-TF-040.9a states, “By means of electrode
measurement the tank farm group determined that the center of the tank bottom was
approximately five feet higher than normal.” The methods of this measurement remain
unknown. The tank contained 1,000 gal of sluicing liquid and 1,000 gal of MW sludge at the
completion of sluicing (HW-44860, Separations Section, Waste – Status Summary July 1956).
Following this observation, a periscope was installed on July 26, 1956 to try to confirm suspicion
of a bulge. The next week, as reported in HW-44024-RD, TBP Plant and Tank Farm Weekly
Summary – Process Unit – 6-29-56 thru 8-31-56, “a definite bulge in the center of the tank and
what appeared to be a meandering split in the steel plates of the bulged portion” was confirmed
and on August 15, 1956 photographs were taken inside tank U-104. It was reported in HW-
44024-RD that these photographs confirmed the bulge (see Section 4.4.3 for additional details).
Tank U-104 is the only known non-boiling waste SST that experienced a tank bottom bulge.
Water was added to the tank in April 1957 to test for a leak and the monthly liquid level readings
indicate the level was decreasing; however, this water was not removed until March 31, 1961
(DSI 1961, “104-U Tank”). The tank was declared an assumed leaker in 1961. A significant
volume of this water remained in the tank due to a bulged bottom which interfered with removal
of the liquid heel until it was again pumped in the first quarter of 1965. In the fourth quarter of
1969 waste was added to the tank from an unknown source, increasing the waste volume to 106
kgal with 40 kgal solids. Process records list the tank waste type as R (REDOX) waste.
However, it appears this was a mistake as the waste type was changed from MW to R on the
process records without any transfers occurring. Therefore, the source of the 1969 transfer
remains unknown.

RPP-RPT-54915, Rev. 0
4-6
In May 1972, ~60 tons of diatomaceous earth (DE) was added to tank U-104 to absorb any
remaining free liquids (ARH-CD-222, Characterization of the Effects of Diatomaceous Earth
Additions to Hanford Wastes).
Tank U-104 was declared administratively interim stabilized in October 1978. As of February
28, 2013, tank U-104 contains 54 kgal of sludge (HNF-EP-0182). The estimated volume is
equivalent to approximately 31.6-in referenced to the tank center bottom.
The operational history of tank U-104 leak related details including liquid level is charted in
Figure 4-2.
RPP-RPT-54915, Rev. 0
4-7
Figure 4-2. Operational Leak History of Tank U-104

RPP-RPT-54915, Rev. 0
4-8
TANK DESIGN/CONSTRUCTION 4.3
4.3.1 Tank Design
The steel bottoms of the U Farm tanks intersect the sidewall on a 4-ft radius knuckle transition
(BPF-73550, Drawings D-2 and D-3). The rounded knuckle transition, the three-ply asphaltic
membrane waterproofing between the liner and the concrete, a notched footing construction
joint, and the concrete shell are features common to all U Farm tanks (see Section 3.1.1).
4.3.2 Tank Construction Conditions
The U Farm tanks were constructed between February 1944 and October 1944. Temperatures
are not available for 1944 between May 18 and December 1. From the start of U Farm tank
construction through May 18, 1944 there were two minimum temperatures of 12F with daytime
temperatures of 44F and 57F, one at 18F, and four at 20F with day time temperatures
between 41F and 56F.
As described in Section 3.1.2, cold weather affects the ductile-to-brittle steel transition
temperature, with 18°F being the assumed design temperature for the carbon steel liner, which
could result in a fracture upon impact. However, in general, the temperatures during the U Farm
construction time frame were much milder than those experienced during 241-SX Farm
construction where ductile-to-brittle steel transition temperatures were exceeded.
Design, fabrication, and erection of the tank steel lining were required to be in accordance with
current “Standard Specifications for Elevated Steel Water Tanks, Standpipes and Reservoirs” as
promulgated by the “American Water Works Association” (BPF 73550). Welding requirements
were required to conform to the American Welding Society’s “Code for Arc and Gas Welding in
Building Construction”, Section 4.
TANK U-104 IN-TANK DATA 4.4
4.4.1 Liquid Level
The liquid level plot in Figure 4-3 indicates the transfer activity into and out of tank U-104. The
liquid levels are end of quarter levels so this figure may not reflect all transfers into and out of
the tank that occurred during the operational history. See Figure 4-2 for historical monthly liquid
level readings.

RPP-RPT-54915, Rev. 0
4-9
Figure 4-3. Tank U-104 End of Quarter Surface Level
WHC-SD-WM-ER-325, Rev. 0, 1994, Supporting Document for the SW Quadrant Historical Tank Content Estimate for U-Tank
Farm.
Tank U-104 was first suspected of leaking during sluicing operations of the MW sludge in July
1956 (HW-44024-RD). During this time there were no reports indicating an unknown decrease
in the liquid level; however, a tank liner bulge was suspected. In-tank photographs and a
periscope confirmed a liner bulge in tank U-104 (see Section 4.4.3).
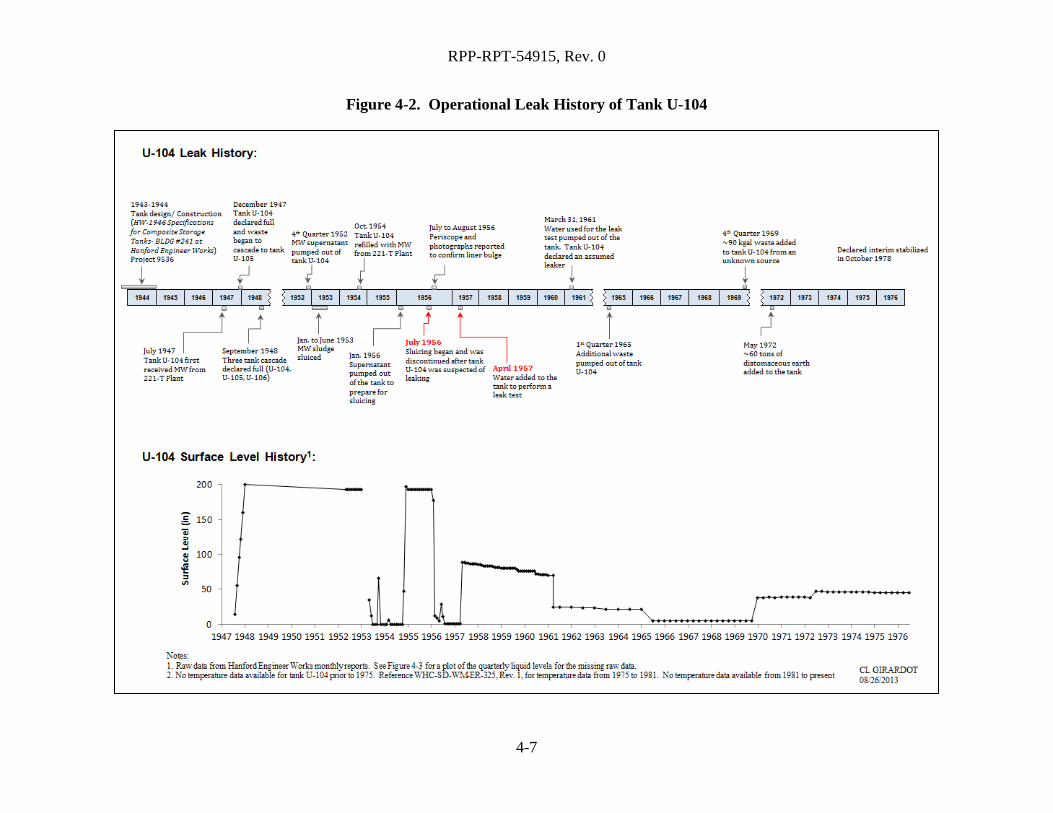
In April 1957, approximately 242 kgal of water was added to the tank (on top of the 2 kgal of
waste) to perform a leak test. The liquid level decreased from 244 kgal reported at the end of
April 1957 to 194 kgal reported on March 23, 1961 (DSI 1961) a potential loss of 50 kgal at a
leak rate of approximately 35 gal/day over the four year span. No recorded liquid level decrease
observations were recovered between the report of the liner bulge in July 1956 and the addition
of the water for a leak test in April 1957. It remains unknown why the leak test lasted for a
period of about four years and why the tank contents were not pumped out as the liquid level was
decreasing. However, there are several periods where the liquid level remained unchanged for
several months as shown in Figure 4-4. Tank U-104 was the first tank suspected of leaking and
the first suspected of having a bulged liner (ARH-R-43, Rev. 2, Management of Radioactive
Wastes Stored in Underground Tanks at Hanford).
RPP-RPT-54915, Rev. 0
4-10
Figure 4-4. Tank U-104 Liquid Level April 1957 through March 1961
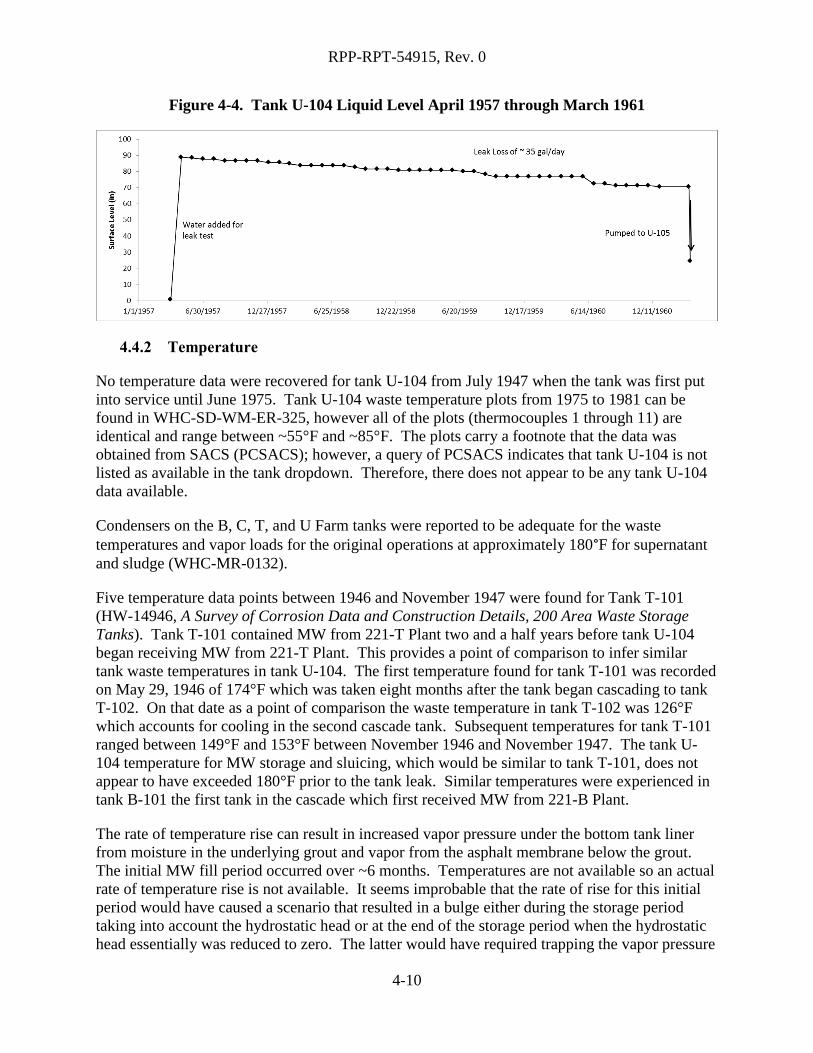
4.4.2 Temperature
No temperature data were recovered for tank U-104 from July 1947 when the tank was first put
into service until June 1975. Tank U-104 waste temperature plots from 1975 to 1981 can be
found in WHC-SD-WM-ER-325, however all of the plots (thermocouples 1 through 11) are
identical and range between ~55°F and ~85°F. The plots carry a footnote that the data was
obtained from SACS (PCSACS); however, a query of PCSACS indicates that tank U-104 is not
listed as available in the tank dropdown. Therefore, there does not appear to be any tank U-104
data available.
Condensers on the B, C, T, and U Farm tanks were reported to be adequate for the waste
temperatures and vapor loads for the original operations at approximately 180°F for supernatant
and sludge (WHC-MR-0132).
Five temperature data points between 1946 and November 1947 were found for Tank T-101
(HW-14946, A Survey of Corrosion Data and Construction Details, 200 Area Waste Storage
Tanks). Tank T-101 contained MW from 221-T Plant two and a half years before tank U-104
began receiving MW from 221-T Plant. This provides a point of comparison to infer similar
tank waste temperatures in tank U-104. The first temperature found for tank T-101 was recorded
on May 29, 1946 of 174°F which was taken eight months after the tank began cascading to tank
T-102. On that date as a point of comparison the waste temperature in tank T-102 was 126°F
which accounts for cooling in the second cascade tank. Subsequent temperatures for tank T-101
ranged between 149°F and 153°F between November 1946 and November 1947. The tank U-
104 temperature for MW storage and sluicing, which would be similar to tank T-101, does not
appear to have exceeded 180°F prior to the tank leak. Similar temperatures were experienced in
tank B-101 the first tank in the cascade which first received MW from 221-B Plant.
The rate of temperature rise can result in increased vapor pressure under the bottom tank liner
from moisture in the underlying grout and vapor from the asphalt membrane below the grout.
The initial MW fill period occurred over ~6 months. Temperatures are not available so an actual
rate of temperature rise is not available. It seems improbable that the rate of rise for this initial
period would have caused a scenario that resulted in a bulge either during the storage period
taking into account the hydrostatic head or at the end of the storage period when the hydrostatic
head essentially was reduced to zero. The latter would have required trapping the vapor pressure

RPP-RPT-54915, Rev. 0
4-11
under the liner for the more than 5 year storage period. There were no reports of bulging at the
end of sluicing the initial MW when a heel jet would have been installed in the center riser to
decrease the waste to the 2,000 gal volume. The second MW fill period occurred over less than
two months which could have resulted in a higher temperature rate of rise, considering cooling of
the empty tank over the preceding year when the tank was empty. There may have been some
mechanism where small fissures in the liner allowed moisture to collect below the liner,
somehow trapping the vapor during the yearlong storage period resulting in bulging the bottom
liner when the tank was emptied, July 1956.
4.4.3 Liner Observations
A bulge in a tank liner may result in the direct failure of the liner or cause enough stress or
thinning on the steel liner plates and welds that they become more susceptible to the effects of
corrosion. Experience indicates that bulging tends to be a dynamic phenomenon, and it is
possible that a tank with no measured bulge at one point in time may actually have had a
displaced liner that was not detected at another time.
The tank U-104 MW sludge sluicing was halted after a failed installation of the heel jet through
the pit at the center of the tank. It was determined by measurement that the center of the tank
bottom was approximately 5-ft higher than normal (HW-45115 H, Separations Technology
Section Monthly Report – August, 1956, page Fc-15) and thus, tank U-104 was suspected of
leaking. A periscope was installed in the tank on July 26, 1956 for inspection which confirmed a
liner bulge (HW-44024-RD; EM-TF-040.9a). A light assembly was installed in the tank the
following week to permit better visibility and HW-44024-RD reported, “Subsequent inspections
of the tank revealed a definite bulge in the center of the tank and what appeared to be a split in
the steel plates of the bulged portion.” Tank U-104 was the only known non-boiling waste SST
that experienced a tank bottom bulge during this time (see Appendix A1).
Photographs were reported to be taken of the interior of tank U-104 on August 15, 1956 (HW-
44024-RD), and photographs confirmed the liner bulge (HW-45115 H, page Fc-15). However,
the photographs did not indicate rupture of the liner although about half of the tank surface was
covered with liquid (see Section 4.4.5). One of the retrieved photographs, Figure 4-5, seems to
show the 5-ft bulged bottom liner with waste around upper quadrant.

RPP-RPT-54915, Rev. 0
4-12
Figure 4-5. Tank U-104 Bulged Bottom Liner August 15, 1956
(Photograph 5BN1D0021185)
RPP-RPT-54915, Rev. 0
4-13
4.4.4 Chemistry-Corrosion
Tank U-104 began receiving waste in July 1947 and test water as shown in Table 4-1. The
typical concentration for nitrite, nitrate, and hydroxide for MW waste is shown in Table 4-2.
Nitrite and hydroxide are known as nitrate induced SCC inhibitors. One key characteristic for
inhibiting SCC is to maintain a high nitrite concentration to nitrate concentration ratio (see
Section 3.2.4).
Table 4-1. Tank U-104 Waste Storage Chronology
Date Waste Type Length of Storage
July 1947 to July 1956 MW ~ 8 years
April 1957 to March 1961 Water ~ 4 years
Table 4-2. Waste Chemistries for Waste Types Stored in Tank U-104
Waste Type [NO3-]
[NO2-]
[OH-] Meets Current DST
Specification2
MW1
0.59 Not reported 1.16 Yes3
1. Reference WHC-EP-0449, 1991, The Sort on Radioactive Waste Type Model: A Method to Sort Single-Shell Tanks into
Characteristic Groups.
2. Reference OSD-T-151-00007, Rev. 12, 2013, Operating Specification for the Double-Shell Storage Tanks.
3. Even with no reported value for nitrite, the ratio of nitrate to nitrite and hydroxide would still be less than 2.5 as stated in
the current DST specification.
Metal waste should not be a concern for either pitting or SCC under the tank U-104 conditions.
4.4.5 Photographs
Photographs were reported to be taken of the interior of tank U-104 on August 15, 1956 that
confirmed a liner bulge (see Section 4.4.3). One of the retrieved photographs seems to show the
bulged bottom liner. The next set of available photographs for tank U-104 was dated November
14, 1967. These photographs focused on the tank sidewall so a view of the waste surface was
not available. These were the only sets of photographs taken prior to the addition of
diatomaceous earth in May 1972 that could be located. No other anomalies were indicated from
a review of available tank U-104 photographs.
TANK U-104 EX-TANK DATA 4.5
4.5.1 Drywells
There are six drywells located around tank U-104: 60-04-03, 60-07-11, 60-04-08, 60-04-10, and
60-04-12, installed in 1974, and 60-07-01, installed in 1976 in addition to two direct pushes
installed in 2007. All of the radiation readings in drywells are assumed to be maximum or peak
readings unless otherwise noted (see Section 3.3.2). The following subsections report the
available drywell information and the drywell summary section provides the analyses of the
associated drywells with tank U-104.
RPP-RPT-54915, Rev. 0
4-14
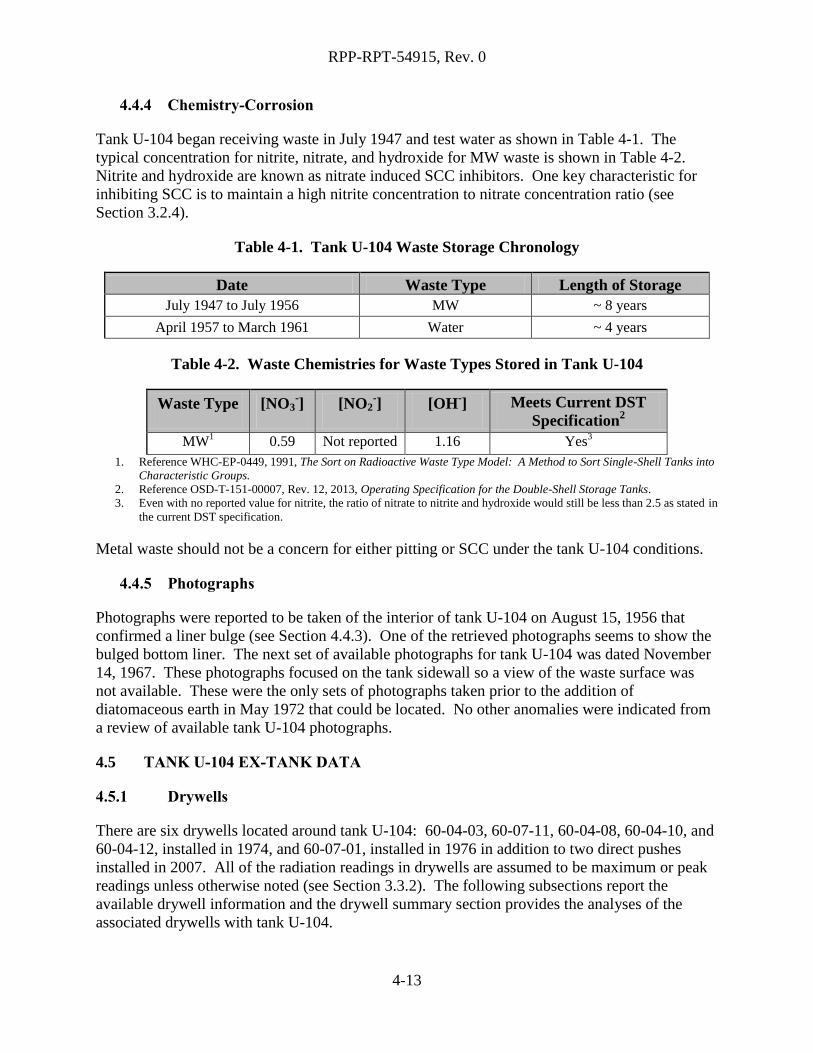
4.5.1.1 Drywell 60-04-03
Drywell 60-04-03 is located approximately 2.2-ft from the tank U-104 footing. Drywell 60-04-
03 was drilled in 1974 with the first recoverable reading on October 4, 1974 reported as less than
values (see Appendix B1). Readings continued to be reported as less than values through June
1986.
In July 1996, Cs-137 was the only man-made radionuclide detected in this drywell (GJ-HAN-33,
Vadose Zone Characterization Project at the Hanford Tank Farms Tank Summary Data Report
for Tank U-104). From the ground surface to 10-ft BGS, Cs-137 was detected continuously,
intermittently from 10 to 15-ft BGS, at a few isolated locations, and at the bottom of the drywell.
The maximum Cs-137 concentration was approximately 0.8 pCi/g at 3-ft BGS. Document GJ-
HAN-33 reports, “The Cs-137 contamination resulted from a surface spill or leak from ancillary
piping that migrated downward.”
Since historical radioactivity in this drywell is very low, and GJ-HAN-33 reported low levels of
radioactivity, drywell 60-04-03 is not being included as part of the leak location for tank U-104.
Figure 4-6 shows the depths of radioactivity from 1975 to 1995 (RPP-7729, Analysis &
Summary Report of Historical Drywell Gamma Logs for 241-U Tank Farm - 200 West).
Figure 4-6. Tank U-104 Drywell 60-04-03 (RPP-7729)
Note: Bottom of the tank footing is ~38-ft 4-in BGS
RPP-RPT-54915, Rev. 0
4-15
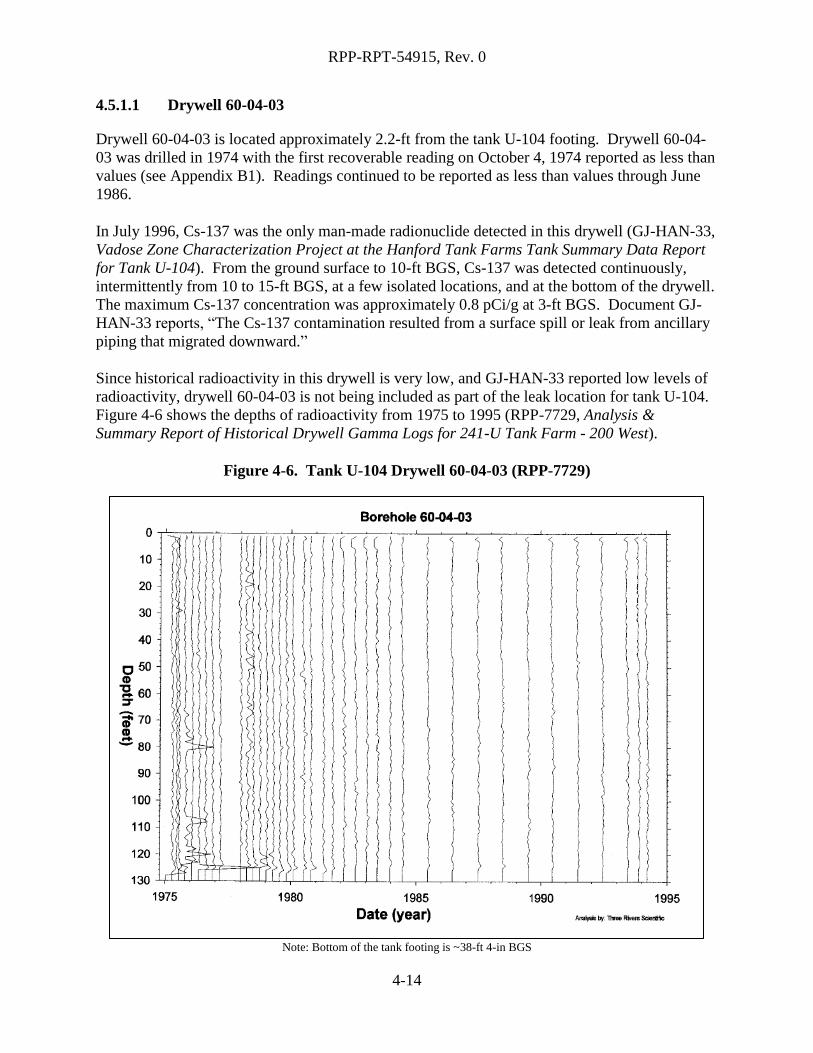
4.5.1.2 Drywell 60-07-01
Drywell 60-07-01 is located approximately 15.7-ft from the tank U-104 footing. Drywell 60-07-
01 was drilled in 1976 with the first recoverable reading on May 12, 1976 with a peak 13-ft
below the bottom base of the tank of 4K cpm at 51-ft BGS (see Appendix B1). Radioactivity
levels remained relatively stable at this BGS depth through November 1986.
In July 1996, Cs-137 and processed U-235 and U-238 (or from waste associated with processed
uranium fuel materials) were the only man-made radionuclides detected in drywell 60-07-01
(GJ-HAN-33). From the ground surface to 14-ft BGS, Cs-137 contamination was detected
intermittently. The maximum concentration of 9 pCi/g was reported at 0.5-ft BGS which was
the result of a surface spill or leak from ancillary piping (GJ-HAN-33).
Processed U-235 was detected continuously from 52 to 57-ft BGS, 73 to 77-ft BGS,
intermittently between these two zones, and slightly below the lower zone. The maximum
concentration of 9 pCi/g was measured at a depth of 55-ft BGS, 17-ft below the base of the tank.
Processed U-238 was measured between 52 and 56-ft BGS at concentrations ranging between
100 and 200 pCi/g. Document GJ-HAN-33 states, “The processed U-235 and U-238
contamination most likely resulted from leakage from tank U-104.” Figure 4-7 shows the depths
of radioactivity from 1975 to 1995 (RPP-7729).
Figure 4-7. Tank U-104 Drywell 60-07-01 (RPP-7729)
Note: Bottom of the tank footing is ~38-ft 4-in BGS

RPP-RPT-54915, Rev. 0
4-16
4.5.1.3 Drywell 60-07-11
Drywell 60-07-11 is located approximately 15.7-ft from the tank U-104 footing. Drywell 60-07-
11 was drilled in 1974 with the first recoverable readings reported on June 4, 1974 with a peak
12-ft below the bottom base of the tank of 73.8K cpm at 50-ft BGS (see Appendix B1). The next
recoverable reading on July 18, 1974 reported a peak at 15.2K cpm at 53-ft BGS. Readings
remained relatively stable through November 1986 at this BGS depth.
In July 1996, Cs-137 and processed U-235 and U-238 were the only man-made radionuclides
detected in drywell 60-07-11 (GJ-HAN-33). Cs-137 was detected continuously from the ground
surface to 8-ft BGS, from 13 to 17-ft BGS, at a few isolated locations, and at the bottom of the
drywell. The maximum Cs-137 concentration of approximately 20 pCi/g was detected at 1-ft
BGS which resulted from a surface or near-surface spill, leak from piping that migrated
downward, and/or was carried down when the drywell was drilled (GJ-HAN-33). Processed U-
235 was detected from 52 to 82-ft BGS and from 83 to 93-ft BGS with the maximum
concentration of 80 pCi/g measured at 53-ft BGS, 15-ft below the base of the tank.
Processed U-238 was detected at depths from 52 to 69-ft, from 70 to 82-ft, and from 83 to 93-ft
BGS. The maximum U-238 concentration of more than 1,000 pCi/g was measured at 53-ft BGS.
Document GJ-HAN-33 reported, “The processed U-235 and U-238 contamination most likely
resulted from leakage from tank U-104.” Figure 4-8 shows the depths of radioactivity from 1975
to 1995 (RPP-7729).
Figure 4-8. Tank U-104 Drywell 60-07-11 (RPP-7729)
Note: Bottom of the tank footing is ~38-ft 4-in BGS
RPP-RPT-54915, Rev. 0
4-17
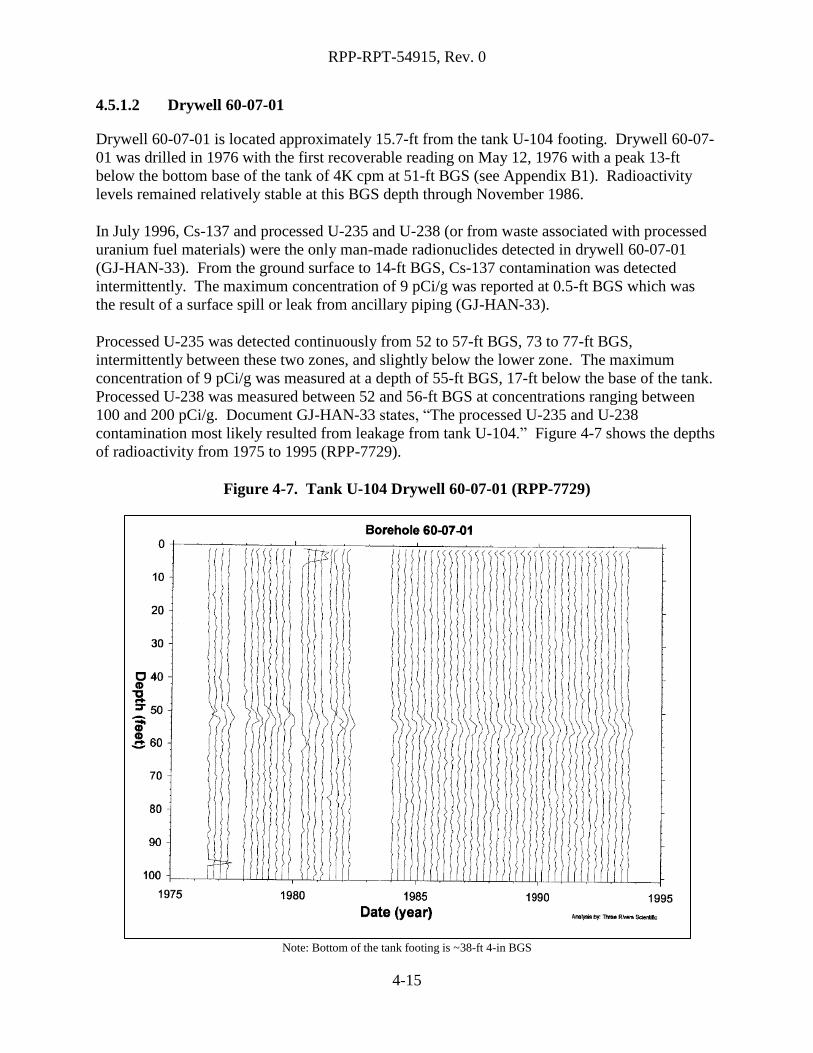
4.5.1.4 Drywell 60-04-08
Drywell 60-04-08 is located approximately 5.2-ft from the tank U-104 footing. Drywell 60-04-
08 was drilled in 1974 with the first recoverable reading on June 4, 1974 with a peak 15-ft below
the bottom base of the tank of 70.8K cpm at 53-ft BGS (see Appendix B1). The next reading
reported on July 1, 1974 reported the peak at 17.8K cpm at 49-ft BGS. Radioactivity remained
relatively stable at this BGS depth through September 1986.
In July 1996, Cs-137 and processed U-235 and U-238 were the only man-made radionuclides
detected in drywell 60-04-08 (GJ-HAN-33). Continuous Cs-137 contamination was detected
from the ground surface to 22-ft BGS with the maximum concentration of 8 pCi/g measured at 2-
ft BGS which resulted from a surface or near-surface spill, leak from piping that migrated
downward, and/or was carried down when the drywell was drilled (GJ-HAN-33).
Processed U-235 was detected from 53 to 65-ft BGS and from 70 to 76-ft BGS with the
maximum U-235 concentration of approximately 20 pCi/g reported at 53-ft BGS. Processed U-
238 was detected from 53 to 65-ft BGS, from 68 to 78-ft BGS, and at a few isolated locations.
The maximum U-238 concentration of 500 pCi/g was measured at 53-ft BGS, 15-ft below the
base of the tank. Document GJ-HAN-33 reports, “The processed U-235 and U-238
contamination most likely resulted from leakage from tank U-104.” Figure 4-9 shows the depths
of radioactivity from 1975 to 1995 (RPP-7729).
Figure 4-9. Tank U-104 Drywell 60-04-08 (RPP-7729)
Note: Bottom of the tank footing is ~38-ft 4-in BGS
RPP-RPT-54915, Rev. 0
4-18
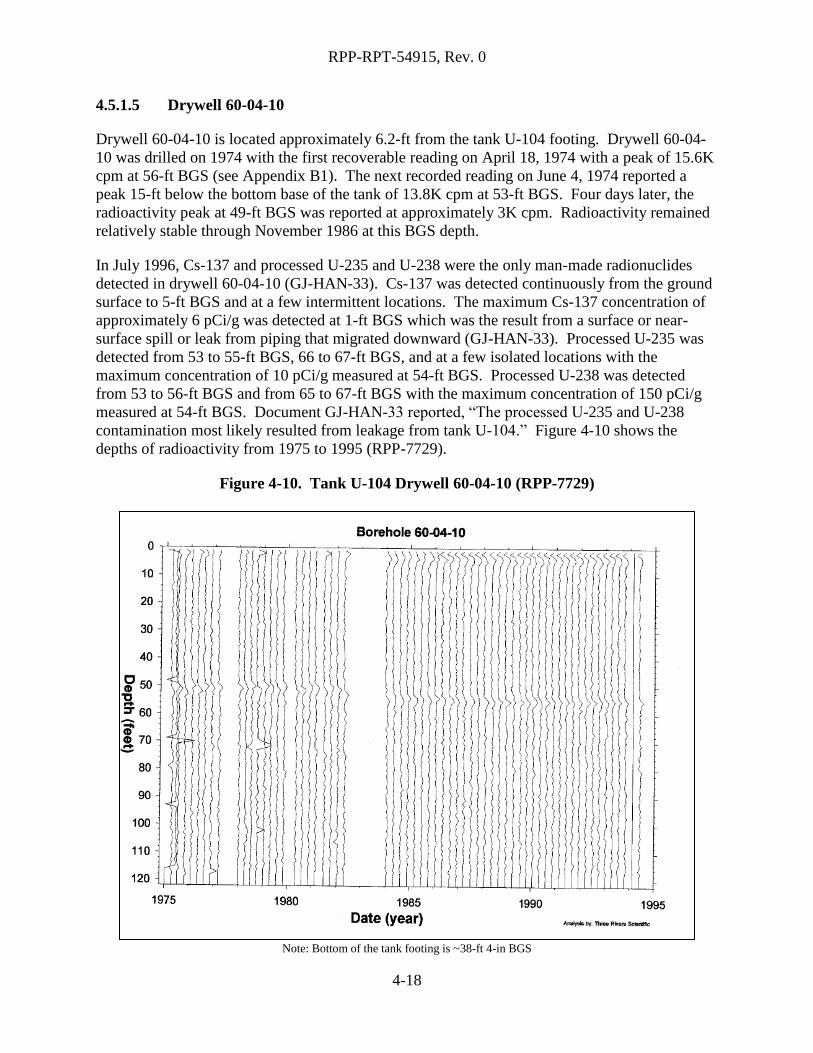
4.5.1.5 Drywell 60-04-10
Drywell 60-04-10 is located approximately 6.2-ft from the tank U-104 footing. Drywell 60-04-
10 was drilled on 1974 with the first recoverable reading on April 18, 1974 with a peak of 15.6K
cpm at 56-ft BGS (see Appendix B1). The next recorded reading on June 4, 1974 reported a
peak 15-ft below the bottom base of the tank of 13.8K cpm at 53-ft BGS. Four days later, the
radioactivity peak at 49-ft BGS was reported at approximately 3K cpm. Radioactivity remained
relatively stable through November 1986 at this BGS depth.
In July 1996, Cs-137 and processed U-235 and U-238 were the only man-made radionuclides
detected in drywell 60-04-10 (GJ-HAN-33). Cs-137 was detected continuously from the ground
surface to 5-ft BGS and at a few intermittent locations. The maximum Cs-137 concentration of
approximately 6 pCi/g was detected at 1-ft BGS which was the result from a surface or near-
surface spill or leak from piping that migrated downward (GJ-HAN-33). Processed U-235 was
detected from 53 to 55-ft BGS, 66 to 67-ft BGS, and at a few isolated locations with the
maximum concentration of 10 pCi/g measured at 54-ft BGS. Processed U-238 was detected
from 53 to 56-ft BGS and from 65 to 67-ft BGS with the maximum concentration of 150 pCi/g
measured at 54-ft BGS. Document GJ-HAN-33 reported, “The processed U-235 and U-238
contamination most likely resulted from leakage from tank U-104.” Figure 4-10 shows the
depths of radioactivity from 1975 to 1995 (RPP-7729).
Figure 4-10. Tank U-104 Drywell 60-04-10 (RPP-7729)
Note: Bottom of the tank footing is ~38-ft 4-in BGS

RPP-RPT-54915, Rev. 0
4-19
4.5.1.6 Drywell 60-04-12
Drywell 60-04-12 is located approximately 6.6-ft from the tank U-104 footing. Drywell 60-04-
12 was drilled in 1974 with the first recoverable reading on April 18, 1974 reported as less than
values (see Appendix B1). Readings continued to be reported as less than values through June
1986.
In July 1996, Cs-137 was the only man-made radionuclides detected in drywell 60-04-12 (GJ-
HAN-33). Cs-137 was detected continuously from the ground surface to 18-ft BGS,
intermittently from 24 to 31-ft BGS, at a few isolated locations, and at the bottom of the drywell.
The maximum Cs-137 concentration of 4 pCi/g was detected at a depth of 9-ft BGS. Document
GJ-HAN-33 reports, “This contamination resulted from a surface or near-surface spill or leak
that migrated downward.” Since historical radioactivity in this drywell is very low, and the 1996
SGLS report low levels of radioactivity, drywell 60-04-12 is not being included as part of the
leak location for tank U-104. Figure 4-11 shows the depths of radioactivity from 1975 to 1995
(RPP-7729).
Figure 4-11. Tank U-104 Drywell 60-04-12 (RPP-7729)
Note: Bottom of the tank footing is ~38-ft 4-in BGS

RPP-RPT-54915, Rev. 0
4-20
4.5.1.7 2007 Direct Pushes
In 2007, two direct pushes (C5593 and C5601) were installed near tank U-104 for spectral
gamma logging (see Figure 4-1).
Results identified Cs-137 as the dominant gamma emitting radionuclide in direct push C5593
with a maximum equivalent Cs-137 concentration of 150 pCi/g detected at 24-ft BGS (RPP-
36007, Rev. 0, Small Diameter Geophysical Logging in the 241-U Tank Farm). This appears to
be a separate unrelated leak site from the earlier drywell data due to timing and depth and may be
associated with a pipeline leak. The source does not appear to be from tank U-104 as only low-
level radioactivity was detected in nearby drywells 60-04-12 and 60-04-03. However, a tank U-
104 leak cannot be ruled out.
The maximum Cs-137 concentration detected in direct push C5601 was 24 pCi/g at 52-ft BGS
(RPP-36007, Rev. 0). Radioactivity detected in this direct push appears to be related to the
drywell radioactivity detected in the southern portion of the tank in 1974 due to the similar
depths where maximum concentrations were recorded.
4.5.1.8 Drywell Summary
Tank U-104 was first suspected of leaking during sluicing operations in July 1956 (see Section
4.4.1). Drywells were not installed near tank U-104 until 1974.
Tank U-104 drywells 60-04-03 and 60-04-12 do not indicate any radioactivity associated with a
tank U-104 leak. Therefore, these drywells are not included in the leak location for tank U-104.
The first recoverable readings in 1974-1976 for drywells 60-04-08, 60-04-10, 60-07-01, and 60-
07-11 indicate radioactivity. A peak was reported in drywells 60-07-11 and 60-04-08 at around
the same intensity (~70K cpm) and similar depths (~50-ft BGS). Radioactivity peaks of much
lower intensity was reported in drywell 60-07-01 (4K cpm at 51-ft BGS) and drywell 60-04-10
(15.6K cpm at 56-ft BGS). Uranium reported in these four drywells (GJ-HAN-33) appears to be
associated with a tank U-104 leak. Direct push C5601, installed in 2007, reports Cs-137 at a
similar depth (52-ft BGS). It appears the source of the uranium detected in these four drywells
and possibly the Cs-137 detected in direct push C5601 is from tank U-104.
Direct push C5593, installed in 2007, reports maximum radioactivity (150 pCi/g equivalent Cs-
137) detected at 24-ft BGS. The source does not appear to be from tank U-104 as very little
radioactivity was reported in nearby drywells 60-04-03 and 60-04-12 and may be associated with
a pipeline leak. In addition the radioactive profile doesn’t fit the profile of the radioactivity in
the other drywells, however, a tank U-104 leak source cannot be ruled out. No laterals were
installed near tank U-104.
POSSIBLE TANK U-104 LINER LEAK LOCATION(S) 4.6
A liner leak may have penetrated the waterproof membrane at any location or pooled on the
waterproof membrane and followed concrete cracks or construction joints to a different location
for egress to the soil, including the top of the tank footing.
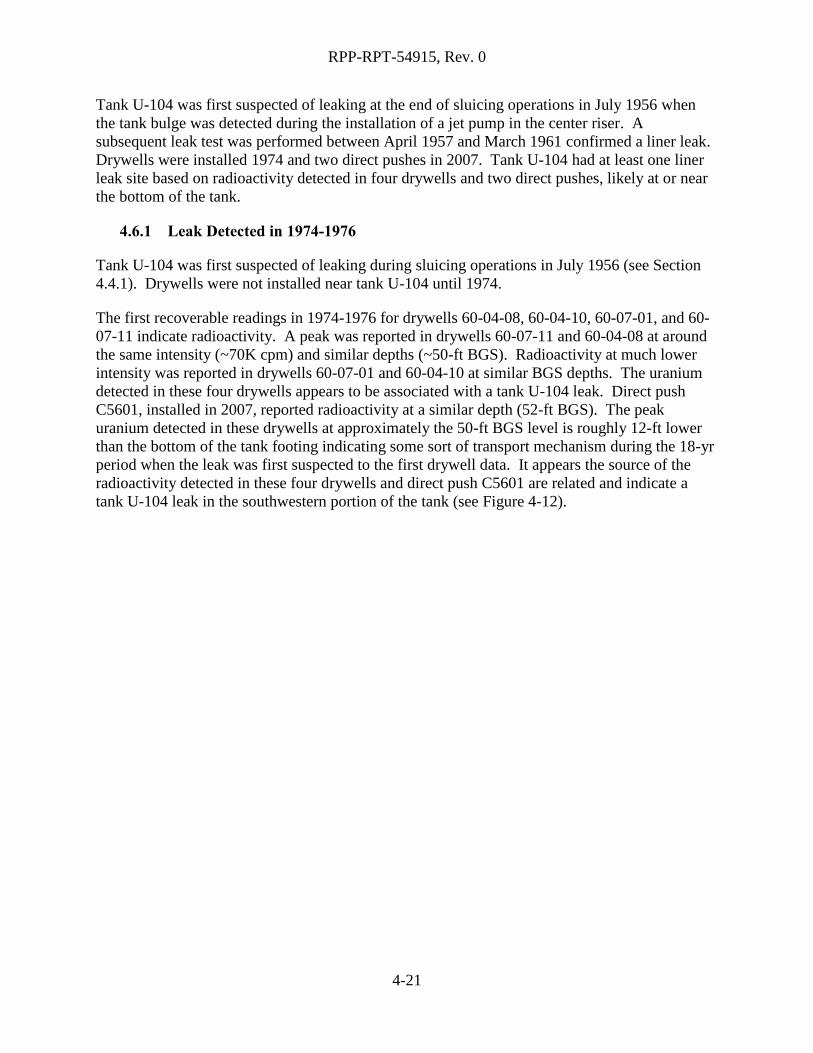
RPP-RPT-54915, Rev. 0
4-21
Tank U-104 was first suspected of leaking at the end of sluicing operations in July 1956 when
the tank bulge was detected during the installation of a jet pump in the center riser. A
subsequent leak test was performed between April 1957 and March 1961 confirmed a liner leak.
Drywells were installed 1974 and two direct pushes in 2007. Tank U-104 had at least one liner
leak site based on radioactivity detected in four drywells and two direct pushes, likely at or near
the bottom of the tank.
4.6.1 Leak Detected in 1974-1976
Tank U-104 was first suspected of leaking during sluicing operations in July 1956 (see Section
4.4.1). Drywells were not installed near tank U-104 until 1974.
The first recoverable readings in 1974-1976 for drywells 60-04-08, 60-04-10, 60-07-01, and 60-
07-11 indicate radioactivity. A peak was reported in drywells 60-07-11 and 60-04-08 at around
the same intensity (~70K cpm) and similar depths (~50-ft BGS). Radioactivity at much lower
intensity was reported in drywells 60-07-01 and 60-04-10 at similar BGS depths. The uranium
detected in these four drywells appears to be associated with a tank U-104 leak. Direct push
C5601, installed in 2007, reported radioactivity at a similar depth (52-ft BGS). The peak
uranium detected in these drywells at approximately the 50-ft BGS level is roughly 12-ft lower
than the bottom of the tank footing indicating some sort of transport mechanism during the 18-yr
period when the leak was first suspected to the first drywell data. It appears the source of the
radioactivity detected in these four drywells and direct push C5601 are related and indicate a
tank U-104 leak in the southwestern portion of the tank (see Figure 4-12).
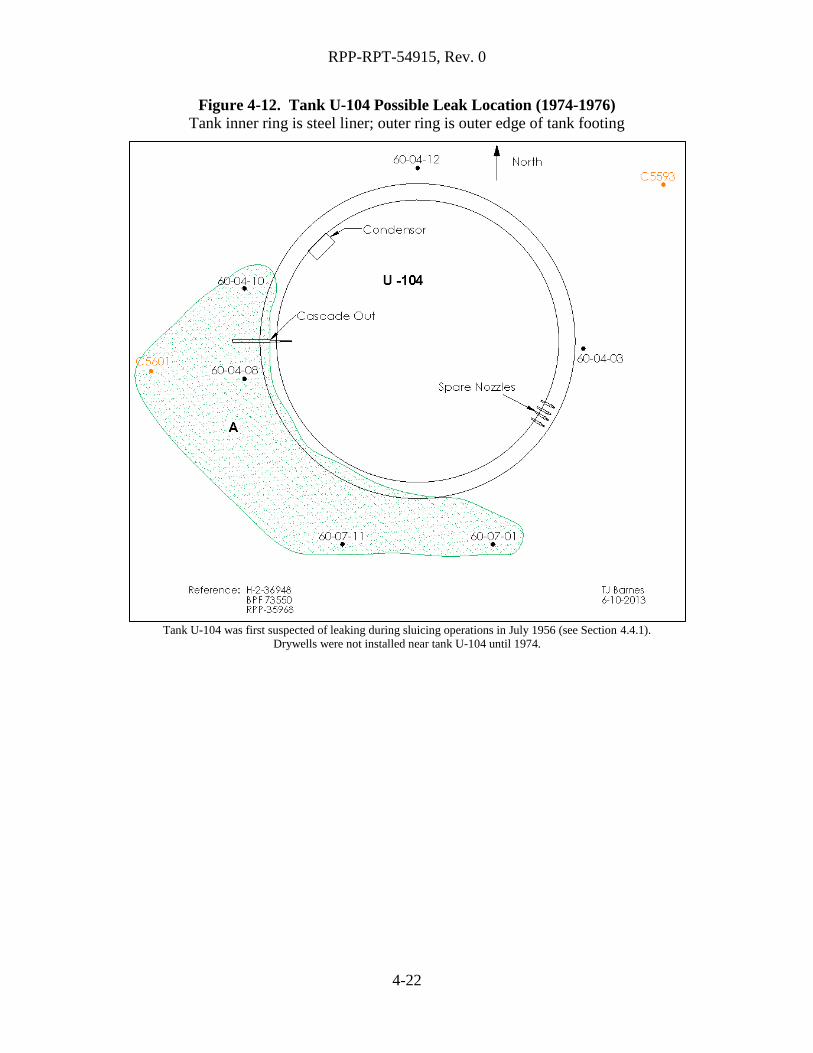
RPP-RPT-54915, Rev. 0
4-22
Figure 4-12. Tank U-104 Possible Leak Location (1974-1976)
Tank inner ring is steel liner; outer ring is outer edge of tank footing
Tank U-104 was first suspected of leaking during sluicing operations in July 1956 (see Section 4.4.1).
Drywells were not installed near tank U-104 until 1974.
RPP-RPT-54915, Rev. 0
4-23
4.6.2 Leak Detected in 2007
Direct push C5593, installed in 2007, reports maximum radioactivity (150 pCi/g equivalent Cs-
137) detected at 24-ft BGS (see Figure 4-13). The source may be associated with a pipeline leak
as it does not appear to be from tank U-104 since very little radioactivity was reported in nearby
drywells 60-04-03 and 60-04-12 and radioactivity reported in this direct push was located at a
much higher BGS level compared to site A in Figure 4-12. The source of this radioactivity
remains unknown; however, a tank U-104 leak source cannot be ruled out.
Figure 4-13. Tank U-104 Possible Leak Location (2007)
Tank inner ring is steel liner; outer ring is outer edge of tank footing
Tank U-104 was first suspected of leaking during sluicing operations in July 1956 (see Section 4.4.1).
Drywells were not installed near tank U-104 until 1974.

RPP-RPT-54915, Rev. 0
4-24
4.6.3 Leak Location Summary
Tank U-104 was first suspected of leaking during sluicing operations in July 1956. A leak test
was conducted from April 1957 through March 1961 where a volume of approximately 50 kgal
was lost (see Section 4.4.1). During this time, no drywells were installed around tank U-104 to
confirm a liner leak.
The first recoverable readings in 1974-1976 for drywells 60-04-08, 60-04-10, 60-07-01, and 60-
07-11 indicate radioactivity at a depth ranging from 50-56-ft BGS. Gross gamma activity was
higher in drywells 60-07-11 and 60-04-08 indicating the leak was closer to these drywells.
Direct push C5601, installed in 2007, reports radioactivity at a similar depth (52-ft BGS). The
peak uranium detected in these drywells starting at approximately the 50-ft BGS level is roughly
12-ft lower than the bottom of the tank footing indicating some sort of transport mechanism
during the 18-yr period when the leak was first suspected to the first drywell data. It appears the
source of the radioactivity detected in these four drywells and direct push C5601 are related and
indicate a tank U-104 leak in the southwestern portion of the tank (see site A in Figure 4-14).
Direct push C5593, installed in 2007, reports maximum radioactivity (150 pCi/g equivalent Cs-
137) detected at 24-ft BGS (see site B in Figure 4-14). The source may be associated with a
pipeline leak as it does not appear to be from tank U-104 since very little radioactivity was
reported in nearby drywells 60-04-03 and 60-04-12. The source of this radioactivity is unknown,
therefore a tank U-104 leak source cannot be ruled out.
Leak locations in Figure 4-14 are based on peak readings and are a representation of possible
initial boundaries of radioactivity.
Tank U-104 was reported to have bulged after a failed installation of the heel jet through the pit
at the center of the tank during sluicing operations in July 1956. It was determined that the
center of the tank bottom was ~5-ft higher than normal (see Section 4-11). Photographs were
taken of the interior of tank U-104 on August 15, 1956 which confirmed the liner bulge (see
Section 4.4.5).

RPP-RPT-54915, Rev. 0
4-25
Figure 4-14. Tank U-104 Possible Radial Leak Locations
Tank inner ring is steel liner, outer ring is outer edge of tank footing

RPP-RPT-54915, Rev. 0
4-26
POSSIBLE TANK U-104 LINER LEAK CAUSE(S) 4.7
Tank U-104 was evaluated for five conditions known to contribute to a failed liner.
4.7.1 Tank Design
The U Farm tank design does not appear to be a factor contributing to a failed liner (see Section
3.1.1).
4.7.2 Thermal Conditions
No temperature data are available for tank U-104, however, tank U-104 held only non-boiling
waste. Thermal shock creates stress both from rapid temperature rise as well as waste-induced
high temperatures. Since no records are available, it is uncertain what the maximum temperature
was in tank U-104 during operation as well as the rate of temperature rise when waste was
added. The thermal attributes of the waste and other information (see Section 4.4.2) would
indicate that thermal stresses were likely minimal and should not have challenged the tank
storage limits. However, the rate of temperature rise could have resulted in vapor pressure under
the liner overcoming the hydrostatic pressure.
Temperature requirements in ARH-951 issued December 18, 1969 indicated that tank
temperatures should be held below 230°F.
4.7.3 Chemistry-Corrosion
Tank U-104 stored MW for ~8 years before the liner leak. Metal waste should not have resulted
in pitting or SCC under tank U-104 conditions.
4.7.4 Liner Observations
Tank U-104 was the first SST reported to have a liner bulge (July 1956) after a failed attempt to
install a heel jet through the pit at the center of the tank during sluicing operations. Confirmation
of the possible 5-ft liner bulge was reported in multiple documents (see Sections 4.4.3 and 4.4.5).
A review of available photographs appears to confirm liner bulging reports. The tank had stored
and sluiced MW twice up to a total of eight years prior to the discovery of the bulge.
Liner bulging coupled with other tank conditions could affect tank liner integrity, however, by
itself bulging induces stresses that can cause breaching of the tank liner (see Section 3.2.3).
4.7.5 Tank Construction Temperature
The U Farm tank liners were constructed between February 1944 and October 1944. Only
isolated minimum temperatures were experienced during tank construction at or below 18F with
day time temperatures between 44F and 57F (see Section 4.3.2). Impact occurrences could
have occurred during cold temperatures that may have triggered fissures in the steel liner;
however, the possibility seems much less than that which might have occurred during
construction in other tank farms.
RPP-RPT-54915, Rev. 0
4-27
TANK U-104 CONCLUSIONS 4.8
A 5-ft bulge in the tank U-104 bottom liner was discovered while completing the second sluicing
of the full tank of MW in July 1956. The bulge with probable failure of the tank bottom liner
resulted in a leak of waste to the soil under the tank towards the southwest. The cause of the
bulge is not clear although there is a likely possibility related to rate of temperature rise which
under the right conditions can cause vapor pressure under the liner to overcome hydrostatic
pressure resulting in a bottom liner bulge. Subsequent leak testing with water confirmed the
presence of a leak in the liner as well as detection of drywell radioactivity.
There are several liner leak cause conditions that were examined but the most likely cause of the
tank U-104 liner leak was a 5-ft bulge in the bottom of the tank resulting from tank waste
thermal conditions. The MW process waste is not conducive to pitting and SCC and there
appears to be very little contribution from tank design and construction temperatures. Some or
all of the factors can act serially or together to contribute to tank liner failure.
RPP-RPT-54915, Rev. 0
A1-1
APPENDIX A1
TANK U-104 NON-BOILING WASTE OPERATIONAL HISTORY
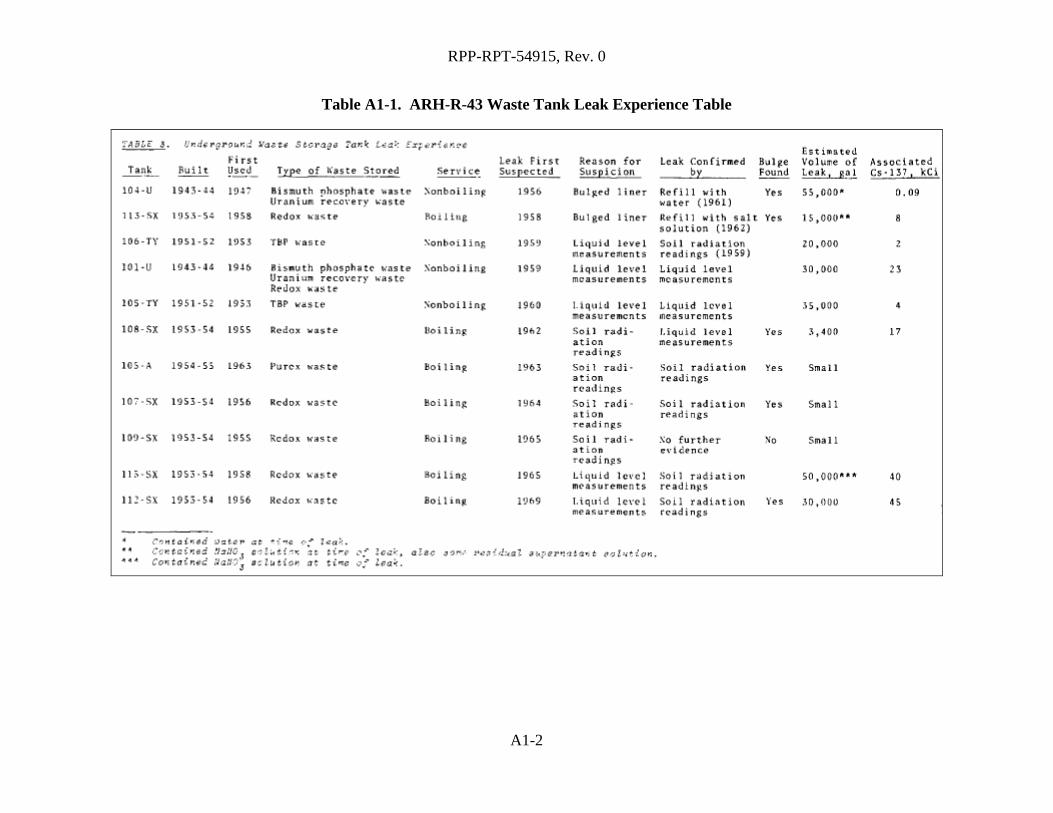
RPP-RPT-54915, Rev. 0
A1-2
Table A1-1. ARH-R-43 Waste Tank Leak Experience Table
RPP-RPT-54915, Rev. 0
B1-1
APPENDIX B1
TANK U-104 GROSS GAMMA DRYWELL DATA
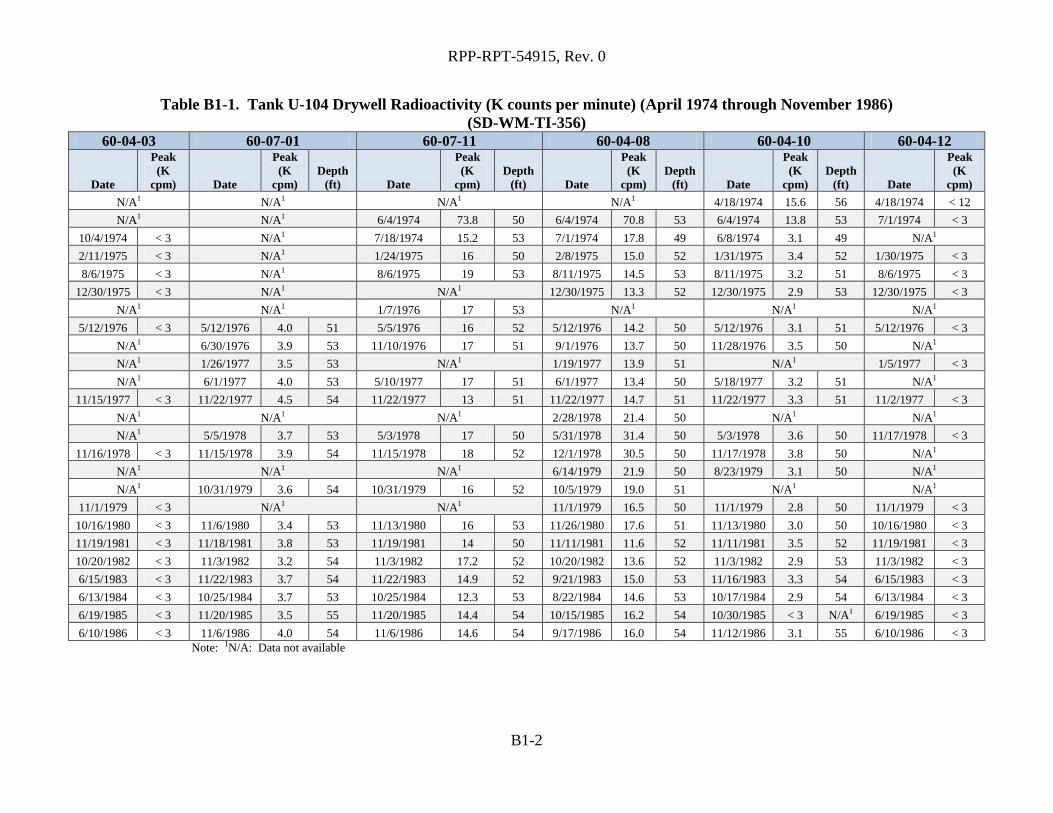
RPP-RPT-54915, Rev. 0
B1-2
Table B1-1. Tank U-104 Drywell Radioactivity (K counts per minute) (April 1974 through November 1986)
(SD-WM-TI-356)
60-04-03 60-07-01 60-07-11 60-04-08 60-04-10 60-04-12
Date
Peak
(K
cpm) Date
Peak
(K
cpm)
Depth
(ft) Date
Peak
(K
cpm)
Depth
(ft) Date
Peak
(K
cpm)
Depth
(ft) Date
Peak
(K
cpm)
Depth
(ft) Date
Peak
(K
cpm)
N/A1 N/A1 N/A1 N/A1 4/18/1974 15.6 56 4/18/1974 < 12
N/A1 N/A1 6/4/1974 73.8 50 6/4/1974 70.8 53 6/4/1974 13.8 53 7/1/1974 < 3
10/4/1974 < 3 N/A1 7/18/1974 15.2 53 7/1/1974 17.8 49 6/8/1974 3.1 49 N/A1
2/11/1975 < 3 N/A1 1/24/1975 16 50 2/8/1975 15.0 52 1/31/1975 3.4 52 1/30/1975 < 3
8/6/1975 < 3 N/A1 8/6/1975 19 53 8/11/1975 14.5 53 8/11/1975 3.2 51 8/6/1975 < 3
12/30/1975 < 3 N/A1 N/A1 12/30/1975 13.3 52 12/30/1975 2.9 53 12/30/1975 < 3
N/A1 N/A1 1/7/1976 17 53 N/A1 N/A1 N/A1
5/12/1976 < 3 5/12/1976 4.0 51 5/5/1976 16 52 5/12/1976 14.2 50 5/12/1976 3.1 51 5/12/1976 < 3
N/A1 6/30/1976 3.9 53 11/10/1976 17 51 9/1/1976 13.7 50 11/28/1976 3.5 50 N/A1
N/A1 1/26/1977 3.5 53 N/A1 1/19/1977 13.9 51 N/A1 1/5/1977 < 3
N/A1 6/1/1977 4.0 53 5/10/1977 17 51 6/1/1977 13.4 50 5/18/1977 3.2 51 N/A1
11/15/1977 < 3 11/22/1977 4.5 54 11/22/1977 13 51 11/22/1977 14.7 51 11/22/1977 3.3 51 11/2/1977 < 3
N/A1 N/A1 N/A1 2/28/1978 21.4 50 N/A1 N/A1
N/A1 5/5/1978 3.7 53 5/3/1978 17 50 5/31/1978 31.4 50 5/3/1978 3.6 50 11/17/1978 < 3
11/16/1978 < 3 11/15/1978 3.9 54 11/15/1978 18 52 12/1/1978 30.5 50 11/17/1978 3.8 50 N/A1
N/A1 N/A1 N/A1 6/14/1979 21.9 50 8/23/1979 3.1 50 N/A1
N/A1 10/31/1979 3.6 54 10/31/1979 16 52 10/5/1979 19.0 51 N/A1 N/A1
11/1/1979 < 3 N/A1 N/A1 11/1/1979 16.5 50 11/1/1979 2.8 50 11/1/1979 < 3
10/16/1980 < 3 11/6/1980 3.4 53 11/13/1980 16 53 11/26/1980 17.6 51 11/13/1980 3.0 50 10/16/1980 < 3
11/19/1981 < 3 11/18/1981 3.8 53 11/19/1981 14 50 11/11/1981 11.6 52 11/11/1981 3.5 52 11/19/1981 < 3
10/20/1982 < 3 11/3/1982 3.2 54 11/3/1982 17.2 52 10/20/1982 13.6 52 11/3/1982 2.9 53 11/3/1982 < 3
6/15/1983 < 3 11/22/1983 3.7 54 11/22/1983 14.9 52 9/21/1983 15.0 53 11/16/1983 3.3 54 6/15/1983 < 3
6/13/1984 < 3 10/25/1984 3.7 53 10/25/1984 12.3 53 8/22/1984 14.6 53 10/17/1984 2.9 54 6/13/1984 < 3
6/19/1985 < 3 11/20/1985 3.5 55 11/20/1985 14.4 54 10/15/1985 16.2 54 10/30/1985 < 3 N/A1 6/19/1985 < 3
6/10/1986 < 3 11/6/1986 4.0 54 11/6/1986 14.6 54 9/17/1986 16.0 54 11/12/1986 3.1 55 6/10/1986 < 3
Note: 1N/A: Data not available

RPP-RPT-54915, Rev. 0
5-1
5.0 TANK 241-U-110 SEGMENT
TABLE OF CONTENTS
Tank U-110 Background History .................................................................................. 5-4 5.1
Tank U-110 Operations Summary ................................................................................ 5-5 5.2
Tank Design/Construction ............................................................................................ 5-7 5.3
5.3.1 Tank Design ......................................................................................................... 5-7
5.3.2 Tank Construction Conditions ............................................................................. 5-7
Tank U-110 In-Tank Data ............................................................................................. 5-7 5.4
5.4.1 Liquid Level ......................................................................................................... 5-7
5.4.2 Temperature ......................................................................................................... 5-9
5.4.3 Liner Observations ............................................................................................. 5-10
5.4.4 Chemistry-Corrosion.......................................................................................... 5-10
5.4.5 Photographs........................................................................................................ 5-11
Tank U-110 Ex-Tank Data .......................................................................................... 5-11 5.5
5.5.1 Drywells ............................................................................................................. 5-11
5.5.1.1 Drywell 60-10-01 ............................................................................................. 5-11
5.5.1.2 Drywell 60-10-02 ............................................................................................. 5-13
5.5.1.3 Drywell 60-00-05 ............................................................................................. 5-14
5.5.1.4 Drywell 60-10-05 ............................................................................................. 5-15
5.5.1.5 Drywell 60-10-07 ............................................................................................. 5-16
5.5.1.6 Drywell 60-11-03 ............................................................................................. 5-19
5.5.1.7 Drywell 60-10-11 ............................................................................................. 5-20
5.5.1.8 2007 Direct Push .............................................................................................. 5-22
5.5.1.9 Drywell Summary ............................................................................................ 5-24
Possible Tank U-110 Liner Leak Location(s) ............................................................. 5-24 5.6
5.6.1 Leak Detected in 1974-1975 .............................................................................. 5-24
Possible Tank U-110 Liner Leak Cause(s) ................................................................. 5-26 5.7
5.7.1 Tank Design ....................................................................................................... 5-26
5.7.2 Thermal Conditions ........................................................................................... 5-26
5.7.3 Chemistry-Corrosion.......................................................................................... 5-26

RPP-RPT-54915, Rev. 0
5-2
5.7.4 Liner Observations ............................................................................................. 5-26
5.7.5 Tank Construction Temperature ........................................................................ 5-26
Tank U-110 Conclusions............................................................................................. 5-27 5.8
Appendices
Appendix A2 Tank U-110 Gross Gamma Drywell Data .......................................................... A2-1
LIST OF FIGURES
Figure 5-1. Tank U-110 Associated Drywells ............................................................................ 5-4
Figure 5-2. Operational Leak History of Tank U-110 ................................................................ 5-6
Figure 5-3. Tank U-110 End of Quarter Surface Level .............................................................. 5-8
Figure 5-4. Tank U-110 Liquid Level March 25, 1975 to July 9, 1975 ..................................... 5-9
Figure 5-5. Tank U-110 Drywell 60-10-01 (RPP-7729) .......................................................... 5-12
Figure 5-6. Tank U-110 Drywell 60-10-02 (RPP-7729) .......................................................... 5-13
Figure 5-7. Tank U-110 Drywell 60-00-05 (RPP-7729) .......................................................... 5-14
Figure 5-8. Tank U-110 Drywell 60-10-05 (RPP-7729) .......................................................... 5-15
Figure 5-9. Tank U-110 Drywell 60-10-07 NaI Probe (RPP-7729) ......................................... 5-16
Figure 5-10. Tank U-110 Drywell Red GM Probe (RPP-7729) ............................................... 5-17
Figure 5-11. Tank U-110 Drywell Red GM Probe (RPP-7729) ............................................... 5-17
Figure 5-12. Tank U-110 Drywell 60-10-07 Green GM Probe (RPP-7729) ............................ 5-18
Figure 5-13. Tank U-110 Drywell 60-10-07 Green GM Probe (RPP-7729) ............................ 5-18
Figure 5-14. Tank U-110 Drywell 60-11-03 (RPP-7729) ........................................................ 5-20
Figure 5-15. Tank U-110 Drywell 60-10-11 (RPP-7729) ........................................................ 5-21
Figure 5-16. Gamma and Moisture Log for C5607 (RPP-36007) ............................................ 5-23
Figure 5-17. Tank U-110 Possible Leak Location (1974-1975) ............................................... 5-25

RPP-RPT-54915, Rev. 0
5-3
LIST OF TABLES
Table 5-1. Tank U-110 Waste Storage Chronology ................................................................. 5-10
Table 5-2. Waste Chemistries for Waste Types Stored in Tank U-110.................................... 5-10
Table A2-1. Tank U-110 Drywell Radioactivity (K counts per minute) (August 1973
through September 1986) ..................................................................................... A2-2

RPP-RPT-54915, Rev. 0
5-4
TANK U-110 BACKGROUND HISTORY 5.1
This section provides information on the historical waste loss event associated with Single-Shell
Tank (SST) 241-U-110 (U-110). There are seven drywells located around tank U-110 with
specified distances from the drywell to the tank footing shown in Figure 5-1: 60-00-05 installed
in 1944, 60-11-03 installed in 1973, 60-10-01, 60-10-05, 60-10-07, installed in 1974, and 60-10-
11 and 60-10-02, installed in 1976. One nearby direct push was installed in 2007.
The bottom of the tank footing is ~39-ft 1-in Below Grade Surface (BGS) with ~7.2-ft soil cover
over the dome (WHC-SD-WM-TI-665).
Figure 5-1. Tank U-110 Associated Drywells
Tank inner ring is steel liner; outer ring is outer edge of tank footing
RPP-RPT-54915, Rev. 0
5-5
TANK U-110 OPERATIONS SUMMARY 5.2
Tank U-110 first began receiving 221-T Plant (T Plant) first cycle waste (1C) typically
neutralized with coating waste (CW) on July 22, 1946 (HW-7-4542-DEL, Hanford Engineer
Works Monthly Report July 1946). The tank was declared full and 1C waste began to cascade to
tank U-111 after April 1947 (HW-7-6184-DEL, Hanford Works Monthly Report April 1947).
First cycle waste cascaded into tank U-111 and tank U-112 through May 1948 when the three
tank cascade was declared full (HW-10166-DEL, Hanford Works Monthly Report May 1948)
and no other transfers occurred through July 1951. No record of tank transfers was available
between August 1951 and March 1952. Beginning in April 1952, supernatant was pumped out
of tank U-110 to the sludge level leaving a volume reported at 336 kgal (HW-27838, Waste
Status Summary Period: April, May, and June 1952). No waste transactions were reported until
January 1954.
Beginning on January 13, 1954, tank U-110 started receiving REDOX concentrated salt waste
(HW-30851, Waste Status Summary January 1954). The REDOX waste level decreased through
self-evaporation from June 1954 through August 1955. Beginning in September 1955 through
July 1957, periodic transfers of REDOX coating waste occurred into and out of tank U-110. No
other transfers occurred until July 1958 when 39 kgal of water was added to the tank. No waste
transfers into or out of the tank occurred from August 1958 until the second quarter in 1969.
The next waste transfer occurred in June 1969 when 157 kgal of supernatant was transferred to
tank TX-118. The solids content was subsequently adjusted downward 47-in to 284 kgal. No
additional transfers were made until the third quarter of 1972 through the second quarter of 1975
when tank U-110 periodically received a total of 316 kgal of waste from 222-S Laboratory.
Tank U-110 was first reported to be leaking on July 9, 1975 after a 0.5-in liquid level decrease
was observed. The 0.5-in liquid level decrease was reported between May 24, 1975 to June 26,
1975 (OR 75-67, Liquid Level Decrease in Tank 110-U). Beginning on July 9, 1975, 225 kgal
supernatant was transferred out of tank U-110 to tank U-111 leaving approximately 161 kgal of
sludge (ARH-CD-336C, Production and Waste Management Division Waste Status Summary
July 1, 1975 through September 30, 1975).
Tank U-110 was declared administratively interim stabilized in December 1984 with 16 kgal of
drainable liquid remaining (HNF-EP-0182). The estimated leak volume ranges from 5 to 8.1
kgal.
The operational history of tank U-110 leak related details including liquid level is charted in
Figure 5-2.
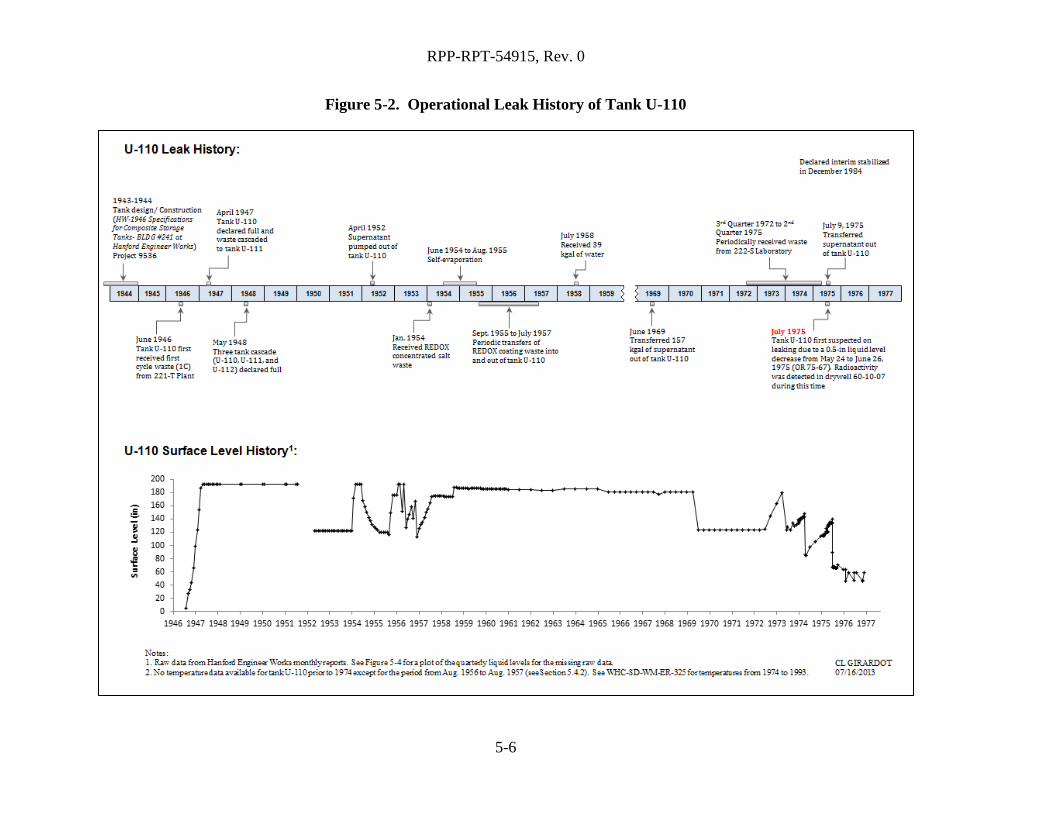
RPP-RPT-54915, Rev. 0
5-6
Figure 5-2. Operational Leak History of Tank U-110

RPP-RPT-54915, Rev. 0
5-7
TANK DESIGN/CONSTRUCTION 5.3
5.3.1 Tank Design
The steel bottoms of the U Farm tanks intersect the sidewall on a 4-ft radius knuckle transition
(BPF-73550, Drawings D-2 and D-3). The rounded knuckle transition, the three-ply asphaltic
membrane waterproofing between the liner and the concrete, a notched footing construction
joint, and the concrete shell are features common to all U Farm tanks (see Section 3.1.1).
5.3.2 Tank Construction Conditions
The U Farm tanks were constructed between February 1944 and October 1944. Temperatures
are not available for 1944 between May 18 and December 1. From the start of U Farm tank
construction through May 18, 1944 there were two minimum temperatures of 12F with daytime
temperatures of 44F and 57F, one at 18F, and four at 20F with day time temperatures
between 41F and 56F.
As described in Section 3.1.2, cold weather affects the ductile-to-brittle steel transition
temperature, with 18°F being the assumed design temperature for the carbon steel liner, which
could result in a fracture upon impact. However, in general, the temperatures during the U Farm
construction time frame were much milder than those experienced during 241-SX Farm
construction where ductile-to-brittle steel transition temperatures were exceeded.
Design, fabrication, and erection of the tank steel lining were required to be in accordance with
current “Standards Specifications for Elevated Steel Water Tanks, Standpipes and Reservoirs” as
promulgated by the “American Water Works Association” (BPF 73550). Welding requirements
were required to conform to the American Welding Society’s “Code for Arc and Gas Welding in
Building Construction”, Section 4.
TANK U-110 IN-TANK DATA 5.4
5.4.1 Liquid Level
The liquid level plot in Figure 5-3 indicates the transfer activity into and out of tank U-110. The
liquid levels are end of quarter levels so this figure may not reflect all transfers into and out of
the tank that occurred during the operational history. See Figure 5-2 for historical monthly liquid
level readings.
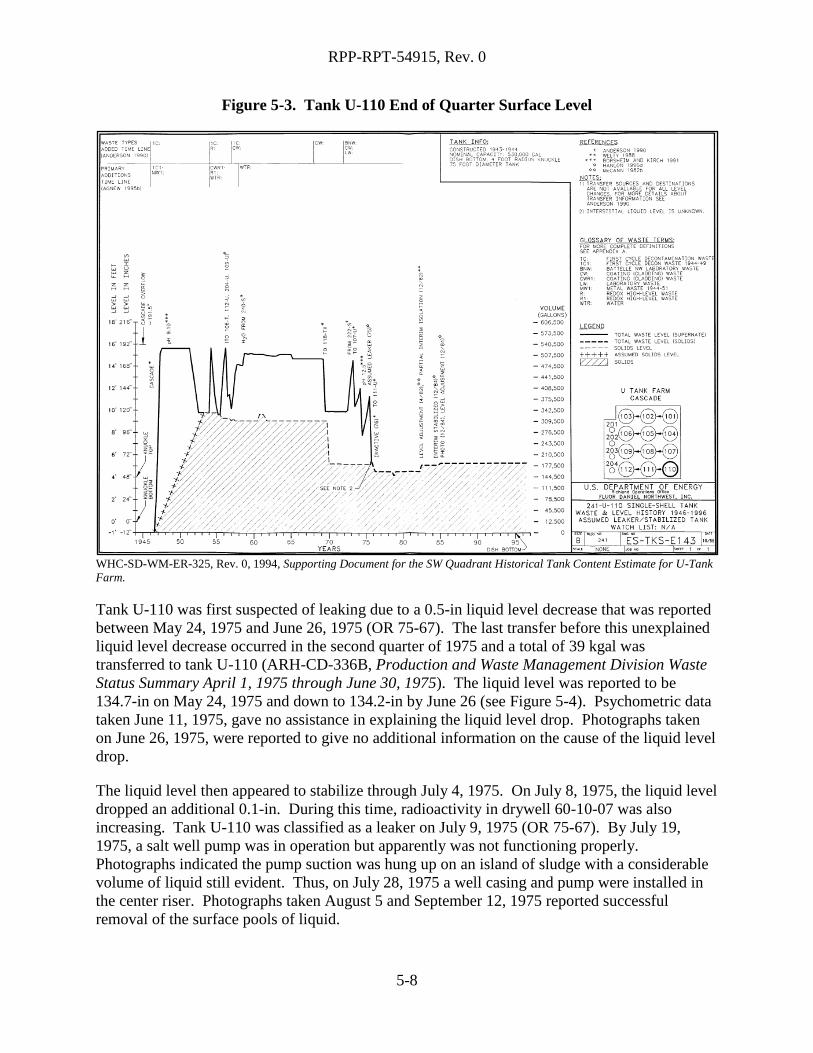
RPP-RPT-54915, Rev. 0
5-8
Figure 5-3. Tank U-110 End of Quarter Surface Level
WHC-SD-WM-ER-325, Rev. 0, 1994, Supporting Document for the SW Quadrant Historical Tank Content Estimate for U-Tank
Farm.
Tank U-110 was first suspected of leaking due to a 0.5-in liquid level decrease that was reported
between May 24, 1975 and June 26, 1975 (OR 75-67). The last transfer before this unexplained
liquid level decrease occurred in the second quarter of 1975 and a total of 39 kgal was
transferred to tank U-110 (ARH-CD-336B, Production and Waste Management Division Waste
Status Summary April 1, 1975 through June 30, 1975). The liquid level was reported to be
134.7-in on May 24, 1975 and down to 134.2-in by June 26 (see Figure 5-4). Psychometric data
taken June 11, 1975, gave no assistance in explaining the liquid level drop. Photographs taken
on June 26, 1975, were reported to give no additional information on the cause of the liquid level
drop.
The liquid level then appeared to stabilize through July 4, 1975. On July 8, 1975, the liquid level
dropped an additional 0.1-in. During this time, radioactivity in drywell 60-10-07 was also
increasing. Tank U-110 was classified as a leaker on July 9, 1975 (OR 75-67). By July 19,
1975, a salt well pump was in operation but apparently was not functioning properly.
Photographs indicated the pump suction was hung up on an island of sludge with a considerable
volume of liquid still evident. Thus, on July 28, 1975 a well casing and pump were installed in
the center riser. Photographs taken August 5 and September 12, 1975 reported successful
removal of the surface pools of liquid.
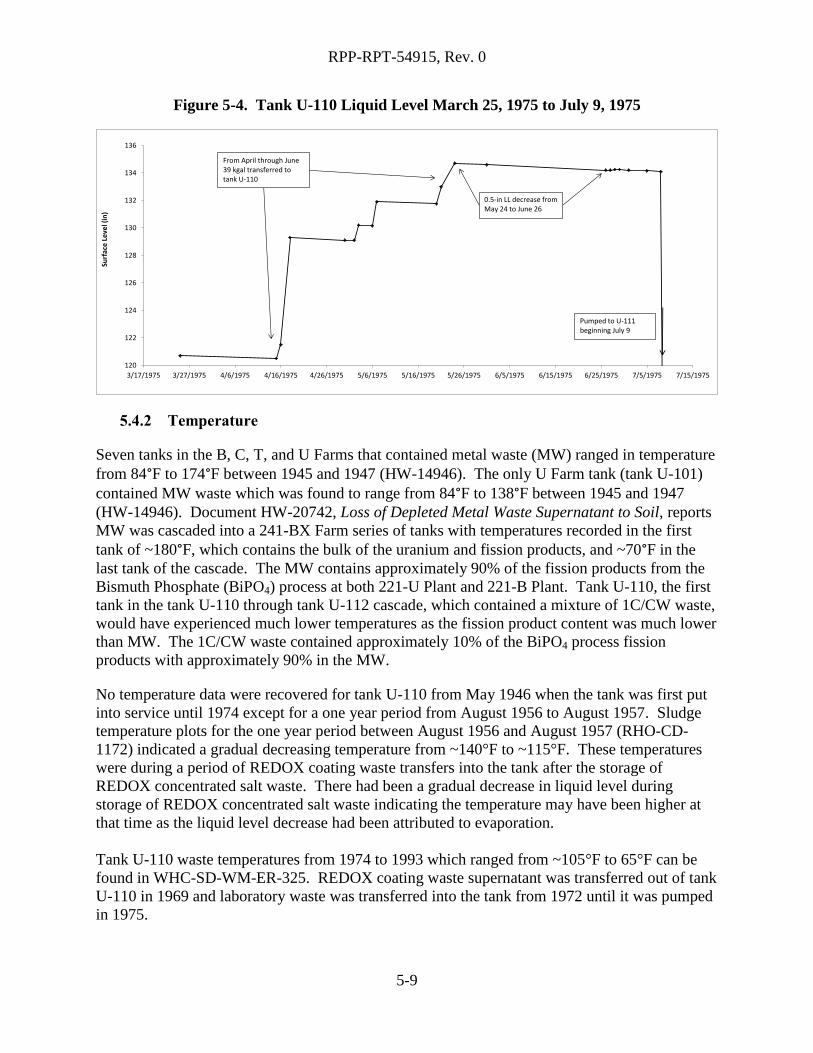
RPP-RPT-54915, Rev. 0
5-9
Figure 5-4. Tank U-110 Liquid Level March 25, 1975 to July 9, 1975
5.4.2 Temperature
Seven tanks in the B, C, T, and U Farms that contained metal waste (MW) ranged in temperature
from 84°F to 174°F between 1945 and 1947 (HW-14946). The only U Farm tank (tank U-101)
contained MW waste which was found to range from 84°F to 138°F between 1945 and 1947
(HW-14946). Document HW-20742, Loss of Depleted Metal Waste Supernatant to Soil, reports
MW was cascaded into a 241-BX Farm series of tanks with temperatures recorded in the first
tank of ~180°F, which contains the bulk of the uranium and fission products, and ~70°F in the
last tank of the cascade. The MW contains approximately 90% of the fission products from the
Bismuth Phosphate (BiPO4) process at both 221-U Plant and 221-B Plant. Tank U-110, the first
tank in the tank U-110 through tank U-112 cascade, which contained a mixture of 1C/CW waste,
would have experienced much lower temperatures as the fission product content was much lower
than MW. The 1C/CW waste contained approximately 10% of the BiPO4 process fission
products with approximately 90% in the MW.
No temperature data were recovered for tank U-110 from May 1946 when the tank was first put
into service until 1974 except for a one year period from August 1956 to August 1957. Sludge
temperature plots for the one year period between August 1956 and August 1957 (RHO-CD-
1172) indicated a gradual decreasing temperature from ~140°F to ~115°F. These temperatures
were during a period of REDOX coating waste transfers into the tank after the storage of
REDOX concentrated salt waste. There had been a gradual decrease in liquid level during
storage of REDOX concentrated salt waste indicating the temperature may have been higher at
that time as the liquid level decrease had been attributed to evaporation.
Tank U-110 waste temperatures from 1974 to 1993 which ranged from ~105°F to 65°F can be
found in WHC-SD-WM-ER-325. REDOX coating waste supernatant was transferred out of tank
U-110 in 1969 and laboratory waste was transferred into the tank from 1972 until it was pumped
in 1975.
120
122
124
126
128
130
132
134
136
3/17/1975 3/27/1975 4/6/1975 4/16/1975 4/26/1975 5/6/1975 5/16/1975 5/26/1975 6/5/1975 6/15/1975 6/25/1975 7/5/1975 7/15/1975
Surf
ace
Leve
l (in
)
0.5-in LL decrease fromMay 24 to June 26
From April through June39 kgal transferred to tank U-110
Pumped to U-111beginning July 9
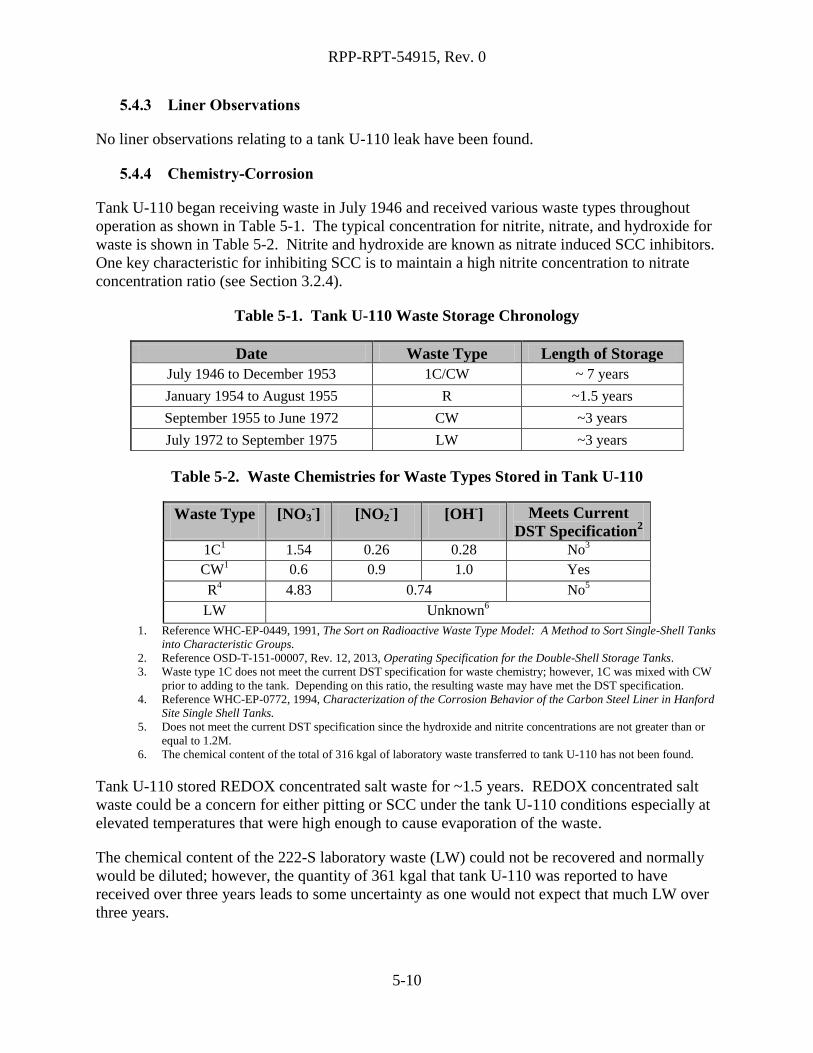
RPP-RPT-54915, Rev. 0
5-10
5.4.3 Liner Observations
No liner observations relating to a tank U-110 leak have been found.
5.4.4 Chemistry-Corrosion
Tank U-110 began receiving waste in July 1946 and received various waste types throughout
operation as shown in Table 5-1. The typical concentration for nitrite, nitrate, and hydroxide for
waste is shown in Table 5-2. Nitrite and hydroxide are known as nitrate induced SCC inhibitors.
One key characteristic for inhibiting SCC is to maintain a high nitrite concentration to nitrate
concentration ratio (see Section 3.2.4).
Table 5-1. Tank U-110 Waste Storage Chronology
Date Waste Type Length of Storage
July 1946 to December 1953 1C/CW ~ 7 years
January 1954 to August 1955 R ~1.5 years
September 1955 to June 1972 CW ~3 years
July 1972 to September 1975 LW ~3 years
Table 5-2. Waste Chemistries for Waste Types Stored in Tank U-110
Waste Type [NO3-]
[NO2-]
[OH-] Meets Current
DST Specification2
1C1 1.54 0.26 0.28 No
3
CW
1 0.6 0.9 1.0 Yes
R
4 4.83 0.74
No
5
LW Unknown6
1. Reference WHC-EP-0449, 1991, The Sort on Radioactive Waste Type Model: A Method to Sort Single-Shell Tanks
into Characteristic Groups.
2. Reference OSD-T-151-00007, Rev. 12, 2013, Operating Specification for the Double-Shell Storage Tanks.
3. Waste type 1C does not meet the current DST specification for waste chemistry; however, 1C was mixed with CW
prior to adding to the tank. Depending on this ratio, the resulting waste may have met the DST specification.
4. Reference WHC-EP-0772, 1994, Characterization of the Corrosion Behavior of the Carbon Steel Liner in Hanford
Site Single Shell Tanks.
5. Does not meet the current DST specification since the hydroxide and nitrite concentrations are not greater than or
equal to 1.2M.
6. The chemical content of the total of 316 kgal of laboratory waste transferred to tank U-110 has not been found.
Tank U-110 stored REDOX concentrated salt waste for ~1.5 years. REDOX concentrated salt
waste could be a concern for either pitting or SCC under the tank U-110 conditions especially at
elevated temperatures that were high enough to cause evaporation of the waste.
The chemical content of the 222-S laboratory waste (LW) could not be recovered and normally
would be diluted; however, the quantity of 361 kgal that tank U-110 was reported to have
received over three years leads to some uncertainty as one would not expect that much LW over
three years.

RPP-RPT-54915, Rev. 0
5-11
The other waste types stored in tank U-110 should not have resulted in pitting or SCC. The
waste type 1C/CW was combination of the acidic 1C waste from T Plant neutralized with the
basic CW waste in T Plant. The combination would have resulted in a [NO3-]/([OH
-] + [NO2
-])
ratio of < 2.5, OSD-T-151-0007 specification for waste chemistry. The CW waste by itself met
the OSD-T-151-0007 specification for waste chemistry.
5.4.5 Photographs
Photographs of tank U-110 taken before and after pumping the tank in 1975 were reviewed and
no anomalies were indicated that relate to a liner failure.
TANK U-110 EX-TANK DATA 5.5
5.5.1 Drywells
There are seven drywells located around tank U-110: 60-00-05 installed in 1944, 60-11-03
installed in 1973, 60-10-01, 60-10-05, 60-10-07, installed in 1974, and 60-10-11 and 60-10-02,
installed in 1976. One nearby direct push was installed in 2007. All of the radiation readings in
drywells are assumed to be maximum or peak readings unless otherwise noted (see Section
3.3.2). The following subsections report the available drywell information and the drywell
summary section provides the analyses of the associated drywells with tank U-110.
5.5.1.1 Drywell 60-10-01
In August 1996, drywell 60-10-01 is located approximately 12.5-ft from the north-northeast side
of tank U-110. Drywell 60-10-01 was drilled in 1974 with the first recoverable reading on
September 27, 1974 reported as a less than value (see Appendix A2). Readings continued to be
reported as less than values through September 1986.
Cs-137 was detected continuously from ground surface to a depth of about 28-ft BGS and
intermittently at greater depths (GJ-HAN-39, Vadose Zone Characterization Project at the
Hanford Tank Farms Tank Summary Data Report for Tank U-110). Indications of Cs-137 were
noted at 33-ft, 35-ft, from 40.5 to 41-ft, 78-ft BGS, and at the bottom of the drywell. The Cs-137
concentrations in the continuous zone ranged between 0.2 and about 9 pCi/g. The maximum Cs-
137 concentration of about 9 pCi/g was measured at a depth of 6.5-ft BGS; a concentration of
approximately 6 pCi/g was observed at a depth of 1.5-ft BGS. Document GJ-HAN-39 reports,
“These two zones of Cs-137 contamination most likely resulted from a surface or near-surface
spill from piping or transfer lines that migrated downward.”
Since historical radioactivity in this drywell is very low, and the GJ-HAN-39 report indicated
low levels of radioactivity below the surface level, drywell 60-10-01 is not being included as part
of the leak location for tank U-110. Figure 5-5 shows the depths of radioactivity from 1975 to
1995 (RPP-7729).
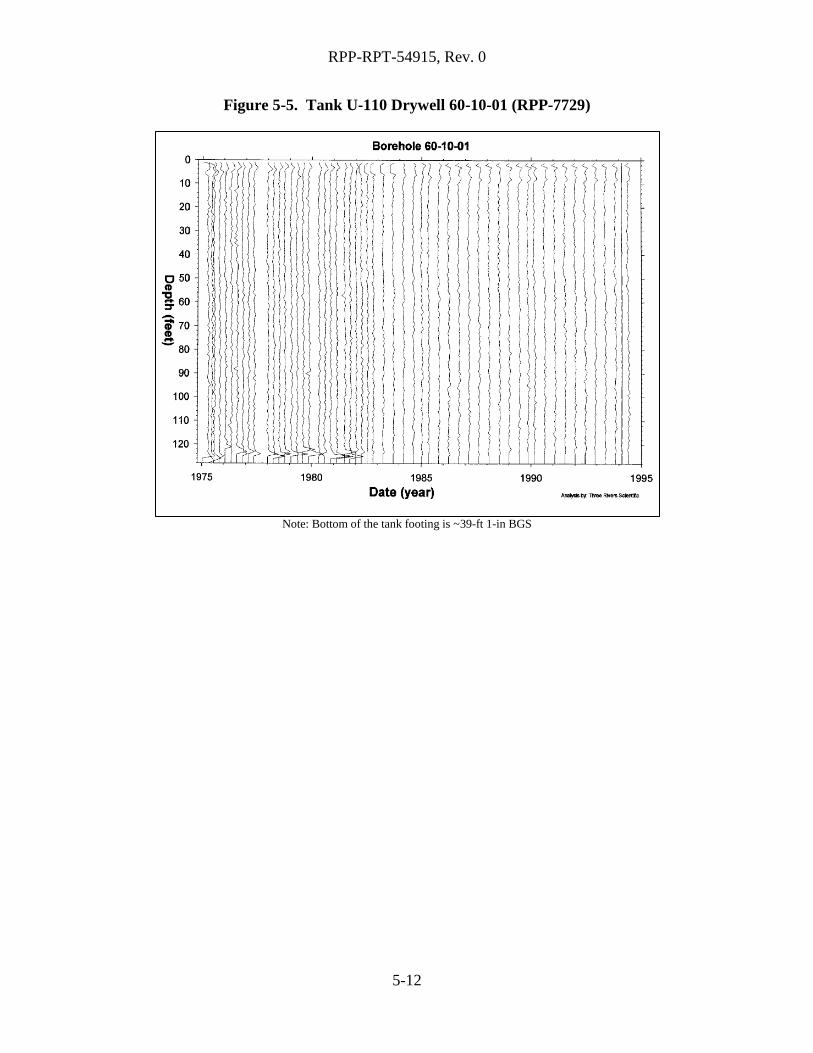
RPP-RPT-54915, Rev. 0
5-12
Figure 5-5. Tank U-110 Drywell 60-10-01 (RPP-7729)
Note: Bottom of the tank footing is ~39-ft 1-in BGS

RPP-RPT-54915, Rev. 0
5-13
5.5.1.2 Drywell 60-10-02
Drywell 60-10-02 is located approximately 5-ft from the northeast side of tank U-110. Drywell
60-10-02 was drilled in 1976 with the first recoverable reading on May 12, 1976 reported as a
less than value (see Appendix A2). Readings continued to be reported as less than values
through September 1986.
In August 1996, Cs-137 was detected from ground surface to a depth of 9-ft, at 10.5-ft, and 13-ft
BGS. Concentrations of Cs-137 ranged between 0.2 and 4 pCi/g (GJ-HAN-39). The highest
contamination levels (3.72 pCi/g) were observed at a depth of 1.5-ft BGS. Cs-137 contamination
of approximately 3 pCi/g was observed at a depth of 7.5-ft BGS. The near-surface
contamination probably resulted from the migration of a surface or near-surface spill or leak.
Some of the contamination may have migrated down the casing to a depth of 13-ft BGS.
Document GJ-HAN-39 reports, “No Cs-137 contamination was observed below the 13-ft depth.”
Since historical radioactivity in this drywell is very low, and GJ-HAN-39 report indicated low
levels of radioactivity, drywell 60-10-02 is not being included as part of the leak location for
tank U-110. Figure 5-6 shows the depths of radioactivity from 1975 to 1995 (RPP-7729).
Figure 5-6. Tank U-110 Drywell 60-10-02 (RPP-7729)
Note: Bottom of the tank footing is ~39-ft 1-in BGS
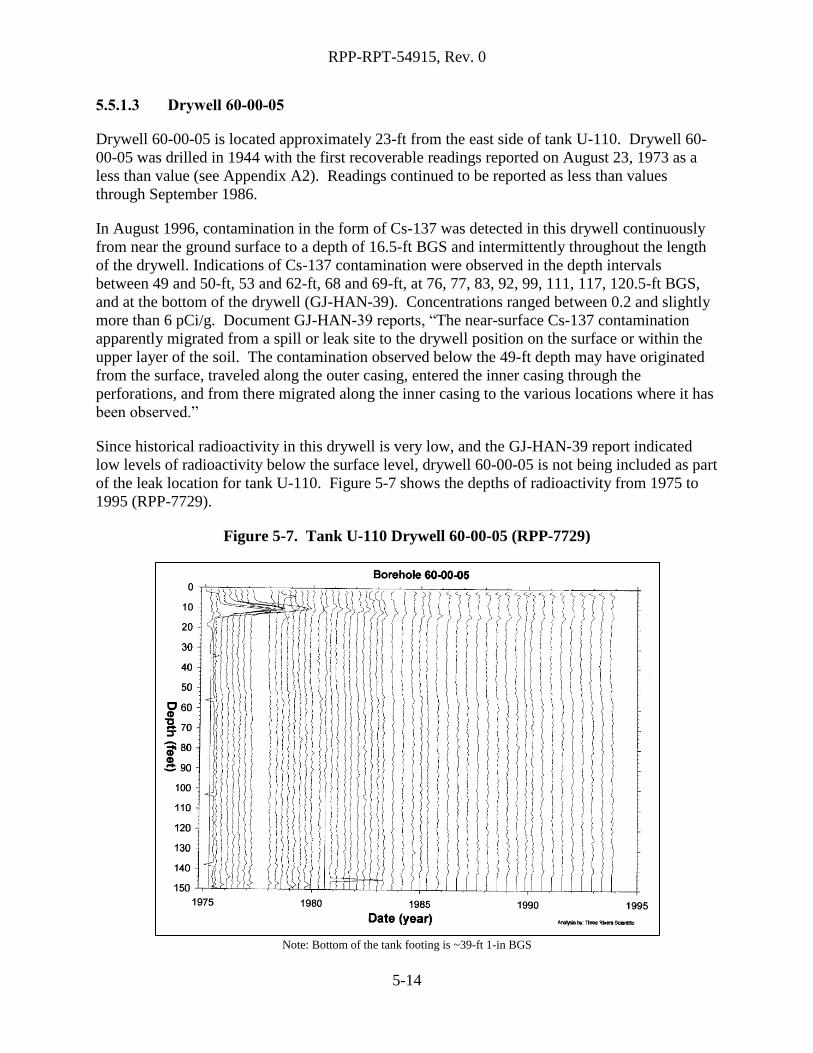
RPP-RPT-54915, Rev. 0
5-14
5.5.1.3 Drywell 60-00-05
Drywell 60-00-05 is located approximately 23-ft from the east side of tank U-110. Drywell 60-
00-05 was drilled in 1944 with the first recoverable readings reported on August 23, 1973 as a
less than value (see Appendix A2). Readings continued to be reported as less than values
through September 1986.
In August 1996, contamination in the form of Cs-137 was detected in this drywell continuously
from near the ground surface to a depth of 16.5-ft BGS and intermittently throughout the length
of the drywell. Indications of Cs-137 contamination were observed in the depth intervals
between 49 and 50-ft, 53 and 62-ft, 68 and 69-ft, at 76, 77, 83, 92, 99, 111, 117, 120.5-ft BGS,
and at the bottom of the drywell (GJ-HAN-39). Concentrations ranged between 0.2 and slightly
more than 6 pCi/g. Document GJ-HAN-39 reports, “The near-surface Cs-137 contamination
apparently migrated from a spill or leak site to the drywell position on the surface or within the
upper layer of the soil. The contamination observed below the 49-ft depth may have originated
from the surface, traveled along the outer casing, entered the inner casing through the
perforations, and from there migrated along the inner casing to the various locations where it has
been observed.”
Since historical radioactivity in this drywell is very low, and the GJ-HAN-39 report indicated
low levels of radioactivity below the surface level, drywell 60-00-05 is not being included as part
of the leak location for tank U-110. Figure 5-7 shows the depths of radioactivity from 1975 to
1995 (RPP-7729).
Figure 5-7. Tank U-110 Drywell 60-00-05 (RPP-7729)
Note: Bottom of the tank footing is ~39-ft 1-in BGS

RPP-RPT-54915, Rev. 0
5-15
5.5.1.4 Drywell 60-10-05
Drywell 60-10-05 is located approximately 9-ft from the southeast side of tank U-110. Drywell
60-10-05 was drilled in 1974 with the first recoverable reading on July 19, 1974 reported as a
less than value (see Appendix A2). Readings continued to be reported as less than values
through September 1986.
In August 1996, Cs-137 was detected intermittently in this drywell (GJ-HAN-39). It was
observed from the ground surface to a depth of about 6-ft, between 11 and 16-ft, from 20 to 26-ft
BGS, and at the bottom of the drywell. The Cs-137 concentrations in the three zones noted
within the upper 25-ft of the drywell ranged between 0.2 and about 6 pCi/g. The highest
concentration (5.6 pCi/g) was measured at a depth of 12.5-ft BGS. In addition, Cs-137
contamination of about 5 pCi/g was observed at the mouth of the drywell.
Historical radioactivity in this drywell is very low, and the GJ-HAN-39 report indicated low
levels of radioactivity, drywell 60-10-05 is therefore not being included as part of the leak
location for tank U-110. Figure 5-8 shows the depths of radioactivity from 1975 to 1995 (RPP-
7729).
Figure 5-8. Tank U-110 Drywell 60-10-05 (RPP-7729)
Note: Bottom of the tank footing is ~39-ft 1-in BGS

RPP-RPT-54915, Rev. 0
5-16
5.5.1.5 Drywell 60-10-07
Drywell 60-10-07 is located approximately 7-ft from the south southwest side of tank U-110.
Drywell 60-10-07 was drilled on 1974 with the first recoverable reading on April 12, 1974 with a
peak of 6.96K cpm at 33-ft BGS (see Appendix A2). The early measurements were made
immediately following completion of the drywell and indicate that the contamination at this
depth occurred before the detected liquid level decrease in 1975. In June 1975 radioactivity
began to be detected at ~53-ft BGS and peaked near this level with increasing radioactivity even
after pumping the tank.
Drywell 60-10-07 was examined with the Green-GM probe (01), Red-GM probe (02), and the
NaI probe (04) to monitor the large Cs-137 gamma variations in this drywell (see Figure 5-9,
Figure 5-10, and Figure 5-12). The NaI probe is the most sensitive and was able to obtain data
until about 1980 when the probe became saturated with high levels of radioactivity, making the
data unreliable. The NaI probe shows the early influx of radioactivity. There is some conflict in
the variability of the grade thickness product, used to eliminate variable sampling effects for a
given zone, between the Green-GM probe, Figure 5-13, and the less sensitive Red probe, Figure
5-11. However, both the Green-GM probe and the Red probe indicate radioactivity Cs-137
below 50-ft BGS.
Figure 5-9. Tank U-110 Drywell 60-10-07 NaI Probe (RPP-7729)
Note: Bottom of the tank footing is ~39-ft 1-in BGS

RPP-RPT-54915, Rev. 0
5-17
Figure 5-10. Tank U-110 Drywell Red GM Probe (RPP-7729)
Note: Bottom of the tank footing is ~39-ft 1-in BGS
Figure 5-11. Tank U-110 Drywell Red GM Probe (RPP-7729)
Grade Thickness Product
Note: Bottom of the tank footing is ~39-ft 1-in BGS

RPP-RPT-54915, Rev. 0
5-18
Figure 5-12. Tank U-110 Drywell 60-10-07 Green GM Probe (RPP-7729)
Note: Bottom of the tank footing is ~39-ft 1-in BGS
Figure 5-13. Tank U-110 Drywell 60-10-07 Green GM Probe (RPP-7729)
Grade thickness Product
Note: Bottom of the tank footing is ~39-ft 1-in BGS

RPP-RPT-54915, Rev. 0
5-19
In August 1996, significant Cs-137 contamination was observed in this drywell continuously
from the ground surface to a depth of 64.5-ft BGS and intermittently at greater depths to bottom
of the drywell (GJ-HAN-39). The Cs-137 concentrations in the upper 9-ft of the drywell ranged
up to 655 pCi/g. Even higher concentrations of Cs-137 projected to be above 1,000 pCi/g were
indicated at depths between 52 and 59-ft BGS; the highest measured concentration in this region
of the drywell was 462 pCi/g. However, because of high dead time, the SGLS system could not
record the data in this region of the drywell (total gamma count rate greater than 500,000 cps).
5.5.1.6 Drywell 60-11-03
Drywell 60-11-03 is located approximately 12-ft west of tank U-110. Drywell 60-11-03 was
drilled in 1973 with the first recoverable reading on September 21, 1973 reported as a less than
value (see Appendix A2). Readings continued to be reported as less than values through June
1986.
In August 1996, significant Cs-137 contamination was detected in this borehole near the ground
surface (GJ-HAN-39). The zone of contamination extends from the surface to a depth of 11-ft
BGS. Concentrations of Cs-137 in this interval ranged between 0.7 and 525 pCi/g. Detectable
Cs-137 contamination (between 0.2 and 1.0 pCi/g) was noted between depths of 16.5 and 21.5-ft
BGS and at the bottom of the drywell. Detectable quantities of Co-60 (approximately 11 pCi/g)
and Eu-154 (approximately 100 pCi/g) were also noted in the near-surface zone where the Cs-
137 contamination occurs. Document GJ-HAN-39 reports, “The near-surface contamination is
probably contained within a transfer line or its concrete encasement.”
Since historical radioactivity in this drywell is very low, and the GJ-HAN-39 report indicated
low levels of radioactivity below the surface level, drywell 60-11-03 is not being included as part
of the leak location for tank U-110. Figure 5-14 shows the depths of radioactivity from 1975 to
1995 (RPP-7729).

RPP-RPT-54915, Rev. 0
5-20
Figure 5-14. Tank U-110 Drywell 60-11-03 (RPP-7729)
Note: Bottom of the tank footing is ~39-ft 1-in BGS
5.5.1.7 Drywell 60-10-11
Drywell 60-10-11 is located approximately 12-ft north northwest of tank U-110. Drywell 60-10-
11 was drilled in 1976 with the first recoverable reading on May 12, 1976 reported as a less than
value (see Appendix A2). Readings continued to be reported as less than values through June
1986.
In August 1996, Cs-137 was observed from the ground surface to a depth of about 14.5-ft, at 23-
ft BGS, and at the bottom of the drywell (GJ-HAN-39). The Cs-137 concentrations in the near-
surface zones ranged between 0.2 and slightly less than 6 pCi/g. The highest concentration of
5.91 pCi/g was measured at a depth of 1.5-ft BGS.
Since historical radioactivity in this drywell is very low, and the GJ-HAN-39 report indicated
low levels of radioactivity below the surface level, drywell 60-10-11 is not being included as part
of the leak location for tank U-110. Figure 5-15 shows the depths of radioactivity from 1975 to
1995 (RPP-7729).

RPP-RPT-54915, Rev. 0
5-21
Figure 5-15. Tank U-110 Drywell 60-10-11 (RPP-7729)
Note: Bottom of the tank footing is ~39-ft 1-in BGS
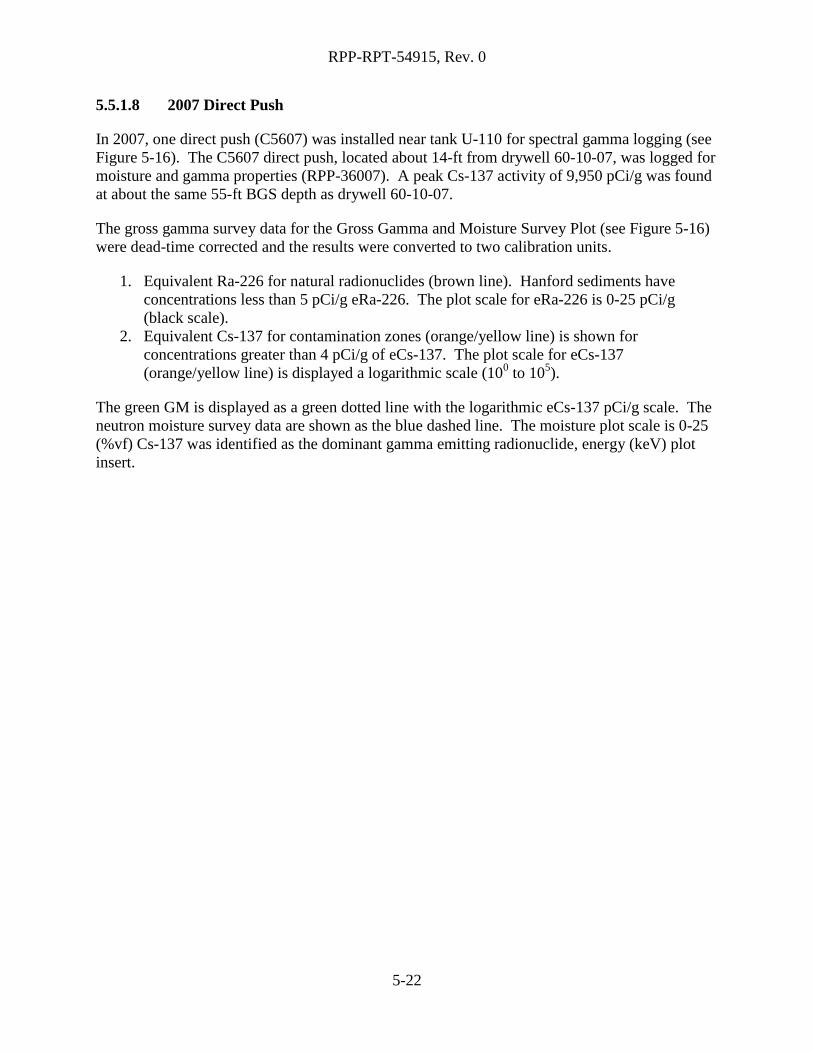
RPP-RPT-54915, Rev. 0
5-22
5.5.1.8 2007 Direct Push
In 2007, one direct push (C5607) was installed near tank U-110 for spectral gamma logging (see
Figure 5-16). The C5607 direct push, located about 14-ft from drywell 60-10-07, was logged for
moisture and gamma properties (RPP-36007). A peak Cs-137 activity of 9,950 pCi/g was found
at about the same 55-ft BGS depth as drywell 60-10-07.
The gross gamma survey data for the Gross Gamma and Moisture Survey Plot (see Figure 5-16)
were dead-time corrected and the results were converted to two calibration units.
1. Equivalent Ra-226 for natural radionuclides (brown line). Hanford sediments have
concentrations less than 5 pCi/g eRa-226. The plot scale for eRa-226 is 0-25 pCi/g
(black scale).
2. Equivalent Cs-137 for contamination zones (orange/yellow line) is shown for
concentrations greater than 4 pCi/g of eCs-137. The plot scale for eCs-137
(orange/yellow line) is displayed a logarithmic scale (100 to 10
5).
The green GM is displayed as a green dotted line with the logarithmic eCs-137 pCi/g scale. The
neutron moisture survey data are shown as the blue dashed line. The moisture plot scale is 0-25
(%vf) Cs-137 was identified as the dominant gamma emitting radionuclide, energy (keV) plot
insert.
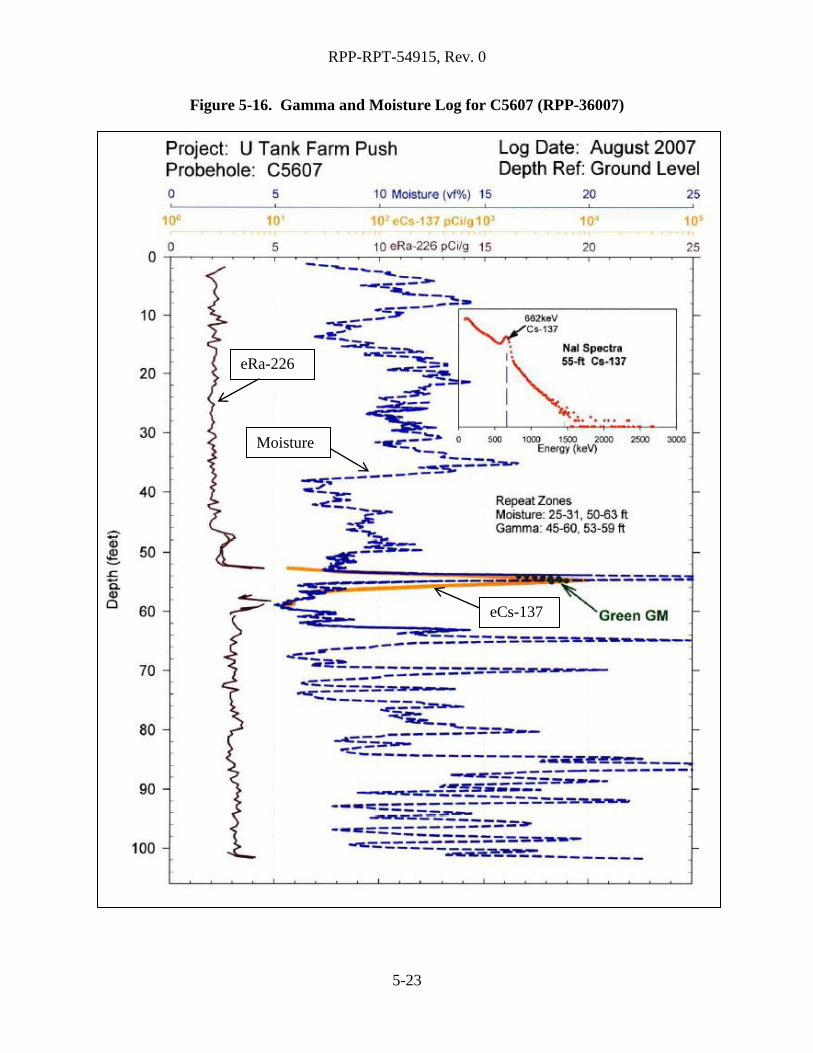
RPP-RPT-54915, Rev. 0
5-23
Figure 5-16. Gamma and Moisture Log for C5607 (RPP-36007)
eRa-226
Moisture
eCs-137
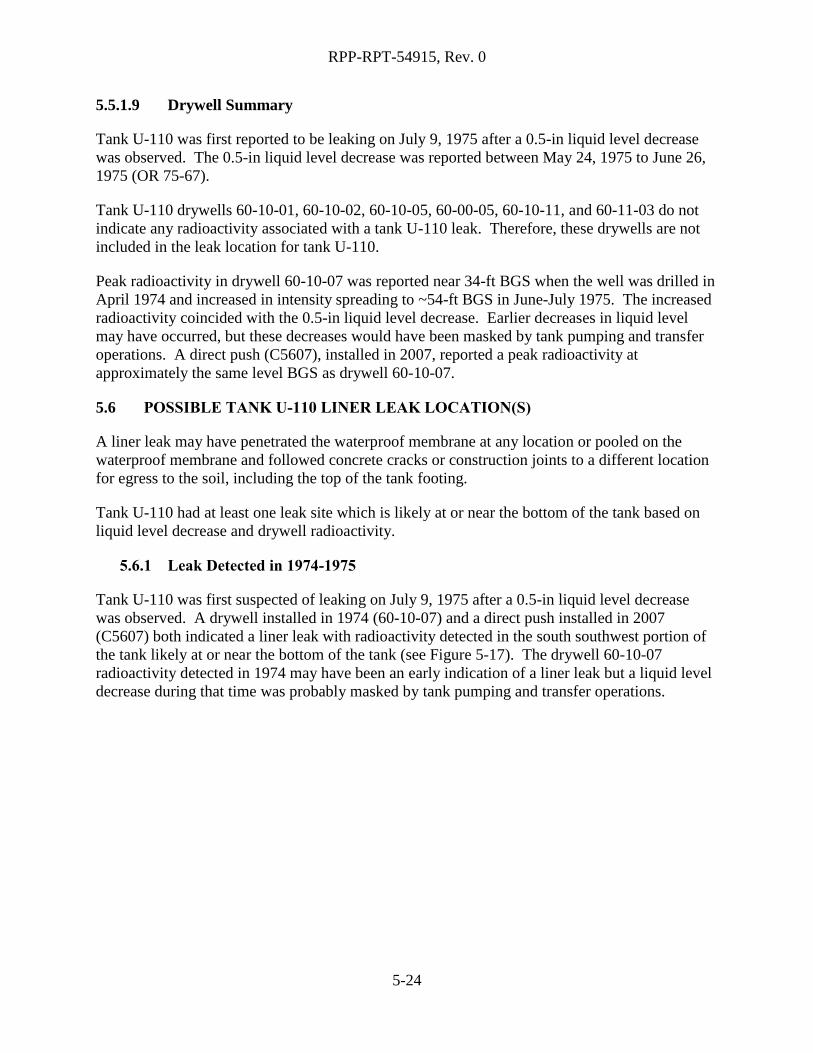
RPP-RPT-54915, Rev. 0
5-24
5.5.1.9 Drywell Summary
Tank U-110 was first reported to be leaking on July 9, 1975 after a 0.5-in liquid level decrease
was observed. The 0.5-in liquid level decrease was reported between May 24, 1975 to June 26,
1975 (OR 75-67).
Tank U-110 drywells 60-10-01, 60-10-02, 60-10-05, 60-00-05, 60-10-11, and 60-11-03 do not
indicate any radioactivity associated with a tank U-110 leak. Therefore, these drywells are not
included in the leak location for tank U-110.
Peak radioactivity in drywell 60-10-07 was reported near 34-ft BGS when the well was drilled in
April 1974 and increased in intensity spreading to ~54-ft BGS in June-July 1975. The increased
radioactivity coincided with the 0.5-in liquid level decrease. Earlier decreases in liquid level
may have occurred, but these decreases would have been masked by tank pumping and transfer
operations. A direct push (C5607), installed in 2007, reported a peak radioactivity at
approximately the same level BGS as drywell 60-10-07.
POSSIBLE TANK U-110 LINER LEAK LOCATION(S) 5.6
A liner leak may have penetrated the waterproof membrane at any location or pooled on the
waterproof membrane and followed concrete cracks or construction joints to a different location
for egress to the soil, including the top of the tank footing.
Tank U-110 had at least one leak site which is likely at or near the bottom of the tank based on
liquid level decrease and drywell radioactivity.
5.6.1 Leak Detected in 1974-1975
Tank U-110 was first suspected of leaking on July 9, 1975 after a 0.5-in liquid level decrease
was observed. A drywell installed in 1974 (60-10-07) and a direct push installed in 2007
(C5607) both indicated a liner leak with radioactivity detected in the south southwest portion of
the tank likely at or near the bottom of the tank (see Figure 5-17). The drywell 60-10-07
radioactivity detected in 1974 may have been an early indication of a liner leak but a liquid level
decrease during that time was probably masked by tank pumping and transfer operations.
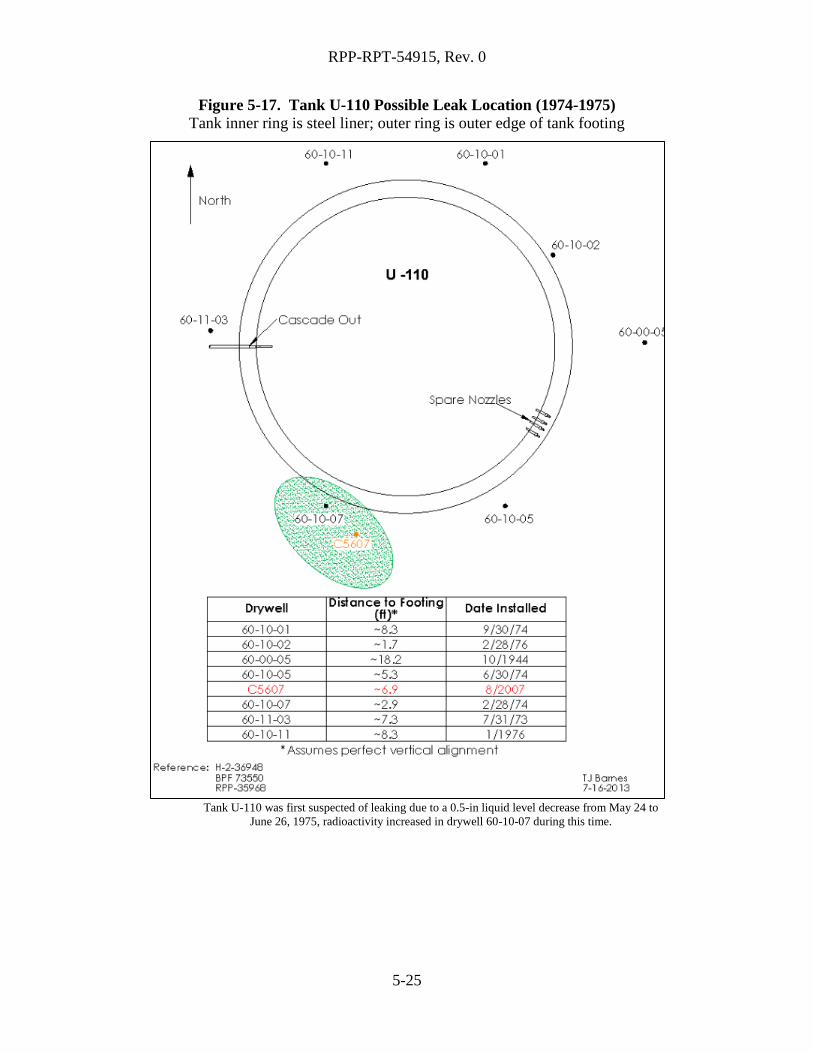
RPP-RPT-54915, Rev. 0
5-25
Figure 5-17. Tank U-110 Possible Leak Location (1974-1975)
Tank inner ring is steel liner; outer ring is outer edge of tank footing
Tank U-110 was first suspected of leaking due to a 0.5-in liquid level decrease from May 24 to
June 26, 1975, radioactivity increased in drywell 60-10-07 during this time.

RPP-RPT-54915, Rev. 0
5-26
POSSIBLE TANK U-110 LINER LEAK CAUSE(S) 5.7
Tank U-110 was evaluated for five conditions known to contribute to a failed liner.
5.7.1 Tank Design
The U Farm tank design should not have been a factor contributing to a failed liner in spite of the
tank U-104 experience (see Section 3.1.1).
5.7.2 Thermal Conditions
Limited temperature data are available for tank U-110 and no temperature data are available
during the storage of REDOX concentrated salt waste. The temperature during REDOX waste
storage resulted in a gradual decrease in liquid level indicating the temperature may have been
higher at that time as the liquid level decrease was attributed to evaporation. Temperatures after
storage of REDOX waste gradually decreased from ~140°F to ~115°F over a period of a year.
Thermal shock creates stress both from rapid temperature rise as well as waste-induced high
temperatures. Since no records are available during a period of evaporation, it is uncertain what
the maximum temperature was in tank U-110 during operation as well as the rate of temperature
rise when waste was added. The thermal attributes of the waste and other information (see
Section 5.4.2) would indicate that thermal stresses were likely minimal and should not have
challenged the tank storage limits.
Temperature requirements in ARH-951 (Limitations for Use of Underground Waste Tanks)
issued December 18, 1969 indicated that tank temperatures should be held below 230°F.
5.7.3 Chemistry-Corrosion
Tank U-110 stored REDOX concentrated salt waste for ~1.5 years at elevated temperatures ~19
years before the liner leak. REDOX waste under high heat conditions could have resulted in
pitting or SCC under tank U-110 conditions. The chemical content of the laboratory waste could
not be recovered and normally would be diluted; however, the quantity of 361 kgal over three
years leads to some uncertainty. Other waste types stored in tank U-110 should not have resulted
in pitting or SCC.
5.7.4 Liner Observations
A review of the available photographs for tank U-110 does not contain any evidence pointing to
a tank leak. There is no documentation available indicating a liner bulge was present in the tank.
5.7.5 Tank Construction Temperature
The U Farm tank liners were constructed between February 1944 and October 1944. Only
isolated minimum temperature were experienced during tank construction at or below 18F with
day time temperatures between 44F and 57F (see Section 5.3.2). Impact occurrences could
have occurred during cold temperatures that may have triggered fissures in the steel liner;
RPP-RPT-54915, Rev. 0
5-27
however, the possibility seems much less than that which might have occurred during
construction in other tank farms.
TANK U-110 CONCLUSIONS 5.8
Liquid level evidence and drywell radioactivity indicate that the tank U-110 liner leaked in at
least one location in the south southwest portion of the tank at or near the tank base.
There are several liner leak cause conditions that were examined and the likely one that might
have caused the tank U-110 liner leak was pitting and SCC from the storage of REDOX
concentrated salt waste or possible laboratory waste. However, the length of time from storage
of REDOX waste at elevated temperatures to evidence of a tank liner leak was ~19 years. The
unknown laboratory waste chemicals contained in the 316 kgal transferred to tank U-110, 3 years
prior to detecting the liner leak, may have had a corrosive influence.
There appears to be very little contribution from other wastes as well as from tank design and
construction temperatures. However, some or all of the factors can act serially or together to
contribute to tank liner failure.
RPP-RPT-54915, Rev. 0
A2-1
APPENDIX A2
TANK U-110 GROSS GAMMA DRYWELL DATA
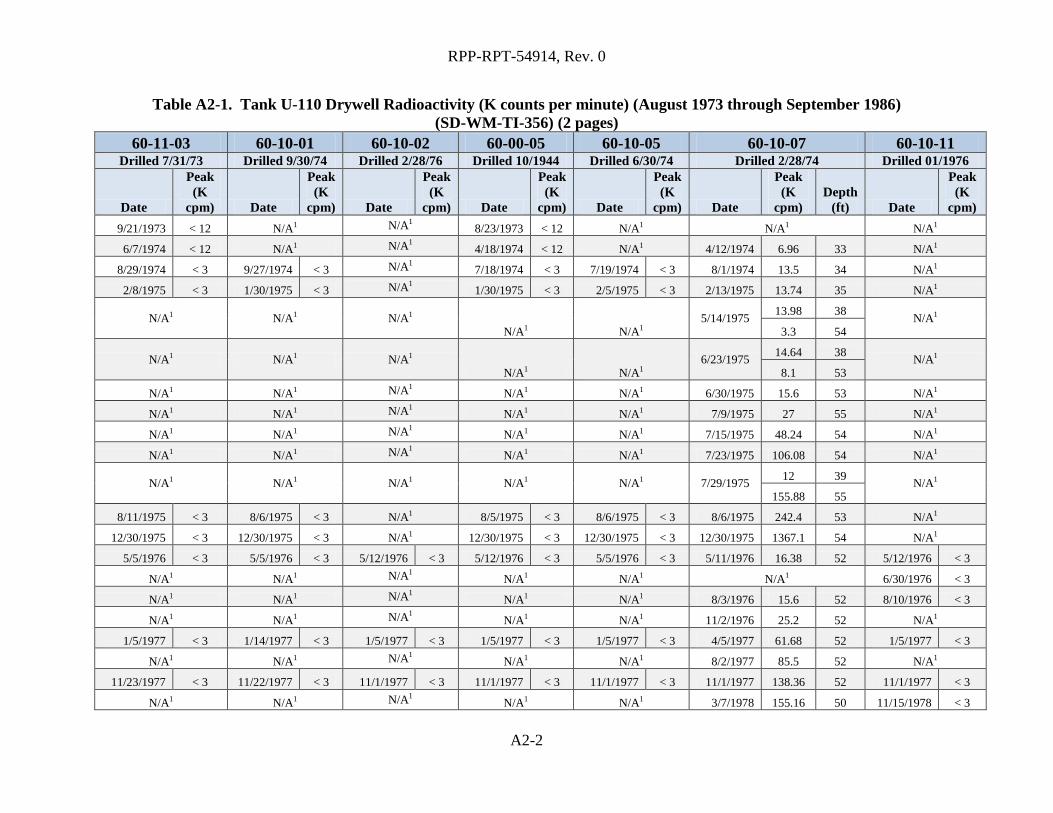
RPP-RPT-54914, Rev. 0
A2-2
Table A2-1. Tank U-110 Drywell Radioactivity (K counts per minute) (August 1973 through September 1986)
(SD-WM-TI-356) (2 pages)
60-11-03 60-10-01 60-10-02 60-00-05 60-10-05 60-10-07 60-10-11 Drilled 7/31/73 Drilled 9/30/74 Drilled 2/28/76 Drilled 10/1944 Drilled 6/30/74 Drilled 2/28/74 Drilled 01/1976
Date
Peak
(K
cpm) Date
Peak
(K
cpm) Date
Peak
(K
cpm) Date
Peak
(K
cpm) Date
Peak
(K
cpm) Date
Peak
(K
cpm)
Depth
(ft) Date
Peak
(K
cpm)
9/21/1973 < 12 N/A1 N/A1 8/23/1973 < 12 N/A1 N/A1 N/A1
6/7/1974 < 12 N/A1 N/A1 4/18/1974 < 12 N/A1 4/12/1974 6.96 33 N/A1
8/29/1974 < 3 9/27/1974 < 3 N/A1 7/18/1974 < 3 7/19/1974 < 3 8/1/1974 13.5 34 N/A1
2/8/1975 < 3 1/30/1975 < 3 N/A1 1/30/1975 < 3 2/5/1975 < 3 2/13/1975 13.74 35 N/A1
N/A1 N/A1 N/A1 N/A1 N/A1
5/14/1975 13.98 38
N/A1 3.3 54
N/A1 N/A1 N/A1 N/A1 N/A1
6/23/1975 14.64 38
N/A1 8.1 53
N/A1 N/A1 N/A1 N/A1 N/A1 6/30/1975 15.6 53 N/A1
N/A1 N/A1 N/A1 N/A1 N/A1 7/9/1975 27 55 N/A1
N/A1 N/A1 N/A1 N/A1 N/A1 7/15/1975 48.24 54 N/A1
N/A1 N/A1 N/A1 N/A1 N/A1 7/23/1975 106.08 54 N/A1
N/A1 N/A1 N/A1 N/A1 N/A1 7/29/1975 12 39
N/A1 155.88 55
8/11/1975 < 3 8/6/1975 < 3 N/A1 8/5/1975 < 3 8/6/1975 < 3 8/6/1975 242.4 53 N/A1
12/30/1975 < 3 12/30/1975 < 3 N/A1 12/30/1975 < 3 12/30/1975 < 3 12/30/1975 1367.1 54 N/A1
5/5/1976 < 3 5/5/1976 < 3 5/12/1976 < 3 5/12/1976 < 3 5/5/1976 < 3 5/11/1976 16.38 52 5/12/1976 < 3
N/A1 N/A1 N/A1 N/A1 N/A1 N/A1 6/30/1976 < 3
N/A1 N/A1 N/A1 N/A1 N/A1 8/3/1976 15.6 52 8/10/1976 < 3
N/A1 N/A1 N/A1 N/A1 N/A1 11/2/1976 25.2 52 N/A1
1/5/1977 < 3 1/14/1977 < 3 1/5/1977 < 3 1/5/1977 < 3 1/5/1977 < 3 4/5/1977 61.68 52 1/5/1977 < 3
N/A1 N/A1 N/A1 N/A1 N/A1 8/2/1977 85.5 52 N/A1
11/23/1977 < 3 11/22/1977 < 3 11/1/1977 < 3 11/1/1977 < 3 11/1/1977 < 3 11/1/1977 138.36 52 11/1/1977 < 3
N/A1 N/A1 N/A1 N/A1 N/A1 3/7/1978 155.16 50 11/15/1978 < 3

RPP-RPT-54914, Rev. 0
A2-3
60-11-03 60-10-01 60-10-02 60-00-05 60-10-05 60-10-07 60-10-11 Drilled 7/31/73 Drilled 9/30/74 Drilled 2/28/76 Drilled 10/1944 Drilled 6/30/74 Drilled 2/28/74 Drilled 01/1976
Date
Peak
(K
cpm) Date
Peak
(K
cpm) Date
Peak
(K
cpm) Date
Peak
(K
cpm) Date
Peak
(K
cpm) Date
Peak
(K
cpm)
Depth
(ft) Date
Peak
(K
cpm)
N/A1 N/A1 N/A1 N/A1 N/A1 4/4/1978 27.18 52 N/A1
11/15/1978 < 3 11/15/1978 < 3 11/15/1978 < 3 11/15/1978 < 3 11/15/1978 < 3 11/6/1978 37.44 52 N/A1
11/1/1979 < 3 11/1/1979 < 3 11/1/1979 < 3 10/31/1979 < 3 11/1/1979 < 3 10/22/1979 49.26 51 11/1/1979 < 3
11/13/1980 < 3 11/13/1980 < 3 11/13/1980 < 3 11/13/1980 < 3 11/13/1980 < 3 11/17/1980 47.22 53 11/13/1980 < 3
11/19/1981 < 3 11/19/1981 < 3 11/19/1981 < 3 11/11/1981 < 3 11/19/1981 < 3 11/16/1981 44.04 54 11/19/1981 < 3
11/3/1982 < 3 11/3/1982 < 3 11/3/1982 < 3 10/12/1982 < 3 11/3/1982 < 3 10/20/1982 52.5 53 11/3/1982 < 3
9/21/1983 < 3 9/21/1983 < 3 9/21/1983 < 3 9/21/1983 < 3 9/21/1983 < 3 9/20/1983 52.5 54 9/21/1983 < 3
8/23/1984 < 3 8/22/1984 < 3 8/22/1984 < 3 8/23/1984 < 3 8/22/1984 < 3 8/20/1984 53.58 54 8/22/1984 < 3
10/15/1985 < 3 10/15/1985 < 3 10/15/1985 < 3 10/15/1985 < 3 10/15/1985 < 3 10/14/1985 51.9 55 10/15/1985 < 3
9/17/1986 < 3 9/17/1986 < 3 9/17/1986 < 3 9/17/1986 < 3 9/17/1986 < 3 9/17/1986 38.88 55 9/17/1986 < 3
Note: 1N/A: Data not available

RPP-RPT-54915, Rev. 0
6-1
6.0 TANK 241-U-112 SEGMENT
TABLE OF CONTENTS
Tank U-112 Background History .................................................................................. 6-4 6.1
Tank U-112 Operations Summary ................................................................................ 6-5 6.2
Tank Design/Construction ............................................................................................ 6-7 6.3
6.3.1 Tank Design ......................................................................................................... 6-7
6.3.2 Tank Construction Conditions ............................................................................. 6-7
Tank U-112 In-Tank Data ............................................................................................. 6-7 6.4
6.4.1 Liquid Level ......................................................................................................... 6-7
6.4.2 Temperature ......................................................................................................... 6-9
6.4.3 Liner Observations ............................................................................................... 6-9
6.4.4 Chemistry-Corrosion............................................................................................ 6-9
6.4.5 Photographs........................................................................................................ 6-11
Tank U-112 Ex-Tank Data .......................................................................................... 6-14 6.5
6.5.1 Drywells ............................................................................................................. 6-14
6.5.1.1 Drywell 60-12-01 ............................................................................................. 6-14
6.5.1.2 Drywell 60-12-03 ............................................................................................. 6-16
6.5.1.3 Drywell 60-12-05 ............................................................................................. 6-17
6.5.1.4 Drywell 60-12-07 ............................................................................................. 6-18
6.5.1.5 Drywell 60-12-10 ............................................................................................. 6-19
6.5.1.6 Drywell 60-00-08 ............................................................................................. 6-20
6.5.1.7 2007 Direct Push .............................................................................................. 6-21
6.5.1.8 Drywell Summary ............................................................................................ 6-21
Possible Tank U-112 Liner Leak Location(s) ............................................................. 6-21 6.6
6.6.1 Leak Detected in 1964 ....................................................................................... 6-21
Possible Tank U-112 Liner Leak Cause(s) ................................................................. 6-23 6.7
6.7.1 Tank Design ....................................................................................................... 6-23
6.7.2 Thermal Conditions ........................................................................................... 6-23
6.7.3 Chemistry-Corrosion.......................................................................................... 6-23
6.7.4 Liner Observations ............................................................................................. 6-23

RPP-RPT-54915, Rev. 0
6-2
6.7.5 Tank Construction Temperature ........................................................................ 6-23
Tank U-112 Conclusions............................................................................................. 6-24 6.8
Appendices
Appendix A3 Tank U-112 Gross Gamma Drywell Data ......................................................... A3-1
LIST OF FIGURES
Figure 6-1. Tank U-112 Associated Drywells ............................................................................ 6-4
Figure 6-2. Operational Leak History of Tank U-112 ................................................................ 6-6
Figure 6-3. Tank U-112 End of Quarter Surface Level .............................................................. 6-8
Figure 6-4. Tank U-112 Liquid Level June 1964 through March 1970 ..................................... 6-9
Figure 6-5. Tank U-112 Photograph, June 5, 1975 ................................................................... 6-11
Figure 6-6. Tank U-112 Photograph March 12, 1970 .............................................................. 6-12
Figure 6-7. Tank U-112 Photograph March 12, 1970 .............................................................. 6-13
Figure 6-8. T Farm Bottom Liner Deformation during Construction April 15, 1944
(D2314) ................................................................................................................. 6-14
Figure 6-9. Tank U-112 Drywell 60-12-01 (RPP-7729) .......................................................... 6-15
Figure 6-10. Tank U-112 Drywell 60-12-03 (RPP-7729) ........................................................ 6-16
Figure 6-11. Tank U-112 Drywell 60-12-05 (RPP-7729) ........................................................ 6-17
Figure 6-12. Tank U-112 Drywell 60-12-07 (RPP-7729) ........................................................ 6-18
Figure 6-13. Tank U-112 Drywell 60-12-10 (RPP-7729) ........................................................ 6-19
Figure 6-14. Tank U-112 Drywell 60-00-08 (RPP-7729) ........................................................ 6-20
Figure 6-15. Tank U-112 Possible Leak Location (1964) ........................................................ 6-22

RPP-RPT-54915, Rev. 0
6-3
LIST OF TABLES
Table 6-1. Tank U-112 Waste Storage Chronology ................................................................. 6-10
Table 6-2. Waste Chemistries for Waste Types Stored in Tank U-112.................................... 6-10
Table A3-1. Tank U-112 Drywell Radioactivity (K counts per minute)
(August 1974 through October 1986) .................................................................. A3-2

RPP-RPT-54915, Rev. 0
6-4
TANK U-112 BACKGROUND HISTORY 6.1
This section provides information on the historical waste loss event associated with Single-Shell
Tank (SST) 241-U-112 (U-112). There are six drywells located around tank U-112 with
specified distances from the drywell to the tank footing shown in Figure 6-1: 60-00-08, installed
in 1944, 60-12-05, 60-12-07, and 60-12-10 installed in 1970, 60-12-03, installed in 1973, and 60-
12-01 installed in 1974. One nearby direct push, C5605, was installed in 2007.
The bottom of the tank footing is ~38-ft Below Grade Surface (BGS) with ~6-ft soil cover over
the dome (WHC-SD-WM-TI-665; BPF-73550).
Figure 6-1. Tank U-112 Associated Drywells
Tank inner ring is steel liner; outer ring is outer edge of tank footing

RPP-RPT-54915, Rev. 0
6-5
TANK U-112 OPERATIONS SUMMARY 6.2
Tank U-112 first began receiving 221-T Plant (T Plant) first cycle waste (1C) typically
neutralized with coating waste (CW) cascaded from tank U-111 in October 1947 (RPP-RPT-
50097, Rev. 0). Tank U-112 is the third tank in the three tank cascade series which includes
tanks U-110 and U-111. Tank U-112 was declared full in May 1948 (HW-10166-DEL, Hanford
Works Monthly Report May 1948). No other transfers occurred through July 1951 and no
records of tank transfers were available from August 1951 through March 1952.
By the end of April 1952, the supernatant was pumped out of tank U-112 as the waste volume
was reported as 32 kgal; however, the tank that received this waste was not recorded (HW-
27838). No additional transfers occurred through December 1953.
Beginning on January 13, 1954, concentrated salt waste from the REDOX plant continued to be
transferred to tank U-110, which cascaded to tanks U-111 and U-112 through April 22, 1954.
During this period, tank U-112 was filled to its nominal operating capacity of 514 kgal (HW-
31811, Separations Section Waste – Status Summary April 30, 1954, page 5). No additional
waste was added to tank U-112 from April 22, 1954 through August 1955, and the waste volume
in the tank remained unchanged from 514 kgal.
In May 1956, approximately 21 kgal of REDOX cladding (coating) waste (CW) was transferred
from tank U-110 to tank U-112 (HW-43490, page 6). The volume of waste stored in tank U-112
was reported as 530 kgal following this transfer. Based on the reported volume of waste in tank
U-112 in April 1954 (514 kgal) and May 1956 (530 kgal) following the transfer of CW (21 kgal)
into tank U-112, there is an apparent 5 kgal discrepancy in the material balance for this transfer.
No additional waste was added to tank U-112 after May 1956. However, a new electrode
measurement of the volume of waste stored in tank U-112 was conducted in January 1957 and
reported as 549 kgal (HW-48144, Chemical Processing Department Waste – Status Summary
January 1, 1957 – January 31, 1957, page 6). The volume of solids in tank U-112 was reported
as 32 kgal. The reported volume of waste in tank U-112 remained unchanged from January 1957
through June 30, 1964. No additional transfers occurred through December 1969.
Tank U-112 was first suspected of leaking based on a 3-in liquid level decrease between
February 1969 and March 1970 and classified as a “questionable integrity” tank (RHO-CD-896).
Tank U-112 was pumped to a minimum heel of 24.5-in and removed from service in March
1970.
From October 1974 through April 12, 1978, the remaining pumpable liquid in tank U-112 was
removed using a saltwell pump (DS-103174, Data Sheet Salt Well Transfer: Tk 112U to Tk-
109U). Tank U-112 was declared administratively interim stabilized in September 1979. As of
April 2013, tank U-112 contains 45 kgal of sludge with 4 kgal of drainable interstitial liquid
(HNF-EP-0182).
The operational history of tank U-112 leak related details including liquid level is charted in
Figure 6-2.
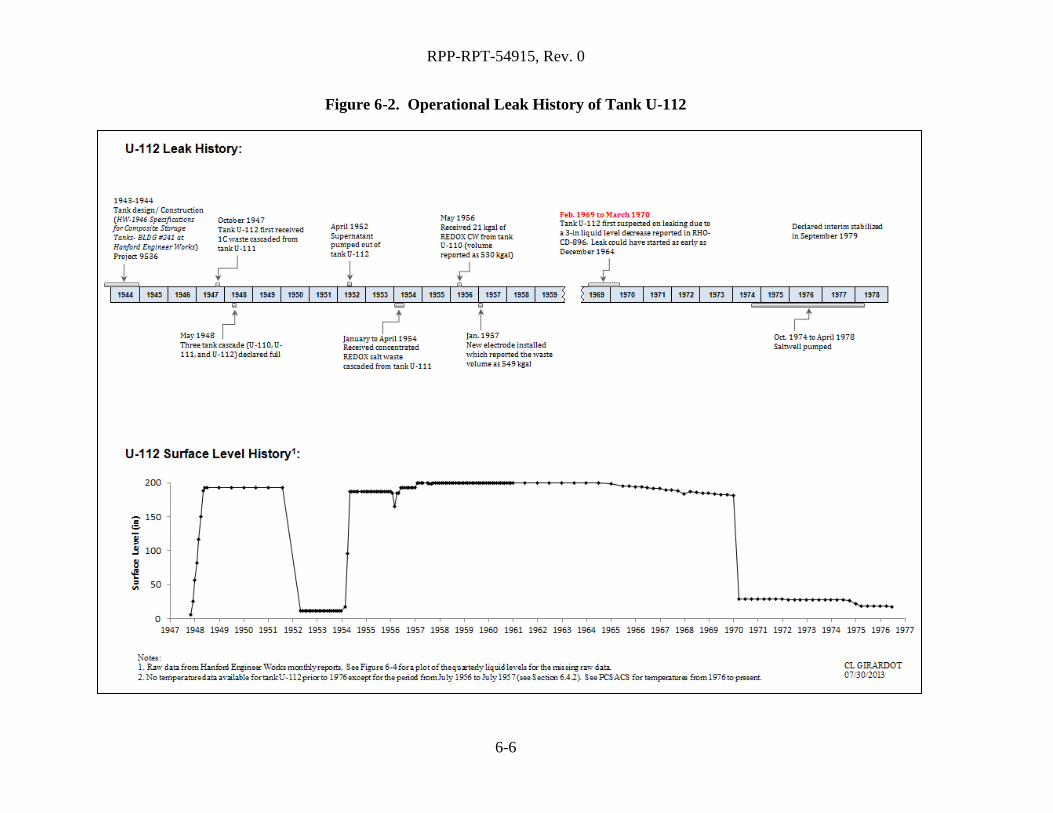
RPP-RPT-54915, Rev. 0
6-6
Figure 6-2. Operational Leak History of Tank U-112

RPP-RPT-54915, Rev. 0
6-7
TANK DESIGN/CONSTRUCTION 6.3
6.3.1 Tank Design
The steel bottoms of the U Farm tanks intersect the sidewall on a 4-ft radius knuckle transition
(BPF-73550, Drawings D-2 and D-3). The rounded knuckle transition, the three-ply asphaltic
membrane waterproofing between the liner and the concrete, a notched footing construction
joint, and the concrete shell are features common to all U Farm tanks (see Section 3.1.1).
6.3.2 Tank Construction Conditions
The U Farm tanks were constructed between February 1944 and October 1944. Temperatures
are not available for 1944 between May 18 and December 1. From the start of U Farm tank
construction through May 18, 1944 there were two minimum temperatures of 12F with daytime
temperatures of 44F and 57F, one at 18F, and four at 20F with day time temperatures
between 41F and 56F.
As described in Section 3.1.2, cold weather affects the ductile-to-brittle steel transition
temperature, with 18°F being the assumed design temperature for the carbon steel liner, which
could result in a fracture upon impact. However, in general, the temperatures during the U Farm
construction time frame were much milder than those experienced during 241-SX Farm
construction where ductile-to-brittle steel transition temperatures were exceeded.
Design, fabrication, and erection of the tank steel lining were required to be in accordance with
current “Standards Specifications for Elevated Steel Water Tanks, Standpipes and Reservoirs” as
promulgated by the “American Water Works Association” (BPF-73550). Welding requirements
were required to conform to the American Welding Society’s “Code for Arc and Gas Welding in
Building Construction”, Section 4.
TANK U-112 IN-TANK DATA 6.4
6.4.1 Liquid Level
The liquid level plot in Figure 6-3 indicates the transfer activity into and out of tank U-112. The
liquid levels are end of quarter levels so this figure may not reflect all transfers into and out of
the tank that occurred during the operational history. See Figure 6-2 for historical monthly liquid
level readings.
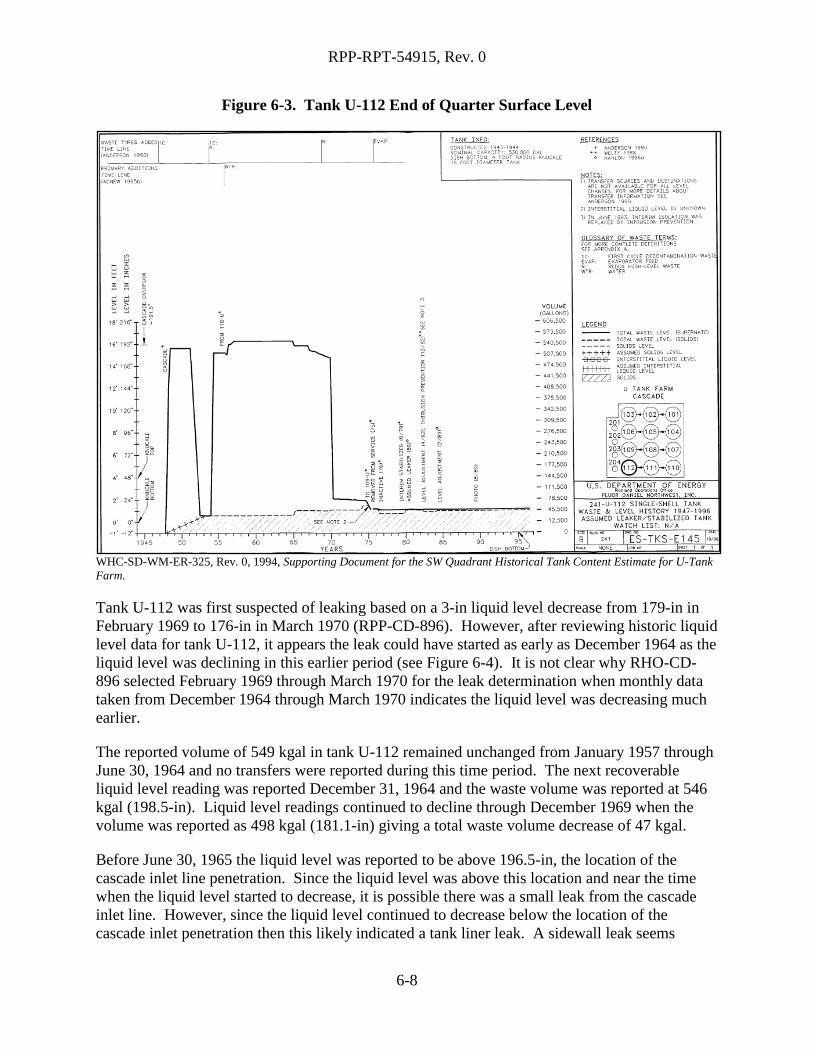
RPP-RPT-54915, Rev. 0
6-8
Figure 6-3. Tank U-112 End of Quarter Surface Level
WHC-SD-WM-ER-325, Rev. 0, 1994, Supporting Document for the SW Quadrant Historical Tank Content Estimate for U-Tank
Farm.
Tank U-112 was first suspected of leaking based on a 3-in liquid level decrease from 179-in in
February 1969 to 176-in in March 1970 (RPP-CD-896). However, after reviewing historic liquid
level data for tank U-112, it appears the leak could have started as early as December 1964 as the
liquid level was declining in this earlier period (see Figure 6-4). It is not clear why RHO-CD-
896 selected February 1969 through March 1970 for the leak determination when monthly data
taken from December 1964 through March 1970 indicates the liquid level was decreasing much
earlier.
The reported volume of 549 kgal in tank U-112 remained unchanged from January 1957 through
June 30, 1964 and no transfers were reported during this time period. The next recoverable
liquid level reading was reported December 31, 1964 and the waste volume was reported at 546
kgal (198.5-in). Liquid level readings continued to decline through December 1969 when the
volume was reported as 498 kgal (181.1-in) giving a total waste volume decrease of 47 kgal.
Before June 30, 1965 the liquid level was reported to be above 196.5-in, the location of the
cascade inlet line penetration. Since the liquid level was above this location and near the time
when the liquid level started to decrease, it is possible there was a small leak from the cascade
inlet line. However, since the liquid level continued to decrease below the location of the
cascade inlet penetration then this likely indicated a tank liner leak. A sidewall leak seems
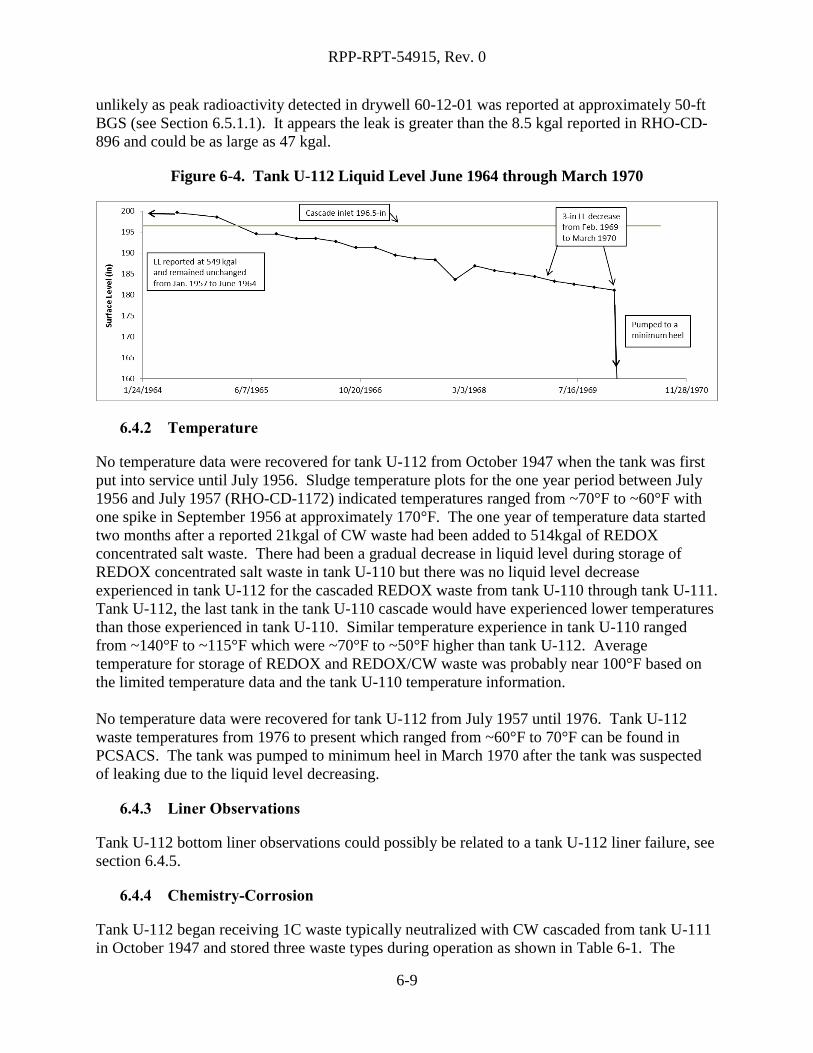
RPP-RPT-54915, Rev. 0
6-9
unlikely as peak radioactivity detected in drywell 60-12-01 was reported at approximately 50-ft
BGS (see Section 6.5.1.1). It appears the leak is greater than the 8.5 kgal reported in RHO-CD-
896 and could be as large as 47 kgal.
Figure 6-4. Tank U-112 Liquid Level June 1964 through March 1970
6.4.2 Temperature
No temperature data were recovered for tank U-112 from October 1947 when the tank was first
put into service until July 1956. Sludge temperature plots for the one year period between July
1956 and July 1957 (RHO-CD-1172) indicated temperatures ranged from ~70°F to ~60°F with
one spike in September 1956 at approximately 170°F. The one year of temperature data started
two months after a reported 21kgal of CW waste had been added to 514kgal of REDOX
concentrated salt waste. There had been a gradual decrease in liquid level during storage of
REDOX concentrated salt waste in tank U-110 but there was no liquid level decrease
experienced in tank U-112 for the cascaded REDOX waste from tank U-110 through tank U-111.
Tank U-112, the last tank in the tank U-110 cascade would have experienced lower temperatures
than those experienced in tank U-110. Similar temperature experience in tank U-110 ranged
from ~140°F to ~115°F which were ~70°F to ~50°F higher than tank U-112. Average
temperature for storage of REDOX and REDOX/CW waste was probably near 100°F based on
the limited temperature data and the tank U-110 temperature information.
No temperature data were recovered for tank U-112 from July 1957 until 1976. Tank U-112
waste temperatures from 1976 to present which ranged from ~60°F to 70°F can be found in
PCSACS. The tank was pumped to minimum heel in March 1970 after the tank was suspected
of leaking due to the liquid level decreasing.
6.4.3 Liner Observations
Tank U-112 bottom liner observations could possibly be related to a tank U-112 liner failure, see
section 6.4.5.
6.4.4 Chemistry-Corrosion
Tank U-112 began receiving 1C waste typically neutralized with CW cascaded from tank U-111
in October 1947 and stored three waste types during operation as shown in Table 6-1. The
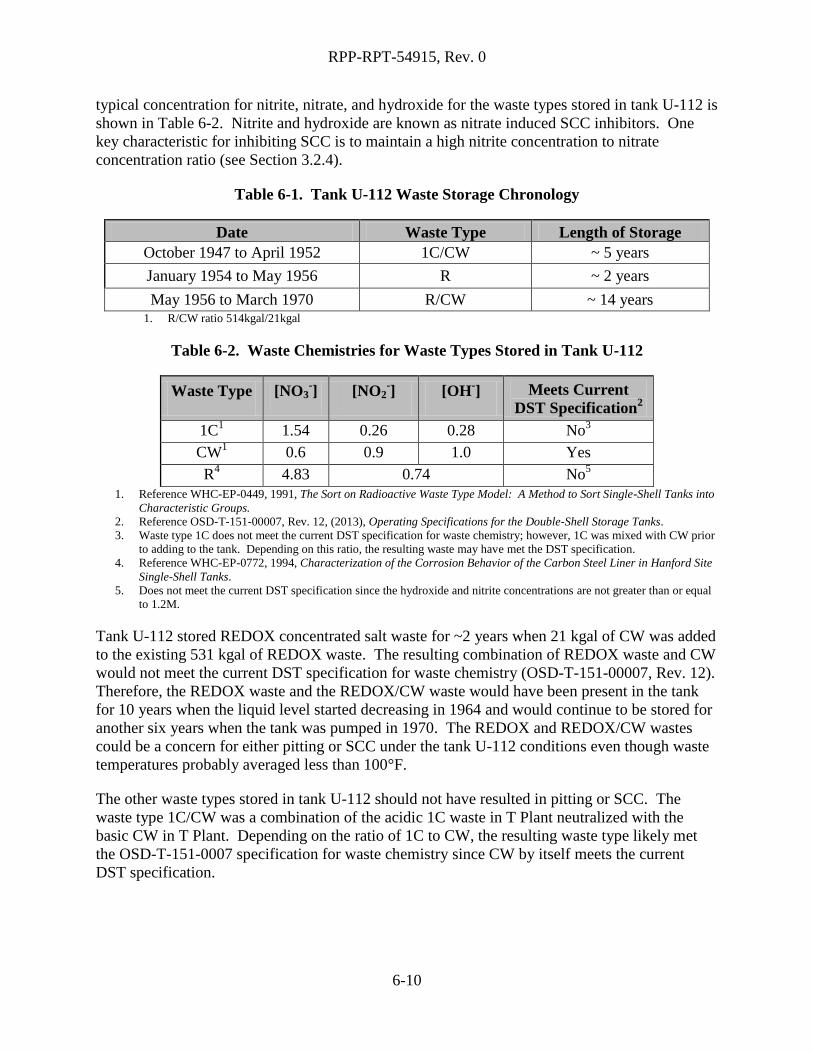
RPP-RPT-54915, Rev. 0
6-10
typical concentration for nitrite, nitrate, and hydroxide for the waste types stored in tank U-112 is
shown in Table 6-2. Nitrite and hydroxide are known as nitrate induced SCC inhibitors. One
key characteristic for inhibiting SCC is to maintain a high nitrite concentration to nitrate
concentration ratio (see Section 3.2.4).
Table 6-1. Tank U-112 Waste Storage Chronology
Date Waste Type Length of Storage
October 1947 to April 1952 1C/CW ~ 5 years
January 1954 to May 1956 R ~ 2 years
May 1956 to March 1970 R/CW ~ 14 years 1. R/CW ratio 514kgal/21kgal
Table 6-2. Waste Chemistries for Waste Types Stored in Tank U-112
Waste Type [NO3-]
[NO2-]
[OH-] Meets Current
DST Specification2
1C1
1.54 0.26 0.28 No3
CW
1 0.6 0.9 1.0 Yes
R4
4.83 0.74 No5
1. Reference WHC-EP-0449, 1991, The Sort on Radioactive Waste Type Model: A Method to Sort Single-Shell Tanks into
Characteristic Groups.
2. Reference OSD-T-151-00007, Rev. 12, (2013), Operating Specifications for the Double-Shell Storage Tanks.
3. Waste type 1C does not meet the current DST specification for waste chemistry; however, 1C was mixed with CW prior
to adding to the tank. Depending on this ratio, the resulting waste may have met the DST specification.
4. Reference WHC-EP-0772, 1994, Characterization of the Corrosion Behavior of the Carbon Steel Liner in Hanford Site
Single-Shell Tanks.
5. Does not meet the current DST specification since the hydroxide and nitrite concentrations are not greater than or equal
to 1.2M.
Tank U-112 stored REDOX concentrated salt waste for ~2 years when 21 kgal of CW was added
to the existing 531 kgal of REDOX waste. The resulting combination of REDOX waste and CW
would not meet the current DST specification for waste chemistry (OSD-T-151-00007, Rev. 12).
Therefore, the REDOX waste and the REDOX/CW waste would have been present in the tank
for 10 years when the liquid level started decreasing in 1964 and would continue to be stored for
another six years when the tank was pumped in 1970. The REDOX and REDOX/CW wastes
could be a concern for either pitting or SCC under the tank U-112 conditions even though waste
temperatures probably averaged less than 100°F.
The other waste types stored in tank U-112 should not have resulted in pitting or SCC. The
waste type 1C/CW was a combination of the acidic 1C waste in T Plant neutralized with the
basic CW in T Plant. Depending on the ratio of 1C to CW, the resulting waste type likely met
the OSD-T-151-0007 specification for waste chemistry since CW by itself meets the current
DST specification.
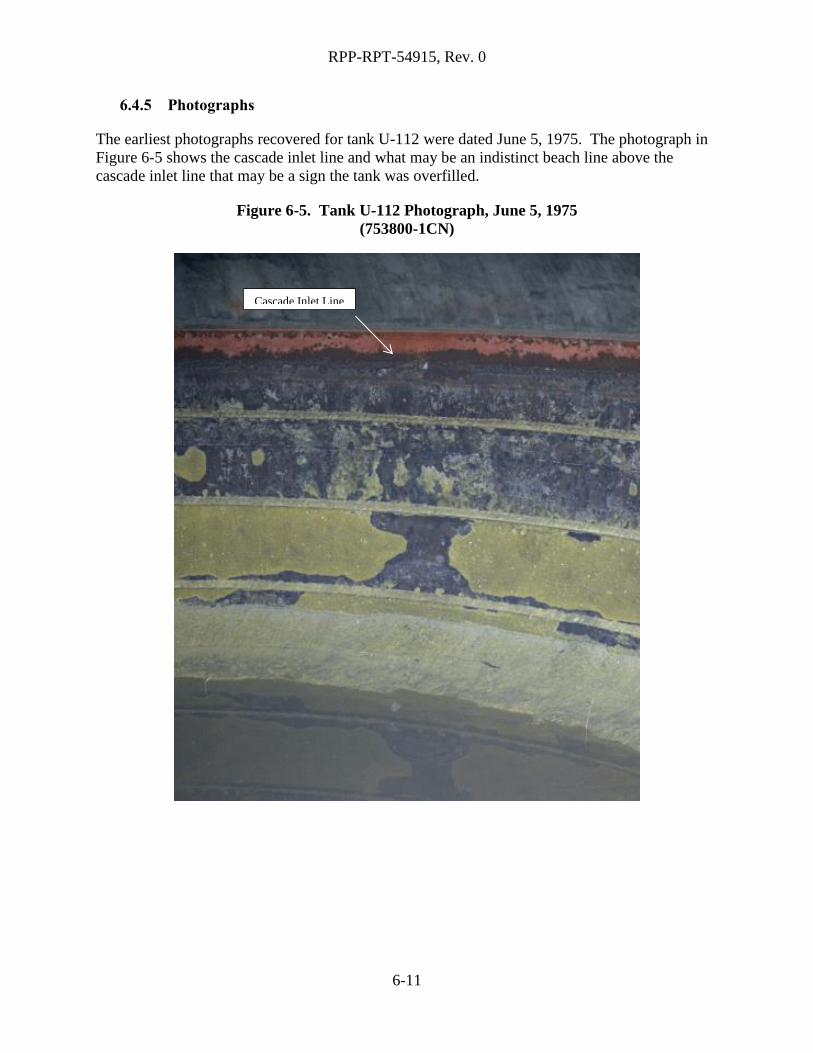
RPP-RPT-54915, Rev. 0
6-11
6.4.5 Photographs
The earliest photographs recovered for tank U-112 were dated June 5, 1975. The photograph in
Figure 6-5 shows the cascade inlet line and what may be an indistinct beach line above the
cascade inlet line that may be a sign the tank was overfilled.
Figure 6-5. Tank U-112 Photograph, June 5, 1975
(753800-1CN)
Cascade Inlet Line

RPP-RPT-54915, Rev. 0
6-12
Photographs of the tank U-112 were taken on March 12, 1970 after pumping the tank to ~80 kgal
with ~46 kgal of sludge. The photographs in Figure 6-6 and Figure 6-7 show a pattern of solids
below the liquid surface that appears to follow plate weld lines on the bottom tank liner. This
could possibly be related to deformation of the bottom plates creating stresses in the plates and
welds as the weight of waste increased during filling and emptying. The 241-T Farm tanks
experienced buckling of the bottom liner during construction of the tanks (see Figure 6-8) and all
of the 241-T Farm tank bottom liners required replacement (HW-7-103, Hanford Engineering
Works Monthly Report April 1944). A similar buckling of some or all of the U Farm tanks may
have occurred and was either not as severe or not recognized which may have resulted in the
pattern seen in Figure 6-6 and Figure 6-7 for tank U-112.
Figure 6-6. Tank U-112 Photograph March 12, 1970
Apparent Weld Ridge Pattern
(701199-4CN)
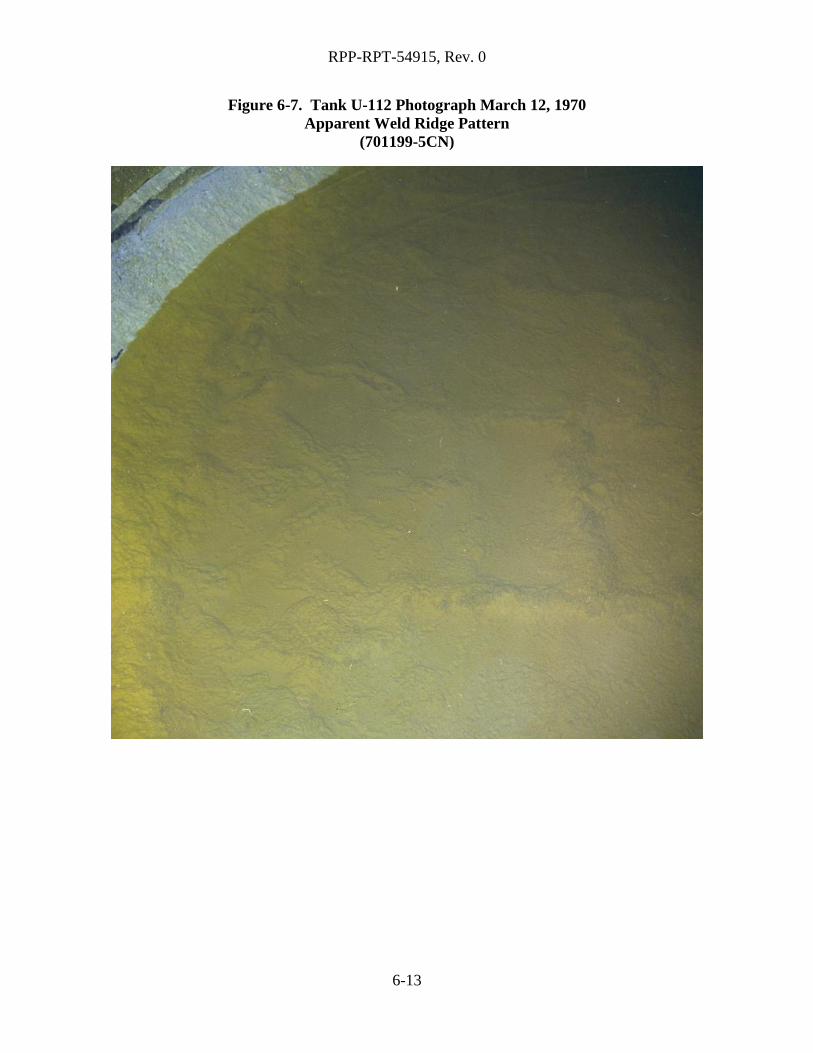
RPP-RPT-54915, Rev. 0
6-13
Figure 6-7. Tank U-112 Photograph March 12, 1970
Apparent Weld Ridge Pattern
(701199-5CN)

RPP-RPT-54915, Rev. 0
6-14
Figure 6-8. 241-T Farm Bottom Liner Deformation during Construction
April 15, 1944
(D2314)
TANK U-112 EX-TANK DATA 6.5
6.5.1 Drywells
There are six drywells located around tank U-112: 60-00-08, installed in 1944, 60-12-05, 60-12-
07, and 60-12-10 installed in 1970, 60-12-03, installed in 1973, 60-12-01 installed in 1974, and a
direct push installed in 2007. All of the radiation readings in drywells are assumed to be
maximum or peak readings unless otherwise noted (see Section 3.3.2). The following
subsections report the available drywell and direct push information including a summary and
analysis section for tank U-112.
6.5.1.1 Drywell 60-12-01
Drywell 60-12-01 is located approximately 5.6-ft from the north northeast side of tank U-112.
Drywell 60-12-01 was drilled in 1974 with the first recoverable reading on August 22, 1974
reported at 3,000K cpm at 50-ft BGS (see Appendix A3). The next recoverable reading reported
a peak at 831.5K cpm at 53-ft BGS. Readings remained relatively stable to March 7, 1977.
Following the use of new monitoring equipment, the peak was reported at approximately 340K
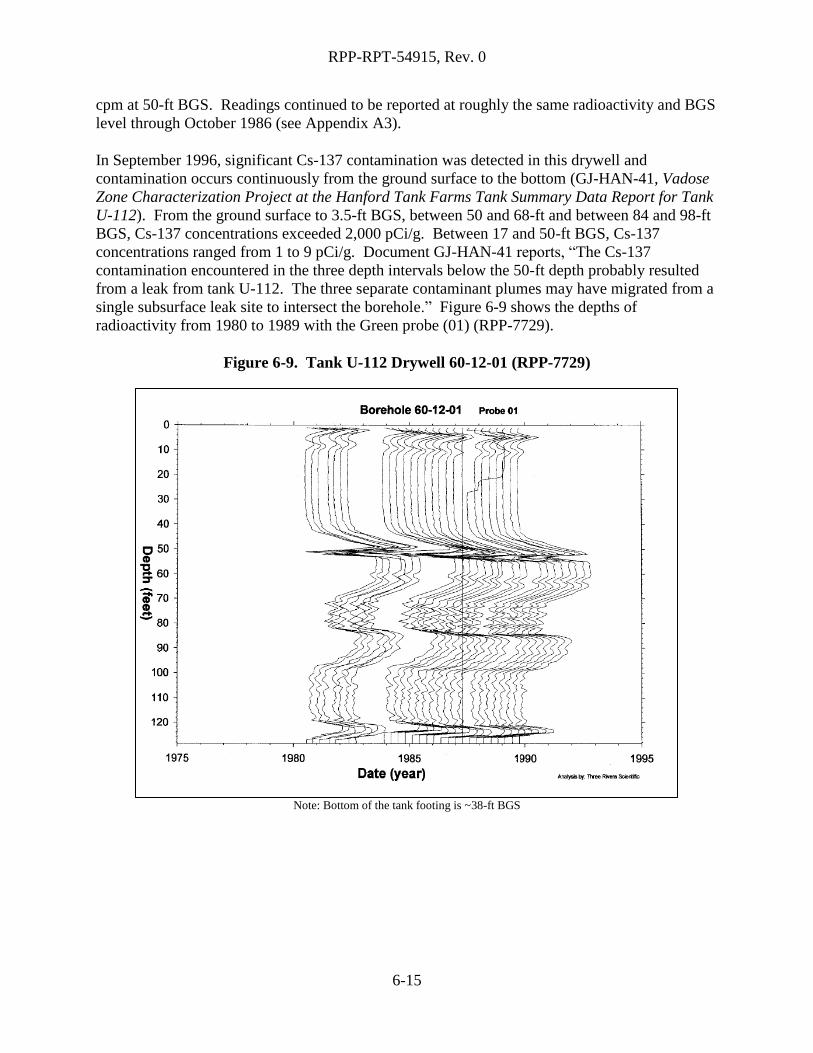
RPP-RPT-54915, Rev. 0
6-15
cpm at 50-ft BGS. Readings continued to be reported at roughly the same radioactivity and BGS
level through October 1986 (see Appendix A3).
In September 1996, significant Cs-137 contamination was detected in this drywell and
contamination occurs continuously from the ground surface to the bottom (GJ-HAN-41, Vadose
Zone Characterization Project at the Hanford Tank Farms Tank Summary Data Report for Tank
U-112). From the ground surface to 3.5-ft BGS, between 50 and 68-ft and between 84 and 98-ft
BGS, Cs-137 concentrations exceeded 2,000 pCi/g. Between 17 and 50-ft BGS, Cs-137
concentrations ranged from 1 to 9 pCi/g. Document GJ-HAN-41 reports, “The Cs-137
contamination encountered in the three depth intervals below the 50-ft depth probably resulted
from a leak from tank U-112. The three separate contaminant plumes may have migrated from a
single subsurface leak site to intersect the borehole.” Figure 6-9 shows the depths of
radioactivity from 1980 to 1989 with the Green probe (01) (RPP-7729).
Figure 6-9. Tank U-112 Drywell 60-12-01 (RPP-7729)
Note: Bottom of the tank footing is ~38-ft BGS

RPP-RPT-54915, Rev. 0
6-16
6.5.1.2 Drywell 60-12-03
Drywell 60-12-03 is located approximately 9.2-ft from the east side of tank U-112. Drywell 60-
12-03 was drilled in June 1973 with the first recoverable reading on September 21, 1973 reported
as less than values (see Appendix A3). Radioactivity continued to be reported as less than values
through October 1986.
In September 1996, Cs-137 was the only man-made radionuclides detected in drywell 60-12-03
(GJ-HAN-41). From the ground surface to 22-ft BGS, at 48-ft BGS, and at the bottom of the
drywell, Cs-137 contamination was detected intermittently. Most of the measured Cs-137
ranged between 0.14 and 0.2 pCi/g, the maximum concentration of 2 pCi/g was measured at the
bottom of the drywell (GJ-HAN-41).
Since historical radioactivity in this drywell is very low, and the GJ-HAN-41report indicated low
levels of radioactivity, drywell 60-12-03 is not being included as part of the leak location for
tank U-112. Figure 6-10 shows the depths of radioactivity from 1975 to 1995 (RPP-7729).
Figure 6-10. Tank U-112 Drywell 60-12-03 (RPP-7729)
Note: Bottom of the tank footing is ~38-ft BGS

RPP-RPT-54915, Rev. 0
6-17
6.5.1.3 Drywell 60-12-05
Drywell 60-12-05 is located approximately 3.5-ft from the southeast side of tank U-112.
Drywell 60-12-05 was drilled in June 1970 with the first recoverable readings reported on
September 21, 1973 as less than values (see Appendix A3). Radioactivity continued to be
reported as less than values through June 1986.
In September 1996, Cs-137 was the only man-made radionuclides detected in drywell 60-12-05
(GJ-HAN-41). From the ground surface to 11.5-ft BGS, 12.5, 15, 38, 42.5, between 52 and 53-
ft, and from 49-ft to the bottom of the drywell, Cs-137 contamination was detected
intermittently. The maximum concentration of just above 2 pCi/g was measured at the ground
surface and subsurface concentrations typically ranged between 0.14 and 1 pCi/g (GJ-HAN-41).
Since historical radioactivity in this drywell is very low, and the GJ-HAN-41report indicated low
levels of radioactivity, drywell 60-12-05 is not being included as part of the leak location for
tank U-112. Figure 6-11 shows the depths of radioactivity from 1975 to 1995 (RPP-7729).
Figure 6-11. Tank U-112 Drywell 60-12-05 (RPP-7729)
Note: Bottom of the tank footing is ~38-ft BGS

RPP-RPT-54915, Rev. 0
6-18
6.5.1.4 Drywell 60-12-07
Drywell 60-12-07 is located approximately 4.3-ft from the southwest side of tank U-112.
Drywell 60-12-07 was drilled in June 1970 with the first recoverable reading reported on August
23, 1973 as less than values (see Appendix A3). Radioactivity continued to be reported as less
than values through June 1986.
In September 1996, Cs-137 was the only man-made radionuclides detected in drywell 60-12-07
(GJ-HAN-41). The maximum Cs-137 concentration was about 11 pCi/g at the top of the drywell
and subsurface concentrations ranged from 0.2 to 1 pCi/g (GJ-HAN-41).
Since historical radioactivity in this drywell is very low, and the GJ-HAN-41 report indicated
low levels of radioactivity, drywell 60-12-07 is not being included as part of the leak location for
tank U-112. Figure 6-12 shows the depths of radioactivity from 1975 to 1995 (RPP-7729).
Figure 6-12. Tank U-112 Drywell 60-12-07 (RPP-7729)
Note: Bottom of the tank footing is ~38-ft BGS
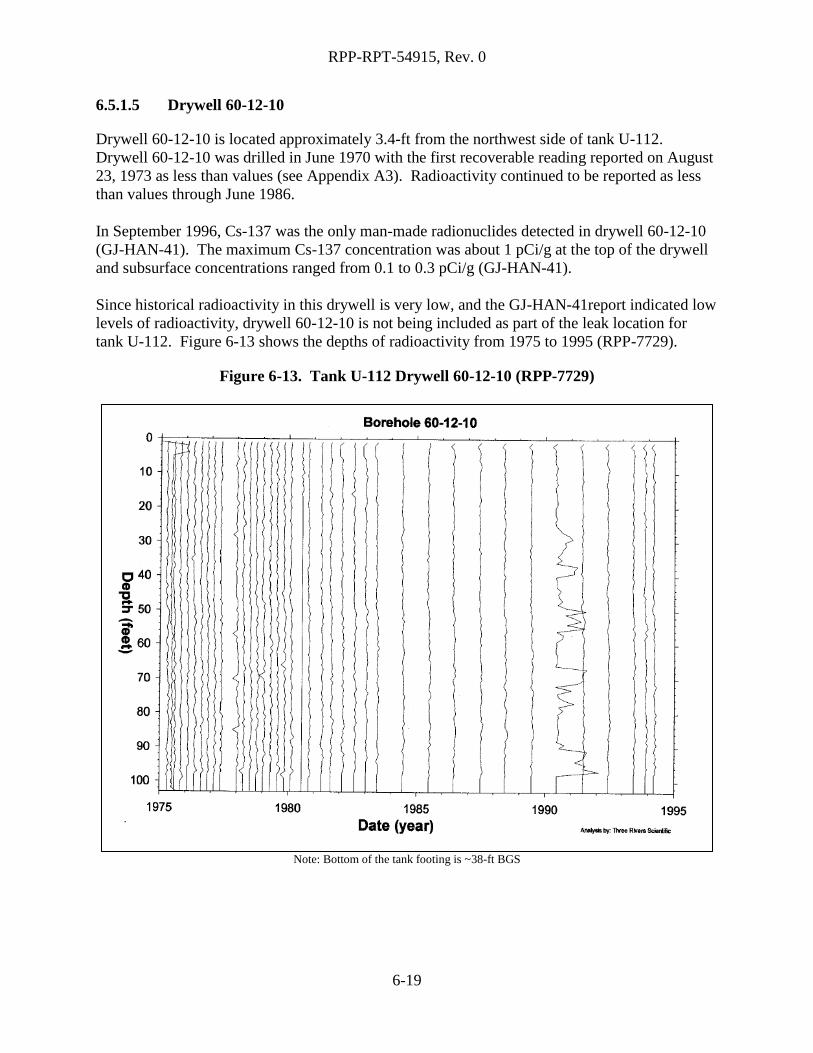
RPP-RPT-54915, Rev. 0
6-19
6.5.1.5 Drywell 60-12-10
Drywell 60-12-10 is located approximately 3.4-ft from the northwest side of tank U-112.
Drywell 60-12-10 was drilled in June 1970 with the first recoverable reading reported on August
23, 1973 as less than values (see Appendix A3). Radioactivity continued to be reported as less
than values through June 1986.
In September 1996, Cs-137 was the only man-made radionuclides detected in drywell 60-12-10
(GJ-HAN-41). The maximum Cs-137 concentration was about 1 pCi/g at the top of the drywell
and subsurface concentrations ranged from 0.1 to 0.3 pCi/g (GJ-HAN-41).
Since historical radioactivity in this drywell is very low, and the GJ-HAN-41report indicated low
levels of radioactivity, drywell 60-12-10 is not being included as part of the leak location for
tank U-112. Figure 6-13 shows the depths of radioactivity from 1975 to 1995 (RPP-7729).
Figure 6-13. Tank U-112 Drywell 60-12-10 (RPP-7729)
Note: Bottom of the tank footing is ~38-ft BGS
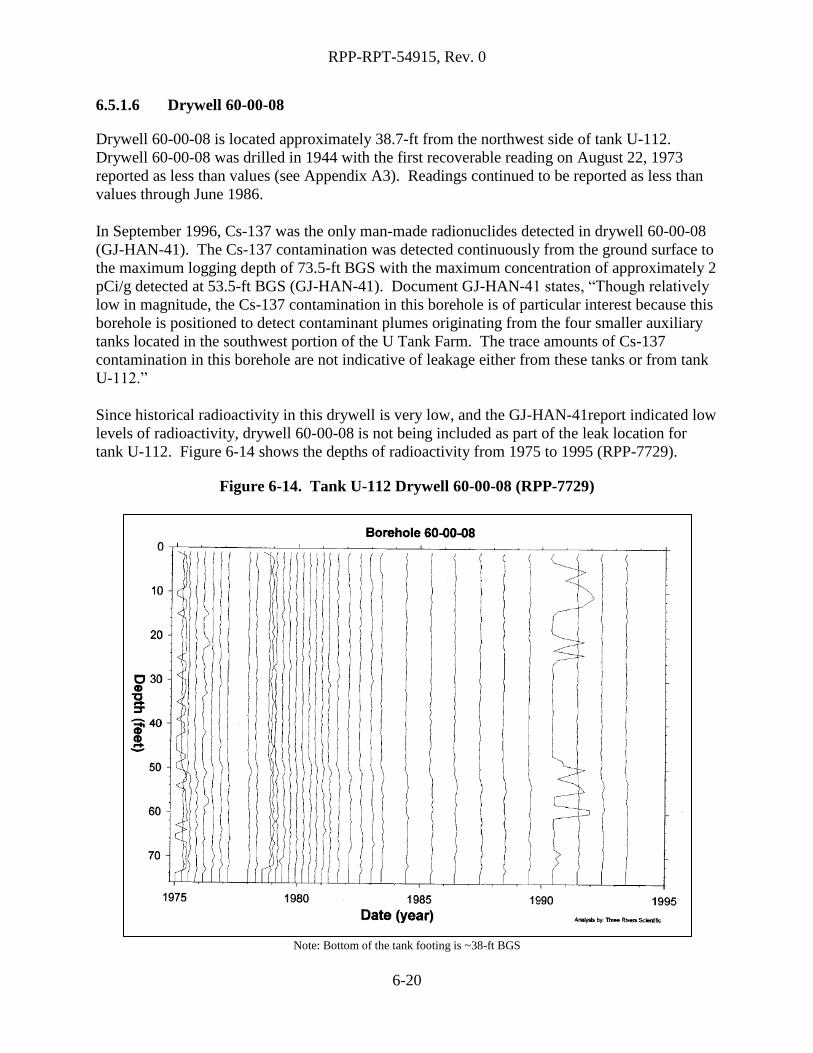
RPP-RPT-54915, Rev. 0
6-20
6.5.1.6 Drywell 60-00-08
Drywell 60-00-08 is located approximately 38.7-ft from the northwest side of tank U-112.
Drywell 60-00-08 was drilled in 1944 with the first recoverable reading on August 22, 1973
reported as less than values (see Appendix A3). Readings continued to be reported as less than
values through June 1986.
In September 1996, Cs-137 was the only man-made radionuclides detected in drywell 60-00-08
(GJ-HAN-41). The Cs-137 contamination was detected continuously from the ground surface to
the maximum logging depth of 73.5-ft BGS with the maximum concentration of approximately 2
pCi/g detected at 53.5-ft BGS (GJ-HAN-41). Document GJ-HAN-41 states, “Though relatively
low in magnitude, the Cs-137 contamination in this borehole is of particular interest because this
borehole is positioned to detect contaminant plumes originating from the four smaller auxiliary
tanks located in the southwest portion of the U Tank Farm. The trace amounts of Cs-137
contamination in this borehole are not indicative of leakage either from these tanks or from tank
U-112.”
Since historical radioactivity in this drywell is very low, and the GJ-HAN-41report indicated low
levels of radioactivity, drywell 60-00-08 is not being included as part of the leak location for
tank U-112. Figure 6-14 shows the depths of radioactivity from 1975 to 1995 (RPP-7729).
Figure 6-14. Tank U-112 Drywell 60-00-08 (RPP-7729)
Note: Bottom of the tank footing is ~38-ft BGS
RPP-RPT-54915, Rev. 0
6-21
6.5.1.7 2007 Direct Push
In 2007, one direct push (C5605) was installed near tank U-112 (near drywell 60-12-01) for
moisture and spectral gamma logging (see Figure 6-1).
Results identified elevated moisture contents (25%) in the 50 to 95-ft BGS range, while only
background levels of Cs-137 were recorded throughout the logging (RPP-36007). Therefore,
direct push C5605 is not included in the leak location for tank U-112.
6.5.1.8 Drywell Summary
Tank U-112 was first suspected of leaking based on a 3-in liquid level decrease between
February 1969 and March 1970; however, the leak could have started as early as December 1964
(see Section 6.4.1). Drywells were installed near tank U-112 in 1970-1974.
Tank U-112 drywells 60-12-03, 60-12-05, 60-12-07, 60-12-10, and 60-00-08 do not indicate any
radioactivity associated with a tank U-112 leak. Therefore, these drywells are not included in the
leak location for tank U-112.
The first recoverable reading in August 1974 for drywell 60-12-01 indicate radioactivity. A peak
of 3,000K cpm was reported in drywell 60-12-01 at 50-ft BGS. Radioactivity declined to
approximately 830K cpm the next month in September 1974. Readings remained relatively
stable through October 1986. It appears the source of the radioactivity detected in this drywell is
tank U-112.
Direct push C5605, installed in 2007, reported elevated moisture content in the 50 to 95-ft BGS
range and background levels of Cs-137 throughout the logging. Thus, direct push C5605 is not
included in the leak location for tank U-112. No laterals were installed under tank U-112.
POSSIBLE TANK U-112 LINER LEAK LOCATION(S) 6.6
A liner leak may have penetrated the waterproof membrane at any location or pooled on the
waterproof membrane and followed concrete cracks or construction joints to a different location
for egress to the soil, including the top of the tank footing.
Tank U-112 had at least one liner leak site based on radioactivity detected in drywell 60-12-01,
likely at or near the bottom of the tank. There is also a possibility of a small leak from the
cascade inlet line which probably would not have been detected in any nearby drywells during
this time.
6.6.1 Leak Detected in 1964
Tank U-112 was first reported as leaking due to a 3-in liquid level drop between February 1969
and March 1970 (RHO-CD-896). However, it appears the tank U-112 leak could have started as
early as December 1964 due to the liquid level decreasing from December 1964 until March
1970, when the tank was pumped down to minimum heel. The leak was detected in drywell 60-
12-01 in the northeast portion of the tank when the drywell was drilled in 1974 (see Figure 6-15).
No other drywells indicated a tank U-112 leak.
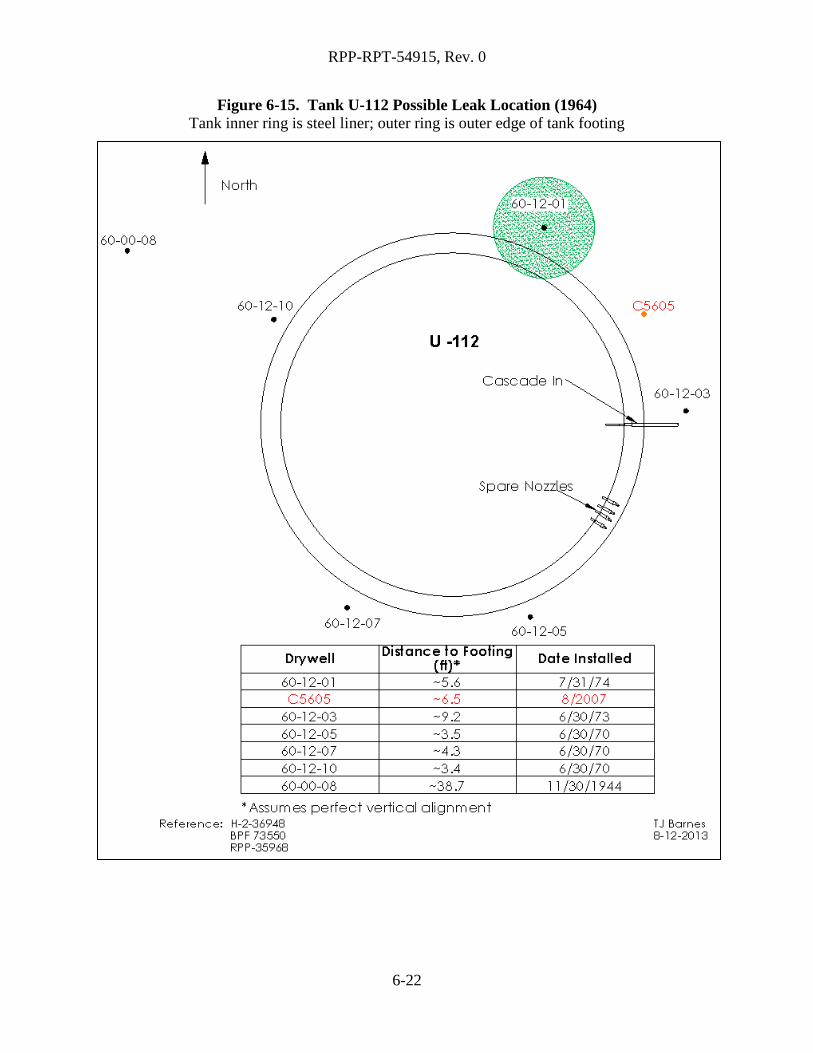
RPP-RPT-54915, Rev. 0
6-22
Figure 6-15. Tank U-112 Possible Leak Location (1964)
Tank inner ring is steel liner; outer ring is outer edge of tank footing
RPP-RPT-54915, Rev. 0
6-23
POSSIBLE TANK U-112 LINER LEAK CAUSE(S) 6.7
Tank U-112 was evaluated for five conditions known to contribute to a failed liner.
6.7.1 Tank Design
The U Farm tank design does not appear to be a factor contributing to a failed liner (see Section
3.1.1).
6.7.2 Thermal Conditions
Limited temperature data are available for tank U-112 from October 1947 when the tank was
first put into service until 1976. Sludge temperature plots for the one year period between July
1956 and July 1957 (RHO-CD-1172) after receiving some CW with the existing REDOX waste
indicated temperatures ranged from ~60°F to ~70°F with one spike in September 1956 at
approximately 170°F. Tank U-112 did not experience evaporation liquid level decreases like
Tank U-110. Tank U-112, the last tank in the tank U-110 cascade would have experienced lower
temperatures than those experienced in tank U-110 (see Section 6.4.2).
Thermal shock creates stress both from rapid temperature rise as well as waste-induced high
temperatures. Since no records are available during a period of evaporation, it is uncertain what
the maximum temperature was in tank U-112 during operation as well as the rate of temperature
rise when waste was added. The thermal attributes of the waste and other information (see
Section 6.4.2) would indicate that thermal stresses were likely minimal and should not have
challenged the tank storage limits.
Temperature requirements in ARH-951 (Limitations for Use of Underground Waste Tanks)
issued December 18, 1969 indicated that tank temperatures should be held below 230°F.
6.7.3 Chemistry-Corrosion
Tank U-112 stored REDOX and REDOX/CW waste for ~10 years prior to the 1964 start of
decreasing liquid levels at temperatures probably averaging ~100°F. The REDOX and
REDOX/CW waste could have resulted in pitting or SCC under tank U-112 conditions. Other
waste types stored in tank U-112 should not have resulted in pitting or SCC.
6.7.4 Liner Observations
A review of the available photographs for tank U-112 indicates some possible bottom liner
deformation that may have resulted in stressing and weakening of the plates and welds. There is
no documentation available indicating a liner bulge was present in tank U-112.
6.7.5 Tank Construction Temperature
The U Farm tank liners were constructed between February 1944 and October 1944. Only
isolated minimum temperature were experienced during tank construction at or below 18F with
day time temperatures between 44F and 57F (see Section 6.3.2). Impact occurrences could
have occurred during cold temperatures that may have triggered fissures in the steel liner;
RPP-RPT-54915, Rev. 0
6-24
however, the possibility seems much less than that which might have occurred during
construction in other tank farms.
TANK U-112 CONCLUSIONS 6.8
Liquid level evidence and drywell radioactivity indicate that the tank U-112 liner leaked in at
least one location in the north north-east portion of the tank at or near the tank base.
There are several liner leak cause conditions that were examined and the one that probably
caused the tank U-112 liner leak was chemistry-corrosion from pitting and SCC from the storage
of REDOX and REDOX/CW waste. Tank U-112 may also have experienced deformation of the
bottom liner during construction which may have resulted in stressing and weakening of the
plates and welds.
There appears to be very little contribution from other wastes as well as from tank design and
construction temperatures. However, some or all of the factors can act serially or together to
contribute to tank liner failure.

RPP-RPT-54915, Rev. 0
A3-1
APPENDIX A3
TANK U-112 GROSS GAMMA DRYWELL DATA
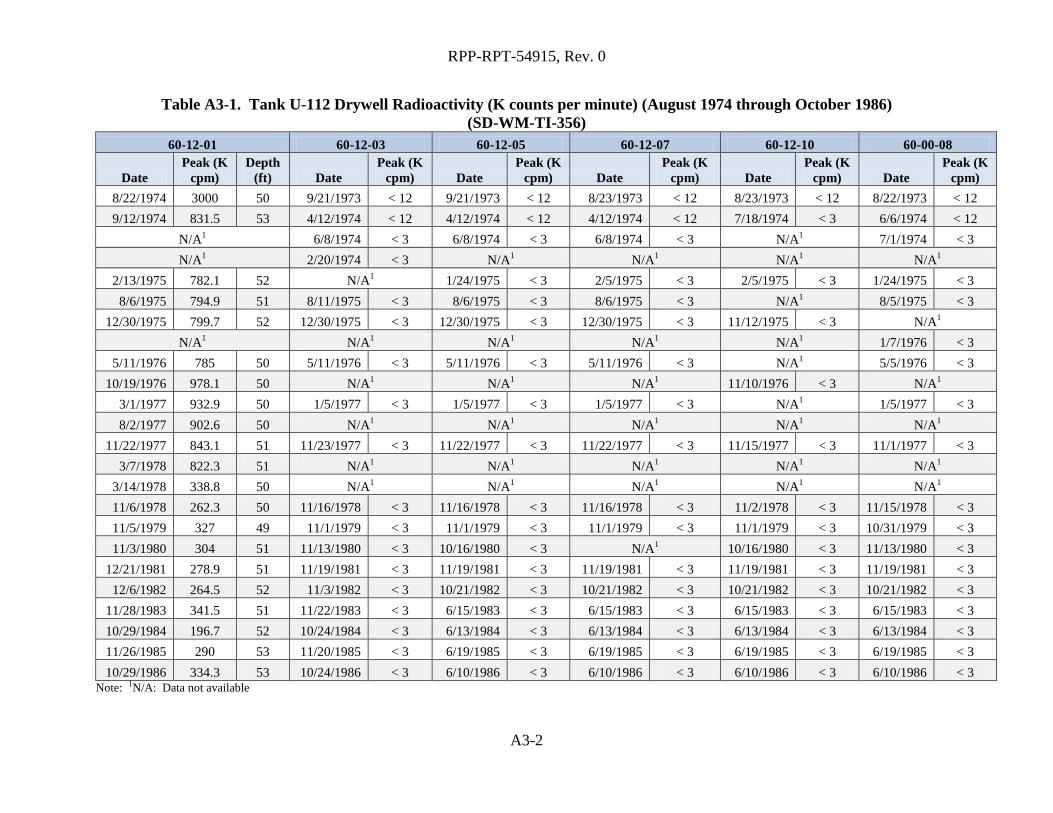
RPP-RPT-54915, Rev. 0
A3-2
Table A3-1. Tank U-112 Drywell Radioactivity (K counts per minute) (August 1974 through October 1986)
(SD-WM-TI-356)
60-12-01 60-12-03 60-12-05 60-12-07 60-12-10 60-00-08
Date
Peak (K
cpm)
Depth
(ft) Date
Peak (K
cpm) Date
Peak (K
cpm) Date
Peak (K
cpm) Date
Peak (K
cpm) Date
Peak (K
cpm)
8/22/1974 3000 50 9/21/1973 < 12 9/21/1973 < 12 8/23/1973 < 12 8/23/1973 < 12 8/22/1973 < 12
9/12/1974 831.5 53 4/12/1974 < 12 4/12/1974 < 12 4/12/1974 < 12 7/18/1974 < 3 6/6/1974 < 12
N/A1 6/8/1974 < 3 6/8/1974 < 3 6/8/1974 < 3 N/A
1 7/1/1974 < 3
N/A1 2/20/1974 < 3 N/A
1 N/A
1 N/A
1 N/A
1
2/13/1975 782.1 52 N/A1 1/24/1975 < 3 2/5/1975 < 3 2/5/1975 < 3 1/24/1975 < 3
8/6/1975 794.9 51 8/11/1975 < 3 8/6/1975 < 3 8/6/1975 < 3 N/A1 8/5/1975 < 3
12/30/1975 799.7 52 12/30/1975 < 3 12/30/1975 < 3 12/30/1975 < 3 11/12/1975 < 3 N/A1
N/A1 N/A
1 N/A
1 N/A
1 N/A
1 1/7/1976 < 3
5/11/1976 785 50 5/11/1976 < 3 5/11/1976 < 3 5/11/1976 < 3 N/A1 5/5/1976 < 3
10/19/1976 978.1 50 N/A1 N/A
1 N/A
1 11/10/1976 < 3 N/A
1
3/1/1977 932.9 50 1/5/1977 < 3 1/5/1977 < 3 1/5/1977 < 3 N/A1 1/5/1977 < 3
8/2/1977 902.6 50 N/A1 N/A
1 N/A
1 N/A
1 N/A
1
11/22/1977 843.1 51 11/23/1977 < 3 11/22/1977 < 3 11/22/1977 < 3 11/15/1977 < 3 11/1/1977 < 3
3/7/1978 822.3 51 N/A1 N/A
1 N/A
1 N/A
1 N/A
1
3/14/1978 338.8 50 N/A1 N/A
1 N/A
1 N/A
1 N/A
1
11/6/1978 262.3 50 11/16/1978 < 3 11/16/1978 < 3 11/16/1978 < 3 11/2/1978 < 3 11/15/1978 < 3
11/5/1979 327 49 11/1/1979 < 3 11/1/1979 < 3 11/1/1979 < 3 11/1/1979 < 3 10/31/1979 < 3
11/3/1980 304 51 11/13/1980 < 3 10/16/1980 < 3 N/A1 10/16/1980 < 3 11/13/1980 < 3
12/21/1981 278.9 51 11/19/1981 < 3 11/19/1981 < 3 11/19/1981 < 3 11/19/1981 < 3 11/19/1981 < 3
12/6/1982 264.5 52 11/3/1982 < 3 10/21/1982 < 3 10/21/1982 < 3 10/21/1982 < 3 10/21/1982 < 3
11/28/1983 341.5 51 11/22/1983 < 3 6/15/1983 < 3 6/15/1983 < 3 6/15/1983 < 3 6/15/1983 < 3
10/29/1984 196.7 52 10/24/1984 < 3 6/13/1984 < 3 6/13/1984 < 3 6/13/1984 < 3 6/13/1984 < 3
11/26/1985 290 53 11/20/1985 < 3 6/19/1985 < 3 6/19/1985 < 3 6/19/1985 < 3 6/19/1985 < 3
10/29/1986 334.3 53 10/24/1986 < 3 6/10/1986 < 3 6/10/1986 < 3 6/10/1986 < 3 6/10/1986 < 3 Note: 1N/A: Data not available

RPP-RPT-54915, Rev. 0
7-1
7.0 CONCLUSIONS
Liner leaks probably occurred at or near the base of all three leaking U Farm tanks. The bulging
bottom liner of tank U-104 and the depth of radioactivity detected in tank U-104, U-110, and
tank U-112 drywells all point to a liner leak near the bottom of the tank.
There are several liner leak cause conditions that were examined for tanks U-104, U-110, and U-
112 which include tank design, construction conditions, thermal conditions, and chemistry-
corrosion. Thermal conditions appear to be the most likely cause of the tank U-104 liner leak.
Chemistry-corrosion, relating to the storage of REDOX waste appears to be the most likely cause
of the leak(s) for tanks U-110 and U-112 and possible laboratory wastes for tank U-110.
REDOX waste at elevated temperatures could have created an environment conducive to pitting
and SCC. Tank U-112 may also have experienced deformation of the bottom liner during
construction possibly creating stresses and weakening of the plates and welds.
Tank U-104 experienced a 5-ft bulge in the bottom liner which was detected while completing
sluicing of the second batch of MW. The liner bulge was probably the result of temperature rate
of rise especially during the second filling of the tank with MW. This could have set up a
situation where vapor pressure under the bottom liner was greater than the hydrostatic pressure.
The bulge probably weakened the bottom liner to the point of failure which was confirmed by
subsequent leak testing and detection of drywell radioactivity.
Both tank U-110 and U-112 experienced liner failures that were detected by a liquid level
decrease and subsequently confirmed by the detection of drywell radioactivity in one of the
drywells surrounding each of the tanks. Corrosion may have been a factor in each case as both
tank U-110 and U-112 stored REDOX waste which is conducive to pitting and SCC. Tank U-
110 also stored several hundred thousand gallons of unknown laboratory waste which may have
influenced corrosion. Tank U-112 may also have experienced deformation of the bottom liner
during construction which may have resulted in stressing and weakening of the plates and welds.
There appears to be very little contribution from tank design and construction temperatures.
However, some or all of the factors can act serially or together to contribute to tank failure.
Basic information on the leaking U Farm tanks and the U Farm sound tanks are listed separately
in Table 7-1 and Table 7-2. The information was reviewed to identify any differences between
leaking and sound tanks related to liner failure. A number of the sound tanks contained REDOX
waste under similar conditions that may have caused corrosion that resulted in the tank U-110
and tank U-112 liner leaks.
The sound tank U-111 is one of the tanks that stored REDOX waste. It is in the curious position
of being the second tank of the three tank cascade from tank U-110 to tank U-112 both of which
are leaking tanks. This would seem to put into question the postulated REDOX waste corrosion
effect unless there was some other unknown factor influencing corrosion rate or other conditions
such as tank U-112 with the possibility of bottom liner stresses caused by poor construction of
the bottom liner. There doesn’t seem to be any of the basic information that stands out as the
reason sound tanks did not experience liner leaks.
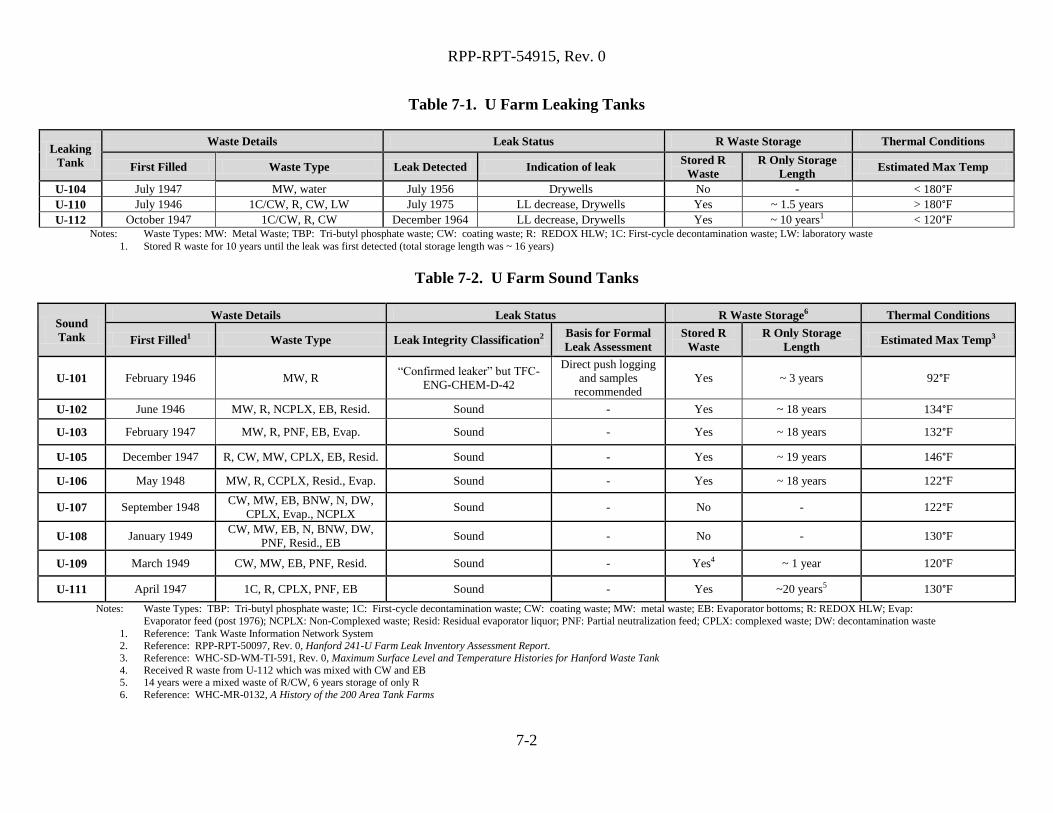
RPP-RPT-54915, Rev. 0
7-2
Table 7-1. U Farm Leaking Tanks
Leaking
Tank
Waste Details Leak Status R Waste Storage Thermal Conditions
First Filled Waste Type Leak Detected Indication of leak Stored R
Waste
R Only Storage
Length Estimated Max Temp
U-104 July 1947 MW, water July 1956 Drywells No - < 180°F
U-110 July 1946 1C/CW, R, CW, LW July 1975 LL decrease, Drywells Yes ~ 1.5 years > 180°F
U-112 October 1947 1C/CW, R, CW December 1964 LL decrease, Drywells Yes ~ 10 years1 < 120°F Notes: Waste Types: MW: Metal Waste; TBP: Tri-butyl phosphate waste; CW: coating waste; R: REDOX HLW; 1C: First-cycle decontamination waste; LW: laboratory waste
1. Stored R waste for 10 years until the leak was first detected (total storage length was ~ 16 years)
Table 7-2. U Farm Sound Tanks
Sound
Tank
Waste Details Leak Status R Waste Storage6 Thermal Conditions
First Filled1 Waste Type Leak Integrity Classification2 Basis for Formal
Leak Assessment Stored R
Waste
R Only Storage
Length Estimated Max Temp3
U-101 February 1946 MW, R “Confirmed leaker” but TFC-
ENG-CHEM-D-42
Direct push logging
and samples
recommended
Yes ~ 3 years 92°F
U-102 June 1946 MW, R, NCPLX, EB, Resid. Sound - Yes ~ 18 years 134°F
U-103 February 1947 MW, R, PNF, EB, Evap. Sound - Yes ~ 18 years 132°F
U-105 December 1947 R, CW, MW, CPLX, EB, Resid. Sound - Yes ~ 19 years 146°F
U-106 May 1948 MW, R, CCPLX, Resid., Evap. Sound - Yes ~ 18 years 122°F
U-107 September 1948 CW, MW, EB, BNW, N, DW,
CPLX, Evap., NCPLX Sound - No - 122°F
U-108 January 1949 CW, MW, EB, N, BNW, DW,
PNF, Resid., EB Sound - No - 130°F
U-109 March 1949 CW, MW, EB, PNF, Resid. Sound - Yes4 ~ 1 year 120°F
U-111 April 1947 1C, R, CPLX, PNF, EB Sound - Yes ~20 years5 130°F
Notes: Waste Types: TBP: Tri-butyl phosphate waste; 1C: First-cycle decontamination waste; CW: coating waste; MW: metal waste; EB: Evaporator bottoms; R: REDOX HLW; Evap:
Evaporator feed (post 1976); NCPLX: Non-Complexed waste; Resid: Residual evaporator liquor; PNF: Partial neutralization feed; CPLX: complexed waste; DW: decontamination waste
1. Reference: Tank Waste Information Network System 2. Reference: RPP-RPT-50097, Rev. 0, Hanford 241-U Farm Leak Inventory Assessment Report.
3. Reference: WHC-SD-WM-TI-591, Rev. 0, Maximum Surface Level and Temperature Histories for Hanford Waste Tank 4. Received R waste from U-112 which was mixed with CW and EB 5. 14 years were a mixed waste of R/CW, 6 years storage of only R 6. Reference: WHC-MR-0132, A History of the 200 Area Tank Farms
RPP-RPT-54915, Rev. 0
8-1
8.0 REFERENCES
ARH-951, 1969, Limitations for Use of Underground Waste Tanks, Richland, Washington.
ARH-1601, 1974, Specifications and Standards for the Operation of Radioactive Waste Tank
Farms and Associated Facilities, Atlantic Richfield Hanford Company, Richland,
Washington.
ARH-CD-222, 1974, Characterization of the Effects of Diatomaceous Earth Additions to
Hanford Wastes, Atlantic Richfield Hanford Company, Richland, Washington.
ARH-CD-336B, 1975, Production and Waste Management Division Waste Status Summary
April 1, 1975 through June 30, 1975, Atlantic Richfield Hanford Company, Richland,
Washington.
ARH-CD-336C, 1975, Production and Waste Management Division Waste Status Summary July
1, 1975 through September 30, 1975, Atlantic Richfield Hanford Company, Richland,
Washington.
ARH-R-43, 1970, Management of Radioactive Wastes Stored in Underground Tanks at Hanford,
Rev. 2, Atlantic Richfield Hanford Company, Richland, Washington.
ASTM A7-39, 1939, American Society for Testing and Materials, Standard Specifications for
Steel for Bridges and Buildings
ASTM A283, 1946, American Society for Testing and Materials, Standard Specification for Low
and Intermediate Tensile Strength Carbon Steel Plates
BPF-73550, 1944, Specification for Construction of Composite Storage Tanks (B, C, T, and U
Tank Farms), Hanford Engineer Works, Richland, Washington.
DS-103174, 1978, Data Sheet Salt Well Transfer: Tk-112U to Tk-109U, Rockwell Hanford
Operations, Richland, Washington.
DSI, 1961, “104-U Tank” (internal memorandum from G. L. Hanson to M. K. Harmon, March
31), Atlantic Richfield Hanford Company, Richland, Washington.
EM-TF-040.9a, 1956, “Inspection of Waste Storage Tank 241-U-104” (internal memorandum
from E. F. Smith and F. H. Shadel to H. F. Peterson, August 7; attachment to internal
letter 65431-79-002, “Tank 271-U-111, Imperfections on the Inside Surface of the
Reinforced Concrete Dome” from F. R. Vollert to C. R. Carter, May 17, 1979), Rockwell
International, Richland, Washington.
GJ-HAN-33, 1996, Vadose Zone Monitoring Project at the Hanford Tank Farms Tank
Summary Data Report for Tank U-104, U.S. Department of Energy Grand Junction
Projects Office, Grand Junction, Colorado.

RPP-RPT-54915, Rev. 0
8-2
GJ-HAN-39, 1996, Vadose Zone Monitoring Project at the Hanford Tank Farms Tank
Summary Data Report for Tank U-110, U.S. Department of Energy Grand Junction
Projects Office, Grand Junction, Colorado.
GJ-HAN-41, 1996, Vadose Zone Monitoring Project at the Hanford Tank Farms Tank
Summary Data Report for Tank U-112, U.S. Department of Energy Grand Junction
Projects Office, Grand Junction, Colorado.
GJPO-HAN-8, Vadose Zone Characterization Project at the Hanford Tank Farms U Tank
Farm Report, U.S. Department of Energy Grand Junction Projects Office, Grand
Junction, Colorado.
H-2-2257, 1962, Conductor Reel for Liquid Level Measurement, General Electric Company,
Richland, Washington.
H-2-36948, 2007, Wells in 241-U Farm As-Built, WRPS, Richland, Washington.
HNF-3018, 1998, Single-Shell Tank Sluicing History and Failure Frequency, COGEMA
Engineering Corporation, Richland, Washington.
HNF-3136, 1998, Analysis Techniques and Monitoring Results, 241-SX Drywell Surveillance
Logs, Lockheed Martin Hanford Corporation, Richland, Washington.
HNF-EP-0182, 2013, Waste Tank Summary Report for Month Ending April 30, 2013, Rev. 301,
CH2M Hill Hanford Group, Inc., Richland, Washington.
HW-1946, 1943, Specifications for Composite Storage Tanks – Buildings #241 at Hanford
Engineering Works, General Electric Company, Richland, Washington.
HW-7-4542-DEL, 1946, Hanford Engineer Works Monthly Report July 1946, General Electric
Company, Richland, Washington.
HW-7-6184-DEL, 1947, Hanford Works Monthly Report April 1947, General Electric Company,
Richland, Washington.
HW-7283-DEL, 1947, Hanford Engineer Works Monthly Report July 1947, General Electric
Company, Richland, Washington.
HW-8438-DEL, 1947, Hanford Works Monthly Report December 1947, General Electric
Company, Richland, Washington.
HW-10166-DEL, 1948, Hanford Works Monthly Report May 1948, General Electric Company,
Richland, Washington.
HW-10475-C-DEL, 1944, Hanford Technical Manual Section C, General Electric Company,
Richland Washington

RPP-RPT-54915, Rev. 0
8-3
HW-11226-DEL, 1948, Hanford Works Monthly Report September 1948, General Electric
Company, Richland, Washington.
HW-14946, 1949, A Survey of Corrosion Data and Construction Details, 200 Area Waste
Storage Tanks, General Electric Company, Richland, Washington.
HW-20742, 1951, Loss of Depleted Metal Waste Supernate to Soil, General Electric Company,
Richland, Washington.
HW-27838, 1952, Waste Status Summary Period: April, May, and June 1952, General Electric
Company, Richland, Washington.
HW-30851, 1954, Waste Status Summary January 1954, General Electric Company, Richland,
Washington.
HW-31811, 1954, Separations Section Waste – Status Summary April 30, 1954, General Electric
Company, Richland, Washington.
HW-33544, 1954, Separations Section, Waste-Status Summary for October 1954, General
Electric Company, Richland, Washington.
HW-33904, 1954, Separations Section, Waste-Status Summary for November 1954, General
Electric Company, Richland, Washington.
HW-43490, 1956, Separations Section Waste – Status Summary for May, 1956, General
Electric Company, Richland, Washington.
HW-44024-RD, 1956, TBP Plant and Tank Farm Weekly Summary – Process Unit – 6-29-56
thru 8-31-56, General Electric Company, Richland, Washington.
HW-44860, 1956, Separations Section, Waste – Status Summary July 1956, General Electric
Company, Richland, Washington.
HW-45115 H, 1956, Separations Technology Section Monthly Report – August, 1956, General
Electric Company, Richland, Washington.
HW-48144, 1957, Chemical Processing Department Waste – Status Summary January 1, 1957 –
January 31, 1957, General Electric Company, Richland, Washington.
HW-51026, 1957, Leak Detection – Underground Storage Tanks, General Electric Company,
Richland, Washington.
LET-082172, 1972, “Maximum Operating Levels and Cascade Levels in 200-West Area Tank
Farms” (internal letter from H.N. Raymond to C.J. Francis, August 21).
LET-72730-80-097, 1980, “Review of Classification of Six Hanford Single-Shell “Questionable
Integrity (QI)” Tanks” (internal letter from W.M. Lindsay to W.W. Schulz September
16).

RPP-RPT-54915, Rev. 0
8-4
Oblath, S. B. and J. W. Congdon, 1987, “Inhibiting Localized Corrosion during Storage of Dilute
SRP Waste”, Waste Management ’87, Volume 1, Tucson, AZ: Arizona Board of
Regents: 599-602.
OSD-T-151-00007, 2012, Operating Specifications for the Double-Shell Storage Tanks, Rev. 10,
Washington River Protection Solutions, LLC., Richland, Washington.
OSD-T-151-00017, 1983, Operating Specifications for the Aging Waste Operations in Tank
Farms 241-AY and 241-AZ, Rev. B-0, Rockwell Hanford Operations, Richland,
Washington.
OR 75-67, 1975, Liquid Level Decrease in Tank 110-U, Atlantic Richfield Hanford Company,
Richland, Washington.
PNL-5488, 1985, Prediction Equations for Corrosion Rates of A-537 and A-516 Steels in Double
Shell Flurry, Pacific Northwest Laboratory, Richland, Washington.
PNNL-13571, 2001, Expert Panel Recommendations for Hanford Double-Shell Tank Life
Extension, Pacific Northwest National Laboratory, Richland, Washington.
RHO-CD-896, 1980, Review of Classification of Nine Hanford Single-Shell “Questionable
Integrity” Tanks, Rockwell Hanford Operations, Richland, Washington.
RHO-CD-1172, 1981, Survey of the Single-Shell Tank Thermal Histories, Rockwell Hanford
Operations, Richland, Washington.
RHO-ST-34, 1981, A Scientific Basis for Establishing Drywell-Monitoring Frequencies,
Rockwell Hanford Operations, Richland, Washington.
RHO-RE-EV-4P, 1982, Supporting Information for the Scientific Basis for Establishing Drywell
Monitoring Frequencies, Rockwell Hanford Operations, Richland, Washington.
RPP-7729, 2001, Analysis and Summary Report of Historical Dry Well Gamma Logs for the
241-U Tank Farm – 200 West, Rev. 0, CH2M HILL Hanford Group, Inc., Richland,
Washington.
RPP-8321, 2001, Analysis and Summary Report of Historical Drywell Gamma Logs for the 241-
C Tank Farm 200 East Area, CH2M HILL Hanford Group Inc., Richland, Washington.
RPP-20820, 2004, Waste Retrieval Leak Evaluation Report: Single-Shell Tanks, Rev. 0, CH2M
HILL Hanford Group Inc., Richland, Washington.
RPP-32681, 2011, Process to Assess Tank Farm Leaks in Support of Retrieval and Closure
Planning, Rev. 1, Washington River Protection Solutions, LLC., Richland, Washington.
RPP-36007, 2007, Small Diameter Geophysical Logging in the 241-U Tank Farm, Rev. 0,
CH2M HILL Hanford Group, Inc., Richland, Washington.
RPP-RPT-54915, Rev. 0
8-5
RPP-ASMT-53793, 2012, Tank 241-AY-102 Leak Assessment Report, Rev. 0, Washington River
Protection Solutions, LLC., Richland, Washington.
RPP-RPT-33306, 2008, IQRPE Integrity Assessment Report for the 242-A Evaporator Tank
System, Rev. 0A, CH2M HILL Hanford Group, Inc., Richland, Washington.
RPP-ENV-39658, 2009, Hanford SX-Farm Leak Assessments Report, Rev. 0, CH2M HILL
Plateau Remediation Company, Richland, Washington.
RPP-RPT-43704, 2011, Hanford BY-Farm Leak Assessments Report, Rev. 0, Washington River
Protection Solutions, LLC., Richland, Washington.
RPP-RPT-47337, 2011, Specifications for the Mineralization of the Stress Corrosion Cracking
Threat in Double-Shell Tank Wastes, Rev. 0, Washington River Protection Solutions,
LLC., Richland, Washington.
RPP-RPT-50097, 2011, Hanford 241-U Farm Leak Inventory Assessment Report, Rev. 0,
Washington River Protection Solutions, LLC., Richland, Washington.
RPP-RPT-54909, TBD, Hanford Single-Shell Tank Leak Causes and Locations – Summary,
Washington River Protection Solutions, LLC., Richland, Washington.
SD-WM-TI-302, 1987, Hanford Waste Tank Sluicing History, Rev. 0, Westinghouse Hanford
Company, Richland, Washington.
SD-WM-TI-356, 1988, Waste Storage Tank Status and Leak Detection Criteria, Rev. 0,
Westinghouse Hanford Company, Richland, Washington.
TFC-ENG-CHEM-D-42, 2009, Tank Leak Assessment Process, Rev. B-2, CH2M HILL Hanford
Group, Inc., Richland, Washington.
WHC-EP-0449, 1991, The Sort on Radioactive Waste Type Model: A Method to Sort Single-
Shell Tanks into Characteristic Groups, Westinghouse Hanford Company, Richland,
Washington.
WHC-EP-0772, 1994, Characterization of the Corrosion Behavior of the Carbon Steel Liner in
Hanford Site Single Shell Tanks, Westinghouse Hanford Company, Richland,
Washington.
WHC-MR-0132, 1990, A History of the 200 Area Tank Farms, Westinghouse Hanford
Company, Richland, Washington.
WHC-SD-WM-ER-325, 1994, Historical Tank Content Estimate for the South West
Quadrant of the Hanford 200 East Area, Rev. 0, ICF Kaiser Hanford Company,
Richland, Washington.
WHC-SD-WM-TI-591, 1994, Maximum Surface Level and Temperature Histories for Hanford
Waste Tanks, Rev. 0, Westinghouse Hanford Company, Richland, Washington.
RPP-RPT-54915, Rev. 0
8-6
WHC-SD-WM-TI-665, 2003, Soil Load above Hanford Waste Storage Tanks, Rev. 0C, CH2M
Hill Hanford Group, Inc., Richland, Washington.
WSRC-TR-90-512, 1990, Effect of Temperature on the Nitrite Requirement to Inhibit Washed
Sludge, Westinghouse Savannah River Company, Aiken, South Carolina.

RPP-RPT-54915, Rev. 0
A-1
Appendix A
Meeting Minutes
June 25, 2013
August 6, 2013
September 10, 2013
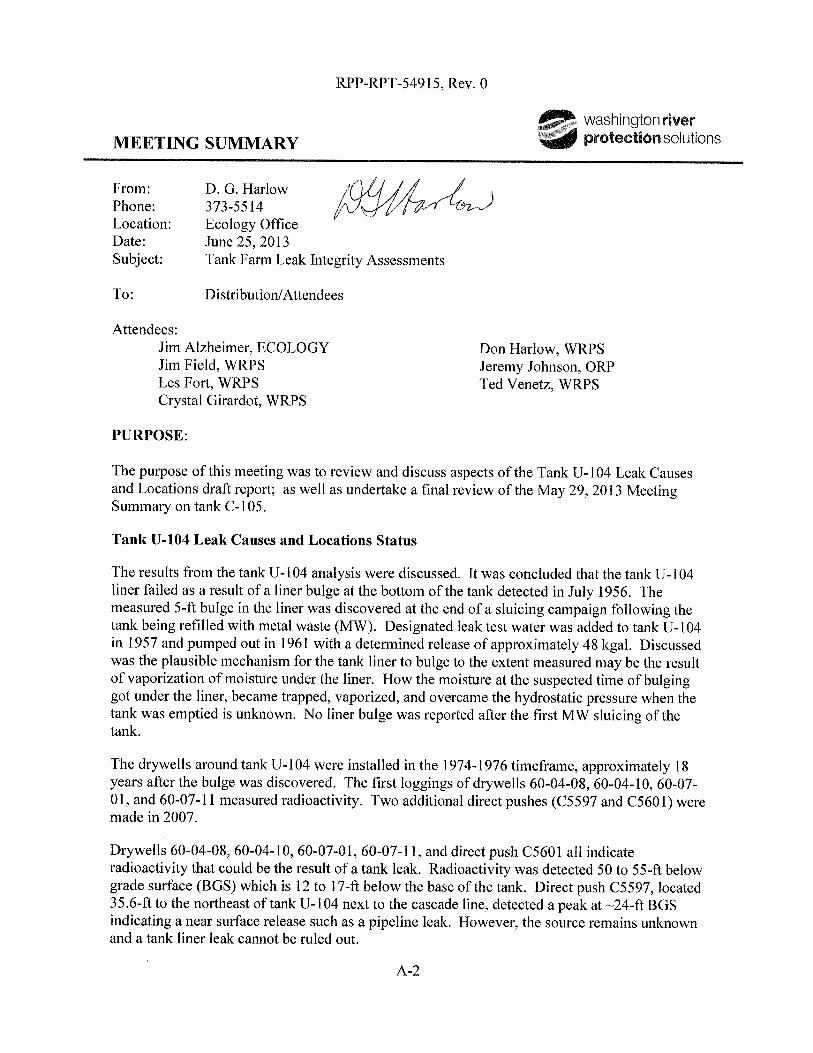

RPP-RPT-54915, Rev. 0
A-3
It was concluded that the bottom liner bulge was likely the result of waste thermal conditions.
There appears to be little contribution from tank design, construction temperatures, and/or waste
chemistry. Drywell readings indicate waste was released southeast of tank U-104 at or near the
tank footing.
Tank C-105 Meeting Summary – May 29, 2013
The tank C-105 meeting summary with attached comments from the Tank C-105 Leak Causes
and Locations segment including comment resolutions was handed out for review and approval.
ACTIONS:
1. All: Review the May 29, 2013 meeting summary from tank C-105 and provide comments by
July 18, 2013.
Status: Complete.
2. All: Provide comments for the Tank U-104 Leak Causes and Locations report by July 18,
2013.
Status: Complete. No comments were received.
NEXT MEETING:
Review Tank U-110 Leak Location and Cause report.
Date: Tuesday August 6, 2013
Time: 2:30 pm
Location: Ecology Room 3B


RPP-RPT-54915, Rev. 0
A-5
Tank U-104 Meeting Summary – June 25, 2013
The tank U-104 meeting summary was handed out for review and approval.
ACTIONS:
3. All: Review the June 25, 2013 meeting summary from tank U-104 and provide comments by
August 20, 2013.
Status: In Progress.
4. All: Provide comments for the Tank U-110 Leak Causes and Locations report by August 20,
2013.
Status: In Progress.
NEXT MEETING:
Review Tank U-112 Leak Location and Cause report.
Date: Tuesday September 10, 2013
Time: 2:30 pm
Location: Ecology Room 3B
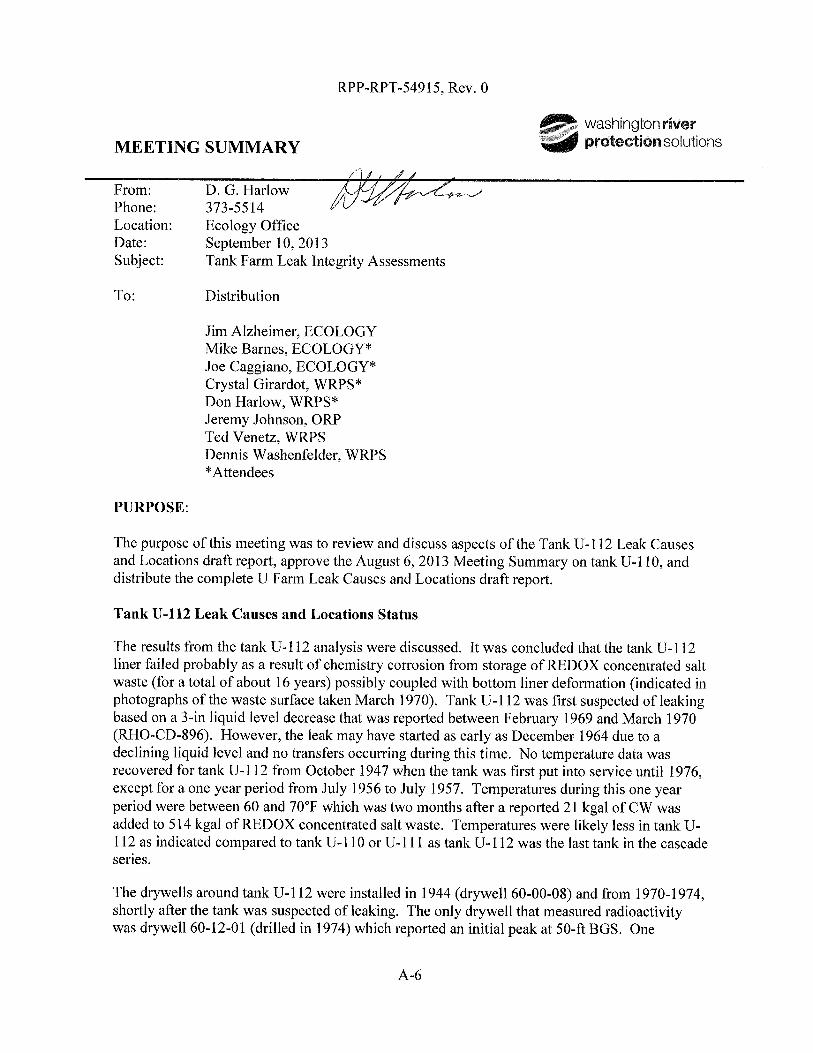
RPP-RPT-54915, Rev. 0
A-7
additional direct push (C5605) was made in 2007 (located between drywells 60-12-01 and 60-
12-03) which indicated moisture but only background levels of radioactivity.
It was suggested in the meeting that additional direct pushes are being performed in U Farm this
fiscal year and possibly next fiscal year for U Farm and TX Farm and to add in any relevant
results to the leak causes and locations reports as appropriate.
It was concluded that the tank U-112 liner leaked in at least one location in the north northeast
portion of the tank at or near the tank base possibly as a result of chemistry corrosion. There
appears to be little contribution from tank design and/or construction temperatures.
It was also suggested in the meeting to add in any available information on the contractor used
during the construction of B, C, T, and U Farms and whether the same contractor was used for
these tank farms or if multiple contractors were used. No records have been recovered indicating
the quality control during construction of these earlier tank farms.
A revision to Figure 2-1 in the report was suggested to include tank U-101 as an assumed leaker
which is identified in the Waste Status Summary monthly reports (HNF-EP-0182). Tank U-101
was subsequently designated to be assessed by the procedure TFC-ENG-CHEM-D-42 in RPP-
RPT-50097 and therefore will not be analyzed for the leak causes and locations report. It was
also recommended to add all of the 2007 direct pushes to this figure.
A comment was made during the meeting about whether sampling was done in the direct push
(C5605) when it was installed in 2007. The report addresses this in Section 6.5.1.7 which
identified moisture and spectral gamma logging performed in this direct push. Results identified
elevated moisture contents but only background levels of Cs-137 were recorded. Relevant direct
push results are included in the other two leaking U Farm tanks.
Tank U-110 Meeting Summary – August 6, 2013
The previously reviewed tank U-110 meeting summary was approved.
ACTIONS:
5. All: Review the September 10, 2013 meeting summary from tank U-112 and provide
comments by September 24, 2013.
Status: Completed. Received editorial comments from Joe Caggiano and the meeting
summary was updated.
6. All: Provide comments for the entire U Farm Leak Causes and Locations draft report by
September 24, 2013.
Status: Completed. See Attachment 1.
NEXT MEETING:
Review Tank T-106 Leak Location and Cause report.
Date: TBD
Time: TBD
Location: TBD

RPP-RPT-54915, Rev. 0
A-8
ATTACHMENT 1:
REVIEW COMMENTS with RESPONSES
J. A. Caggiano September 12, 2013
U FARM DRAFT REPORT COMMENTS
GENERAL:
1. There is a great deal of redundancy in this and other reports. The same information
seems to be cut and pasted into several different sections. I would suggest you try to
streamline the reports to reduce repetition. It gets tedious reading the same lines over and
over. Some readers might get offended at this.
Response: Sections 1 and 2 of the document were designed to present background
information on the tank farm in the document. Section 3 deals with common design
features and construction details relevant to waste storage. Basic in-tank and ex-tank
background is also presented in this section to be applied to individual leaking tanks that
could affect causes for liner leaks and identification of possible liner leak locations. The
last two subsections indicate how the previous information is used to address leak
locations and causes. The next section(s) develop in-tank and ex-tank specific
information for individual leaking tank(s). The individual leaking tank sections contain
some consolidated information from sections 1 through 3 to be as close to stand alone as
possible. This includes presenting relevant information as scenarios are developed
through summaries of a leak cause and a leak location to a final conclusion. This results
in repeating some information as the discussion progresses. This should help the reader
who may want information on only one specific tank or a specific subsection to
understand some of the background without referring to background section unless
further information is needed.
2. Push holes are NOT drywells. They are generally constructed in pairs; the first hole is
used for logging moisture and gross gamma to select intervals for sampling in the second
hole that is generally pushed very nearby. These are one time logs and samples with no
potential for later logging or sampling, as these holes are decommissioned shortly after
their one-time use is completed. Drywells remain open (but capped and locked) so as to
remain accessible for logging as conditions require. Most drywells were logged multiple
times.
Response: Deleted the word “drywell” as it relates to direct pushes.
SPECIFIC COMMENTS:
1. Pg. i, para 4. First sentence should be amended to indicate radial “transport in the soil.”
Response: Inserted “transport in the soil” after the word “radial”.
2. Pg. i, para 4. Last sentence should be amended to include “or to point of egress near the
tank bottom.” Slow leaks from a cascade or spare inlet line might “dribble” down the

RPP-RPT-54915, Rev. 0
A-9
tank wall and then flow laterally once they hit the footing. But high levels of Cs-137 at
tank bottom likely indicate a leak at that location.
Response: Agree, indications point to egress of the waste near the bottom of the tank.
The depth of detected radioactivity between 50-ft and 54-ft BGS, more than 10-ft below
the bottom of the tank base, seemed to point that way. Details pertaining to the
individual tanks are in the individual tank sections and indicate liner leaks could follow
different paths to the point of egress to the soil. Also where there are indications of
overfilling above the cascade or inlet lines such as tank U-112 the possibility of leakage
form those sites are addressed.
3. Pg. 2-2. This figure needs to be either re-titled, or amended to include the C-200 series
tanks. You may want to designate U-101 as an “assumed leaker” from the Hanlon
reports which the leak assessment team did not believe.
Response: Retitled the figure, included tank U-101 as an assumed leaker, and modified
the footnote pertaining to tank U-101to indicated it was not included in the document and
why. The 200 series tanks have not been included as they are not in the scope of the
milestone.
4. Pg. 3-6, last para in 3.1.2. As suggested in the meeting, you may want to check to see if
different contractors were involved in tank farm construction and whether they might
have had different quality control standards regarding welding steel plates.
Response: The same contractor (Morrison-Bechtel-McCone) built all 64 B, C, T, U
Tanks (HAN-10970, Volume 1, page 271). This and other tank contractors will be
addressed in either the summary document or in the Common Factors document.
5. Pg. 3-8, Sect. 3.2.3. Bulging is listed as a cause for tank failure, but bulging is an effect
because of some unidentified cause on which one can speculate. I would also add that
any buckling that remains in the elastic realm would not produce a permanent bulge, but
could weaken the steel and facilitate SCC or some other form of corrosion.
Response: Added the statement that a bulge is typically caused by rapid vaporization of
moisture under the liner and that stressing the liner may not produce a permanent bulge.
Susceptibility to corrosion was already mentioned in the paragraph.
6. Pg. 3-9, para 1 discusses operating specification to prevent SCC which were developed in
1983, well after all the SSTs were out of service. Provides guidance in hindsight, but is
“too little, too late” for SSTs.
Response: Agree. The paragraph indicates many investigations led to the 1983
specification. The individual tank sections compare available historical corrosion
chemistry data to later specification as a means to identify possible liner failure causes.
7. Pg. 3-10, last para Sect. 3.2.4. Sentence reads, “Therefore, waste chemistry conditions
are speculative when sample and temperature data….” Consider speculating and what
might be done further to investigate these speculations.

RPP-RPT-54915, Rev. 0
A-10
Response: Revised the last paragraph of section 3.2.4 to address the speculation
comment.
8. Pg. 3-11, Drywells. First you say that the earliest drywells were constructed in 1970-
1976, and in the following paragraph talk about the “00” series of drywells constructed
shortly after tank farm construction. Correct these inconsistencies.
Response: Section 3.3.2, second sentence; added the words “tank specific” after the word
“earliest”, now reads, “The earliest tank specific drywells were installed ……” Tank
Farm drywells “00” series are addressed later in the paragraphs.
9. Pg. 4-5, last para. What was the LL decline for the “leak test water” added to this tank in
1957 and that remained for almost 4 years?
Response: April 1957 to March 23, 1961, see Section 4.4.1 for the details on the leak test
water liquid level decrease of 50k gal over ~4 years.
10. Pg. 4-7. The figure should be called “U-104 Operating History”. Titled “Leak History”,
it suggests that every entry should describe a release. Check other similar figures as well.
Response: The title of Figure 4-2 is “Operational Leak History of Tank U-104” and was
intended to gather both Operational and Leak information in one timeline with emphasis
placed in red on the more important entries. Figures 5.2 and 6.2 have the same wording
for tanks U-110 and U-112.
11. Pg. 4-9, last para. Could the periodic “leveling out” of LL be due to lower evaporation
rates during the colder winter months? Just a question for consideration.
Response: There may be a seasonal effect but reviewing the actual data used for the
Figure 4-4 plot indicates inconsistent seasonal effects. This could be some kind of a data
problem but the observation was included to indicate apparent uncertainty with the liquid
level decrease for such a long period of observation with no pumping action.
12. Pg. 5-5, para 2. If 39 kgal of water were added to this tank at a time when tank storage
space was scarce, there had to be a reason and I would guess that it was to lower
temperature from those considered too high for tank stability or at least beyond operating
specifications. If so, temperature conditions are even further supported. Do you know
why cooling water was added?
Response: A flex jumper was found leaking in the 204-S diversion box and the water
was transferred (HW-56972 Page D-2) and HW-57122 page 4 indicates the 39k gal of
water was from 204-S. There probably was a temperature reduction in tank U-110 but it
appears that the primary reason for the transfer was to remove the water from 204-S. The
temperature towards the middle of 1957 was ~115°F which was about a year before the
water transfer.
13. Pg. 6-5, para 5. 549 kgal would be about 19 kgal above the listed capacity for this tank
and definitely an overfill which is supported by the “beach line” in Fig. 6-5. That raises
the question of how reliable earlier LL were, given that this “new level” was found after
replacing an electrode.
RPP-RPT-54915, Rev. 0
A-11
Response: Agree. The liquid level measurement reliability especially in the earlier years
is a large subject to tackle and may not change the basic conclusions of the causes and
locations of a tank liner leak. Reliability of liquid level as it relates to identifying tank
leak causes and locations has been handled on a tank by tank basis by dropping suspect
data, trending, identifying second sources, identifying collaborating information, and
others. We plan on addressing this subject in the summary document.
14. Pg. 6-11, para 2 speaks of adding 21 kgal of CW which would be an overfill and
probably to cool waste that was considered too hot and out of spec. Should any of this be
mentioned?
Response: Figure 6-4 shows the liquid level above the cascade inlet with the liquid level
decreasing. However, the liquid level continued to decrease after reaching the cascade
inlet which indicated a leak. Section 6.4.2 indicated that the U-110 liquid level slowly
decreased (probably as a result of the waste temperature and evaporation). However, the
third tank in the cascade, tank U-112 did not experience a decreasing liquid level e.g.
lower temperature and less or no evaporation. How much of a temperature effect the 21
kgal of CW had on the 514 kgal of cascaded REDOX waste in tank U-112 is speculative
without detailed temperature data, however, two months after receiving the 21 kgal of
CW, sludge temperatures range between 70°F and 60°F. Therefore, the temperature of
the REDOX waste in tank U-112 must have been relatively low at least compared to tank
U-110. Therefore, a projected average temperature was indicated as near 100°F (see
Sections 6.4.1 and 6.4.2).
15. Pg. 6-13. In discussing the “replacement of tank bottom liners”, an April 1944 report is
cited. As construction began in February, how far along could construction have been?
Something seems amiss here.
Response: Construction of U Farm began in February 1944; however, the replacement of
the bottom liners discussed in the April 1944 report is referring to the construction of T
Farm. A photo was taken on January 19, 1944 of T Farm construction (P1147,
N1545817) that indicates construction of the tank pads started earlier as some steel was
laid out for a part of one tank. Photo P1955 N 1557899 taken March 23, 1944 shows the
T Farm construction of the tanks with the knuckles in place. Photo P6507 N 1603404
taken September 2, 1944 shows the farm in the process of backfill. Photo P4709 N
1591787 taken September 19, 1944 shows the final backfilling of the farm. The time line
is OK.