Hands-on Tutorial: Building a Simple SAP ESP...
25
Hands-on Tutorial: Building a Simple SAP ESP Project Document version 4.0 January 2015 SAP ESP version 5.1 SP09
Transcript of Hands-on Tutorial: Building a Simple SAP ESP...

Hands-on Tutorial: Building a Simple SAP ESP Project Document version 4.0 January 2015 SAP ESP version 5.1 SP09

Hands-on Tutorial: Building a Simple SAP ESP Project
2
Prerequisites:
Install SAP Sybase ESP 5.1 SP09 Download the sample code (zip file) from: http://www.sdn.sap.com/irj/scn/index?rid=/library/uuid/d081d266-
9397-3010-a2bf-dacb914f80f9 Unzip the “towermonTutorial” to c:\espdemos to follow the directory paths used in this tutorial. If you choose
to unzip the file to another directory, you will need to adjust the directory path appropriately.
Launch ESP Studio
Create a new ESP Project using the Visual Editor, and add Input streams
1. Open ESP Studio – double-click on SAP ESP Studio icon on the desktop to launch.
2. If the ESP Studio opens to the Welcome screen, go to the workbench SAP ESP Authoring perspective

Hands-on Tutorial: Building a Simple SAP ESP Project
3
3. Create a new Project: From the menu: File -> New -> Project
Enter a name for the project: towermon
Click the [Finish] button
We’ll start by connecting to our first data source, which is a csv-formatted file of static reference data for the weather stations. 4. Add a File/Hadoop CSV Input adapter to the project:
Open the Input Adapters drawer on the palette by clicking on the drawer
Click on File/Hadoop CSV Input to select it
Click on the diagram to add it
5. Configure the input Adapter:
Hover the mouse over the input Adapter to display the popup shape toolbar
Click on the properties button on the popup shape toolbar
6. Set the adapter Directory property
Click on the value field to the right of the Directory property and then click on the browse button that appears.
For the Directory property, browse to and select this directory:
C:/espdemos/towermon3/data
Now type the filename into the File (in Directory) property value:
weather-sensor-inventory.csv
Note that even when running this tutorial on a Windows machine, ESP expects the directory path to use “/” as the directory separator.
7. Set the adapter Has Header property
On the Advanced tab (still in the Adapter Properties dialog), set the Has Header property to true
Click the OK button This tells the adapter to interpret the first row in the file as the set of column names
Hands-on Tutorial: Building a Simple SAP ESP Project
4
8. Use Schema Discovery to create an input window attached to this adapter and import the data schema to the new window
Click the Schema Discovery button in the shape toolbar
Select weather-sensor-inventory.csv
Click Next>
Select Create a new input window (with inline schema)
Click the Finish button Note: If you get an error, you probably didn’t set the adapter Directory property correctly, to point to a directory containing one or more valid data files
9. Edit the new Window properties
Click the icon to the left of the window name in the shape header, and change the name to iwWeatherStationReference
Click the icon next to the USAFWBAN field in the schema to indicate this field is the primary key
Before we go further – let’s save the file. Click “Save” in the toolbar.
10. As a best practice, we will now specify the Keep Policy for the iwWeatherStationReference input window.
Click the Keep Policy button in the shape toolbar
Leave the policy set to the default value of All Rows
Press OK Note: If you do not explicitly set the Keep Policy, ESP will default to Keep All, however this will be reported as a warning at compile time. Since the iwWeatherStationReference input window contains lookup data that will not grow over time, the Keep All policy is the appropriate setting.

Hands-on Tutorial: Building a Simple SAP ESP Project
5
11. Now we’re going to use a little trick to import the schema for our other two input streams, even though we won’t actually use file adapters with them in our finished project – because they won’t load data from a file, but will receive streaming input.
Repeat steps 4-7 above to create a 2nd
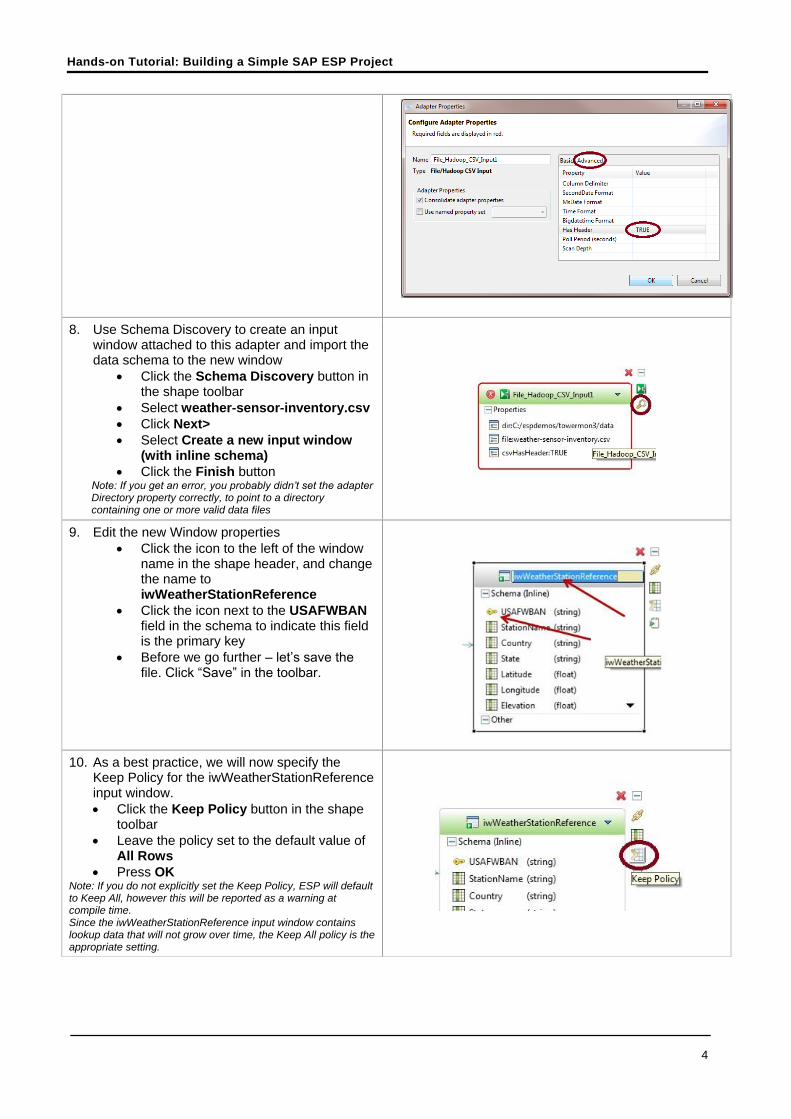
file adapter, only set the file property to sensorDataSample.csv
Use schema discovery (as in step 8 above), and select “Create new named schema” and click Finish
Hands-on Tutorial: Building a Simple SAP ESP Project
6
12. Now, using the same adapter that you created in step 11 change the file property to the weatherDataSample.csv file and use schema discovery again to create another named schema.
Note: Schema discovery against comma delimited (.csv) files, determines the data type of a column based on the first data record in the file. If a column contains mixed data types (eg: integer and string values) then you may need to manually edit the column data type in the generated schema definition.
13. To complete our little schema import trick, we need to delete the 2
nd adapter that we created
in step 11 and used to import the two schema definitions: • Select the adapter in the diagram • Press “Delete” ( or right click and “Delete
Element”)
Note: If at this point the two named schema you created are on top of each other in the diagram, you can click and drag the top one to move it.

Hands-on Tutorial: Building a Simple SAP ESP Project
7
14. Now we are going to add an event sequence number to the weather data schema, so that we can capture this data in a window. When we create the window in the next step, the sequence number will serve as the window key. This will use the Autogenerate feature, which requires a field with datatype = long
In the weatherDataSample_csv_schema1, click the “Add Column” button in the shape toolbar
Change the name of the new column to “Id”
Change the datatype of the new column to “long”
15. Now add an input stream for the sensor data
Click on Input Stream in the Palette
Click on the diagram to add this to the project
Change the name of the new stream to isSensorStream
Click the Connector tool in the Palette, then click first on the header of isSensorStream, then click on the header of the sensorDataSample… schema to connect them
16. Repeat step 13 to add an input stream named isWeatherStream connected to the weatherDataSample… schema

Hands-on Tutorial: Building a Simple SAP ESP Project
8
17. Now we’ll set up that Autogenerate field
Click the Set Autogenerate button in the toolbar of the new isWeatherStream input streamSelect “Id” in the Candidate Columns list
Click the “Add” button
Click “OK” This adds an Autogenerate clause to isWeatherStream. The incoming events don’t set the value of this field but rather, the value will be incremented with each new event. This thus becomes a sequence number and can be used downstream as a primary key (a unique identifier) for a window that holds all the recent weather reports
18. Finally, let’s do a little clean up before we move on to the next section. First, delete the NEWSTREAM object that was added by default when we created the project – we won’t be using it.
Click on the NEWSTREAM shape in the diagram
Press Delete (or right click on the shape and select “Delete Element”)
Confirm

Hands-on Tutorial: Building a Simple SAP ESP Project
9
19. Let’s hide the two named schema. They take up space on our diagram, but at this point we don’t really need to see them
Right click on the sensorDataSample… schema
Select Delete from Diagram
Repeat this for the weatherDataSample… schema
When you select “Delete Element”, the element is deleted entirely from the project. “Delete from Diagram” removes the element from the diagram, but it still exists in the project – in the underlying CCL.
If you wish to display the named schemas in the diagram at a later time, they are still available through the Outline panel.
20. And let’s clean up the diagram and save the project
Click “All Iconic” tool in the Studio toolbar – this will collapse all the shapes to give us more room to work
Click one of the layout buttons to arrange the shapes on the diagram
Click the save button to save the project

Hands-on Tutorial: Building a Simple SAP ESP Project
10
Adding Continuous Queries to produce Derived Streams and Windows
Now that we have set up all the inputs, we’ll start to add a set of derived streams and windows, each of which has a continuous query attached to it. This series of continuous queries will transform the raw inputs into the outputs that we want. At this point your project should look something like this:
21. Add a new window to hold the most recent weather data. This will hold all weather reports over the last 4 hours.
Click on Derived Window in the Palette
Click on the diagram to add it to the project
Change the name of the new window to RecentWeatherData
22. Connect the new window to its inputs
Click the connector tool in the Palette
Click the isWeatherStream shape and then the RecentWeatherData shape to add the first connection
Repeat to connect iwWeatherStationReference
Tip: to add multiple connections, you can hold down Shift when you select the connector tool and it will stay selected until you are finished adding connections. Then press Esc to release it.

Hands-on Tutorial: Building a Simple SAP ESP Project
11
23. Edit the Join Condition
Double click on the 2nd
element in the Join Conditions (“,iwWeatherStationReference”) compartment
Leave the Join type set to INNER
Select USAFWBAN from each source and click the Add button.
Click OK
This does a look up and adds info about the location of the weather station to each incoming weather report
24. Add a GROUP BY clause
Click the Add Query Clause button on the shape toolbar and then select the Edit Group By Clause option from the pop up menu
Select the isWeatherStream.Id column from the list of available columns
Click the button to add it to the Selected columns list
Press OK This doesn’t actually do an aggregation – since every weather report has a unique ID. However, in order to take a stream, which doesn’t have a primary key, into a window, which does have a primary key, you must have a GROUP BY clause.

Hands-on Tutorial: Building a Simple SAP ESP Project
12
25. Add a KEEP policy to only keep the last 4 hours of weather reports
Click the Add KEEP Policy button in the shape toolbar
Select Time and enter 4 hours
Press OK
26. Select the columns to include
Click the Add Column Expression button on the shape toolbar and then choose the Copy Columns from Input option from the pop up menu
Click the Select All button
Uncheck the iwWeatherStationReference.USAFWBAN and iwWeatherStationReference.StationName columns
Click OK We’ll take all columns from both inputs, but we don’t want duplicates

Hands-on Tutorial: Building a Simple SAP ESP Project
13
27. Close the shape to make some room on the diagram
28. Add an Aggregation to compute weather stats for each station
Click Aggregate in the Streams and Windows Palette and then click on the diagram to add it
Change the name to LatestWeatherConditions
Use the connector tool and click the RecentWeatherData shape and then click LatestWeatherConditions shape
Connect RecentWeatherData to this Aggregation shape for input
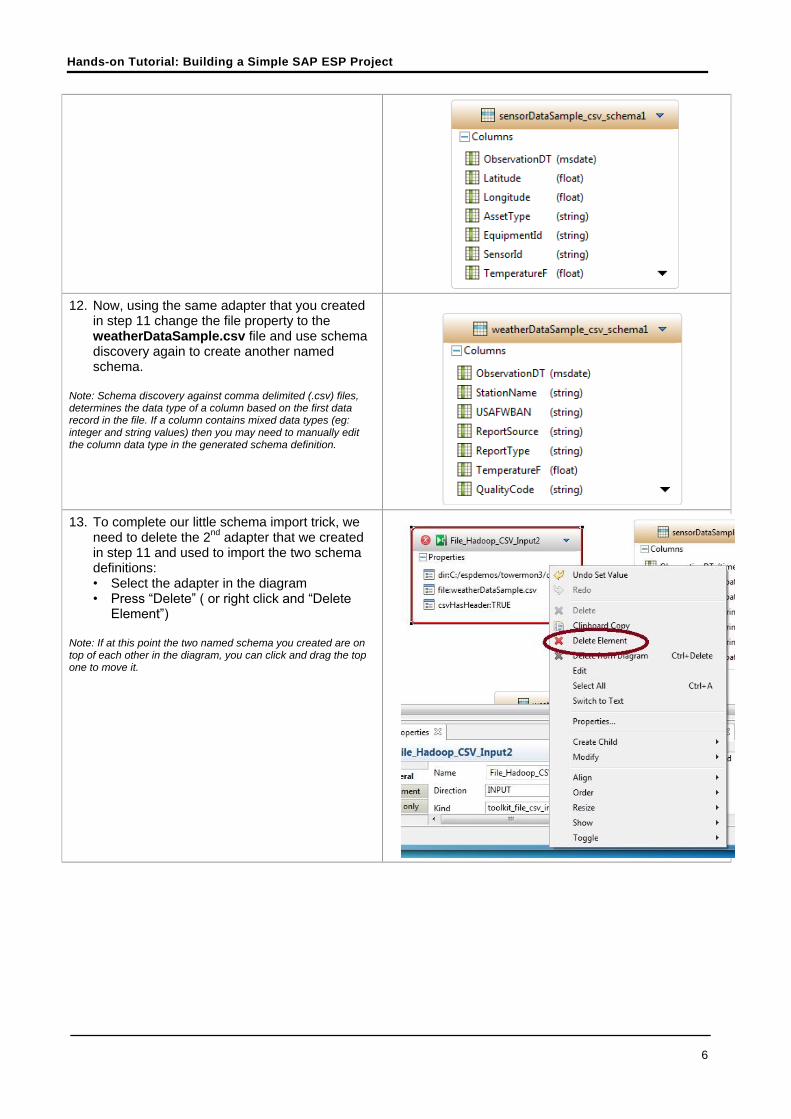
29. Select which columns to include
Click the Add Column Expression button on the shape toolbar and then choose the Copy Columns from Input option from the pop up menu
Select All columns except: …ReportSource …ReportType …QualityCode …Id
Click OK
Hands-on Tutorial: Building a Simple SAP ESP Project
14
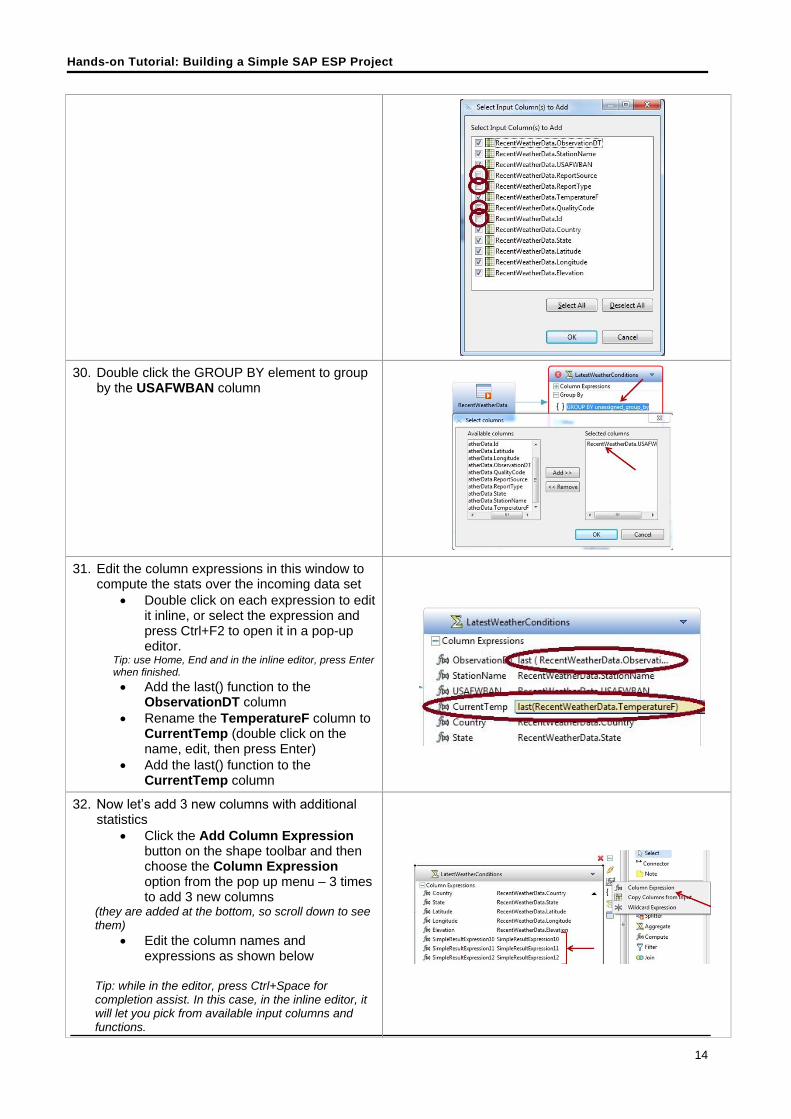
30. Double click the GROUP BY element to group by the USAFWBAN column
31. Edit the column expressions in this window to compute the stats over the incoming data set
Double click on each expression to edit it inline, or select the expression and press Ctrl+F2 to open it in a pop-up editor.
Tip: use Home, End and in the inline editor, press Enter when finished.
Add the last() function to the ObservationDT column
Rename the TemperatureF column to CurrentTemp (double click on the name, edit, then press Enter)
Add the last() function to the CurrentTemp column
32. Now let’s add 3 new columns with additional statistics
Click the Add Column Expression button on the shape toolbar and then choose the Column Expression option from the pop up menu – 3 times to add 3 new columns
(they are added at the bottom, so scroll down to see them)
Edit the column names and expressions as shown below
Tip: while in the editor, press Ctrl+Space for completion assist. In this case, in the inline editor, it will let you pick from available input columns and functions.

Hands-on Tutorial: Building a Simple SAP ESP Project
15
AvgTemp: avg(RecentWeatherData.TemperatureF) MinTemp: min( RecentWeatherData.TemperatureF) MaxTemp: max( RecentWeatherData.TemperatureF)
33. As an Aggregate, the LatestWeatherConditions element will only contain a single record for each GROUP BY value. However, it is still a best practice to explicitly set the Keep Policy, which will also avoid generating a compile warning.
Click the Keep Policy button in the shape toolbar
Leave the policy set to the default value of All Rows
Press OK
34. Clean up and check your work
Use the layout tools to clean up your diagram
Click the Compile tool to compile your project
Check the Console to see if it compiled without errors.
If there are errors, check the Problems view to see the errors and correct them
If you don’t understand the error message, it may be easier to fix it in the CCL editor…so leave it and go on to the next step below
Hands-on Tutorial: Building a Simple SAP ESP Project
16
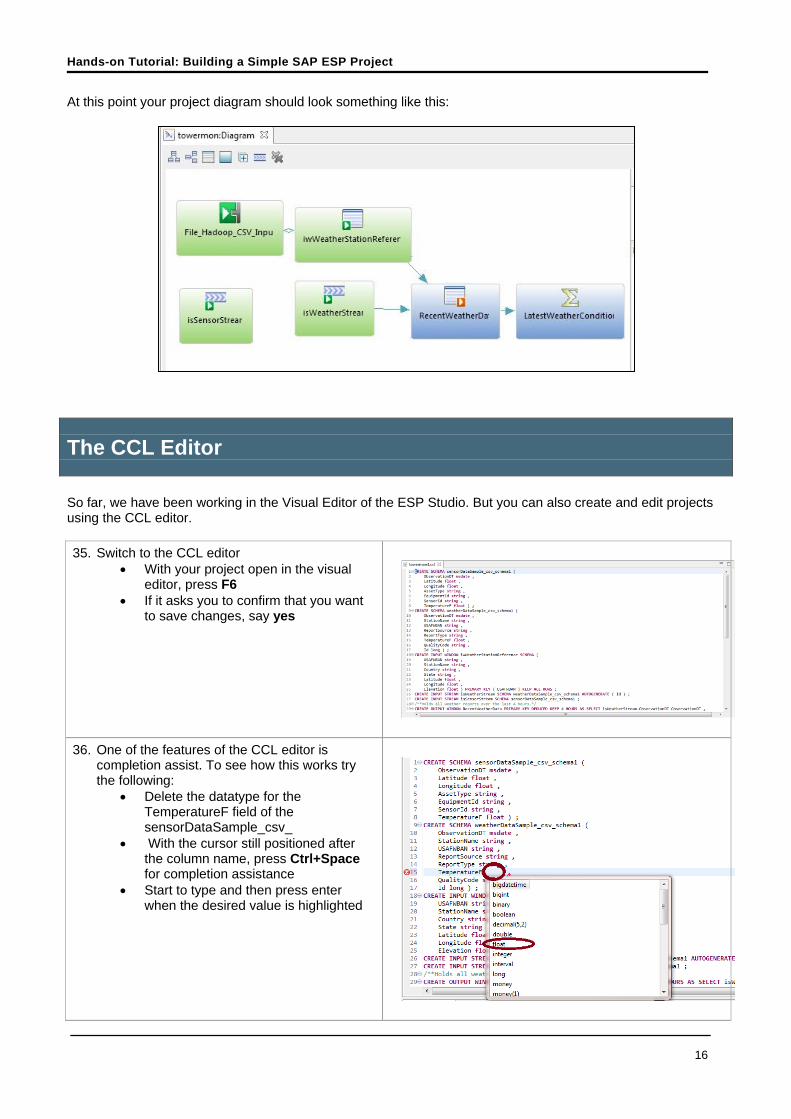
At this point your project diagram should look something like this:
The CCL Editor
So far, we have been working in the Visual Editor of the ESP Studio. But you can also create and edit projects using the CCL editor.
35. Switch to the CCL editor
With your project open in the visual editor, press F6
If it asks you to confirm that you want to save changes, say yes
36. One of the features of the CCL editor is completion assist. To see how this works try the following:
Delete the datatype for the TemperatureF field of the sensorDataSample_csv_
With the cursor still positioned after the column name, press Ctrl+Space for completion assistance
Start to type and then press enter when the desired value is highlighted

Hands-on Tutorial: Building a Simple SAP ESP Project
17
Add Alerts
37. Now we’re going to copy some CCL from another project. So first we need to add that project to our workspace
Click on the File menu of the Studio
Select Open > ESP Project …
Click the browse button and select the towermon3 project (unzipping this to the espdemos folder was a prerequisite for this tutorial
Click Finish
38. Copy the SensorAnalytics window from the towermon3 project and add it to this project
Expand the towermon3 project in the File Explorer
Double click towermon3.cclnotation to open it in the visual editor
Select the SensorAnalytics shape
Press F6 to switch to the CCL editor By selecting the SensorAnalytics window in the visual editor, your cursor is now positioned (in the CCL editor) at the start of the statement that creates the SensorAnalytics window
Select the whole statement, including the preceding comment, down through the GROUP BY clause
Copy it to the clipboard (Ctrl+C or Copy from either the main menu or right-click menu)
Click on the editor tab for the towermon project – it should still be open in the CCL editor
Position the cursor at the end of the file and paste from the clipboard (Ctrl+V)
Note: if you don’t paste at the end of the file this will result in the following error at compile time: “Element has forward reference in data flow” and you will not be able to compile
39. Check your work
Compile it to look for errors
Use F6 to go back to the visual editor to see the extended data flow
Drag the new stream to clean up the diagram
Hands-on Tutorial: Building a Simple SAP ESP Project
18
We’re almost finished creating our project. One more thing: we want to generate alerts. So we’re going to add one more Continuous Query to produce an output window with the alerts.
At this point your project diagram should look something like this:
The Run/Test Perspective
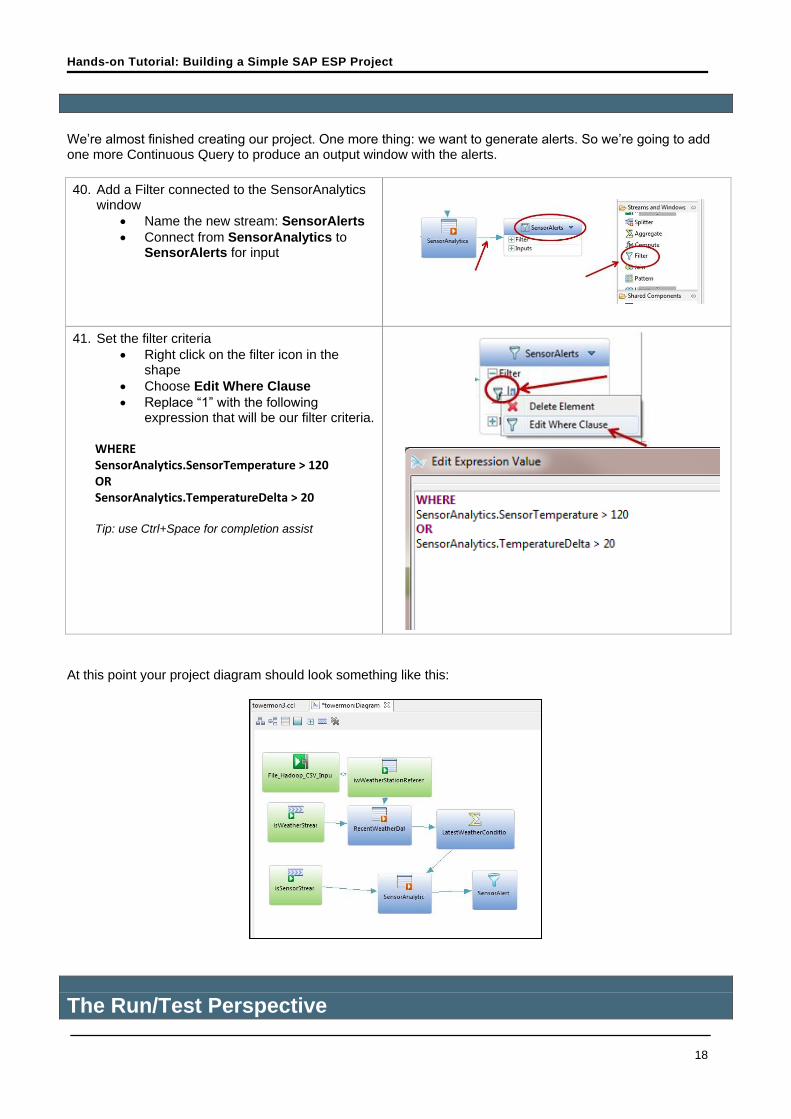
40. Add a Filter connected to the SensorAnalytics window
Name the new stream: SensorAlerts
Connect from SensorAnalytics to SensorAlerts for input
41. Set the filter criteria
Right click on the filter icon in the shape
Choose Edit Where Clause
Replace “1” with the following expression that will be our filter criteria.
WHERE SensorAnalytics.SensorTemperature > 120 OR SensorAnalytics.TemperatureDelta > 20 Tip: use Ctrl+Space for completion assist

Hands-on Tutorial: Building a Simple SAP ESP Project
19
Now let’s run and test our project. At this point, if you have errors in your project that you haven’t been able to correct, just open towermon3 in either the visual editor or CCL editor and work with it. It is just like the project you’ve been building, with a couple of extra windows.
42. Run the project
With the project you want to run open in either the visual editor or the CCL editor, click the run button on the main toolbar
This will start a local ESP server, start the project, and switch the ESP Studio to the SAP ESP Run-Test perspective
When it prompts for a password, you can enter anything – you are creating a password that other applications would need to use to connect to the local server you are starting – but we won’t be using it
43. View the data in the WeatherStationReference input window
If your project started successfully, you will see it listed in the Server View
Expand the project to see all the streams/windows that are running
Double click on iwWeatherStationReference to open it in the Stream View – you should see some data in it
The iwWeatherStationReference window has a file input adapter attached to it – so it reads in that file on startup
44. Open other output windows in Stream View – though they won’t have data yet
Double click on SensorAnalytics in the Server view to open it in Stream View
Double click on SensorAlerts to also open it in Stream View
These will both be empty, because they rely on data from the SensorStream and WeatherStream inputs which don’t have attached adapters and haven’t received any data yet Note: if you get a “Cannot subscribe to local stream” error message, it’s because one or both of these are set to LOCAL. Go back to the editor and toggle it/them to OUTPUT.

Hands-on Tutorial: Building a Simple SAP ESP Project
20
More Exploration (Optional)
If you have more time, either now, or later, here are some additional things to explore using the same project we’ve been working with.
1. Different Window policies
a. In the Visual Editor, in the SAP ESP Authoring Perspective, expand the RecentWeatherData window, expand the “Other” compartment, and double click on the KEEP policy. Here you’ll see what your options are.
b. Window size: can be based on number of rows or time
45. Use the Playback tool to stream in some sample data from a file
Go to the Playback view in the lower left tile of the Studio
1. Click on the Select Project tool in the upper right corner of the Playback View. Note: this connects the playback tool to a project. If you only have one project running, one click will connect it. If you have multiple projects running it will prompt you to choose.
2. Click the Select Playback File tool and select the input-streams.csv file in the data folder of the towermon3 project (c:\espdemos\towermon3\data\input_streams.csv)
a. Change the file type to *.csv from in the dropdown if you don’t see your file
3. (Optional) Change the Playback Mode to rec/ms and set a rate (eg: 0.01) to slow down the playback and get a better view of the alerts being generated over time.
4. Click the Start Playback button Note: To re-run the playback file, you can stop and restart the project from the Server View.
46. You can now view the output in the Stream View
Click the Stream View tabs to view SensorAnalytics and SensorAlerts
View latest weather conditions by double clicking the output window in the Server View

Hands-on Tutorial: Building a Simple SAP ESP Project
21
i. In the time field you can use most English keywords or abbreviated keywords, e.g. min, minutes, sec, hours, day, month, etc.
ii. If specifying number of rows (in the Count(Rows) field), you can optionally specify a slack value to improve performance. Without slack, when the window is full, each new event will push the oldest event out. But with slack of 10, for example, when the window is full it will grow to be 10 events larger than the window size, and then delete the oldest 10. It’s just more efficient than one-for-one deletes
c. Jumping windows:
i. By default, windows are rolling windows: as new events arrive, or as the clock ticks, the oldest events are pushed out according to the KEEP policy. If you check the keyword EVERY, the window becomes a jumping window, where the window is cleared by the KEEP policy and starts over. So if you set the policy to KEEP EVERY 4 HOURS, every 4 hours all the events in the window would be deleted and the window would start collecting again.
d. KEEP PER Clause
i. This is a new window type that applies the KEEP policy to groups of events, where the groups are based on common values of a column or columns. For an example of this, look at the KEEP policy for the SensorAnalytics window. Here, the window is keyed by EquipmentID and ObservationDT, but we want to keep roughly 100 readings for each EquipmentID. Without the “PER” clause, the keep policy would apply to the whole window, so if we only kept the last 100 readings, if some sensors report more frequently than others, we might have lots of readings for some and no readings for others.
2. Capture ESP output in SAP HANA or SAP Sybase IQ
a. It’s as simple as adding an output adapter, attaching it to the output stream or window that you want to capture, and configuring the adapter
b. You’ll see the Sybase IQ Output and HANA Output adapters on the output adapters palette.

Hands-on Tutorial: Building a Simple SAP ESP Project
22
3. Autogenerate
a. This feature can be used to apply an automatically generated sequence number of events arriving in an input stream or input window. It’s particularly useful where you want to create an input window where the incoming event stream doesn’t have a natural key. All ESP windows must have a primary key column, which has a unique value in each row.
b. In our towermon3 project, take a look at the isWeatherStream input stream in either the visual editor or the CCL editor. You’ll see that it uses the Autogenerate clause to indicate that the Id field should be incremented with each incoming event.
c. Now you might ask: why did we use this on a stream? After all, streams don’t require keys. But if you look at the next step in our dataflow, you’ll see why. (Hint: see the note in step 24)
4. Flex Operator
a. In the towermon3 project, select LatestWeatherConditionsPulsed in the Visual Editor. This is an example of a Flex Operator. Flex operators are custom operators that run event handlers written in CCL Script – the ESP scripting language – on the arrival of each new event.
b. Press F6 to go to the CCL Editor and view the code for this Flex Operator. Flex operators are an important feature of ESP, as they add tremendous versatility, but they are an advanced feature and outside the scope of this workshop
c. If you study this Flex operator, however, you’ll notice the use of dictionaries to retain state, and the built in timer that fires at fixed intervals. This particular operator publishes the current weather statistics every 1 minute.
5. Parameters and Project Configuration Files
a. Parameter can be used to be able to change the values of constants at runtime. In step 41 above, we could have used two parameters in the filter expression instead of hard coding the values being checked. MaxTemp and MaxTempDelta. Open the towermon3 project in the CCL editor and scroll to the very top. You’ll see a global declaration block where they are defined. This also sets the default values.
declare parameter float MaxTemp := 120.0; parameter float MaxTempDelta := 20.0; end; Then scroll down the “CREATE OUTPUT WINDOW SensorAlerts …” to see the
parameters being used in the WHERE clause.
b. The parameter values can be changed, however, at run time, after the project has been compiled.
c. In towermon3 project in the file explorer, double click on towermon3.ccr. This is the project configuration file editor. It allows various project properties to be set independently of the CCL, allowing a project to be compiled once, but then deployed with different project configuration files that contain parameter settings as well as things like adapter properties that contain connection information.
d. Go to the Parameters tab to see how you can change the values of these parameters, even after the project has been compiled.

Hands-on Tutorial: Building a Simple SAP ESP Project
23
6. Project Bindings
a. Bindings allow you to connect one project to another project. In fact you can even create a network of projects. A binding connects an output stream (or window) from one project to an input stream/window in another project. The binding can be initiated from either direction.
b. You can add input bindings to a project to connect one or more input streams/windows to the output from another project
c. First, be sure a project is running and then open a project configuration file (e.g. double click towermon3.ccr)
d. Go to the Clusters tab and click the Discover button. Select the local server and click OK
e. Now go to the Bindings tab. Click the Discover button and select the input that you want to add a binding to. Now, on the right, choose the project and output stream/window to bind to
f. Uses for bindings include:
i. If a project is so large that it is capacity constrained on the box it’s running on, rather than buying a bigger box, you can break the project into multiple smaller interconnected projects running across multiple machines
ii. You can dynamically add new calculations to a live project. You don’t actually change the live project; just start a new project that binds to outputs from the existing project and does further computations.
7. Diagrams
a. Using the Visual Editor, compare the inputs of the towermon and towermon3 projects. Do you see the difference? The towermon3 project has a brown schema block that doesn’t appear on the towermon diagram. In reality, the projects are the same - it’s just the diagrams that are different. Here’s the explanation: diagrams don’t have to show all parts of a project. And in fact you can create multiple different diagrams for a single project. This is very useful for large projects, where a single diagram with everything might become to awkward.
b. In the towermon3, in the visual editor, select the isSensorStream. Right click on the shape and choose Show and click on Related Shared Components. The named schema will now appear on the diagram.
c. Now select the schema you just added, right click on the shape and select Delete from Diagram. It gets removed from the diagram, but it’s still in the project. You can see it if you look at the underlying CCL.
8. Outline
a. The outline, in the upper right corner of the authoring perspective (by default) can also be a useful tool for seeing all elements of a project, whether they are shown in the diagram or not. If an element exists in the project but not on the current diagram, you can drag it from the outline onto the diagram
9. Comments
a. In the towermon3 diagram, hover the mouse over the RecentWeatherData shape. The tool tip will show a description of the function of this window.
b. Select the window shape and then view the properties in the Properties View at the bottom of the Studio. You’ll see that the description you saw in the tooltip for the shape is set in the comment property
Hands-on Tutorial: Building a Simple SAP ESP Project
24
10. Properties View
a. The Properties View is context sensitive and will let you view and edit the properties of the item selected in the diagram
11. Run multiple projects
a. You can run multiple projects on a single server. Try it. Start 2 or more projects. Then see how they’re listed in the Server View and how you can use the various run/test tools with them
12. Manual Input tool
a. The manual input view (beside the Playback tab) in the Run/Test perspective is very useful for debugging. Try it. The first step is to connect it to an input stream by clicking the Select Stream button in the upper right corner of the Manual Input view. Then just enter values and Publish (again – green button on the upper right corner of the view).
13. Monitor tool
a. After starting the project (eg: towermon or towermon3) in the SAP ESP Run-Test perspective, right click on the project in the Server View and choose Show In > Monitor View. Select the Monitor tab if it isn’t already displayed. Start a Playback (Hint: see step 45 above) and then adjust the Range values to see how the monitor displays load. For example at a playback rate of 0.1 rec/ms on the input-streams.csv file, range values for Rows per second of 10 and 1 will illustrate how the Monitor visualizes the status of the different elements in the ESP project based on current load.
b. You can then choose whether to have colors indicate throughput (Rows per Second) or queuing (Queue depth). If any of the shapes show a black portion, that indicates % cpu utilization. The Monitor can be a very useful tool for identifying bottlenecks in a project

Copyright
© 2015 SAP SE SE or an SAP SE affiliate company. All rights reserved.
No part of this publication may be reproduced or transmitted in any form or for any purpose without the express permission of SAP SE. The information contained herein may be changed without prior notice.
Some software products marketed by SAP SE and its distributors contain proprietary software components of other software vendors. National product specifications may vary.
These materials are provided by SAP SE and its affiliated companies (“SAP SE Group”) for informational purposes only, without representation or warranty of any kind, and SAP SE Group shall not be liable for errors or omissions with respect to the materials. The only warranties for SAP SE Group products and services are those that are set forth in the express warranty statements accompanying such products and services, if any. Nothing herein should be construed as constituting an additional warranty.
SAP SE and other SAP SE products and services mentioned herein as well as their respective logos are trademarks or registered trademarks of SAP SE in Germany and other countries.
Please see http://www.sap.com/corporate-en/legal/copyright/index.epx#trademark for additional trademark information and notices.