HANDS-ON DATA DISCOVERY - Carleton University · HANDS-ON DATA DISCOVERY Exploring Data with IBM...
53
HANDS-ON DATA DISCOVERY Exploring Data with IBM SPSS Modeler and Other Platforms Jennifer Schellinck, Ph.D., Sysabee Patrick Boily, Ph.D., CQADS October 30, 2014
Transcript of HANDS-ON DATA DISCOVERY - Carleton University · HANDS-ON DATA DISCOVERY Exploring Data with IBM...

HANDS-ON DATA
DISCOVERY Exploring Data with IBM SPSS Modeler and Other Platforms
Jennifer Schellinck, Ph.D., Sysabee
Patrick Boily, Ph.D., CQADS
October 30, 2014

REVIEW AND
INTRODUCTION Section I − What is data science and data mining?

Data Science, Broadly Speaking
• Hilary Mason, a noted data scientist, divides data science
into two halves.
• The one half is analytics, which she simplifies as
“counting things.”
• The other half is the invention of new techniques that can
draw insights from data that were not possible before. http://www.forbes.com/sites/danwoods/2012/03/08/hilary-mason-what-is-a-data-scientist/

The 5 W’s of Data Mining
• Who: organizations, governments, researchers
• What: A knowledge increasing strategy
• Where: Wherever there is data- small or big
• When: When you need to make decisions supported by
facts and knowledge
• Why: Increase your capability to achieve a given goal

The How of Data Mining
• How does data mining increase knowledge and decision
making power?
• Data mining can increase your empirical knowledge of a situation
(more facts)
• This is accomplished using algorithms that discover patterns in
data sets
• This workshop will further introduce you to how data mining does
this, in a hands on fashion

Workshop III − Overview
• Workshop II discussed the functionality of data mining
techniques:
• Association
• Classification
• Clustering
• Workshop III gets more into the details of what is involved
in actually carrying out these techniques on real data
• We will be using particular software, but the goal is to
provide you with skills and knowledge that you can apply
to any data mining situation, regardless of the particular
software

Workshop III − Goals
• Increase your understanding of, and gain practical
experience in, the flow-through of data-mining- from initial
data to final output
• Gain a preliminary understanding of which data is
appropriate for which data mining techniques
• Get some hands on experience in carrying out data-
mining using some well known data mining tools

The Breadmaker Analogy

The Breadmaker Analogy − Purpose
• To help you generalize what we are showing you in this
workshop, beyond the specific data and software we are
using here, we present a useful high level analogy- the
breadmaker analogy
• This will be particularly helpful for people who have not
had much experience working with data or software that
processes data
• For those who have more experience, this analogy may
also provide you with a broader perspective on working
with data

The Breadmaker Analogy − I
• Get raw materials
• Wheat grains, yeast cakes, etc.
• Data
• Refine raw materials
• Mill wheat into flour, extract yeast
• Clean data and create conceptual models of the data
• Choose what you want to do with your materials
• Make egg bread
• Find association rules, classification rules, clusters
• Select the appropriate materials and prepare them appropriately
• Crack and beat the eggs, measure the flour, etc.
• Determine which parts of your data are relevant to the process, make sure they are in the correct format (ordinal, numeric, categorical)

The Breadmaker Analogy − II
• Get your machine set up- add the right attachments,
select the appropriate settings:
• Select egg bread, cook for three hours, etc.
• Determine what your algorithm parameters should be (e.g your
required level of accuracy)
• Feed the materials into the machine in the appropriate
order and fashion
• Add the liquid, then the flour, then the yeast, etc.
• Input the data into the chosen algorithm in the correct way
• Wait for the machine to create your product for you…

Limitations of the Breadmaker Analogy
• The breadmaker then outputs…
• A new machine constructed out of bread? That takes as input more
flour, and then bakes cookies?
• Clearly this is where the breadmaker analogy breaks
down!
• In a sense this extension to the analogy is what happens
with data-mining, because the output of your first ‘data
mining machine’ is a new ‘machine’ (a model) into which
you then feed more data

What You Will Be Doing Today − In
‘Breadmaker’ Terms • What we have done for you:
• Get raw materials (wheat grains, yeast cakes, etc.)
• Refine raw materials (mill wheat into flour, extract yeast)
• Choose the types of products you will make with your materials
• What you will do during the workshop
• Select the appropriate materials and prepare them appropriately
(crack and beat the eggs, measure the flour, etc.)
• Get your machine set up- select the appropriate settings (select
egg bread, cook for three hours, etc.)
• Feed the materials into the machine in the appropriate order and
fashion (add the liquid, then the flour, then the yeast, etc.)
• Wait for the machine to create your products for you…
RELEVANT DATA MINING
CONCEPTS Section 2

Review − Objects and Attributes
shape = spherical
colour = red
function = food
location = fridge
owner = Jen

Review − From Attributes to Datasets
ID# Shape Colour Function Location Owner
1 spherical red food fridge Jen
2 rectangle brown food office Pat
3 round white Tell time Math
lounge
Math
Department
… … … … … …

Raw Data from the Mushroom Dataset

Learning from the poisonous mushrooms
dataset
odor= not distinctive
spore colour = white
habitat=woods
Amanita muscaria
gill size = narrow

Connecting Data Back to the Source
• To fully utilize data, you must first and foremost
understand what the data represents
• If you are initially just presented with the data, you must
do the detective work to gain this understanding
• You can then ask questions about the underlying objects
• You select data analysis techniques based on what
questions you want answered
• Then you return to the data to see if the data you have will
adequately support the techniques you have chosen to
answer your questions

Which Direction?
• From goal to data, or from data to goal?
• Goal to data: • You have a goal you want to achieve/question you want to answer
• You consider how data science techniques (analytics/data mining) can help you get there
• You gather data specifically based on this, or confirm that existing data can achieve these goals with these tools
• Data to goals • You have some data, you want to do something with it!
• You consider what data mining techniques might be applied to the data
• You ‘play around’ with the data
• You come to some conclusions based on the outputs of various techniques

What’s Wrong With Just Playing?
• You may hear some people disparagingly speak about
‘going on fishing expeditions’
• ‘Playing with the data’ can be beneficial in the right
context:
• In a particular situation, you can get a feel for what the data is like,
what is going on
• You can learn a lot/increase your skills by doing this
• This can be great for what science refers to as ‘hypothesis
discovery’
• But once you have discovered a hypothesis, you still need
to test it − this is a main ‘rule’ of science − for good
reason!

Data Analysis Project − Data Flow
I. Data Pre-Analysis: I. Select what data you want to use (filter out certain columns)
II. Clean, prepare your data (e.g. remove null values)
II. Data Algorithm ‘Set Up’ I. Derive measures from atomic data
II. Choose an analysis technique
III. Prepare data for analysis (e.g. set the type of the data in columns- i.e. which is the target data?)
IV. Set the parameters for the data analysis techniques you have chosen
III. Data Analysis I. Use the training/sample data to carry out the analysis or create
models, if you are using data mining techniques
IV. Use/Interpretation of Results I. Review the output of the model or the data analysis
II. Run new data through the system *Note that these are not necessarily sequential activities- they are numbered for ease of reference.

Data Transformation
• At each stage of the data flow, the data is transformed.
• We can think of this transformed data as the output of
each stage.
• We can start to understand what is happening in the data
flow by looking at this output.
• For the data mining examples in the following sections,
we will start by looking at the output, and then see how
the output was created.

Workshop Software Tools
• In this workshop you will be able to try out three different
data analysis software packages:
• IBM Cognos Insight
• IBM SPSS Modeler (our main focus)
• WEKA

BASIC ANALYTICS Section 3

Basic Analytics − A Review
• Basic analytics involves:
• Structuring data to support various types of analysis
• Combining data or transforming data to create new, derived data
• Creating summaries and overviews of existing data
• Creating more complex measures or metrics by combining data
• Using this derived data to answer questions/draw conclusions

Dataset − Wholesaler Purchasing Data
• Dataset is provided as a ‘flat file’- a database encoded as a single table.
• This is a good format for doing data mining, but not necessarily for doing other types of analytics
• Other database models put the emphasis on particular objects and relations within the data
• Dataset Attributes: • FRESH: annual spending on fresh products
• MILK: annual spending on milk products
• GROCERY: annual spending on grocery products
• FROZEN: annual spending on frozen products
• DETERGENTS_PAPER: annual spending on detergents and paper products
• DELICATESSEN: annual spending on and delicatessen products
• CHANNEL: customer's channel: Horeca (Hotel/Restaurant/Cafe) or Retail channel (Nominal)
• REGION: customer's region: Lisnon, Oporto or Other (Nominal) https://archive.ics.uci.edu/ml/datasets/Wholesale+customers

Wholesale Data − Structuring the Data
• Two key objects, or dimensions: • Client (as represented by Client Type)
• Region
• Relating to these two dimensions, seven measures relating to amount of money spent: • Fresh
• Milk
• Grocery
• Frozen
• Detergent_Paper
• Delicatesen
• Count
•

Wholesale Data − Connecting Data to
Source • To understand this dataset, may need to do some external
research:
• Example- what is HORECA?
• Knowledge of data supports structuring the dataset into a
particular data model, which can facilitate particular types
of use and analysis
• Cognos Insight requires data to be structured as OLAP
cubes, which focuses on the relationships between
particular objects (e.g. three objects) represented by the
database
• This type of representation is particularly suitable for
financial data

Wholesaler Dataset − Basic Analytics
Questions • How much money did each region spend?
• How much money did each channel spend?
• How much did each channel spend by region?
• How much did each region spend by channel?
• In general, can use cross tabulation and other strategies
to summarize or ‘roll up’ your data, generating
contingency tables or pivot tables
• Related to ‘slicing and dicing’: “Slicing and dicing is a
feature whereby users can take out (slicing) a specific set
of data of the OLAP cube and view (dicing) the slices from
different viewpoints” https://en.wikipedia.org/wiki/Online_analytical_processing

Answering Analytics Questions
Cognos Insight Demonstration
CLASSIFICATION Section 4

Data Mining Algorithms − Key Points
• There are many many data-mining algorithms − often variations on a theme. Algorithms (techniques) are being continually ‘tweaked’.
• When confronted with an algorithm, some basic questions to answer: • Which data mining category - association, clustering, classification
(regression), etc.
• What type of data does the algorithm take as input? (categorical, continuous, binary, etc.)
• If supervised, what type of data does the target need to be? (categorical, continuous, binary, etc.)
• What are the parameters of the algorithm?
• What metrics are used to determine if the output is any good?
• Can the results of the algorithm be used on new data? If so, how?

A Review of Classification
• Goal of classification is to determine into which (predefined) category a new instance of data fits
• Dataset specific models are created using some data + a data mining technique
• The models can then themselves be used to classify new instances
• Some classifications work well for numeric data: • Regression - relevant attributes are combined in an equation. The
equation equals the (predicted) value for the attribute of interest.
• Some classifications work well for categorical data: • Decision trees - the value of particular attributes leads you through
the tree, with the leaves representing the category of the attribute of interest.

Dataset − Wine Dataset
• Contains data relating to chemical composition of wines
• Wine Cultivars from three different regions are
represented
• Attributes: Cultivar (target), Alcohol, Malic acid, Ash,
Alcalinity of ash, Magnesium, Total phenols, Flavanoids,
Nonflavanoid phenols, Proanthocyanins, Color intensity,
Hue, OD280/OD315 of diluted wines, Proline
• Classification Problem: Which region does a wine come
from? https://archive.ics.uci.edu/ml/datasets/Wine

Classification
SPSS Modeler Demonstration

Classification Demonstration − Some
Additional Points • This is a very simple example.
• Some useful points:
• Programming points:
• Even for a simple ‘program’, there will be debugging
• Get data to flow through the program doesn’t necessarily mean the
program is working the way you think it is- validate results
• Meaning points:
• What do the results mean?
• Which is the better classifier?
• Are any of these classifiers reliable enough to use?

CLUSTERING Section 5

A Review of Clustering
• Goal of clustering is to take a dataset and divide it into
clusters
• Each cluster contains instances that are similar to each
other
• Popular clustering algorithm: k-means
• Challenge with clustering:
• Why are you interested in clustering- what is your goal?
• How do you properly interpret the results?
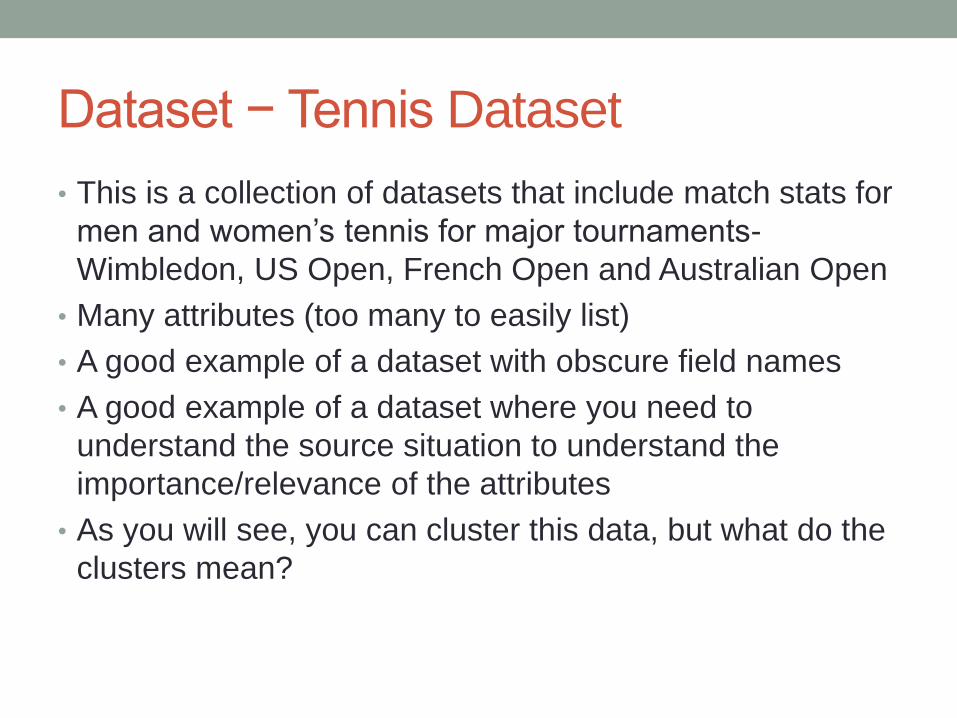
Dataset − Tennis Dataset
• This is a collection of datasets that include match stats for
men and women’s tennis for major tournaments-
Wimbledon, US Open, French Open and Australian Open
• Many attributes (too many to easily list)
• A good example of a dataset with obscure field names
• A good example of a dataset where you need to
understand the source situation to understand the
importance/relevance of the attributes
• As you will see, you can cluster this data, but what do the
clusters mean?

Sidebar − Data Ethics
• As a data professional, you should be aware of, and able
to talk knowledgably about, ethical practices and issues in
data science (more than just- yes, there are some!)
• Beyond that, we can’t make you care about data science
ethics (but we do!)
• Here are two high level key points:
• Consent
• Anonymity
• Want to learn more?

Sidebar − Data Ethics
• Data Ethics Resources:
• Some basics from Wikipedia:
• Research Ethics (https://en.wikipedia.org/wiki/Research_ethics)
• Nuremberg Code (https://en.wikipedia.org/wiki/Nuremberg_Code)
• National Centre for Education Statistics: The Forum Guide to Data
Ethics (http://nces.ed.gov/pubs2010/2010801.pdf)
• Information Week Articles:
• Data Scientists Want Big Data Ethics Standards • (http://dsi.virginia.edu/center-big-data-ethics-law-and-policy)
• Data Scientists Create Code Of Professional Conduct (http://www.informationweek.com/big-data/big-data-analytics/data-scientists-create-code-of-professional-conduct/d/d-id/1111836?)

Clustering
SPSS Modeler Demonstration

EXPLORING THE DATA Section 5

Jumping In…
• Now that you’ve seen some of the tools in action, it’s your
turn to try doing some analysis
• You will be working with either the Goodworks dataset or
some selected datasets from the UCI machine learning
repository
• You will use SPSS Modeler to analyze the data
• We have earmarked suggested datasets for classification,
clustering and association
• You can access the provided UCI data repository website
to learn more about each dataset

THE GOODWORKS
DATASET A Case Study

Goodworks: The Background
• Goodworks: a (fictional) medium sized national charity
which connects donors to charities that interest them and
manages the donation process.
• The board of directors has heard about data mining-
wants to leverage their data assets in the creation of the
next fundraising campaign.
• They have already hired a data scientist, Fiona, to
manage and work with the charity’s data on any relevant
projects.
• Deepthi and Pierre-Luc are responsible for designing and
organizing the upcoming fund-raising campaign.

Defining the Problem & Planning the
Project • The goal: Get the maximum number of return dollars possible
for every dollar spent on the campaign. To do this, make sure the right people get the right materials.
• Want to discover: • What other attributes are connected to different types of donations
(Association Learning)
• If there are any connections between other variables and the different types of fundraising initiatives (Association Learning) )
• What variables predict the highest donors, to devise a campaign that influence this factor. (Classification).
• Which attributes predict whether or not donors will increase their donations over time and which variables predicted a decrease in donation rate over time. (Classification).
• How best to target fundraising strategies. (Cluster Analysis)
• They also realize that it is worthwhile to carry out some basic analysis of the data, and create some summary data to supplement their other findings.

The Goodworks Dataset
• Attributes: ID, Gender, Age, Marital_Status, Children_in_Household, Region, Urban_Rural, Employment_Status, Education, Religious_Attendance, Individual_Income, Household_Income, Household_Language, Annual_Volunteering, First_Year, Number_of_Years, Current_Year_Donation_Method, Current_Year_Event, Event_Gifts, Current_Year_Donation_Type, Current_Year_Number_of_Donations, Current_Year_Total_Donation_Value, Current_Year_Average_Value_per_Donation, Current_Year_Total_Donation_Values_Plus_Gift_Events, Proportion_of_Individual_Income, Proportion_of_Household_Income, Next_Year

The Goodworks Dataset − Points
• A large number of attributes!
• Not all will be relevant (perhaps some are even red
herrings…)
• Not all fields will work as input to the various algorithms
• Is the data clean?

Some Options for Exploring
• Try out one of the mini-exercises: • Basic Analytics
• Supervised Learning: Classification
• Unsupervised Learning: Association Rules
• Unsupervised Learning: Clustering
• Want to start more slowly? • Load one of our existing streams and try loading a different dataset.
Then run the stream to see what happens.
• Try out some of the example streams available in Modeler (see handout for a guide and links to documentation that explains the example streams)
• Want to jump ahead? • Try downloading a new dataset from the UCI data repository and
doing your own analysis

Reminder − Data Analysis Flow
I. Data Pre-Analysis: I. Select what data you want to use (filter out certain columns)
II. Clean, prepare your data (e.g. remove null values)
II. Data Algorithm ‘Set Up’ I. Derive additional measures from atomic data
II. Choose an analysis technique
III. Prepare data for analysis (e.g. set the type of the data in columns- i.e. which is the target data?)
IV. Set the parameters for the data analysis techniques you have chosen
III. Data Analysis I. Use the training/sample data to carry out the analysis or create
models, if you are using data mining techniques
IV. Use/Interpretation of Results I. Review the output of the model or the data analysis
II. Run new data through the system Note that these are not necessarily sequential activities- they are numbered for ease of reference

Reminder − Connecting Data Back to the
Source • To fully utilize data, you must first and foremost
understand what the data represents
• If you are initially just presented with the data, you must
do the detective work to gain this understanding
• You can then ask questions about the underlying objects
• You select data analysis techniques based on what
questions you want answered
• Then you return to the data to see if the data you have will
adequately support the techniques you have chosen to
answer your questions