Handbook for Developing Watershed Plans to Restore … · 2015-11-02 · This document is one...
14
This document is one chapter from the EPA “Handbook for Developing Watershed Plans to Restore and Protect Our Waters,” published in March 2008. The reference number is EPA 841-B-08-002. You can find the entire document http://www.epa.gov/owow/nps/watershed_handbook. Handbook for Developing Watershed Plans to Restore and Protect Our Waters March 2008 Chapter 9. Set Goals and Identify Load Reductions
Transcript of Handbook for Developing Watershed Plans to Restore … · 2015-11-02 · This document is one...

This document is one chapter from the EPA “Handbook for Developing Watershed Plans to Restore and Protect Our Waters,” published in March 2008. The reference number is EPA 841-B-08-002. You can find the entire document http://www.epa.gov/owow/nps/watershed_handbook.
Handbook for Developing Watershed Plans to Restore and Protect Our Waters
March 2008
Chapter 9. Set Goals and Identify Load Reductions

9-1
Handbook for Developing Watershed Plans to Restore and Protect Our Waters
Handbook Road Map1 Introduction
2 Overview of Watershed Planning Process
3 Build Partnerships
4 Define Scope of Watershed Planning Effort
5 Gather Existing Data and Create an Inventory
6 Identify Data Gaps and Collect Additional Data If Needed
7 Analyze Data to Characterize the Watershed and Pollutant Sources
8 Estimate Pollutant Loads
9 Set Goals and Identify Load Reductions
10 Identify Possible Management Strategies
11 Evaluate Options and Select Final Management Strategies
12 Design Implementation Program and Assemble Watershed Plan
13 Implement Watershed Plan and Measure Progress
Read this chapter if...• Youwanttoselectindicatorstomeasureattainmentofyour
watershedgoals
• Youwanttouseyourwatershedgoalstoidentifynumericwaterqualitytargets
• Youneedanapproachtodeterminehowmuchofaloadreductionyouneedtomeetyourwatershedgoals
• Youwantinformationonhowtofocusloadreductionsappropriately
Chapter Highlights• Settinggoals
• Identifyingmanagementobjectives
• Selectingindicators
• Developingtargets
• Determiningloadreductionsneeded
• Focusingonloadreductions
9. Set Goals and Identify Load Reductions
Handbook for Developing Watershed Plans to Restore and Protect Our Waters
9-2
9.1 HowDoILinktheWatershedAnalysistoManagementSolutions?
Onceyouhaveanalyzedthedata,identifiedtheproblem(s)inthewatershed,andidentifiedandquantifiedthesourcesthatneedtobemanaged,you’lldevelopmanagementgoalsandassociatedtargets.Duringthescopingphaseofplanning(chapter4),youestablishedbroadwatershedgoals(e.g.,meetwaterqualitystandards,restoredegradedwetlands)asaprelimi-naryguide.Nowthatyouhavecharacterizedandquantifiedtheproblemsinthewatershed(chapters7and8),you’rereadytorefinethegoalsandestablishmoredetailedobjectivesandtargetsthatwillguidedevelopingandimplementingamanagementstrategy.
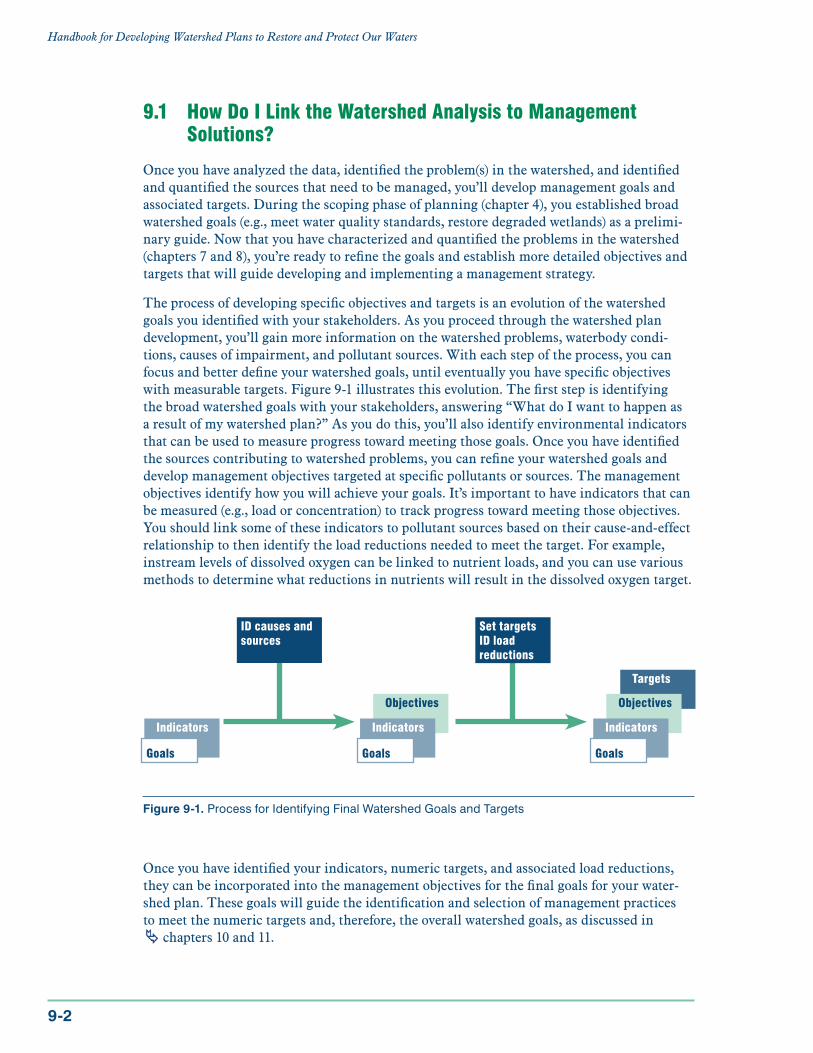
Theprocessofdevelopingspecificobjectivesandtargetsisanevolutionofthewatershedgoalsyouidentifiedwithyourstakeholders.Asyouproceedthroughthewatershedplandevelopment,you’llgainmoreinformationonthewatershedproblems,waterbodycondi-tions,causesofimpairment,andpollutantsources.Witheachstepoftheprocess,youcanfocusandbetterdefineyourwatershedgoals,untileventuallyyouhavespecificobjectiveswithmeasurabletargets.Figure9-1illustratesthisevolution.Thefirststepisidentifyingthebroadwatershedgoalswithyourstakeholders,answering“WhatdoIwanttohappenasaresultofmywatershedplan?”Asyoudothis,you’llalsoidentifyenvironmentalindicatorsthatcanbeusedtomeasureprogresstowardmeetingthosegoals.Onceyouhaveidentifiedthesourcescontributingtowatershedproblems,youcanrefineyourwatershedgoalsanddevelopmanagementobjectivestargetedatspecificpollutantsorsources.Themanagementobjectivesidentifyhowyouwillachieveyourgoals.It’simportanttohaveindicatorsthatcanbemeasured(e.g.,loadorconcentration)totrackprogresstowardmeetingthoseobjectives.Youshouldlinksomeoftheseindicatorstopollutantsourcesbasedontheircause-and-effectrelationshiptothenidentifytheloadreductionsneededtomeetthetarget.Forexample,instreamlevelsofdissolvedoxygencanbelinkedtonutrientloads,andyoucanusevariousmethodstodeterminewhatreductionsinnutrientswillresultinthedissolvedoxygentarget.
Onceyouhaveidentifiedyourindicators,numerictargets,andassociatedloadreductions,theycanbeincorporatedintothemanagementobjectivesforthefinalgoalsforyourwater-shedplan.Thesegoalswillguidetheidentificationandselectionofmanagementpracticestomeetthenumerictargetsand,therefore,theoverallwatershedgoals,asdiscussedin chapters10and11.
Indicators
Goals
Objectives
Indicators
Goals
Targets
Objectives
Indicators
Goals
IDcausesandsources
SettargetsIDloadreductions
Figure 9-1. ProcessforIdentifyingFinalWatershedGoalsandTargets
Chapter9:SetGoalsandIdentifyLoadReductions
9-3
9.2 TranslateWatershedGoalsintoManagementObjectivesYou’veprobablyalreadyidentifiedpreliminarygoalsandassociatedenvironmentalindica-torswithyourstakeholders,asoutlinedinchapter4,butnowyou’llrefinethegoalsonthebasisofyourdataanalysis.Thedataanalysisidentifiedthelikelycausesandsourcesaffect-ingspecificindicators(e.g.,temperature,dissolvedoxygen,pebblecounts).Therefore,youhaveanideaofwhatsourcesneedtobecontrolledtomeetyouroverallwatershedgoalsandcanusethisinformationtotranslateyourwatershedgoalsintomanagementobjectives.Man-agementobjectivesincorporatethewatershedgoalsbutfocusonspecificprocessesthatcanbemanaged,suchaspollutantloadingandriparianconditions.
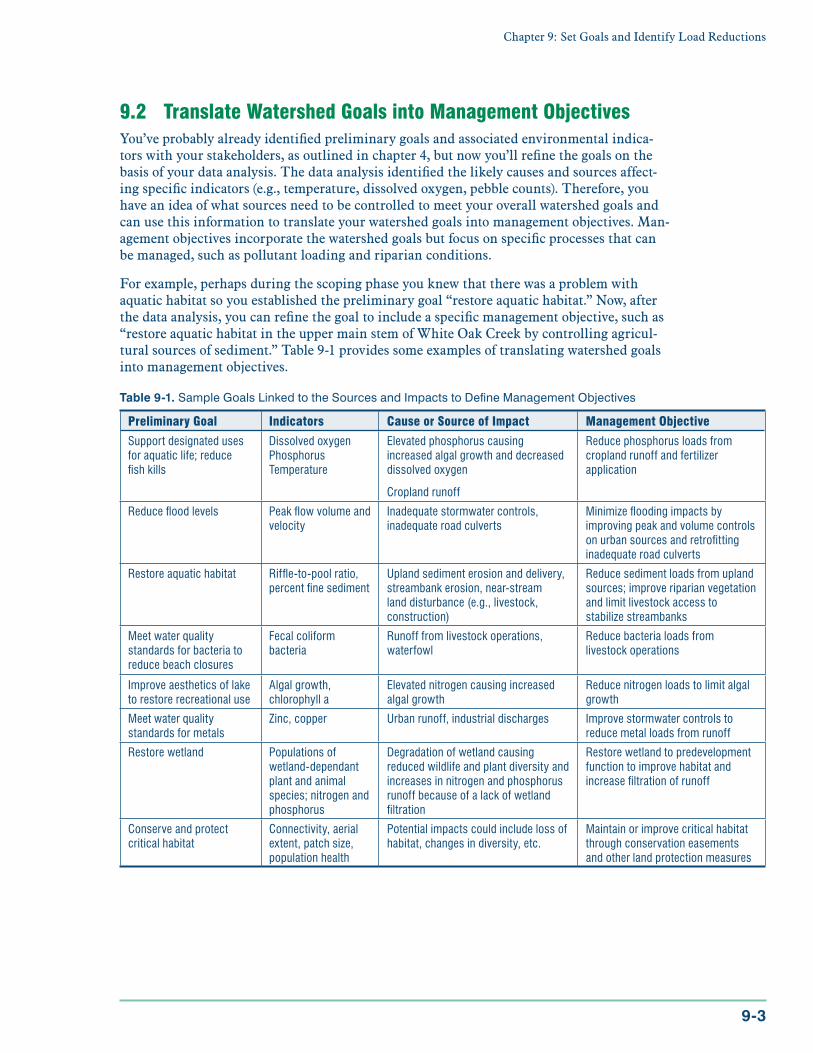
Forexample,perhapsduringthescopingphaseyouknewthattherewasaproblemwithaquatichabitatsoyouestablishedthepreliminarygoal“restoreaquatichabitat.”Now,afterthedataanalysis,youcanrefinethegoaltoincludeaspecificmanagementobjective,suchas“restoreaquatichabitatintheuppermainstemofWhiteOakCreekbycontrollingagricul-turalsourcesofsediment.”Table9-1providessomeexamplesoftranslatingwatershedgoalsintomanagementobjectives.
Table 9-1. SampleGoalsLinkedtotheSourcesandImpactstoDefineManagementObjectives
PreliminaryGoal Indicators CauseorSourceofImpact ManagementObjective
Support designated uses for aquatic life; reduce fish kills
Dissolved oxygenPhosphorusTemperature
Elevated phosphorus causing increased algal growth and decreased dissolved oxygen
Cropland runoff
Reduce phosphorus loads from cropland runoff and fertilizer application
Reduce flood levels Peak flow volume and velocity
Inadequate stormwater controls, inadequate road culverts
Minimize flooding impacts by improving peak and volume controls on urban sources and retrofitting inadequate road culverts
Restore aquatic habitat Riffle-to-pool ratio, percent fine sediment
Upland sediment erosion and delivery, streambank erosion, near-stream land disturbance (e.g., livestock, construction)
Reduce sediment loads from upland sources; improve riparian vegetation and limit livestock access to stabilize streambanks
Meet water quality standards for bacteria to reduce beach closures
Fecal coliform bacteria
Runoff from livestock operations, waterfowl
Reduce bacteria loads from livestock operations
Improve aesthetics of lake to restore recreational use
Algal growth, chlorophyll a
Elevated nitrogen causing increased algal growth
Reduce nitrogen loads to limit algal growth
Meet water quality standards for metals
Zinc, copper Urban runoff, industrial discharges Improve stormwater controls to reduce metal loads from runoff
Restore wetland Populations of wetland-dependant plant and animal species; nitrogen and phosphorus
Degradation of wetland causing reduced wildlife and plant diversity and increases in nitrogen and phosphorus runoff because of a lack of wetland filtration
Restore wetland to predevelopment function to improve habitat and increase filtration of runoff
Conserve and protect critical habitat
Connectivity, aerial extent, patch size, population health
Potential impacts could include loss of habitat, changes in diversity, etc.
Maintain or improve critical habitat through conservation easements and other land protection measures
Handbook for Developing Watershed Plans to Restore and Protect Our Waters
9-4
9.3 SelectEnvironmentalIndicatorsandTargetstoEvaluateManagementObjectives
Onceyouhaveestablishedspecificmanagementobjectives,you’lldevelopenvironmentalindicatorsandnumerictargetstoquantitativelyevaluatewhetheryouaremeetingyourob-jectives.Youidentifiedindicatorswiththestakeholderswhenyoudevelopedyourconcep-tualmodel( chapter4),andtheindicatorsshouldberefinedinthisstep.Theindicators
aremeasurableparametersthatwillbeusedtolinkpollutantsourcestoenvironmentalconditions.Thespecificindicatorswillvarydependingonthedesignateduseofthewaterbody(e.g.,warm-waterfishery,cold-waterfishery,recreation)andthewaterqualityimpairmentorproblemofcon-cern.Forexample,multiplefactorsmightcausedegradationofawarm-wa-terfishery.Somepotentialcausesincludechangesinhydrology,elevatednutrientconcentrations,elevatedsediment,andhighersummertempera-tures.Eachofthesestressorscanbemeasuredusingindicatorslikepeakflow,flowvolume,nutrientconcentrationorload,sedimentconcentrationorload,andtemperature.
Aspecificvaluecanbesetasatargetforeachindicatortorepresentthedesiredconditionsthatwillmeetthewatershedgoalsandmanagementobjectives.Targetscanbebasedonwaterqualitycriteriaor,wherenumericwaterqualitycriteriadonotexist,ondataanalysis,referenceconditions,literaturevalues,orexpertexaminationofwaterqualityconditionstoidentifyvaluesrepresen-tativeofconditionsthatsupportdesignateduses.IfaTotalMaximumDailyLoad(TMDL)alreadyexistsforpollutantsofconcerninyourwatershed,youshouldreviewtheTMDLtoidentifyappropriatenumerictargets.TMDLsaredevelopedtomeetwaterqualitystandards,andwhennumericcriteriaarenotavailable,narrativecriteria(e.g.,prohibitingexcessnutrients)mustbeusedtodevelopnumerictargets.
Itmightbenecessarytoidentifyseveralrelatedindicatorsandtargetvaluestofacilitateevalu-ationofpollutantloadsandmeasureprogress.Forexample,dissolvedoxygenisanindicatorofthesuitabilityofawaterbodytosupportfisheries.However,dissolvedoxygenisnotaspecific
pollutantandisnottypicallyestimatedasaload.Becausedissolvedoxygenisawaterbodymeasurethatisaffectedbyseveralparameters,includingnutrients,it’sappropriatetoselectotherindicatorsthatcanbelinkedtodissolvedoxygenandquantifiedasloads(e.g.,phosphorusloading).
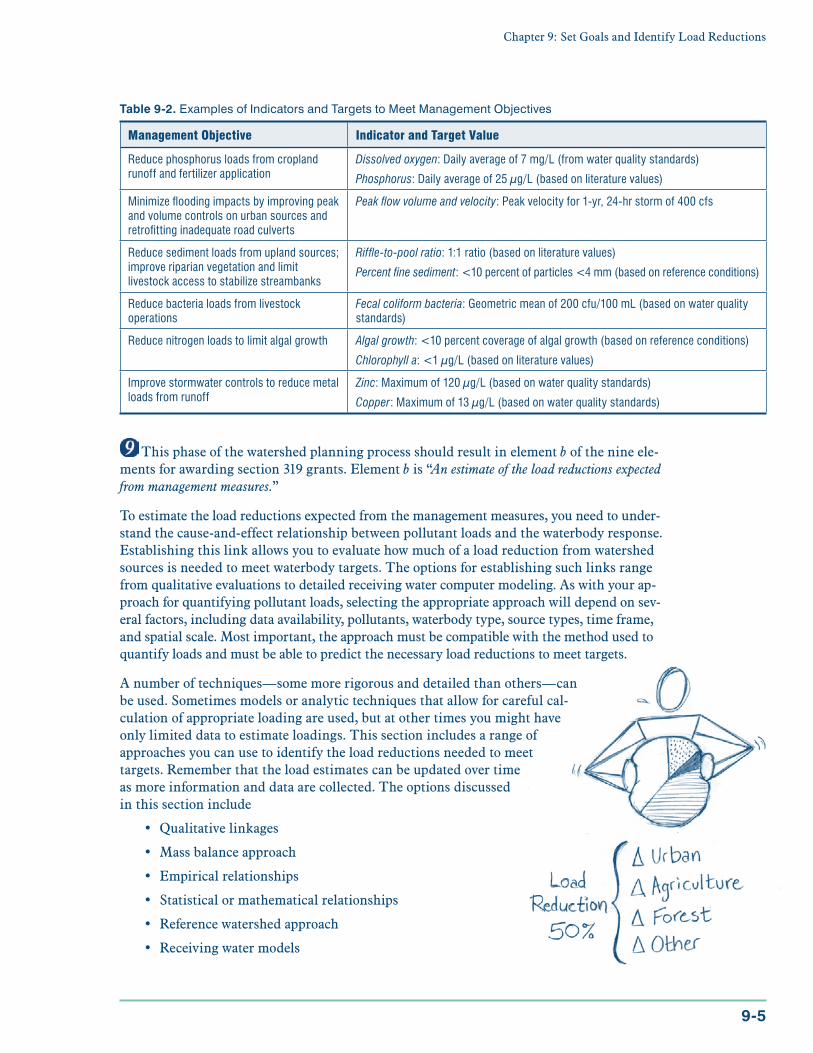
Table9-2providessomeexamplesofindicatorsandtargetvaluesassociatedwithmanagementobjectives.
9.4 DetermineLoadReductionstoMeetEnvironmentalTargets
Atthispointinthewatershedplanningprocess,youhavealreadyquantifiedthepollutantloadsfromsourcesinyourwatershed( chapter8)andidentifiedappropriateenviron-mentalindicatorsandassociatedtargetstomeetyourwater-shedgoals.Thenextstepistodeterminetheloadreductionsneededtomeetyourtargets—howtocontrolwatershedsourcestomeetyourgoals.
Don’tForgetAboutProgrammaticandSocialIndicators
Chapters 4 and 12 discuss the development of a variety of indicators to measure progress in implementing your watershed plan and meeting your goals. Indicators can be environmental, social, or programmatic. This chapter discusses only environmental indicators and how they are used to represent watershed goals and evaluate pollutant load reductions. Social and programmatic indicators are identified as part of the implementation program, discussed in chapter 12.
NotAllIndicatorsWillHaveAssociatedLoadReductions
It will be difficult or impossible to develop quantifiable indicators for all watershed issues of concern. For example, some goals and associated indicators (e.g., “make the lake more appealing for swimming,” or “reduce the prevalence of exotic species”) are indirectly related to other indicators that are more easily linked to source loads (e.g., dissolved oxygen, nutrient loads), and trying to link them to one or even a few specific pollutants and source loads is often too difficult or inappropriate. Therefore, these indicators are expected to improve based on identified load reductions for other indicators. They will be directly measured to track overall watershed goals, but they will not have an associated load reduction target.
Chapter9:SetGoalsandIdentifyLoadReductions
9-5
Thisphaseofthewatershedplanningprocessshouldresultinelementbofthenineele-mentsforawardingsection319grants.Elementbis“An estimate of the load reductions expected from management measures.”
Toestimatetheloadreductionsexpectedfromthemanagementmeasures,youneedtounder-standthecause-and-effectrelationshipbetweenpollutantloadsandthewaterbodyresponse.Establishingthislinkallowsyoutoevaluatehowmuchofaloadreductionfromwatershedsourcesisneededtomeetwaterbodytargets.Theoptionsforestablishingsuchlinksrangefromqualitativeevaluationstodetailedreceivingwatercomputermodeling.Aswithyourap-proachforquantifyingpollutantloads,selectingtheappropriateapproachwilldependonsev-eralfactors,includingdataavailability,pollutants,waterbodytype,sourcetypes,timeframe,andspatialscale.Mostimportant,theapproachmustbecompatiblewiththemethodusedtoquantifyloadsandmustbeabletopredictthenecessaryloadreductionstomeettargets.
Anumberoftechniques—somemorerigorousanddetailedthanothers—canbeused.Sometimesmodelsoranalytictechniquesthatallowforcarefulcal-culationofappropriateloadingareused,butatothertimesyoumighthaveonlylimiteddatatoestimateloadings.Thissectionincludesarangeofapproachesyoucanusetoidentifytheloadreductionsneededtomeettargets.Rememberthattheloadestimatescanbeupdatedovertimeasmoreinformationanddataarecollected.Theoptionsdiscussedinthissectioninclude
• Qualitativelinkages
• Massbalanceapproach
• Empiricalrelationships
• Statisticalormathematicalrelationships
• Referencewatershedapproach
• Receivingwatermodels
Table 9-2. ExamplesofIndicatorsandTargetstoMeetManagementObjectives
ManagementObjective IndicatorandTargetValue
Reduce phosphorus loads from cropland runoff and fertilizer application
Dissolved oxygen: Daily average of 7 mg/L (from water quality standards)
Phosphorus: Daily average of 25 µg/L (based on literature values)
Minimize flooding impacts by improving peak and volume controls on urban sources and retrofitting inadequate road culverts
Peak flow volume and velocity: Peak velocity for 1-yr, 24-hr storm of 400 cfs
Reduce sediment loads from upland sources; improve riparian vegetation and limit livestock access to stabilize streambanks
Riffle-to-pool ratio: 1:1 ratio (based on literature values)
Percent fine sediment: <10 percent of particles <4 mm (based on reference conditions)
Reduce bacteria loads from livestock operations
Fecal coliform bacteria: Geometric mean of 200 cfu/100 mL (based on water quality standards)
Reduce nitrogen loads to limit algal growth Algal growth: <10 percent coverage of algal growth (based on reference conditions)
Chlorophyll a: <1 µg/L (based on literature values)
Improve stormwater controls to reduce metal loads from runoff
Zinc: Maximum of 120 µg/L (based on water quality standards)
Copper: Maximum of 13 µg/L (based on water quality standards)
Handbook for Developing Watershed Plans to Restore and Protect Our Waters
9-6
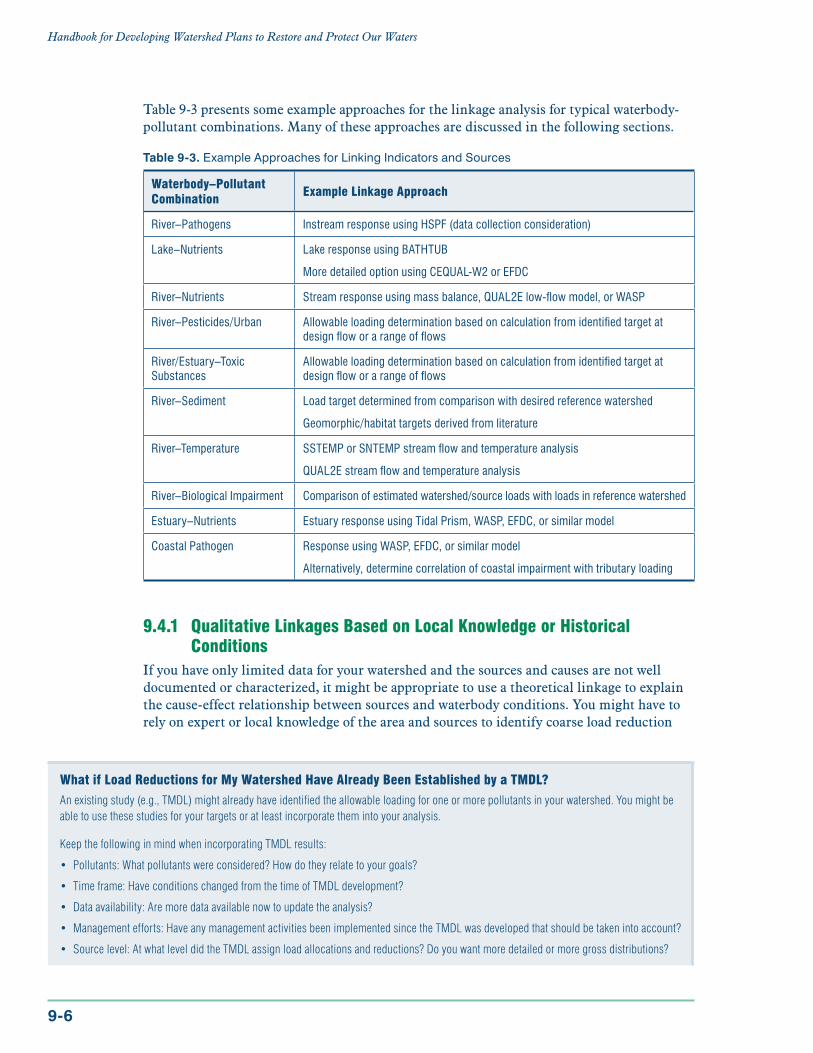
Table9-3presentssomeexampleapproachesforthelinkageanalysisfortypicalwaterbody-pollutantcombinations.Manyoftheseapproachesarediscussedinthefollowingsections.
Table 9-3. ExampleApproachesforLinkingIndicatorsandSources
Waterbody–PollutantCombination
ExampleLinkageApproach
River–Pathogens Instream response using HSPF (data collection consideration)
Lake–Nutrients Lake response using BATHTUB
More detailed option using CEQUAL-W2 or EFDC
River–Nutrients Stream response using mass balance, QUAL2E low-flow model, or WASP
River–Pesticides/Urban Allowable loading determination based on calculation from identified target at design flow or a range of flows
River/Estuary–Toxic Substances
Allowable loading determination based on calculation from identified target at design flow or a range of flows
River–Sediment Load target determined from comparison with desired reference watershed
Geomorphic/habitat targets derived from literature
River–Temperature SSTEMP or SNTEMP stream flow and temperature analysis
QUAL2E stream flow and temperature analysis
River–Biological Impairment Comparison of estimated watershed/source loads with loads in reference watershed
Estuary–Nutrients Estuary response using Tidal Prism, WASP, EFDC, or similar model
Coastal Pathogen Response using WASP, EFDC, or similar model
Alternatively, determine correlation of coastal impairment with tributary loading
9.4.1 QualitativeLinkagesBasedonLocalKnowledgeorHistoricalConditions
Ifyouhaveonlylimiteddataforyourwatershedandthesourcesandcausesarenotwelldocumentedorcharacterized,itmightbeappropriatetouseatheoreticallinkagetoexplainthecause-effectrelationshipbetweensourcesandwaterbodyconditions.Youmighthavetorelyonexpertorlocalknowledgeoftheareaandsourcestoidentifycoarseloadreduction
WhatifLoadReductionsforMyWatershedHaveAlreadyBeenEstablishedbyaTMDL?
An existing study (e.g., TMDL) might already have identified the allowable loading for one or more pollutants in your watershed. You might be able to use these studies for your targets or at least incorporate them into your analysis.
Keep the following in mind when incorporating TMDL results:
• Pollutants: What pollutants were considered? How do they relate to your goals?
• Time frame: Have conditions changed from the time of TMDL development?
• Data availability: Are more data available now to update the analysis?
• Management efforts: Have any management activities been implemented since the TMDL was developed that should be taken into account?
• Source level: At what level did the TMDL assign load allocations and reductions? Do you want more detailed or more gross distributions?
Chapter9:SetGoalsandIdentifyLoadReductions
9-7
targets.Ifyoudothis,remembertoincorporateascheduleforupdatingyourwatershedplanandloadreductionsasmoreinformationanddataarecollected.
Anexampleofaqualitativelinkageisanassumedlinkagebetweeninstreamsedimentdepositionandwatershedsedimentloading.Theexpectedproblemisfinesedimentfillinginpoolsusedbyfishandcementingthestreambed,prohibitingthefishfromlayingeggs.Al-thoughitisknownthatsedimentloadingincreasesthedepositionoffinesediment,youhavenodocumentedorquantifiedlinkbetweenthetwo.Youcanestimateaconservativeloadreduction,accompaniedbyplansforadditionalmonitoringtoevaluateinstreamconditions.
Anotherexampleofaqualitativelinkageistheassumptionthatloadingisdirectlypropor-tionaltotheinstreamresponse.Thatis,apercentincreaseinloadingwillresultinanequalpercentincreaseininstreamconcentrations.Assumingthis,youcanuseobserveddatatocalculatetheneededreductioninwaterbodyconcentrationtomeetyourtargetandassumethatitisequaltothenecessarypercentreductioninloading.Althougha1-to-1relationshipbetweenloadingandconcentrationlikelydoesnotexist,youmightnothavethedataneededtosupportidentificationofamoreaccuratelinkage.
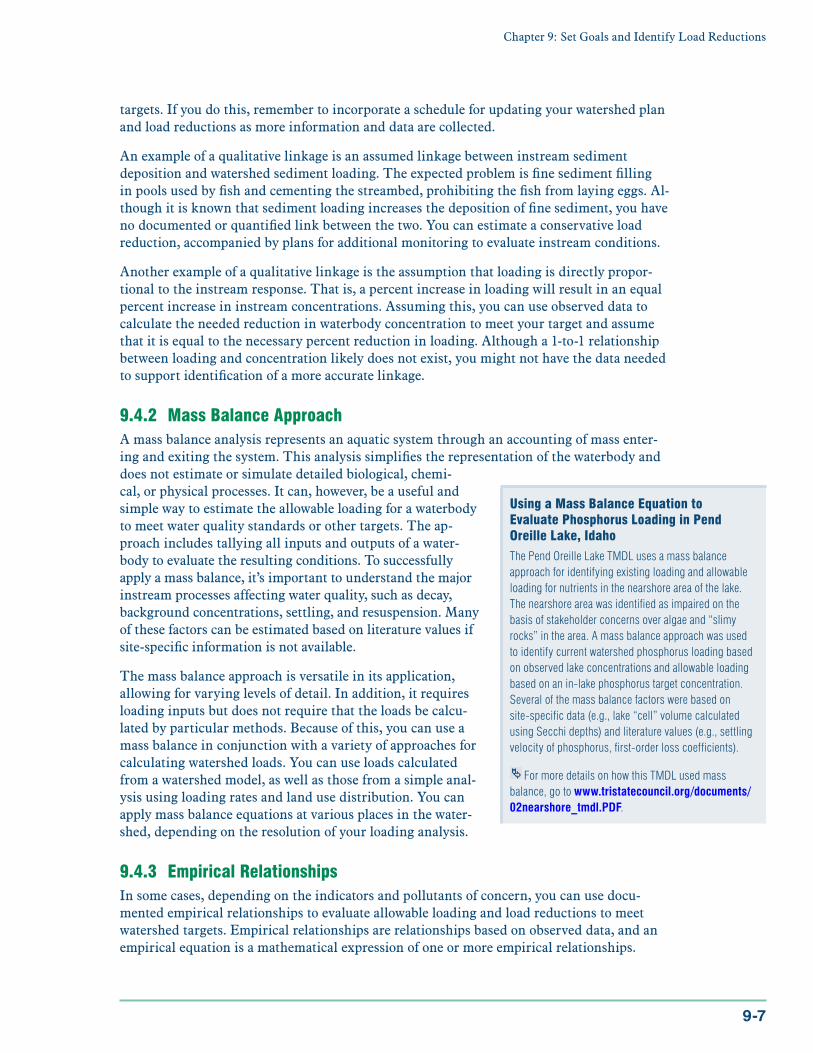
9.4.2 MassBalanceApproachAmassbalanceanalysisrepresentsanaquaticsystemthroughanaccountingofmassenter-ingandexitingthesystem.Thisanalysissimplifiestherepresentationofthewaterbodyanddoesnotestimateorsimulatedetailedbiological,chemi-cal,orphysicalprocesses.Itcan,however,beausefulandsimplewaytoestimatetheallowableloadingforawaterbodytomeetwaterqualitystandardsorothertargets.Theap-proachincludestallyingallinputsandoutputsofawater-bodytoevaluatetheresultingconditions.Tosuccessfullyapplyamassbalance,it’simportanttounderstandthemajorinstreamprocessesaffectingwaterquality,suchasdecay,backgroundconcentrations,settling,andresuspension.Manyofthesefactorscanbeestimatedbasedonliteraturevaluesifsite-specificinformationisnotavailable.
Themassbalanceapproachisversatileinitsapplication,allowingforvaryinglevelsofdetail.Inaddition,itrequiresloadinginputsbutdoesnotrequirethattheloadsbecalcu-latedbyparticularmethods.Becauseofthis,youcanuseamassbalanceinconjunctionwithavarietyofapproachesforcalculatingwatershedloads.Youcanuseloadscalculatedfromawatershedmodel,aswellasthosefromasimpleanal-ysisusingloadingratesandlandusedistribution.Youcanapplymassbalanceequationsatvariousplacesinthewater-shed,dependingontheresolutionofyourloadinganalysis.
9.4.3 EmpiricalRelationshipsInsomecases,dependingontheindicatorsandpollutantsofconcern,youcanusedocu-mentedempiricalrelationshipstoevaluateallowableloadingandloadreductionstomeetwatershedtargets.Empiricalrelationshipsarerelationshipsbasedonobserveddata,andanempiricalequationisamathematicalexpressionofoneormoreempiricalrelationships.
UsingaMassBalanceEquationtoEvaluatePhosphorusLoadinginPendOreilleLake,Idaho
The Pend Oreille Lake TMDL uses a mass balance approach for identifying existing loading and allowable loading for nutrients in the nearshore area of the lake. The nearshore area was identified as impaired on the basis of stakeholder concerns over algae and “slimy rocks” in the area. A mass balance approach was used to identify current watershed phosphorus loading based on observed lake concentrations and allowable loading based on an in-lake phosphorus target concentration. Several of the mass balance factors were based on site-specific data (e.g., lake “cell” volume calculated using Secchi depths) and literature values (e.g., settling velocity of phosphorus, first-order loss coefficients).
For more details on how this TMDL used mass balance, go to www.tristatecouncil.org/documents/02nearshore_tmdl.PDF.
Handbook for Developing Watershed Plans to Restore and Protect Our Waters
9-8
OneexampleofanempiricalrelationshipthatcanbeusedinevaluatingallowableloadingistheVollenweiderempiricalrelationshipbetweenphosphorusloadingandtrophicstatus.TheVollenweiderrelationshippredictsthedegreeofalake’strophicstatusasafunctionofthearealphosphorusloadingandisbasedonthelake’smeandepthandhydraulicresidencetime.Forexample,theLakeLinganore,Maryland,TMDLfornutrientsusedtheVollenwei-derrelationshiptoidentifytheallowableloadingandnecessaryloadingreductionstoreturnthelaketomesotrophicconditions,representedbyCarlson’sTrophicStatusIndex(TSIof53andchlorophyllaof10µg/L).Theexistingnutrientloadingtothelakewascalculatedusing
landuseareasandphosphorusloadingratesobtainedfromtheChesapeakeBayProgram.TheVollenweiderrelationshipwasthenusedtoidentifytheallowableannualphospho-rusloadingratetomeetthetrophicstatustargets.Theexistingloadingandallowableloadingwerecomparedtoidentifytheneces-saryloadreductions.
AnotherexampleofanempiricalrelationshipistheSimpleMethod(Schueler1987), dis-cussedinsection8.2.2.TheSimpleMethodcalculatespollutantloadingusingdrainagearea,pollutantconcentrations,arunoffcoefficient,andprecipitationdata.Ifyourwatershedtargetisapollutantconcentration,youcanapplytheSimpleMethodusingyourconcentrationtargettoestimatetheallowableloadingtomeetthattarget.
Usecarewhenapplyingempiricalrelationshipsbecausealthoughtheyarebasedonobserveddata,theymightnotberepresentativeofyourwatershedorbeapplicabletoyourpurposes.Whenusingempiricalrelationships,it’simportanttoreviewthedocumentationandlitera-turetounderstandonwhatdatatherelationshipisbasedandanyrelatedassumptionsorcaveatsforapplyingtherelationshiporequation.
9.4.4 StatisticalorMathematicalRelationshipsYoucanusestatisticalormathematicalanalysestoestimateallowableloadingsandsubse-quentloadreductionsbasedonavailabledataforyourwatershed.Thisapproachassumessomerelationshipbetweenkeyfactorsinthewatershed(e.g.,loading,percentlanduse)andinstreamconditions(e.g.,concentration)basedonobserveddata.Aloaddurationcurve, discussedindetailinsection7.2.4,isoneofthemostcommonofthesetypesoflink-
ages.Thisapproachcanbeappliedtodiagnoseandevaluatewaters(e.g.,dominanttypesofsources,criticalconditions)andcanhelptodeterminespecificloadreductions.Alimita-tionofthisapproachisthatitdoesnotexplicitlydescribewheretheloadsarecomingfromorhowtheyaredelivered.Thetechniqueiswellsuitedtoareaswhererobustmonitoringrecordsareavailablebutdataaretoolimitedtousemoredetailedwatershedloadingmodels.Theanalysisdoesnotidentifyloadreductionsbysourcetype,butitcanbeappliedatanylocationinthewatershedwithsufficientdata.
9.4.5 ReferenceWatershedApproachIfyoudon’thaveanappropriatewaterqualityorloadingtarget,anothertechniqueforlinkingyourindicatorstosourceloadsistocompareyourwatershedwithanotheronethatiscon-sidered“healthy.”Thereferencewatershedapproachisbasedonusinganunimpairedwater-shedthatsharessimilarecoregionandgeomorphologicalcharacteristicswiththeimpairedwatershedtoidentifyloadingratetargets.Streamconditionsinthereferencewatershedare
Tip Check the assumptions used in developing empirical equations. They usually predict an “average” condition or are based on
conditions specific to certain regions. Is your waterbody unusual (e.g., narrow and deep)? Sometimes the unique features of your waterbody or watershed make a difference and require more sensitive analyses or models.

Chapter9:SetGoalsandIdentifyLoadReductions
9-9
assumedtoberepresentativeoftheconditionsneededfortheimpairedstreamtosupportitsdesignatedusesandmeetthewatershedgoals.
Youshouldselectareferencewatershedonthebasisofconditionsthatarecomparablewiththewatershedrequiringmanagement.Thereferencewatershedshouldbesimilartoyourwatershedinsize,landusedistribution,soils,topography,andgeology.Tosettheloadingratetarget,predicttheloadingforeachwatershedthroughmodelingoranothermethodandthendeterminetheallowableloadingratebasedonthereferencewatershedloadsandareas.Theloadingratefromthereferencewatershedcanbecalculatedatalevelcomparabletothesourcesyouidentifiedinyourwatershed.Forexample,youcanmodelspecificlandusesorcroptypesinthereferencewatershedtoidentifyloadingratesoridentifyagrossratebasedontheloadingfromtheentirewatershed.Thereferenceloadingratesarethenmultipliedbytheappropriateareasofthewatershedtoidentifyallowableloadsfortheimpairedwatershed.Theloadreductionrequirementisthedifferencebetweenthisallowableloadingandtheexistingload( estimatedinchapter8).
Thisapproachisbestsuitedtowatersnotmeetingbiologicalornarrativecriteria(e.g.,cri-teriafornutrientsandsediment),whereinstreamtargetsaredifficulttoidentify.Selectingareferencewatershedcanbeextremelydifficult,andnotallareashaveappropriatewatersheddataorsufficientmonitoringdatatosupportselection.
9.4.6 ReceivingWaterModelsSometimesitwillbeappropriateorevennecessarytousedetailedreceivingwatermodelingtorelatewatershedsourceloadstoyourwatershedindicators.Thefollowingaretypicalsitua-tionsinwhichyoushoulduseamodelinsteadofasimplerapproach:
• Locallysignificantfeaturesorconditions(e.g.,groundwaterinteraction)affectthewaterbody’sresponse.
• Chemicalandbiologicalfeaturesarecomplicatedandaffectthewaterbody’sresponsetopollutantloads(e.g.,nutrientloadsaffectingalgalgrowthandsubsequentdissolvedoxygen).
• Uniquephysicalcharacteristicsofthewaterbodymustbeconsidered(e.g.,longandnarrowlake).
• Therearelocalizedimpairmentsandimpactsduetothelocationofsources(e.g.,dis-chargefromafeedlotaffectsasmallsegmentofstream).
• Cumulativeimpactsoccurfrompollutants(e.g.,metals)thatcanaccumulateinsedi-mentandorganisms.
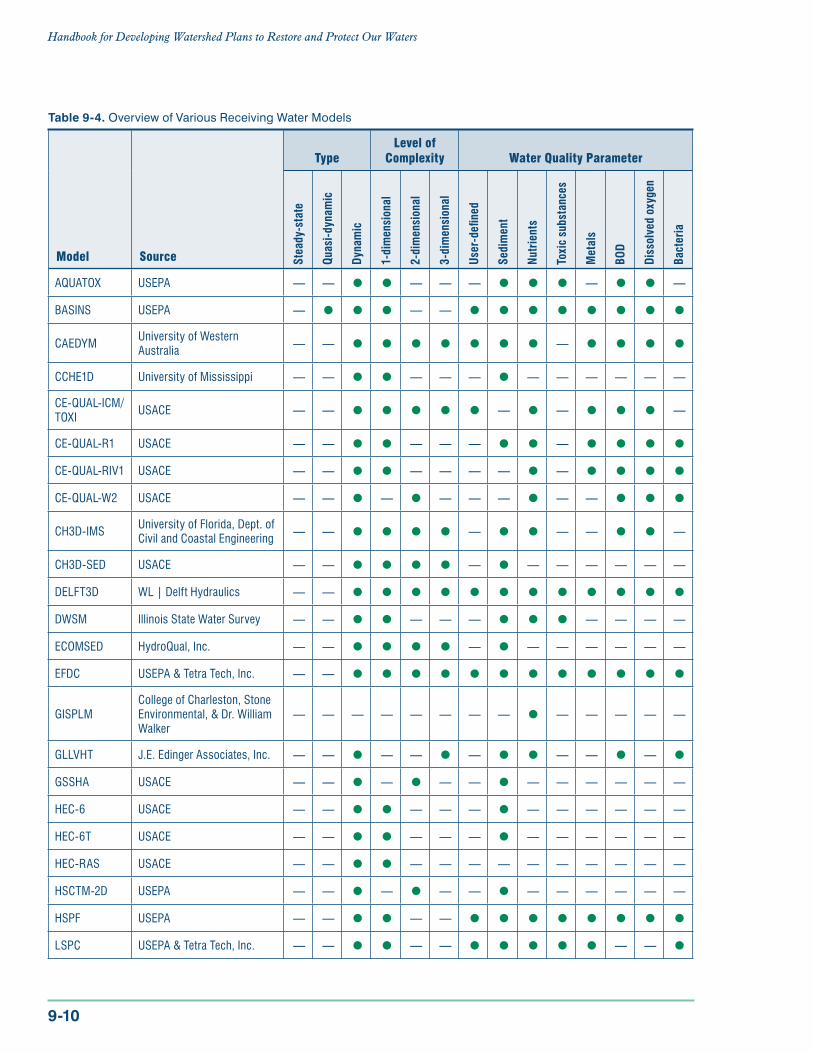
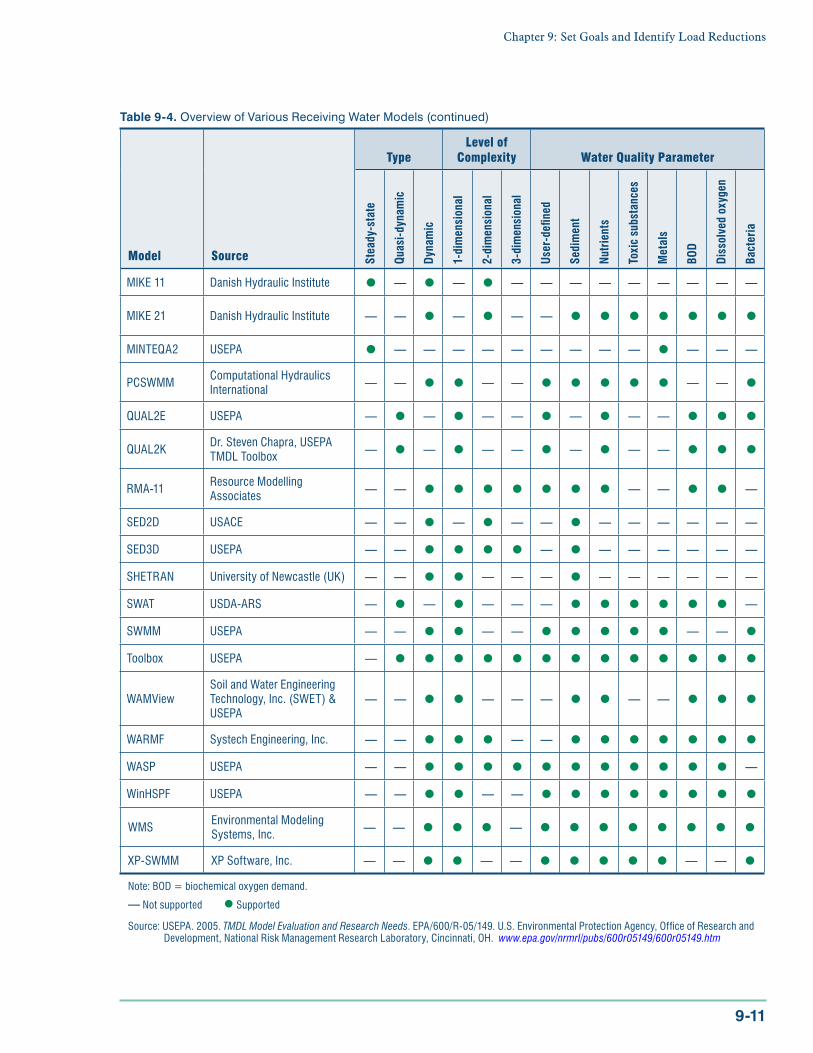
Table9-4providesasummaryofmanyofthereceivingwatermodelsavailabletosupportlinkageofsourcesandindicatorsforwatershedplanning. Formoredetailsonthemodels,gotoEPA’sCouncilforRegulatoryEnvironmentalModeling(CREM)Websiteathttp://cfpub.epa.gov/crem/.
Handbook for Developing Watershed Plans to Restore and Protect Our Waters
9-10
Table 9-4. OverviewofVariousReceivingWaterModels
Model Source
TypeLevelof
Complexity WaterQualityParameter
Stea
dy-s
tate
Quas
i-dy
nam
ic
Dyn
amic
1-di
men
sion
al
2-di
men
sion
al
3-di
men
sion
al
Use
r-de
fined
Sedi
men
t
Nut
rien
ts
Toxi
c su
bsta
nces
Met
als
BOD
Diss
olve
d ox
ygen
Bact
eria
AQUATOX USEPA — — — — — — —
BASINS USEPA — — —
CAEDYMUniversity of Western Australia — — —
CCHE1D University of Mississippi — — — — — — — — — — —
CE-QUAL-ICM/TOXI
USACE — — — — —
CE-QUAL-R1 USACE — — — — — —
CE-QUAL-RIV1 USACE — — — — — — —
CE-QUAL-W2 USACE — — — — — — — —
CH3D-IMSUniversity of Florida, Dept. of Civil and Coastal Engineering — — — — — —
CH3D-SED USACE — — — — — — — — —
DELFT3D WL | Delft Hydraulics — —
DWSM Illinois State Water Survey — — — — — — — — —
ECOMSED HydroQual, Inc. — — — — — — — — —
EFDC USEPA & Tetra Tech, Inc. — —
GISPLMCollege of Charleston, Stone Environmental, & Dr. William Walker
— — — — — — — — — — — — —
GLLVHT J.E. Edinger Associates, Inc. — — — — — — — —
GSSHA USACE — — — — — — — — — — —
HEC-6 USACE — — — — — — — — — — —
HEC-6T USACE — — — — — — — — — — —
HEC-RAS USACE — — — — — — — — — — — —
HSCTM-2D USEPA — — — — — — — — — — —
HSPF USEPA — — — —
LSPC USEPA & Tetra Tech, Inc. — — — — — —
Chapter9:SetGoalsandIdentifyLoadReductions
9-11
Table 9-4. OverviewofVariousReceivingWaterModels(continued)
Model Source
TypeLevelof
Complexity WaterQualityParameter
Stea
dy-s
tate
Quas
i-dy
nam
ic
Dyn
amic
1-di
men
sion
al
2-di
men
sion
al
3-di
men
sion
al
Use
r-de
fined
Sedi
men
t
Nut
rien
ts
Toxi
c su
bsta
nces
Met
als
BOD
Diss
olve
d ox
ygen
Bact
eria
MIKE 11 Danish Hydraulic Institute — — — — — — — — — — —
MIKE 21 Danish Hydraulic Institute — — — — —
MINTEQA2 USEPA — — — — — — — — — — — —
PCSWMMComputational Hydraulics International — — — — — —
QUAL2E USEPA — — — — — — —
QUAL2KDr. Steven Chapra, USEPA TMDL Toolbox — — — — — — —
RMA-11Resource Modelling Associates — — — — —
SED2D USACE — — — — — — — — — — —
SED3D USEPA — — — — — — — — —
SHETRAN University of Newcastle (UK) — — — — — — — — — — —
SWAT USDA-ARS — — — — — —
SWMM USEPA — — — — — —
Toolbox USEPA —
WAMViewSoil and Water Engineering Technology, Inc. (SWET) & USEPA
— — — — — — —
WARMF Systech Engineering, Inc. — — — —
WASP USEPA — — —
WinHSPF USEPA — — — —
WMSEnvironmental Modeling Systems, Inc. — — —
XP-SWMM XP Software, Inc. — — — — — —
Note: BOD = biochemical oxygen demand.
— Not supported Supported
Source: USEPA. 2005. TMDL Model Evaluation and Research Needs. EPA/600/R-05/149. U.S. Environmental Protection Agency, Office of Research and Development, National Risk Management Research Laboratory, Cincinnati, OH. www.epa.gov/nrmrl/pubs/600r05149/600r05149.htm

Handbook for Developing Watershed Plans to Restore and Protect Our Waters
9-12
9.5 FocustheLoadReductionsRegardlessofwhatapproachyouusetoestimateyourallowableloadingsornecessaryreduc-tions,it’slikelythatseveralscenariosorcombinationsofsourcereductionswillmeetyourtargets.Dependingonthemagnitudeofyourloadreductions,youmightbeabletodistributethemamongyoursourcesoryoumighthavetofocusononedominantsourcetomeetyourtargets.Table9-5illustrateshowdifferenttargetreductionscanmeetthesameoverallgoal.Inaddition,thelocationoftheproposedreductionscanaffectthedistributionandmag-nitudeofloadreductions.Ifyoucalculatetheloadreductiononlyatthemouthofthewa-tershed,alargenumberofscenarioswillmeettheloadreductiontarget—atleastonpaper.Sometimesimpactsfromloadreductionsarenotadequatetomeettargetsatdownstreamlocations.Althoughtheupstreamreductionswillnodoubtimprovedownstreamconditions,theymightbesuchasmallportionoftheoverallloadthattheywon’thaveameasurableeffectontheoverallwatershedloading.Inaddition,theloadreductionscalculatedatthebottomofthewatershedmightnotcapturethemoresignificantreductionsneededinsmallerupstreamsubwatersheds.Besuretoestimateyourloadreductionsatafewkeylocationsinthewatershedtocapturethemajorproblemareasandsourcesandtosupportefficientandtargetedmanagement.
Table 9-5. ExamplesofDifferentScenariostoMeettheSameLoadTarget
Source
ExistingPhosphorus
Loading(kg/yr)
Scenario1 Scenario2
%LoadReduction
AllowableLoad(kg/yr)
%LoadReduction
AllowableLoad(kg/yr)
Roads 78 26 58 20 62
Pasture/Hay 21 26 16 10 19
Cropland 218 26 162 55 98
Forest 97 26 72 0 97
Landfill 7 26 5 0 7
Residential 6 26 5 0 6
Groundwater 111 26 83 0 111
Total 539 26 400 26 400
Note: Scenario 1 represents an equitable distribution of load reduction among sources. Reductions are applied so that the resulting loads are the same percentage of the total as under existing conditions. Scenario 2 represents a more feasible scenario, in which controllable sources (e.g., roads, cropland, pasture) are targeted to meet the load reduction target.
Ifyouusedareceivingmodeltoevaluateyourloadreductions,youshouldusea“top-down”approachtoevaluatingnecessaryloadreductions.Beginbyidentifyingnecessaryloadre-ductionstomeetwaterbodytargetsinupstreamportionsofthewatershed.Themodelthenallowsyoutothenevaluatetheeffectoftheupstreamloadreductionsondownstreamcondi-tions.Startingatthetopofthewatershedandmovingdown,youcanevaluatethecumulativeeffectsfromupstreamcontrols.Inmanycases,theupstreamreductionswillsignificantlydecreaseoreveneliminatethenecessaryreductionsforthelowerwatershed.
Bythispoint,youshouldhaveidentifiedtheoverallloadreductionsneededtomeetyourtargetsanddeterminedgenerallyhowyouwanttofocusreductionsamongsources.

Chapter9:SetGoalsandIdentifyLoadReductions
9-13
Theactivitiesdiscussedinchapters10and11willhelpyoutomorespecificallyidentifyandselectthereductionsforeachsource.
9.6 SummarizeWatershedTargetsandNecessaryLoadReductions
Nowthatyouhaveidentifiedthepollutantloadreductionsneededtomeetyourwa-tershedgoals,youshouldhavetheinformationneededtosatisfyelementbofthenineminimumelements.Atthispointyoushouldprepareasummarytobeincludedinyourwatershedplandocumentingthesourceloads,numerictargetstomeetthewatershedgoalsandmanagementobjectives,andloadreductionsneededtomeetthetargets.Thereductionsshouldbecalculatedandpresentedatthesametimeandspatialscalesasthesourceloadesti-mations( discussedinchapter8).Aswiththesourceloads,thereareavarietyofwaysyoucanpresenttheloadreductionrequirements,includingbargraphsandwatershedmaps.
Youshouldalsoincludeinthesummaryotherwatershedtargets—theindicatorsandnu-merictargetsthatcouldnotbelinkedtospecificpollutantloads(e.g.,cobbleembeddedness,percentfinesediment).Eventhoughtheresponseofthesetargetscouldnotbepredictedandlinkedtosourceloads,they’reimportantformeasuringthesuccessofyourwatershedplanandtheattainmentofyourwatershedgoals.Thesetargetswillbeintegratedintotheimple-mentationandmonitoringplan( discussedinchapter12).
State-SupportedModelingTools
Some states are supporting modeling tools for conducting current load analyses and BMP load reduction projections. For example, Pennsylvania has merged the ArcView GWLF model with companion software developed for evaluating the implementation of both agricultural and non-agricultural pollution reduction strategies at the watershed level. This new tool, called PredICT (Pollution Reduction Impact Comparison Tool), allows the user to create various scenarios in which current landscape conditions and pollutant loads (both point and nonpoint) can be compared against future conditions that reflect the use of different pollution reduction strategies. This tool includes pollutant reduction coefficients for nitrogen, phosphorus and sediment, and it also has built-in cost information for an assortment of pollution mitigation techniques. For more information, visit http://www.predict.psu.edu/.