Varithena® improves vein appearance and 5 key varicose vein ...
1
Hand Vein Biometry Based on Geometry andAppearance Methods
Aycan Yuksel*, Lale Akarun* and Bulent Sankur**
Abstract
Many biometric systems, such as face, fingerprint and iris have been studied extensively for personal verificationand identification purposes. Biometric identification with vein patterns is a more recent approach that uses the vastnetwork of blood vessels underneath a person’s skin. These patterns in the hands are assumed to be unique toeach individual and they do not change over time except in size. As veins are under the skin and have a wealth ofdifferentiating features, an attempt to copy an identity is extremely difficult. These properties of uniqueness, stabilityand strong immunity to forgery of the vein patterns make it a potentially good biometric trait which offers greatersecurity and reliable features for personal identification. In this study, we present a novel hand vein database anda biometric technique based on the statistical processing of the hand vein patterns. The BOSPHORUS hand veindatabase has been collected under realistic conditions in that subjects had to undergo the procedures of holding abag, pressing an elastic ball and cooling with ice, all exercises that force changes in the vein patterns. The appliedrecognition techniques are a combination of geometric and appearance-based techniques and good identificationperformances have been obtained on the database.
Index Terms
Vein biometry, Hand vein database, Infrared imaging, BOSPHORUS hand vein database
I. INTRODUCTION
Developments in biometric technologies have achieved sufficiently high recognition rates under controlled con-ditions, but the need for reliability, robustness and convenience is still a major requirement that remains unfulfilled.Identification based on vein patterns emerges as a good candidate for a user friendly interface. Although thereare already some studies regarding the uniqueness of vein patterns, the adversarial effects of temperature changesand various physical activities have not been considered. An important roadblock to the advancement of hand veinbiometry is the lack of open hand vein databases, and hence, absence of reproducible results. Finally, there remainsseveral new feature alternatives and feature/classifier fusion schemes that have not yet been explored. In this work,we intend to address all these three issues.
Anatomically, the shape of vascular patterns in the dorsal region of the hand is claimed to be unique to anindividual even for identical twins [1], and it appears to remain stable over long periods of time. The structure ofthe vein patterns can be detected and captured with the help of infrared sensors. The visibility of the vein structuredepends on various factors such as age, thickness of the skin, ambient temperature, physical activity, depth of theveins under the skin, to name a few. In addition, surface features such as moles, warts, scars and hair can alsoaffect the imaging quality of the veins.
Identification using vein patterns is less studied compared to other human traits probably because the vein patternis not observable under visible light. The structure of the vein patterns can be detected and captured with the helpof infrared sensors. Typically, there are two kinds of imaging technologies, namely Far-infrared (FIR) and Near-infrared (NIR) imaging. FIR technology that works within the range 8-14 µm is more suitable for capturing thelarge veins in the back of the hand, but it is sensitive to ambient conditions and does not provide a stable imagequality. On the other hand, NIR imaging that works within the range 700-1000 nm produces good quality imageswhen capturing vein patterns in the back of the hand, palm, and wrist. This band is more tolerant to changes in
**B. Sankur is with the Department of Electric and Electronic Engineering, Bogazici University, Istanbul, Turkey e-mail: ([email protected])
*A. Yuksel and L. Akarun are with Department of Computer Engineering, Bogazici University, Istanbul, Turkey e-mails:(aycan.yuksel,[email protected])
1This work was funded by Bogazici University project 09HA202D and TUBITAK project 107E001

2
TABLE ICOMPARATIVE SURVEY OF METHODS
Reference Data Methods and ResultsVerification
C.-L. Lin etal. [13],
32 users, 30 samples/subjects, to-tal 960 images
Multi-resolution analysis. 5× enrollment. EER: 3.75
K. A. Toh etal. [5],
50 users, left and right hands, 10samples/subjects, total 1000 im-ages
Palm vein and palmprint scores are fused with SUM rule. SVMwith RBF kernel is optimized for the vein features consisting ofsub-sampled vein lines and for the directional wavelet energyfeatures for palmprint. 5× enrollment.
L. Wang etal. [3],
30 users, 9 samples/subjects, total270 images
Vein images are skeletonized as in [17] and LEM is used.Triple enrollment. EER is claimed to be 0.
A. Kumar etal. [27],
100 users, 6 samples/subjects, to-tal 600 images
EER is 1.14, EER of fusion is 0.38 for left hand and 0.28 forright hand.Identification
Y. Ding etal. [2],
48 users, 5 samples/subjects, total240 images
The number of the end points and crossing points and thedistances between them are used for feature extraction. Singleenrollment. Identification rate: 99.1%.
Z. Wang etal. [4]
100 users, 5 samples/subjects, to-tal 500 images
Single enrollment. Hausdorff, LEM and Gabor methods yield58%, 66% and 80%, respectively.
A. Kumar etal. [28],
100 users, 6 samples/subjects, to-tal 600 images
LRT, Hessian Phase, Ordinal Code and Laplacianpalm andtheir fusion is used. In single enrollment combined score is96.67% for fusion (left hands). 3× enrollment, 99.67%
This work 100 users, 3 samples/user, 4 con-ditions, total 1200 images
ICA, LEM and NMF methods as well as their fusion are con-sidered. Identification rates are 94.16% for single enrollmentand 97.33% for double enrollment.
environmental and body conditions, but it also faces the problem of disruption due to skin features such as hairsand line patterns [3].
L. Wang et al. [3] proposed a person verification system using the thermal-imaged vein pattern in the back ofthe hand based on the Line Segment Hausdorff Distance (LHD). They reported correct recognition of all subjectsin a database of 30 persons. A. Kumar et al. [27] present a new technique based on shape features of knucklesbased on minutiae matching of vein junction points. In a later paper, [28] Kumar and Prathyusha have usedthe fusion of Hessian phase and ordinal code, two different phase-based representations, namely, Laplacianpalm,which is an appearance based representation, and localized Radon transform, an orientation based representation. Z.Wang et al. [4] gave comparisons of shape and texture based methods for vein recognition. While shape similarityis measured via Hausdorff and Line Edge Map (LEM), texture similarity was measured via Euclidean distanceof Gabor magnitude features. In a dataset of 100 persons, Hausdorff, LEM and Gabor based methods achievedaccuracies of 58%, 66% and 80%, respectively. C.-L. Lin et al. [13] presented person verification results usinghand dorsal images acquired from IR images in the 3.4 - 5 µm band. Their approach is based on the combinationof multiresolution images obtained from the pre-processed thermal vein images. G. Wang et al. [14] proposeda multimodal person identification system where palmprint and palm vein modalities were combined in a singleimage. Locality Preserving Projection (LPP) was used to extract features of the fused images and they calledthis “Laplacianpalm”. A summary of literature is presented in Table I. In this table, the second column gives thedatabase information, such as the gallery size, the enrollment size, and the total number of images; specifically, 5×enrollment refers to 5 images per subjects in the enrollment set.
Reproducibility of results is an essential requirement for the advancement of a technology. Although there is anincreasing number of papers that report good recognition results, none of them allow open access to their database;hence their results are not reproducible. Thus in our study, we collected a hand vein database, called BOSPHORUS,which is open access to researchers (http://bosphorus.ee.boun.edu.tr/). The rest of the paper is organized as follows.Section II gives the details of the hand-vein database. In Section III we discuss feature alternatives for hand veinbiometry, and in Section IV we present classification and classifier fusion issues. Experimental results are presentedin Section V, and finally, conclusions are drawn in Section VI.

3
Fig. 1. Block diagram of the hand vein biometry system. (ICA: Independent Component Analysis, NMF: Non-negative Matrix Factorization,CSM: Cosine Similarity Measure, LEM: Line Edge Map, LHD: Line Segment Hausdorff Distance)
II. BOSPHORUS HAND VEIN DATABASE
The hand vein biometric identification system consists of four main processing stages: I) image acquisition,II) hand normalization, III) feature extraction, IV) matching and identity detection; as shown in Figure 1. In thissection, we give details about image acquisition, data collection, and hand normalization.
A. Image Acquisition and Camera Setup
NIR imaging technology and reflection method have been chosen for image acquisition. A monochrome NIRCCD camera (WAT-902H2 ULTIMATE [8]) fitted with an infrared lens is used to capture the vein patterns in theback of the hand. This camera has a good sensitivity in the near infrared spectrum (Figure 2(b)). The region ofinterest is irradiated by two IR light sources. Light sources are composed of six infrared LEDs which are placedin a circular combination. Diffusing papers are placed in front of the infrared light sources to scatter the lightuniformly. In order to eliminate the effects of visible light, the setup is installed in a dark room. In a real-lifeacquisition set-up, the access location will not be dark, but the device enclosure will control and limit substantiallythe amount of interfering visible light. The camera in the overhead position is adjusted approximately 80 cm abovethe hand stand. Users were asked to place their hands on a black background with the back of the hand facing thecamera. The images were digitized into 640× 480 pixels with a gray-scale resolution of 8-bit per pixel and afterdeinterlacing, the image size was reduced to 300 × 240 pixels. Our hand vein database contains 1200 images ofleft hands of 100 different people. Each subject underwent four imaging sessions that consisted of the left hand• Under normal condition (N: Normal),• After having carried a bag weighing 3 kg. for one minute (B: Bag),• After having squeezed an elastic ball repetitively (closing and opening) for one minute (Activity: A),• After having cooled the hand by holding an ice pack on the surface of the back of the hand (Ice: I).
These sessions intend to simulate physical stress conditions that could occur in real-life are denoted by the mnemonicsymbols N, B, A, I, corresponding to normal conditions, bag carrying exercise, ball pressing exercise and coolingwith ice. In each session we captured three images, which resulted in 3 × 4 = 12 images per subject of his lefthand under four different conditions. The subjects (100 people, 42 female and 58 male) were volunteers chosenfrom undergraduate students, staff and administrative members from a large age bracket. The histogram of the agedistribution of the subjects is given in Figure 3. In addition to the left hand images, we collected 300 right handimages from subjects under normal conditions. The right hand data is intended to test the degree of interchangeabilitybetween left and right hands, or to investigate the performance if both hands were presented. Finally, since anybiometric system should pass the test of time lapse, we collected additional data of left hands under normalconditions from 25 persons after some time ranging from two months to five months. For each individual, we alsorecorded demographic information. The database is presently open access at http://bosphorus.ee.boun.edu.tr/

4
(a) Camera Setup
(b) Camera Response
Fig. 2. (a) The hand vein image acquisition setup (b) Acquisition camera’s spectral response
15 20 25 30 35 40 45 50 55 60 650
5
10
15
20
25
30
35
Fig. 3. Age histogram of the database
TABLE IIDATABASE INFORMATION
Gender Female: 42 persons, Male: 58 personsLeft/Right Handed Left: 2 persons, Right: 98 personsAge Varying between 16-63
5
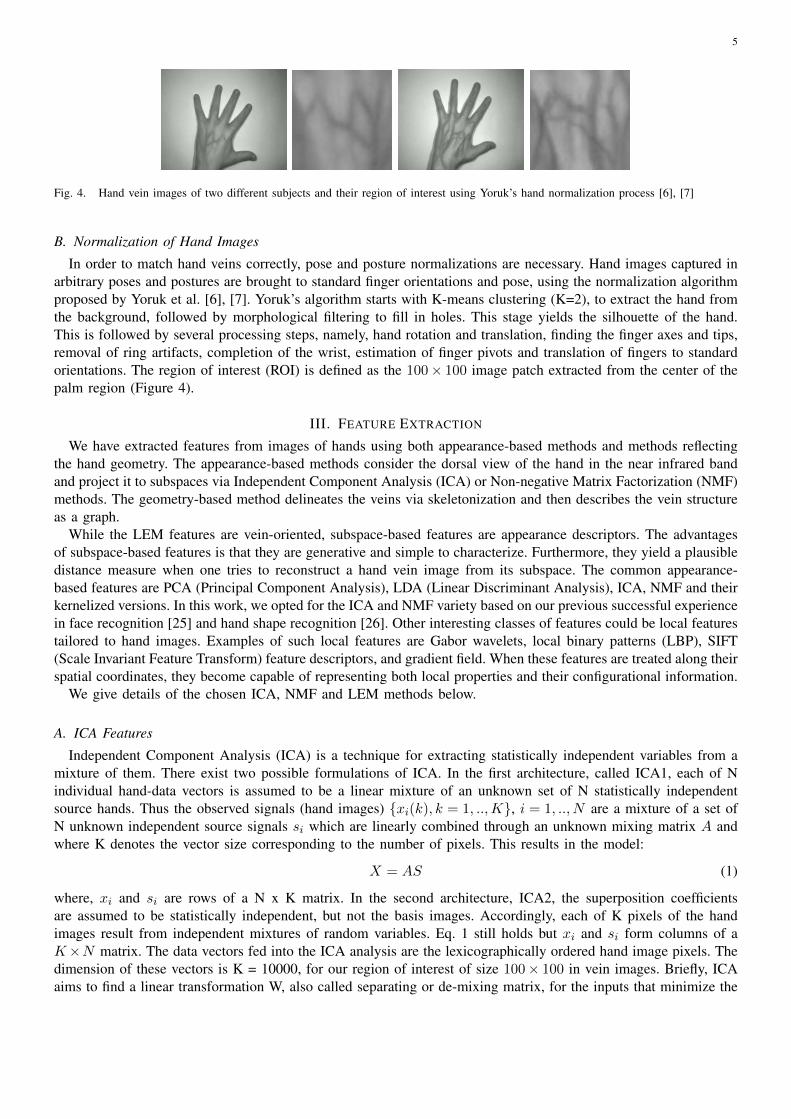
Fig. 4. Hand vein images of two different subjects and their region of interest using Yoruk’s hand normalization process [6], [7]
B. Normalization of Hand Images
In order to match hand veins correctly, pose and posture normalizations are necessary. Hand images captured inarbitrary poses and postures are brought to standard finger orientations and pose, using the normalization algorithmproposed by Yoruk et al. [6], [7]. Yoruk’s algorithm starts with K-means clustering (K=2), to extract the hand fromthe background, followed by morphological filtering to fill in holes. This stage yields the silhouette of the hand.This is followed by several processing steps, namely, hand rotation and translation, finding the finger axes and tips,removal of ring artifacts, completion of the wrist, estimation of finger pivots and translation of fingers to standardorientations. The region of interest (ROI) is defined as the 100× 100 image patch extracted from the center of thepalm region (Figure 4).
III. FEATURE EXTRACTION
We have extracted features from images of hands using both appearance-based methods and methods reflectingthe hand geometry. The appearance-based methods consider the dorsal view of the hand in the near infrared bandand project it to subspaces via Independent Component Analysis (ICA) or Non-negative Matrix Factorization (NMF)methods. The geometry-based method delineates the veins via skeletonization and then describes the vein structureas a graph.
While the LEM features are vein-oriented, subspace-based features are appearance descriptors. The advantagesof subspace-based features is that they are generative and simple to characterize. Furthermore, they yield a plausibledistance measure when one tries to reconstruct a hand vein image from its subspace. The common appearance-based features are PCA (Principal Component Analysis), LDA (Linear Discriminant Analysis), ICA, NMF and theirkernelized versions. In this work, we opted for the ICA and NMF variety based on our previous successful experiencein face recognition [25] and hand shape recognition [26]. Other interesting classes of features could be local featurestailored to hand images. Examples of such local features are Gabor wavelets, local binary patterns (LBP), SIFT(Scale Invariant Feature Transform) feature descriptors, and gradient field. When these features are treated along theirspatial coordinates, they become capable of representing both local properties and their configurational information.
We give details of the chosen ICA, NMF and LEM methods below.
A. ICA Features
Independent Component Analysis (ICA) is a technique for extracting statistically independent variables from amixture of them. There exist two possible formulations of ICA. In the first architecture, called ICA1, each of Nindividual hand-data vectors is assumed to be a linear mixture of an unknown set of N statistically independentsource hands. Thus the observed signals (hand images) {xi(k), k = 1, ..,K}, i = 1, .., N are a mixture of a set ofN unknown independent source signals si which are linearly combined through an unknown mixing matrix A andwhere K denotes the vector size corresponding to the number of pixels. This results in the model:
X = AS (1)
where, xi and si are rows of a N x K matrix. In the second architecture, ICA2, the superposition coefficientsare assumed to be statistically independent, but not the basis images. Accordingly, each of K pixels of the handimages result from independent mixtures of random variables. Eq. 1 still holds but xi and si form columns of aK×N matrix. The data vectors fed into the ICA analysis are the lexicographically ordered hand image pixels. Thedimension of these vectors is K = 10000, for our region of interest of size 100× 100 in vein images. Briefly, ICAaims to find a linear transformation W, also called separating or de-mixing matrix, for the inputs that minimize the

6
TABLE IIICOMPARISON OF BINARIZATION METHODS (ME: MISCLASSIFICATION ERROR, MHD: MODIFIED HD; SEE [10] FOR THE DETAILS OF
THE PERFORMANCE METRICS)
Accuracy ME Hausdorff MHDNiblack 0.69 0.30 15.85 1.16Bernsen 0.86 0.13 15.03 0.41Yasuda 0.94 0.05 12.31 0.27
Wang [3] 0.74 0.25 14.86 0.81Otsu 0.78 0.21 29.65 2.04
statistical dependence between the output components, the latter being estimates of the hypothesized independentsources si:
S ∼=WX (2)
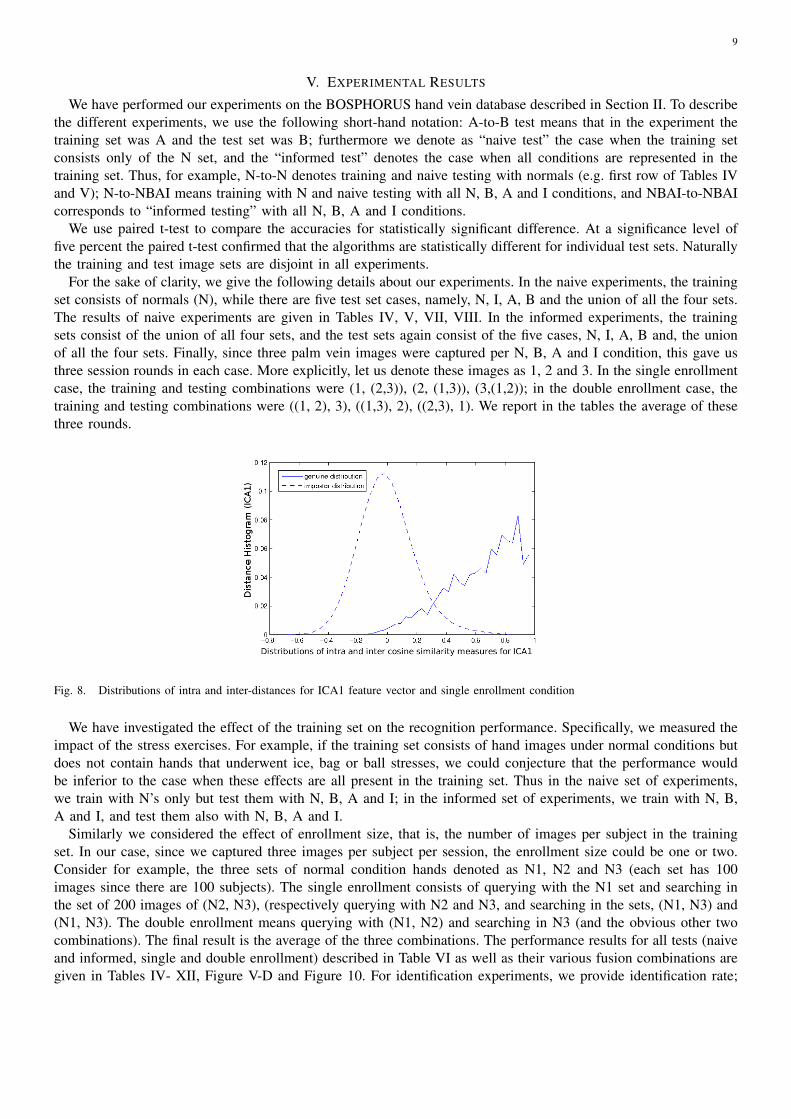
We implemented Eq. 2 via fastICA algorithm [11]. Fig. 8 shows the plot of the histograms of the intra-subject(genuine-to-genuine) differences and of the inter-subject differences (genuine-to-impostor) for ICA1 features.
B. NMF Features
Non-negative Matrix Factorization (NMF) is another matrix factorization technique with the added constraintthat each factor matrix must have only non-negative coefficients [15], though statistical independence is not soughtfor. Given a non-negative data matrix X (as in Eq. 1 and 2) of size K ×N , we obtain two non-negative matricesW and H such that:
X ∼=WH (3)
where W is of size K × L and H of size L × N . Since we force the two matrices to be non-negative, we canonly reconstruct X approximately from their product. The columns of W can be regarded as basis vectors and thecolumns of H are utilized as feature vectors of the corresponding vein images. We use Hoyer’s code [16] for NMFrepresentation.
C. LEM Features
Line Edge Map (LEM) is an approach that extracts lines from an image edge map as features. The algorithm canbe considered as a combination of template matching and geometrical feature matching. It was proposed by Gaoand Leung [9] for face recognition and then applied to vein biometry by Wang et al. [3]. The steps of binarization,skeletonization and line extraction as adapted to vein images are detailed below. The basic unit of LEM is theline segment grouped from pixels of the edge map and matching of line segments is based on the Line SegmentHausdorff Distance (LHD). Two image patterns are considered to be similar if their LHD is small.
The LEM algorithm starts with thresholding and segmenting the foreground (vein) regions. This is followed bymorphological noise filtering and skeletonization, which finally yield the vein line segments. Once the hand imagesare reduced to vein skeletons, the recognition will be based on some measure of line graph similarity. Gao andLeung [9] extend the concept of Hausdorff distance into LHD to compare line patterns. Briefly LHD incorporatesstructural information of line segment orientations, line lengths and line-point associations.
1) Image Binarization: We have compared several binarization methods. Global thresholding of NIR images doesnot always prove to be successful; hence, we resort to local binarization methods such as Yasuda [10], Bernsen [10],Niblack [10], Wang [3]. For comparison we also include one global method, Otsu [10]. Based on several groundtruth-images the scores of various similarity criteria [10], such as accuracy, misclassification error (ME), Hausdorffdistance and Modified Hausdorff Distance (MHD) between ground-truth images and test images are shown inTable III. The best results have been obtained with the Yasuda method.
In the Yasuda method [10] one first applies a normalization process, followed by a nonlinear smoothing, whichpreserves the sharp edges and culminating in an adaptive thresholding and segmentation stage. Finally noise filteringand skeletonization yield the vein line segments.

7
Fig. 5. Three LEMs of the users are displayed with different colors on the same figure in order to show the variations.
Fig. 6. LEM extraction steps: (left-to-right) A vein image, Yasuda binarization, noise removal, skeletonization and line segments generation
2) LHD: While Hausdorff distance is a natural measure for comparing similarity of sets and shapes, its extensioncalled LHD is a measure to compare line patterns. LHD incorporates structural information of line segmentorientations and line-point associations, and hence is effective in comparing two shapes made up of a numberof curve segments.
LHD measures the degree of dissimilarity between two LEMs. LEM is a representation which records only theend points of line segments on curves. Given two LEMs, M l = {ml
1,ml2, ..,m
lp} representing a model in the
database and T l = {tl1, tl2, .., tlq} representing a test input LEM where the superscript l stands for line, ~d(mli, t
lj)
represents the dissimilarity defined as:
~d(mli, t
lj) =
dθ(mli, t
lj)
d‖(mli, t
lj)
d⊥(mli, t
lj)
(4)
where dθ(mli, t
lj), d‖(m
li, t
lj) and d⊥(ml
i, tlj) are the angular distance, parallel distance and perpendicular distance,
respectively. Using these distances, LHD has been calculated using the equations defined in [9]. LHD steps are
Fig. 7. Illustration of the LHD calculation: 1) Two line segments; 2) Angular distance, 3) Rotation of the shorter segment for parallelism;4) Paralel distance, l‖1; 5) perpendicular distance, l⊥
given in Figure 7.Three different LEMs of the same person are superimposed in Figure 5. There are registration problems,
sometimes because of the normalization process, sometimes because of the binarization or skeletonization process,as well as because of the acquisition conditions.
IV. FEATURE MATCHING AND CLASSIFIER FUSION
In the identification mode, the user does not provide any identity claim, but the system must find out the user’sidentity from a database of enrolled users. For the person identification task, we measure the distance between

8
TABLE IVIDENTIFICATION AND VERIFICATION (EER) RESULTS FOR SINGLE-ENROLLMENT, NAIVE TESTS
Test Set ICA1 ICA2 NMF LEM
Normal Iden.Rate: 88.66 94.16 81.33 68.5EER: 4.02 2.47 8.14 13.52
Bag Iden.Rate: 78.33 72.33 71.44 73.77EER: 8.01 13.04 12.77 12.13
Activity Iden.Rate: 75.55 68.88 68.88 71.77EER: 9.20 13.23 14.11 12.76
Ice Iden.Rate: 68.77 64.88 66.55 65.77EER: 11.52 14.88 15.08 14.07
All Iden.Rate: 77.82 75.06 72.06 69.95EER: 8.18 10.90 12.53 13.12
TABLE VIDENTIFICATION AND VERIFICATION (EER) RESULTS FOR DOUBLE-ENROLLMENT, NAIVE TESTS
Test Set ICA1 ICA2 NMF LEM
Normal Iden.Rate: 94.33 97.33 89.67 81.66EER: 2.43 1.53 4.00 7.41
Bag Iden.Rate: 88.55 82.88 83.33 88.44EER: 4.75 8.69 7.33 7.33
Activity Iden.Rate: 86.44 79.44 81.89 86.66EER: 6.22 8.00 8.33 6.47
Ice Iden.Rate: 77.66 74.77 77.22 80.77EER: 8.22 10.76 10.89 9.13
All Iden.Rate: 86.74 83.60 83.03 84.38EER: 5.40 7.24 7.64 7.59
the test feature vector and all the feature vectors in the database belonging to N different subjects. For a personverification task, one must differentiate the genuine hand from the impostor (in our context, everybody else inthe database) hands as the user provides her hand image in support of her claimed identity. For this purpose, thedistances between the hand of the applicant and all the hands in the database are calculated and the scores arecompared against a threshold.
For ICA and NMF techniques, L1 (mean absolute difference), L2 (Euclidean) and CSM (cosine similaritymeasure) were compared and the best results have been obtained with CSM, calculated as:
dcos(ai, atest) =ai · atest‖ai‖ ‖atest‖
(5)
We have considered four fusion techniques to improve the performance of the individual schemes used for theidentification and verification tasks. We have used the Borda count technique, majority voting, which is a decisionlevel fusion technique, and three score fusion techniques: product rule, sum rule, and weighted sum rule [12].
a) Borda Count: Each classifier outputs a rank, and the ranks from individual classifiers are summed and theidentity of the vein pattern is declared to be the one with the lowest sum rank.
b) Majority Voting: Each classifier casts a vote of 1 to a class if the test pattern belongs to that class. Theclass having the highest vote is declared to be the identity of the pattern.
c) Z-score Normalized Product: Each classifier produces a similarity value from the test image to the classes.The values are mapped to the range [0, 1] with z-score normalization. Normalized scores are multiplied to obtainthe final score.
d) Z-score Normalized Sum: After z-score normalization, the scores are summed up to obtain the final score.e) Z-score Normalized Weighted Sum: Sum Rule is actually a special case of weighted sum with equal weights.
We have experimented with different weights. As expected, giving more weight to the better performing classifieryielded better results. Accordingly, we assigned the following weights: 0.6 for ICA1, 0.2 for LEM and 0.2 forNMF.
9
V. EXPERIMENTAL RESULTS
We have performed our experiments on the BOSPHORUS hand vein database described in Section II. To describethe different experiments, we use the following short-hand notation: A-to-B test means that in the experiment thetraining set was A and the test set was B; furthermore we denote as “naive test” the case when the training setconsists only of the N set, and the “informed test” denotes the case when all conditions are represented in thetraining set. Thus, for example, N-to-N denotes training and naive testing with normals (e.g. first row of Tables IVand V); N-to-NBAI means training with N and naive testing with all N, B, A and I conditions, and NBAI-to-NBAIcorresponds to “informed testing” with all N, B, A and I conditions.
We use paired t-test to compare the accuracies for statistically significant difference. At a significance level offive percent the paired t-test confirmed that the algorithms are statistically different for individual test sets. Naturallythe training and test image sets are disjoint in all experiments.
For the sake of clarity, we give the following details about our experiments. In the naive experiments, the trainingset consists of normals (N), while there are five test set cases, namely, N, I, A, B and the union of all the four sets.The results of naive experiments are given in Tables IV, V, VII, VIII. In the informed experiments, the trainingsets consist of the union of all four sets, and the test sets again consist of the five cases, N, I, A, B and, the unionof all the four sets. Finally, since three palm vein images were captured per N, B, A and I condition, this gave usthree session rounds in each case. More explicitly, let us denote these images as 1, 2 and 3. In the single enrollmentcase, the training and testing combinations were (1, (2,3)), (2, (1,3)), (3,(1,2)); in the double enrollment case, thetraining and testing combinations were ((1, 2), 3), ((1,3), 2), ((2,3), 1). We report in the tables the average of thesethree rounds.
Fig. 8. Distributions of intra and inter-distances for ICA1 feature vector and single enrollment condition
We have investigated the effect of the training set on the recognition performance. Specifically, we measured theimpact of the stress exercises. For example, if the training set consists of hand images under normal conditions butdoes not contain hands that underwent ice, bag or ball stresses, we could conjecture that the performance wouldbe inferior to the case when these effects are all present in the training set. Thus in the naive set of experiments,we train with N’s only but test them with N, B, A and I; in the informed set of experiments, we train with N, B,A and I, and test them also with N, B, A and I.
Similarly we considered the effect of enrollment size, that is, the number of images per subject in the trainingset. In our case, since we captured three images per subject per session, the enrollment size could be one or two.Consider for example, the three sets of normal condition hands denoted as N1, N2 and N3 (each set has 100images since there are 100 subjects). The single enrollment consists of querying with the N1 set and searching inthe set of 200 images of (N2, N3), (respectively querying with N2 and N3, and searching in the sets, (N1, N3) and(N1, N3). The double enrollment means querying with (N1, N2) and searching in N3 (and the obvious other twocombinations). The final result is the average of the three combinations. The performance results for all tests (naiveand informed, single and double enrollment) described in Table VI as well as their various fusion combinations aregiven in Tables IV- XII, Figure V-D and Figure 10. For identification experiments, we provide identification rate;

10
TABLE VITHE ORGANIZATION OF THE DATA SETS IN THE EXPERIMENTS FOR ENROLLMENT SIZE AND TRAINING SET
Sessions Training TrainingTypes Size
Naive Tests Single Enrollment N 100Double Enrollment N 200
Informed Tests 4× Enrollment N,B,A,I 4008× Enrollment N,B,A,I 800
for verification experiments, we provide Equal Error Rate (EER) figures and Receiver Operating Characteristics(ROC) curves.
TABLE VIIFUSION RESULTS OF ICA1, LEM AND NMF FOR NAIVE TESTS WITH SINGLE-ENROLLMENT
Test Set ICA1 Majority V. Borda C. Sum Weighted Sum ProductNormal 88.66 86.33 86.00 91.16 93.50 87.66Bag 78.33 77.33 79.00 84.66 85.66 83.77Activity 75.55 75.00 76.22 83.33 84.00 82.55Ice 68.77 72.44 73.44 80.44 79.77 79.44All 77.82 77.78 78.67 84.89 85.73 83.35
TABLE VIIIFUSION RESULTS OF ICA1, LEM AND NMF FOR NAIVE TESTS WITH DOUBLE-ENROLLMENT
Test Set ICA1 Majority V. Borda C. Sum Weighted Sum ProductNormal 94.33 93.00 93.00 97.33 97.33 93.00Bag 88.55 88.44 89.88 94.55 94.77 92.44Activity 86.44 87.33 87.55 92.55 92.22 91.77Ice 77.66 82.88 84.77 90.22 89.11 89.66All 86.74 87.91 88.80 93.66 93.35 91.71
A. Choice of features
We have observed that ICA1 features almost always had superior performance throughout all the tests, whethernaive or informed, single or double enrollment, under normal or adverse conditions. However, despite the lowerperformance achieved by NMF and LEM features, they still play a useful role when employed in a fusion scheme.
We have considered three score level schemes, one rank level fusion scheme and one decision level fusion schemeto take advantage of the diversity offered by individual feature types. Among the fusion sets of {ICA1, ICA2, NMF,LEM}, {ICA1, NMF, LEM} and {ICA2, NMF, LEM}, the best results were obtained with the {ICA1, NMF, LEM}fusion. Consider, for example, the naive identification test N-versus-NBAI, where the contribution of fusion shouldbe more relevant (Table VII and Table VIII ). The improvement brought about by the weighted sum rule is 7.9points in single enrollment (from 77.8% with ICA1 to 85.7% with fusion), and 7.8 points with double enrollment(from 86.7% with ICA1 to 93.5% with fusion). We found out that the weighted sum rule (with ICA1 weight 0.6,and weights 0.2 to NMF and LEM) brings a slight advantage on average in the naive tests; but SUM rule (allthree weights set to 0.33) performs consistently better in the informed tests (TablesX and XII ). This indicates thatwhen there are many enrollment images, the simple assumptions made during the computation of the weights donot hold.
Majority voting and Borda count also show improvements under challenging conditions such as ice, but sincethey are using hard decisions their contributions are not expected as good as the score fusion results. We reportmajority voting and Borda count performances for the sake of completeness. Product rule fusion improves in mostcases the performance vis-a-vis the best performing single feature, though not on a par with the sum rule fusion.
11
B. Effect of stressors
The effects of adverse conditions created by cold, strong exercise and weight carrying are displayed in Tables VII-VIII and X- XII. We report recognition results for Normal, Bag, Activity and Ice conditions as well as for the casewhen these four conditions are pooled together (All). As expected, in the naive tests, the performance degrades by10-20 percentage points. It is interesting to note that ice condition (I) affects the performance more than any othereffect. For example, with ICA1 features, if we compare N-to-N results with those of N-to-I results, we observe thatnaive and single enrollment incurs a drop of 20 points and naive and double enrollment 16.7 points. The drops withthe ice condition are less dramatic but still sizeable even with fusion (weighted sum); the losses being 13.7 pointsand 8.2 points. The message here is that if the test conditions differ from those of training (normal), performancedrops are inevitable.
C. Effect of enrollment size
The benefit of multiple enrollments can be read off from these tables. Since we have three images per subject,it is possible to compare only the single and double enrollments. For naive tests and with ICA1 features, theperformance improves for N-to-N tests from 88.7% to 94.3% by 6.6 percentage points as we go from single todouble enrollment (compare tables IV and V). As another case in point comparison of Tables VII and VIII showthat using weighted sum rule, and the N-versus-All test, the performance improves from 85.7% to 93.4% by 7.7points with the use of double enrollment.
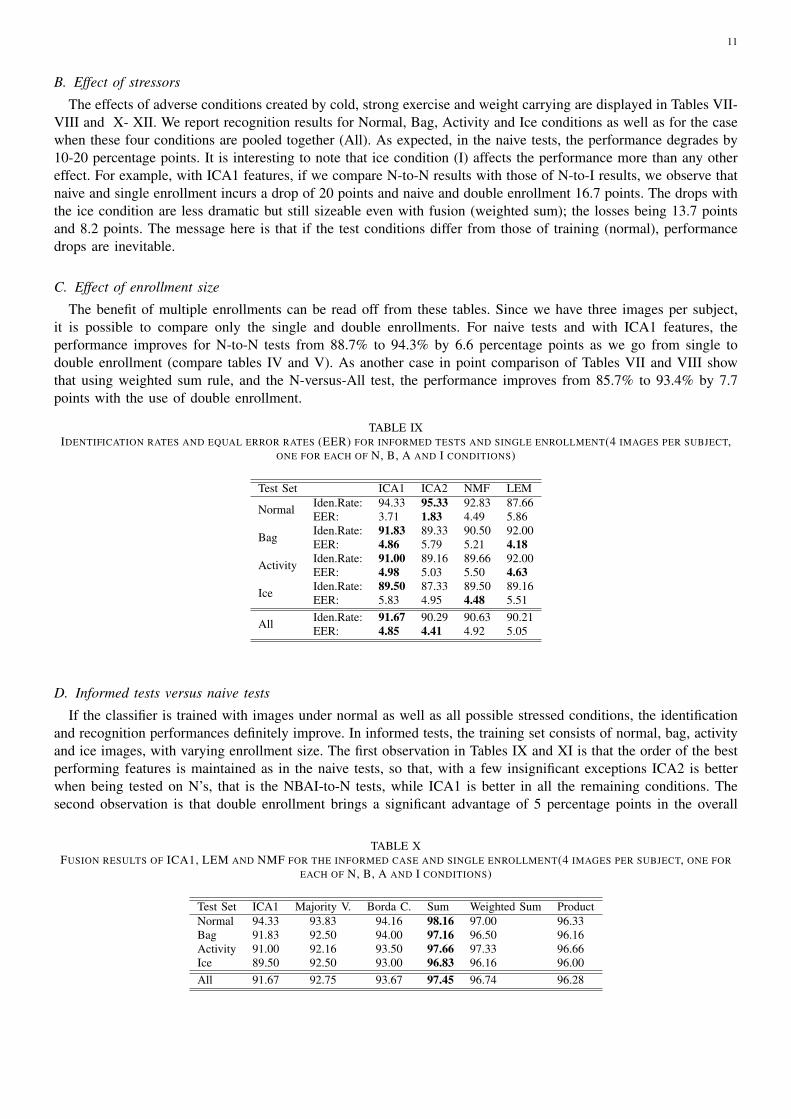
TABLE IXIDENTIFICATION RATES AND EQUAL ERROR RATES (EER) FOR INFORMED TESTS AND SINGLE ENROLLMENT(4 IMAGES PER SUBJECT,
ONE FOR EACH OF N, B, A AND I CONDITIONS)
Test Set ICA1 ICA2 NMF LEM
Normal Iden.Rate: 94.33 95.33 92.83 87.66EER: 3.71 1.83 4.49 5.86
Bag Iden.Rate: 91.83 89.33 90.50 92.00EER: 4.86 5.79 5.21 4.18
Activity Iden.Rate: 91.00 89.16 89.66 92.00EER: 4.98 5.03 5.50 4.63
Ice Iden.Rate: 89.50 87.33 89.50 89.16EER: 5.83 4.95 4.48 5.51
All Iden.Rate: 91.67 90.29 90.63 90.21EER: 4.85 4.41 4.92 5.05
D. Informed tests versus naive tests
If the classifier is trained with images under normal as well as all possible stressed conditions, the identificationand recognition performances definitely improve. In informed tests, the training set consists of normal, bag, activityand ice images, with varying enrollment size. The first observation in Tables IX and XI is that the order of the bestperforming features is maintained as in the naive tests, so that, with a few insignificant exceptions ICA2 is betterwhen being tested on N’s, that is the NBAI-to-N tests, while ICA1 is better in all the remaining conditions. Thesecond observation is that double enrollment brings a significant advantage of 5 percentage points in the overall
TABLE XFUSION RESULTS OF ICA1, LEM AND NMF FOR THE INFORMED CASE AND SINGLE ENROLLMENT(4 IMAGES PER SUBJECT, ONE FOR
EACH OF N, B, A AND I CONDITIONS)
Test Set ICA1 Majority V. Borda C. Sum Weighted Sum ProductNormal 94.33 93.83 94.16 98.16 97.00 96.33Bag 91.83 92.50 94.00 97.16 96.50 96.16Activity 91.00 92.16 93.50 97.66 97.33 96.66Ice 89.50 92.50 93.00 96.83 96.16 96.00All 91.67 92.75 93.67 97.45 96.74 96.28

12
TABLE XIIDENTIFICATION RATES AND EQUAL ERROR RATES (EER) FOR INFORMED TESTS AND DOUBLE ENROLLMENT (8 IMAGES PER SUBJECT,
TWO FOR EACH OF N, B, A AND I CONDITIONS)
Test Set ICA1 ICA2 NMF LEM
Normal Iden.Rate: 97.00 98.66 96.33 94.33EER: 2.29 1.02 2.00 3.44
Bag Iden.Rate: 97.00 94.66 95.00 98.00EER: 3.31 3.00 3.02 1.74
Activity Iden.Rate: 98.00 96.00 96.00 98.00EER: 2.94 2.33 2.37 2.60
Ice Iden.Rate: 94.66 94.33 95.66 94.66EER: 4.13 2.64 2.00 3.39
All Iden.Rate: 96.67 95.92 95.75 96.25EER: 3.17 2.25 2.35 2.79
TABLE XIIFUSION RESULTS OF ICA1, LEM AND NMF FOR THE INFORMED CASE AND DOUBLE ENROLLMENT (8 IMAGES PER SUBJECT, TWO FOR
EACH OF N, B, A AND I CONDITIONS)
Test Set ICA1 Majority V. Borda C. Sum Weighted Sum ProductNormal 97.00 97.66 98.00 99.33 98.66 97.00Bag 97.00 95.66 95.00 99.33 98.00 99.00Activity 98.00 76.44 98.33 100.00 100.00 99.33Ice 94.66 96.33 98.00 99.33 99.00 97.00All 96.67 91.52 97.33 99.49 98.91 98.08
tests, while this advantage amounted to 9 percentage points in the more disadvantaged, hence difficult naive tests(Tables IV and V).The second observation is that using more enrollment images (i.e, 8 instead of 4) brings asignificant advantage in the overall tests. The third observation is that feature fusion is advantageous, improving theoverall score in the quadruple enrollment case by more than 6 percentage points using Sum Rule (Table X). Thisresult is even better than the fusion advantage in the naive case (2.4 percentage points as in Table VII). The fourthand most important observation is that informed testing, that is, training the classifier with all likely variations tobe encountered during testing provides a very significant performance increase; and it is possible to obtain morethan 99 percent performance on average with the SUM rule, in the informed case with 8 enrollment images.
E. Factors of Time Lapse, Resolution and Population Size
In this section we investigate the effects of such factors as the time elapsed between the training and test imagecapture sessions, the way the performance scales with the gallery size, and the imaging resolution.
Part of the database collection process was repeated after three months. Table XIII shows the performance resultswhere Contemporaneous means hand that enrollment and test images were collected within minutes of each other,while Time Lapsed means that a hand presently imaged is tried to be identified and/or verified by considering thehands collected three months ago. A significant drop in performance is observed; pointing to a need for multiple time-lapse enrollment or template adaptation. Figure 10(a) and 10(b) show how EER changes under increasing resolutionand increase in gallery size. As expected, performance degrades with decreasing resolution, and increasing gallerysize.
TABLE XIIIEFFECTS OF TIME LAPSE DATA (ICA1 NAIVE TESTS)
Version Contemporaneous Time Lapsed
Single Enr. Iden.Rate: 96.00 81.33EER: 1.98 9.25
Double Enr. Iden.Rate: 98.66 88.00EER: 0.33 5.02

13
Fig. 9. ROC curves of single enrollment and 8× enrollment
Fig. 10. (a) ICA1, EER performances for different resolutions (30×30, 50×50, 70×70 and 100×100) (b) ICA1, EER performances fordifferent population sizes (20, 50, 80, 100) for naive tests. TEST1 refers to Single Enrollment Tests and TEST2 refers to Double EnrollmentTests that are explained in Table VI
VI. CONCLUSION
We have collected a hand vein database which we call BOSPHORUS, using near infrared imaging technology,under adverse conditions mirroring real life situations and designed a new biometric identification system based onhand vein patterns. The main novelty of the study is the collection of the BOSPHORUS hand vein database, thatincludes adversarial conditions, and the study of performance under these conditions. Another contribution is theextensive experimentation on joint appearance-based and geometry-based features. Notice that a variety of differentfeatures have recently been analyzed in [27].
The appearance-based features are extracted using ICA and NMF algorithms in this work, and they both haveproved superior to the geometry-based LEM technique. Although NMF and LEM are inferior to ICA features alone;their fusion brings significant advantages, pointing out that they provide complementary information. The majorconclusions can be summarized as follows:
i. According to the results achieved on the employed dataset, ICA architecture 1 (ICA1) proves to be alwaysslightly better compared to its competitors ICA2, LEM and NMF. Recall that ICA1 presents a parts-basedsparse representation while ICA2 gives a holistic view. ICA2 seems to achieve somewhat better results whenhands are presented without stressing effects.
14
ii. For stressed conditions, such as strenuous exercise with the hand, there are large performance drops.iii. Fusion of the classifier scores under the sum rule improves the performance significantly.
We have shown that hand vein pattern biometry is a promising technique. The BOSPHORUS database is presentlypublicly available for the sake of reproducable results at http://bosphorus.ee.boun.edu.tr/. Our future research willaddress several related problems such as: i) Contactless hand vein image acquisition, where the registration andclassification are more challenging; ii) The local features of the Gabor, LBP, SIFT or gradient variety; ii) Effectsof time lapse analyzed on a more significant volume of subjects.
REFERENCES
[1] Jain, A. K., P. Flynn, and A. A. Ross, Handbook of Biometrics, Springer, 2008.[2] Ding, Y., D. Zhuang, and K. Wang, A Study of Hand Vein Recognition Method, Proceedings of IEEE International Conference on
Mechatronics and Automation, 2005.[3] Wang, L.-Y., G. Leedham, and D. S.-Y. Cho, Infrared Imaging of Hand Vein Patterns for Biometric Purposes, The Institution of
Engineering and Technology, Computer Vision, Vol. 1, pp. 113-122, 2007.[4] Wang, Z., B. Zhang, W. Chen, and Y. Gao, A Performance Evaluation of Shape and Texture Based Methods for Vein Recognition,
Congress on Image and Signal Processing, Vol. 2, pp. 659-661, 2008.[5] Toh, K.-A., H.-L. Eng, Y.-S. Choo, Y.-L. Cha, W.-Y. Yau, and K.-S. Low, Identity Verification Through Palm Vein and Crease Texture,
Lecture Notes in Computer Science, 2005.[6] Konukoglu, E., E. Yoruk, J. Darbon, and B. Sankur, Shape-Based Hand Recognition, IEEE Transactions on Image Processing, Vol. 15,
No. 7, pp. 1803-1815, 2006.[7] Yoruk, E., H. Dutagaci, and B. Sankur, Hand Biometry, Image and Vision Computing, Vol. 24, No. 5, pp. 483-497, 2006.[8] Watec, Specifications of the WAT-902H2 ULTIMATE Camera, June 2010, http://www.watec.co.jp/english/bw/wat 902 ultimate.html.[9] Gao, Y.-S. and M. K. H. Leung, Line Segment Hausdorff Distance on Face Matching, Pattern Recognition, Vol. 35, No. 2, pp. 361-371,
February 2002.[10] Sezgin, M. and B. Sankur, Survey over Image Thresholding Techniques and Quantitative Performance Evaluation, Journal of Electronic
Imaging, Vol. 13, No. 1, pp. 146-165, 2004.[11] Hyvrinen, A. and E. Oja, Independent Component Analysis: Algorithms and Applications, Neural Networks, Vol. 13, No. 4-5, pp.
411-430, 2000.[12] Gokberk, B., A. A. Salah, and L. Akarun, Rank-Based Decision Fusion for 3D Shape-Based Face Recognition, Audio- and Video-Based
Biometric Person Au- thentication (AVBPA), July 2005.[13] Lin, C.-L. and K.-C. Fan, Biometric Verification Using Thermal Images of Palm- Dorsa Vein Patterns, IEEE Trans. Circuits and Sys.
For Video Technology, Vol. 14, No. 2, pp. 199-213, February 2004.[14] Wang, J.-G., W.-Y. Yau, and A. Suwandy, Fusion of Palmprint and Palm Vein Images for Person Recognition Based on Laplacianpalm
Feature, Pattern Recognition, Vol. 41, pp. 1531-1544, May 2008.[15] Lee, D. D. and H. S. Seung, Algorithms for Non-negative Matrix Factorization, Advances in Neural Information Processing Systems,
Vol. 13, pp. 556-562, 2001.[16] Hoyer, P. O., Non-negative Matrix Factorization with Sparseness Constraints, Journal of Machine Learning Research, Vol. 5, pp.
1457-1469, December 2004.[17] Zhang, T. Y. and C. Y. Suen, A Fast Parallel Algorithm for Thinning Digital Patterns, Communications of the ACM, Vol. 27, No. 3,
pp. 236-239, March 1984.[18] Weeks, A. R., Fundamentals of Electronic Image Processing, SPIE Press, 1996.[19] Jain, A. K., L. Hong, S. Pankanti, and R. Bolle, An Identity-Authentication System Using Fingerprints, Proc. IEEE, Vol. 85, No. 9,
pp. 1365-1388, September 1997.[20] Wang, L.-Y., G. Leedham, and D. S.-Y. Cho, Minutiae Feature Analysis for Infrared Hand Vein Pattern Biometrics, The Journal of the
Pattern Recognition Society, Vol. 41, No. 3, pp. 920-929, March 2008.[21] Lecornu, L., C. Roux, and J. Jacque, Extraction of Vessel Contours in Angiograms by Simultaneous Tracking of the Two Edges, IEEE
Conf. Eng. in Medicine and Bio., Vol. 1, pp. 678-679, 1994.[22] Martelli, A., An Application of Heuristic Search Methods to Edge and Contour Detection, Comm. ACM, Vol. 19, pp. 73-83, 1976.[23] Luo, H., F. Yu, J. Pan, S. Chu, and P. Tsai, A Survey of Vein Recognition Techniques, Information Technology Journal, Vol. 9, No. 6,
pp. 1142-1149, 2010.[24] Stan, Z. Li. (Editor), Encyclopedia of Biometrics, Vol. 2, Springer, 2009.[25] Ekenel, H., K. and B. Sankur, Feature selection in the independent component subspace for face recognition, Pattern Recognition
Letters, Vol. 23, pp. 1377-1388, 2004.[26] Dutagaci, H., B. Sankur, and E. YorukA comparative analysis of global hand appearance based person recognition, J. Electronic Imaging,
Vol. 17, No.1, 011018/1- 011018/19, 2008.[27] Kumar, A., K. and K., V. Prathyusha, Personal authentication using hand vein triangulation, IEEE Trans. Image Process., Vol. 38, pp.
2127-2136, 2009.[28] Zhou, Y., K. and A. Kumar, Contactless palmvein identification using multiple representations, Proc. BTAS 10, Washington, D.C.,
2010.