Hand-held Analyzer Types 2250 and 2270 User Manual (be1713)
368
USER MANUAL Hand-held Analyzer Types 2250 and 2270 With Sound Level Meter Software BZ-7222, Frequency Analysis Software BZ-7223, Logging Software BZ-7224, Enhanced Logging Software BZ -7225, Signal Recording Option BZ-7226, Reverberation Time Software BZ-7227, 2-channel Option BZ-7229 Tone Assessment Option BZ-7231 and Enhanced Vibration and Low Frequency Option BZ-7234 BE 1713 – 32 English
Transcript of Hand-held Analyzer Types 2250 and 2270 User Manual (be1713)
USER MANUAL
www.bksv.com © Brüel & Kjær. All rights reserved.
Hand-held AnalyzerTypes 2250 and 2270
With Sound Level Meter Software BZ-7222,Frequency Analysis Software BZ-7223,Logging Software BZ-7224,Enhanced Logging Software BZ -7225,Signal Recording Option BZ-7226, Reverberation Time Software BZ-7227,2-channel Option BZ-7229Tone Assessment Option BZ-7231 and Enhanced Vibration and Low Frequency Option BZ-7234BE 1713 – 32English
ËBE-1713---|Î
BE17
13–
32


BE 171332February 2016 www.bksv.com
Hand‐held Analyzer Types 2250 and 2270
withSound Level Meter Software BZ‐7222,Frequency Analysis Software BZ‐7223,
Logging Software BZ‐7224,Enhanced Logging Software BZ‐7225,Signal Recording Option BZ‐7226,
Reverberation Time Software BZ‐7227,2‐channel Option BZ‐7229,
Tone Assessment Option BZ‐7231 and Enhanced Vibration and Low Frequency Option BZ‐7234
User Manual
Valid for all hardware versions and from software version 4.6

Health and Safety ConsiderationsThis apparatus has been designed and tested in accordancewith IEC/EN 61010 – 1 and ANSI/UL 61010 – 1 SafetyRequirements for Electrical Equipment for Measurement,Control and Laboratory Use. This manual containsinformation and warnings which must be followed to ensuresafe operation and to retain the apparatus in safe condition.
Safety Symbols and Signal Words Used
The apparatus will be marked with this symbolwhen it is important that you refer to theassociated danger or warning statement given inthis manualThe manual uses this symbol when a danger orwarning statement is applicableHazardous Voltage/Electricity. Both the apparatusand manual use this symbol when there is a risk forshock or electrocutionHot Surface. This manual will use this symbol whenthere is a risk for burning or scolding
Earth (Ground) Terminal. The apparatus will bemarked with this symbol when applicable Protective Conductor Terminal. The apparatus willbe marked with this symbol when applicableAlternating Current. The apparatus will be markedwith this symbol when applicable
Danger Signals an imminent hazardous situation, which, ifnot avoided, will result in death or serious injury
Warning Signals a possibly hazardous situation, which, ifnot avoided, will result in death or serious injury
Caution Signals a hazardous situation, which, if notavoided, could result in minor or moderate injuryor damage to the apparatus
Notice Signals a situation or practice that requiresattention, but does not directly result in personalinjury if ignored
Risks and Hazards
Explosion HazardsDanger: The apparatus is not designed to be usedin potentially explosive environments. It shouldnot be operated in the presence of flammableliquids or gases
Electrical HazardsWarning: Any adjustment, maintenance andrepair of the open apparatus under voltage mustbe avoided as far as possible and, if unavoidable,must be carried out only by trained service
Caution: Switch off all power to equipment beforeconnecting or disconnecting their digitalinterface. Failure to do so could damage theequipment
Mechanical HazardsCaution: Whenever it is likely that the correct function or
operating safety of the apparatus has beenimpaired, it must be made inoperative and besecured against unintended operation
Waste HandlingBrüel & Kjær complies with the EU’s Waste Electricaland Electronic Equipment (WEEE) Directive, which issuesthe following waste handling instructions:• Do not dispose of electronic equipment or
batteries as unsorted municipal waste• It is your responsibility to contribute to a clean
and healthy environment by using theappropriate local return and collection systems
• Hazardous substances in electronic equipment orbatteries may have detrimental effects on theenvironment and human health
• The symbol shown to the left indicates thatseparate collection systems must be used for anydiscarded equipment or batteries marked withthat symbol
• Waste electrical and electronic equipment orbatteries may be returned to your localBrüel & Kjær representative or to Brüel & KjærHeadquarters for disposal


Brüel & Kjær has made every effort to ensure the accuracy ofthe information contained in this document. No responsibilityis accepted for any errors or omissions herein. It is theresponsibility of the user to ensure compliance with any legalor statutory requirements in the country of use. Data maychange, as well as legislation, therefore you are advised toobtain copies of the most recently issued applicableregulations, standards and guidelines.
All descriptions, illustrations and any other information relatingto the product are made by way of general description, areapproximate only and for the general guidance and informationof the user. They cannot be construed to imply representation orwarranty as to their accuracy, currency or completeness and arenot intended to form the basis of any contract.
The information in this document does not constitute awarranty, representation or guarantee concerning thesuitability or performance of the product.
Brüel & Kjær shall not be liable for any loss whether direct,indirect, incidental or consequential arising from the use of orreliance upon any of the content of this document, regardlessof whether such content has been accurate or complete.Brüel & Kjær will not pay any damages whether for loss orinjury, punitive or otherwise, because of use of or reliance uponany of the content in this document.
Brüel & Kjær and all other trademarks, service marks, tradenames, logos and product names are the property ofBrüel & Kjær or a third-party company. Nothing in thisdocument may be construed as granting, by implication, orotherwise any license or right to use any of the trademarkswithout a prior written permission of Brüel & Kjær or the ownerof such trademark.
© Brüel & Kjær. All rights reserved.
Brüel & Kjær Sound & Vibration Measurement A/SDK-2850 Nærum · Denmark
For service and support, contact your nearest Brüel & KjærCustomer Care support team:
Headquarters: [email protected], +45 7741 2400China (Beijing): +86 10 59935811France: [email protected], +33 1 69 90 71 02Germany: [email protected], +49 421 17 87 0Italy: [email protected], +39 02 5768061 Japan: [email protected], +81 3 6810 3500North & South America: [email protected],+1 770 209 6907Spain: [email protected], +34 91 659 08 20UK & Ireland: [email protected], +44 1223 389800
Go to www.bksv.com/contact for contact information to ourother global offices.
Contents
CHAPTER 1
Introduction............................................................................................................................. 11.1 How to Use this Manual ........................................................................................................... 1
Conventions Used in this Manual ............................................................................................. 1Beginners .................................................................................................................................. 2Experienced Users of Acoustic Measurement Equipment ....................................................... 2
CHAPTER 2
Assembling your Analyzer ....................................................................................................... 32.1 Determining Your Hardware Version........................................................................................ 3
What is Different with G4 Hardware? ...................................................................................... 32.2 Analyzer Components............................................................................................................... 42.3 Analyzer Inputs/Outputs........................................................................................................... 7
Hardware Versions 1 – 3 (G1 – 3): ............................................................................................ 7Hardware Version 4 (G4): ......................................................................................................... 8Description of Inputs and Outputs ........................................................................................... 9
2.4 Hardware Setup ...................................................................................................................... 132.5 Assembling the Analyzer......................................................................................................... 14
Charging the Battery for the First Time .................................................................................. 14Making Good Measurements ................................................................................................. 14Alternative Measurement Method (Extended Microphone) ................................................. 16Measuring for Convenience.................................................................................................... 17Measuring Using Accelerometers........................................................................................... 17
CHAPTER 3
Making your First Measurement ............................................................................................ 193.1 Point and Shoot ...................................................................................................................... 193.2 Making a Measurement.......................................................................................................... 20
Switching On........................................................................................................................... 20Select Template and Measure ................................................................................................ 20
3.3 Save your Measurement......................................................................................................... 24Viewing the Saved Measurement........................................................................................... 25
3.4 Document your Measurement ............................................................................................... 26Annotation Tutorial ................................................................................................................ 30
3.5 Switching Off........................................................................................................................... 30

Hand‐held Analyzer Types 2250 and 2270 – User Manualvi
CHAPTER 4
Getting to Know Your Analyzer.............................................................................................. 314.1 What is a Sound Level Meter?................................................................................................ 314.2 What is the Hand‐held Analyzer?........................................................................................... 32
Sound Level Meter Software Module BZ‐7222 ...................................................................... 32Frequency Analysis Software Module BZ‐7223...................................................................... 34Logging Software Module BZ‐7224 ........................................................................................ 34Enhanced Logging Software Module BZ‐7225........................................................................ 34Signal Recording Option BZ‐7226........................................................................................... 34Reverberation Time Software BZ‐7227 .................................................................................. 352‐channel Option BZ‐7229 (Type 2270 only).......................................................................... 35Tone Assessment Option BZ‐7231.......................................................................................... 35Enhanced Vibration and Low Frequency Option BZ‐7234...................................................... 35
4.3 Built‐in Help............................................................................................................................ 36Software and Hardware Versions........................................................................................... 36
4.4 What is Measurement Partner Suite BZ‐5503?...................................................................... 364.5 Basic Principles when using the Analyzer............................................................................... 37
Navigation Principles – ‘Star’ Navigation Concept ................................................................. 37The Display Screen ................................................................................................................. 40Use of Pushbuttons for Controlling Measurements............................................................... 43On‐screen Feedback and Traffic Light .................................................................................... 44Use of Stylus and Navigation Pushbuttons............................................................................. 44How to Change Parameter Values.......................................................................................... 45How to Personalize your Setup .............................................................................................. 47How to Manage the Project Templates.................................................................................. 48Locking the Pushbuttons and Display..................................................................................... 50
CHAPTER 5
Calibration............................................................................................................................. 515.1 Introduction............................................................................................................................ 515.2 Calibration Types.................................................................................................................... 515.3 Sound Level Calibration.......................................................................................................... 52
Standard Calibration............................................................................................................... 52Calibration Settings ................................................................................................................ 54
5.4 Calibration History.................................................................................................................. 555.5 Transducer Database.............................................................................................................. 555.6 Calibration Reminder ............................................................................................................. 575.7 Charge Injection Calibration................................................................................................... 58
Theory of Charge Injection Calibration................................................................................... 58Performing a Manual CIC with your Type 2250/2270 ............................................................ 59
5.8 Vibration Calibration .............................................................................................................. 60

vii
CHAPTER 6
Data Management ................................................................................................................. 616.1 Organizing Measurements...................................................................................................... 61
Description of Jobs and Projects............................................................................................. 61Navigating in Jobs ................................................................................................................... 62
6.2 Selecting Default Measurement Job/Path.............................................................................. 636.3 Recalling Measurements ........................................................................................................ 64
Viewing Data and Reusing Setups from Projects .................................................................... 64Viewing or Listening to Annotations and Metadata ............................................................... 64
6.4 Measurement Partner Cloud .................................................................................................. 65Connecting the Analyzer to MP Cloud.................................................................................... 66Managing MP Cloud on the Analyzer ..................................................................................... 67
CHAPTER 7
Connection to PC or Smartphone or Measurement Partner Field App........................................................................................ 69
7.1 Introduction ............................................................................................................................ 697.2 Transferring Measurement Data to Your PC .......................................................................... 70
Connect to Your PC ................................................................................................................. 71Post‐processing and Reporting ............................................................................................... 71
7.3 Measurement Partner (MP) Field App.................................................................................... 72Annotations ............................................................................................................................ 73Connect the Analyzer to MP Field App ................................................................................... 73
7.4 Internet Browser for Online Display and Control of the Analyzer .......................................... 74
CHAPTER 8
Advanced Use of the Analyzer –Tips and Tricks ....................................................................................................................... 79
8.1 Setting your Preferences on the Analyzer .............................................................................. 79Display..................................................................................................................................... 79Power...................................................................................................................................... 80Regional .................................................................................................................................. 82Users and Projects .................................................................................................................. 83Headphone Settings................................................................................................................ 85Printers ................................................................................................................................... 86
8.2 Modem/DynDNS Settings ....................................................................................................... 86Connection to the Network using a LAN Modem................................................................... 87Connection to Network using GPRS/EDGE/HSPA Modem...................................................... 87DynDNS ................................................................................................................................... 88
8.3 Network Settings .................................................................................................................... 89Connecting to the Analyzer .................................................................................................... 90Parameters in Network Settings ............................................................................................. 91
Hand‐held Analyzer Types 2250 and 2270 – User Manualviii
8.4 Notifications ........................................................................................................................... 93Alarm Settings ........................................................................................................................ 93Text/SMS Notifications........................................................................................................... 95Email Notifications ................................................................................................................. 96
8.5 Web Server ............................................................................................................................. 97Password Protection .............................................................................................................. 97
8.6 Connecting to Weather Stations and GPS Receivers.............................................................. 97Weather Stations.................................................................................................................... 97GPS Receivers ......................................................................................................................... 98
8.7 Preparing your Measurements............................................................................................... 99Metadata ................................................................................................................................ 99Timers and Automatic Measurements................................................................................. 101
CHAPTER 9
Updating and Upgrading Applications,Maintenance, Calibration and Troubleshooting ................................................................... 103
9.1 How to Install New Applications .......................................................................................... 1039.2 How to Update/Upgrade Applications and Install New Languages ..................................... 103
Update/Upgrade using BZ‐5503........................................................................................... 103Update through the Internet................................................................................................ 104Downgrade to an Earlier Version ......................................................................................... 105
9.3 How to Move a License ........................................................................................................ 1069.4 Troubleshooting ................................................................................................................... 106
Measurements ..................................................................................................................... 106SD/CF Cards and USB Sticks.................................................................................................. 106Battery Pack and Recalibration of Battery Charge Indicator................................................ 108Touch Screen ........................................................................................................................ 108Reset Options ....................................................................................................................... 109
9.5 Care, Cleaning and Storage .................................................................................................. 112Handling the Analyzer .......................................................................................................... 112Cleaning the Analyzer........................................................................................................... 112Storing the Analyzer ............................................................................................................. 112
9.6 Services at Brüel & Kjær for Types 2250 and 2270 .............................................................. 113Accredited Calibration.......................................................................................................... 113Initial Calibration .................................................................................................................. 113Regular Recalibration ........................................................................................................... 113Filter Calibration................................................................................................................... 113Service and Repair ................................................................................................................ 113Hardware Maintenance and Repair ..................................................................................... 114Rental ................................................................................................................................... 114Training................................................................................................................................. 114

ix
CHAPTER 10
1/1‐ or 1/3‐octave Frequency Analysis (Optional Module) ................................................... 11510.1 Setting up the Analyzer......................................................................................................... 11510.2 Controlling the Measurement .............................................................................................. 11610.3 Displaying the Results ........................................................................................................... 116
Smileys .................................................................................................................................. 12110.4 Saving Results ....................................................................................................................... 121
CHAPTER 11
Logging (Optional Module) .................................................................................................. 12311.1 Setting up the Analyzer......................................................................................................... 12411.2 Controlling the Measurement .............................................................................................. 127
Annotating a Project ............................................................................................................. 127Recording the Signal ............................................................................................................. 127
11.3 Displaying the Results ........................................................................................................... 127The Profile Tab...................................................................................................................... 128Marking Sound Categories.................................................................................................... 131Editing Markers on Profiles................................................................................................... 132Annotate Sound Categories .................................................................................................. 133Editing Annotations on Profiles ............................................................................................ 134
11.4 Saving and Recalling Results ................................................................................................. 134
CHAPTER 12
Enhanced Logging (Optional Module) .................................................................................. 13512.1 Setting up the Analyzer......................................................................................................... 13612.2 Controlling the Measurement .............................................................................................. 137
Annotating a Project ............................................................................................................. 138Recording the Signal ............................................................................................................. 138
12.3 Displaying the Results ........................................................................................................... 138The Profile Tab...................................................................................................................... 139Displaying Noise Indicators................................................................................................... 139Saving and Recalling Results ................................................................................................. 140
CHAPTER 13
Signal Recording Option....................................................................................................... 14113.1 Sound Level Meter and Frequency Analysis Software.......................................................... 141
Setting up the Analyzer......................................................................................................... 141Controlling the Recording..................................................................................................... 143Playing the Recording ........................................................................................................... 143
13.2 Logging and Enhanced Logging Software ............................................................................. 144Setting up the Analyzer......................................................................................................... 144Controlling the Recording..................................................................................................... 145Control Recording using the Stylus ....................................................................................... 146Playing the Recording ........................................................................................................... 147Signal Recordings on the PC.................................................................................................. 149

Hand‐held Analyzer Types 2250 and 2270 – User Manualx
CHAPTER 14
Reverberation Time Software (Optional Module) ............................................................................................................... 151
14.1 Introduction.......................................................................................................................... 151Definition.............................................................................................................................. 151How Do We Measure Reverberation Time?......................................................................... 152
14.2 Setting up the Analyzer ........................................................................................................ 155Interrupted Noise Method ................................................................................................... 156Impulsive Method ................................................................................................................ 156Signal Recording ................................................................................................................... 157Controlling the Measurement .............................................................................................. 157Serial Measurements............................................................................................................ 157Annotating Projects and Positions ....................................................................................... 159
14.3 Displaying the Results........................................................................................................... 159Overview .............................................................................................................................. 159Spectrum .............................................................................................................................. 161Decay .................................................................................................................................... 163
14.4 Measurements with Graphical Position Management......................................................... 16514.5 Quality Indicators ................................................................................................................. 16914.6 Saving and Recalling Results................................................................................................. 170
CHAPTER 15
Tone Assessment Option BZ‐7231 – 1/3‐octave Method.............................................................................................................. 171
15.1 Tone Assessment According to ISO 1996‐2, Annex D........................................................... 172ISO 1996‐2, Annex D – Tone Assessment Calculations......................................................... 172
15.2 Tone Assessment According to Italian Law .......................................................................... 17415.3 Setting up the Analyzer ........................................................................................................ 175
Selecting the Tone Assessment Option ................................................................................ 175Setting up a Measurement Manually ................................................................................... 176Setting up the Measurement using the Default Setup......................................................... 177Signal Recording ................................................................................................................... 178
15.4 Measuring............................................................................................................................. 179Result Display ....................................................................................................................... 179
15.5 Logging Software BZ‐7224 Template.................................................................................... 18015.6 Enhanced Logging Software BZ‐7225 Template................................................................... 18115.7 Status Codes (Smileys).......................................................................................................... 18115.8 Recalling Saved Measurements............................................................................................ 183
CHAPTER 16
2‐channel Option BZ‐7229 ................................................................................................... 18516.1 Connecting Transducers ....................................................................................................... 18616.2 Range Setting........................................................................................................................ 186
Underrange/Overload .......................................................................................................... 187
xi
16.3 Setting Up 2‐channel Sound Level Meter ............................................................................. 187Controlling the Measurement .............................................................................................. 188Displaying the Results ........................................................................................................... 188Saving Results ....................................................................................................................... 189
16.4 Setting Up 2‐channel Frequency Analyzer............................................................................ 189Controlling the Measurement .............................................................................................. 190Displaying the Results ........................................................................................................... 190Saving Results ....................................................................................................................... 192
16.5 Setting Up 2‐channel Logging and Enhanced Logging .......................................................... 192Controlling the Measurement .............................................................................................. 193Displaying the Results ........................................................................................................... 193 Saving Results ...................................................................................................................... 193
16.6 Setting Up 2‐channel Signal Recording................................................................................. 193
CHAPTER 17
Enhanced Vibration and Low‐frequency Option BZ‐7234............................................................................................ 195
17.1 Sound Measurements and G‐weighting ............................................................................... 196Setting up the Analyzer for G‐weighting............................................................................... 197Controlling the Measurement .............................................................................................. 198Displaying the Results ........................................................................................................... 198
17.2 General Vibration Measurements ........................................................................................ 199Setting up the Analyzer for General Vibration Measurements ............................................ 200Controlling the Measurement .............................................................................................. 201Displaying the Results ........................................................................................................... 201
17.3 Human Vibration Measurements ......................................................................................... 204Setting up the Analyzer for Human Vibration Measurements ............................................. 205Controlling the Measurement .............................................................................................. 206Displaying the Results ........................................................................................................... 206
17.4 Setting Up the Frequency Analyzer Module for Very Low Frequencies ............................... 207Controlling the Measurement .............................................................................................. 208Displaying the Results ........................................................................................................... 208Saving Results ....................................................................................................................... 208
CHAPTER 18
Specifications....................................................................................................................... 209
APPENDIX A
Setup Parameters ................................................................................................................ 231A.1 Input...................................................................................................................................... 232A.2 Frequency Settings ............................................................................................................... 235A.3 Statistics................................................................................................................................ 239A.4 Measurement Control – for BZ‐7222 to BZ‐7225 ................................................................. 240A.5 Measurement Control – for Reverberation Time Software BZ‐7227 ................................... 243A.6 Logged Broadband (10/100 ms) ........................................................................................... 245
Hand‐held Analyzer Types 2250 and 2270 – User Manualxii
A.7 Logged Broadband................................................................................................................ 245A.8 Logged Spectrum.................................................................................................................. 248A.9 Markers ................................................................................................................................ 249A.10 Level Trigger ......................................................................................................................... 250A.11 Triggers................................................................................................................................. 253A.12 Units ..................................................................................................................................... 257A.13 Signal Recording ................................................................................................................... 258A.14 Output Socket Signal ............................................................................................................ 263A.15 Lden Periods .......................................................................................................................... 264A.16 Occupational Health............................................................................................................. 265A.17 Generator ............................................................................................................................. 266A.18 Post‐processing .................................................................................................................... 268A.19 Tone Assessment.................................................................................................................. 269A.20 RPM Measurements............................................................................................................. 271
APPENDIX B
Measurement Parameters ................................................................................................... 273B.1 Total Measurement (Microphone Input) ............................................................................. 274
For Sound Level Meter Software BZ‐7222, Frequency Analysis Software BZ‐7223, Logging Software BZ‐7224 and Enhanced Logging Software BZ‐7225 274
B.2 Periodic Reports (Microphone Input)................................................................................... 277For Enhanced Logging Software BZ‐7225............................................................................. 277
B.3 Logged Measurement (Microphone Input) .......................................................................... 280For Logging Software BZ‐7224 and Enhanced Logging Software BZ‐7225 ........................... 280
B.4 Logged (10/100 ms) Measurement (Microphone Input) ..................................................... 282For Logging Software BZ‐7224 and Enhanced Logging Software BZ‐7225 ........................... 282
B.5 Instantaneous Measured Parameters (available at any time; Microphone Input) .............. 283Processed Parameters for Display Only (Microphone Input) ............................................... 284
B.6 Total Measurement (Accelerometer and Direct Input)........................................................ 285For Sound Level Meter Software BZ‐7222, Frequency Analysis Software BZ‐7223, Logging Software BZ‐7224 and Enhanced Logging Software BZ‐7225 285Periodic Reports (Accelerometer or Direct input)................................................................ 286Logged Measurement (Accelerometer or Direct input) ....................................................... 287Logged (100 ms) Measurement (Accelerometer or Direct input) ........................................ 288Instantaneous Measured Parameters (Available at Any Time; Accelerometer or Direct input). 289Relationship Between Setup and Measurement Parameters .............................................. 290
B.7 Reverberation Time Measurement ...................................................................................... 291For Reverberation Time Software BZ‐7227 .......................................................................... 291

xiii
APPENDIX C
Analyzer Parameters............................................................................................................ 293C.1 Current Transducer............................................................................................................... 294C.2 Transducer Database ............................................................................................................ 295
Transducer Setup.................................................................................................................. 295Calibration History ................................................................................................................ 297
C.3 Calibration Setup .................................................................................................................. 299C.4 Type 2250/2270 Microphones.............................................................................................. 300
APPENDIX D
Preferences.......................................................................................................................... 303D.1 Display Settings..................................................................................................................... 303D.2 Power Settings ...................................................................................................................... 304D.3 Regional Settings .................................................................................................................. 305D.4 Users and Projects Settings .................................................................................................. 306D.5 Headphone Settings.............................................................................................................. 306D.6 Printer Settings ..................................................................................................................... 308D.7 Modem/DynDNS Settings ..................................................................................................... 309D.8 Network Settings .................................................................................................................. 310D.9 Measurement Partner Cloud Settings .................................................................................. 312D.10 Notification Settings ............................................................................................................. 313D.11 Remote Access Settings ........................................................................................................ 316D.12 Image Settings (Type 2270 only)........................................................................................... 317D.13 NMT Server Settings (Hardware Version 4 only) .................................................................. 317
APPENDIX E
Glossary............................................................................................................................... 319
INDEX ............................................................................................................................. 333

Hand‐held Analyzer Types 2250 and 2270 – User Manualxiv

1
Chapter 1Introduction
This manual describes Hand-held Analyzer Type 2250 and Hand-held Analyzer Type 2270platforms, including:• Sound Level Meter Software BZ-7222• Frequency Analysis Software BZ-7223• Logging Software BZ-7224• Enhanced Logging Software BZ-7225• Signal Recording Option BZ-7226• Reverberation Time Software BZ-7227• 2-channel Option BZ-7229• Tone Assessment Option BZ-7231• Enhanced Vibration and Low Frequency Option BZ-7234The manual explains how to perform a basic sound measurement, which parameters you canmeasure and how the hand-held analyzer should be operated. In addition, some practical hintsand guidelines are provided, including all relevant technical specifications. Finally, a glossary isadded to help with specific terminology found in this manual.This manual is intended for all hardware versions (from 1 to 4). All hardware versions support thelatest application software covered in this manual.
1.1 How to Use this Manual
1.1.1 Conventions Used in this Manual
“Analyzer” refers to Type 2250 or Type 2270 if the description is valid for both types.Instructions and descriptions that refer to the analyzer pushbuttons are shown with thepushbutton icons as seen on the analyzer. See Chapter 2 for a list of pushbutton icons and theirfunctions.
Icons, Buttons and Tabs Used on the Screen
Indicated by bold type face (for example, tap Main Menu icon).

Hand‐held Analyzer Types 2250 and 2270 – User Manual2
Parameter Values, Text and Variables
Parameter values, instructions, descriptions appearing on the screen and variables are indicatedby italics (for example, Internal Disk).
Menu, Parameters and Screen Navigation
Indicated by bold type face (for example, Setup > Frequency Settings > BB Peak).
Keyboard Entries
Keyboard entries and combinations are indicated by bold type face within angle brackets (forexample, <Ctrl+b> means you should press the Ctrl button and b button at the same time).
1.1.2 Beginners
Before you read the rest of this manual, read Brüel & Kjær’s primer on Measuring Sound. This willgive you a basic idea of acoustic measurements. It can be found on the www.bksv.com website,by typing ‘Primer’ in the search window. The website also contains lots of other information youmight find useful.Further information is available in the online help installed on the analyzer.
1.1.3 Experienced Users of Acoustic Measurement Equipment
The manual is designed so that you do not have to read all of it to be able to use the analyzer. Itis built around the most frequently used operations, these are as follows:• Assembling your Analyzer (see Chapter 2)• Making your First Measurement (see Chapter 3)• Getting to Know Your Analyzer (see Chapter 4)• Calibration (see Chapter 5)• Data Management (see Chapter 6)• Connection to PC or Smartphone or Measurement Partner Field App (see Chapter 7)• Advanced Use of the Analyzer – Tips and Tricks (see Chapter 8)• Updating and Upgrading Applications, Maintenance and Troubleshooting (see Chapter 9)However, it is recommended that you read the entire manual for appropriate procedures on howto use the analyzer to obtain accurate sound level measurement results.

3
Chapter 2Assembling your Analyzer
This chapter describes how to assemble and set up your analyzer, including:• Necessary information concerning the analyzer’s hardware version• A diagram and brief description of the analyzer components and various input and output
connections• An overview of hardware components, showing the main configurations of the analyzer and
its accessories• Instructions on how to assemble standard and optional hardware components
2.1 Determining Your Hardware Version
Analyzer hardware is periodically updated. The most significant update was to hardwareversion 4 (G4) in 2012. To check if your analyzer uses G4 hardware, tap then About. The Aboutscreen will list the hardware and software versions currently installed.
2.1.1 What is Different with G4 Hardware?
The differences in the G4 hardware compared to previous versions include:• A brighter screen that is easier to view in direct sunlight• The CF card slot was replaced with a second SD card slot to take advantage of the SD format’s
dominance in the storage and Wi-Fi markets• The USB connector was changed from USB 1.1 Mini B to USB 2.0 Micro AB. The USB 2.0
connection speeds are faster, and the Micro USB connector is more common• A second standard USB Type A socket was added for easier connection to USB peripherals
such as Wi-Fi dongles, modems, printers, GPS receivers, and USB to RS–232 adaptors• A 100 Mbps Local Area Network (LAN) connector is available for both Types 2250 and 2270

Hand‐held Analyzer Types 2250 and 2270 – User Manual4
2.2 Analyzer Components
An overview of the main analyzer components is provided in Fig.2.1 and the text below.
Fig.2.1 Analyzer components
1
2
8
3 4
6 7
11
5
9
10
12
13
14
15
16
17
18
20
19
21
1
22
23
24

CHAPTER 2Assembling your Analyzer
5
1) Measurement Microphone: A Brüel & Kjær Prepolarized Free-field ½ Microphone. Arobust and reliable microphone with a wide frequency range.
2) Preamplifier: Used to convert the high-impedance output of the microphone to lowimpedance, suitable for driving long extension cables. The arrow points to the preamplifier’sbuilt-in windscreen sensor.
3) (Manual Event Pushbutton): Manually indicate events during a measurement. UsingBZ-7222 and BZ-7223 software you can control signal recording, and using BZ-7224 LoggingSoftware or BZ-7225 Enhanced Logging Software you can insert an Event Marker and controlrecordings. With Type 2270 this button can also be used to capture images.
✐Please note: Signal recording requires a Signal Recording Option BZ-7226 license.
4) (Commentary Pushbutton): Add recorded audio messages to your measurement files.5) , , , (Navigation Pushbuttons): These move the active screen component (Field
Selector) and navigate the user interface.6) (Back-erase Pushbutton): Erase the last 5 seconds of measurement data or insert an
Exclude Marker (BZ-7224 Logging Software or BZ-7225 Enhanced Logging Software only).7) (Accept Pushbutton): Accept changes you make to the analyzer’s setup.8) (Reset Measurement Pushbutton): Clear the current measurement from the screen.9) (Start/Pause/Continue Pushbutton): Start, pause or continue with a measurement.
10) (Status Indicator): The red, yellow or green lights, (or LEDs), referred to as the ‘TrafficLight’ either side of the Start/Pause pushbutton, indicate important states of the analyzerduring operation, that is, measurement stopped, paused or running. See Chapter 4 for furtherdetails.
11) (Save Pushbutton): Save measurement results.12) Display Screen: A high-contrast, colour, touch-sensitive screen. 13) (Main Menu Icon): Calls up the Main Menu, which allows you to navigate immediately
to all the main functions of the analyzer, such as Setup, Explorer (or Data-browser),Preferences, and Calibration.
14) (Power-on Pushbutton): Turns the analyzer on and off. If held in for 1 second, theanalyzer goes into standby mode; if held in for more than 4 seconds, it turns the analyzer off.
15) Stylus: Stored in a holder on the side of the analyzer, for use on the touch-sensitive screen.You can choose to use the stylus or the hardkeys, depending on your preference and themeasurement situation. (Also see section 4.5.5.)
16) Secondary Microphone: Add recorded comments to measurements – positioned on theunderside of the analyzer.

Hand‐held Analyzer Types 2250 and 2270 – User Manual6
17) Top Socket: The main microphone input socket for the analyzer. The measurementmicrophone and preamplifier (items 1 and 2 respectively) are normally connected directly tothis socket. For more details see section 2.3.
18) Tripod Mounting Thread: Mount the analyzer onto the tripod and/or tripod extension.19) Wrist Strap/Tripod Mounting Thread: Attach a wrist strap to the analyzer for added
security, or use it to mount the analyzer onto the tripod and/or tripod extension using TripodAdaptor UA-1673.
20) Internal Battery Pack: Rechargeable, high-capacity Li-Ion battery pack to power theanalyzer.
21) Hinged Cover FB-0679/FB-0699: A removable plastic cover, hinged at the top to provideprotection for the connector panel underneath. To remove, open the cover and pull the hingeout of the slot at the top of the connector panel. The cover includes a rubber insert printedwith an overview of the main connectors and reset button for easy recognition. Indents areprovided on the inside of the cover (behind the insert) that allow you to drill holes in theplastic cover, giving access to the main connectors underneath, so you can use the coverwhile power or other cables are connected.
22) Camera (Type 2270 only): Add images to measurements. Protected and positioned on theunderside at 45 degrees, the camera is designed to allow simultaneous image capture andnoise measurement without the need to reposition the analyzer for each task.
23) High Speed USB and LAN Interfaces: – Hardware versions 1 – 3 (G1 – 3): Available in Type 2270 only– Hardware version 4 (G4): Available in both Types 2250 and 2270Fast, seamless transfer of data, recordings and photographs back to the office. Both high-speed interfaces, USB or LAN, can be used when the analyzer is located in close proximity tothe PC. However, if the analyzer is remote from the host PC, the LAN interface has the furtheradvantage of data download from anywhere within the same LAN network. Both interfacesare not just used for data download, but also for remote monitoring and remote control.
24) G4 Mark: Indicates that the hardware is version 4. Without this mark, your hardware is anearlier version.

CHAPTER 2Assembling your Analyzer
7
2.3 Analyzer Inputs/Outputs
2.3.1 Hardware Versions 1 – 3 (G1 – 3):
Fig.2.2 Connector panel of Type 2270 G1 – 3
1) Mini USB Interface Socket: Use the supplied Mini USB Cable AO-1476 to connect.2) Earphone Socket: Use the supplied Earphones HT-0015 to connect.3) Output Socket: A triaxial LEMO connector – use the supplied LEMO to BNC cable
AO-0440-D-015 to connect.4) Trigger and Tacho Input Socket: A triaxial LEMO connector – use the supplied LEMO to
BNC cable AO-0440-D-015 to connect. For tacho probe connection, other cables may beused – see section 2.3.3 for more information.
5) Input Socket (or for Type 2270 only, Input Ch.2 Socket): A triaxial LEMO connector–depending on the transducer used, a number of cables are available for connection. Seesection 2.3.3 for more information.
6) External Power Socket: Use Mains Power Supply ZG-0426 to connect and charge batteries.7) Battery Charge Indicator: An LED that indicates when the battery pack is being charged
from external power. See section 2.3.3 for more information on the LED colour codes.
2
1
3 4 5 6
7
8
109
11
12

Hand‐held Analyzer Types 2250 and 2270 – User Manual8
8) Reset Button: Press to reset the analyzer if you have problems.9) Compact Flash Card Slot: Insert a CF memory card to save data or connect a modem (either
a CompactFlash® modem or using an CF to Serial converter).10) Secure Digital Card Slot: Insert a SD or SDHC memory card to save data.11) (Type 2270 only) Input Ch.1 Socket: A triaxial LEMO connector – depending on the
transducer used, a number of cables are available for connection. See section 2.3.3 for moreinformation.
12) (Type 2270 only) LAN Socket: Connect a LAN cable to synchronize measurement and setupdata with a host PC over a LAN.
2.3.2 Hardware Version 4 (G4):
Fig.2.3 Connector panel of Type 2270 for G4 hardware
1) Micro USB Interface Socket: Use the supplied Micro USB Cable AO-1494 to connect.2) Earphone Socket: Use the supplied Earphones HT-0015 to connect.3) Output Socket: A triaxial LEMO connector – use the supplied LEMO to BNC cable
AO-0440-D-015 to connect.
2
1
3 4 5 6
7
8
11
12
10 9

CHAPTER 2Assembling your Analyzer
9
4) Trigger and Tacho Input Socket: A triaxial LEMO connector – use the supplied LEMO toBNC cable AO-0440-D-015 to connect. For tacho probe connection, other cables may beused. See Trigger Input Socket in section 2.3.3 for more information.
5) Input Socket (or for Type 2270 only: Input Ch.2 Socket): A triaxial LEMO connector –depending on the transducer used, a number of cables are available for connection. Seesection 2.3.3 for more information.
6) External Power Socket: Use Mains Power Supply ZG-0426 to connect and charge batteries.7) Battery Charge Indicator: An LED that indicates when the battery pack is being charged
from external power. See Battery Charge Indicator in section 2.3.3 for more information onthe LED colour codes.
8) Reset Button: Press to reset the analyzer if you have problems.9) Secure Digital Card Slots Insert an SD or SDHC memory card to save data.
10) LAN Socket: Connect a LAN cable to synchronize measurement and setup data with a hostPC over a LAN.
11) USB A Socket: Connect to Wi-Fi Dongle UL-1050, printers or other external USB devices.12) (Type 2270 only) Input Ch.1 Socket: A triaxial LEMO connector – depending on the
transducer used, a number of cables are available for connection. See section 2.3.3 for moreinformation.
2.3.3 Description of Inputs and Outputs
Top Socket
See item 17 in Fig.2.1.This 10-pin LEMO connector is the main microphone input for the analyzer. MicrophoneType 4189 (including Preamplifier ZC-0032) is normally connected directly to this connector. Ifrequired, however, one of two microphone extension cables (AO-0697-D-030, 3 m, or AO-0697-D-100, 10 m), can be fitted between the input stage and the main microphone input socket toextend the distance to the desired length. For Type 2270, the microphone is connected to input Channel 1. In addition, you can use the Dual10-pole Adaptor JP-1041 for accessing both input Channel 1 and input Channel 2.
USB Interface
See item 1 in Fig.2.2 (G1 – 3 analyzers) or items 1 and 11 in Fig.2.3 (G4 analyzers).The USB Interface provides high-speed direct communication with your PC’s USB port tosynchronize measurement and setup data: • G1 – 3 analyzers: Use the supplied Mini USB Cable AO-1476• G4 analyzers: Use the supplied Micro USB Cable AO-1494
Hand‐held Analyzer Types 2250 and 2270 – User Manual10
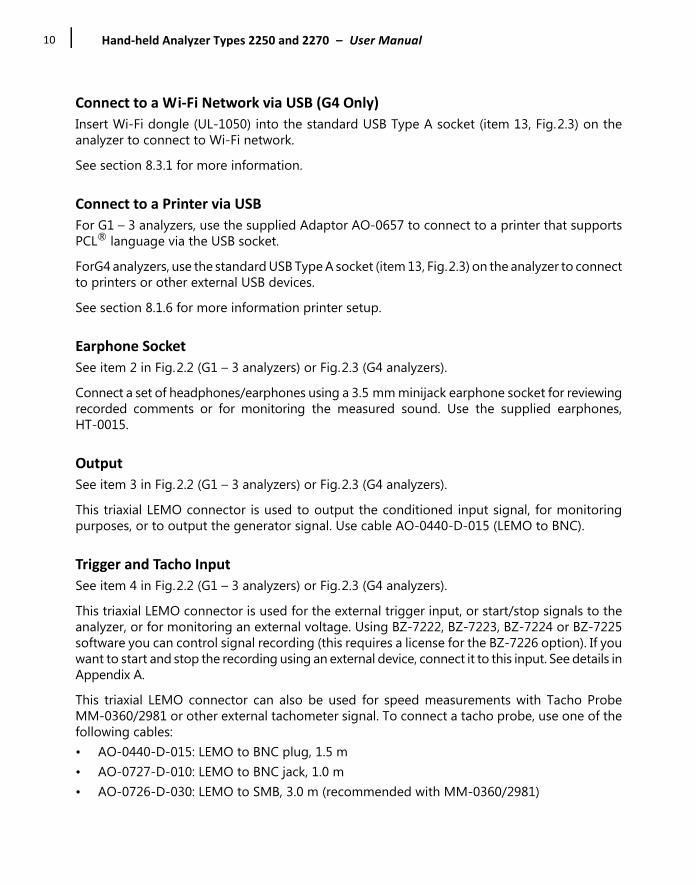
Connect to a Wi‐Fi Network via USB (G4 Only)
Insert Wi-Fi dongle (UL-1050) into the standard USB Type A socket (item 13, Fig.2.3) on theanalyzer to connect to Wi-Fi network.See section 8.3.1 for more information.
Connect to a Printer via USB
For G1 – 3 analyzers, use the supplied Adaptor AO-0657 to connect to a printer that supportsPCL® language via the USB socket.ForG4 analyzers, use the standard USB Type A socket (item 13, Fig.2.3) on the analyzer to connectto printers or other external USB devices. See section 8.1.6 for more information printer setup.
Earphone Socket
See item 2 in Fig.2.2 (G1 – 3 analyzers) or Fig.2.3 (G4 analyzers).Connect a set of headphones/earphones using a 3.5 mm minijack earphone socket for reviewingrecorded comments or for monitoring the measured sound. Use the supplied earphones,HT-0015.
Output
See item 3 in Fig.2.2 (G1 – 3 analyzers) or Fig.2.3 (G4 analyzers).This triaxial LEMO connector is used to output the conditioned input signal, for monitoringpurposes, or to output the generator signal. Use cable AO-0440-D-015 (LEMO to BNC).
Trigger and Tacho Input
See item 4 in Fig.2.2 (G1 – 3 analyzers) or Fig.2.3 (G4 analyzers).This triaxial LEMO connector is used for the external trigger input, or start/stop signals to theanalyzer, or for monitoring an external voltage. Using BZ-7222, BZ-7223, BZ-7224 or BZ-7225software you can control signal recording (this requires a license for the BZ-7226 option). If youwant to start and stop the recording using an external device, connect it to this input. See details inAppendix A.This triaxial LEMO connector can also be used for speed measurements with Tacho ProbeMM-0360/2981 or other external tachometer signal. To connect a tacho probe, use one of thefollowing cables:• AO-0440-D-015: LEMO to BNC plug, 1.5 m• AO-0727-D-010: LEMO to BNC jack, 1.0 m• AO-0726-D-030: LEMO to SMB, 3.0 m (recommended with MM-0360/2981)
CHAPTER 2Assembling your Analyzer
11
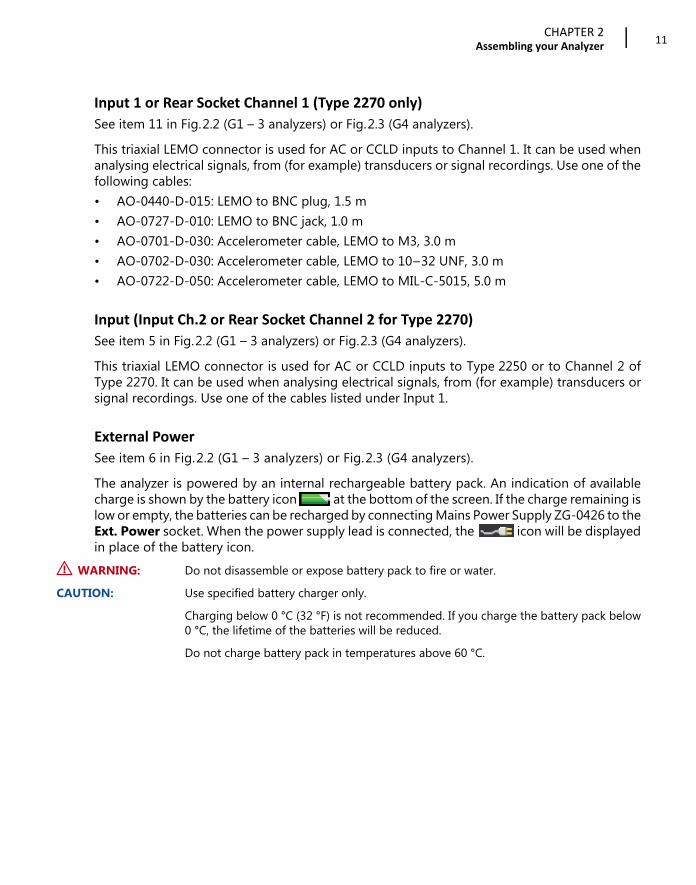
Input 1 or Rear Socket Channel 1 (Type 2270 only)
See item 11 in Fig.2.2 (G1 – 3 analyzers) or Fig.2.3 (G4 analyzers).This triaxial LEMO connector is used for AC or CCLD inputs to Channel 1. It can be used whenanalysing electrical signals, from (for example) transducers or signal recordings. Use one of thefollowing cables: • AO-0440-D-015: LEMO to BNC plug, 1.5 m• AO-0727-D-010: LEMO to BNC jack, 1.0 m• AO-0701-D-030: Accelerometer cable, LEMO to M3, 3.0 m• AO-0702-D-030: Accelerometer cable, LEMO to 10–32 UNF, 3.0 m• AO-0722-D-050: Accelerometer cable, LEMO to MIL-C-5015, 5.0 m
Input (Input Ch.2 or Rear Socket Channel 2 for Type 2270)
See item 5 in Fig.2.2 (G1 – 3 analyzers) or Fig.2.3 (G4 analyzers).This triaxial LEMO connector is used for AC or CCLD inputs to Type 2250 or to Channel 2 ofType 2270. It can be used when analysing electrical signals, from (for example) transducers orsignal recordings. Use one of the cables listed under Input 1.
External Power
See item 6 in Fig.2.2 (G1 – 3 analyzers) or Fig.2.3 (G4 analyzers).The analyzer is powered by an internal rechargeable battery pack. An indication of availablecharge is shown by the battery icon at the bottom of the screen. If the charge remaining islow or empty, the batteries can be recharged by connecting Mains Power Supply ZG-0426 to theExt. Power socket. When the power supply lead is connected, the icon will be displayedin place of the battery icon.
⚠ WARNING: Do not disassemble or expose battery pack to fire or water.CAUTION: Use specified battery charger only.
Charging below 0 °C (32 °F) is not recommended. If you charge the battery pack below0 °C, the lifetime of the batteries will be reduced.Do not charge battery pack in temperatures above 60 °C.

Hand‐held Analyzer Types 2250 and 2270 – User Manual12
Battery Charge Indicator
See item 7 in Fig.2.2 (G1 – 3 analyzers) or Fig.2.3 (G4 analyzers).A battery charge light (LED) indicates when the battery pack is being charged from externalpower: • With G1 – 3 analyzers: The LED is a steady green light when external power is applied (and the
battery is charging), and a flashing green light when charging has finished• With G4 analyzers: The LED is red when external power is applied (and the battery is charging);
green when the battery is completely charged; and blue to indicate that the unit is in stand-by and battery powered
Reset Button
See item 8 in Fig.2.2 (G1 – 3 analyzers) or Fig.2.3 (G4 analyzers).Located above the USB connector, it is used to reset the analyzer if you have problems with theanalyzer and cannot get it to operate. To reset, press the button with the point of the stylus (seechapter 9 for troubleshooting).
Slot for CompactFlash (CF) Cards (Hardware versions 1 – 3 only)
See item 9 in Fig.2.2.This slot accepts CF sized cards and can be used for memory or, for example, a modem.
Slot for Secure Digital (SD) Cards
See item 10 in Fig.2.2 (G1 – 3 analyzers) or item 9 and 10 in Fig.2.3 (G4 analyzers).The SD slots accept SD and SDHC (Secure Digital High Capacity) memory cards, and are typicallyused to save measurement data. Capacities upto 32 gigabytes are acceptable.
✐Please note: G1 – 3 analyzers have only one SD Card slot. G4 analyzers have two slots.
LAN Socket
See item 12 in Fig.2.2 (G1 – 3 analyzers) or Fig.2.3 (G4 analyzers).All G4 hardware has one LAN socket with 100 Mbit connection. With G1 – 3 analyzers, onlyType 2270 is equipped with a 10 Mbit LAN connection.The LAN Socket provides high-speed direct communication with a LAN. It is used to synchronizemeasurement and setup data with a host PC. The yellow LED on the right is on when there is a link.The green LED on the left blinks when there is activity on the LAN connection.

CHAPTER 2Assembling your Analyzer
13
2.4 Hardware Setup
Fig.2.4 Type 2250/2270 – Hardware Overview
UA -1317Microphone
Holder
UA -0801Small Tripod(or UA -0587)
4231Sound
Calibrator
HT-0015Earphones
AO -1476USB Cable, 1.8 mfor hardware v. 1 – 3
ZG -0426Mains Power Supply
ZC -0032 Microphone Preamplifier
4189/4190 Microphone
UA -1651Tripod
Extensionfor Hand-held
Analyzer
UA -0587Tripod
(or UA -0801)
AO -0697-D-030Microphone
Ext. Cable, 3 m
AO -0697-D-100Microphone Ext. Cable, 10 m
AO -0440-D-015Output Cable,
1.5 m
AO-0440-D-015Trigger Input Cable,
1.5 m
AO-1450LAN Cable, 1.5 m
AO -0440-D-015Input Cable,1.5 m
AO -0646Sound Cable,1.5 m
040031/9
UL -1009 Industrial Grade SD Memory Card for Hand-held Analyzer
2250/2270Hand-heldAnalyzer
JP-1041Dual 10-pole
Adaptor
A O -1494USB Cable, 1.8 mfor hardware v. 4
AO-1449-D-010LAN Cross-over Cable, 1 m
ZG -0444 Battery Chargerfor QB-0061
QB -0061RechargeableBattery Pack
UA -16545 extra Styli
KE -0441Protective Cover
KE -0440 Travel Bag for 2250/2270 and Accessories
FB -0699Hinged Cover for Hand-held Analyzer
UA -1673 Adaptor forStandardTripod Mount
BZ -5298Environmental Software CD incl. Utility software
DH -0696Wrist Strap
UL -1050 Wi-Fi Dongle for Hand-held Analyzer
UA-1404Outdoor
Microphone Kit UA -165090 mm Windscreen
with AutoDetect
Interface Cables:Interface cables(see list)

Hand‐held Analyzer Types 2250 and 2270 – User Manual14
2.5 Assembling the Analyzer
2.5.1 Charging the Battery for the First Time
Battery Pack QB-0061 comes charged to approximately half capacity on initial delivery. Fullycharge the battery pack before assembling the analyzer for the first time. Connect Mains PowerSupply ZG-0426 to the external power socket. It should take 8 to 10 hours.On G1 – 3 analyzers, the battery charge indicator shows a steady green light when external poweris applied (and the battery is charging), and a flashing green light when charging has finished. On G4 hardware, the light is red when the battery is charging and green when charging is finished.You can leave the analyzer with external power on, even when the battery is fully charged. Seesection 9.4.3 for more information.
2.5.2 Making Good Measurements
Using your Type 2250 or Type 2270, which fully complies with the IEC 61672–1 standard, ensuresyou always make good measurements. The analyzer should be set up using the followingrecommended assembly instructions. This is to minimize the influence of acoustical reflectionsduring measurements. All components described below are shown in Fig.2.1 and Fig.2.4.Another set of instructions is provided in section 2.5.3, for situations where you need to positionthe microphone at a distance from the analyzer, while still complying with the standard.
Placing the Measurement Microphone
The measurement microphone must be placed away from shielding, reflecting, or absorbingobjects. In a diffuse sound field, absorbing objects will reduce the measured sound levels. In a freesound field, reflecting objects can change the measured sound levels. Typically, the sound level0.5 m from a plane reflecting wall is 3 dB higher than if there was no wall.The operator of the system may be personally shielding, absorbing, and reflecting, and can be anadditional noise source. Measure downwind in dry conditions with a wind speed less than 5 m/s.The optimum position for the microphone is best found by trying different positions and observingthe resulting sound levels.
Mounting the Measurement Microphone
CAUTION: Before mounting the measurement microphone, note the following precautions:• When screwing the microphone on, do it gently to avoid damaging threads• Keep dust and foreign matter off the microphone diaphragm • Do not touch the diaphragm with anything – it is very delicate
CHAPTER 2Assembling your Analyzer
15
✔Best Practice: Once the measurement microphone and preamplifier have been assembled andconnected to your analyzer, they should normally be left connected to the analyzer.
To Connect:
1) Gently screw the microphone onto Preamplifier ZC-0032, see items 1 and 2 in Fig.2.1.2) Insert the male plug of the preamplifier into the top socket of the analyzer (see item 17 in
Fig.2.1) and push gently until it snaps into position.
To Disconnect:
To disconnect the preamplifier and microphone from the analyzer, grip the locking collar firmlyand slide back to remove the preamplifier and microphone combination.
Mounting the Windscreen
For short outdoor noise measurements (or indoor measurements exposed to air movement)mount Windscreen UA-1650 onto the microphone and preamplifier combination, making sureit snaps into place over the windscreen sensor. The sensor is built into the preamplifier, see item2 in Fig.2.1. Icons in the status field on the screen indicate whether the windscreen is detected ornot. For longer-term outdoor measurements, see Mounting the Outdoor Microphone Kit below.
Mounting the Analyzer onto the Tripod Extension Stem and Tripod
To mount the analyzer onto the Tripod Extension Stem UA-1651 and Small Tripod UA-0801:1) Screw Tripod Extension Stem UA-1651 onto the threaded stud of the ball-joint on Small
Tripod UA-0801. Secure the ball-joint roughly in a vertical position (that is, in line with thetripod) until ready to follow the instruction in step 4.
2) Screw the Extension Stem UA-1651 into the analyzer, using the threaded socket at the lowerback of the analyzer (see item 18 in Fig.2.1).
3) Set Small Tripod UA-0801 (including the analyzer) in the required position, and adjust it to therequired height. Ensure that one of the three legs is pointing roughly in the same directionas your analyzer needs to point (referred to as the front leg).
4) Position the extension stem at an angle of 45° to the horizontal and vertically in line with thefront leg of the tripod to ensure the whole setup is stable.
✐Please note: The procedure is the same if Tripod UA-0587 is used instead of Small Tripod UA-0801.
You are ready to start measuring, see Chapter 3.
Hand‐held Analyzer Types 2250 and 2270 – User Manual16
2.5.3 Alternative Measurement Method (Extended Microphone)
The measurement microphone can be placed a distance from the analyzer by connecting anextension cable and fitting the microphone to a microphone holder or to Outdoor MicrophoneKit UA-1404. The analyzer should be set up using the following assembly instructions. This is toensure that the accessories have limited acoustical influence on the analyzer duringmeasurement. All the components described below are shown in Fig.2.1 and Fig.2.4.
Mounting the Outdoor Microphone Kit
For long-term outdoor measurements, Outdoor Microphone Kit UA-1404 will be required as analternative to the windscreen. If this is the case, mount the kit onto the microphone andpreamplifier combination according to assembly and mounting instructions in the User Manualfor the Outdoor Microphone Kit, BE 1077.
Connecting a Microphone Extension Cable
The optional extension cables that are recommended for use with Type 2250/2270 are:• AO-0697-D-030 – 3 m long• AO-0697-D-100 – 10 m long
✐Please note: Connecting a recommended microphone extension cable has no acoustical effect on theanalyzer’s measurement and has no effect on calibration. However, although it is notessential to re-calibrate, it is good measurement practice to calibrate the wholemeasurement chain (including microphone extension cable) before starting ameasurement.
To connect a microphone using an extension cable:1) Gently screw the microphone onto Preamplifier ZC-0032, see items 1 and 2 in Fig.2.1.2) Insert the preamplifier into the female plug of the extension cable and push gently until it
snaps into position.3) Insert the male plug of the extension cable into the top socket of the hand-held analyzer (see
item 17 in Fig.2.1) and push gently until it snaps into position.
CHAPTER 2Assembling your Analyzer
17
Connecting Two Microphones (Type 2270 only)
To connect two microphones to a Type 2270:✐Please note: You will need Dual 10-pole Adaptor JP-1041, two extension cables (AO-0697-D-030 3 m long
or AO-0697-D-100 10 m long) and two Preamplifiers and two Microphones.
1) Gently screw the Microphones onto Preamplifiers ZC-0032, see items 1 and 2 in AnalyzerComponents (Fig.2.1).
2) Insert the preamplifiers into the female plugs of the extension cables and push gently untilinto position.
3) Insert the male plugs of the extension cables into the female plugs of the dual 10-poleadaptor and push gently until they snap into position.
✐Please note: Channel 1 is tagged CH 1 and Channel 2 is tagged CH 2 on the dual 10-pole adaptor.
4) Insert the male plug of the dual 10-pole adaptor into the top socket of Type 2270 (see item17 in Fig.2.1) and push gently until it snaps into position.
Mounting the Measurement Microphone on the Microphone Holder and Tripod
To mount the microphone and preamplifier combination onto Microphone Holder UA-1317 andSmall Tripod UA-0801:1) Set Small Tripod UA-0801 in the required position, and adjust to the required height.2) Screw Microphone Holder UA-1317 onto the threaded stud on the tripod ball-joint, and
position the holder as required.3) Push the microphone and preamplifier combination carefully into the microphone holder,
so that it grips onto the body of the microphone and preamplifier. Ensure that themicrophone cable sits properly in the plastic guide.
You are ready to start measuring, see Chapter 3.
2.5.4 Measuring for Convenience
Measurements that need to be done at short notice, with no particular accuracy can be carriedout by simply holding the analyzer or using any combination of hardware components andaccessories shown in Fig.2.4.
2.5.5 Measuring Using Accelerometers
For vibration measurements you need an accelerometer as the measurement transducer. Theaccelerometer is connected to the rear socket of the analyzer. Please refer to Chapter 3 of FFT Analysis Software User Manual BE 1778 for detailed informationabout selecting the right accelerometer and how to mount it correctly.

Hand‐held Analyzer Types 2250 and 2270 – User Manual18
19
Chapter 3Making your First Measurement
This chapter describes:• Point and shoot measurements• Basic measurements• Saving your data• Documenting the results It assumes you have just received your analyzer and are turning it on for the first time. If the analyzer has been used before, and the previous user has initiated the multi-user facility,then the screens that are displayed may not follow the sequence described below. If this is thecase, please refer to section 8.1.4.
✐Please note: A stylus is stored in a holder on the side of the analyzer, see item 15 in Fig.2.1. This can beused on the touch-sensitive screen to select icons and functions during the proceduresthat follow. Alternatively, you can use the various pushbuttons, see items 3 to 11 in Fig.2.1.
The following procedures assume that the measurement microphone and preamplifier havebeen mounted as described in Chapter 2 and the analyzer has a fully charged battery, see section2.5.1.
3.1 Point and Shoot
Using the following basic procedure you will be able to start using your hand-held analyzerimmediately to make measurements and start the familiarization process:1) Switch on by pressing and make sure the SOUND LEVEL METER project template is
selected (see section 3.2.2 for instructions).2) Check that the data path at the top of the screen displays the correct job/project, (that is,
where you want to save the new data). See section 6.1.1.3) Set Measurement Mode to Manual (and change any Setup parameters) by tapping
> Setup.4) Press the Start/Pause pushbutton , then monitor the status indicator (traffic light).5) Use the Start/Pause , Continue , Back-erase and Reset pushbuttons to control the
measurement.
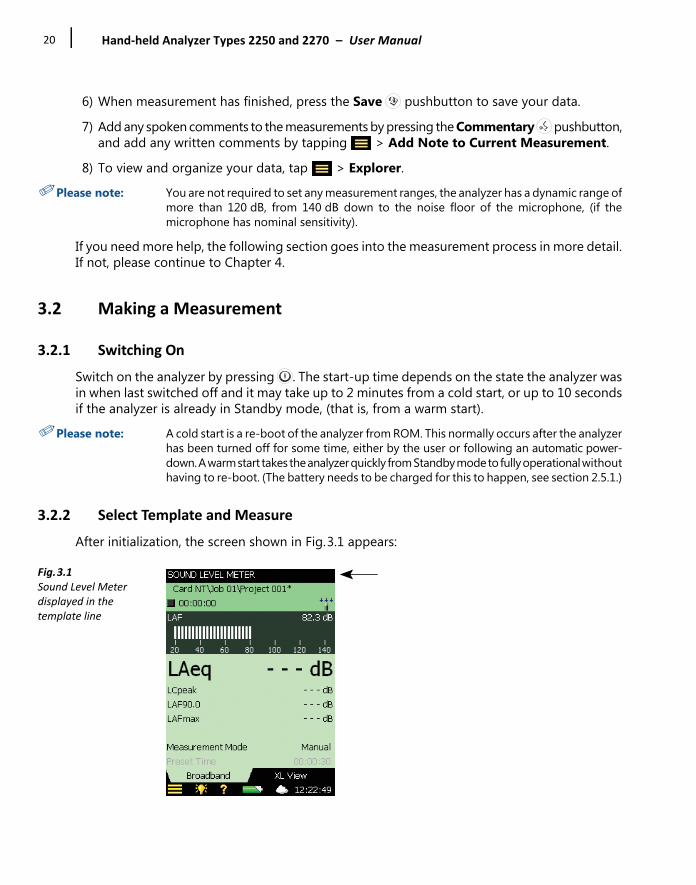
Hand‐held Analyzer Types 2250 and 2270 – User Manual20
6) When measurement has finished, press the Save pushbutton to save your data.7) Add any spoken comments to the measurements by pressing the Commentary pushbutton,
and add any written comments by tapping > Add Note to Current Measurement.8) To view and organize your data, tap > Explorer.
✐Please note: You are not required to set any measurement ranges, the analyzer has a dynamic range ofmore than 120 dB, from 140 dB down to the noise floor of the microphone, (if themicrophone has nominal sensitivity).
If you need more help, the following section goes into the measurement process in more detail.If not, please continue to Chapter 4.
3.2 Making a Measurement
3.2.1 Switching On
Switch on the analyzer by pressing . The start-up time depends on the state the analyzer wasin when last switched off and it may take up to 2 minutes from a cold start, or up to 10 secondsif the analyzer is already in Standby mode, (that is, from a warm start).
✐Please note: A cold start is a re-boot of the analyzer from ROM. This normally occurs after the analyzerhas been turned off for some time, either by the user or following an automatic power-down. A warm start takes the analyzer quickly from Standby mode to fully operational withouthaving to re-boot. (The battery needs to be charged for this to happen, see section 2.5.1.)
3.2.2 Select Template and Measure
After initialization, the screen shown in Fig.3.1 appears:
Fig.3.1Sound Level Meter displayed in the template line

CHAPTER 3Making your First Measurement
21
1) Check that the SOUND LEVEL METER project template is displayed at the top of the screen(Fig.3.1). For more information on templates, see What is a Project Template? at the end ofthis section.
Fig.3.2Changing the project template
2) Tap Measurement Mode in the View Area and set to Manual (Fig.3.3).✐Please note: The bar graph showing the sound pressure level LAF is now live, but parameters such as
LAeq are not. This is because LAF is an instantaneous value, always available for display,whereas LAeq is a measured value that needs to be averaged over a period of time.Therefore, it cannot be displayed before you have started a measurement using theStart/Pause pushbutton .
Fig.3.3Setting the measurement mode
3) Press the Start/Pause pushbutton to start the measurement.Notice the Running icon on the screen and monitor the red, yellow, green status indicatorsaround the Start/Pause pushbutton while you are measuring.

Hand‐held Analyzer Types 2250 and 2270 – User Manual22
The indicators are: – Yellow status indicator flashing every 5 s before starting the measurement – Steady green status indicator after pressing the Start/Pause pushbutton and during
the measurement (if everything is OK) – Short green flash every second means the measurement is waiting for the trigger– Yellow status indicator flashing every 5 s when you have stopped, saved the
measurement and are ready to do another measurement – Yellow status indicator flashing slowly (0.5 s on, 0.5 s off) when paused– Red status indicator flashing rapidly if you encounter an overload condition during the
measurement4) Use the Start/Pause , Continue , Back-erase and Reset pushbuttons to control the
measurement. The status field at the top of the screen will give short textual feedback on thepushbutton operation. A visual indication of measurement status is also displayed on thestatus line, by way of the Stopped icon , the Running icon and the Paused icon (Fig.3.4).
Fig.3.4Measurement feedback in the Status Field
5) Toggle between different display parameters, as required, by tapping on each parameterfield (for example LAF90.0 in Fig.3.4) with the stylus and selecting other parameters from thedrop-down lists that appear.
💡 Hint: The tabs at the bottom of the screen allow you to choose different ways of displaying themeasurement results:
– The Broadband tab shows an instantaneous LAF readout, with associated bar graph andfour measurement parameters, followed by two measurement setup parameters. (Thefirst parameter is displayed in a larger font size for better readability (Fig.3.4))
– The XL View tab increases the size of the first parameter readout to a four-digit, full-screendisplay (including decimal point)

CHAPTER 3Making your First Measurement
23
6) Set Measurement Mode to Automatic and choose a preset time for your measurement. Thenrepeat steps 3 and 4. The measurement will automatically pause after the preset time. Thisallows you to either save your measurement or continue measuring, as required.
7) Tap > Setup (Fig.3.5).
Fig.3.5Main Menu options
Change the broadband weighting parameters by tapping on the next to FrequencySettings, then on the weighting parameter field on the right side of the screen. A weightingdrop-down menu will appear (Fig.3.6). Change the parameters as required.
Fig.3.6Changing the broadband frequency settings
8) Return to the bar graph screen of the SOUND LEVEL METER template by tapping , and youare ready to make a new measurement.

Hand‐held Analyzer Types 2250 and 2270 – User Manual24
What is a Project Template?
A project template contains all the common display settings and measurement setups requiredto perform a noise measurement. The template does not contain any measurement data – thesedata are saved as individual projects, stored in job folders, see section 6.1.1. The project templatescovered by this manual are:• Sound Level Meter (included in BZ-7222 software)• Frequency Analysis (included in BZ-7223 software)• Logging (included in BZ-7224 software)• Enhanced Logging (included in BZ-7225 software)• Reverberation Time (included in BZ-7227 software)
✐Please note: • Signal Recording Option BZ-7226 does not contain a specific template – signal recording options are available in all templates.
• Tone Assessment Option BZ-7231 does not contain a specific template – tone assessment options are available in all templates included in BZ-7223/24/25/30.
• Enhanced Vibration and Low Frequency Option BZ-7234 works with all the templates included in BZ-7222/23/24/25
• 2-channel Option BZ-7229 (for Type 2270) enables 2-channel operation for all 2-channel templates included in BZ-7222/23/24/25/28 and for Signal Recording Option BZ-7226 and Enhanced Vibration and Low Frequency Option BZ-7234.
If you make any changes to the settings in a project template, ‘*’ will appear next to the templatename to indicate that the new settings have not been saved. To save the template, tap the template name at the top of the display to open the TemplateExplorer (or tap Main Menu ) and tap Save .
3.3 Save your Measurement
When you have completed your measurement, you need to save it. By default the analyzercreates a project called Project 001. (Subsequent measurements will be labelled Project 002,Project 003, etc. This will happen each time you have saved a measurement*.) Check that the data path at the top of the screen displays Project 001* and save your measurementby pressing the Save pushbutton . For more details, see section 6.1.
✐Please note: An asterisk will appear alongside the project at the top of the status field as soon as youstart your measurement (Fig.3.7). This signifies that the measurement has not been saved.It will disappear once you have saved the measurement.
* If you are using Reverberation Time Software BZ-7227, please note that there are more measurements stored in Reverberation Time projects than Sound Level Meter, Frequency Analyzer or Logging projects, which all contain one measurement within each project. See Chapter 14 for more information on BZ-7727.

CHAPTER 3Making your First Measurement
25
Fig.3.7Saving your measurement
3.3.1 Viewing the Saved Measurement
To view the saved measurement: 1) Tap the project name or > Explorer.2) Tap the name of your measurement (Project 001, in this case) and then tap Open (Fig.3.8).
Alternatively, tap the icon to the left of the project name to open and view.
Fig.3.8Viewing your measurement in Explorer
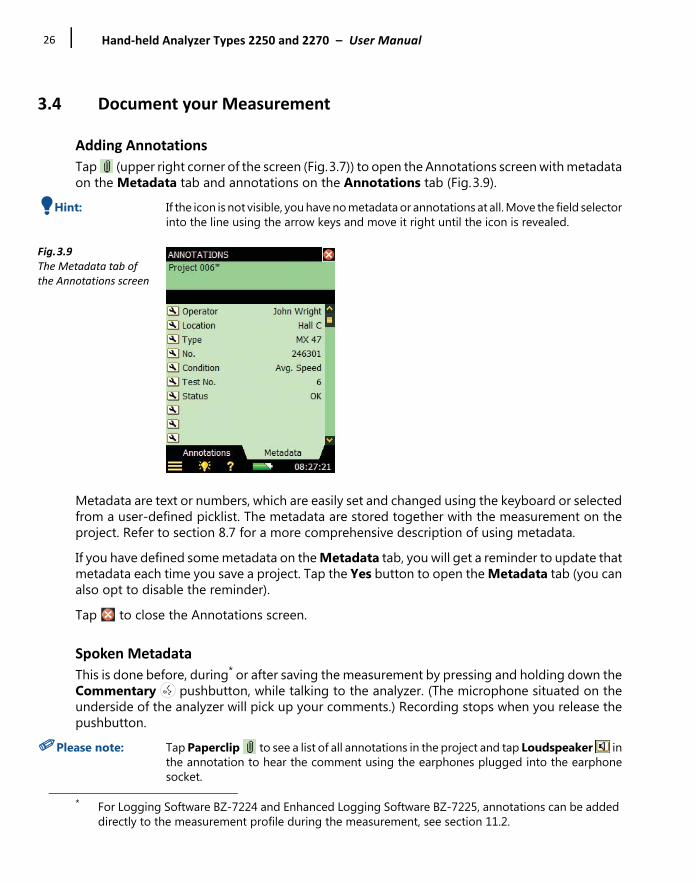
Hand‐held Analyzer Types 2250 and 2270 – User Manual26
3.4 Document your Measurement
Adding Annotations
Tap (upper right corner of the screen (Fig.3.7)) to open the Annotations screen with metadataon the Metadata tab and annotations on the Annotations tab (Fig.3.9).
💡 Hint: If the icon is not visible, you have no metadata or annotations at all. Move the field selectorinto the line using the arrow keys and move it right until the icon is revealed.
Fig.3.9The Metadata tab of the Annotations screen
Metadata are text or numbers, which are easily set and changed using the keyboard or selectedfrom a user-defined picklist. The metadata are stored together with the measurement on theproject. Refer to section 8.7 for a more comprehensive description of using metadata.If you have defined some metadata on the Metadata tab, you will get a reminder to update thatmetadata each time you save a project. Tap the Yes button to open the Metadata tab (you canalso opt to disable the reminder).Tap to close the Annotations screen.
Spoken Metadata
This is done before, during* or after saving the measurement by pressing and holding down theCommentary pushbutton, while talking to the analyzer. (The microphone situated on theunderside of the analyzer will pick up your comments.) Recording stops when you release thepushbutton.
✐Please note: Tap Paperclip to see a list of all annotations in the project and tap Loudspeaker inthe annotation to hear the comment using the earphones plugged into the earphonesocket.
* For Logging Software BZ-7224 and Enhanced Logging Software BZ-7225, annotations can be added directly to the measurement profile during the measurement, see section 11.2.

CHAPTER 3Making your First Measurement
27
Text Metadata
This is done before, during or after saving the measurement by tapping > Add Note toCurrent Measurement A blank Notes screen will appear, where you can make written commentsabout the measurement, using the standard full character keyboard that appears at the bottomof the Notes screen. See the example in Fig.3.10.Tap Paperclip to see a list of all annotations in the project and tap Text in the annotationto view the comment.
Fig.3.10Example of a written annotation that is attached to a measurement
GPS Metadata
This can also be done before, during or after saving the measurement by tapping > Add GPSNote to Cur. Measurement. If a GPS receiver is connected (via USB) when you press the Save pushbutton, then the GPSnote is automatically created with the position. Remove the GPS receiver after usage to savepower.
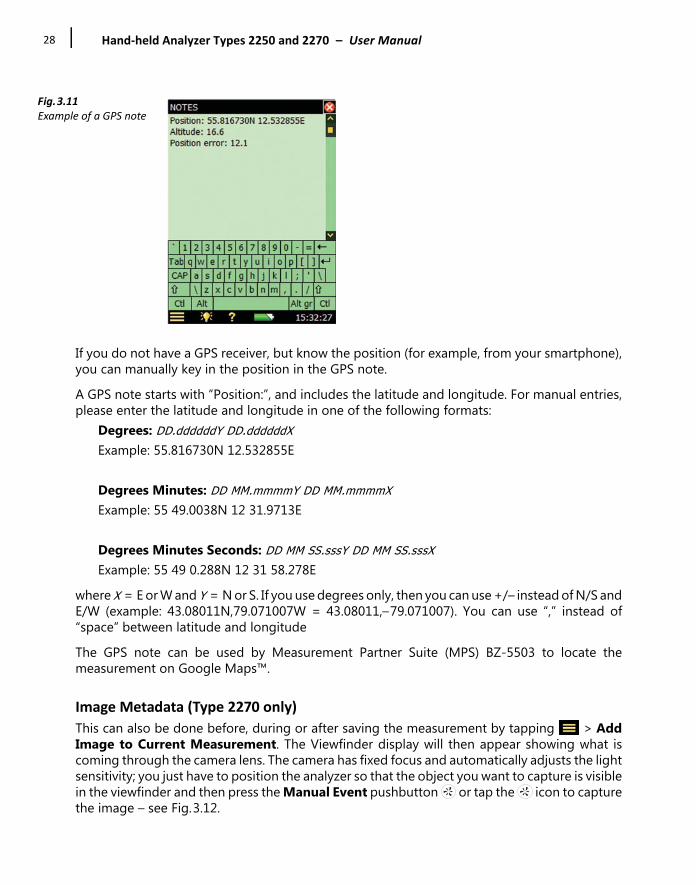
Hand‐held Analyzer Types 2250 and 2270 – User Manual28
Fig.3.11Example of a GPS note
If you do not have a GPS receiver, but know the position (for example, from your smartphone),you can manually key in the position in the GPS note.A GPS note starts with “Position:”, and includes the latitude and longitude. For manual entries,please enter the latitude and longitude in one of the following formats:
Degrees: DD.ddddddY DD.ddddddX Example: 55.816730N 12.532855E
Degrees Minutes: DD MM.mmmmY DD MM.mmmmX Example: 55 49.0038N 12 31.9713E
Degrees Minutes Seconds: DD MM SS.sssY DD MM SS.sssX
Example: 55 49 0.288N 12 31 58.278Ewhere X = E or W and Y = N or S. If you use degrees only, then you can use +/– instead of N/S andE/W (example: 43.08011N,79.071007W = 43.08011,–79.071007). You can use “,” instead of“space” between latitude and longitudeThe GPS note can be used by Measurement Partner Suite (MPS) BZ-5503 to locate themeasurement on Google Maps™.
Image Metadata (Type 2270 only)
This can also be done before, during or after saving the measurement by tapping > AddImage to Current Measurement. The Viewfinder display will then appear showing what iscoming through the camera lens. The camera has fixed focus and automatically adjusts the lightsensitivity; you just have to position the analyzer so that the object you want to capture is visiblein the viewfinder and then press the Manual Event pushbutton or tap the icon to capturethe image – see Fig.3.12.

CHAPTER 3Making your First Measurement
29
Fig.3.12Viewfinder
When captured, the image is presented as a still picture and you can save the captured image bypressing the Save pushbutton (or by closing the Images view), or you can reject the image bypressing the Back-erase pushbutton.
Fig.3.13Viewfinder
✐Please note: When finished, tap the icon to return to the Measurement screen. Tap Paperclip tosee a list of all annotations in the project and tap the Camera icon in the annotation toview the image.

Hand‐held Analyzer Types 2250 and 2270 – User Manual30
3.4.1 Annotation Tutorial
To become more familiar with this process, try the following:1) Make a new measurement (see section 3.1, if unsure).2) Tap Paperclip and define or select metadata.3) Make a short written comment and attach it to the new measurement (as previously
described).4) Make a short spoken comment (as previously described).5) Make an image (as previously described – for Type 2270 only).6) Tap Paperclip and check that you have three annotations – select one of them to see/hear
the annotation.
3.5 Switching Off
Switch the analyzer off by pressing . If held in for 1 second, the analyzer goes into standbymode; if held in for more than 4 seconds, it switches the analyzer off.The analyzer will automatically switch off when it has been in standby mode without external powerfor more than 30 hours.

31
Chapter 4Getting to Know Your Analyzer
This chapter describes the basic features and functions of your analyzer, including:• What a sound level meter (SLM) is• What the hand-held analyzer can do• How to get help• What is Measurement Partner Suite (MPS)• How to navigate through the user interface
4.1 What is a Sound Level Meter?
An SLM is an instrument that is designed to measure sound levels in a standardized way. An SLMcomprises a microphone, a preamplifier, a main processor and a read-out unit. The microphoneconverts the sound signal into an equivalent electric signal. The electric signal that themicrophone creates is at a very low level, so it is made stronger with the help of a preamplifierbefore it is processed by the main processor.Processing includes applying frequency and time weightings to the signal as specified byinternational standards, such as IEC 61672–1, to which the analyzer conforms.Frequency weighting adjusts how the SLM responds to different sound frequencies. This isnecessary because the human ear’s sensitivity to sound varies according to the sound’sfrequency. The most commonly used frequency weighting is A-weighting, which adjusts a signalin a way that best resembles the human ear’s response at medium-range levels. A-weighting isrequired for nearly all environmental and workplace noise measurements, and is specified ininternational and national standards and guidelines. All of the analyzer’s measurementparameters apply A- or B-weighting and a choice of C- or Z-weighting, except for themeasurement of peak levels where a single weighting (typically ‘C’) is applied. In this case, C-weighting is used to take into account the energy present at low frequencies even when they arenot particularly annoying.Time weighting specifies how the SLM reacts to changes in sound pressure. It is an exponentialaveraging of the fluctuating signal, providing an easy-to-read value. The analyzer applies Fast,Slow and Impulse (or ‘F’, ‘S’ and ‘I’) time weightings, which are the required weightings accordingto the vast majority of international and national standards and guidelines.
Hand‐held Analyzer Types 2250 and 2270 – User Manual32
The signal is processed through the weighting filters, and the resulting sound pressure level isdisplayed in decibels (dB) referenced to 20 µPa on the analyzer’s screen. The sound pressure levelvalues are updated at least once per second.Assessing a fluctuating noise level means getting a value for a level that is, in simple terms, theaverage level. The ‘equivalent continuous sound level’, Leq, is known around the world as theessential averaged parameter. Leq is the level that, had it been a steady level during themeasurement period, would represent the amount of energy present in the measured,fluctuating sound pressure level. It is a measure of the averaged energy in a varying sound level.It is not a direct measure of annoyance, though extensive research has shown that Leq correlateswell with annoyance.Leq is measured directly with any SLM. If an A-weighting filter is used, it is expressed as LAeq: themeasurement of the equivalent continuous sound level using the A-weighted filter network.A full range of measurement parameters is given in Appendix B.
4.2 What is the Hand‐held Analyzer?
The hand-held analyzer is a versatile hardware platform suitable for covering a wide range ofdifferent applications. Together with Sound Level Meter Software BZ-7222, it is a Class 1 modularprecision integrating-averaging sound level analyzer with an easy-to-use interface for quick andsimple measurement setups. This highly versatile hand-held analyzer platform includes a range of optional software modules,that are enabled through easily activated software license keys. The combination of softwaremodules and innovative hardware makes the analyzer a dedicated solution for performing allyour high-precision measurement tasks. The following sections are optional software modulescovered in this manual.
4.2.1 Sound Level Meter Software Module BZ‐7222
Sound Level Meter Software BZ-7222 allows you to measure a comprehensive set ofparameters used for rating noise in terms of its impact on the environmental and workingenvironments and on occupational noise evaluation.The more commonly used parameters for sound measurements, which cover a large range ofapplications, are either instantaneous measured parameters (available at any time) or timedmeasured parameters (measured within a controlled time interval):

CHAPTER 4Getting to Know Your Analyzer
33
Timed Measured Parameters
• Equivalent Continuous Sound Levels (Leq – example: LAeq)• Moving (or sliding) Equivalent Continuous Sound Levels (example: LAeq,T,mov and
LAeq,T,mov,max)• Peak Sound Levels (Lpeak – example: LCpeak)• Time for Peak Sound Level (example: TCpeak)• Maximum Time-weighted Sound Levels (Lmax – example: LAFmax)• Minimum Time-weighted Sound Levels (Lmin – example: LAFmin)• Percentile Levels (LN – example: LAF90.0)• Sound Exposure Level (example: LAE)• Sound Exposure (example: E)• Daily Noise Exposure Levels (example: Lep,d or LEX,8h)• Noise Dose (example: based on ISO standards: Dose, based on US standards: DoseS5)• Number of Peaks (example: #CPeaks(>140 dB))• Time Weighted Average (example: TWA)• Level Average with Exchange Rates 4, 5 or 6 (example: LavS5)• Weather data (requires a weather station connected)• GPS data (requires a GPS device connected)
Instantaneous Measured Parameters
• Instantaneous Time-weighted Sound Levels (Lp – example: LAF)• Sound Pressure Levels (max levels once per second – example: LAF(SPL)• Instantaneous Peak Sound Levels (example: LCpeak,1s)• Instantaneous Weather data (requires a weather station connected)• Instantaneous GPS data (requires a GPS device connected)If you measure the acceleration signal from an accelerometer, then the most common usedparameters are:
Timed Measured Parameters
• Average (example: Linear)• Peak (example: Peak)• Time for Peak (example: Tpeak)• Maximum Time-weighted parameters (example: Fast max)• Minimum Time-weighted parameters (example: Slow min)• GPS data (requires a GPS device connected)

Hand‐held Analyzer Types 2250 and 2270 – User Manual34
Instantaneous Measured Parameters
• Instantaneous Time-weighted parameters (example: Fast Inst)• Instantaneous GPS data (requires a GPS device connected)The acceleration parameters can be displayed in either Engineering units (m/s2) or in dB.
✐Please note: See Appendix B for a comprehensive list of all parameters.
Sound Level Meter Software BZ-7222 incorporates a simple user interface that is easy to learn anduses intuitive data storage and recall. Comprehensive security features mean no loss of data, evenon accidental power-off. Smart features are built-in for field use, for example, allowing you topersonalize your measurements. Sound Level Meter Software BZ-7222 also providesconnectivity between your PC and other sound analysis software.
4.2.2 Frequency Analysis Software Module BZ‐7223
This software module allows real-time frequency measurements in 1/1- and 1/3-octave bands,making it a simple matter to, for example, select suitable hearing protection, qualify noise fromheat and ventilation systems and assess tonality.
4.2.3 Logging Software Module BZ‐7224
This software module allows logging of broadband and spectral data* to obtain a time history forlater analysis, for example, for use in environmental noise as well as workplace noise assessment.It allows free selection of up to 10 parameters to log at periods from 1 s to 24 h. Results are loggeddirectly to the SD memory card (or CF card if using hardware versions 1 – 3).
4.2.4 Enhanced Logging Software Module BZ‐7225
This software module is optimized for long-term monitoring. It has the functionality of theLogging and Frequency Analysis software, and in addition it can measure continuously, save datain manageable portions (every 24 hours), make periodic reports (that is, every hour) and measureLdn and Lden, etc.
4.2.5 Signal Recording Option BZ‐7226
This option allows recording of the input signal (typically sound) in either 16-bit or 24-bitresolution during measurement. The signal recording can be controlled manually or by using anexternal trigger signal. The recording can also be triggered when a measured parameter exceedsa preset level (BZ-7224 and BZ-7225 only). The recorded signal can be played back and listenedto using the supplied Earphones HT-0015. The signal is recorded directly to the SD memory card(or CF card if using G1 – 3 analyzers).
* Requires Frequency Analysis Software BZ-7223

CHAPTER 4Getting to Know Your Analyzer
35
4.2.6 Reverberation Time Software BZ‐7227
This software module allows measurement of reverberation time using Impulsive excitation andbackwards integration of the impulse, or using Interrupted Noise from the built-in noise generator.Measurements can be made in a number of positions in the room and the average reverberationtime for the room is calculated.
4.2.7 2‐channel Option BZ‐7229 (Type 2270 only)
This option allows a number of software modules to measure two channels simultaneously: • Sound Level Meter BZ-7222, Frequency Analysis BZ-7223, Logging BZ-7224, Enhanced
Logging BZ-7225 and Building Acoustics Software BZ-7228 modules• Signal Recording Option BZ-7226 will be able to record in both channels of a two channel
measurement
4.2.8 Tone Assessment Option BZ‐7231
This option allows the assessment of tones on site, according to selected methods. The optiondescribed in this manual is based on the 1/3-octave method. (Please refer to User ManualBE 1778 for detailed information about tone assessment based on FFT spectra.) When used withBZ-7223 Frequency Analysis, BZ-7224 Logging and BZ-7225 Enhanced logging, it allows you toassess tones in a measured 1/3-octave spectrum according to ISO 1996:2007, Annex D, or, assesstones in a measured 1/3-octave spectrum according to Italian Law, “Ministero dell’ambiente,Decreto 16 marzo 1998”.
4.2.9 Enhanced Vibration and Low Frequency Option BZ‐7234
This option enables:• Measurements down to 0.4 Hz using Brüel & Kjær low-frequency microphones and adds
G-weighting parameters in accordance with ISO 7196:1995• Measurements of human vibration parameters using Brüel & Kjær low-level accelerometers
in accordance with ISO 2631–1:1999, ISO 2631–2:2003, ISO 2631–4:2001, ISO 5349–1:2001, ISO 8041:2005, DIN 45669–1:2010–09 and DIN 4150-2:1999–06
• Measurements of acceleration, velocity and displacement by integrating the time domain acceleration signal
• Peak-Peak value• 1/3-octave frequency analysis down to 0.8 Hz (1/1-octave down to 1 Hz)This option can be used together with Sound Level Meter BZ-7222, Frequency Analyzer BZ-7223,Logging BZ-7224 and Enhanced Logging BZ-7225 software modules and the 2-channel OptionBZ-7229.

Hand‐held Analyzer Types 2250 and 2270 – User Manual36
4.3 Built‐in Help
If you need more detailed information at any time during operation, tap the Help icon on theanalyzer’s screen. The resulting screen will explain that particular item in much more detail. Youcan scroll up and down the explanatory text using either the and pushbuttons, or the scrollbar on the screen. Return to the normal display screen by tapping .If you need to view any of the previous 10 screens you have visited in the help system, tap the icon at the top of the display.
4.3.1 Software and Hardware Versions
Once in the help system, you can access the list of installed software versions and licenses,together with information about the hardware. This information is always available and is accessedby selecting About from the top of the display.
4.4 What is Measurement Partner Suite BZ‐5503?
Measurement Partner Suite BZ-5503 comes standard with your hand-held analyzer and providesdata archive, preview and export capabilities as well as software maintenance and remote onlinedisplay. In addition to the included standard configuration, valuable data analysis and post-processing functionality is available in an expanding suite of optional application modules.The software enables you to do the following:• Setup or control the analyzer from a PC• Retrieve data from the analyzer• Manage and archive data from the analyzer• Manage archives in Measurement Partner (MP) Cloud• Merge MP Field App annotations with the corresponding analyzer in the project• View data in archives• Update the software in the analyzer• Install licenses for use of software modules in the analyzer• Remotely view online displays• Post-process data (optional)• Export to other post-processing and documentation tools like Evaluator™ Type 7820 or
Microsoft® Excel® or WordMeasurement Partner Suite BZ-5503 is supplied on the Environmental Software DVD (BZ-5298),which is included with your analyzer.
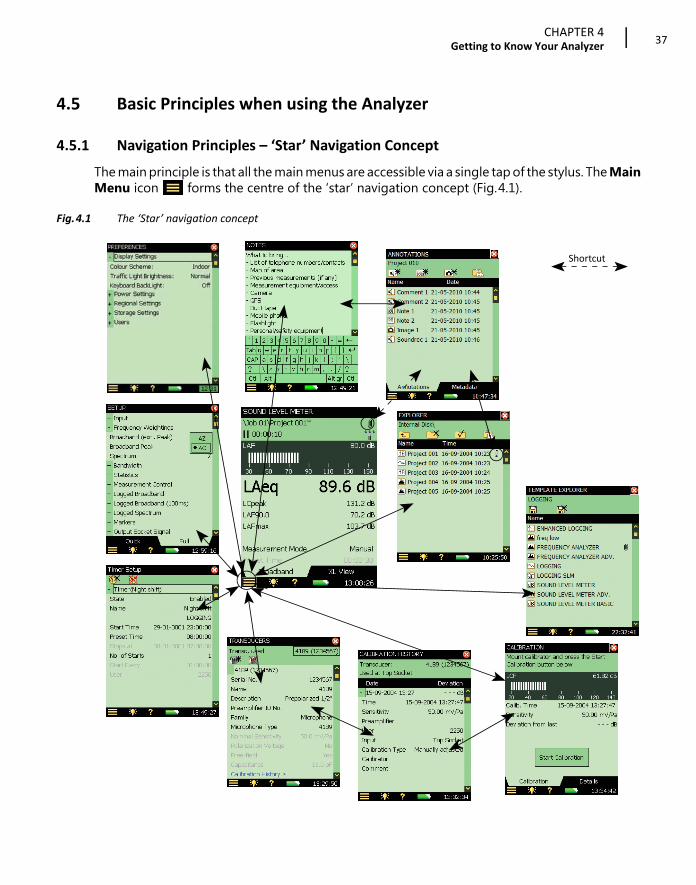
CHAPTER 4Getting to Know Your Analyzer
37
4.5 Basic Principles when using the Analyzer
4.5.1 Navigation Principles – ‘Star’ Navigation Concept
The main principle is that all the main menus are accessible via a single tap of the stylus. The MainMenu icon forms the centre of the ‘star’ navigation concept (Fig.4.1).
Fig.4.1 The ‘Star’ navigation concept
Shortcut

Hand‐held Analyzer Types 2250 and 2270 – User Manual38
This configuration gives you immediate access to screens you need most, that is, those you willneed to perform, save and document your measurements. Tapping allows you to navigate to:
In addition, tapping also allows you to perform the following actions:• Lock Keys and Screen• Log Off
Explorer
The Explorer screen is accessed by tapping > Explorer or by tapping the project name andgives you access to the analyzer’s Data/Project Manager. This allows you to view the overallproject structure, including job folders and projects, and to view all the individual measurements.When you have finished, tap to return to the Measurement screen.You can tap any measurement file to open the saved measurement and if there are any voice textor image annotations attached, these can be viewed by tapping Paperclip , visible next to allmeasurement files with attachments. When you have finished reading, listening or viewing theattachments, tap to return to the Explorer screen.
Setup
Tap > Setup to access the various setup parameters, such as frequency weightings, controlof the measurement, bandwidth, statistics and the type of input currently connected. You canchange these as required, see section 4.5.6. The Full tab at the bottom of the screen allows you to view the complete list of setup parameters,while the Quick tab allows you to access the more frequently used parameters defined byyourself. When you have finished viewing or updating the parameters, tap to return to theMeasurement screen.Changes made to the setup will only be applied temporarily, that is, until you select anotherproject template or open another project to reuse the setup from that project. However, to savesetup changes in the current template, tap > Template Explorer then the Save icon .
💡 Hint: If you make changes to the setup that you do not want to keep (and you have not yet savedthe template), you can undo them by selecting the template again from the ProjectTemplate Bar at the top of the screen.
Preferences
Tap > Preferences to access the analyzer’s preferences (if Multi User is disabled) or yourown preferences (if Multi User is enabled). These include things such as regional settings,appearance of the screen, power management, user profiles and language. You can change
• Explorer • Add Note to Current Measurement• Setup • Add Image to Current Measurement
(Type 2270 only)• Preferences• Transducers • Template Explorer• Calibration • Timer Setup

CHAPTER 4Getting to Know Your Analyzer
39
these as required, see section 4.5.6. For more information, refer to section 8.1. When you havefinished viewing or updating the parameters, tap to return to the Measurement screen.
Transducers
Tap > Transducers to access the Transducers screen. You can view/set which transducer isconnected to the analyzer and add new ones if required. Details can be changed for existingtransducers or entered for new ones, see section 4.5.6. When you have finished viewing orupdating the details, tap to return to the Measurement screen.When a transducer is selected, you can tap the Calibration History link at the bottom of thetransducer details and open the Calibration History screen (Fig.4.1). This screen includes thecalibration history for the transducer (that is, microphone) that is currently selected. When youhave finished viewing or updating the details, tap to return to the Transducers screen.
Calibration
Tap > Calibration to access the analyzer’s calibration procedure. To calibrate the analyzer,follow the instructions in the Status Field. For more information refer to section 5.2. When you havefinished calibrating or viewing the details, tap to return to the Measurement screen.The Calibration tab at the bottom of the Calibration screen allows you to perform and monitorthe calibration, while the Details tab allows you to view the details of the calibration and thecalibrator that are being used to calibrate the analyzer. While you are viewing the Details tab, youcan tap the Calibration History link at the bottom of the calibration details and open the CalibrationHistory screen (Fig.4.1). This screen includes the calibration history for the currently selectedtransducer, tap to return to the Calibration screen.
Add Note to Current Measurement
Tap > Add Note to Current Measurement to access the Notes screen. This screen allowsyou to create a text annotation that you can attach to your measurement. Text is inserted usinga character keyboard, similar to the one covered in section 4.5.6. When you have finished, tap to return to the Measurement screen.
Add Image to Current Measurement (Type 2270 only)
Tap > Add Image to Current Measurement to access the Images screen with a viewfinder.This screen allows you to capture an image that you can attach to your measurement – seeChapter 3. When you have finished, tap to return to the Measurement screen.
Template Explorer
Tap > Template Explorer to access the Template Explorer and manage your projecttemplates. When you have finished, tap to return to the Measurement screen.

Hand‐held Analyzer Types 2250 and 2270 – User Manual40
Timer Setup
Tap > Timer Setup to set up and control the analyzer via one or more of the analyzer’stimers. The purpose of a timer is to initiate measurements in the absence of an operator. Whenyou have finished, tap to return to the Measurement screen.
4.5.2 The Display Screen
During normal operation, you will use the Display screen to view your measurements and carryout a variety of functions, which are described in the following sections.
CAUTION: The touch-sensitive screen is susceptible to damage from sharp objects, such as pencils,fingernails, etc. We, therefore, recommend you use the provided stylus. See also section4.5.5.
A typical screen is shown in Fig.4.2.
Fig.4.2Typical screen when making a measurement
The main areas, starting at the top of the screen, are:• Project Template Bar• Status Field• View Area (with view tabs)• Shortcut Bar
Project Template Bar
This bar displays the name of the project template, which contains all the screen settings andmeasurement setup for the current project. Tap the text to open the Template Explorer screencontaining all the available templates. If you make any changes to the setup in a template, ‘*’ willappear next to the template name to indicate that the new settings have not been saved. TapSave in the Template Explorer to save the settings in the current template.
Project Template Bar
View Area
Shortcut Bar with icons
Status Field
View tabs

CHAPTER 4Getting to Know Your Analyzer
41
Status Field
The area just below the Project Template Bar is called the Status Field. Depending on thetemplate, this field displays status information using up to three lines of text, as follows:
First Line
• Path and name of the current project (see section 6.1.1). Tap it to open the Explorer. To change the path, navigate to the desired job (path) and tap the icon to save this path as the default measurement path. As in the project template, ‘*’ will appear next to the project name to indicate that the project has not been saved. Press the Save pushbutton if you want to save the measurement or changed settings.
• Smiley (if applicable)• PC – connected to Measurement Partner Suite BZ-5503 via USB or a network connection• LAN – connected to a network through an Ethernet cable• Wi-Fi – connected to a network via Wi-Fi. indicates a lost connection• Commentary – spoken commentary is being recorded, together with an indication of the
available recording time• Recording – measurement signal is being recorded• Paperclip – an annotation is attached to the project. Tap the icon to go to the
Annotations screen
Second Line
• Measurement state represented as icons: Stopped , Running and Paused • Elapsed time of the measurement• Feedback on the action of pressing the following pushbuttons: Reset , Back-erase ,
Start/Pause and Save • Indication that the measurement microphone is uncalibrated. In this case the word Uncal.
appears in the Status Field• Six icons are used to represent whether or not and accelerometer or microphone is used,
weather a windscreen is fitted and whether you are measuring in a free or diffuse field:For Type 2270, two icons are displayed – one for Ch. 1 and one for Ch. 2. If only one channelis used, then no icon is displayed for the unused channel– Accelerometer – an accelerometer is selected as input– Input Socket – direct input is selected– – no windscreen fitted, measuring in a free field– – no windscreen fitted, measuring in a diffuse field– – windscreen fitted, measuring in a free field– – windscreen fitted, measuring in a diffuse field
• Immediate textual feedback on overload/underrange situation and latched overload indicated with Overload

Hand‐held Analyzer Types 2250 and 2270 – User Manual42
Third Line
• Used for Logging and Enhanced Logging, see section 11.3.1, or used for Reverberation Time, see section 14.3.1
View Area
The View Area contains the screens required for a particular measurement, such as bar graphs,result readouts and various frequently used setup parameters (for example, Meas. mode). Thetemplate defines the content of this area. More than one screen can be used for displaying theinformation. Select the screen using the view tabs at the bottom of the View Area.Changes made to the screens will only be applied temporarily, that is, until you select anotherproject template or open another project to re-use the screen from that project. However, if youwant the screen changes to be saved in the current template, tap the Project Template Bar at thetop of the screen to open the Template Explorer and tap Save .
💡 Hint: If you make changes to the screen that you do not want to keep (and you have not yetsaved the template), you can undo them by selecting the template again from the ProjectTemplate Bar at the top of the screen.
Shortcut Bar
The Shortcut Bar, at the bottom of the screen, displays a number of fixed icons that are alwaysaccessible. These include:• Main Menu – accesses the Main Menu. This allows you to navigate to a specific function,
see description earlier under Navigation Principles• Backlight – select a backlight level• Help – get context-sensitive help from any screen by tapping on the icon at the bottom.
Closing the Help screen will return you to the previous screen• Battery/Power Status – shows the battery condition. All green shows a fully charged
battery, red indicates low power levels. Tap the icon to get more details of the battery condition. (When the power supply lead is connected, will be displayed in place of Battery/Power Status .)
• Cloud – displays Cloud connection status: – logged out; – logged in; – uploading; – upload paused; – not connected. Tap to open the MP Cloud
parameters on the Preferences screen (section 6.4.2)The clock in the lower right corner displays the current time. Tap the readout to get details of thetime and date, or to set the clock.

CHAPTER 4Getting to Know Your Analyzer
43
4.5.3 Use of Pushbuttons for Controlling Measurements
The design of the analyzer is such that the layout of the pushbuttons has been optimized forsingle-handed operation.
Reset Measurement Pushbutton
Use the Reset pushbutton to reset a measurement; that is, to reset all detectors, averagers,maximum and minimum hold, etc. If the measurement is paused (Paused is displayed in thestatus field), then the measurement reverts to a stopped state after a reset, (Stopped isdisplayed with a zeroed readout). If the measurement is running, then the measurement will beautomatically restarted after the reset.
Start/Pause Pushbutton
Use the Start/Pause pushbutton for controlling the measurement. The function of this keydepends on the current measurement state (Table 4.1).
Save Pushbutton
Use the Save pushbutton to save the measurement data together with the current projecttemplate (including all the screen settings and setup information) and the calibrationdocumentation.Pressing Save will affect the pause and running states. In both cases the measurement state willbe ‘stopped’ shortly after pressing the pushbutton (Stopped icon displayed).
Back‐erase Pushbutton
For BZ‐7222 and BZ‐7223 Software
Use the Back-erase pushbutton to erase the last 5 seconds completely from the measurement.(This includes, of course, overload indications you would like to erase.)If used when the current measurement is running, then the measurement will be paused. TheStatus Field displays Pause, Back-erase briefly, and then displays the shortened elapsed time alongwith the Paused icon .
For BZ‐7224 and BZ‐7225 Software
Pressing the Back-erase pushbutton will start drawing an Exclude Marker on the display, seesection 11.3.2. Pressing it again will stop drawing the marker on the display (toggle function).
Table 4.1Start/Pause pushbutton functions
Current Measurement State
Function of Start/Pause Pushbutton
Next Measurement State
Stopped Start the measurement Running Running Pause the measurement Paused Paused Continue the measurement Running

Hand‐held Analyzer Types 2250 and 2270 – User Manual44
4.5.4 On‐screen Feedback and Traffic Light
Feedback is given on screen in the Status Field (Fig.4.2), and the Traffic Light indicates importantstates of the analyzer (Table 4.2).
4.5.5 Use of Stylus and Navigation Pushbuttons
The stylus and navigation pushbuttons are used for setting up the analyzer, navigating throughthe screens and managing the results.A number of items that appear on the screen (parameter values or icons) can be selected, updatedand activated. For instance, a new parameter value can be selected from a drop-down list. The selection and activation of items on the screen can be done in two ways:• Tapping once on the item on the screen will select and activate it, or• Moving the field selector around using the navigation keys until the item you want is
highlighted, then pressing the Accept pushbutton to activate itYou can choose to use the stylus or the pushbuttons, depending on your preference and themeasurement situation. For instance, if the amount of noise generated by the analyzer needs tobe kept to an absolute minimum, consider using the pushbuttons rather than the stylus – this isbecause tapping of the stylus on the touch-sensitive screen may create extra noise. However, ifspeed is of major importance, the stylus can navigate through the setup and measurementscreens quicker.Throughout the manual we have described how to perform the measurement procedures usingthe stylus only, but you may also use the alternative method (using the Navigation and Acceptpushbuttons) if you prefer.
Table 4.2Traffic Light Indications
State Light SchemeDuring power-on or loading template Nothing
Stopped. Ready to measure Short yellow flash every 5 s Awaiting trigger, searching for
calibration signalShort green flash every second
Running measurement, everything OK
Steady green light
Paused. Measurement not saved Slow yellow flash on 1/2 s, off 1/2 s Overload Fast red flash
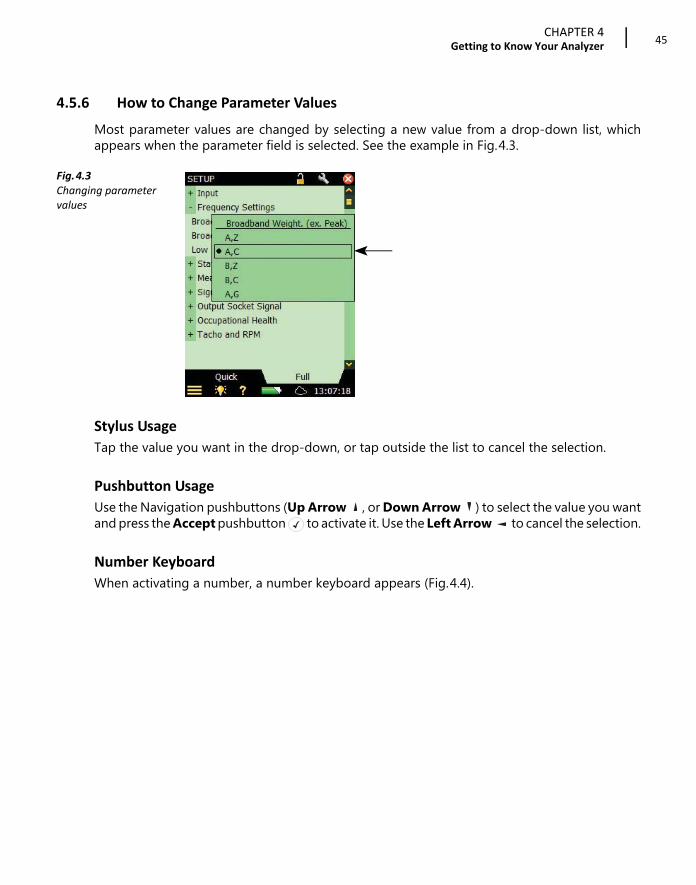
CHAPTER 4Getting to Know Your Analyzer
45
4.5.6 How to Change Parameter Values
Most parameter values are changed by selecting a new value from a drop-down list, whichappears when the parameter field is selected. See the example in Fig.4.3.
Fig.4.3Changing parameter values
Stylus Usage
Tap the value you want in the drop-down, or tap outside the list to cancel the selection.
Pushbutton Usage
Use the Navigation pushbuttons (Up Arrow , or Down Arrow ) to select the value you wantand press the Accept pushbutton to activate it. Use the Left Arrow to cancel the selection.
Number Keyboard
When activating a number, a number keyboard appears (Fig.4.4).

Hand‐held Analyzer Types 2250 and 2270 – User Manual46
Fig.4.4Number keyboard
Tap the digits or use Up Arrow /Down Arrow to increment/decrement the number. UseLeft Arrow /Right Arrow to select other digits if necessary. Press the Accept pushbutton
or tap on the number keyboard to enter the number for the parameter. Tap on thenumber keyboard, or outside the number keyboard to cancel the change of value.
Character Keyboard
When activating a text value, a standard full character keyboard appears on the screen (Fig.4.5).
Fig.4.5Character keyboard
The character keyboard has all the functionality of a normal keyboard, enter text as required bytapping the individual keys with the stylus. Tap to accept the changes, or tap outside thekeyboard to cancel.

CHAPTER 4Getting to Know Your Analyzer
47
4.5.7 How to Personalize your Setup
Setup contains all the settings for the measurement and some settings for post-processing.Tap > Setup (Fig.4.6).
Fig.4.6The Setup screen –Edit Mode
The Full tab at the bottom of the screen allows you to view the complete list of setup parameters,while the Quick tab allows you to access the more frequently used parameters defined byyourself. Press Edit on top of the screen to enter Edit Mode.This mode allows you to copy parameters from the Full tab view to the Quick tab simply bytapping on the parameters in the Full tab – and to remove parameters from the Quick tab bytapping on the parameters on the Quick tab.When you have finished, tap the Edit icon again to exit Edit Mode.Setup settings can be protected from accidental changes by tapping Padlock on the top of thescreen. This will also protect the template from being deleted or renamed.When locking the template you get the option of password protecting the lock. If you choose this,then you enter a password (see Fig.4.7).
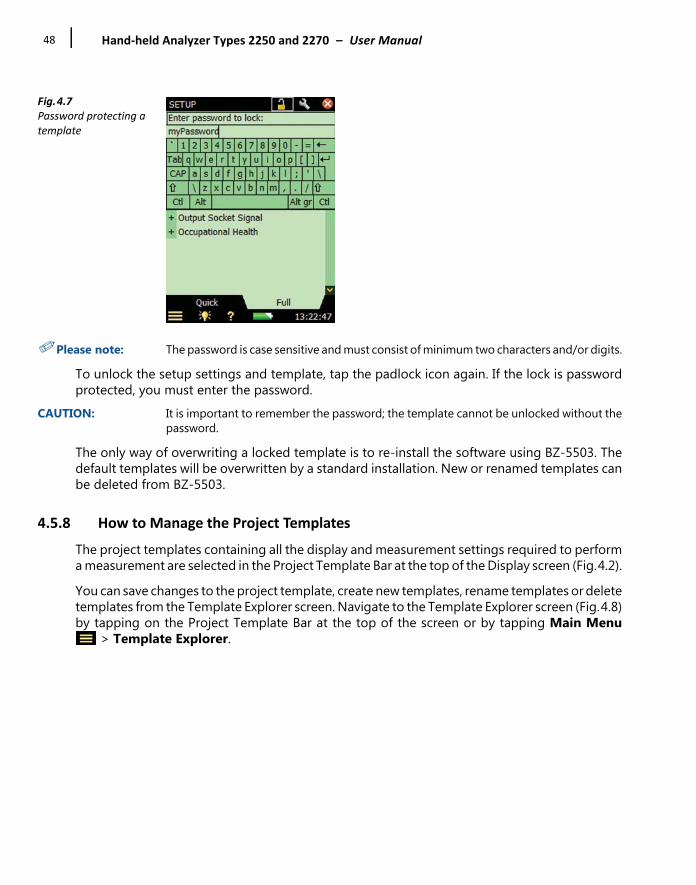
Hand‐held Analyzer Types 2250 and 2270 – User Manual48
Fig.4.7Password protecting a template
✐Please note: The password is case sensitive and must consist of minimum two characters and/or digits.
To unlock the setup settings and template, tap the padlock icon again. If the lock is passwordprotected, you must enter the password.
CAUTION: It is important to remember the password; the template cannot be unlocked without thepassword.
The only way of overwriting a locked template is to re-install the software using BZ-5503. Thedefault templates will be overwritten by a standard installation. New or renamed templates canbe deleted from BZ-5503.
4.5.8 How to Manage the Project Templates
The project templates containing all the display and measurement settings required to performa measurement are selected in the Project Template Bar at the top of the Display screen (Fig.4.2).You can save changes to the project template, create new templates, rename templates or deletetemplates from the Template Explorer screen. Navigate to the Template Explorer screen (Fig.4.8)by tapping on the Project Template Bar at the top of the screen or by tapping Main Menu
> Template Explorer.

CHAPTER 4Getting to Know Your Analyzer
49
Fig.4.8Template Explorer
The topmost line in the Status Field (“Sound Level Meter” in Fig.4.8) contains the name of thecurrent template. If you make any changes to the settings in the current template, an ‘*’ willappear next to the template name to indicate that the new settings have not been saved.The next line contains icons for saving the settings. Tap Save to save the settings in the currenttemplate.Tap Save As to save the settings in a new template. Use the keyboard that pops up to definethe name of the template.The rest of the screen is used for listing the defined templates with an icon, a template name andpossibly an Annotations icon (paperclip):1) Tap a template icon to open and use the template.2) Tap a template name to get a drop-down list with the options:
– Open (open and use the selected template)– Clone (create a copy of the selected template)– Delete (delete the selected template)– Rename (rename the selected template)– Add Note (or commentary) to the template– View Annotations on the template
3) Tap Paperclip to get the list of annotations attached to the project.The Full tab at the bottom of the screen allows you to view the complete list of project templates,while the Quick tab allows you to access the more frequently used project templates. Tap Edit on top of the screen to enter Edit Mode.This mode allows you to copy parameters from the Full tab view to the Quick tab simply bytapping on the parameters in the Full tab – and to remove parameters from the Quick tab bytapping on the parameters on the Quick tab.

Hand‐held Analyzer Types 2250 and 2270 – User Manual50
When you have finished, tap the Edit again to exit Edit Mode.✐Please note: • Annotations on templates are for describing the template and will not be copied to
the project, when starting or saving a measurement• If you delete all templates of a certain type (for example, the Frequency Analyzer) and
you want a template of this type again, then you either have to open a project made with this template and save the template, or you have to use Measurement Partner Suite BZ-5503 to transfer a template of this type to the analyzer
4.5.9 Locking the Pushbuttons and Display
The pushbuttons and display can be locked to prevent inadvertent operation:• To Lock: Select the Lock Keys and Screen option from the Main Menu • To Unlock: Press the Left Arrow pushbutton , followed by the Right Arrow pushbutton
, then the Accept pushbutton If you attempt to press a pushbutton, or tap the screen, while the analyzer is locked, aninformation window pops up with instructions on how to unlock it.
51
Chapter 5Calibration
This chapter describes calibration, including:• Types of calibration• How to calibrate• Calibration history• The transducer database• How to set up a calibration reminder• Charge injection calibration (CIC)• Accelerometer calibration
5.1 Introduction
Calibration is an adjustment of your analyzer to measure and display correct values. Thesensitivity of the transducer as well as the response of the electronic circuitry can vary slightly overtime, or could be affected by environmental conditions such as temperature and humidity. Whileyou are unlikely to ever experience a large drift or change in sensitivity with the analyzer, it isnevertheless good practice to perform regular calibrations, normally before and after each set ofmeasurements. Often calibration is required by measurement standards, such as IEC 61672–1.
5.2 Calibration Types
Acoustic Calibration
Acoustic calibration is the preferred calibration method, particularly when standards andregulations require calibration before a measurement. The method involves applying an acousticsignal of known magnitude and frequency to the microphone, which calibrates all the analyzer’scomponents (microphone, preamplifier and electrical circuitry).
Electrical Calibration
To calibrate the Direct input use a stable sinusoidal voltage at a frequency between 150 Hz and10 kHz. The procedure is very similar to the Standard Calibration procedure for sound calibrationdescribed above; however, without the transducer mounting procedure.

Hand‐held Analyzer Types 2250 and 2270 – User Manual52
Manual Calibration
If no calibrator is available (or a known amplification is introduced, for example, by analysing atape recorded signal) then you can type the sensitivity directly into the Sensitivity field. Theanalyzer will be regarded as uncalibrated and the text ‘Uncal.’ will appear in the status field.
Charge Injection Calibration
You can check the complete measurement chain during long term measurement using ChargeInjection Calibration. See section 5.7.
Vibration Calibration
You can calibrate accelerometers using Calibration Exciter Type 4294. See section 5.8.
5.3 Sound Level Calibration
5.3.1 Standard Calibration
Use Sound Calibrator Type 4231. It provides a stable sound pressure at 1 kHz and has minimalsusceptibility to environmental factors. The procedure itself is relatively simple, and on theanalyzer the procedure is referred to as the Standard Calibration procedure.To perform acoustic calibration and to fit the calibrator:1) Stand away from loud sound sources that may interfere with the calibrator’s signal.2) Switch on the analyzer: push .3) Tap > Calibration to open the Calibration screen (Fig.5.1).
Fig.5.1Calibration screen

CHAPTER 5Calibration
53
This screen contains a bar graph showing the actual sound pressure level and threeplaceholders for displaying information about the last calibration.
4) Following the first part of the instruction in the Status Field, fit Sound Calibrator Type 4231carefully onto the microphone of the analyzer. (To avoid handling vibrations that disturb thecalibration, rest the assembly in a roughly horizontal position on a table or other flat surface.) Ensure that the calibrator fits snugly on the microphone.
5) Switch on the calibrator. Wait a few seconds the level to stabilize.6) Tap to start the calibration.
✐Please note: Detecting level... appears on the screen as feedback.
7) While the analyzer is searching for the calibration signal and the signal level is stabilizing, the‘traffic light’ indicates a short green flash every second. When the level is stable, the trafficlight indicates a steady green and the signal is measured and used for calibration. Once thecalibration has been completed successfully, the traffic light indicates a short yellowflash every 5 seconds. The Sensitivity is automatically calculated and displayed in a pop-uptogether with the deviation from the last calibration. Tap Yes to accept and use the newsensitivity and save it in the calibration history. Tap No to disregard the new calibration andcontinue with the old calibration.If the calibration deviates more than 1.5 dB from the initial calibration (microphones only),then the calibration is stopped without changing the calibration of the analyzer. The trafficlight will indicate a fast flashing red and an error description will appear in the status field.
💡 Hint: If the microphone is separated from the analyzer using a microphone extension cable thenplace the analyzer so it can be seen from the location of the microphone. Start thecalibration process (select the Calibration screen and tap the button on thescreen), then go to the microphone and fit the calibrator onto the microphone, switch onthe calibrator and monitor the traffic light on the analyzer, as discussed previously.
8) Once you have completed the calibration, tap the button and remove the calibrator.It will automatically switch off after a few seconds.

Hand‐held Analyzer Types 2250 and 2270 – User Manual54
5.3.2 Calibration Settings
To view the calibration details, select the Details tab on the Calibration screen (Fig.5.2).
Fig.5.2Calibration details screen
This screen displays the following information:• Details of the last calibration: date, sensitivity, deviation from last calibration and deviation
from initial calibration• The connected transducer: type and serial number
✐Please note: You select a new transducer by tapping > Setup > Input).• Max. Input Level: The maximum sinusoidal input level to be measured without overload
indication• A Calibration History link, which is provided to enable you to view a history of transducer and
calibration settings, see belowThe calibration settings can be adjusted as follows:• Calibrator: select between Type 4231 and a custom calibrator• Calibration Level: Enter the specific level of your custom calibrator. If you are using, Type 4231,
calibrator level is automatically detected (shown as Auto detect)✐Please note: The Auto detect setting enables the automatic detection of the calibration level. For free-
field microphone types (like Types 4189 and 4190) the calibration level from SoundCalibrator Type 4231 is either 93.85 dB or 113.85 dB. For diffuse- or pressure-field types,the calibration level is either 94 dB or 114 dB. The calibration process automaticallydetermines the correct level
• Calibrator Serial Number: Type in the serial number for your calibrator. The calibrator will be documented in the calibration history

CHAPTER 5Calibration
55
5.4 Calibration History
To view calibration history, tap Calibration History > on the Calibration Details screen (Fig.5.2).The analyzer saves the last 20 calibrations, plus initial calibration, which can be viewed on theCalibration History screen (Fig.5.3). Tap to return to the calibration details screen; tap againto return to the Measurement screen.
Fig.5.3Calibration History screen
5.5 Transducer Database
The specifications for Microphone Types 4189 and 4190 (and Preamplifier ZC-0032), which comefitted in the top socket of the analyzer, are described in a transducer database.1) To open the Transducer Database screen (Fig.5.4), tap > Transducers.
Fig.5.4Transducer Database screen

Hand‐held Analyzer Types 2250 and 2270 – User Manual56
2) To view the details in the database (Fig.5.5), tap the transducer name/number, or tap Plus next to the name/number.
Fig.5.5Details in the Transducer Database
All the details for the currently selected microphone can be found in the database. You can addother transducers by tapping on Add New Transducer , selecting Microphone, Accelerometeror Direct input from the drop-down, and filling in the details of your particular transducerparameters. See section C.2.1. This is done by selecting the item from the drop-down list thatappears on some parameter fields, or by entering the data via the keyboard that appears on otherparameter fields.When adding a new microphone, Type 4189 is the default entry. Change Microphone Type tofit your microphone. For known microphone types, a number of parameters are automatically set.
✐Please note: • If the transducer is a microphone and the microphone type is known to the analyzer (as in the example in Fig. 5.5, where Type 4189 details are known), then the parameters Nominal Sensitivity, Polarization Voltage, Free-field, Capacitance and CCLD are set automatically. See details in Appendix C. The analyzer can then make sound-field correction and windscreen correction as specified in the setup. To confirm which type of correction is being applied, an icon is displayed in the measurement Status Field, as described on section 4.3.2. If the microphone is unknown to the analyzer, no corrections can be made and no icon appears in the Status Field. The parameters mentioned above have to be set manually (that is, typed in). We recommend that you insert the value for Nominal Sensitivity directly from the calibration chart. Nominal sensitivity is used in the automatic level detection calculations, when calibrating using Sound Calibrator Type 4231, to determine whether the level is 94 or 114 dB.
• If the transducer is an accelerometer and the accelerometer type is known to the analyzer, then the parameters Nominal Sensitivity, CCLD and Weight are set automatically.
In the top line of the Status Field you can select which transducer is currently connected to theanalyzer. This can also be done via the Setup screen by selecting Input, then selecting thetransducer in the Transducer field.

CHAPTER 5Calibration
57
In the first line of the Status Field you can select whether the transducer is connected to the TopSocket or the Rear Socket of the analyzer. This can also be done via the Setup screen by selectingInput, then selecting the socket in the Input: field.For Type 2270 only: In the second line you also have a Channel Selector.To change which input the transducer uses to connect to the analyzer, tap > Setup > Inputand tap the required input from the drop-down list: Top Socket or Rear Socket (Rear Socket refersto the Input socket on the connector panel of the analyzer).At the bottom of the parameter list you can select the calibration history for the currently selectedtransducer by tapping on the Calibration History link. See section 5.4 and Fig.5.2.You can delete a transducer by tapping Delete Transducer then the transducer to delete fromthe drop-down that appears.
✐Please note: Only transducers that are not connected can be deleted. The calibration history will alsobe deleted.
Tap to return to the Measurement screen.
5.6 Calibration Reminder
The Calibration screen Reminder tab (Fig.5.6), allows you to keep track of when you need to runyour next Accredited/Traceable calibration, and shows you the date of your last calibration.
Fig.5.6Calibration Reminder tab

Hand‐held Analyzer Types 2250 and 2270 – User Manual58
The automatic calibration reminder facility will pop up a reminder approximately two monthsbefore your next calibration and keep on reminding you every week until you do one of thefollowing actions:• Send your analyzer for Accredited/Traceable Calibration and update the Last Calibration date• Check the Do not ask/remind again checkbox in the reminder pop-up• Disable the automatic calibration reminderAn example of a reminder pop-up is shown in Fig.5.7:
Fig.5.7Reminder pop‐up
You can set the Calibration Interval parameter to either 12 months or 24 months depending on yourlocal requirements.You can disable the facility by selecting the Automatic Calibration Reminder parameter to Off.
5.7 Charge Injection Calibration
5.7.1 Theory of Charge Injection Calibration
If an external sound source is not available, for example during short or long term monitoring, youcan check the calibration of the analyzer using the Charge Injection Calibration (CIC) facility. Thisis done automatically during a logging measurement (see section 11.2 and section 12.2). Unlikean internal calibration, the Brüel & Kjær patented CIC technique enables a completemeasurement chain to be verified, including the microphone, preamplifier, cabling and analyzer.Each verification measurement is compared to an initial reference measurement.As the name implies, the CIC method injects an internally generated charge into the microphoneand preamplifier input circuit, and the ratio between the measured signal and the injected signalis measured (CIC Ratio; Fig.5.8).
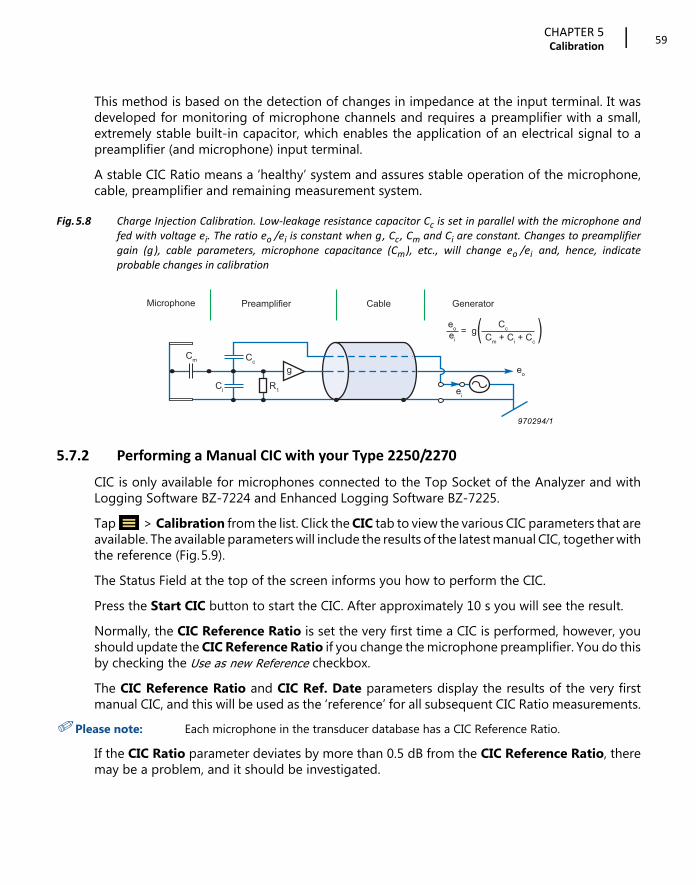
CHAPTER 5Calibration
59
This method is based on the detection of changes in impedance at the input terminal. It wasdeveloped for monitoring of microphone channels and requires a preamplifier with a small,extremely stable built-in capacitor, which enables the application of an electrical signal to apreamplifier (and microphone) input terminal. A stable CIC Ratio means a ‘healthy’ system and assures stable operation of the microphone,cable, preamplifier and remaining measurement system.
Fig.5.8 Charge Injection Calibration. Low‐leakage resistance capacitor Cc is set in parallel with the microphone andfed with voltage ei. The ratio eo /ei is constant when g, Cc, Cm and Ci are constant. Changes to preamplifiergain (g), cable parameters, microphone capacitance (Cm), etc., will change eo /ei and, hence, indicateprobable changes in calibration
5.7.2 Performing a Manual CIC with your Type 2250/2270
CIC is only available for microphones connected to the Top Socket of the Analyzer and withLogging Software BZ-7224 and Enhanced Logging Software BZ-7225.Tap > Calibration from the list. Click the CIC tab to view the various CIC parameters that areavailable. The available parameters will include the results of the latest manual CIC, together withthe reference (Fig.5.9).The Status Field at the top of the screen informs you how to perform the CIC.Press the Start CIC button to start the CIC. After approximately 10 s you will see the result. Normally, the CIC Reference Ratio is set the very first time a CIC is performed, however, youshould update the CIC Reference Ratio if you change the microphone preamplifier. You do thisby checking the Use as new Reference checkbox.The CIC Reference Ratio and CIC Ref. Date parameters display the results of the very firstmanual CIC, and this will be used as the ‘reference’ for all subsequent CIC Ratio measurements.
✐Please note: Each microphone in the transducer database has a CIC Reference Ratio.
If the CIC Ratio parameter deviates by more than 0.5 dB from the CIC Reference Ratio, theremay be a problem, and it should be investigated.
Cm Cc
Ci R1
PreamplifierMicrophone Cable Generator
g
ei
eo
eo
ei
Cc= gCm + Ci + Cc
( )
970294/1

Hand‐held Analyzer Types 2250 and 2270 – User Manual60
Fig.5.9CIC tab
The CIC result consists of four parameters:• CIC Ratio • CIC Ratio Date • Deviation from Reference • CIC Result The CIC Result can be Passed, Background noise too high or CIC Ratio deviates from Ref.
5.8 Vibration Calibration
To calibrate an accelerometer use Calibration Exciter Type 4294. It provides a stable accelerationof 10 m/s2 at 159 Hz. The procedure for mounting the accelerometer to the exciter is describedin the Type 4294 user manual. Otherwise the calibration procedure is very similar to the StandardCalibration procedure for sound calibration described above. However, if the calibration deviatesmore than ±5.5 dB from the nominal sensitivity, the calibration is stopped without changing thecalibration of the analyzer. In this case, check whether the correct accelerometer has beenselected from the transducer database and whether it has the correct nominal sensitivity.
✐Please note: If you use Low Level Accelerometer Type 8344, you need Calibration ExciterType 4294-002.

61
Chapter 6Data Management
This chapter describes data management, including:• Job and project organization• Setting the default job folder• Recalling measurements• Uploading to Measurement Partner Cloud (MP Cloud)
6.1 Organizing Measurements
6.1.1 Description of Jobs and Projects
When saving a set of measurement results, they are organized together with setup information,calibration information, annotations and signal recordings in a project.A project contains the following:• Measurement results:
– Broadband values (for example, LAeq, LAFmax, LAFmin)– Frequency spectra (if Frequency Analysis Software BZ-7223 is enabled on your analyzer
and you have selected a FREQUENCY ANALYZER template)• Weather and GPS data• Measurement Setup • Display Setup (parameters you have selected)• Information on the microphone• Calibration • Annotations – Commentary (attached to measurements as required)• Annotations – Text, notes or GPS notes (attached to measurements as required)• Annotations – Image (attached to measurements as required) – Type 2270 only• Signal Recordings (attached to measurements as required)The project name is automatically created by combining the Project Name Prefix with a number(starting from 001),that is, Project 001 for the first project, Project 002 for the next, etc.

Hand‐held Analyzer Types 2250 and 2270 – User Manual62
To rename the Project Name Prefix:
1) Navigate to the project (tap > Explorer). 2) Tap the name of the project (tapping the icon opens the project immediately)3) Tap Rename and enter the new project name.
Projects are saved in folders, which are called ‘jobs’ on your analyzer. These are similar to foldersin the Microsoft® Windows® filing system. Jobs can be created:• In the internal memory• On a Secure Digital (SD) card• On a USB memory stick (G4 analyzers only)• On a CompactFlash (CF) card (G1 – 3 analyzers only)
6.1.2 Navigating in Jobs
A results browser called Explorer is used to navigate through the jobs and projects.To view all jobs and projects, tap > Explorer or tap the project name on the Measurementscreen. A screen similar to Fig.6.1 will appear.
Fig.6.1The Explorer screen
The example in Fig.6.1 displays a list of jobs and then some projects that have not been storedunder a job name.The topmost line in the status area (Internal Disk\ in Fig.6.1) shows the location in the memory.The next line in the status area contains four icons for navigation.Tap to go up one level in the job levels. The top level is the Memory level, where physicalmemory devices can be selected. You can select:

CHAPTER 6Data Management
63
• With G1 – 3 analyzers: – Internal Disk – SD-Card (if a card is inserted in the SD slot)– CF-Card (if a card is inserted in the CF slot)
• With G4 analyzers: – Internal Disk
– SD-Card B (if a card is inserted in the bottom SD slot) – SD-Card T (if a card is inserted in the top SD slot) – USB-Mem (if a memory stick is inserted in the USB Standard A socket)
If Multi User is enabled (see section 8.1.4, Multi-user Facility), then each user can access data onany of the devices. However, a user cannot see or access jobs for other users.To go down one level (that is, exit the Memory level), tap the job name (Internal Disk in this case)and select Open from the drop-down list or tap Memory , next to Internal Disk.Tap to create a new job folder. The first job folder name will be Job 01, subsequent job folderswill be labelled Job 02, Job 03, etc. You can rename the job folder name by tapping on the nameand selecting Rename from the drop-down list. Use the keyboard to key in a new name – acceptby tapping Enter .To go down one level (open a job), tap the job name in the list and select Open from the drop-down list or tap the job folder icon to the left of the job name.You can move a job/project (and its content) to another job by tapping the job name/projectname and selecting Cut from the drop-down list. Then navigate to the job you want as the newholder of the moved job/project and tap Paste , or navigate to the level above, tap the jobname and select Paste from the drop-down list.In order to copy a job/project, do as described above, but use Copy instead of Cut from the drop-down list.Select Delete from the drop-down list in order to delete the job/project and all of its contents.You can select more than one job/project for Copy, Cut or Delete by tapping and holding the styluson a job/project name and then dragging the stylus up or down to select other jobs/projects.
6.2 Selecting Default Measurement Job/Path
Tap to select the current job as the default measurement job, where all projects will be savedwhen you press the Save pushbutton. The job name, followed by the current project name, willappear in the topmost line in the status area to confirm which job you have selected.

Hand‐held Analyzer Types 2250 and 2270 – User Manual64
6.3 Recalling Measurements
You can recall your measurement results to display the measured results, reuse setups frompreviously saved projects or view logged data as a profile. Use the Open command inExplorer – this will recall the project template (display settings and measurement setup used onthe saved results) along with the results. This will, however, stop and reset the currentmeasurement.
6.3.1 Viewing Data and Reusing Setups from Projects
From > Explorer, locate the project with the setup you want to reuse, then tap the projectname and select Open from the drop-down that appears. This will stop and reset the currentmeasurement and load the project including all setups and data. You are now using the samescreens as the ones you were using just before you saved the data. Use the screens to browse theresults. Pressing Start/Pause will start a new measurement using the setups from the project.You can save the setup information in a template by tapping the Template Bar at the top of thescreen, see section 4.5.8.
6.3.2 Viewing or Listening to Annotations and Metadata
Use Explorer to locate the project with the annotations you want to view/hear, then tap theproject name and select Annotations from the drop-down that appears (or tap Paperclip ) andselect the Annotations tab. This will show all annotations attached to the project (Fig.6.2.)
Fig.6.2Example of an annotation attached to a project
The icon represents a verbal annotation, or commentary. Tap the annotation name and selectPlay from the drop-down that appears (or tap the icon) to play the commentary using theheadphone output.
💡 Hint: You can also rename, delete, copy or move annotations to and from other projects or jobs.
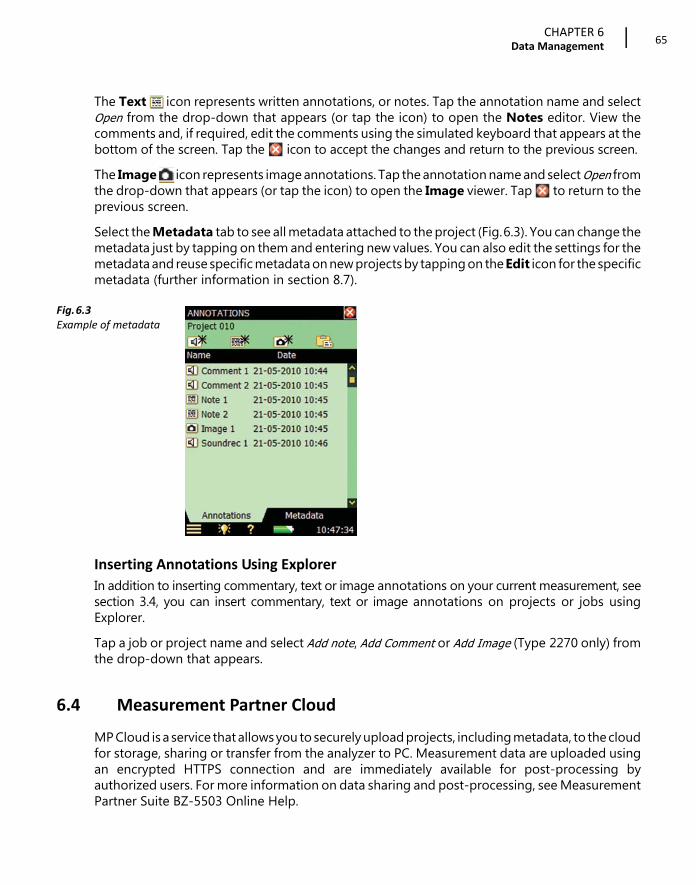
CHAPTER 6Data Management
65
The Text icon represents written annotations, or notes. Tap the annotation name and selectOpen from the drop-down that appears (or tap the icon) to open the Notes editor. View thecomments and, if required, edit the comments using the simulated keyboard that appears at thebottom of the screen. Tap the icon to accept the changes and return to the previous screen.The Image icon represents image annotations. Tap the annotation name and select Open fromthe drop-down that appears (or tap the icon) to open the Image viewer. Tap to return to theprevious screen. Select the Metadata tab to see all metadata attached to the project (Fig.6.3). You can change themetadata just by tapping on them and entering new values. You can also edit the settings for themetadata and reuse specific metadata on new projects by tapping on the Edit icon for the specificmetadata (further information in section 8.7).
Fig.6.3Example of metadata
Inserting Annotations Using Explorer
In addition to inserting commentary, text or image annotations on your current measurement, seesection 3.4, you can insert commentary, text or image annotations on projects or jobs usingExplorer.Tap a job or project name and select Add note, Add Comment or Add Image (Type 2270 only) fromthe drop-down that appears.
6.4 Measurement Partner Cloud
MP Cloud is a service that allows you to securely upload projects, including metadata, to the cloudfor storage, sharing or transfer from the analyzer to PC. Measurement data are uploaded usingan encrypted HTTPS connection and are immediately available for post-processing byauthorized users. For more information on data sharing and post-processing, see MeasurementPartner Suite BZ-5503 Online Help.

Hand‐held Analyzer Types 2250 and 2270 – User Manual66
6.4.1 Connecting the Analyzer to MP Cloud
In order to be able to connect an analyzer to MP Cloud, you must have:• An MP Cloud account (cloud.bksv.com)• An Internet connection (LAN, Wi-Fi, etc.; see Chapter 7)
Connect an Analyzer to MP Cloud
You can connect the analyzer to the cloud directly on the analyzer or set up the connectionremotely using Measurement Partner Suite BZ-5503. To set up the connection using Measurement Partner Suite, see Measurement Partner SuiteBZ-5503 Online Help.To connect directly through the analyzer: 1) Connect to the Internet (Chapter 7).2) Tap Cloud , in the Shortcut bar then MP Cloud.
Fig.6.4The Cloud icon
You can also navigate to the MP Cloud settings by tapping > Preferences > MP Cloud.3) Tap Account and select Logged in.
Instructions shown in Fig.6.5 will pop up.

CHAPTER 6Data Management
67
Fig.6.5First MP Cloud login instructions
4) Navigate to cloud.bksv.com using an Internet browser and log in.5) Click the Devices tile.6) Click Create new... and enter the analyzer’s serial number (located just above the tripod
mounting thread; see section 2.2).Also enter a comment (for example, a reference to the analyzer’s primary user or location).
7) Click the Create button.8) You will be prompted to Confirm device invitation and will be provided with a pin code. 9) On the analyzer, tap OK and enter the pin code when prompted.
10) Tap OK on the analyzer and click Refresh... on the Web browser.
6.4.2 Managing MP Cloud on the Analyzer
When you log in to MP Cloud, a Cloud folder and Uploaded folder will automatically be createdon all attached memory devices (Internal Disk, SD-cards, CF-card and USB memory stick). TheCloud folder will be Cloud when logged in to an account.
Upload to MP Cloud
To upload data to MP Cloud, move or copy the data into the Cloud folder. All data in the Cloudfolder will automatically be uploaded to MP Cloud when connected to the Internet.
✐Please note: In the event of a lost connection, the upload will resume when the connection isre-established.

Hand‐held Analyzer Types 2250 and 2270 – User Manual68
The Cloud Icon:
The icon will change depending on the status of the connection and upload:• Logged out of MP Cloud• Logged in, all has been uploaded• Logged in, upload in progress• Logged in, upload paused• Logged in, but not connected to the account
To Resume or Pause Uploading, Check MP Cloud Status or Change Parameters:
Tap the Cloud icon to open a drop-down menu:• Pause Upload or Resume Upload (depending on the current upload state)• MP Cloud Status (provides status; see Fig.6.6)• MP Cloud (a shortcut to MP Cloud parameters)
✐Please note: The first time you connect to MP Cloud and when you are logged out, only MP Cloud willbe available.
Fig.6.6Example of MP Cloud Status
To Log in to MP Cloud:
1) Tap Cloud or tap > Preferences > MP Cloud.2) Tap Account then Logged in.
To set the archive in the cloud to which the data will upload:
1) Tap > Preferences > MP Cloud > Archive and enter the archive name.
✐Please note: If that archive does not exist, it will be created when you tap the Enter key.
To delete a project from the analyzer or move the project to another storage device after asuccessful upload to MP Cloud:
1) Tap > Preferences > MP Cloud > Action after upload and select Move project (if youwant to access the data on the analyzer after the measurement) or Delete project (if you wantto clear space on the SD-card after the measurement).

69
Chapter 7Connection to PC or Smartphone
or Measurement Partner Field App
This chapter describes connecting to your analyzer from a PC or smartphone, including:• An introduction to connection methods• Measurement Partner Suite BZ-5503 for full control of the analyzer• Use an Internet browser for online display and control of the analyzer• Measurement Partner Field App (MP Field App) for streamlined functional control of the
measurement, data and annotations in the field
7.1 Introduction
Two different methods are available for connecting to the analyzer:• USB: BZ-5503 connects to the analyzer through a USB cable• Network: The analyzer is connected to a network (local or Internet) via a modem, LAN cable
or Wi-Fi adaptor. BZ-5503 or an Internet browser and MP Field App (on a smartphone) will then be able to connect to the analyzer through TCP/IP using the analyzer’s (global) IP address
In addition to connecting to the analyzer, the analyzer itself can notify you by SMS or email, basedon various conditions. For more information, see section 8.4.Table 7.1 gives you an overview of the different connection possibilities including links to relevantchapters with more details.

Hand‐held Analyzer Types 2250 and 2270 – User Manual70
Table 7.1 Connection overview
💡 Hint: The online help for BZ-5503 contains additional information on how to connect ananalyzer using the different connection types.
7.2 Transferring Measurement Data to Your PC
Measurement Partner Suite BZ-5503 is used for communication between your PC and theanalyzer. You can use this software to:• Transfer measurement data and templates from the analyzer to your PC, and vice versa• View data• Organize data on the analyzer • Create users on the analyzer• Upgrade software on the analyzer• Install software licenses on the analyzer
Connect From Connection Type Settings in Preferences Available Notifications
BZ-5503 USB Modem = Disabledsee section 8.2
–
BZ-5503, Internet browser or smartphone with MP Field App
Network or GPRS/EDGE/HSPA Modem
Modem = GPRS/EDGE/HSPA DialupPossibly settings in Modem/DynDNSsee sections 8.2 and 8.3
Emailsee section 8.4
BZ-5503, Internet browser or smartphone with MP Field App
NetworkEthernet cable
Modem = DisabledPossibly settings in Modem/DynDNS and Networksee sections 8.2 and 8.3
Emailsee section 8.4
BZ-5503, Internet browser or smartphone with MP Field App
NetworkCF WLAN (G1 – 3 analyzers only)Wi-Fi dongle or SD WLAN (G4 only)
Modem = DisabledPossibly settings in Modem/DynDNS and Networksee sections 8.2 and 8.3
Emailsee section 8.4
BZ-5503, Internet browser or smartphone with MP Field App
NetworkDSL Modem/Router
Modem = DisabledPossibly settings in Modem/DynDNS and Networksee sections 8.2 and 8.3
Emailsee section 8.4

CHAPTER 7Connection to PC or Smartphone or Measurement Partner Field App
71
Using this software, measurements on the analyzer can be controlled from your PC and displayedonline, using the same user interface on the PC as on the analyzer.Data transferred to the PC are organized in Archives. You can view the measurement data in theArchives.
7.2.1 Connect to Your PC
Connect the analyzer to your PC using one of the following: • G1 – 3 analyzers:
– The supplied Mini USB Cable AO-1476– A modem connection– A LAN connection using a LAN cable (Type 2270 only)– A LAN connection via CF card adaptor
• G4 analyzers:– The supplied Micro USB Cable AO-1494– A modem connection– A LAN connection
The connection can be protected by requiring a login with user name and password – seesettings in section D.11. See Chapter 8 for descriptions on how to set up your preferences,including PC connections.
7.2.2 Post‐processing and Reporting
Use the optional modules of the Measurement Partner Suite for data analysis and post-processing. For example, data in the archives can be post-processed directly in the LoggingModule BZ-5503-A or Spectrum Module BZ-5503-B. Furthermore, data can be exported tovarious post-processing tools like Evaluator™ Type 7820 for assessing environmental noise;Protector™ Type 7825 for assessing workplace noise; Qualifier™ Light Type 7831 fordocumenting reverberation time measurements; or Microsoft® Excel®. Signal recordings can be imported to Brüel & Kjær’s PULSE™ multi-analyzer platform for furtheranalysis.For more information on Measurement Partner Suite BZ-5503 and the PULSE multi-analyzerplatform, see our website at www.bksv.com or contact your local Brüel & Kjær representative.For further information on post-processing and reporting capabilities, please refer to the onlinehelp included with the relevant PC software. This software is supplied on the EnvironmentalSoftware DVD (BZ-5298) included with your analyzer.

Hand‐held Analyzer Types 2250 and 2270 – User Manual72
7.3 Measurement Partner (MP) Field App
Measurement Partner Field App is the recommended solution for on-site measurement controland annotation.MP Field App enables:• Remote analyzer control• Remote display• Remote annotation of measurement dataYou can wirelessly connect to your analyzer from a smartphone when the analyzer is connectedto the Internet or to the same network as the smartphone.The analyzer can be connected through wired LAN, 3G modem or Wi-Fi connection to an accesspoint or directly to the hotspot of the smartphone.The Wi-Fi connection can be made using USB Wi-Fi Dongle UL-1050 (preferred) or SD WLANCard UL-1025 for G4 or CF WLAN Card UL-1019 for G1 – G3.Once connection is made to the analyzer, for noise measurements, the instantaneous LAF profileis displayed and you can start, stop and pause your measurement from a safe distance. Forvibration measurements, the Fast inst. profile is shown.
Fig.7.1MP Field App showing the instantaneous LAF

CHAPTER 7Connection to PC or Smartphone or Measurement Partner Field App
73
7.3.1 Annotations
MP Field App supports the following annotation types:• Note• Voice commentary• Image• Video• GPSAll annotations are uploaded to MP Cloud for merging with the project in Measurement PartnerSuite. It is also possible to annotate your measurements directly on the analyzer using notes, voicecommentaries and images (Type 2270 only). These are transferred to Measurement Partner Suitealong with your measurement data.
7.3.2 Connect the Analyzer to MP Field App
To Connect Using a Smartphone Hotspot
On the smartphone:
1) Create a personal hotspot.Consult your smartphone help for instructions specific to your device.
On the analyzer:
2) Switch on the analyzer.3) Plug in Wi-Fi Dongle UL-1050 (preferred) or WLAN SD-card UL-1021 for G4 analyzers or
WLAN CF-card UL-1019 for G1 – 3 analyzer.✐Please note: The CF-card requires additional input. See section 8.3 for additional information).
4) Tap > Preferences > Network:– Set IP Address and select Automatically.– Available Networks and select the hotspot you set up.Ensure that Preferences > Remote Access > Web Server is set to Enabled.
On the smartphone:
5) Open MP Field App.6) Tap to open the Instruments screen.7) Tap your analyzer's serial number to connect.
Hand‐held Analyzer Types 2250 and 2270 – User Manual74
✐Please note: • For subsequent uses, MP Field App should recognized your analyzer and connect automatically. However, the smartphone may assign a different IP address to the analyzer. If so, repeat steps 6 and 7 to connect.
• If the analyzer does not appear on the instrument list, tap the + icon and enter the analyzer's IP address (which can be found on your analyzer at
> Preferences > Network > IP Address)
To Connect Using an Access Point or Internet Connection
On the analyzer:
1) Switch on the analyzer.2) Plug in Wi-Fi Dongle UL-1050 (preferred) or WLAN SD-card UL-1021 for G4 analyzers or
WLAN CF-card UL-1019 for G1 – 3 analyzers.✐Please note: The CF-card requires additional input. See section 8.3 for additional information).
3) Tap > Preferences > Network >a) IP Address and select Automatically.b) Available Networks and select the network.
Ensure that Preferences > Remote Access > Web Server is set to Enabled.
On the smartphone:
4) Open MP Field App.5) Tap to open the Instruments screen.6) Tap your analyzer's serial number to connect.
✐Please note: For subsequent uses, MP Field App should recognized your analyzer and connectautomatically. However, the smartphone may assign a different IP address to the analyzer.If so, repeat steps 5 and 6 to connect.
7.4 Internet Browser for Online Display and Control of the Analyzer
When the analyzer is connected to a network (see Fig.7.2) you can connect to the analyzer froma PC or smartphone using an Internet browser supporting JavaScript™.
Analyzer Settings
You access preferences by tapping on > Preferences (the screen shown in Fig.8.1 willappear).

CHAPTER 7Connection to PC or Smartphone or Measurement Partner Field App
75
Tap Remote Access, or select next to Remote Access and set the Web Server parameters toEnabled. Define sets of User Names and Passwords:• One set for guest use (view only)• One set for administrator use of the analyzer (view and full control)See section 8.5 and section D.11 for more details.
Connect to Analyzer
When you enter the IP address or host name of the analyzer (see sections 8.2. and 8.3) in the addressor location bar of the Internet browser, the following screen appears:
Fig.7.2Type 2250 home page
Click the Help link to get more detailed help on using the Web page.Click the Service link for updating the software or for rebooting the analyzer.Click the View Instrument button to enter the web page for viewing the analyzer only. You mightbe prompted for the Guest Username and Guest Password defined for the Web server (see section8.5).Click the View and Control Instrument button to enter the web page for full access to theanalyzer. You will be prompted for the User Name and Password defined for the web server.
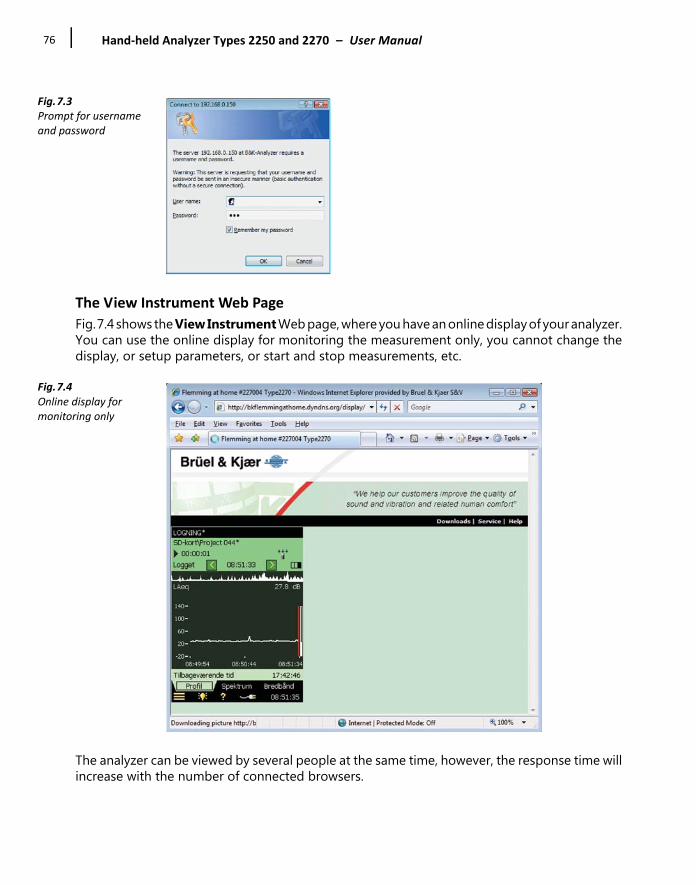
Hand‐held Analyzer Types 2250 and 2270 – User Manual76
Fig.7.3Prompt for username and password
The View Instrument Web Page
Fig.7.4 shows the View Instrument Web page, where you have an online display of your analyzer.You can use the online display for monitoring the measurement only, you cannot change thedisplay, or setup parameters, or start and stop measurements, etc.
Fig.7.4Online display for monitoring only
The analyzer can be viewed by several people at the same time, however, the response time willincrease with the number of connected browsers.
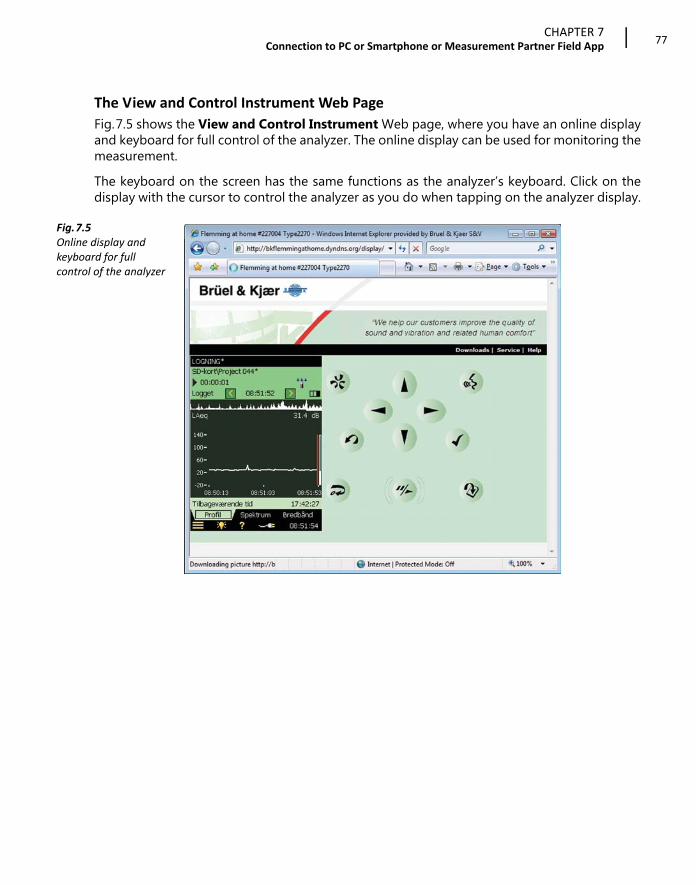
CHAPTER 7Connection to PC or Smartphone or Measurement Partner Field App
77
The View and Control Instrument Web Page
Fig.7.5 shows the View and Control Instrument Web page, where you have an online displayand keyboard for full control of the analyzer. The online display can be used for monitoring themeasurement.The keyboard on the screen has the same functions as the analyzer’s keyboard. Click on thedisplay with the cursor to control the analyzer as you do when tapping on the analyzer display.
Fig.7.5Online display and keyboard for full control of the analyzer

Hand‐held Analyzer Types 2250 and 2270 – User Manual78

79
Chapter 8Advanced Use of the Analyzer –
Tips and Tricks
8.1 Setting your Preferences on the Analyzer
You can specify a number of parameters controlling display settings, power settings, regionalsettings, storage settings and users. These parameters are grouped together under Preferences.You access preferences by tapping > Preferences. The screen shown in Fig.8.1 will appear.
Fig.8.1The Preferences screen
8.1.1 Display
Tap Display, or next to Display, to expand the list of available display settings (Fig.8.2). Theseparameters allow you to select a suitable display colour scheme. This may vary, depending on thelighting conditions at the time of the measurement.
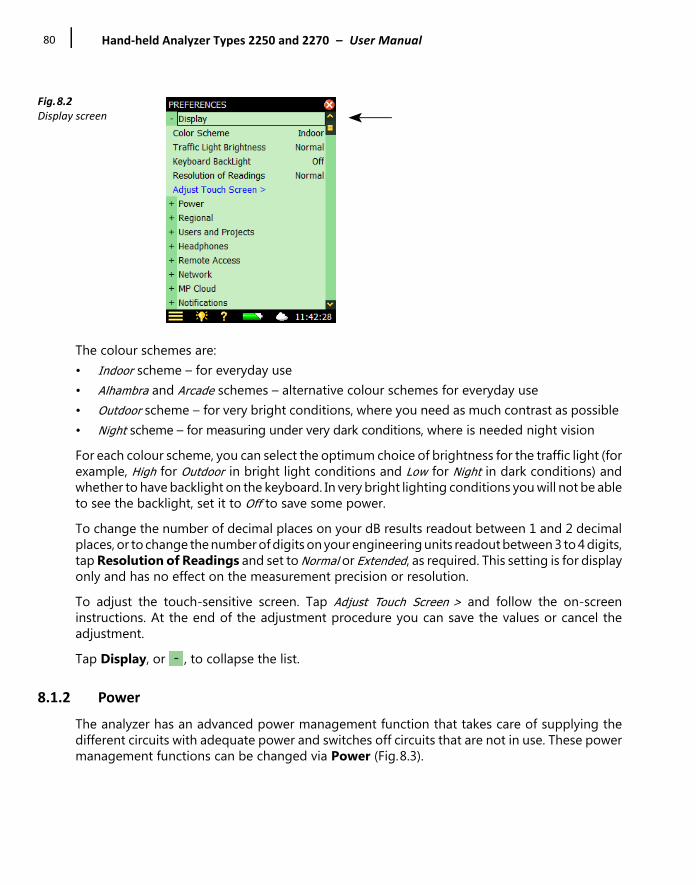
Hand‐held Analyzer Types 2250 and 2270 – User Manual80
Fig.8.2Display screen
The colour schemes are:• Indoor scheme – for everyday use• Alhambra and Arcade schemes – alternative colour schemes for everyday use• Outdoor scheme – for very bright conditions, where you need as much contrast as possible • Night scheme – for measuring under very dark conditions, where is needed night visionFor each colour scheme, you can select the optimum choice of brightness for the traffic light (forexample, High for Outdoor in bright light conditions and Low for Night in dark conditions) andwhether to have backlight on the keyboard. In very bright lighting conditions you will not be ableto see the backlight, set it to Off to save some power.To change the number of decimal places on your dB results readout between 1 and 2 decimalplaces, or to change the number of digits on your engineering units readout between 3 to 4 digits,tap Resolution of Readings and set to Normal or Extended, as required. This setting is for displayonly and has no effect on the measurement precision or resolution.To adjust the touch-sensitive screen. Tap Adjust Touch Screen > and follow the on-screeninstructions. At the end of the adjustment procedure you can save the values or cancel theadjustment.Tap Display, or , to collapse the list.
8.1.2 Power
The analyzer has an advanced power management function that takes care of supplying thedifferent circuits with adequate power and switches off circuits that are not in use. These powermanagement functions can be changed via Power (Fig.8.3).

CHAPTER 8Advanced Use of the Analyzer – Tips and Tricks
81
Tap Power, or next to Power, to expand the list of power settings:• Backlight Dim• Standby• Turn off Backlight (only with G1 – 3 analyzers)• Ext. Power (only with G4 analyzers)
Fig.8.3Power screenLeft: For G1 – 3 analyzersRight: For G4 analyzers
The backlight will be switched on as soon as you operate the analyzer, either by using thekeyboard or stylus on the touch-sensitive screen. The backlight brightness will be one of the sixlevels set by tapping at the bottom of the screen. Tap Minimum for minimum brightness (andpower consumption), or up to Maximum for maximum brightness (and power consumption). Onceyou have chosen the level, tap Close to save the settings.When the analyzer has been left unused for the time specified in the Backlight Dim parameter, thebacklight level will change to the dim level (Minimum):• For G1 – 3 analyzers, this state will hold for the time specified in the Turn off Backlight parameter
(if still left unused). If the analyzer has been left unused for the time specified in the Backlight Dim parameter plus the Turn off Backlight time period, then the backlight will be switched off completely (Fig.8.4). Use the keyboard or tap the screen to switch the backlight on again
• For G4 analyzers, the backlight will never be switched off completely because the Minimum dim level already has the lowest power consumption
Fig.8.4Power Settings overview
‘Backlight Dim’ Parameter
‘Turn off Backlight’Parameter (hardware v. 1 – 3)
Backlight off
Time
‘Standby’ Parameter
040284/2

Hand‐held Analyzer Types 2250 and 2270 – User Manual82
If the analyzer is left unused, not measuring and not communicating over the USB interface, it willgo to Standby after the time specified in the Standby parameter. If in Standby mode, you mustpress to switch the analyzer on again.The analyzer will automatically switch off when it has been in Standby mode without externalpower for more than 30 hours.
✐Please note: • If the analyzer is powered externally, the Standby After parameters are ignored and the analyzer will never go to Standby. However, if the analyzer is left unused for more than Standby After time, the Standby After setting will overrule the Backlight settings and the backlight will be switched off or dimmed.
• Please use the Display in conjunction with the Power to save power during measurements and extend the battery operating time.
G4 analyzers have an Ext. Power setting, which determines whether the analyzer automaticallyswitches on and charges the battery when external power is applied or the battery is just charged.It is recommended to select the Switch On and Charge setting for unattended measurements, toensure measurement will restart in case of power failure.G1 – 3 analyzers have a similar function. There is a small, manual switch at the back of theanalyzer, under the battery pack. To access the switch, remove the battery.When you have made your choices, tap Power, or , to collapse the list.
8.1.3 Regional
Tap Regional, or next to Regional, to expand the list of available regional settings (Fig.8.5).
Fig.8.5Regional screen
Select your preferred settings for Decimal Point and Date Separator and select your preferredDate Format (date and time) from the six different formats provided in the drop-down. Thenselect your Time Zone from the list.

CHAPTER 8Advanced Use of the Analyzer – Tips and Tricks
83
A number of different languages are available for your analyzer. Select your preferred Language – ifit is not in the list, then it might be available for installation using BZ-5503 (Harware version 1 – 3only).Built-in help is provided in the more commonly used languages – if your particular language isnot covered, English will be chosen automatically.Select a Keyboard matching the one you prefer when using your PC.Select the unit system for Wind Speed Unit, Temperature Unit, Dimension Unit and VibrationUnit, as required:• Use the SI setting for measurement units in accordance with the SI standard, for example,
measuring wind speed in m/s • Use the US/UK setting for imperial measurement units, for example, measuring Wind Speed
in mph When you have made your choices, tap Regional, or , to collapse the list.
8.1.4 Users and Projects
Multi‐user Facility
The analyzer can handle more than one user. Each user can have their own set of preferences,templates and jobs and projects – completely invisible to other users. This can also be very usefulin organising large measurement jobs or cases – you can separate the cases completely fromeach other by handling each case as a separate user. The transducers, the calibration setup and the calibration histories of the transducers are commonto all users, as shown in the overview provided in Fig.8.6.
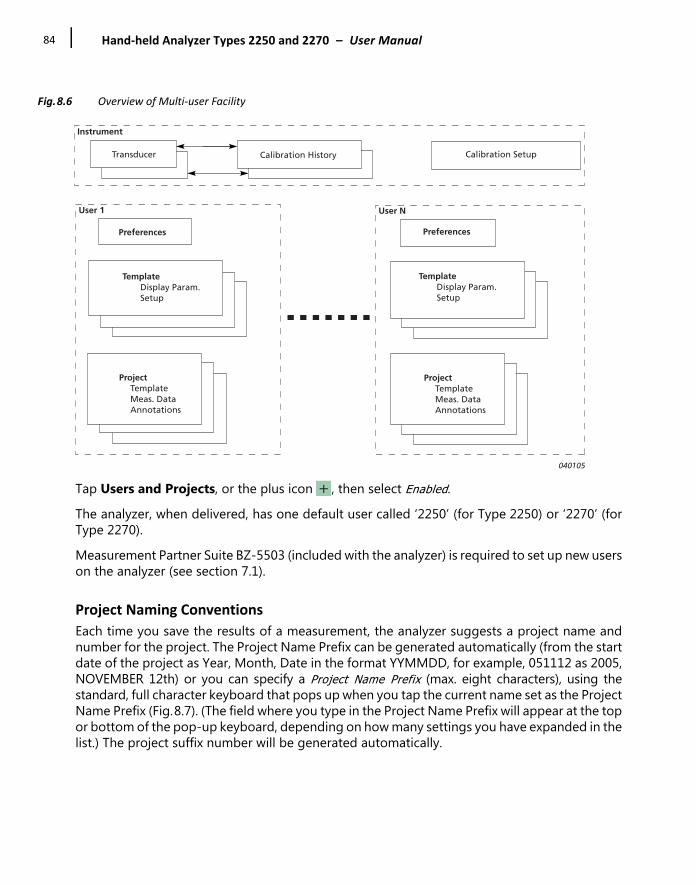
Hand‐held Analyzer Types 2250 and 2270 – User Manual84
Fig.8.6 Overview of Multi‐user Facility
Tap Users and Projects, or the plus icon , then select Enabled.The analyzer, when delivered, has one default user called ‘2250’ (for Type 2250) or ‘2270’ (forType 2270).Measurement Partner Suite BZ-5503 (included with the analyzer) is required to set up new userson the analyzer (see section 7.1).
Project Naming Conventions
Each time you save the results of a measurement, the analyzer suggests a project name andnumber for the project. The Project Name Prefix can be generated automatically (from the startdate of the project as Year, Month, Date in the format YYMMDD, for example, 051112 as 2005,NOVEMBER 12th) or you can specify a Project Name Prefix (max. eight characters), using thestandard, full character keyboard that pops up when you tap the current name set as the ProjectName Prefix (Fig.8.7). (The field where you type in the Project Name Prefix will appear at the topor bottom of the pop-up keyboard, depending on how many settings you have expanded in thelist.) The project suffix number will be generated automatically.
Transducer Calibration History Calibration Setup
Instrument
User 1 User N
Preferences
TemplateDisplay Param.Setup
ProjectTemplateMeas. DataAnnotations
Preferences
TemplateDisplay Param.Setup
ProjectTemplateMeas. DataAnnotations
040105
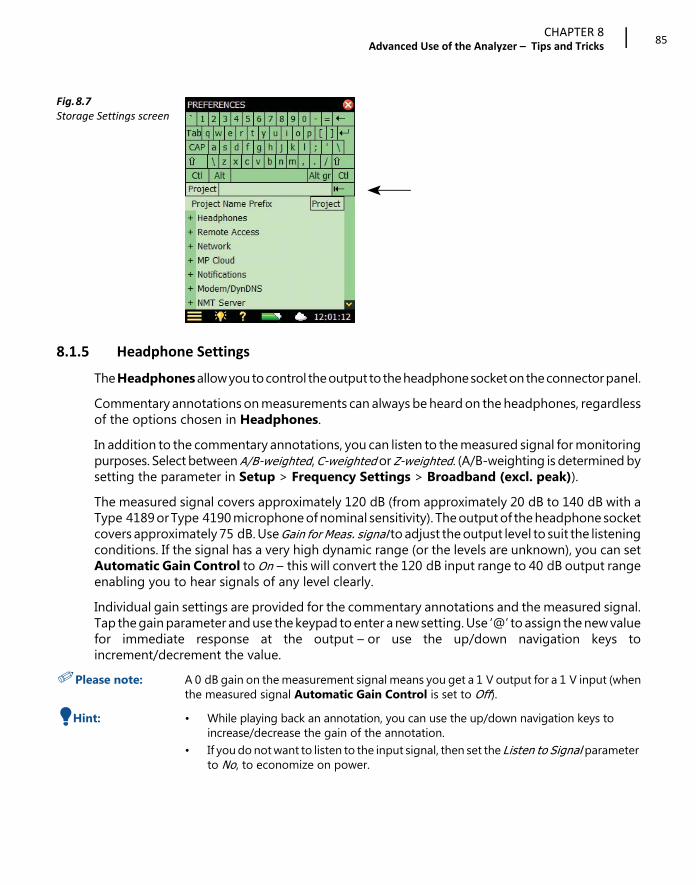
CHAPTER 8Advanced Use of the Analyzer – Tips and Tricks
85
Fig.8.7Storage Settings screen
8.1.5 Headphone Settings
The Headphones allow you to control the output to the headphone socket on the connector panel.Commentary annotations on measurements can always be heard on the headphones, regardlessof the options chosen in Headphones.In addition to the commentary annotations, you can listen to the measured signal for monitoringpurposes. Select between A/B-weighted, C-weighted or Z-weighted. (A/B-weighting is determined bysetting the parameter in Setup > Frequency Settings > Broadband (excl. peak)).The measured signal covers approximately 120 dB (from approximately 20 dB to 140 dB with aType 4189 or Type 4190 microphone of nominal sensitivity). The output of the headphone socketcovers approximately 75 dB. Use Gain for Meas. signal to adjust the output level to suit the listeningconditions. If the signal has a very high dynamic range (or the levels are unknown), you can setAutomatic Gain Control to On – this will convert the 120 dB input range to 40 dB output rangeenabling you to hear signals of any level clearly.Individual gain settings are provided for the commentary annotations and the measured signal.Tap the gain parameter and use the keypad to enter a new setting. Use ‘@’ to assign the new valuefor immediate response at the output – or use the up/down navigation keys toincrement/decrement the value.
✐Please note: A 0 dB gain on the measurement signal means you get a 1 V output for a 1 V input (whenthe measured signal Automatic Gain Control is set to Off).
💡 Hint: • While playing back an annotation, you can use the up/down navigation keys to increase/decrease the gain of the annotation.
• If you do not want to listen to the input signal, then set the Listen to Signal parameter to No, to economize on power.
Hand‐held Analyzer Types 2250 and 2270 – User Manual86
8.1.6 Printers
You can make screen dumps on a printer connected to the analyzer using a standard USB cable,or on G1 – 3 analyzers, the supplied Adaptor AO-0657. Use the Printers to select your preferredprinter.When a printer has been selected under the Printer Used parameter, then the Print Screencommand in the Main Menu list appears. Use this command to print a screen dump of any screenon the analyzer.The printer must either be a mobile thermal printer (from AM Tech or Seiko) or accept the PCL®
printer language:• MPS: Mobile Pro Spectrum – a mobile thermal printer from AM Tech (www.amteq.co.kr) • PCL: printers accepting PCL printer language • PCL Inkjet: suitable for Inkjet printers and supports colour printing• PCL Laser: suitable for laser printers• Seiko DPU: DPU-S245 or DPU-S445 – mobile thermal printers from Seiko Instruments
(www.seikoinstruments.com) PCL is the Printer Control Language developed by Hewlett-Packard (see www.hp.com). For PCLprinters, you can use the Top and Left Margin parameters to position the print on the paper, anduse Width and Height parameters to set the size of the print.
8.2 Modem/DynDNS Settings
You can use the analyzer for monitoring in remote places and control it using MeasurementPartner Suite BZ-5503 via a telephone connection – wired or wireless – using suitable modemsor via network connections. See the overview of possibilities in Table 7.1. When you connect viaa modem, or via a network connection, you will see the contents of the analyzer in the InstrumentTask as if you had made the connection via USB. You then have the same possibilities fortransferring data to the Archives and organising data on the analyzer, as if you were connectedvia the USB connector.The analyzer is connected directly to the Internet through a modem. BZ-5503 or an Internetbrowser will then be able to connect to the analyzer through TCP/IP using the analyzer’s (global)IP address. The setup of the modem connected to the analyzer is described in section8.2.2 – please refer to the BZ-5503 online help for details on how to make a connection.

CHAPTER 8Advanced Use of the Analyzer – Tips and Tricks
87
8.2.1 Connection to the Network using a LAN Modem
Using a 3G modem with LAN interface is a simple and very reliable and powerful way of remotelyconnecting to the analyzer.Set up the modem according to its user manual (usually requires connection to a PC) before youconnect the modem to your analyzer. When ready, connect the modem to the analyzer using aLAN cable. For G1 – 3 analyzers, you will also need the 10/100 Ethernet CF Card UL-1016. (seeOrdering Information on page 226)The Modem parameter should be set to Off.The Airlink Raven XE, Intelligent 3G Ethernet Gateway from Sierra Wireless(www.sierrawireless.com) has been tested.
8.2.2 Connection to Network using GPRS/EDGE/HSPA Modem
✔Best Practice: Turn off the analyzer when connecting the analyzer to a modem.
✐Please note: The SIM card account should include a data subscription and should be usable without apincode.
To use the modem you need to set up the parameters in Dialup Networking (listed below) andset the Modem parameter to GPRS/EDGE/HSPA Dialup.Parameters in Dialup Networking:• APN (Access Point Name) is an identifier required by the network operator. Examples are
Internet, public and www.vodaphone.de• User Name, Password and possibly Domain should be set as required by the network
operatorWhen the Modem parameter is set to GPRS/EDGE/HSPA Dialup, a connection is made using thesettings in Dialup Networking. The Status parameter reflects the current status of the networkconnection – for example, Connected or Disconnected. If the connection fails, then the analyzer willtry to reconnect – until it succeeds, or the Modem parameter is set to Disabled.If the connection succeeds, then the analyzer will automatically get an IP address, which isreadable (but not accessible) in Network – for more details see section 8.3.The IP address is the address on the WAN (Wide Area Network) or Internet. Use this address inBZ-5503 or an Internet browser to connect to the analyzer.
✐Please note: In some cases you might be able to get a static IP address from the network operator,which means that the analyzer will always have the same IP address when connected to thenetwork. However, typically the IP address will be renewed each time the analyzerconnects to the network. In order to deal with this, in BZ-5503 or via an Internet browseryou need to use DynDNS – see section 8.2.3.
Hand‐held Analyzer Types 2250 and 2270 – User Manual88
Modems with USB Interface
The Airlink Fastrack Xtend GPRS, EDGE and HSPA modem from Sierra Wireless(www.sierrawireless.com) has been testedModems with an USB interface can be connected to the USB Type A socket on G4 analyzers.
Modems with RS–232 Serial InterfacesThe following modems have been tested:• FASTRACK Supreme 10 and 20 GSM/GPRS/EDGE Modem from Wavecom • Airlink Fastrack Xtend GPRS, EDGE and HSPA from Sierra Wireless (www.sierrawireless.com)For G4 analyzers, modems with an RS–232 serial interface can be connected using a USB to serialconverter inserted in the USB Type A socket of the analyzer. The following USB to serial convertershave been tested:• USB to RS–232 Converter UL-0250 (see Ordering Information on page 226)• ES-U-1001-R10, ES-U-1001-B10 and ES-U-1001-A from EasySync (www.easysync-ltd.com)• USB to RS232 Standard, USB to RS232 Professional and USB to RS232 Mini STD from U.S.
Converters (www.usconverters.com)For G1 – 3 analyzers, use a compact flash-to-serial converter inserted in the compact flash slot ofthe analyzer. Serial I/O CF Card – Ruggedized from Socket (www.socketmobile.com) has beentested.
CompactFlash Modems (for Hardware Versions 1 – 3)
Compact GPRS™ from Pretec (www.pretec.com) has been tested.Compactflash modems can be inserted directly in the compact flash socket of the analyzer.
8.2.3 DynDNS
If the analyzer is connected to the Internet through a GPRS/EDGE/HSPA modem or a localnetwork with access to the Internet through a DSL modem/router and you want to connect to theanalyzer from a place outside the local network, then you need to know: • Global IP address of the analyzer, or • Global IP address of the DSL modem/router (and ensure that correct port forwarding in has
been set the router – details in the online help for BZ-5503)In some cases, the global IP address is static and will never change, so you connect to the analyzerusing BZ-5503 or an Internet browser using this IP address.Normally when you browse to addresses using an Internet browser you do not use the IP addressitself, but a hostname for it (for example, you would use the hostname www.google.com insteadof ‘74.125.77.99’). This requires a DNS (Domain Name System) provider, which is a kind of Internetphone book that translates hostnames to IP addresses for you.

CHAPTER 8Advanced Use of the Analyzer – Tips and Tricks
89
However, for a GPRS/EDGE/HSPA or even a DSL router, often the global IP address is renewed ateach new connection or at certain time intervals (for example, every two weeks). In this case youwill have to change the IP address in BZ-5503 or the Internet browser accordingly. To avoid this,a service like DDNS (Dynamic Domain Name System) can be used.DDNS is a network service that provides the capability for a modem/router/computer system tonotify a domain name system provider to change, in real time (ad-hoc), the active DNSconfiguration of its configured hostnames and IP addresses. This will ensure that the hostnameyou use will always be updated to reflect the correct IP address. The analyzer supports DDNS provided by the worldwide DDNS service provider ‘DynDNS.com’. The analyzer can then be configured to notify DynDNS.com each time the global IP address is setor changed. When BZ-5503 or an Internet browser connects to the analyzer, it then uses ahostname defined by DynDNS.com. From DynDNS.com it then gets the updated IP address.You need to make an account at DynDNS.com, specifying a user name and a password for theaccount and a hostname (for example, 'MyBK2250.dyndns.org') identifying your analyzer.In the analyzer you need to specify the Hostname, Username and Password and set Active to Yes inPreferences, under Modem/DynDNS settings. Each time the analyzer detects a change in the IPaddress it notifies DynDNS.com.
✐Please note: To avoid too much traffic at DynDNS.com, the analyzer ensures that this service does notallow updates of settings more frequently than every 10 minutes. So you may experienceup to a 10 minute wait for DynDNS settings to update.
8.3 Network Settings
The analyzer can be connected to a Local Area Network (LAN) through an Ethernet cable or to aWi-Fi network using equipment conforming to the IEEE 802.11a/b/g/n standard. This connectioncan be used to synchronize measurement and setup data with a host PC using BZ-5503.The analyzer supports Transmission Control Protocol/Internet Protocol (TCP/IP). This requires the analyzer to have a unique address on the network. This address is called an IPaddress and consists of four sets of 3-digit numbers, for example, 010.116.121.016.The IP address can be obtained in different ways:• Automatically • Using DHCP
A Dynamic Host Configuration Protocol (DHCP) Server on the network assigns automaticallyan IP address to the analyzer when connected to the network. This is the most common wayof setting up IP addresses
• Using Link-local If no address is automatically assigned by the DHCP Server, then after a few seconds theanalyzer will use an address from the Link-local address range 169.254.x.x
Hand‐held Analyzer Types 2250 and 2270 – User Manual90
This will most likely be the case when connecting the analyzer directly to a PC using anEthernet crossover cable
• Manually You setup the IP address manuallyThis will typically be the case in a private network without a DHCP Server
8.3.1 Connecting to the Analyzer
Wired LAN Connection
• Use a “straight-through” (standard) Ethernet cable with RJ45 connectors at both ends to connect the analyzer to the network (via a hub, switch or router)
• Use a “crossover” Ethernet cable with RJ45 connectors at both ends to connect the analyzer directly to a PC
G4 analyzers have an Auto-MDIX facility, allowing you to use either a straight-through orcrossover cable to connect to a network or PC.With G1 – 3 analyzers, only Type 2270 has a built-in LAN socket on the connector panel (seesection 2.3).
Wi‐Fi Connection
Types 2250 and 2270 provide a wireless LAN option using a Wi-Fi device.Types 2250 and 2270 with hardware version 4 accept the following:• USB Wi-Fi Dongle UL-1050 (preferred)• P322 802.11abg SD WLAN from Socket Mobile (www.socketmobile.com)Types 2250 and 2270 with hardware versions 1 – 3 accept the following compact flash LAN andWLAN cards:• 10/100 Ethernet Ruggedized CF Card from Socket Mobile
(www.socketmobile.com) – Brüel & Kjær order number UL-1016 • Go Wi-Fi!® P500 CF WLAN, rev. B and rev. C from Socket Mobile – Brüel & Kjær order number
UL-1019
CHAPTER 8Advanced Use of the Analyzer – Tips and Tricks
91
8.3.2 Parameters in Network Settings
Location
Use the Location parameter to specify a text up to 20-character long, identifying the analyzeror location of the analyzer. The Location will be displayed on the PC as well as the serialnumber of the analyzer when browsing for analyzers in BZ-5503 and when connected usingthe online display.
💡 Hint: The Location parameter is useful for both USB and LAN connections
Network Connection
• G1 – 3 analyzers: Type 2250: – None: (default) – CF Socket: Select this to use an Ethernet CF Card in the Compact Flash socketType 2270:– LAN Socket: (default) Select this to connect via a LAN cable. This is disabled if an Ethernet
CF card is inserted in the Compact Flash socket– CF Socket: Select this to use an Ethernet CF Card in the Compact Flash socket
• G4 analyzers (for all analyzer types):– LAN Socket: (default) Select this to connect via a LAN cable. LAN settings are hidden if a
Wi-Fi Dongle or an SD WLAN card is inserted– SD Socket: Automatically set when an SD WLAN card is in the SD card slot– WiFi Dongle: Automatically set when USB Wi-Fi Dongle UL-1050 is in the USB slot
Set IP AddressThis setting is common to LAN and Wi-Fi connections.Automatically: Obtain an IP address from a DHCP server – if no server available, then a Link-local address will be setManually: You have to set the IP Address, Subnet Mask, Default Gateway, Preferred DNSand Alternate DNS (see below)
IP Address
The IP address of the analyzerSelectable if Set IP Address = Manually
Subnet Mask
The Subnet Mask combined with the IP Address identifies the network segment theanalyzer is onSelectable if Set IP Address = Manually

Hand‐held Analyzer Types 2250 and 2270 – User Manual92
Default Gateway
Address to a gateway for routing to another networkSelectable if Set IP Address = Manually
Preferred DNS
The IP address of the primary DNS server
Alternate DNS
The IP address of the secondary DNS server
MAC Address
The Media Access Control (MAC) address of the network adaptor (LAN or Wi-Fi) in use. TheMAC address is a unique identifier assigned to the network adaptor. This field is forinformation only.
Status
The status of the network connection:• Operational: the network adaptor can be used for a connection• Non-operational: the network adaptor cannot be used
Parameters for Wi‐Fi Only
Name
Name (SSID) of the network you want to connect to. Update the name either by: • entering a name directly, or• tapping on Available Networks and selecting a name from the list
✐Please note: G4 analyzers will automatically detect the security needed and prompt you for a password.Please enter the password for the network. If you already are connected to the networkyou can select to forget the network.
Available Networks
Tap the line to get a list of available networks. Tap a name in the list to connect to this network.The name is inserted in the Name line above this line. Each network name is preceded withSignal Strength information, ranging from Excellent (displayed as ‘• • • • •’) down to No Signal(displayed as no dots at all)
Security (G1 – 3 Only)
Select the Security as required by the network: Open, Shared, WPA PSK or WPA2 PSK. Open andShared are for Wired Equivalent Privacy (WEP) Infrastructure mode. WPA PSK is for Wi-Fi

CHAPTER 8Advanced Use of the Analyzer – Tips and Tricks
93
Protected Access (WPA) with Pre-shared Key (also called Personal mode). WPA2 is anenhanced version of WPA
Encryption (G1 – 3 Only)
Select the Encryption as required by the network: None, WEP Enabled, AES Enabled orTKIP Enabled. None is for Open security. WEP Enabled is for Open and Shared security. AES andTKIP Enabled are for WPA PSK and WPA2 PSK security
Encryption Key (G1 – 3 Only)
Insert the Encryption Key required by the network. The key will be displayed until you pressEnter, then it will be replaced by ‘ *** ’
8.4 Notifications
The analyzer can send you a daily status or notify you if noise level exceeds a set threshold level,if disk space is getting low or external power has disappeared, etc. This is done via SMS (textmessage) or email, as described in this section. The SMS/email notification contains a short statusreport for the analyzer. This facility is especially useful if the analyzer is left for unattendedmonitoring.
8.4.1 Alarm Settings
If one or more of the following alarms occur, then a notification will be issued as either an SMSor an email, depending on your equipment and settings. If the notification fails (for example, theconnection has been lost), then the analyzer will retry to send the notification once more after fiveminutes.
Table 8.1 Alarm Settings
Alarm Type Condition Comment
Power On When analyzer is switched on or reboots
Indicates start from a timer, or a power failure, or unexpected behaviour
Measurement State
When a measurement starts or stops
Indicates measurement finished – or unexpected behaviour
CIC When Charge Injection Calibration fails
Indicates possible measurement problem
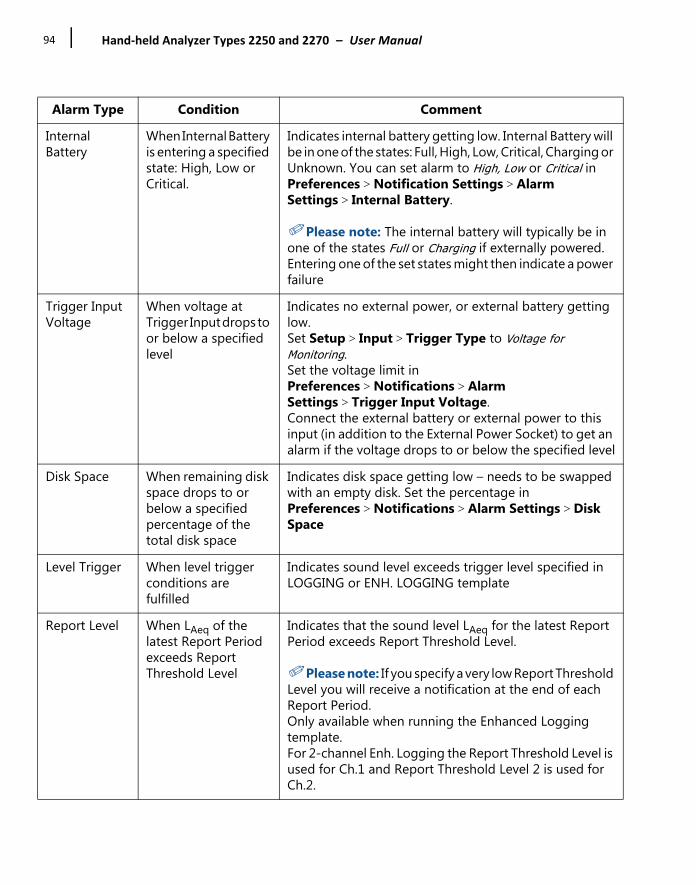
Hand‐held Analyzer Types 2250 and 2270 – User Manual94
Internal Battery
When Internal Battery is entering a specified state: High, Low or Critical.
Indicates internal battery getting low. Internal Battery will be in one of the states: Full, High, Low, Critical, Charging or Unknown. You can set alarm to High, Low or Critical in Preferences > Notification Settings > Alarm Settings > Internal Battery.
✐Please note: The internal battery will typically be in one of the states Full or Charging if externally powered. Entering one of the set states might then indicate a power failure
Trigger Input Voltage
When voltage at Trigger Input drops to or below a specified level
Indicates no external power, or external battery getting low. Set Setup > Input > Trigger Type to Voltage for Monitoring. Set the voltage limit in Preferences > Notifications > Alarm Settings > Trigger Input Voltage. Connect the external battery or external power to this input (in addition to the External Power Socket) to get an alarm if the voltage drops to or below the specified level
Disk Space When remaining disk space drops to or below a specified percentage of the total disk space
Indicates disk space getting low – needs to be swapped with an empty disk. Set the percentage in Preferences > Notifications > Alarm Settings > Disk Space
Level Trigger When level trigger conditions are fulfilled
Indicates sound level exceeds trigger level specified in LOGGING or ENH. LOGGING template
Report Level When LAeq of the latest Report Period exceeds Report Threshold Level
Indicates that the sound level LAeq for the latest Report Period exceeds Report Threshold Level.
✐Please note: If you specify a very low Report Threshold Level you will receive a notification at the end of each Report Period.Only available when running the Enhanced Logging template.For 2-channel Enh. Logging the Report Threshold Level is used for Ch.1 and Report Threshold Level 2 is used for Ch.2.
Alarm Type Condition Comment

CHAPTER 8Advanced Use of the Analyzer – Tips and Tricks
95
Table 8.2 Content of Notification
✐Please note: Some of the information listed above may not be available, depending on the conditionswhen the notification was sent, for example, no measurement values will be availableimmediately after a power on.
8.4.2 Text/SMS Notifications
Notifications via SMS (text message) can be used if you have connected aGSM/GPRS/EDGE/HSPA modem to the analyzer (section 8.2.2) and set Modem to Disabled (a textmessage cannot be sent if the modem is set to GPRS/EDGE/HSPA Dialup).In addition to sending notifications initiated by alarms, you can send an ‘Info’ text to the analyzerand ask for an SMS notification, after which you will get a notification within 30 seconds.You must set > Preferences > Notifications > SMS:• Phone Number to the appropriate number• Active to Yes
Information Type Content
Reason for notification Test, Alarm or Status followed by a short description
Time of notification Date and Time
Instrument ID Serial No. and Location
Status of current Disk Free memory / Total memory
Status of Internal Battery Full, High, Low, Critical, Charging or Unknown
Trigger Input Voltage (if available)
The voltage
Measurement Status (if available)
Running, Paused or Stopped
No. of Signal Recordings (if available)
The number of signal recordings made since start of measurement
Latest CIC Result (if available) Passed, Background noise too high, Ratio outside tolerances, Ratio deviates from Ref., Undefined Ref., or Undefined. For 2-channel measurements: One CIC result per channel
Current value of LAF (if available) The value. For 2-channel measurements: One CIC result per channel
Report Threshold Level The value
Report Level LAeq The value

Hand‐held Analyzer Types 2250 and 2270 – User Manual96
You can also add a Name for the number for easier identification.You can setup two individual SMS phone numbers for sending the SMS notification to tworecipients.Set Notification to SMS and a notification will be sent by SMS to the active phone numbers, whenany of the alarm conditions are met, or if the analyzer receives an ‘Info’ SMS.You can test the system by tapping on > Send Notification via SMS.
✐Please note: • Two to three text messages will be used to send the complete notification – depending on the content and language settings.
• Text messages cannot be sent or received while the analyzer is connected to BZ-5503 or displayed online.
8.4.3 Email Notifications
Email notifications can be used if the analyzer is connected to a network with access to a mailserver. This can typically be done if the analyzer is connected through LAN or by aGPRS/EDGE/HSPA modem (see section 8.2.2 and section 8.3).Go to Preferences > Notifications > E-mail and setup details for the e-mail account under theTo parameter. The details consist of the SMTP server name, the SMTP Port used, whetherSSL/TLS is required or not, the Account, the User Name and Password for the account – pleaseconsult section D.10 (Appendix D) and your email provider for more details.Set Notification to E-mail and a notification will be sent by email when any of the alarmconditions are met.You can test the system by tapping on > Send Notification via E-mail.Example of email:
Subject: E-mail from 2479719 Abbey Road Test: Manual e-mailTest: Manual e-mail29-04-2009 12:51:16Instrument 2479719 Abbey RoadSD-Card 383 MB / 483 MBInternal Battery ChargingTrigger Input Voltage 13.5VMeasurement Status RunningNo. of Signal Recordings 13CIC Result PassedLAF 45.8dB

CHAPTER 8Advanced Use of the Analyzer – Tips and Tricks
97
8.5 Web Server
To connect to the analyzer using an Internet browser, the following conditions must be fulfilled:• The analyzer must be connected to a network as described in sections 8.2.2, 8.2.3 and 8.3• The Internet browser must support JavaScript™The Web page of the analyzer has been tested on the following Internet browsers:• Microsoft® Internet Explorer®, from version 7 • Mozilla® Firefox®, from version 3 • Google Chrome™, from version 2 • Apple® Safari®, from version 4You may also be able to connect to the analyzer using Internet browsers on smartphones suchas an iPhone®.
8.5.1 Password Protection
Connection to the analyzer is password protected. There are two levels of protection:• Guest – for viewing only• Administrator – for viewing and controlling the analyzer
User Name and Password
Under Preferences, set User Name and Password individually for the Guest and forAdministrator accounts.You need to specify User Name and Password for the Administrator, however, you can specifywhether a guest requires a login or not.
8.6 Connecting to Weather Stations and GPS Receivers
8.6.1 Weather Stations
The analyzer can be connected to the following weather stations:• Weather Station MM-0316 – for measurement of wind speed and wind direction• Weather Station MM-0256 – for measurement of wind speed, wind direction, ambient
temperature, ambient pressure, relative humidity and rainfallA weather station can be connected to the analyzer using USB Adaptor ZH-0698. For Noise Monitoring Terminal Type 3639-A, B and C details on how to mount and connect theweather station using Utility Unit ZH-0689 or ZH-0705, please refer to Noise Monitoring TerminalType 3639-A, B and C – User Manual BE 1818.
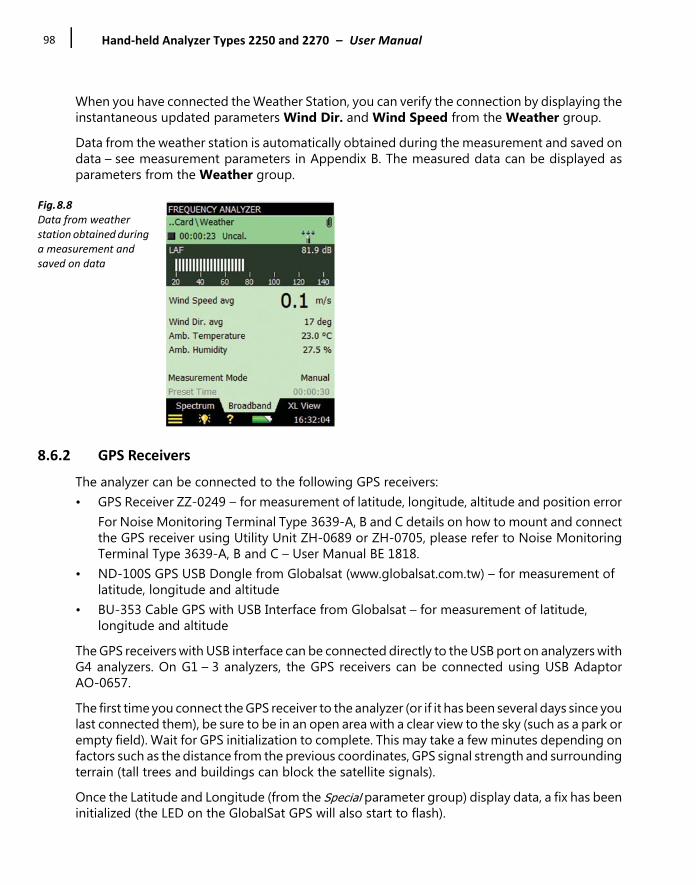
Hand‐held Analyzer Types 2250 and 2270 – User Manual98
When you have connected the Weather Station, you can verify the connection by displaying theinstantaneous updated parameters Wind Dir. and Wind Speed from the Weather group.Data from the weather station is automatically obtained during the measurement and saved ondata – see measurement parameters in Appendix B. The measured data can be displayed asparameters from the Weather group.
Fig.8.8Data from weather station obtained during a measurement and saved on data
8.6.2 GPS Receivers
The analyzer can be connected to the following GPS receivers:• GPS Receiver ZZ-0249 – for measurement of latitude, longitude, altitude and position error
For Noise Monitoring Terminal Type 3639-A, B and C details on how to mount and connectthe GPS receiver using Utility Unit ZH-0689 or ZH-0705, please refer to Noise MonitoringTerminal Type 3639-A, B and C – User Manual BE 1818.
• ND-100S GPS USB Dongle from Globalsat (www.globalsat.com.tw) – for measurement of latitude, longitude and altitude
• BU-353 Cable GPS with USB Interface from Globalsat – for measurement of latitude, longitude and altitude
The GPS receivers with USB interface can be connected directly to the USB port on analyzers withG4 analyzers. On G1 – 3 analyzers, the GPS receivers can be connected using USB AdaptorAO-0657.The first time you connect the GPS receiver to the analyzer (or if it has been several days since youlast connected them), be sure to be in an open area with a clear view to the sky (such as a park orempty field). Wait for GPS initialization to complete. This may take a few minutes depending onfactors such as the distance from the previous coordinates, GPS signal strength and surroundingterrain (tall trees and buildings can block the satellite signals). Once the Latitude and Longitude (from the Special parameter group) display data, a fix has beeninitialized (the LED on the GlobalSat GPS will also start to flash).

CHAPTER 8Advanced Use of the Analyzer – Tips and Tricks
99
In some cases initialization can take up to several minutes depending on the conditionsmentioned above before complete GPS data are displayed on the screen. The GPS may get afaster fix if connected through a small USB cable (delivered together with the GPS).If a GPS receiver is connected when data are saved in a project, a GPS note is automatically createdas an annotation with the GPS information.See more details on GPS notes in section 3.4.
8.7 Preparing your Measurements
You can prepare your measurements in advance by making job folders, setting up the correctmeasurement parameters in the templates, defining settings for metadata and by makingchecklists (see example in Fig. 8.8) either as memos containing addresses and phone numbers ofrelevant people, or notes that have been partly filled-in beforehand, where you just have to fill inthe final information on location. The notes can be attached to jobs as annotations, and can becopied onto projects, when necessary.
Fig.8.9Example notes screen
When you have finished typing in your note, tap to accept the changes and save it as a textannotation. See section 3.4 for more details on annotations.
8.7.1 Metadata
For easy and convenient use of metadata, define settings for any metadata entered and displayedon the Annotations screen (see section 3.4) in advance.

Hand‐held Analyzer Types 2250 and 2270 – User Manual100
To define settings for each of the 30 metadata:✐Please note: Ensure that you do not have any saved data displayed on the screen.
1) Tap Paperclip .If the Paperclip icon is not visible, you have no metadata or annotations. To access theAnnotations screen, use the navigation pushbuttons ( , , , ) to move the field selectorinto the top right corner of the Status Field. Tap Paperclip .
💡 Hint: If you do not have any metadata defined, you can create a set of default metadata to havea convenient starting point for defining your own metadata. Tap and check the Insertdefault metadata checkbox and tap OK.
✐Please note: Inserting default metadata will overwrite existing metadata!
2) Tap the Edit icon in front of the metadata you want to edit (Fig.8.10) to define:• Metadata:
Enabled (visible and editable on the Annotations screen) orDisabled (invisible on the Enabled (visible and editable on the Annotations screen)
• Name: Insert a name preceding the metadata value when displayed on the Annotationsscreen
• Type: Select a type suitable for your metadata. Select between:Text: The metadata is the text you enter or edit using the alphanumeric keyboardPick List: The metadata are selected from a list of up to 30 user-defined textsNumber: The metadata number is entered using the numeric keyboardIndex: The metadata number is automatically incremented after creating the projectNot defined: The metadata are removed from the project. This will be the initial state ofmetadata for old projects without metadata.
• Entry No. (for type = Pick List): The entry number for the text to be defined in the pick list. Select the required numberand enter text in the Entry Text field
• Entry Text:For Type = Text: The textFor Type = Pick List: The text for the selected Entry No.
• Current No.: For Type = Number: The number• Current Index: For Type = Index: The index• Step (for Type = Index ):
The Current Index is incremented with Step after creation of a project The index wraps around when exceeding Upper Limit or getting below Lower Limit
✐Please note: Step can be negative– Upper Limit: For Type = Index: The upper limit of the index– Lower Limit: For Type = Index: The lower limit of the index

CHAPTER 8Advanced Use of the Analyzer – Tips and Tricks
101
At the top of the screen you can set a checkmark to use the settings for this metadata on newprojects when closing the display. The checkmark is disabled for changes to the definition of the metadata currently in use becausethis will always be used for new projects, however, when you are editing or looking at metadatafrom a previously saved project you can decide whether to use the settings on new projects tooor keep the changes to the project only.
Fig.8.10Edit metadata
8.7.2 Timers and Automatic Measurements
Automatic control of the analyzer is available via one or more of the analyzer’s timers (up to ten).The purpose of a timer is to initiate measurements in the absence of an operator. Basically, a timerwill:• Switch on the analyzer at a preset time• Load a preselected template• Start a measurement as specified in the template• Stop the measurement after a preset time defined by the Timer Setup• Save the measurement• Switch the analyzer off• Repeat the above a preset number of times at preset intervalsFor a timer to work, the analyzer must be in the ‘switched off’ state.A timer will never interrupt the analyzer if it is already in use manually. If a switch-on time is setduring the time the analyzer is in use, the timer opportunity is lost.You can control the analyzer during a timer-initiated measurement as long as this does not affectthe measurements. If you try to change any parameters affecting the measurement you will bewarned of this. If you persist, the analyzer will revert to manual control and timer control cannotbe resumed.

Hand‐held Analyzer Types 2250 and 2270 – User Manual102
The Timer Setup lists the timers that have been defined previously on the analyzer (that is, addedby you or previous users).
Fig.8.11Example Timer Setup
In the topmost line you can add other timers by tapping on the Add New Timer icon . You candelete a timer from the list by tapping on the Delete Timer icon . Only timers created by thecurrent user can be deleted. To delete a timer defined by another user, you have to logon as theother user and then delete the timer.For each timer you can specify:• State: Enable or disable the timer• Name: Name the timer• Template: Select the template you want to use for the measurement
✐Please note: Reverberation Time templates are not available for timer control• Start Time: Set the start time – at least 3 minutes ahead of current time• Preset Time: Set the preset time for the measurement – regardless of the settings in the
template used by the timer• Stop Time: The time when the measurement stops – for information only• No. of Starts: Set to the total number of times you want to start the measurement• Start Every: The time interval between the start of each successive measurement. This interval
must be greater than Preset Time + 3 minutes• User: The user who specified the timer. Cannot be changed
✐Please note: When using timers for automatic measurements, ensure the meter is connected to a stablepower supply. It is advised to set the Ext. Power switch to Charge battery only – seesection 8.1.2.

103
Chapter 9Updating and Upgrading Applications,
Maintenance, Calibration and Troubleshooting
9.1 How to Install New Applications
Sound Level Meter Software BZ-7222, Frequency Analysis Software BZ-7223, Logging SoftwareBZ-7224, Enhanced Logging Software BZ-7225, Signal Recording Option BZ-7226,Reverberation Time Software BZ-7227, Building Acoustics Software BZ-7228, FFT SoftwareBZ-7230, Tone Assessment Option BZ-7231, Noise Monitoring Software BZ-7232 and EnhancedVibration and Low Frequency Option BZ-7234 are pre-installed on Types 2250 and 2270. Inaddition, 2-channel Option BZ-7229 (and the 2-channel modules for Sound Level Meter,Frequency Analysis, Logging, Enhanced Logging and Building Acoustics software) and SoundIntensity Software BZ-7233 are pre-installed on Type 2270. However, a valid license is requiredto run the software. If you have purchased the analyzer together with the softwareapplication(s), then the relevant license(s) will come pre-installed on the analyzer.If you purchase a separate software application for your analyzer, then you have to install thelicense onto the analyzer. This is done using Measurement Partner Suite BZ-5503, please consultthe online help included with the BZ-5503 software for instructions on how to install a license.Tap , on the analyzer’s screen, then About to get a list of installed software and licenses.
9.2 How to Update/Upgrade Applications and Install New Languages
Brüel & Kjær recommends that you always use the most current software available. New versionsof the analyzer software are available for download via the Brüel & Kjær website(www.bksv.com). To do this, use Measurement Partner Suite BZ-5503, or connect the analyzerdirectly to the Internet to download. Some software versions will be free updates, and some willbe upgrades requiring that a new license is purchased.
9.2.1 Update/Upgrade using BZ‐5503
BZ-5503 can be used for updating or upgrading new software applications on your analyzer. Itcan even downgrade to specific software versions if required by type approval authorities. UsingBZ-5503, you can also install licenses for the specific applications; and, if you have hardwareversion 1 – 3, install your preferred language (with G4 hardware, all languages are pre-installedin the analyzer). Installation requires a USB connection between BZ-5503 and the analyzer.
Hand‐held Analyzer Types 2250 and 2270 – User Manual104
BZ-5503 software will clearly indicate if the new software version is an update (free of charge) oran upgrade (license fee). Please consult the on-line help included with BZ-5503 for instructionson how to install upgrades/updates of the software, together with your preferred language.
9.2.2 Update through the Internet
The analyzer can update software by itself, if it is connected to the Internet – see section 7.1.This method is particularly useful if the analyzer is used for long-term monitoring, and you do notwant to go to the measurement site for servicing (that is, you want to disturb the measurementas little as possible).
✐Please note: • The method is used for updating the software with the latest version available from the Brüel & Kjær website. The languages already installed will be updated at the same time. If you have G1 – 3 analyzers, you cannot install new languages or licenses – to do this, you must use BZ-5503.
• This can be done remotely if you connect to the online display using either BZ-5503 or an Internet browser.
To update via the Internet:1) Tap , on the analyzer’s screen, then About to get a list of installed software and licenses. 2) Scroll down to the bottom of the screen and tap the Check for updates on the web…> link, the
Software Update screen appears – see Fig.9.1and Fig.9.2.3) Click on the Check for Updates button to check for the latest updates.
This will connect to the Brüel & Kjær update server. If a new software version is available, thebuild version will be displayed and you can decline or start the update (you will be warned,if the new version requires a new license). If the versions that are available are not later thanthose already installed you will be told so and the update will be terminated.
4) If you choose to update the analyzer, the software will start downloading to the SD or CF card(G1 – 3 analyzers) already inserted in the analyzer. You need at least 200 MB of free space onthe memory card. Depending on the speed and quality of the Internet connection, this cantake from a few minutes to several hours. If the connection is lost, then the download willautomatically continue when connection is established again.
✐Please note: The analyzer can continue measuring during the download period.
5) When download is complete, the measurement is paused and normal use of the analyzer isprevented. Connections to the analyzer are terminated and the upgrade of the analyzer willstart. This will take 10-15 minutes and the analyzer will reboot when finished. Any unsavedlogging data will be saved and the analyzer is ready to use again.
6) Connect to the analyzer again and verify the new software version by tapping , on theanalyzer's screen, then About.
To continue the measurement, press the Start pushbutton.

CHAPTER 9Updating and Upgrading Applications, Maintenance, Calibration and Troubleshooting
105
✐Please note: If you have set up your analyzer for email notifications (see section 8.4), you will get anemail in step 4) when the analyzer is paused, and you will get a new e-mail in step 5), whenthe analyzer has rebooted and is ready for connection again.
Fig.9.1About screen – showing the ‘Check for updates on the Web link’
Fig.9.2Software update screen – showing the ‘Check for updates button’
9.2.3 Downgrade to an Earlier Version
It is possible to downgrade to an earlier version of the software:1) Change the latest part of the server address (Fig.9.2) to the requested software package, for
example, SW22.
2) Tap Check for updates.3) Follow the procedure described in section 9.2.1 or section 9.2.2.
✐Please note: Only software packages equal to or above SW24 can downgrade to another package.Software packages down to SW21 are available for update through Internet.
Hand‐held Analyzer Types 2250 and 2270 – User Manual106
9.3 How to Move a License
If you have more than one analyzer, you may want to share application software between theanalyzers. You can do this by moving the license from one analyzer to another by usingMeasurement Partner Suite BZ-5503, together with the License Mover VP-0647. If you lend out your analyzer, you may want to temporarily uninstall applications not needed. Thiscan be achieved by moving the license of the application to License Mover VP-0647. When neededagain, you move the license back to your analyzer.Please consult the on-line help included with the BZ-5503 software for instructions on how tomove a license.
9.4 Troubleshooting
9.4.1 Measurements
If your measurement seems to be wrong, then:• Check the cabling, if any• Check that the microphone, including preamplifier, is correctly mounted in the top socket (or
correctly connected to the extension cable)• Check that the Input parameter is set to Top Socket/Rear Socket in agreement with how you
are going to use the input. This is found by tapping > Setup > Input• Check that the transducer you have mounted on your analyzer is selected as the Transducer
parameter, this is also found on the Setup screen• Check whether the parameters for the selected transducer (Transducer) are set correctly,
especially the Microphone Type and Polarization Voltage parameters. These are found by tapping > Transducers
• Check that the Sound Field and Windscreen Correction parameters have been set correctly These are found by tapping > Setup > Input
• Check if the calibration is OK (make a new calibration using an external calibrator)
9.4.2 SD/CF Cards and USB Sticks
The Logging, Enhanced Logging and Signal Recording software requires that measurements aresaved on memory cards – SD or (with G1 – 3 analyzers) CF. A USB memory stick can be used fromhardware version 4.
Device Format and Speed
In order to ensure reliable operation with the memory device, the format of the file system andthe speed of the device are tested. Upon insertion, the analyzer verifies the format of the memorydevice’s file system. If the file system is not optimal for usage with the analyzer, then you areprompted to format it. You will be guided through the process.

CHAPTER 9Updating and Upgrading Applications, Maintenance, Calibration and Troubleshooting
107
When the format of the file system has been accepted, then the speed of the device is tested. Thetest writes data to the device and measures the writing speed. The test takes less than a minute.If the speed test is successful, then you can proceed using the device, otherwise you should useanother memory device or try reformatting the device (if not done already).
Problems with Storing or Recalling Data
If you experience problems in storing or recalling data on the memory device, you can check andrepair the integrity of the file system on the device or even re-format it, by doing the following:1) Insert the memory device in the correct slot of the connector panel of the analyzer.2) You will be notified that a memory device has been inserted – select Yes to change the default
measurement path to it.3) Tap > Explorer4) Tap to go up folder levels until you have reached the topmost level with a list of the
available memory devices.5) Tap the name of the device (not the icon) to get a list of available commands. 6) Select Check and Repair to start the procedure. If any errors are found in the file system, they
are fixed. When finished, you will be informed whether the memory device was OK or thaterrors have been fixed.
✐Please note: The checking procedure can take several minutes, depending on the size of the device.
To format a memory device:CAUTION: • All data on the device will be erased during the formatting process.
• Do not remove the device or switch off the analyzer during the procedure – this might damage the file system and data and make the device unusable.
7) Select Format to start the formatting procedure.✐Please note: • The formatting procedure can take several minutes – depending on the size of the
device• The read/write performance of SD and CF memory cards and USB sticks varies a lot. The
performance depends on the manufacturer of the memory device, the type of device, the size of the device, how much it has been used, how fragmented the memory is, and even the day of production of the device. Two ‘identical’ memory devices can have a different performance because the manufacturer has changed the internal technology without notice.
• The cards delivered by Brüel & Kjær have all been tested for their read/write performance in the analyzer and can be used for the applications available in the analyzer. If you need more (or other) types of memory devices, please consult your local Brüel & Kjær representative.
💡 Hint: In general, you should select devices aimed for the industrial or professional photographermarket.

Hand‐held Analyzer Types 2250 and 2270 – User Manual108
✔Best Practice: Remember to regularly re-format the device (especially before a long unattendedmeasurement) – this will ensure the best performance of the device.
8) Select Test Speed, if you want to check the device’s file speed.
9.4.3 Battery Pack and Recalibration of Battery Charge Indicator
The software keeps the capacity of the battery pack updated. Over time the total capacity of thebattery pack decreases. If you find that the ‘Time Remaining’ estimate (tap the Battery icon to get this information) does not match the real time remaining (for example, the analyzerswitches off automatically because of lack of power while the Time Remaining estimate indicatesat least ½ hour), then you should manually re-calibrate the capacity of the battery pack. This isdone using the following method:1) Drain all the power from the battery:
a) Switch the analyzer on.b) Disconnect external power.c) Disconnect the analyzer from the PC.d) Set > Preferences > Power > Standby After to Never.e) To drain the battery faster, set Backlight On to Always (same menu) and select the
maximum level of display backlight (tap Backlight at the bottom of the screen).f) Leave the analyzer until the analyzer switches itself off
2) Charge the battery fully (at least 10 hours):a) Connect the Mains Power Supply ZG-0426 to the analyzer.b) Switch the analyzer on (and leave it on) and remember to reset the Standby After and
Backlight On to your preferred settings.c) Tap the Battery icon for the battery condition. This will indicate ‘Calibrating
Battery’ initially. Let the battery charge until the battery charge indicator just below thepower socket starts flashing green (hardware versions 1–3) or changes from red togreen (G4 analyzers) and the ‘Calibrating Battery’ indication disappears from the pop-up window.
9.4.4 Touch Screen
If tapping with the stylus on the screen seems to be getting more inaccurate, you can adjust thetouch sensitive screen, as follows:1) Tap > Preferences > Display.2) Tap Adjust Touch Screen and follow the on-screen instructions.
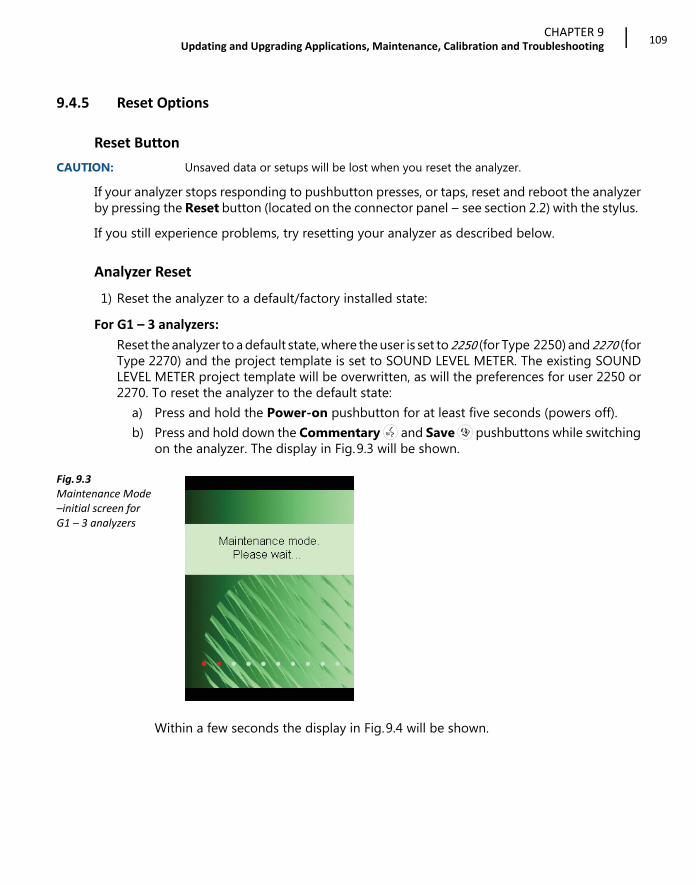
CHAPTER 9Updating and Upgrading Applications, Maintenance, Calibration and Troubleshooting
109
9.4.5 Reset Options
Reset Button
CAUTION: Unsaved data or setups will be lost when you reset the analyzer.
If your analyzer stops responding to pushbutton presses, or taps, reset and reboot the analyzerby pressing the Reset button (located on the connector panel – see section 2.2) with the stylus. If you still experience problems, try resetting your analyzer as described below.
Analyzer Reset
1) Reset the analyzer to a default/factory installed state:
For G1 – 3 analyzers:
Reset the analyzer to a default state, where the user is set to 2250 (for Type 2250) and 2270 (forType 2270) and the project template is set to SOUND LEVEL METER. The existing SOUNDLEVEL METER project template will be overwritten, as will the preferences for user 2250 or2270. To reset the analyzer to the default state:
a) Press and hold the Power-on pushbutton for at least five seconds (powers off).b) Press and hold down the Commentary and Save pushbuttons while switching
on the analyzer. The display in Fig.9.3 will be shown.
Fig.9.3Maintenance Mode –initial screen for G1 – 3 analyzers
Within a few seconds the display in Fig.9.4 will be shown.

Hand‐held Analyzer Types 2250 and 2270 – User Manual110
Fig.9.4Update 2250 software screen for G1 – 3 analyzers
c) Cancel the update by pressing any other pushbutton than the Accept pushbutton .
Fig.9.5Reset to default settings screen for G1 – 3 analyzers
d) Press the Accept pushbutton to reset to default settings.
F or G4 analyzers:
The analyzer contains two sets of the firmware/software package and settings. The oneoriginally delivered with the analyzer and one installed afterwards. To restore the factoryfirmware/software package and settings:
a) Press and hold the Power-on pushbutton for at least five seconds (powers off).b) Press and hold down the Commentary and Save pushbuttons while switching
on the analyzer. The display in Fig.9.6 will be shown.
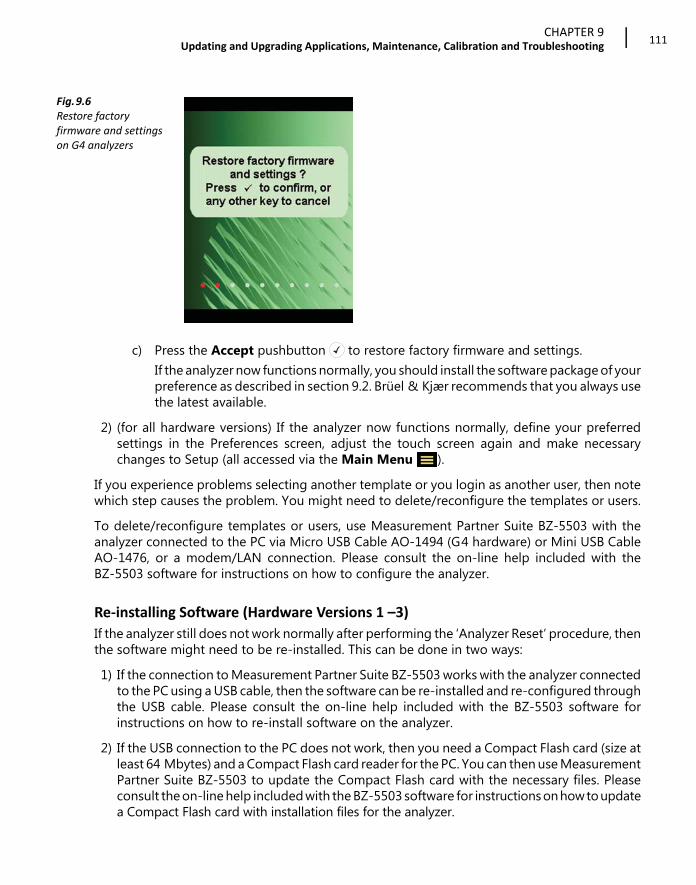
CHAPTER 9Updating and Upgrading Applications, Maintenance, Calibration and Troubleshooting
111
Fig.9.6Restore factory firmware and settings on G4 analyzers
c) Press the Accept pushbutton to restore factory firmware and settings.If the analyzer now functions normally, you should install the software package of yourpreference as described in section 9.2. Brüel & Kjær recommends that you always usethe latest available.
2) (for all hardware versions) If the analyzer now functions normally, define your preferredsettings in the Preferences screen, adjust the touch screen again and make necessarychanges to Setup (all accessed via the Main Menu ).
If you experience problems selecting another template or you login as another user, then notewhich step causes the problem. You might need to delete/reconfigure the templates or users.To delete/reconfigure templates or users, use Measurement Partner Suite BZ-5503 with theanalyzer connected to the PC via Micro USB Cable AO-1494 (G4 hardware) or Mini USB CableAO-1476, or a modem/LAN connection. Please consult the on-line help included with theBZ-5503 software for instructions on how to configure the analyzer.
Re‐installing Software (Hardware Versions 1 –3)
If the analyzer still does not work normally after performing the ‘Analyzer Reset’ procedure, thenthe software might need to be re-installed. This can be done in two ways:1) If the connection to Measurement Partner Suite BZ-5503 works with the analyzer connected
to the PC using a USB cable, then the software can be re-installed and re-configured throughthe USB cable. Please consult the on-line help included with the BZ-5503 software forinstructions on how to re-install software on the analyzer.
2) If the USB connection to the PC does not work, then you need a Compact Flash card (size atleast 64 Mbytes) and a Compact Flash card reader for the PC. You can then use MeasurementPartner Suite BZ-5503 to update the Compact Flash card with the necessary files. Pleaseconsult the on-line help included with the BZ-5503 software for instructions on how to updatea Compact Flash card with installation files for the analyzer.

Hand‐held Analyzer Types 2250 and 2270 – User Manual112
Power off the analyzer and insert the compact flash card in the CF slot on the analyzer. Thenpress and hold down the Commentary and Save pushbuttons while switching on theanalyzer. The Maintenance Mode initial screen will be displayed, and then within a fewseconds the screen shown in Fig.9.4 will appear.Press the Accept pushbutton to update the software. This will take approximately 5minutes.
CAUTION: Do not remove the CF-card while updating the analyzer software!When the analyzer software has been updated, you will get the option of resetting to thedefault settings.
If the problem still persists, then you should contact your local Brüel & Kjær representative.
9.5 Care, Cleaning and Storage
The analyzer is a delicate precision instrument. When handling, storing or cleaning your analyzer,please take the following precautions.
9.5.1 Handling the Analyzer
• Do not try to remove the microphone grid as you can easily damage the microphone in this way
• Do not attempt to open the analyzer. There are no user-serviceable parts inside. If you think your analyzer requires service, please contact your Brüel & Kjær representative
• Do not allow the analyzer to get wet• Protect the analyzer from impact. Do not drop it. Transport it in the supplied carrying pouch
9.5.2 Cleaning the Analyzer
If the analyzer casing becomes dirty, then wipe it with a lightly dampened cloth. Do not useabrasive cleansers or solvents. Do not allow moisture to enter the microphone, connectors or casing.
9.5.3 Storing the Analyzer
• Keep the analyzer in a dry place, preferably within its carrying pouch• For long-term storage, remove the battery pack• Do not exceed storage temperature limits of –25 to +70 °C (–13 to +158 °F)
CHAPTER 9Updating and Upgrading Applications, Maintenance, Calibration and Troubleshooting
113
9.6 Services at Brüel & Kjær for Types 2250 and 2270
9.6.1 Accredited Calibration
For Types 2250 and 2270, you can order accredited calibration and choose between DANAK,A2LA, UKAS, Eichamt (Austria), RvA, ENAC, NATA and Inmetro.For Spain, Primitiva is available.The calibration will be performed in an ISO 17025 certified laboratory.
9.6.2 Initial Calibration
To start the measurement history from day one – if this is required, for example, for measurementuse in public, for customer audit or quality procedures – we recommend you order accreditedcalibration together with the new analyzer.
9.6.3 Regular Recalibration
To fulfil requirements for public measurements and to minimize the cost of errors due to faultyor inaccurate measurements, we can arrange for calibration every year in an ISO 17025 certifiedlaboratory at Brüel & Kjær. With annual data, you will have an unbroken history to use asreference, either for internal requirements, for audit required by authorities or at the request ofyour customers. And not least, you can follow the history of sensitivity for your analyzers overtime.
9.6.4 Filter Calibration
• You can order calibration of filters. Please specify at the time of ordering• Calibration of filter response for octave and 1/3-octave filters according to IEC 61260
9.6.5 Service and Repair
The hand-held analyzer is designed and constructed to provide many years of reliable operation.However, if a fault occurs that impairs the analyzer’s correct function, then remove the batterypack and disconnect any external power supply to prevent risk of further damage.For more information about preventing faults or damage to your analyzer, see section 9.5.

Hand‐held Analyzer Types 2250 and 2270 – User Manual114
9.6.6 Hardware Maintenance and Repair
You can minimize the risk of unexpected costs by purchasing the hardware maintenance with afive years warranty. Minor repairs, such as those resulting from damage caused by unauthorizeduse of the analyzer, can be performed at the same time as the analyzer is being calibrated atBrüel & Kjær. This will save you time. If any other errors are detected by the technician duringcalibration, repair will be performed before returning the analyzer to you.Repair is available at a fixed price, which includes a Conformance Test Certificate upon the returnof your analyzer (no measurement data included).
9.6.7 Rental
To ensure optimal uptime, you can rent a substitute hand-held analyzer* while yours is beingcalibrated. To arrange rental, please contact your local Brüel & Kjær representative.
9.6.8 Training
Basic knowledge on sound and vibration measurement, analyzer training and applicationtraining are a few examples of what local training or consultancy hours* can do for you. To findout more about training and consultancy hours, please contact your local Brüel & Kjærrepresentative.
* Providing this service is available from your local Brüel & Kjær office

115
Chapter 101/1‐ or 1/3‐octave Frequency Analysis (Optional
Module)
Frequency Analysis Software BZ-7223 enables you to make 1/1-octave or 1/3-octavemeasurements and broadband sound level measurements simultaneously.Check the About screen to see whether you have a license to run this module. (To access theAbout screen, tap the Help icon then tap About.) See Chapter 9 for instructions on installinglicenses.
10.1 Setting up the Analyzer
The Frequency Analyzer measures the following spectrum parameters together with full spectralstatistics during timed measurements:• LXeq • LXFmax• LXSmax• LXFmin• LXSmin
where X is the frequency weighting A, B, C or Z.These spectra and the spectral statistics are saved in the project together with the measuredsound level meter (broadband) parameters.The spectral statistics can be viewed as LXYN percentile spectra, where Y is the time weighting For S and N can be one of 7 defined percentiles.In addition, the instantaneous spectra LXF and LXS are always available.1) Select the FREQUENCY ANALYZER project template. (See section 3.2.1 for more details on
templates.) The project template is displayed at the top of the screen.2) Tap > Setup. Set the Broadband and Spectrum parameters to A, B, C or Z, as required.
(A/B-weighting is determined by setting the parameter in > Setup > FrequencySettings > Broadband (excl. peak).Set the Bandwidth parameter to 1/1-octave or 1/3-octave before making the measurement.To exit the screen, tap .
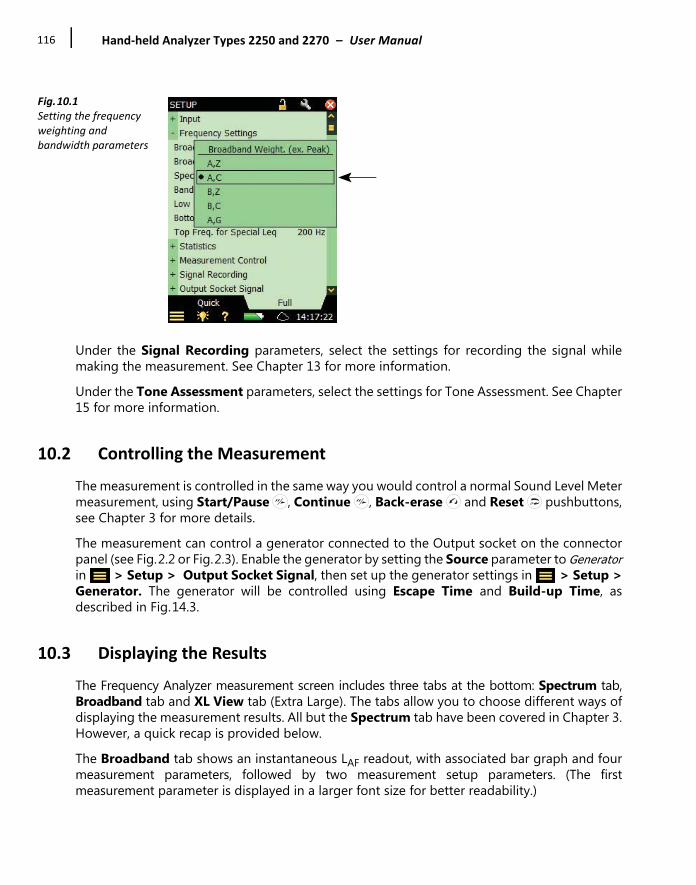
Hand‐held Analyzer Types 2250 and 2270 – User Manual116
Fig.10.1Setting the frequency weighting and bandwidth parameters
Under the Signal Recording parameters, select the settings for recording the signal whilemaking the measurement. See Chapter 13 for more information.Under the Tone Assessment parameters, select the settings for Tone Assessment. See Chapter15 for more information.
10.2 Controlling the Measurement
The measurement is controlled in the same way you would control a normal Sound Level Metermeasurement, using Start/Pause , Continue , Back-erase and Reset pushbuttons,see Chapter 3 for more details.The measurement can control a generator connected to the Output socket on the connectorpanel (see Fig.2.2 or Fig.2.3). Enable the generator by setting the Source parameter to Generatorin > Setup > Output Socket Signal, then set up the generator settings in > Setup >Generator. The generator will be controlled using Escape Time and Build-up Time, asdescribed in Fig.14.3.
10.3 Displaying the Results
The Frequency Analyzer measurement screen includes three tabs at the bottom: Spectrum tab,Broadband tab and XL View tab (Extra Large). The tabs allow you to choose different ways ofdisplaying the measurement results. All but the Spectrum tab have been covered in Chapter 3.However, a quick recap is provided below.The Broadband tab shows an instantaneous LAF readout, with associated bar graph and fourmeasurement parameters, followed by two measurement setup parameters. (The firstmeasurement parameter is displayed in a larger font size for better readability.)

CHAPTER 101/1‐ or 1/3‐octave Frequency Analysis (Optional Module)
117
The XL View tab increases the size of the first parameter readout to a 4 digit, full-screen display(including decimal point). The Spectrum tab, (which only appears as a tab if Frequency Analysis Software BZ-7223 isenabled), shows two different spectra parameters being measured simultaneously. In the examplein Fig.10.2, LZFmax and LZF are being viewed at the same time.
✐Please note: The Reference Spectrum and Main Spectrum icons indicate which spectrumbelongs to which parameter.
1) Select which spectra to view by tapping the parameter fields in the two lines above thespectrum display. These lines also include readouts of the spectrum values highlighted by the spectrum cursor.Tap the spectrum at the frequency of interest – or just tap anywhere in the spectrum area andthen move the cursor to the position of interest using the Left and Right arrowpushbuttons. To the right of the spectrum, two broadband bars (of the same parameters) are alsodisplayed.
Fig.10.2Displaying the results –spectrum screen
2) Adjust the X-axis (the horizontal frequency axis below the graphical display) by tapping onthe scale and accessing the drop-down menu (Fig.10.3):• Use Set Lower Display Limit to set the lower frequency limit of the X-axis• Use Set Higher Display Limit to set the upper frequency limit of the X-axis• Use Reset Display Range to display all measured frequency bands
✐Please note: • These settings only affect the frequency range of the display of measured data, not the frequency range of the measurement itself.
• The Display range automatically resets if you change the filter Bandwidth setup parameter or change the Low Frequency setup parameter.

Hand‐held Analyzer Types 2250 and 2270 – User Manual118
Fig.10.3Adjusting the X‐axis
3) Scale the Y-axis (left-hand vertical scale of the graphical display) by tapping on the scale andaccessing the drop-down menu (Fig.10.4).
💡 Hint: You can also select the spectrum cursor and press the Accept pushbutton.
Fig.10.4Scaling the Y‐axis on
the Spectrum display
4) Select Auto Zoom to adjust the range of the Y-axis for best fit of the measured spectrum.5) Select Zoom In/Zoom Out to adjust the zoom.6) Select Scale Up/Scale Down to adjust the full scale value on the Y-axis – or select Auto Scale
to select the best scaling for viewing the spectra – without adjusting the zoom.

CHAPTER 101/1‐ or 1/3‐octave Frequency Analysis (Optional Module)
119
7) Spectrum Table shows the displayed part of the spectrum in tabular form – as in Fig.10.5.Tap Table Format , at the top of the screen, to select between three different viewingformats:– Two Parameters: for displaying values from both spectra– One Parameter: for displaying values from the main spectrum only (available for
Reverberation Time Software only)– One Parameter (wrap): for displaying values from the main spectrum only, but with the
columns wrapped on the display to allow as many values as possible on the screen
Fig.10.5Spectrum table
8) To exit the Spectrum Table, tap the icon.9) Auto Zoom and Auto Scale automatically close the drop-down menu, otherwise, select Close,
tap outside the drop-down list or use the Left arrow pushbutton to close the menu.💡 Hint: A quick way of auto zooming is to tap anywhere in the spectrum and then press the Accept
pushbutton twice.
✐Please note: Save the template, if you want to use the display settings for other measurements.
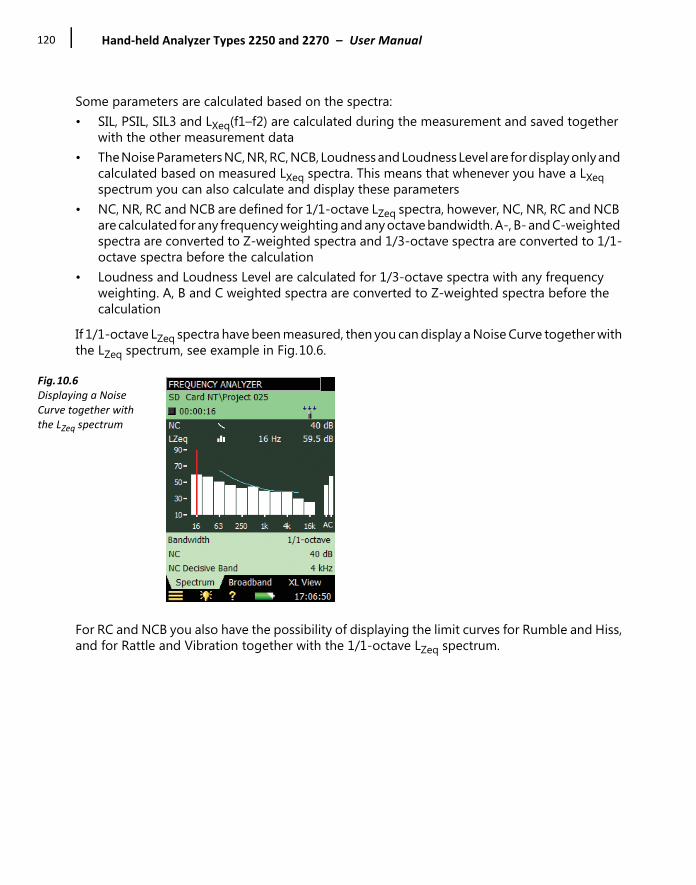
Hand‐held Analyzer Types 2250 and 2270 – User Manual120
Some parameters are calculated based on the spectra:• SIL, PSIL, SIL3 and LXeq(f1–f2) are calculated during the measurement and saved together
with the other measurement data• The Noise Parameters NC, NR, RC, NCB, Loudness and Loudness Level are for display only and
calculated based on measured LXeq spectra. This means that whenever you have a LXeq spectrum you can also calculate and display these parameters
• NC, NR, RC and NCB are defined for 1/1-octave LZeq spectra, however, NC, NR, RC and NCB are calculated for any frequency weighting and any octave bandwidth. A-, B- and C-weighted spectra are converted to Z-weighted spectra and 1/3-octave spectra are converted to 1/1-octave spectra before the calculation
• Loudness and Loudness Level are calculated for 1/3-octave spectra with any frequency weighting. A, B and C weighted spectra are converted to Z-weighted spectra before the calculation
If 1/1-octave LZeq spectra have been measured, then you can display a Noise Curve together withthe LZeq spectrum, see example in Fig.10.6.
Fig.10.6Displaying a Noise Curve together with the LZeq spectrum
For RC and NCB you also have the possibility of displaying the limit curves for Rumble and Hiss,and for Rattle and Vibration together with the 1/1-octave LZeq spectrum.

CHAPTER 101/1‐ or 1/3‐octave Frequency Analysis (Optional Module)
121
10.3.1 Smileys
A smiley will be shown to the right of the project name if there are any issues with calculating noiseparameters, or displaying noise curves (see the overview in Table 10.1).
Table 10.1 Overview of Smileys
10.4 Saving Results
Measurements are saved and can be viewed later, in the same way as described for the SoundLevel Meter project in Chapter 3.
Smiley Explanation DescriptionNo Loudness for 1/1-octaves Select 1/3-octaveNo Leq parameter logged Select a Leq spectrum for loggingSound Field Mismatch for Loudness
Set the Loudness parameter in Input in accordance with the Sound Field Correction
Frequency bands outside Noise Curves
Levels are lower or higher than any noise curve band
Noise Curves require use of Mic. Select a microphoneDisplay Noise Curve with LZeq Noise parameters are calculated but Noise Curves
can only be displayed together with LZeqNoise Curve for 1/1-octaves only Noise parameters are calculated but Noise Curves
can only be displayed for 1/1-octaves

Hand‐held Analyzer Types 2250 and 2270 – User Manual122

123
Chapter 11Logging (Optional Module)
Logging Software BZ-7224 enables you to measure and save data periodically on SD or CF cards.You can also save to a USB memory stick with G4 analyzers. The module is optimized for attendeduse, which means that while measuring you can annotate any sound online, as well as ‘mark’ upto five different sound categories online.The main benefit is that data is documented on-site and is therefore ready for post-processing andreporting back at the office using Measurement Partner Suite BZ-5503 or other post-processingsoftware such as Evaluator Type 7820, Protector Type 7825 or Microsoft® Excel®. In addition to measuring broadband parameters (see Chapter 3) and spectra* (see Chapter 10),the Logging module allows you to simultaneously log the following parameters:• Broadband parameters (including broadband statistics)• Spectra* (including spectral statistics)• Broadband parameters every 10/100 ms• Record the measured signal†
An overview showing the options available during a typical logging task has been provided inTable 11.1.
Table 11.1 Overview of options available during a typical logging task
* Requires Frequency Analysis Software BZ-7223† Requires Signal Recording Option BZ-7226
Selection Period BroadbandParameters
BroadbandStatistics
SpectralParameters
SpectralStatistics
Logged 1 s – 24 h 1 to 10or All (45)
Noneor Full
0 – 3or All (5)
Noneor Full
Logged (100 ms) 100 ms
None, LAeq, LAF and/or LAS
Noneavailable
Noneavailable
Noneavailable
Logged (10 ms) 10 ms None or LAF None
availableNone
availableNone
availableTotal Elapsed Time All (58) Full All (5) Full

Hand‐held Analyzer Types 2250 and 2270 – User Manual124
Check the About screen to see whether you have a license to run this module. (To access theAbout screen, tap the Help icon then tap About.) See Chapter 9 for instructions on installinglicenses.
11.1 Setting up the Analyzer
1) Select the LOGGING project template. (See section 3.2.1 for more details on templates.) Theproject template is displayed on the black banner at the top of the screen.
✐Please note: The Logging project template assumes you have a license for the Frequency AnalysisSoftware. If not, then select the Logging SLM project template instead.
2) Depending on your memory device:• Insert an SD memory card in a SD card slot at the bottom of the analyzer• If you have G1 – 3 analyzers, you can insert a CF memory card in the CF card slot at the
bottom of the analyzer• With G4 analyzers, you can use a USB Type A stick at the bottom of the analyzerYou will be notified that a memory card has been inserted – select Yes to change the defaultmeasurement path to the memory card.
✐Please note: You cannot log data on the internal disk.
3) Tap > Explorer from the list of options. Create a job folder for the measurements and setthe default measurement job/path as described in Chapter 6.
4) Tap > Setup (Fig.11.1). Set the Input, Frequency Settings and Statistics parameters asrequired for the Sound Level Meter and Frequency Analyzer measurements, see Chapter 3and Chapter 10, respectively. These settings are common to both the logging and the totalmeasurement.
Fig.11.1The Setup screen
CHAPTER 11Logging (Optional Module)
125
5) Under the Measurement Control parameters, set the Measurement Time and LoggingPeriod as required. Set Synchronize with clock to Yes if you want the logging to synchronizewith whole minutes or hours. For example, if Logging Period is set to 1 minute and you startthe measurement at 8:12:33, then the first logging interval will be from 8:12:33 to 8:12:59 (27seconds), the second will be from 8:13:00 to 8:13:59 (60 seconds), etc. Set Synchronize withclock to No if you want every logging interval to be the specified Logging Period exactly. SetCharge Injection Calibration to On if you want to validate the complete measurement chainby performing CIC at the start and end of the logging measurement, refer to section 5.7.
6) Under the Logged Broadband parameters, choose which broadband parameters you wantto log in accordance with the Measurement Control parameters. You can choose to log FullStatistics per Logging Period or not. You can also choose to log All the measured BroadbandParameters or a Selected number of parameters. If you choose Selected then you can specifyup to 10 parameters.
7) The Logged Broadband (10/100 ms) parameter allows you to log LAeq, with an elapsedtime of 100 ms and a logging period of 100 ms, LAF and/or LAS, with a logging period of100 ms, and/or LAF with a logging period of 10 ms, irrespective of the other loggingparameters.
✐Please note: LAF with a logging period 10 ms will be stored on the project, but will not be displayed bythe analyzer. Use MPS BZ-5503 to display the LAF logged every 10 ms.
8) The Logged Spectrum* parameter allows you to choose which spectra to log. You canspecify to log All, None or up to 3 Selected spectra. You can also choose to log Full SpectralStatistics per Logging Period or not.
9) Under Markers you can specify the names of the five available markers. The markers arepredefined as follows:– Marker 1: ‘Exclude’ – can be controlled by pressing the Back-erase pushbutton – Marker 2: ‘Manual’ – can be controlled by pressing the Manual Event pushbutton – Marker 3: ‘Level’ – can be controlled by the Level Trigger detection– Marker 4: ‘Marker 4’– Marker 5: ‘Marker 5’– Marker 6: ‘Sound’ – is set when recording signal (typically sound) – requires Signal
Recording Software BZ-7226All markers can be controlled by the stylus in the Profile display.You can set a Pre-marker Time between 0 and 5 seconds. This will start markers 1, 2 or 3 theset number of pre-marker seconds before the point where the Back-erase pushbutton, theManual Event pushbutton, or the Level Trigger, respectively, are pressed. See section 11.3.2.
* Requires Frequency Analysis Software BZ-7223
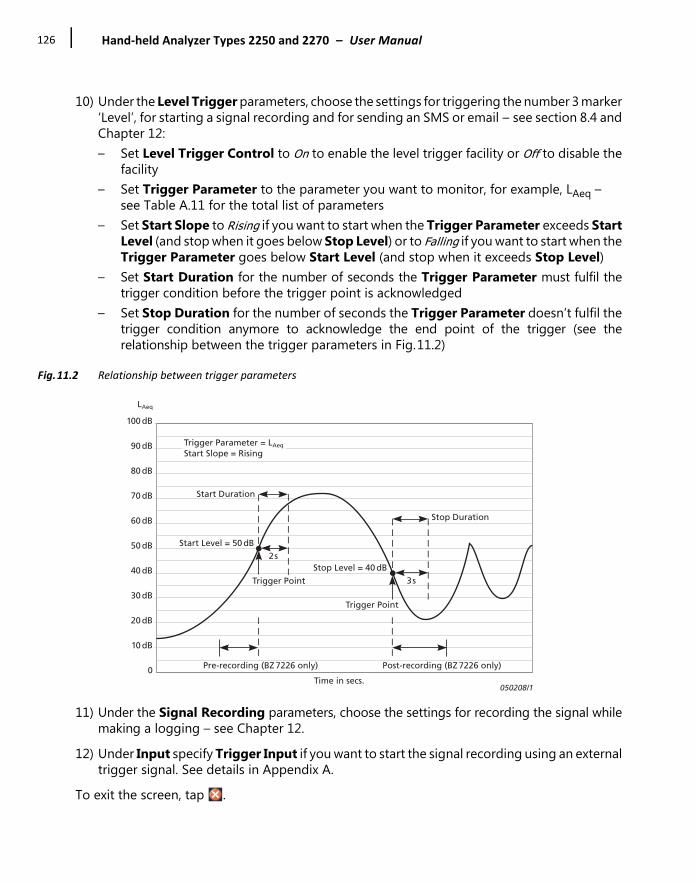
Hand‐held Analyzer Types 2250 and 2270 – User Manual126
10) Under the Level Trigger parameters, choose the settings for triggering the number 3 marker‘Level’, for starting a signal recording and for sending an SMS or email – see section 8.4 andChapter 12: – Set Level Trigger Control to On to enable the level trigger facility or Off to disable the
facility– Set Trigger Parameter to the parameter you want to monitor, for example, LAeq –
see Table A.11 for the total list of parameters– Set Start Slope to Rising if you want to start when the Trigger Parameter exceeds Start
Level (and stop when it goes below Stop Level) or to Falling if you want to start when theTrigger Parameter goes below Start Level (and stop when it exceeds Stop Level)
– Set Start Duration for the number of seconds the Trigger Parameter must fulfil thetrigger condition before the trigger point is acknowledged
– Set Stop Duration for the number of seconds the Trigger Parameter doesn’t fulfil thetrigger condition anymore to acknowledge the end point of the trigger (see therelationship between the trigger parameters in Fig.11.2)
Fig.11.2 Relationship between trigger parameters
11) Under the Signal Recording parameters, choose the settings for recording the signal whilemaking a logging – see Chapter 12.
12) Under Input specify Trigger Input if you want to start the signal recording using an externaltrigger signal. See details in Appendix A.
To exit the screen, tap .
Start Level = 50 dB
Start Duration
100 dB
90 dB
80 dB
70 dB
60 dB
50 dB
40 dB
30 dB
20 dB
10 dB
0Time in secs.
Trigger Point
Trigger Point
Pre-recording (BZ 7226 only) Post-recording (BZ 7226 only)
2sStop Level = 40 dB
Stop Duration
3s
Trigger Parameter = LAeq
Start Slope = Rising
LAeq
050208/1

CHAPTER 11Logging (Optional Module)
127
11.2 Controlling the Measurement
The measurement is controlled in the same way you would control a normal Sound Level Metermeasurement, using Start/Pause , Continue , Back-erase and Reset pushbuttons,see Chapter 3 for more details.If you have set the Charge Injection Calibration parameter to On, then CIC is performed at thestart of the measurement and at the end of the measurement. An Exclude marker is set on thelogging profile at the point where CIC is being performed. The update of the Total parametersis stopped while CIC is being performed. You can see the results of the CIC under Totalparameters, CIC Result 1 and CIC Result 2.
11.2.1 Annotating a Project
While using the logging software you can annotate measurements using the normal method ofadding annotations to a project, before or after a measurement, or while the measurement ispaused. The annotations can then be viewed by tapping Paperclip or tapping > Explorerfrom the list of options. section 3.4. However, if you choose to annotate the profile during the measurement, the icon will appearbelow the profile, not as an icon in the Status Field or attached to a project in Explorer, asdescribed previously. In this case, you view the annotation using the method described in section11.3.1.
11.2.2 Recording the Signal
You can record the input signal during the measurement* by pressing the Manual Eventpushbutton (Manual Event marker), the Back-erase pushbutton (Exclude Marker) or when thelevel of a specific parameter exceeds a certain level – or you can record the signal through the wholemeasurement – depending on the Signal Recording setting on the Setup screen – details inChapter 12.
11.3 Displaying the Results
The Logging Measurement screen (or Profile tab) includes three tabs at the bottom: Profile,Spectrum and Broadband tabs (the Logging SLM includes the tabs: Profile, Broadband and XLView). The tabs allow you to choose different ways of displaying the measurement results. All butthe Profile tab have been covered previously in Chapters 3 and 10, however a quick recap isprovided below.The Broadband tab shows an instantaneous LAF readout, with associated bar graph and anumber of measurement parameters. (The first measurement parameter is displayed in a largerfont size for better readability.)
* Requires License for Signal Recording Software BZ-7226
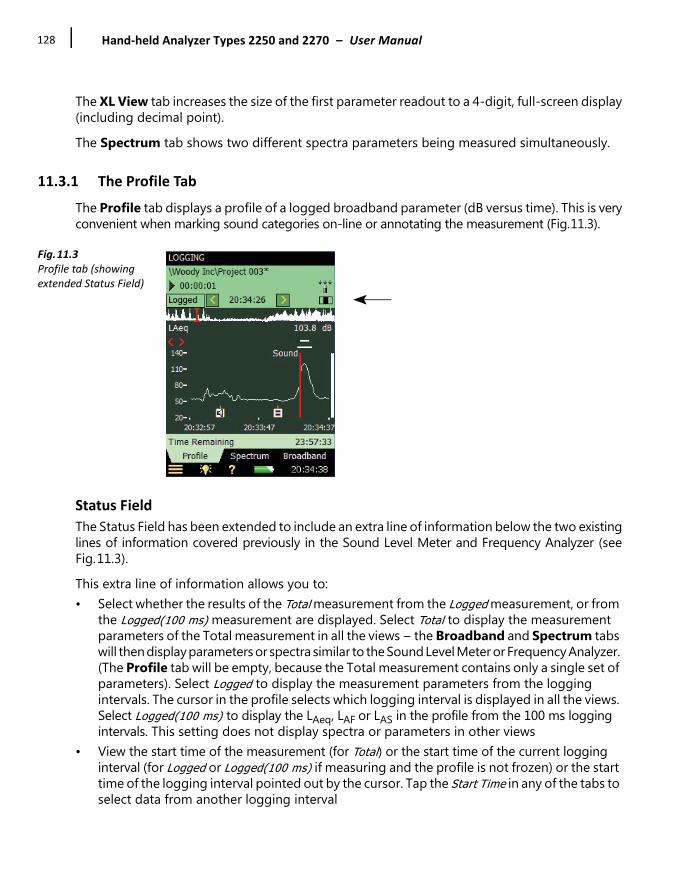
Hand‐held Analyzer Types 2250 and 2270 – User Manual128
The XL View tab increases the size of the first parameter readout to a 4-digit, full-screen display(including decimal point).The Spectrum tab shows two different spectra parameters being measured simultaneously.
11.3.1 The Profile Tab
The Profile tab displays a profile of a logged broadband parameter (dB versus time). This is veryconvenient when marking sound categories on-line or annotating the measurement (Fig.11.3).
Fig.11.3Profile tab (showing extended Status Field)
Status Field
The Status Field has been extended to include an extra line of information below the two existinglines of information covered previously in the Sound Level Meter and Frequency Analyzer (seeFig.11.3).This extra line of information allows you to:• Select whether the results of the Total measurement from the Logged measurement, or from
the Logged(100 ms) measurement are displayed. Select Total to display the measurement parameters of the Total measurement in all the views – the Broadband and Spectrum tabs will then display parameters or spectra similar to the Sound Level Meter or Frequency Analyzer. (The Profile tab will be empty, because the Total measurement contains only a single set of parameters). Select Logged to display the measurement parameters from the logging intervals. The cursor in the profile selects which logging interval is displayed in all the views. Select Logged(100 ms) to display the LAeq, LAF or LAS in the profile from the 100 ms logging intervals. This setting does not display spectra or parameters in other views
• View the start time of the measurement (for Total) or the start time of the current logging interval (for Logged or Logged(100 ms) if measuring and the profile is not frozen) or the start time of the logging interval pointed out by the cursor. Tap the Start Time in any of the tabs to select data from another logging interval
CHAPTER 11Logging (Optional Module)
129
• View whether the display of the profile during the measurement is frozen or not. When the icon is “animated” the display is being updated with new logged data during the
measurement. You can freeze the display update by tapping on the icon. This also freezes the icon. Tap the icon again to unfreeze the display
• Step forwards or backwards through the logging intervals on all displays, using the and icons. (The icons are also connected to the profile cursor, so that any corresponding movement backwards or forwards through the intervals in one display will be reproduced in the other)
Some interaction with the display will automatically freeze and unfreeze the display (only whilemeasuring):• Tap the stylus on the profile. This will set the profile cursor and freeze the display update of
the profile. You can move the cursor to any point in the profile by using the left and right arrow pushbuttons. The profile will be scrolled automatically, if necessary. Unfreeze by tapping on the
icon • Tap and hold the stylus on the profile display and drag it to the left or right. This will freeze
the display and show two cursors. Next, remove the stylus from the display and a drop-down menu appears with the possibility of setting or editing a marker or annotation (see below). Select the required function from the drop-down menu. When the function has been carried out, the profile unfreezes automatically and progresses as it did before you tapped on the screen
The logged data are displayed as two profiles. The Profile Overview with the entire profile andthe Profile with 100 logging samples.
The Profile Overview
An overview of the entire profile is displayed across the screen on the topmost part of the grapharea.The overview is based on LXeq,1s (X = A or B, depending on the FrequencySettings > Broadband (excl. Peak) setting). The Y-axis is auto-zoomed.When you have logged for more than 4 minutes, then each pixel on the X-axis will cover morethan 1 s. The overview will then display from the minimum LXeq,1s to the maximum LXeq,1s withinthe interval covered by the pixels on the X-axis.Tap in the Profile Overview to select the part of the entire profile to display in the Profile below.
The Profile
The Profile displays a hundred samples of the logged data.Select which parameter to view by tapping the parameter field in the line above the profile.

Hand‐held Analyzer Types 2250 and 2270 – User Manual130
Markers are displayed between the profile and the profile parameter. Marker 1 (Exclude) is thetopmost positioned marker. The name of the marker is displayed if the marker overlaps the cursorposition. If a signal has been recorded, then a Sound Marker (Marker 6) is displayed above theprofile – the marker covers exactly the time of the signal recording.You can browse through markers using the buttons in the profile.The whole, or any part of the signal recording can be played back, once or repetitively – seeChapter 12 for details.To the right of the profile, the broadband parameter LAF is displayed and updated regardless ofthe measurement status and the display freeze status.Annotations are displayed below the profile as icons. To select an annotation, tap and hold thestylus at one side of the icon, just above it, then drag the stylus to the opposite side of the icon(so it looks like the example in Fig.11.4) and remove the stylus from the display.
Fig.11.4Selecting annotations
A drop-down menu appears, select the required function:• Open note or Play commentary • Delete annotation • Move annotation (to the position on the display where the stylus was removed from the display)Scale the Y-axis (left-hand vertical scale of the graphical display) by tapping on the scale andaccessing the drop-down menu (as in the Spectrum tab):• Select Auto Zoom to adjust the range of the Y-axis for best fit of the measured spectrum• Select Zoom In/Zoom Out to adjust the zoom• Select Scale Up/Scale Down to adjust the full scale value on the Y-axis - or select Auto Scale to
select the best scaling for viewing the spectra – without adjusting the zoom• Auto Zoom and Auto Scale automatically close the drop-down menu, otherwise, select Close,
tap outside the drop-down list or use the Left Arrow pushbutton to close the menu
CHAPTER 11Logging (Optional Module)
131
11.3.2 Marking Sound Categories
Use this facility to categorize the sound while you are measuring, or while you are observing thedifferent kinds of sound on the display. This will make it much easier to do the post-processingand reporting back in the office.You can mark up to five sound categories on-line. The markers are displayed as horizontal linesabove the sound profile (Fig.11.3). There are two main types of marker:• An Exclude Marker – this allows you to mark a sound you want to exclude from your
measurement later during post-processing or reporting. (It does not remove any data from your measurement)
• An Event Marker – this allows you to mark a particular sound of interest during your measurement
On the analyzer:• Marker 1 is used as an Exclude Marker• Markers 2 to 5 are used as Event Markers. All of these event markers can be user-defined.
You can define a marker by tapping > Setup > Markers.– Marker 2 is set to a Manual Event marker by default – it can be controlled by the Manual
Event pushbutton and the stylus.– Marker 3 is set to a Level Event marker by default – it can be controlled by the level trigger
facility and the stylus.• Marker 6 is used as a Sound Marker and shows the size of the signal recording.The analyzer allows you to view the markers at a later date by recalling the data and viewing thedesired profile. (This can also be done if you have transferred the data to BZ-5503).If required, Measurement Partner Suite BZ-5503, Evaluator Type 7820 and Protector Type 7825 canuse the markers in their calculations. Marker number 1 (the Exclude Marker) will always be used asan Exclude Marker, while markers 2 to 5 will be used as defined in Type 7820 Evaluator/Type 7825Protector software. The marker names, however, will be transferred from the analyzer. Marker 6will be used as sound marker.
Marking During the Measurement
The measurement parameter is displayed as a progressing profile.
Use of Pushbuttons
Press the Back-erase pushbutton to start an Exclude Marker (marker number 1). The markeris displayed above the profile. Press the button once more to stop the Exclude Marker.Press the Manual Event pushbutton to start a Manual Event Marker (marker number 2). Themarker is displayed above the profile. Press the button once more to stop the Manual EventMarker.

Hand‐held Analyzer Types 2250 and 2270 – User Manual132
Use of the Stylus
Tap and hold the stylus on the profile display at the position where you want the marker to start.This will freeze the display and show a cursor at the position of the stylus. Then drag the stylus leftor right to the position where you want the marker to end. This will display a second cursor. Next,remove the stylus from the display and a drop-down menu appears showing the five markers youhave specified in the setup. Select the marker you require. The marker is displayed above theprofile, the cursors disappear and the profile unfreezes and progresses as it did before youtapped on the screen.
✐Please note: If you select Sound Marker, then the sound for this part will be recorded – see Chapter 12for details.
Marking Measurement While it is Paused
The measurement parameter is displayed as a profile while the measurement is paused.
You Can Use the Stylus to Mark the Sound Categories
Tap and hold the stylus in the profile display at the position where you want the marker to start.This will display a cursor at the position of the stylus. Then drag the stylus left or right to theposition where you want the marker to end. This will display a second cursor. Next, remove thestylus from the display and a drop-down menu appears showing the five markers you havespecified in the setup. Select the marker you require. The marker is displayed above the profileand the cursors disappear.
11.3.3 Editing Markers on Profiles
To widen a marker:
1) Tap and hold the stylus on the profile display at a position within the marker range.2) Drag the stylus left or right to the position where you want the marker to end.3) Remove the stylus from the display and a drop-down menu appears.4) Select the marker you want to widen from the drop-down menu.
To narrow a marker:
1) Tap and hold the stylus on the profile display at the position inside the marker range whereyou want it to stop.
2) Drag the stylus left or right to a position outside the marker range.3) Remove the stylus from the display and a drop-down menu appears.4) Select Delete for the marker you want to narrow from the drop-down menu. The part where
the marker overlaps the gap between the two cursors will be deleted.
CHAPTER 11Logging (Optional Module)
133
To delete a marker:
1) Tap and hold the stylus in the profile display at a position to the left of the marker you wantto delete.
2) Drag the stylus to a position to the right of the marker.3) Remove the stylus from the display and a drop-down menu appears.4) Select Delete for the marker you want to delete from the drop-down menu.
✐Please note: Sound markers cannot be edited. Marking the whole sound marker (or part of it) andselecting Delete will delete the whole sound marker and signal recording.
11.3.4 Annotate Sound Categories
You can annotate the measurement online with a spoken comment or a written note or (withType 2270 only) an image. The annotation is displayed as an icon below the sound profile.
Annotating During the Measurement
The measurement parameter is displayed as a progressing profile.
Use of Pushbuttons
Press and hold down the Commentary pushbutton and talk to the analyzer to make yourcomment. Release the button when finished. This will insert a comment annotation in the profile atthe time when the button was pressed.
Use of Stylus
Tap and hold the stylus in the profile display at the position where you want the annotation tostart. This will freeze the display and display a cursor at the position of the stylus. Then drag thestylus a little to the left or right and raise it again. A drop-down menu appears and below the fivemarkers you can select Add Comment or Add Note or Add Image to add a spoken comment or writea note or capture an image. When finished, the Comment or Note or Image is inserted in theprofile, the cursors disappear and the profile unfreezes and progresses as before tapping on thescreen.
Annotating While the Measurement is Paused
The measurement parameter is displayed as a profile while the measurement is paused.
Use of Stylus to Annotate the Sound
Tap and hold the stylus in the profile display at the position where you want the marker to start.This will display a cursor at the position of the stylus. Next, drag the stylus a little to the left or rightand remove the stylus from the display. A drop-down menu appears and below the five markersyou can select Add Comment, Add Note or Add Image (Type 2270 only) to add a spoken comment,

Hand‐held Analyzer Types 2250 and 2270 – User Manual134
write a note or capture an image. When finished the Comment, Note or Image is inserted in theprofile and the cursors disappear.
Use of Pushbuttons
Using the Commentary pushbutton during a pause means that the comment annotation willbe added to the project instead of the profile. (The annotations can be viewed by tapping on thepaperclip icon or tapping the Main Menu and selecting Explorer from the list of options. Seesection 3.4.)
11.3.5 Editing Annotations on Profiles
To move an annotation:
1) Tap and hold the stylus on the profile display at a position on one side of the Annotationsicon.
2) Drag the stylus through the Annotations icon to the position where you want the annotationmoved to.
3) Remove the stylus from the display and a drop-down menu appears.4) Select Move Comment (or Move Note, or Move Image) from the drop-down menu.
To delete an annotation:
1) Tap and hold the stylus on the profile display at a position to the left of the Annotations iconyou want to delete.
2) Drag the stylus to a position to the right of the annotation.3) Remove the stylus from the display and a drop-down menu appears.4) Select Delete for the annotation you want to delete from the drop-down menu.
11.4 Saving and Recalling Results
Measurements are saved and can be viewed later, in the same way as described for the SoundLevel Meter project in Chapter 3 and Chapter 6.

135
Chapter 12Enhanced Logging (Optional Module)
Enhanced Logging Software BZ-7225 enables you to measure and save data periodically onmemory cards. You can also save to a USB memory stick with G4 analyzers. The module isoptimized for unattended use, which means that the module will measure and save data in anefficient way, without the requirement for an operator to be present. In addition to measuring broadband parameters (see Chapter 3) and spectra* (see Chapter 10),it simultaneously logs the following parameters (see Chapter 11):• Broadband parameters (including broadband statistics)• Broadband parameters every 10/100 ms• Spectra* (including spectral statistics)• Record the measured signal†
Finally, the Enhanced Logging module can also log with a different period (periodic reports –forexample, every hour) for reporting:• Broadband parameters (including broadband statistics) • Spectra* (including spectral statistics)The Enhanced Logging module can measure continuously, limited only by data memory andpower supply. An overview showing the options available during a typical enhanced logging taskhas been provided in Table 12.1.
* Requires Frequency Analysis Software BZ-7223† Requires Signal Recording Option BZ-7226

Hand‐held Analyzer Types 2250 and 2270 – User Manual136
Table 12.1 Overview of options available during a typical enhanced logging task
Check the About screen to see whether you have a license to run this module. (To access theAbout screen, tap the Help icon then tap About.) See Chapter 9 for instructions on installinglicenses.
12.1 Setting up the Analyzer
1) Select the ENHANCED LOGGING project template. (section 3.2.1 for more details ontemplates.) The project template is displayed on the black banner at the top of the screen.
2) Depending on your memory device:– Insert an SD memory card in a SD card slot at the bottom of the analyzer– If you have G1 – 3 analyzers, you can insert a CF memory card in the CF card slot at the
bottom of the analyzer– With G4 analyzers, you can use a USB Type A stick at the bottom of the analyzerYou will be notified that a memory card has been inserted – select Yes to change the defaultmeasurement path to the memory card.
✐Please note: You cannot log data on the internal disk.
3) Tap > Explorer then create a job folder for the measurements and set the defaultmeasurement job/path as described in Chapter 6.
4) Tap > Setup and set up the measurement as described for Logging in Chapter 11, steps4 – 12.
Selection Period BroadbandParameters
BroadbandStatistics
SpectralParameters
SpectralStatistics
Logged 1 s – 24 h 1 to 10 or All (45)
None or Full
0 – 3or All (5)
None or Full
Logged (100 ms) 100 ms
None, LAeq, LAF and/or LAS
None available
None available
None available
Logged (10 ms) 10 ms None or LAF
None available
None available
None available
Periodic Reports 1 m – 24 h All (53) Full All (5) None
or Full
TotalElapsed
Time All (67) Full All (5) Full

CHAPTER 12Enhanced Logging (Optional Module)
137
5) Under the Measurement Control parameters:– Set the Save Project Data at, Continuous Logging and Report Period as required– Select whether or not you want to save the Full Spectral Statistics for Reports
✐Please note: All other measured broadband and spectral parameters are logged automatically perreport period.
Then you can select:– Number of CICs – Desired time periods for calibration
6) Under the Logged Spectrum parameters, you can choose to log Full Spectral Statistics perLogging Period or not.
✐Please note: Logging the full spectral statistics at a short logging period (for example, every second)takes up a lot of space on the memory card.
7) Under Triggers, you can specify a Signal Recording Timer for periodically starting a signalrecording (for example, five minutes per hour) and you can specify up to four independentLevel Triggers to be active at four different times during the day. Each level trigger works asspecified in section 11.1. In addition, you can specify a Hold Off period – this means thatduring this period, new triggers are inhibited. You also have the ability to trigger LXeq(f1–f2).
✐Please note: You can trigger on a specific frequency band by setting f1 = f2.
8) Under Lden Periods parameters you can set up the day, evening and night periods and thepenalties in accordance with your local legislation.
To exit the screen, tap .
12.2 Controlling the Measurement
The measurement is controlled in the same way you would control a normal Sound Level Metermeasurement, using Start/Pause , Continue , Back-erase and Reset pushbuttons,see Chapter 3 for more details.However, during the measurement, data are automatically saved in projects, one per day. Theprojects are automatically saved at the time specified in the Save Project Data at parameter in
> Setup > Measurement Control. The next project is (automatically) started immediatelyafter the first one, without any data loss.
✐Please note: When Preset Logging Time has elapsed, or you pause the measurement, then the projectwill not be saved automatically. This has to be done manually.
In the case of power failure, or other failures, the software is rebooted automatically. This meansthat the measurement data collected up until the time of the reboot is saved in a project and anew measurement is started. The new measurement is started in a new project.The projects are named as specified in > Preferences > Users and Projects.
Hand‐held Analyzer Types 2250 and 2270 – User Manual138
For example, if you select Auto-naming of Projects, and start the measurement on the 13th ofNovember, then your projects for measuring 48 hours (assuming you have started in the middleof the day, and have set Save Project Data at parameter to 00:00:00) will be:• 051113 001 (containing data from the middle of the day November 13th until midnight)• 051114 001 (containing data for a whole day – November 14th)• 051115 001 (containing data from midnight to the middle of the day on November 15th)If you did not select Auto-naming of Projects then you would have the following projects(assuming the Project Name Prefix parameter was set to Project and no projects had been savedbefore in the directory): • Project 001• Project 002• Project 003If you have set the Charge Injection Calibration parameter to On, then a CIC calibration isperformed at specified times of the day. An Exclude marker is set on the logging profile at thepoint where the CIC is being performed. The update of the Total parameters and the PeriodicReports is stopped while the CIC is being performed. You can see the results of the CIC calibrationunder Total parameters, CIC Result 1 to 4.The CIC result can be either Passed, Background noise too high or CIC Ratio deviates from Ref. (The Ref.mentioned here is the reference created by the very first manual CIC, and is the one used as thereference to all subsequent CIC ratio measurements, see section 5.7.)
✐Please note: If a level trigger is active when the CIC is due to start, then the CIC will not be done.
12.2.1 Annotating a Project
Measurements can be annotated in the same way as you annotate Logging measurements. Seesection 11.2.1.
12.2.2 Recording the Signal
Signal recordings can be done in the same way as described under Logging measurements. Seesection 11.2.2.
12.3 Displaying the Results
The Enhanced Logging Measurement screen includes three tabs at the bottom: Profile,Spectrum and Broadband – as the Logging Measurement screen does. You view data in thesame way as in the Logging module. You mark and annotate sound categories and edit markersand annotations in the same way as in the Logging module – please see Chapter 11.The Result Selector (first item in the third line of the Status Field) determines whether results fromthe Total, Logged, Logged (100 ms) or Report measurement are displayed.
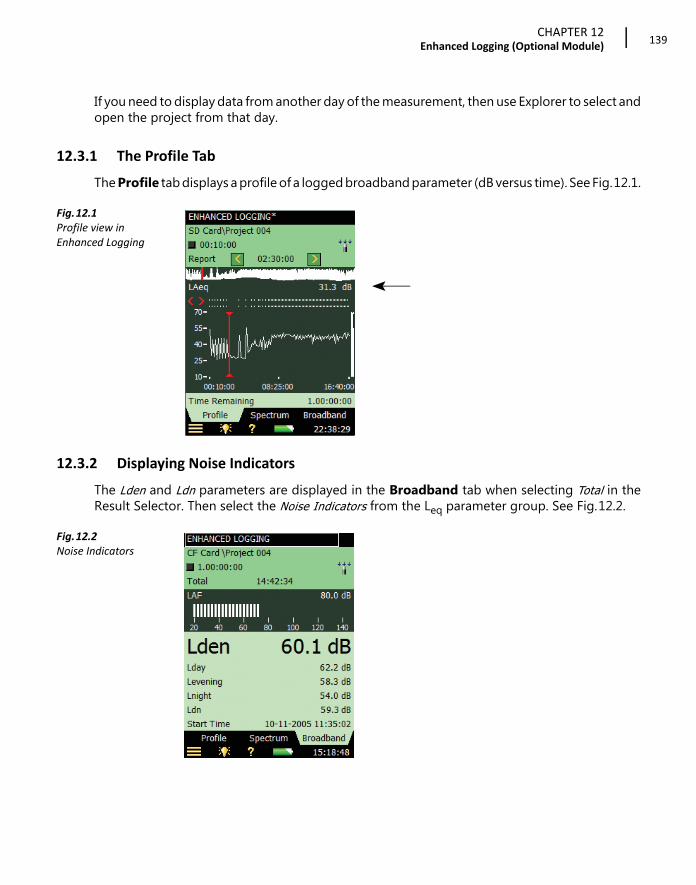
CHAPTER 12Enhanced Logging (Optional Module)
139
If you need to display data from another day of the measurement, then use Explorer to select andopen the project from that day.
12.3.1 The Profile Tab
The Profile tab displays a profile of a logged broadband parameter (dB versus time). See Fig.12.1.
Fig.12.1Profile view in Enhanced Logging
12.3.2 Displaying Noise Indicators
The Lden and Ldn parameters are displayed in the Broadband tab when selecting Total in theResult Selector. Then select the Noise Indicators from the Leq parameter group. See Fig.12.2.
Fig.12.2Noise Indicators

Hand‐held Analyzer Types 2250 and 2270 – User Manual140
12.3.3 Saving and Recalling Results
Measurements are saved and can be viewed later, in the same way as described for the SoundLevel Meter Project in Chapter 3 and Chapter 6.
141
Chapter 13Signal Recording Option
Signal Recording Option BZ-7226 allows you to record the input signal (typically sound) in either16-bit or 24-bit resolution during measurement (24-bit for BZ-7222/23/24/25/30/33 only). Thesignal recording can be controlled manually or by using an external trigger signal. The recordingcan also be triggered when a measured parameter exceeds a preset level (BZ-7224 and BZ-7225only). The recorded sound can be played back and listened to using the supplied Earphones HT-0015.Sound is recorded directly to a memory card. With G4 analyzers, sound can also be recorded toa USB memory stick.The main benefit is that data is documented on-site and is therefore ready for post-processingand reporting back at the office using Measurement Partner Suite BZ-5503 or other post-processing software such as Evaluator Type 7820, Protector Type 7825 or Microsoft® Excel®.Check the About screen to see whether you have a license to run this module. (To access theAbout screen, tap the Help icon then tap About.) See Chapter 9 for instructions on installinglicenses.
13.1 Sound Level Meter and Frequency Analysis Software
You can use the Signal Recording facility together with the Sound Level Meter Software and theFrequency Analysis Software. You can record the sound for the whole measurement period oryou can record sound for controlled parts of the measurement. The recordings are attached tothe project as annotations, named “Soundrec N”, where N is the number of the recording for theproject. (section 3.4 and section 6.3.2 for a description of how to use annotations.)
✐Please note: • Signal recordings can only be done during measurements.• Signal recordings can only be done on projects saved on memory cards (or with G4
analyzers, on a USB memory stick).
13.1.1 Setting up the Analyzer
1) Select a SOUND LEVEL METER project template or a FREQUENCY ANALYZER projecttemplate (see section 3.2.1 for more details on templates).
Hand‐held Analyzer Types 2250 and 2270 – User Manual142
2) Depending on your memory device:– Insert an SD memory card in a SD card slot at the bottom of the analyzer– If you have G1 – 3 analyzers, you can insert a CF memory card in the CF card slot at the
bottom of the analyzer– With G4 analyzers, you can use a USB Type A stick at the bottom of the analyzer
✐Please note: You cannot record the signal on the internal disk.
3) Tap > Explorer. Navigate to the memory card, create a job folder for the measurementsand set the default measurement job/path as described in Chapter 6.
4) Tap > Setup. Set all the parameters as required for the Sound Level Meter or FrequencyAnalyzer measurement, see Chapter 3 and Chapter 10, respectively.
5) Under Signal Recording you can specify the Recording Control parameters as follows:– Automatic, if you want to start the recording when you start the measurement and stop
when you pause the measurement, and to limit the recording to Maximum Duration, ifDuration Limit is set to On
– Manual Event, if you want to start and stop the recording using the Manual Eventpushbutton during the measurement and to limit the duration of the recording, ifDuration Limit is set to On. In this case the recording will be at least Minimum Durationlong, but no longer than the Maximum Duration. Use Pre-recording Time and Post-recording Time to specify how much extra you want to be recorded before and after theevent
– External Event, if you want to start and stop the recording using an external trigger signal,connected to the Trigger Input. See details in Appendix A
– Image Event (Type 2270 only), if you want to make a short recording together withcapturing an image. The recording will be "Pre-recording Time + Post-recording Time +1" second long. See details in Table A.13
– Off, if you do not want to record the signal6) Set Recording Quality to High, Medium, Fair or Low in accordance with your needs.
✐Please note: High quality requires more disk space than low quality – details in Appendix A.
7) Set Recorded Signal to either Input A/B-weighted, Input C-weighted or Input Z-weighted (A/B-weighting is determined by setting the parameter in > Setup > FrequencySettings > Broadband (excl. Peak)). Input C-weighted is suitable for recordings usedafterwards to identify the sound source – it contains all the audible content of the signal, butreduces the low-frequency noise from wind, etc.
8) Set Automatic Gain Control to On – if you just want to listen to the signal afterwards. The full120 dB dynamic range (from max. input level and down) will be converted to 40 dB and thesignal is stored as a 16-bit WAV file. Set Automatic Gain Control to Off – if you need to record calibrated signals or need toanalyze the WAV file afterwards on a PC. Set Resolution to 24 bit (recommended) to cover the

CHAPTER 13Signal Recording Option
143
full 120 dB dynamic range (from max. input level and down) or set Resolution to 16 bit andspecify the Peak Recording Level.
9) Tap > Setup > Input > Trigger Input and select a trigger if you want to start the signalrecording using an external trigger signal. See details in Appendix A.
To exit the screen, tap the icon.
13.1.2 Controlling the Recording
The measurement is controlled in the same way you would control a normal Sound Level Metermeasurement, using Start/Pause , Continue , Back-erase and Reset pushbuttons,see Chapter 3 for more details.When the measurement signal is being recorded, the Recording icon is displayed in theStatus Field. The recording is attached to the project as an annotation. The annotations icon is then displayed to indicate that the project has been annotated.When Recording Control is set to Automatic, the recording will start when the measurement isstarted and last for the Maximum Duration or the Elapsed Time, whichever is smallest. If youcontinue a paused measurement, then a new recording is started.When Recording Control is set to Manual Event, the recording will start the first time you pressthe Manual Event pushbutton during the measurement, and stop the second time you press it;if you press it a second time before the Minimum Duration has elapsed, then the recording willcontinue until Minimum Duration has elapsed; if you press it a second time after MaximumDuration has elapsed, then the recording has already been stopped when Maximum Durationelapsed and the pushbutton will initiate a new recording instead.When Recording Control is set to External Event, and Trigger Input is set to Voltage Level, thenrecording is started when the voltage level is ‘high’ and stopped when voltage level is ‘low’(details in Appendix A). Duration Limit has no effect on this setting.When Recording Control is set to Image Event (Type 2270 only), then you will record 1s plus thePre- and Post-recording Time.If Pre-recording Time has been set, then the recording will start this time before you hit theManual Event pushbutton. This is possible because the recording is done continuously in aninternal buffer, ready to be saved as a wave file. The Pre-recording Time is limited by this buffersize and the Recording Quality – details in Appendix A.
✐Please note: Very long signal recordings will be split into wave files containing maximum 10 minutes,that is, a 35-minute signal recording will consist of 4 wave files, three with 10 minutes ofsound and one with 5 minutes of sound.
13.1.3 Playing the Recording
Signal recordings are attached to the measurement project as annotations. The annotations icon is displayed in the Status Field to indicate this. Tap the paperclip to open the list of annotations.
Tap the annotation to play it back – details in Chapter 3 and Chapter 6.
Hand‐held Analyzer Types 2250 and 2270 – User Manual144
13.2 Logging and Enhanced Logging Software
You can use Signal Recording together with the Logging and Enhanced Logging Software. Youcan record the sound for the whole measurement period or you can record sound for controlledparts of the measurement. The recordings are attached to the profile as sound markers. The signalrecordings can be controlled by the Manual Event pushbutton, the Back-erase pushbutton, anexternal trigger signal, or by the level of the measured signal. You can also control the signalrecording using the stylus to mark the interesting part on the profile.
✐Please note: • Signal recordings can only be done during measurements.• Signal recordings can only be done on projects saved on memory cards (or with G4
analyzers, from a USB memory stick).
13.2.1 Setting up the Analyzer
1) Select a Logging, Logging SLM or Enhanced Logging Project Template. (see section 3.2.1 formore details on templates.)
2) Depending on your memory device:– Insert an SD memory card in a SD card slot at the bottom of the analyzer– If you have G1 – 3 analyzers, you can insert a CF memory card in the CF card slot at the
bottom of the analyzer– With G4 analyzers, you can use a USB Type A stick at the bottom of the analyzer
✐Please note: You cannot record the signal on the internal disk.
3) Tap > Explorer. Navigate to the memory card, create a job folder for the measurementsand set the default measurement job/path as described in Chapter 6.
4) Tap > Setup. Set all the parameters as required for the Logging or Enhanced Loggingmeasurement, see Chapter 11 or Chapter 12, respectively.
5) Under Signal Recording you can specify the Recording Control parameters as follows:– Automatic, if you want to start the recording when you start the measurement and stop
when you pause the measurement, and to limit the recording to Maximum Duration, ifDuration Limit is set to On
– Manual Event, if you want to start and stop the recording using the Manual Eventpushbutton during the measurement
– Exclude Event, if you want to start and stop the recording using the Back-erase pushbutton during the measurement
– External Event, if you want to start and stop the recording using an external trigger signal,connected to the Trigger Input
– Level Event, if you want to start and stop the recording based on the level trigger settingsduring the measurement
– All Events, if you want to start and stop the recording based on any of the events

CHAPTER 13Signal Recording Option
145
✐Please note: When Recording Control set to any of the events, you can limit the duration of therecording, if Duration Limit is set to On. In this case the recording will be at leastMinimum Duration long, but no longer than the Maximum Duration. Use Pre-recording Time and Post-recording Time to specify how much extra you want to berecorded before and after the event
– Image Event (Type 2270 only), if you want to make a short recording together withcapturing an image. The recording will be "Pre-recording Time + Post-recording Time +1" seconds long. See details in Appendix A
– Off, if you do not want to record the signal6) Set Recording Quality to High, Medium, Fair or Low in accordance with your needs.
✐Please note: High quality requires more disk space than low quality – details in Appendix A.
7) Set Recorded Signal to either Input A/B-weighted, Input C-weighted or Input Z-weighted (A/B-weighting is determined by setting the parameter in Setup > FrequencySettings > Broadband (excl. Peak)). Input C-weighted is suitable for recordings usedafterwards to identify the sound source – it contains all the audible content of the signal, butreduces the low-frequency noise from wind, etc.
8) Set Automatic Gain Control to On – if you just want to listen to the signal afterwards. The full120 dB dynamic range (from max. input level and down) will be converted to 40 dB and thesignal is stored as a 16-bit wav-file. Set Automatic Gain Control to Off – if you need to record calibrated signals or need toanalyze the wav-file afterwards on a PC. Set Resolution to 24 bit (recommended) to cover thefull 120 dB dynamic range (from max. input level and down) or set Resolution to 16 bit andspecify the Peak Recording Level.
To start the recording using an external trigger signal, tap > Setup > Input and specifyTrigger Input. See details in Appendix A.To exit the screen, tap the icon.
13.2.2 Controlling the Recording
The measurement is controlled in the same way you would control a normal logging measurement,using Start/Pause, Continue, Reset and Save pushbuttons, see Chapter 11 for more details.When the measurement signal is being recorded, then the Recording icon is displayed in theStatus Field. The recording is attached to the profile as a Marker 6 (Sound). If you set Recording Control to Automatic, the recording will start when the measurement isstarted and last for Maximum Duration or Elapsed Time, whichever is smallest. If you continuea paused measurement, then a new recording is started.If you set Recording Control to Manual Event, the recording will start the first time you press theManual Event pushbutton during the measurement (this starts a Manual Event marker and aSound marker), and stop the second time you press it; if you press it a second time before
Hand‐held Analyzer Types 2250 and 2270 – User Manual146
Minimum Duration has elapsed, then the recording will continue until Minimum Duration haselapsed; pressing it a second time after Maximum Duration has elapsed will have no effect onthe signal recording (the Manual Event marker, however, will be stopped).If you set Recording Control to Exclude Event, the recording will start the first time you press theBack-Erase pushbutton during the measurement (this starts an Exclude Event marker and aSound marker), and stop the second time you press it – the behaviour will be similar to controlby the Manual Event pushbutton.When Recording Control is set to External Event, and Trigger Input is set to Voltage Level, thenrecording is started when the voltage level is ‘high’ and stopped when voltage level is ‘low’(details in Appendix A). Duration Limit has no effect on this setting.If you set Recording Control to Level Event, the recording will start, controlled by the leveltrigger – see Chapter 11 for details.When Recording Control is set to Image Event (Type 2270 only), then you will record 1s plus thePre- and Post-recording TimeIf you set Recording Control to All Events, the recording will start when any of the events abovebecome active, and stop when all events are inactive again.If Pre-recording Time has been set, then the recording will start this time before the Eventappears. This is possible because the recording is done continuously in an internal buffer, readyto be saved as a wave file. The Pre-recording Time is limited by this buffer size and the RecordingQuality – details in Appendix A.
✐Please note: Very long signal recordings will be split into wave files containing maximum 10 minutes,that is, a 35-minute signal recording will consist of 4 wave files, three with 10 minutes ofsound and one with 5 minutes of sound.
13.2.3 Control Recording using the Stylus
If Recording Control is set to any of the events, or to All Events, the recording can also becontrolled using the stylus directly on the profile, in the same way as you mark soundcategories – details in Chapter 11.

CHAPTER 13Signal Recording Option
147
Fig.13.1Example Logging display (showing internal buffer marker)
The small triangle above the profile indicates the amount of sound you have in the internalbuffer – ready for storage in a wave-file. You will have sound from this triangle to the right-handside of the profile. The triangle is updated every second.To make a signal recording using the stylus, you tap and hold the stylus on the profile display anddrag it to the position where the signal recording should end, then you remove the stylus and geta drop-down menu with the possibility of setting one of the six markers. If you select Sound, thena sound marker is made and the sound for the marked interval is stored in a wave file. Only theportion of the sound available in the internal buffer (to the right of the small triangle) will bestored and the sound marker will only indicate this part.
✐Please note: When selecting an interval for storing (or setting a marker), the profile display freezes, butthe signal recording is still updated in the internal buffer. The part of the buffer availableon the screen will decrease and you will see the small triangle move to the right. Be surenot to wait too long in selecting the Sound marker from the drop-down menu – otherwisethe signal recording will disappear from the internal buffer.
13.2.4 Playing the Recording
You playback the sound simply by selecting part of the marker – as described in section11.3.3 – and choose Play Sound from the resulting drop-down menu. The following drop-downmenu will then appear (Fig.13.2).

Hand‐held Analyzer Types 2250 and 2270 – User Manual148
Fig.13.2Playing the recording – the drop‐down menu
Select one of the four ways of playing a sound: Selection will play the part you have selected; RepeatSelection will play the selected part until you press Cancel on the pop-up menu; To End will play thesound from the position you selected the sound marker to the end; and finally All will play theentire signal recording, regardless of your selection point.
Fig.13.3Playing the recording – output level pop‐up
When you have selected the method of play-back, a pop-up appears explaining how to adjust theoutput level in the headphone and how to stop the play-back. Tap the Minimize icon to reduce this to a small blue bar at the top of the screen – allowing youto watch the profile underneath – you will notice that the profile cursor is updated every secondto the position of the sound that is currently being played.

CHAPTER 13Signal Recording Option
149
Fig.13.4Playing the recording – minimizing the pop‐up
The small blue button bar at the top can be maximized again by tapping , or you can close itand stop playback by tapping .
13.2.5 Signal Recordings on the PC
When projects including signal recording have been transferred into an Archive on a PC usingBZ-5503, then the recordings can be played back directly from BZ-5503.Signal Recordings can be input to the Brüel & Kjær PULSE Multi-analyzer platform for furtheranalysis – please contact your local Brüel & Kjær representative for further information.
✐Please note: When recording signals for further analysis in PULSE, be sure to record the Z-weightedsignal and select Automatic Gain Control to Off under the Signal Recording parametersand select the Recording Quality to match your needs for frequency content – see detailson sampling frequency in Appendix A.
When Automatic Gain Control is set to Off, then the calibration information is stored in the wavefiles – allowing PULSE to analyse the signal recordings, taking the calibration into account.
✐Please note: Other sound players than BZ-5503 might not be able to amplify “24-bit per sample” WAVfiles enough to hear weak sounds. If this is needed, then use 16-bits per sample.

Hand‐held Analyzer Types 2250 and 2270 – User Manual150
151
Chapter 14Reverberation Time Software
(Optional Module)
14.1 Introduction
Reverberation Time Software BZ-7227 enables you to measure reverberation time in 1/1-octaveor 1/3-octave.Check the About screen to see whether you have a license to run this module. (To access theAbout screen, tap the Help icon then tap About.) See Chapter 9 for instructions on installinglicenses.
14.1.1 Definition
Reverberation Time (RT) is the most important parameter describing the acoustic quality of aroom or space. It is important for sound levels, speech intelligibility and the perception of music.In addition, it is used to correct for the effects of RT on building acoustics and sound powermeasurements.RT is the decay time for sound in a room after the excitation stops. It is the time for a 60 dB dropin level, but the decay is usually evaluated over a 10, 20 or 30 dB drop, using the measurementswithin these ranges to make a regression line, which is then extrapolated to the 60 dB range(Fig.14.1).RT may be labelled EDT, T20 and T30 respectively for those three evaluation ranges. EDT is usedin room acoustics only, while T20 and T30 may be used for Building Acoustics, Sound Power andAbsorption Coefficient measurements as well.RT is measured in 1/1- or 1/3-octave frequency bands, some of which may be averaged toprovide a single-number result for the most significant bands.RT may range from 0.1 seconds (or less) in anechoic chambers, to 10 or more seconds in largepublic spaces.

Hand‐held Analyzer Types 2250 and 2270 – User Manual152
Fig.14.1 Definition of Reverberation Time (RT). Evaluation range of 30 dB for calculation of T30 indicated
RT varies between positions in a room, so it is usually measured at several positions. The spatialaverage (Room average) for all positions gives an overall assessment, and the position resultsmay be used to indicate the acoustic quality as a function of location.The Room average can either be made as an average of the RT spectra, or calculated for theaveraged decays (ensemble average), that is: the decays for each frequency band are averagedover all positions and the RT spectrum is then calculated for the averaged decays.
14.1.2 How Do We Measure Reverberation Time?
RT can be measured using either Interrupted Noise, with the built-in noise generator, or by usingImpulsive Excitation (Schroeder Method), such as from a pistol or balloon burst.
Interrupted Noise Method
When using a power amplifier and loudspeaker sound source (Fig.14.2), the analyzer will turn itsnoise generator on and off, then measure and display the RT spectrum and decays.
Reverberation Time
–35 dB
Background Noise Level
Time
–5 dB
0 dB
Regression LinedB
Excitation Level
Evaluation Range
060210
–60dB

CHAPTER 14Reverberation Time Software (Optional Module)
153
Fig.14.2 Typical RT measurement setup using a loudspeaker source
Fig.14.3 Typical RT measurement cycle for the interrupted noise method
Fig.14.3 shows a typical RT measurement cycle automatically performed by the analyzer, wherethe different steps are described as follows:1) After ‘Start’, there is a chosen ‘Escape Time’ which allows for vacating the measurement site.2) The noise generator is then switched on and waits for the chosen ‘Build-up’ time to allow for
a steady state to be reached.3) The decay measurement starts. The level for the first second, or so, (labelled ‘About 1s’ on
Fig.14.3) is used to identify the excitation sound level as the 0 dB reference level.4) The noise generator is switched off and the ‘Decay time’ starts.5) The decay measurement ends when only the background noise level is measured (automatically
detected by the analyzer).
0-1
-2
-3
-4-5-6
-9
-12
-18
-24-30 dB
-20 -10 0 dB
Power Amplifier Type 2734
White Pink
Generator
RemoteIn Out
Level
Power On
Protect
Loudspeaker
FuseBalanced In
230/115 V AC / 650 W
OO I
2250
4292-L2734
ZE-0948
DIRAC
110009
MP3Player
060208
Start
EscapeTime
Build-upTime About 1s
Generator On
Decay time
Decay measurement
dBSound Level
Time
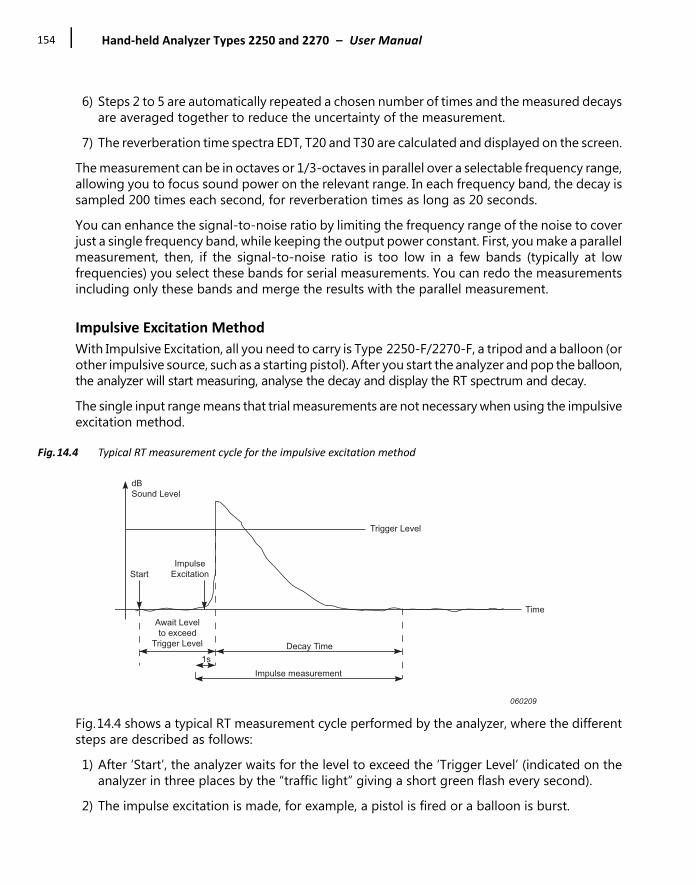
Hand‐held Analyzer Types 2250 and 2270 – User Manual154
6) Steps 2 to 5 are automatically repeated a chosen number of times and the measured decaysare averaged together to reduce the uncertainty of the measurement.
7) The reverberation time spectra EDT, T20 and T30 are calculated and displayed on the screen.The measurement can be in octaves or 1/3-octaves in parallel over a selectable frequency range,allowing you to focus sound power on the relevant range. In each frequency band, the decay issampled 200 times each second, for reverberation times as long as 20 seconds.You can enhance the signal-to-noise ratio by limiting the frequency range of the noise to coverjust a single frequency band, while keeping the output power constant. First, you make a parallelmeasurement, then, if the signal-to-noise ratio is too low in a few bands (typically at lowfrequencies) you select these bands for serial measurements. You can redo the measurementsincluding only these bands and merge the results with the parallel measurement.
Impulsive Excitation Method
With Impulsive Excitation, all you need to carry is Type 2250-F/2270-F, a tripod and a balloon (orother impulsive source, such as a starting pistol). After you start the analyzer and pop the balloon,the analyzer will start measuring, analyse the decay and display the RT spectrum and decay.The single input range means that trial measurements are not necessary when using the impulsiveexcitation method.
Fig.14.4 Typical RT measurement cycle for the impulsive excitation method
Fig.14.4 shows a typical RT measurement cycle performed by the analyzer, where the differentsteps are described as follows:1) After ‘Start’, the analyzer waits for the level to exceed the ‘Trigger Level’ (indicated on the
analyzer in three places by the “traffic light” giving a short green flash every second).2) The impulse excitation is made, for example, a pistol is fired or a balloon is burst.
Time
Trigger Level
Decay Time
Impulse measurement1s
Await Levelto exceed
Trigger Level
StartImpulse
Excitation
dBSound Level
060209
CHAPTER 14Reverberation Time Software (Optional Module)
155
CAUTION: The use of hearing protection is highly recommended.
3) The impulse measurement is started 1 s before the level exceeds the ‘Trigger Level’.4) The impulse measurement stops after the analyzer detects the background noise level again
(automatically measured by the analyzer).5) The analyzer performs backward integration of the impulse measurement.6) The reverberation time spectra EDT, T20 and T30 are calculated and displayed on the screen.
The measurement can be in octaves or 1/3-octaves in parallel over a selectable frequency range.In each frequency band, the decay is sampled 200 times each second. The impulse response is backward integrated (according to the Schroeder method). In theory, theresulting decay will be equivalent to the average of a large number of decays made with theinterrupted noise method. Therefore, the decays will be smooth using just one single shot.
14.2 Setting up the Analyzer
1) Select the REVERBERATION TIME project template. (see section 3.2.1 for more details ontemplates.) The project template is displayed at the top of the screen.
2) Tap > Setup. Set the Bandwidth and Bottom and Top Frequency of the measurementas required.
3) Set Map Based Measurement = No in the Measurement Control setup – the reverberationdecays will then be numbered from Pos. 1 to N. See how to measure with positionmanagement in section 14.2.1.
4) Set Automatic Save = No, if you want to inspect the reverberation time and decays beforemanually saving the measurement – otherwise select Yes to automatically save the decaysafter each measurement.
5) Set Measurement Mode to:– Parallel, for measuring all bands in a spectrum simultaneously– Serial, for measuring selected bands only (to be saved and merged with a previously
measured Parallel spectrum)– Combined, for measuring Parallel and then Serial in an automated sequenceWhen doing the Serial measurement, the bandwidth of the generator will match the selectedband, thus increasing the output power for the band and increasing the signal to noise ratiofor the band.
6) The analyzer automatically detects the decay time and stops the measurement at the end ofthe decay – however, under special conditions (for example, when measuring with highbackground noise) the decay time cannot be detected and the measurement will run up to20 s. To minimize the measurement time and memory requirement for the measurement,
Hand‐held Analyzer Types 2250 and 2270 – User Manual156
you can limit the measurement by setting the Max Decay Time. 3 s is adequate for mostordinary rooms, but should be increased for larger halls or reverberation rooms.
7) Set Excitation to Impulse if you want to measure using the impulse method (go to step15) – otherwise select Interrupted Noise.
14.2.1 Interrupted Noise Method
8) Set the number of decays you want to measure per position – the analyzer automaticallycontrols the generator, measurement of the decays and averaging the decays.
9) Set the Generator as required – set Generator Type to External if you want to control anexternal generator (details in Appendix A) – otherwise leave it at Internal to use the internalgenerator.
10) Select Noise Type for the internal generator. Pink noise is typically used.11) Adjust the level of the internal generator output to match the input of the power amplifier
used by setting Level [re. 1 V]. 💡 Hint: You can manually turn the generator on and off by tapping on the Loudspeaker icon in
the Status Field.
12) Set Escape Time to enable you to leave the room before the generator is turned on duringthe measurement – see Fig.14.3.
13) Set Build-up Time to allow the excitation noise to reach a steady level before themeasurement starts. 1 s is adequate in most ordinary rooms, but should be increased forlarger halls or reverberation rooms.
14) Select the Sound Source used to optimize the frequency response of the internal generatoroutput for either a flat power response or optimum power difference between adjacent1/1- or 1/3-octave bands – thereby eliminating the need for an equalizer to smooth theresponse in most cases. Select a type matching your sound source – select Unknown if you areusing a non-Brüel & Kjær sound source, or do not want to make a correction to the frequencyresponse. Go to step 16.
14.2.2 Impulsive Method
15) Set Trigger Level low enough to be sure the impulse will be triggered, but high enough toavoid triggering on the background noise. A level between 80 and 100 dB is normally adequate.
16) If you have set Automatic Save to Yes, then Trigger Repeat can be set to Yes to automaticallystart a new measurement when a measurement has been saved. This allows you to go toanother position and make a new impulse, without the need for controlling the analyzerbetween the measurements. Observe how the “traffic light” indicates the status of themeasurement (see Table 4.2 and Fig.14.4) making it easy for you to change position andgenerate the impulse synchronized with the measurement procedure. Press the Start/Pause
pushbutton to stop the measurement when the last measurement has been saved.
CHAPTER 14Reverberation Time Software (Optional Module)
157
14.2.3 Signal Recording
17) Set Recording Control to Automatic if you want to record the signal during the measurement.The recordings can be played back afterwards for identifying the cause of measurementsdiffering from each other – or (if Excitation is set to Impulse) for further analysis of themeasured impulse response by post-processing software like DIRAC Room AcousticsSoftware Type 7841.The recordings will contain the signal from when you press the Start pushbutton until themeasurement stops. The recording will be attached to the measurement as an annotation.
✐Please note: Signal Recording requires a license for Signal Recording Option BZ-7226.
To exit the Setup screen, tap the icon.
14.2.4 Controlling the Measurement
The measurement is controlled in the same way you would control a normal Sound Level Metermeasurement, using Start/Pause , Continue , Back-erase and Reset pushbuttons,see Chapter 3 for more details.Note the following exceptions:• Pressing Start initiates a measurement cycle slightly more complex than a standard SLM
measurement – see Fig.14.3 and Fig.14.4 for details. The results are the same, however, a set of measurement data – in this case the reverberation decays at one position
• Creating a new reverberation time project: The measured data is stored at a position – and you can have several positions in one project. Therefore, starting a complete new project cannot be done by pressing Reset and then Start (as when measuring using the SLM template), because this will measure the decays at a single position within the Project – a new project is initiated by selecting a new project template (or the same again). This will create a new project
14.2.5 Serial Measurements
If you have made a measurement using the Interrupted Noise method and at some frequenciesyou have not been able to get a sufficient signal to noise ratio. This problem may show up atfrequencies where the background noise has been too high. The frequencies will then be markedwith red smileys (see Table 14.1).To solve this, lower the background noise (which might not be possible) or increase the power ofthe loudspeaker in the source room.If your loudspeaker already produces as much noise as possible, you can limit the frequencyrange of the noise to cover just a single frequency band while keeping the output power constant,thus increasing the noise level in the smaller frequency range. For a 1/3-octave band, this willincrease the noise level at the band by up to 10 dB.To select the frequency bands to be measured (using noise limited to cover these bands only):
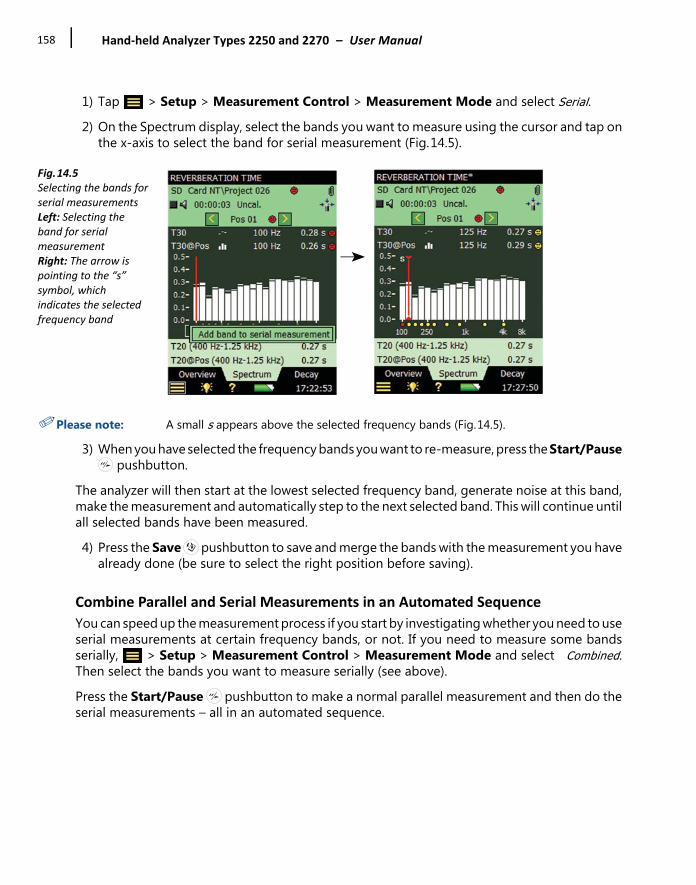
Hand‐held Analyzer Types 2250 and 2270 – User Manual158
1) Tap > Setup > Measurement Control > Measurement Mode and select Serial.2) On the Spectrum display, select the bands you want to measure using the cursor and tap on
the x-axis to select the band for serial measurement (Fig.14.5).
Fig.14.5Selecting the bands for serial measurements Left: Selecting the band for serial measurementRight: The arrow is pointing to the “s” symbol, which indicates the selected frequency band
✐Please note: A small s appears above the selected frequency bands (Fig.14.5).
3) When you have selected the frequency bands you want to re-measure, press the Start/Pause pushbutton.
The analyzer will then start at the lowest selected frequency band, generate noise at this band,make the measurement and automatically step to the next selected band. This will continue untilall selected bands have been measured. 4) Press the Save pushbutton to save and merge the bands with the measurement you have
already done (be sure to select the right position before saving).
Combine Parallel and Serial Measurements in an Automated Sequence
You can speed up the measurement process if you start by investigating whether you need to useserial measurements at certain frequency bands, or not. If you need to measure some bandsserially, > Setup > Measurement Control > Measurement Mode and select Combined.Then select the bands you want to measure serially (see above).Press the Start/Pause pushbutton to make a normal parallel measurement and then do theserial measurements – all in an automated sequence.

CHAPTER 14Reverberation Time Software (Optional Module)
159
14.2.6 Annotating Projects and Positions
While using the Reverberation Time Software you can annotate the Reverberation Time projectusing the normal method of adding annotations to a project. The annotations can then be viewedby tapping on the Annotations icon or tapping > Explorer. See section 3.4.However, your project can contain a lot of measurements, one per position, so you can annotate anyposition in the project. Signal recordings are automatically attached as annotations to the positions.Annotations at positions are managed in the Overview display – described in the next section.
14.3 Displaying the Results
The Reverberation Time Measurement screen includes three tabs at the bottom: Overview,Spectrum and Decay. The tabs allow you to choose different ways of displaying themeasurement results:• Overview: Shows the measurement positions in a table – one position per row. Use this to
get an overview of your measurements, to include/exclude positions from the spatial average of all positions in the room, and to manage annotations/signal recordings at the positions
• Spectrum: Shows the reverberation spectra graphically, or as a table, for one position, or for the room average. Alternatively, it can show the instantaneous sound pressure level while measuring
• Decay: Shows the reverberation decay at a single frequency, for one position, or for the room average
14.3.1 Overview
The Overview tab shows the measurement positions in a table – one position per row.
Fig.14.6Overview tab

Hand‐held Analyzer Types 2250 and 2270 – User Manual160
Status Field
The Status Field consists of three lines (see Fig.14.6) – the first two lines of information arecommon to the status lines in the Sound Level Meter and Frequency Analyzer (see Chapter 4).
✐Please note: The first line of the Status Field might also contain a smiley, indicating the quality of theroom (the spatial average of all positions). See the description of smileys in the followingparagraph and section 14.5.
The third line of information allows you to:• Select the measured position. The selected position is the one highlighted in the table. The
selected position will be the one displayed when selecting the Spectrum or Decay tab• Step forwards or backwards through the positions on all displays, using the and icons• Get information on the quality of the measurement through a quality indicator (smiley) displayed
as an icon: : means results should be used with caution: means results may be suspect or missing
No icon means the analyzer found no measurement quality issues Tap the smiley to get more detailed information about the quality indication. (See the descriptionof smileys in section 14.5.)
Table
The header row of the table contains (from left to right):• The RT selector (EDT, T20 or T30), which determines which RT to display in the table rows
below. It is also linked to the main Spectrum selector and main Decay selector• The Frequency selector (which includes decrement and increment buttons), determines
the frequency of the readouts in the table rows below. The frequency selector is linked to the Spectrum cursor and the frequency of the selected Decay
• Readout of the RT value for the current measurement, before it is saved to a positionEach row of the table contains (from left to right):• A checkmark controlling whether the position is included or excluded from the Room
Average. Tap it to include (check) or exclude (uncheck) the position. All positions are by default included in the Room Average
• The position. Tap it to get a drop-down with two options, Select and View Annotations. Use Select to select the position and View Annotations to view the list of annotations for the position. You can add annotations on the position from this view – as described in Chapter 6
• Possible annotation indicated by . Tap it to view the list of annotations for the position• The readout of the RT parameter at the frequency determined by the RT selector and Frequency
selector in the table header row. There might be a smiley to the right of the readout warning about the quality of the readout. Tap the smiley to get more detailed information about the warning

CHAPTER 14Reverberation Time Software (Optional Module)
161
14.3.2 Spectrum
The Spectrum tab shows the reverberation time spectrum from a position, or the room averagereverberation time, or both. The sound level is displayed during measurements.
Fig.14.7Spectrum tab
Status Field
The Status Field on the Spectrum tab is the same as on the Overview tab.
Spectrum Graph
The Spectrum graph is the same as in the Frequency Analysis software: Two 1/1-octave, or 1/3-octave spectra, superimposed with cursor readouts. The displayed frequency range is automaticallyadjusted for the measured frequency range.Small smileys are set below each frequency band with a potential problem. The smileys are alsoavailable at the cursor readouts. Tap the smiley at the cursor readout to get detailed informationabout the warning.The Spectrum Parameter selectors above the graph selects which spectra to display. You canchoose to display: T20@Pos, T30@Pos, EDT@Pos, T20, T30 or EDT. If you only want one graph youcan set the other to Off. In addition to choosing which parameter to display, you can choose to Display Sound Level – thiswill display the Z-weighted spectrum LZF together with the A- and C-weighted broadbandlevels – see Fig.14.8. When displaying LZF you can tap the LZF selector and select DisplayReverberation Time to display the reverberation time spectra.When starting a measurement the graph will automatically display the sound level spectrum,when finished it will display the reverberation time spectrum.
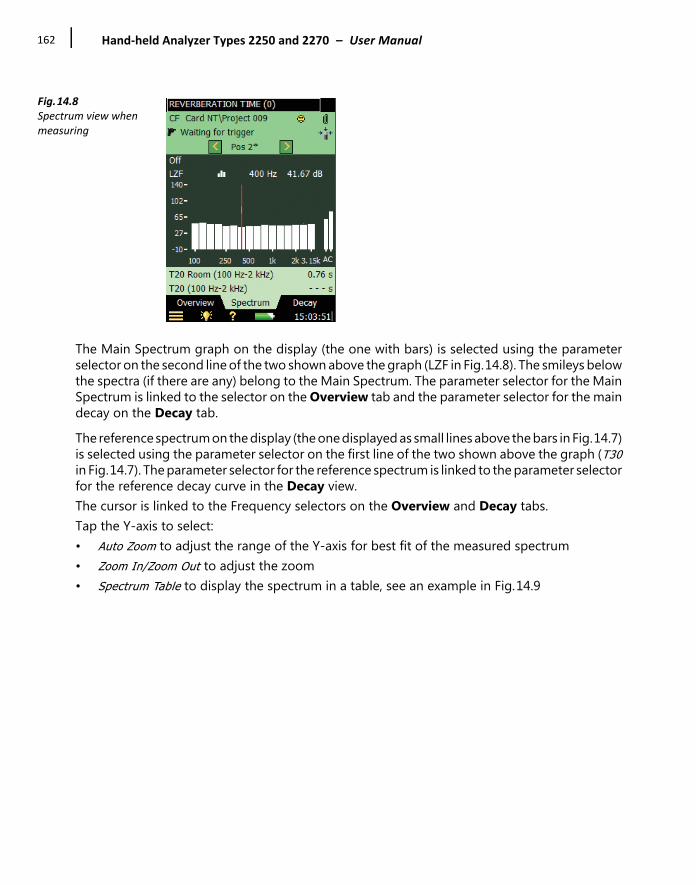
Hand‐held Analyzer Types 2250 and 2270 – User Manual162
Fig.14.8Spectrum view when measuring
The Main Spectrum graph on the display (the one with bars) is selected using the parameterselector on the second line of the two shown above the graph (LZF in Fig.14.8). The smileys belowthe spectra (if there are any) belong to the Main Spectrum. The parameter selector for the MainSpectrum is linked to the selector on the Overview tab and the parameter selector for the maindecay on the Decay tab.The reference spectrum on the display (the one displayed as small lines above the bars in Fig.14.7)is selected using the parameter selector on the first line of the two shown above the graph (T30in Fig.14.7). The parameter selector for the reference spectrum is linked to the parameter selectorfor the reference decay curve in the Decay view.The cursor is linked to the Frequency selectors on the Overview and Decay tabs.Tap the Y-axis to select:• Auto Zoom to adjust the range of the Y-axis for best fit of the measured spectrum• Zoom In/Zoom Out to adjust the zoom• Spectrum Table to display the spectrum in a table, see an example in Fig.14.9

CHAPTER 14Reverberation Time Software (Optional Module)
163
Fig.14.9Spectrum table
Auxiliary Parameters
Below the graphics are two lines containing parameters for displaying the wide band reverberationtimes for the current position, or the room average. You are also able to display the LCF and LAFbroadband values.
14.3.3 Decay
The Decay tab shows the reverberation time decay from a position or the room average – or both(Fig.14.10).
Status Field
The Status Field on the Decay tab is the same as on the Overview and Spectrum tabs.
Decay Graph
The Decay graph shows the decay of one frequency band for the selected position and/or thedecay of the same frequency band for the room average (requires Ensemble Averaging).The Decay Parameter selectors above the graph select which decay to display: T20 at theparticular position (Pos), T30 at Pos or EDT at Pos. Each of these selections show the decay for themeasurement at the selected position together with the readout of T20 at Pos, T30 at Pos and EDTat Pos, respectively. T20, T30 and EDT show the decay for the Room Average together with thereadout of T20, T30 and EDT, respectively. If you only want one graph you can set the otherselector to Off.

Hand‐held Analyzer Types 2250 and 2270 – User Manual164
Fig.14.10Decay view
The main decay on the display (displayed as a continuous line) is selected using the parameterselector in the second line of the two shown above the display (T30 at Pos 1 in Fig.14.10). Theparameter selector for the main decay is linked to the selector on the Overview tab and theparameter selector for the main spectrum on the Spectrum tab.The reference decay on the display (displayed as a dashed line) is selected using the parameterselector in the first line of the two shown above the display (T20 at Pos 1 in Fig.14.10). Theparameter selector for the reference decay is linked to the parameter selector for the referencespectrum on the Spectrum tab.The Frequency selector (with decrement and increment buttons as well), determines thefrequency of the decay curves. The Frequency selector is linked to the spectrum cursor and theFrequency selector on the Overview tab.In the upper right corner of the View Area, the value of a single quality indicator is displayed:• C: xx%. The Curvature indicator – if above 10%, then the quality indicator ‘%’, meaning ‘Decay
is bent’, is setFor more details of the quality indicators, see section 14.5.Tap the Y-axis to select:• Auto Zoom to adjust the range of the Y-axis for best fit of the measured spectrum• Zoom In/Zoom Out to adjust the zoom• Auto Scale to select the best scaling for viewing the spectra – without adjusting the zoom• Scale Up/Scale Down to adjust the full scale value on the Y-axis• Show/Hide Regression Line to show/hide the regression line and the evaluation range for the
main decay, together with the two quality indicators C and

CHAPTER 14Reverberation Time Software (Optional Module)
165
14.4 Measurements with Graphical Position Management
The analyzer can keep track of the source and receiver positions in a graphical way together withthe measurements. To do this, make the following settings on the Setup screen:1) Set Map Based Measurement = Yes in the Measurement Control setup – the reverberation
decays will then be placed graphically on the ‘map’ shown on the Overview tab, andnumbered as source-receiver relations (for example, S1R2 means the decay measurementwith noise from Source 1 and measured at Receiver position 2).
2) Set Meas. All Pos. for Each Source = Yes for measuring all combinations of source andreceiver positions. Set to No, if you want to measure at a specific number of receiver positionsper source.
3) Set No. of Positions per Source to the number of receiver positions you want to measure persource.
4) Set Increment to Sources First, Receivers First or Manual. Typically Sources First is best forImpulsive excitation (you can then walk between the source positions and generate theimpulses while the analyzer is placed on a tripod at one receiver position); Receivers First isbest for Interrupted Noise excitation (you can move the analyzer between the receiver positions,while the sound source remains in the same place).
The Overview tab will then look like Fig.14.11:
Fig.14.11Overview tab showing one source and one receiver position
Note the Add Source and Add Receiver icons on the headline for the map. Tap to addnew sources, and tap to add new receivers on the map.

Hand‐held Analyzer Types 2250 and 2270 – User Manual166
Fig.14.12Overview tab showing two sources and three receiver positions
You can move the sources or receivers on the map by tapping on the source/receiver (seeFig.14.13), select Move from the drop-down menu that appears, then tap at the position whereyou want the source/receiver (see Fig.14.14).
Fig.14.13Tap a source to get a drop‐down with options
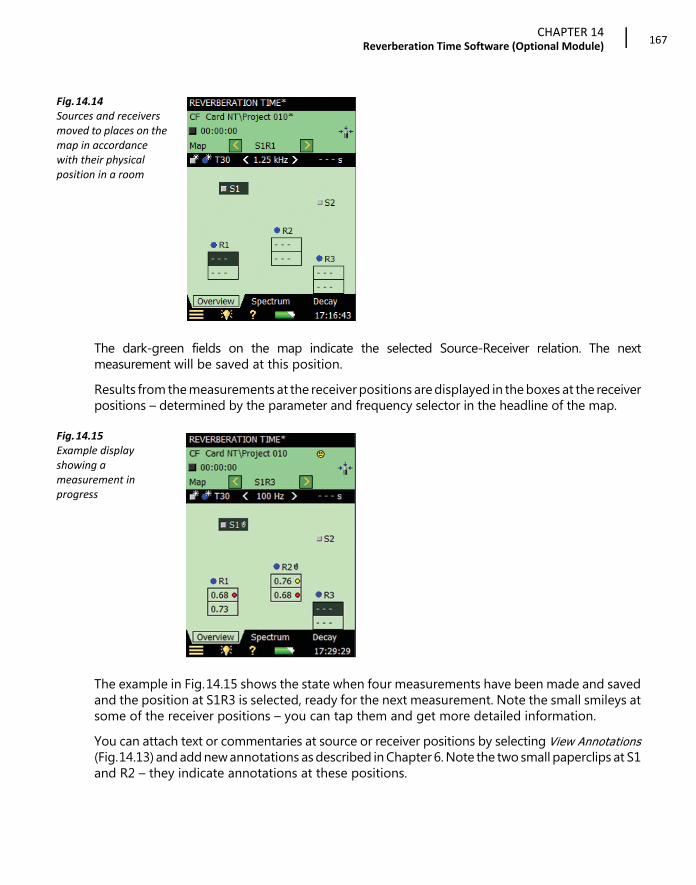
CHAPTER 14Reverberation Time Software (Optional Module)
167
Fig.14.14Sources and receivers moved to places on the map in accordance with their physical position in a room
The dark-green fields on the map indicate the selected Source-Receiver relation. The nextmeasurement will be saved at this position.Results from the measurements at the receiver positions are displayed in the boxes at the receiverpositions – determined by the parameter and frequency selector in the headline of the map.
Fig.14.15Example display showing a measurement in progress
The example in Fig.14.15 shows the state when four measurements have been made and savedand the position at S1R3 is selected, ready for the next measurement. Note the small smileys atsome of the receiver positions – you can tap them and get more detailed information.You can attach text or commentaries at source or receiver positions by selecting View Annotations(Fig.14.13) and add new annotations as described in Chapter 6. Note the two small paperclips at S1and R2 – they indicate annotations at these positions.
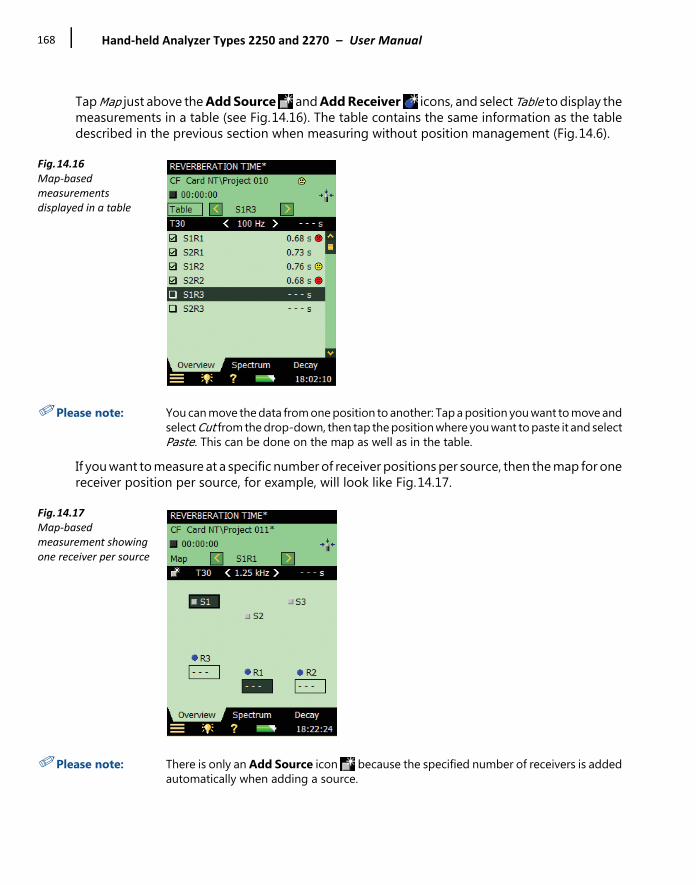
Hand‐held Analyzer Types 2250 and 2270 – User Manual168
Tap Map just above the Add Source and Add Receiver icons, and select Table to display themeasurements in a table (see Fig.14.16). The table contains the same information as the tabledescribed in the previous section when measuring without position management (Fig.14.6).
Fig.14.16Map‐based measurements displayed in a table
✐Please note: You can move the data from one position to another: Tap a position you want to move andselect Cut from the drop-down, then tap the position where you want to paste it and selectPaste. This can be done on the map as well as in the table.
If you want to measure at a specific number of receiver positions per source, then the map for onereceiver position per source, for example, will look like Fig.14.17.
Fig.14.17Map‐based measurement showing one receiver per source
✐Please note: There is only an Add Source icon because the specified number of receivers is addedautomatically when adding a source.

CHAPTER 14Reverberation Time Software (Optional Module)
169
The Spectrum and Decay tabs function in the same way as when measuring without positionmanaging. The only difference is the indication of the position in the Status Field – this is now aSource-Receiver selector instead of a Position Number selector.
14.5 Quality Indicators
There are quality indicators for each frequency band in each reverberation time spectrum foreach reverberation time spectrum. These include letters, symbols or smileys, see Table 14.1 for anoverview. One of the quality indicators are recommended in ISO 3382-2 Annex B, as a measureof how good the slope of the decay can be approximated to a straight line:• C: xx%. The Curvature indicator – if above 10%, then the quality indicator ‘%’, meaning ‘Decay
is bent’, is set
Table 14.1 Overview of Quality Indicators and Smileys
QualityIndicator Smiley Explanation Description
NNo decay end found The end of the decay cannot be
determined because it doesn’t end in the background noise
y Background noise too high Background noise is above the upper evaluation point
t No decay start found No decay start found
Y Background noise too high Background noise is above the lower evaluation point
T Max. Decay Time too short The lower evaluation point is beyond the decay time
Z No decay found The slope of the decay is positive, that is, the reverberation time is negative
P Reverberation time too short Less than 2 points in Evaluation Range
O Excitation sound level too high
Overload
FReverberation time too short BT below 16 (B = filter bandwidth and T =
reverberation time of detector) – required by ISO 3382
R T20 used (T30 unavailable) T20 used (T30 unavailable)

Hand‐held Analyzer Types 2250 and 2270 – User Manual170
The quality indicators (first column) are shown in the spectrum table only.The smileys are shown on: • all readouts of reverberation time results• on the Position selector as the ‘sum’ of all quality indicators from each frequency band • on the Room (project) as the ‘sum’ of all quality indicators from each frequency band in the
Room reverberation time spectrumThe explanation is shown if you tap a smiley (except on the small smileys below the frequencybands in the spectrum – select the frequency band with the cursor and tap the smiley in thecursor readout).
14.6 Saving and Recalling Results
Measurements are saved at position numbers (for example, Pos 1) or Source-Receiver relations(for example, S1R1) within the project. This means there are more measurements stored in theReverberation Time projects than the Sound Level Meter, Frequency Analyzer or Loggingprojects, which all contain only one measurement within each project.To open a saved project, tap > Explorer and tap the project’s icon, then you can view all themeasured data, and even continue measuring at new positions.
n High background noise Background noise too close to level at lower evaluation point
p Short reverberation time Less than 4 points in Evaluation Range
%Decay is bent The difference between T20 and T30 is
greater than 10%. (Recommended quality indicator from ISO 3382–2 Annex B)
k Decay is non-linear Correlation coefficient in linear regression is too low
QualityIndicator Smiley Explanation Description

171
Chapter 15Tone Assessment Option BZ‐7231 –
1/3‐octave Method
Tone Assessment Option BZ-7231 includes tone assessment according to selected methods. Thesoftware module includes an ‘FFT based’ as well as a ‘1/3-octave based’ method. It allowsassessment of tones on-site. The result of the tone assessment is the adjustment to be added to the LAeq as described in therelevant standards for calculating rating level.BZ-7231, when used with Frequency Analysis Software BZ-7223, Logging Software BZ-7224, andEnhanced Logging Software BZ-7225, allows you to:• Assess tones in a measured 1/3-octave spectrum according to ISO 1996:2007, Annex D • Assess tones in a measured 1/3-octave spectrum according to Italian Law, “Ministero
dell’ambiente, Decreto 16 marzo 1998”, hereafter referred to as “Italian Law”BZ-7231, when used with FFT Analysis Software BZ-7230, allows you to: • Assess tones in a measured FFT spectrum according to ISO 1996:2007, Annex C • Use the “Generate tone at cursor” feature to generate a pure tone on the headphone output
of the Hand-held Analyzer, for comparison to the actual noiseThis section will focus on tone assessment based on the 1/3-octave method. Please refer to UserManual BE 1778: “FFT Analysis Software BZ-7230 and Tone Assessment Option BZ-7231, for usewith Hand-held Analyzers Types 2270 and 2250” for detailed information about tone assessmentbased on FFT spectra.Tone Assessment Option BZ-7231 brings results to the user on-site as well as preparing for post-processing and reporting back at the office. Documentation can be completed usingMeasurement Partner Suite BZ-5503, or the measured data can be exported for post-processingby Evaluator Type 7820 or other post-processing software such as Microsoft® Excel®.Check the About screen to see whether you have a license to run this module. (To access theAbout screen, tap the Help icon then tap About.) See Chapter 9 for instructions on installinglicenses.If you have purchased Type 2250/2270 together with the software application(s), then therelevant license(s) comes pre-installed on the analyzer.
Hand‐held Analyzer Types 2250 and 2270 – User Manual172
If you purchased a separate software application for your Type 2250/2270, then you have toinstall the license on the analyzer. This is done using BZ-5503, please consult the on-line helpincluded with the BZ-5503 software for instructions on how to install a license.
15.1 Tone Assessment According to ISO 1996‐2, Annex D
When assessing noise, it is generally recognized that noise containing audible pure tones is moreannoying than noise with the same A-weighted broadband level that does not contain audibletones. When assessing noise that contains tones or narrow bands of noise, an adjustment shallbe added to the A-weighted time averaged level, LAeq. The first evaluation of audible tones innoise is most often carried out by the human ear. But for comparative analysis results, anddocumentation, an objective analysis may be needed. Tone Assessment can be performed using the ISO 1996-2:2007 standard “Determination ofenvironmental noise levels”, Annex D: “Objective method for assessing the audibility of tones innoise – Simplified method”. This method uses 1/3-octave measurements.The selection of method depends on local legislation which may refer to ISO 1996-2 or alocal method. Find more information about rating level and assessment of environmental noise in ISO 1996-2and in Brüel & Kjær’s Environmental Booklet.
15.1.1 ISO 1996‐2, Annex D – Tone Assessment Calculations
The ISO method searches a measured, time averaged (Leq) spectrum, for level differencesbetween adjacent 1/3-octave bands. If the level difference between a 1/3-octave band and theband either side of it are higher than a certain limit, an adjustment for audible tones may be addedto the LAeq level when calculating the rating level, Lr.In ISO 1996-2, Annex D, the spectrum is divided into three frequency ranges: Low, Middle andHigh. In each frequency range a specific limit for the level differences leading to an adjustmentis defined (Fig.15.1).
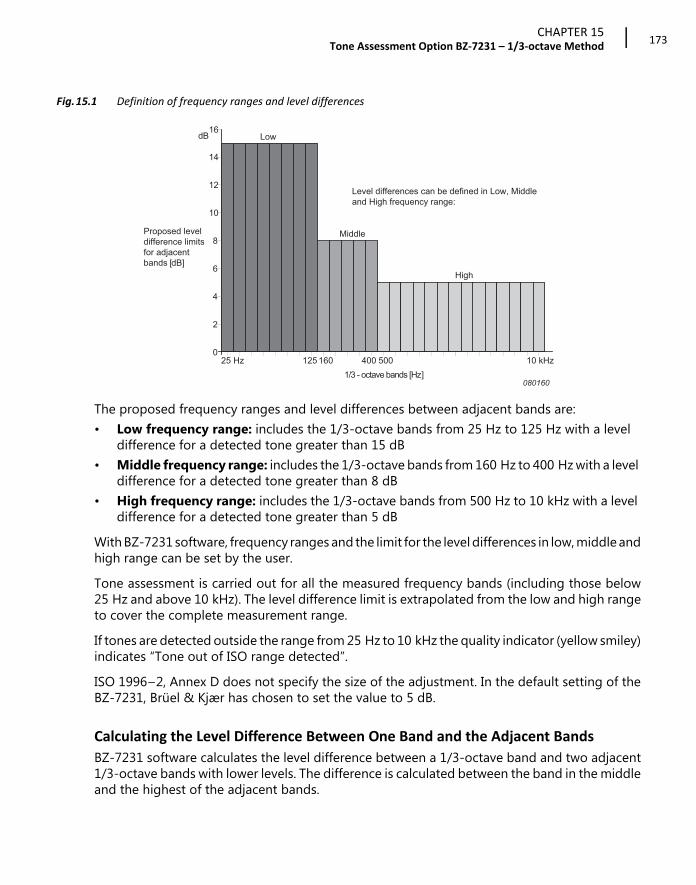
CHAPTER 15Tone Assessment Option BZ‐7231 – 1/3‐octave Method
173
Fig.15.1 Definition of frequency ranges and level differences
The proposed frequency ranges and level differences between adjacent bands are:• Low frequency range: includes the 1/3-octave bands from 25 Hz to 125 Hz with a level
difference for a detected tone greater than 15 dB• Middle frequency range: includes the 1/3-octave bands from 160 Hz to 400 Hz with a level
difference for a detected tone greater than 8 dB• High frequency range: includes the 1/3-octave bands from 500 Hz to 10 kHz with a level
difference for a detected tone greater than 5 dBWith BZ-7231 software, frequency ranges and the limit for the level differences in low, middle andhigh range can be set by the user.Tone assessment is carried out for all the measured frequency bands (including those below25 Hz and above 10 kHz). The level difference limit is extrapolated from the low and high rangeto cover the complete measurement range.If tones are detected outside the range from 25 Hz to 10 kHz the quality indicator (yellow smiley)indicates “Tone out of ISO range detected”.ISO 1996–2, Annex D does not specify the size of the adjustment. In the default setting of theBZ-7231, Brüel & Kjær has chosen to set the value to 5 dB.
Calculating the Level Difference Between One Band and the Adjacent Bands
BZ-7231 software calculates the level difference between a 1/3-octave band and two adjacent1/3-octave bands with lower levels. The difference is calculated between the band in the middleand the highest of the adjacent bands.
25 Hz
Low
Middle
High
125 160 400 500 10 kHz1/3 - octave bands [Hz]
Proposed leveldifference limitsfor adjacentbands [dB]
Level differences can be defined in Low, Middleand High frequency range:
0
2
4
6
8
10
12
14
16dB
080160
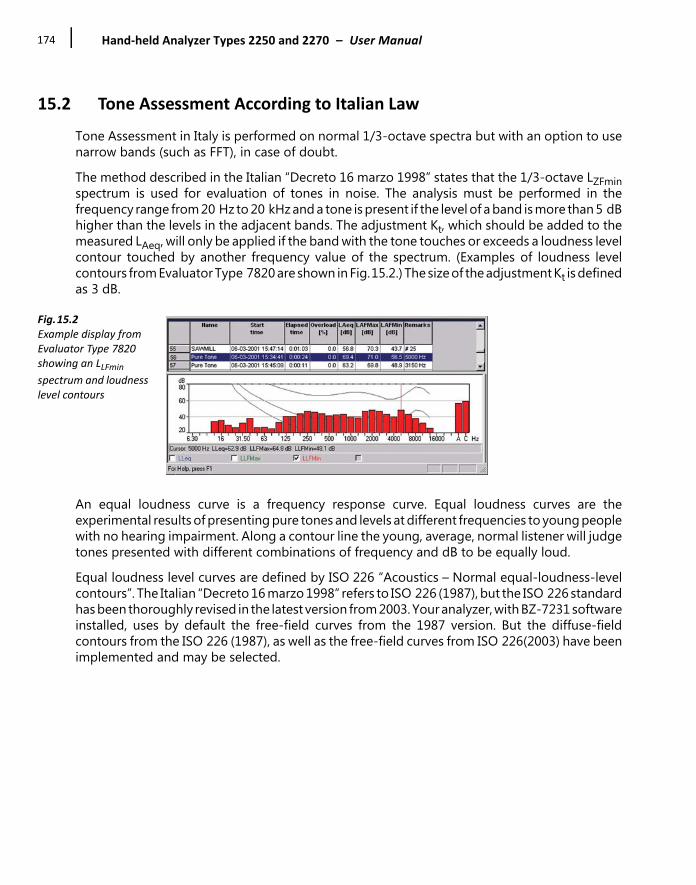
Hand‐held Analyzer Types 2250 and 2270 – User Manual174
15.2 Tone Assessment According to Italian Law
Tone Assessment in Italy is performed on normal 1/3-octave spectra but with an option to usenarrow bands (such as FFT), in case of doubt.The method described in the Italian “Decreto 16 marzo 1998” states that the 1/3-octave LZFminspectrum is used for evaluation of tones in noise. The analysis must be performed in thefrequency range from 20 Hz to 20 kHz and a tone is present if the level of a band is more than 5 dBhigher than the levels in the adjacent bands. The adjustment Kt, which should be added to themeasured LAeq, will only be applied if the band with the tone touches or exceeds a loudness levelcontour touched by another frequency value of the spectrum. (Examples of loudness levelcontours from Evaluator Type 7820 are shown in Fig.15.2.) The size of the adjustment Kt is definedas 3 dB.
Fig.15.2Example display from Evaluator Type 7820 showing an LLFmin
spectrum and loudness level contours
An equal loudness curve is a frequency response curve. Equal loudness curves are theexperimental results of presenting pure tones and levels at different frequencies to young peoplewith no hearing impairment. Along a contour line the young, average, normal listener will judgetones presented with different combinations of frequency and dB to be equally loud.Equal loudness level curves are defined by ISO 226 “Acoustics – Normal equal-loudness-levelcontours”. The Italian “Decreto 16 marzo 1998” refers to ISO 226 (1987), but the ISO 226 standardhas been thoroughly revised in the latest version from 2003. Your analyzer, with BZ-7231 softwareinstalled, uses by default the free-field curves from the 1987 version. But the diffuse-fieldcontours from the ISO 226 (1987), as well as the free-field curves from ISO 226(2003) have beenimplemented and may be selected.

CHAPTER 15Tone Assessment Option BZ‐7231 – 1/3‐octave Method
175
15.3 Setting up the Analyzer
15.3.1 Selecting the Tone Assessment Option
Tap > Setup > Tone Assessment and set Tone Assessment to On (Fig.15.3).
Fig.15.3Set Tone Assessment to On
Tap > Setup > Tone Assessment and set Tone Standard to ISO 1996:2-2007 or the ItalianLaw DM 16-03-1998:
Fig.15.4Setting the Tone Assessment method
If you select the tone assessment method according to the ISO 1996–2, Annex D standard, youcan accept the default setup according to that standard. You can then change the various toneparameters according to your needs (apart from the ISO 226 parameter which is greyed-out) andproceed directly to the measurement.
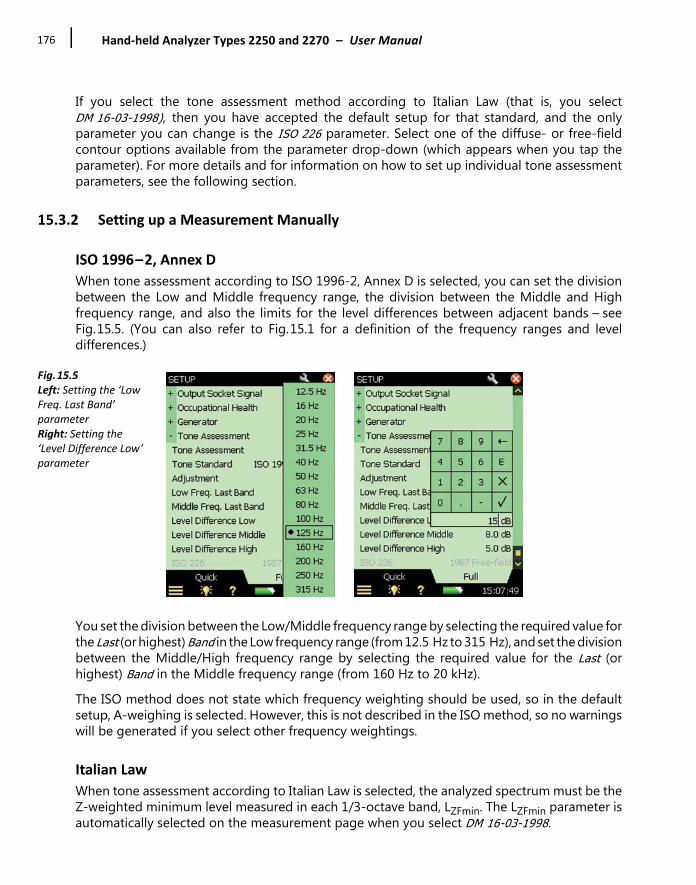
Hand‐held Analyzer Types 2250 and 2270 – User Manual176
If you select the tone assessment method according to Italian Law (that is, you selectDM 16-03-1998), then you have accepted the default setup for that standard, and the onlyparameter you can change is the ISO 226 parameter. Select one of the diffuse- or free-fieldcontour options available from the parameter drop-down (which appears when you tap theparameter). For more details and for information on how to set up individual tone assessmentparameters, see the following section.
15.3.2 Setting up a Measurement Manually
ISO 1996–2, Annex D
When tone assessment according to ISO 1996-2, Annex D is selected, you can set the divisionbetween the Low and Middle frequency range, the division between the Middle and Highfrequency range, and also the limits for the level differences between adjacent bands – seeFig.15.5. (You can also refer to Fig.15.1 for a definition of the frequency ranges and leveldifferences.)
Fig.15.5Left: Setting the ‘Low Freq. Last Band’ parameterRight: Setting the ‘Level Difference Low’ parameter
You set the division between the Low/Middle frequency range by selecting the required value forthe Last (or highest) Band in the Low frequency range (from 12.5 Hz to 315 Hz), and set the divisionbetween the Middle/High frequency range by selecting the required value for the Last (orhighest) Band in the Middle frequency range (from 160 Hz to 20 kHz).The ISO method does not state which frequency weighting should be used, so in the defaultsetup, A-weighing is selected. However, this is not described in the ISO method, so no warningswill be generated if you select other frequency weightings.
Italian Law
When tone assessment according to Italian Law is selected, the analyzed spectrum must be theZ-weighted minimum level measured in each 1/3-octave band, LZFmin. The LZFmin parameter isautomatically selected on the measurement page when you select DM 16-03-1998.
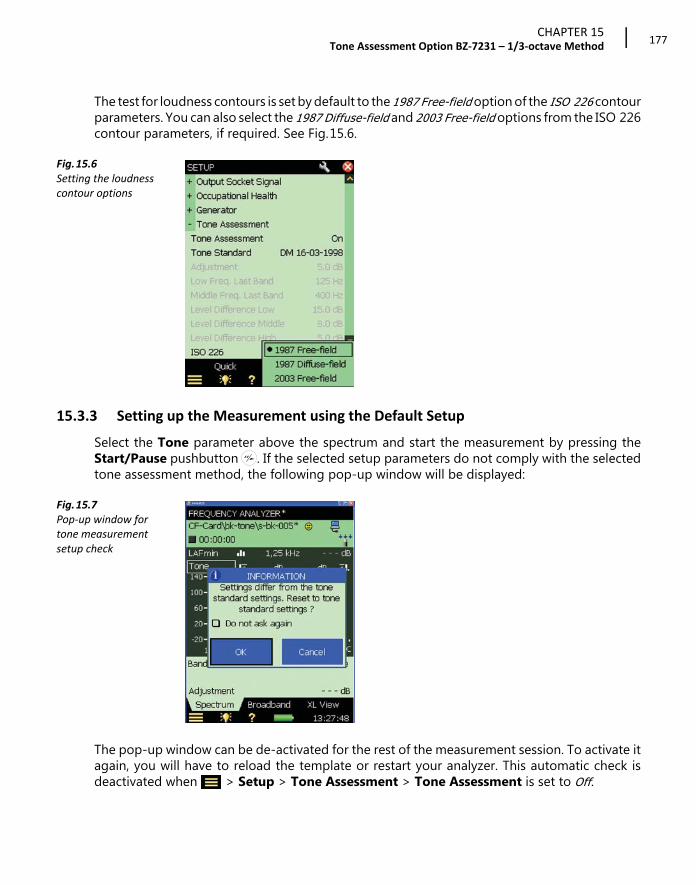
CHAPTER 15Tone Assessment Option BZ‐7231 – 1/3‐octave Method
177
The test for loudness contours is set by default to the 1987 Free-field option of the ISO 226 contourparameters. You can also select the 1987 Diffuse-field and 2003 Free-field options from the ISO 226contour parameters, if required. See Fig.15.6.
Fig.15.6Setting the loudness contour options
15.3.3 Setting up the Measurement using the Default Setup
Select the Tone parameter above the spectrum and start the measurement by pressing theStart/Pause pushbutton . If the selected setup parameters do not comply with the selectedtone assessment method, the following pop-up window will be displayed:
Fig.15.7Pop‐up window for tone measurement setup check
The pop-up window can be de-activated for the rest of the measurement session. To activate itagain, you will have to reload the template or restart your analyzer. This automatic check isdeactivated when > Setup > Tone Assessment > Tone Assessment is set to Off.

Hand‐held Analyzer Types 2250 and 2270 – User Manual178
To reset all the relevant parameters to the default setup, tap the OK button. (The default setupincludes preset parameters that comply with the selected standard. These are described in Table15.1.) To measure with the settings you set up manually, tap the Cancel button.
✐Please note: Even if you have set the Tone Assessment to On (Setup screen), the calculation is notcarried out until the Tone parameter is selected above the spectrum.
💡 Hint: You may find the Template Explorer (accessed from Main Menu ) useful to save yourown measurement setup.
15.3.4 Signal Recording
If a valid license for the Signal Recording Option BZ-7226 is present, it is possible to record thesound while measuring. (Refer to Chapter 13 for information about the Signal Recording Option.)
✐Please note: When analyzer recordings are to be used for re-analysis on a PC, be sure to set AutomaticGain Control parameter to Off, under the Signal Recording parameters, and set theRecording Quality parameter to High.
Table 15.1Default parameters used by the automatic measurement setup check
Setup Parameter Default ValueSelected standard: ISO 1996-2, Annex DAdjustment 3 dBLast band in low frequency range 125 HzLast band in middle frequency range 400 HzLevel difference low 15 dBLevel difference middle 8 dBLevel difference high 5 dBSelected standard: Italian Law (DM 16-03-1998)ISO 226 1987 Free-field

CHAPTER 15Tone Assessment Option BZ‐7231 – 1/3‐octave Method
179
15.4 Measuring
15.4.1 Result Display
Tone assessment is not performed until the Tone parameter is selected above the spectrum. (Thisis done by tapping one of the parameter fields in the two lines above the Spectrum display andchoosing Tone from the drop-down menu.) Once selected, tone assessment is carried out on theselected spectrum. The results are updated during the measurement.
Fig.15.8Selecting the Tone parameter above the spectrum display
On the Results display, a blue marker is set at the top of each detected band with a tone.Differences to the left and right of the frequency band selected by the main cursor are shown (onthe left and right) in the tone parameter panel above the spectrum (Fig.15.9). The main cursor ismoved using either the hard keys or the stylus.
Fig.15.9The differences to the left and right of the selected frequency band are shown in the tone parameter panel – in this example, there is a 11.4 dB difference to the left and a 3.9 dB difference to the right

Hand‐held Analyzer Types 2250 and 2270 – User Manual180
The information shown in the value panel can be changed by tapping in the field. From the toneparameters, the adjustment and the selected tone standard can be selected. See Fig.15.10.Results from the tone assessment can also be found by tapping on the Broadband tab andbrowsing in a similar way.
Fig.15.10Changing the information shown in the value panel
15.5 Logging Software BZ‐7224 Template
The results from the tone assessment can be found in the Spectrum tab of the Logging template.Tone assessment is performed for each logging period, as well as for the total measurement time(Fig.15.11).
Fig.15.11Viewing results on the logging template
See Chapter 11 for more information about setting up a Logging measurement.

CHAPTER 15Tone Assessment Option BZ‐7231 – 1/3‐octave Method
181
15.6 Enhanced Logging Software BZ‐7225 Template
The tone parameter can be shown, for both the logging and the report periods, in the Spectrumtab of the Enhanced Logging template (Fig.15.12).
Fig.15.12Viewing results on the enhanced logging template
See Chapter 12 for more information about setting up a Logging measurement.
15.7 Status Codes (Smileys)
When Tone is selected on the tone parameter panel, the list of status codes is updated. Tap asmiley to get an explanation of the status code, and for a tip on how to remedy or improve thesettings on the analyzer, see an example in Fig.15.13.
Fig.15.13Example of a status code explanation
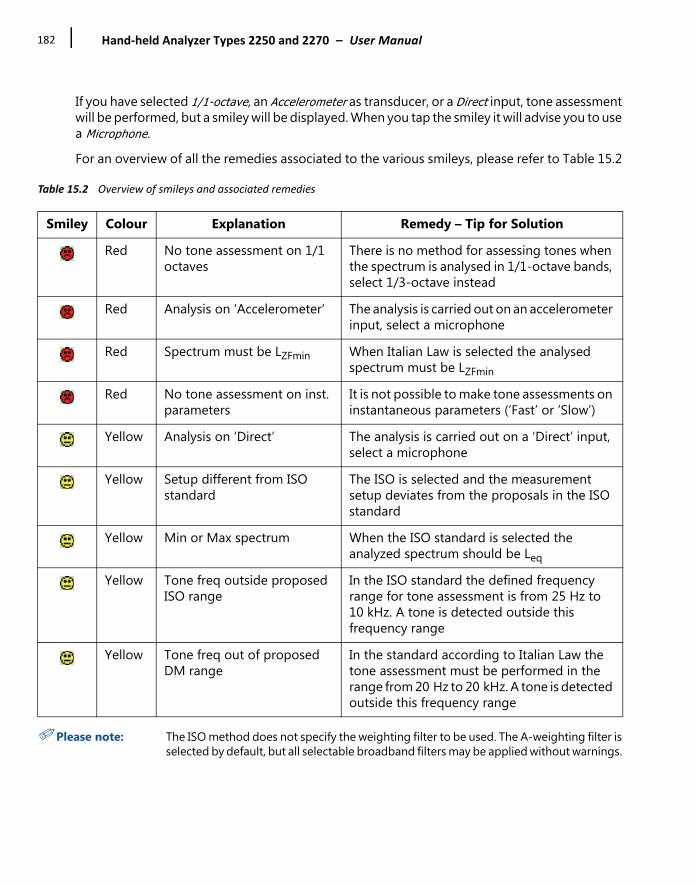
Hand‐held Analyzer Types 2250 and 2270 – User Manual182
If you have selected 1/1-octave, an Accelerometer as transducer, or a Direct input, tone assessmentwill be performed, but a smiley will be displayed. When you tap the smiley it will advise you to usea Microphone.For an overview of all the remedies associated to the various smileys, please refer to Table 15.2
Table 15.2 Overview of smileys and associated remedies
✐Please note: The ISO method does not specify the weighting filter to be used. The A-weighting filter isselected by default, but all selectable broadband filters may be applied without warnings.
Smiley Colour Explanation Remedy – Tip for Solution
Red No tone assessment on 1/1 octaves
There is no method for assessing tones when the spectrum is analysed in 1/1-octave bands, select 1/3-octave instead
Red Analysis on ‘Accelerometer’ The analysis is carried out on an accelerometer input, select a microphone
Red Spectrum must be LZFmin When Italian Law is selected the analysed spectrum must be LZFmin
Red No tone assessment on inst. parameters
It is not possible to make tone assessments on instantaneous parameters (‘Fast’ or ‘Slow’)
Yellow Analysis on ‘Direct’ The analysis is carried out on a ‘Direct’ input, select a microphone
Yellow Setup different from ISO standard
The ISO is selected and the measurement setup deviates from the proposals in the ISO standard
Yellow Min or Max spectrum When the ISO standard is selected the analyzed spectrum should be Leq
Yellow Tone freq outside proposed ISO range
In the ISO standard the defined frequency range for tone assessment is from 25 Hz to 10 kHz. A tone is detected outside this frequency range
Yellow Tone freq out of proposed DM range
In the standard according to Italian Law the tone assessment must be performed in the range from 20 Hz to 20 kHz. A tone is detected outside this frequency range

CHAPTER 15Tone Assessment Option BZ‐7231 – 1/3‐octave Method
183
15.8 Recalling Saved Measurements
Saved measurements using the Frequency Analyzer, Logging and Enhanced Logging templatescan be opened and the Tone Assessment can be applied. Please refer to section 3.3 and section6.3 for information on how to save and recall measurements, respectively.

Hand‐held Analyzer Types 2250 and 2270 – User Manual184
185
Chapter 162‐channel Option BZ‐7229
2-channel Option BZ-7229 enables 2-channel measurements with Hand-held AnalyzerType 2270. This option adds an extra channel of measurement data. The two channels can haveinputs from the same type of transducer (for example, two microphones) or different transducers(for example, one microphone and one accelerometer).Check the About screen to see whether you have a license to run this module. (To access theAbout screen, tap the Help icon then tap About.) See Chapter 9 for instructions on installinglicenses.The 2-channel Option works with the following applications: • Sound Level Meter BZ-7222• Frequency Analysis BZ-7223• Logging BZ-7224• Enhanced Logging BZ-7225• Building Acoustics Software BZ-7228and with these options:• Signal Recording Option BZ-7226• Enhanced Vibration and Low Frequency Option BZ-7234
✐Please note: • 2-channel Enhanced Logging is not available for G1 – 3 analyzers. Please refer to Building Acoustics Software BZ-7228 User Manual BE-1799 for a description of the Dual-channel Building Acoustics Software
• If you have purchased your analyzer together with the software application(s), then the relevant license(s) comes pre-installed on the analyzer
• If you purchased a separate software application for your analyzer, you have to install the license on the analyzer. This is done using BZ-5503, please consult the online help included with the BZ-5503 software for instructions on how to install a license
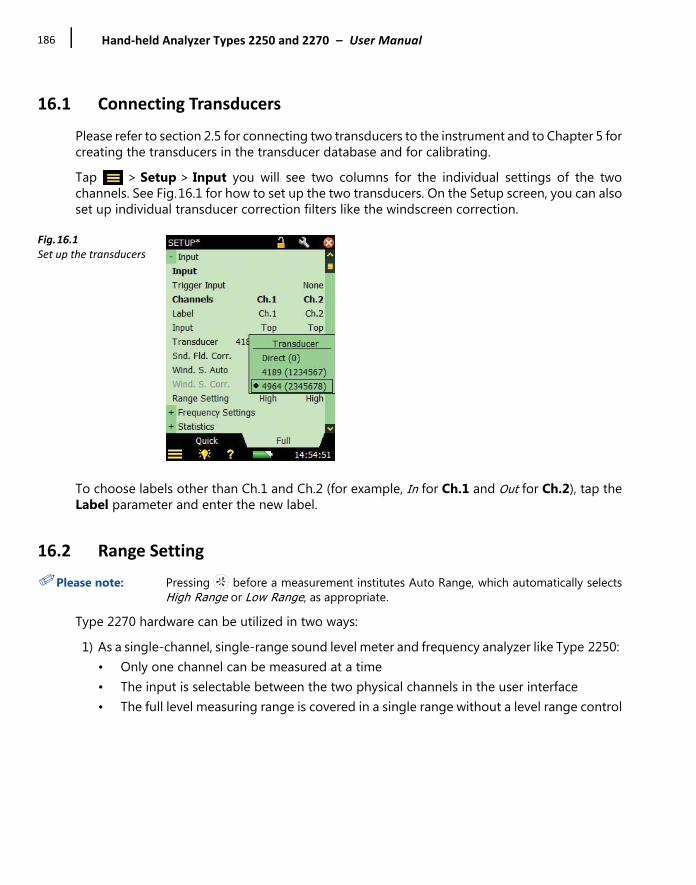
Hand‐held Analyzer Types 2250 and 2270 – User Manual186
16.1 Connecting Transducers
Please refer to section 2.5 for connecting two transducers to the instrument and to Chapter 5 forcreating the transducers in the transducer database and for calibrating.Tap > Setup > Input you will see two columns for the individual settings of the twochannels. See Fig.16.1 for how to set up the two transducers. On the Setup screen, you can alsoset up individual transducer correction filters like the windscreen correction.
Fig.16.1Set up the transducers
To choose labels other than Ch.1 and Ch.2 (for example, In for Ch.1 and Out for Ch.2), tap theLabel parameter and enter the new label.
16.2 Range Setting
✐Please note: Pressing before a measurement institutes Auto Range, which automatically selectsHigh Range or Low Range, as appropriate.
Type 2270 hardware can be utilized in two ways:1) As a single-channel, single-range sound level meter and frequency analyzer like Type 2250:
• Only one channel can be measured at a time• The input is selectable between the two physical channels in the user interface• The full level measuring range is covered in a single range without a level range control
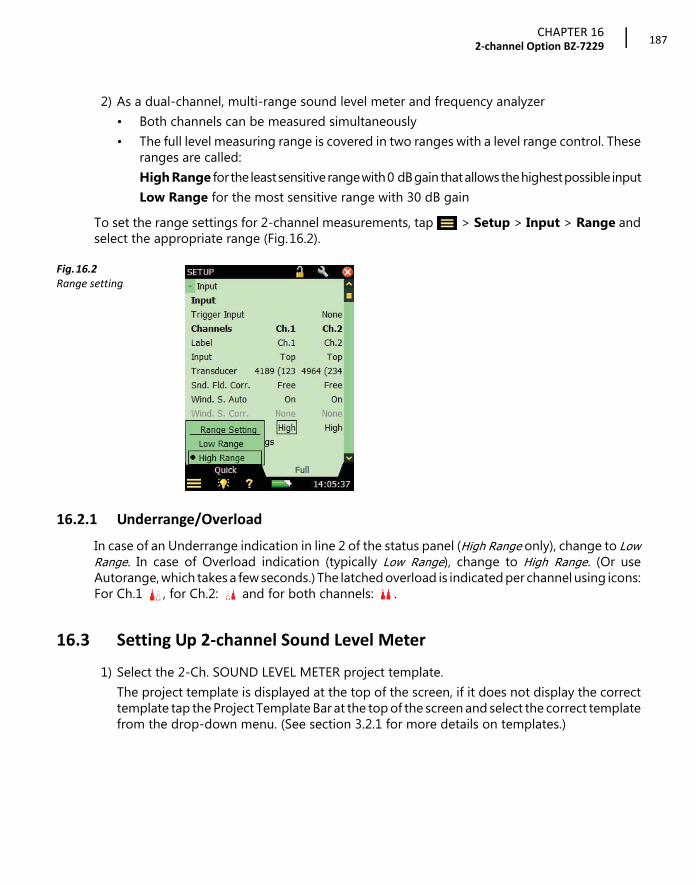
CHAPTER 162‐channel Option BZ‐7229
187
2) As a dual-channel, multi-range sound level meter and frequency analyzer• Both channels can be measured simultaneously• The full level measuring range is covered in two ranges with a level range control. These
ranges are called:High Range for the least sensitive range with 0 dB gain that allows the highest possible inputLow Range for the most sensitive range with 30 dB gain
To set the range settings for 2-channel measurements, tap > Setup > Input > Range andselect the appropriate range (Fig.16.2).
Fig.16.2Range setting
16.2.1 Underrange/Overload
In case of an Underrange indication in line 2 of the status panel (High Range only), change to LowRange. In case of Overload indication (typically Low Range), change to High Range. (Or useAutorange, which takes a few seconds.) The latched overload is indicated per channel using icons:For Ch.1 , for Ch.2: and for both channels: .
16.3 Setting Up 2‐channel Sound Level Meter
1) Select the 2-Ch. SOUND LEVEL METER project template. The project template is displayed at the top of the screen, if it does not display the correcttemplate tap the Project Template Bar at the top of the screen and select the correct templatefrom the drop-down menu. (See section 3.2.1 for more details on templates.)

Hand‐held Analyzer Types 2250 and 2270 – User Manual188
2) Tap > Setup > (Fig.16.3).– Frequency Settings to set Broadband frequency weighting parameters, as required.– Statistics to set statistics parameters, as required.
3) Tap to exit.
Fig.16.3Setting the frequency and statistics parameters
16.3.1 Controlling the Measurement
The measurement is controlled in the same way you would control a normal Sound Level Metermeasurement, using Start/Pause , Continue , Back-erase and Reset pushbuttons,see Chapter 3 for more details.The two channels are controlled and measured simultaneously, thus some of the housekeepingparameters are common for the two channels, e.g., Start Time and Elapsed Time.
16.3.2 Displaying the Results
The results are displayed as bar graphs and measurement parameters can be displayed on theBroadband tab or XL View (Extra Large) tab by selecting the appropriate tab (Fig.16.4).
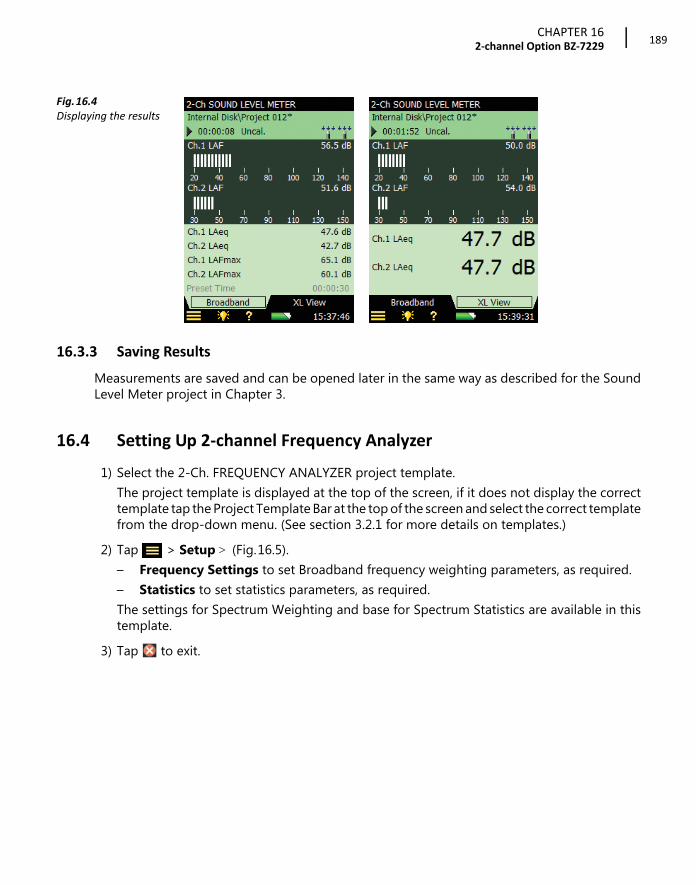
CHAPTER 162‐channel Option BZ‐7229
189
Fig.16.4Displaying the results
16.3.3 Saving Results
Measurements are saved and can be opened later in the same way as described for the SoundLevel Meter project in Chapter 3.
16.4 Setting Up 2‐channel Frequency Analyzer
1) Select the 2-Ch. FREQUENCY ANALYZER project template. The project template is displayed at the top of the screen, if it does not display the correcttemplate tap the Project Template Bar at the top of the screen and select the correct templatefrom the drop-down menu. (See section 3.2.1 for more details on templates.)
2) Tap > Setup > (Fig.16.5).– Frequency Settings to set Broadband frequency weighting parameters, as required.– Statistics to set statistics parameters, as required.The settings for Spectrum Weighting and base for Spectrum Statistics are available in thistemplate.
3) Tap to exit.
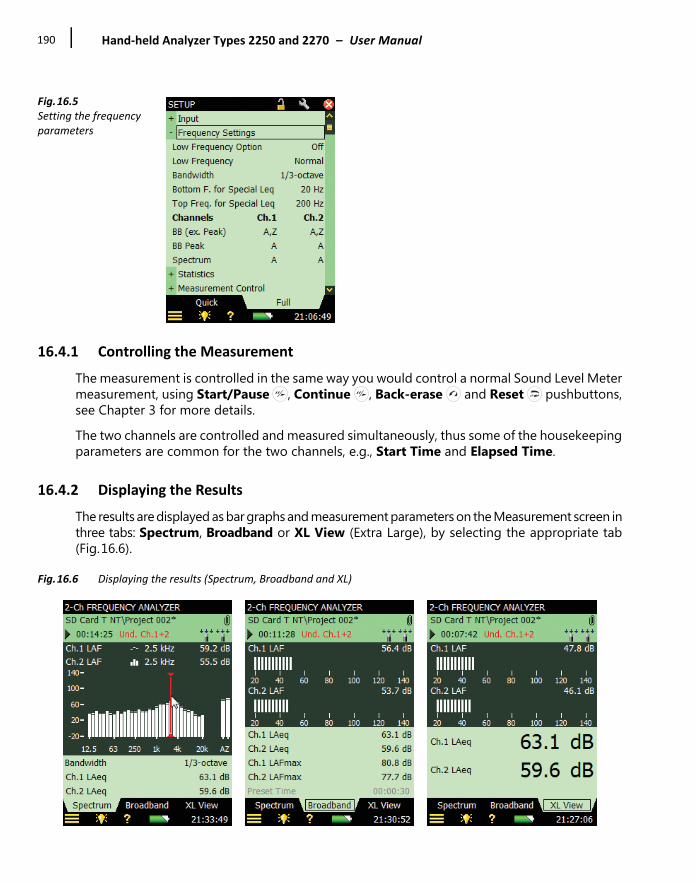
Hand‐held Analyzer Types 2250 and 2270 – User Manual190
Fig.16.5Setting the frequency parameters
16.4.1 Controlling the Measurement
The measurement is controlled in the same way you would control a normal Sound Level Metermeasurement, using Start/Pause , Continue , Back-erase and Reset pushbuttons,see Chapter 3 for more details.The two channels are controlled and measured simultaneously, thus some of the housekeepingparameters are common for the two channels, e.g., Start Time and Elapsed Time.
16.4.2 Displaying the Results
The results are displayed as bar graphs and measurement parameters on the Measurement screen inthree tabs: Spectrum, Broadband or XL View (Extra Large), by selecting the appropriate tab(Fig.16.6).
Fig.16.6 Displaying the results (Spectrum, Broadband and XL)

CHAPTER 162‐channel Option BZ‐7229
191
When the same type of transducers are used by both channels (for example, two microphones ortwo accelerometers) or if you only display data from one channel, then the spectrum display is thestandard spectrum display (Fig.16.7).
Fig.16.7Single‐channel spectrum
When the transducers at the two channels are of different types (for example, a microphone andan accelerometer), the scaling of the two spectra can be set individually for easy comparison. Ch.1will use the standard Y-axis at the left of the spectrum and Ch.2 will have its own Y-axis to the rightof the spectrum (instead of the broadband values). Tapping on the Ch.2 Y-axis reveals the samepossibilities for zooming and scaling the spectrum as for Ch.1. See examples in Fig.16.8.
Fig.16.8 Displaying the results with different scaling for each channel

Hand‐held Analyzer Types 2250 and 2270 – User Manual192
16.4.3 Saving Results
Measurements are saved and can be opened later in the same way as described for the SoundLevel Meter project in Chapter 3.
16.5 Setting Up 2‐channel Logging and Enhanced Logging
1) Select:– The 2-Ch. LOGGING SLM project template for logging broadband data only from the two
inputs– The 2-Ch. LOGGING project template for logging both spectra and broadband data from
the two inputs– The 2-Ch. ENH. LOGGING project template for logging both spectra and broadband data
from the two inputs, making reports and periodically saving the data on the memorycard.
✐Please note: 2-Ch. Enh. Logging is not available for G1–3.The project template is displayed at the top of the screen, if it does not display the correcttemplate tap the Project Template Bar at the top of the screen and select the correct templatefrom the drop-down menu. (See section 3.2.1 for more details on templates.)
2) Tap > Setup > (Fig.16.5).– Frequency Settings to set Broadband frequency weighting parameters, as required.– Statistics to set statistics parameters, as required.
3) Set the parameters you want to log every 10/100 ms in Logged Broadband (10/100 ms). You can specify up to 4 parameters from the two channels.
4) Set the broadband parameters you want to log in Logging Broadband. You can either log all parameters from both channels or select up to 10 parameters from thetwo channels. The fewer parameters you select the less space will be needed for saving on thememory card.
5) Set the spectrum parameters you want to log in Logged Spectrum. You can either log all spectrum parameters from both channels or select up to four spectrumparameters from the two channels.
6) Set the Level Trigger parameter(s) as required. You can level trigger on a parameter from either Ch.1 or Ch.2.
7) Tap to exit.
CHAPTER 162‐channel Option BZ‐7229
193
✐Please note: You should select the transducers before selecting the parameters to log and selecting thelevel trigger parameter(s). Changing the transducer afterwards might correct the selectedparameter; for example, if you have selected to log Ch.1 LAeq and change the transducerat channel 1 from a microphone to an accelerometer, then the Ch.1 LAeq will not beavailable anymore and the parameter will be set to Off.
16.5.1 Controlling the Measurement
The measurement is controlled in the same way you would control a single-channel Logging orEnh. Logging measurement. See Chapter 11 and Chapter 12 for more details. The two channels are controlled and measured simultaneously, thus some of the housekeepingparameters are common for the two channels, for example, Start Time and Elapsed Time.
16.5.2 Displaying the Results
The results are displayed as bar graphs and measurement parameters on the Measurement screen onthree tabs: Profile, Spectrum or Broadband, by selecting the appropriate tab.See Chapter 11 for more details on Logging displays and Chapter 12 for more details oncontrolling Enhanced Logging displays.
16.5.3 Saving Results
Measurements are saved and can be opened later in the same way as described for Logging inChapter 11 and Enhanced Logging in Chapter 12.
16.6 Setting Up 2‐channel Signal Recording
Signal Recording in the 2-Ch. templates is set up in the same way as in the single channeltemplates (Chapter 13), with the following additions and changes:1) The Recording Channel parameter can be set to Ch.1, Ch.2 or Both.
Choose Both to record both channels simultaneously.2) The Recorded Signal parameter is set to Input Z-weighted and cannot be changed.
The Recorded Signal parameter is not displayed in the setup.3) If Automatic Gain Control set to Off, the Peak Recording Level is automatically set to
highest possible setting; for example, 145 dB for Range Setting set to High Range and 115 dBfor Range Setting set to Low Range when using Type 4189 microphones. The Peak recording Level parameter is not displayed in the setup.
2-channel recordings are played back in the headphones as a stereo signal.Use Measurement Partner Suite BZ-5503 to play back the 2-channel recordings either as a stereosignal or as two mono signals, one for Ch.1 and one for Ch.2.

Hand‐held Analyzer Types 2250 and 2270 – User Manual194

195
Chapter 17Enhanced Vibration and
Low‐frequency Option BZ‐7234
Enhanced Vibration and Low-frequency Option BZ-7234 enables • G-weighting parameters in accordance with the standards ISO 7196:1995 and
ANSI S1.42–2001 (R2011) using Brüel & Kjær low-frequency microphones• Measurements of human vibration parameters using a Brüel & Kjær low-level accelerometer
in accordance with the standards ISO 8041:2005 and DIN 45669–1:2010–09• High- and low-pass filters together with integration of the time domain signal
(accelerometer input) to produce:– Broadband acceleration values within specific frequency ranges– Broadband velocity values within specific frequency ranges– Broadband displacement values within specific frequency ranges– Acceleration spectra– Velocity spectra
• Peak-Peak value• 1/3-octave frequency analysis down to 0.8 Hz (1/1-octave down to 1 Hz)This option can be used together with the following modules:• Sound Level Meter Software BZ-7222• Frequency Analyzer Software BZ-7223• Logging Software BZ-7224• Enhanced Logging Software BZ-7225 Check the About screen to see whether you have a license to run this module. (To access theAbout screen, tap the Help icon then tap About.) See Chapter 9 for instructions on installinglicenses.
✐Please note: • If you have purchased your analyzer together with any software applications, then the relevant licenses come pre-installed on the analyzer.
• If you purchased a separate software application for your analyzer, then you have to install the license on the analyzer. This is done using BZ-5503, please consult the online help included with the BZ-5503 software for instructions on how to install a license.

Hand‐held Analyzer Types 2250 and 2270 – User Manual196
17.1 Sound Measurements and G‐weighting
This section describes how to measure G-weighting parameters. See the G-weighted frequencyresponse in Fig.17.1.
Fig.17.1 G‐weighted frequency response
Enhanced Vibration and Low Frequency Option BZ-7234, together with BZ-7222, BZ-7223,BZ-7224 or BZ-7225 and a low-frequency microphone, Type 4193 or Type 4964* measures thefollowing timed broadband parameters in addition to the standard measured parameters:• LGeq: G-weighted equivalent continuous noise level• LG10max: Maximum time-weighted sound level measured with G-weighting and 10 s
exponential time constant• LG10min: Minimum time-weighted sound level measured with G-weighting and 10 s
exponential time constant• LGpeak: Maximum peak sound level with G-weighting• TGpeak:Time when the G-weighted peak sound level occurredThe following instantaneous values are also available:• LG10: Instantaneous time-weighted sound level with G-weighting and 10 s exponential time
constant • LGpeak,1s: Maximum peak sound level with G-weighting during the latest second
* Possibly with Low-frequency Adaptor UC-0211. Refer to Table C.5 note for Type 4193 and Type 4964.
–80.00
–70.00
–60.00
–50.00
–40.00
–30.00
–20.00
–10.00
0.00
20.00
10.00
Gai
n [d
B]
0.1000 1.0000 10.0000 100.0000 10000.0000Frequency [Hz]
130809
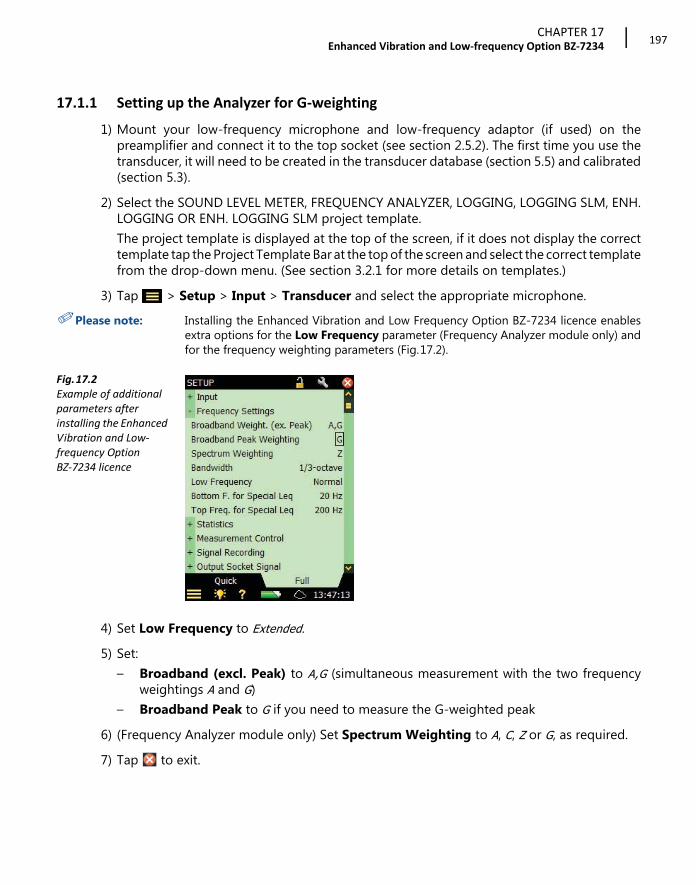
CHAPTER 17Enhanced Vibration and Low‐frequency Option BZ‐7234
197
17.1.1 Setting up the Analyzer for G‐weighting
1) Mount your low-frequency microphone and low-frequency adaptor (if used) on thepreamplifier and connect it to the top socket (see section 2.5.2). The first time you use thetransducer, it will need to be created in the transducer database (section 5.5) and calibrated(section 5.3).
2) Select the SOUND LEVEL METER, FREQUENCY ANALYZER, LOGGING, LOGGING SLM, ENH.LOGGING OR ENH. LOGGING SLM project template. The project template is displayed at the top of the screen, if it does not display the correcttemplate tap the Project Template Bar at the top of the screen and select the correct templatefrom the drop-down menu. (See section 3.2.1 for more details on templates.)
3) Tap > Setup > Input > Transducer and select the appropriate microphone.✐Please note: Installing the Enhanced Vibration and Low Frequency Option BZ-7234 licence enables
extra options for the Low Frequency parameter (Frequency Analyzer module only) andfor the frequency weighting parameters (Fig.17.2).
Fig.17.2Example of additional parameters after installing the Enhanced Vibration and Low‐frequency Option BZ‐7234 licence
4) Set Low Frequency to Extended.5) Set:
– Broadband (excl. Peak) to A,G (simultaneous measurement with the two frequencyweightings A and G)
– Broadband Peak to G if you need to measure the G-weighted peak6) (Frequency Analyzer module only) Set Spectrum Weighting to A, C, Z or G, as required.7) Tap to exit.

Hand‐held Analyzer Types 2250 and 2270 – User Manual198
17.1.2 Controlling the Measurement
The measurement is controlled in the same way you would control a normal Sound Level Metermeasurement, using Start/Pause , Continue , Back-erase and Reset pushbuttons,see Chapter 3 for more details.
✐Please note: • The low-frequency settings require much longer settling times of filters and detectors for correct results. The instrument automatically takes care of this and waits (after you press Start ) for the needed settling time for the individual detectors.
• You cannot start a measurement with G-weighting without using one of the low-frequency microphones.
17.1.3 Displaying the Results
Tap on the broadband result readouts to select parameters from the Low Frequency or theLpeak group to select the G-weighted results (Fig.17.3).
Fig.17.3Selection of Low Frequency broadband‐readout results
✐Please note: If you use the FREQUENCY ANALYZER template, you will also have the parameterLXeq(f1 – f2), X=A/B/C/Z/G and F1 = bottom freq. and F2 = top freq. of the frequencybands in the spectrum. By using G-weighting of the spectrum you would, for example, beable to readout the parameter LGeq(5 Hz – 20 Hz) in cases where that needs to bereported.

CHAPTER 17Enhanced Vibration and Low‐frequency Option BZ‐7234
199
17.2 General Vibration Measurements
This section describes how to measure the Enhanced General Vibration parameters. TheEnhanced Vibration parameters are measured when applying integration (to get the velocitysignal) or double integration (to get the displacement signal) as input to the broadbanddetectors.In addition to the integration for velocity you can chose between four bandpass filters:1) 1 – 100 Hz2) 10 – 1000 Hz3) 0.3 – 1000 Hz4) 3 – 20000 Hz
In addition to the double integration for displacement you can chose between three bandpassfilters:1) 1 – 100 Hz2) 3 – 300 Hz3) 10 – 1000 Hz
The choice of integration and filter is handled by the weighting filter for the broadband detectors.You have the following possibilities for two broadband detectors and the peak detector:• Acc Linear – : Linear weighted acceleration signal in the full frequency range• Acc 1 k – 20 kHz: Linear weighted acceleration signal in the frequency range 1 k – 20 kHz• Vel 3 – 20000 Hz: Linear weighted velocity signal in the frequency range 3 – 20 000 Hz• Vel 0.3 – 1000 Hz: Linear weighted velocity signal in the frequency range 0.3 – 1000 Hz• Vel 10 – 1000 Hz: Linear weighted velocity signal in the frequency range 10 – 1000 Hz• Vel 1 – 100 Hz: Linear weighted velocity signal in the frequency range 1 – 100 Hz• Dis 10 – 1000 Hz: Linear weighted displacement signal in the frequency range 10 – 1000 Hz• Dis 3 – 300 Hz: Linear weighted displacement signal in the frequency range 3 – 300 Hz• Dis 1 – 100 Hz: Linear weighted displacement signal in the frequency range 1 – 100 HzThe weighting filter for the spectrum detector can be one of:• Acc Linear: Linear weighted acceleration signal in the full frequency range• Vel 3 – 20000 Hz: Linear weighted velocity signal in the frequency range 3 – 20000 Hz• Vel 0.3 – 1000 Hz: Linear weighted velocity signal in the frequency range 0.3 – 1000 Hz• Vel 10 – 1000 Hz: Linear weighted velocity signal in the frequency range 10 – 1000 Hz• Vel 1 – 100 Hz: Linear weighted velocity signal in the frequency range 1 – 100 Hz

Hand‐held Analyzer Types 2250 and 2270 – User Manual200
Enhanced Vibration and Low-frequency Option BZ-7234, together with BZ-7222, BZ-7223,BZ-7224 or BZ-7225 and an accelerometer, measures two sets of broadband parameters plusPeak, Peak-Peak and Crest Factor parameters.
✐Please note: Peak-Peak is calculated on displacement measurements only.
The parameter naming conventions follow the format:xpar(f1 – f2)
where • x = a for acceleration, v for velocity, d for displacement• par = the parameter• (f1 – f2) = a possible frequency range
Examples are:• aLinear: Linear acceleration• vFast max: Fast max velocity• dPeak(1 – 100 Hz): Peak displacement in frequency range 1 – 100 Hz
An exception to the rule is: Peak Particle Vel. – Peak velocity in frequency range 1 – 100 Hz
17.2.1 Setting up the Analyzer for General Vibration Measurements
1) Connect an accelerometer to the rear socket.If this is the first time you use the accelerometer, you must create the accelerometer in thetransducer database (section 5.5) and calibrate it (section 5.8).
2) Select the VIBRATION METER, VIBRATION FREQ. ANALYZER, LOGGING, LOGGING SLM,ENHANCED LOGGING OR ENHANCED LOGGING SLM project template.See section 3.2.2 for more details on selecting templates.
3) Tap > Setup > Input:a) Input and select Rear Socket.b) Transducer and select the appropriate accelerometer.
4)✐Please note: Installing the Enhanced Vibration and Low Frequency Option BZ-7234 licence enablesextra options for the Low Frequency parameter (Frequency Analyzer module only) andfor the frequency weighting parameters (Fig.17.4).

CHAPTER 17Enhanced Vibration and Low‐frequency Option BZ‐7234
201
Fig.17.4Example of additional general vibration parameters after installing the Enhanced Vibration and Low‐frequency Option BZ‐7234 licence
4) Set:– Vibration Filters to General
– Broadband Detectors 1 and Broadband Detectors 2 to the required weighting filters– Broadband Peak as requiredFrequency Analyzer module only– Spectrum Weighting as required.
5) Tap > Units > Engineering Unit and select No (for dB) or Yes (for m/s2).✐Please note: If you want readouts in g instead of m/s2, tap > Preferences > Vibration Unit
and select US/UK.
6) Tap to exit.
17.2.2 Controlling the Measurement
The measurement is controlled in the same way you would control a normal Sound Level Metermeasurement, using Start/Pause , Continue , Back-erase and Reset pushbuttons,see Chapter 3 for more details.
17.2.3 Displaying the Results
Tap on the broadband result readouts to select parameters from the Linear, Peak, Max or Mingroup to select the general vibration results (Fig.17.5).

Hand‐held Analyzer Types 2250 and 2270 – User Manual202
Fig.17.5Selection of Enhanced Vibration results
Example 1: Vibration Severity
Mechanical vibration of rotating and reciprocating machinery is often measured in accordancewith the standards ISO 2954 and ISO 10816–1 to ISO 10816–6.Accelerometers suitable for this are Type 4533/34 general purpose series and Type 8341industrial.The quantities to be measured are broadband acceleration, velocity and displacement in the10 – 1000 Hz typical frequency range, for large machines the displacement to even lowerfrequencies.A suitable setup is (Fig.17.4): • Broadband Detector 1 is set on velocity in the frequency range from 10 to 1000 Hz
(Vel 10-1000Hz)• Broadband Detector 2 is set on displacement in the same frequency range (or even lower
if required).• Broadband Peak Detector is set on displacement in order to measure Peak-Peak. • Spectrum Weighting is set on the acceleration signal. Then the aLinear(f1-f2) parameter
can be used to calculate the acceleration value in the frequency range f1-f2. f1 and f2 are set by the parameters Bottom F. for Special Leq and Top Freq. for Special Leq.
The parameters are displayed as shown in Fig.17.6.
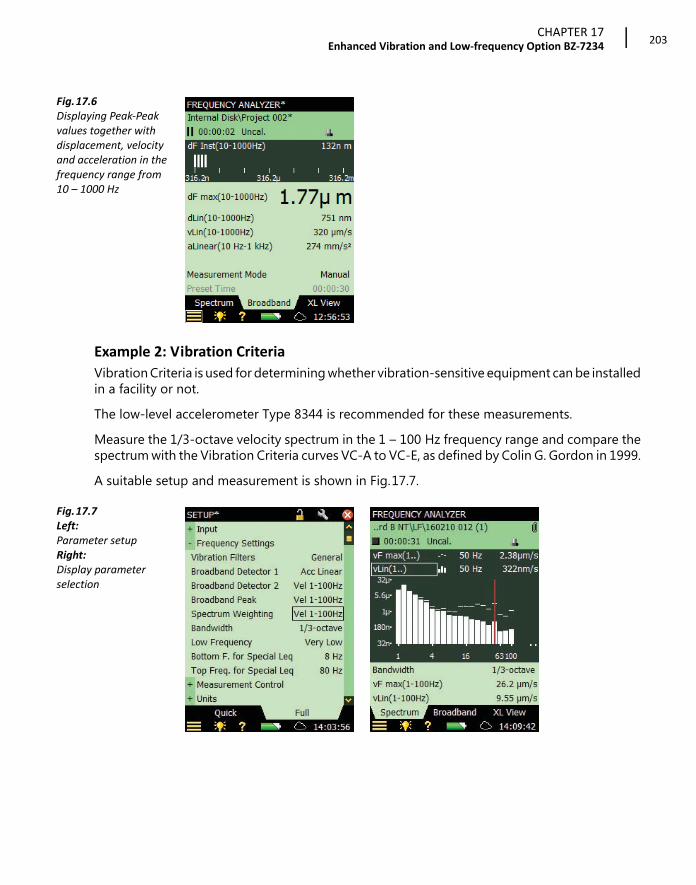
CHAPTER 17Enhanced Vibration and Low‐frequency Option BZ‐7234
203
Fig.17.6Displaying Peak‐Peak values together with displacement, velocity and acceleration in the frequency range from 10 – 1000 Hz
Example 2: Vibration Criteria
Vibration Criteria is used for determining whether vibration-sensitive equipment can be installedin a facility or not.The low-level accelerometer Type 8344 is recommended for these measurements.Measure the 1/3-octave velocity spectrum in the 1 – 100 Hz frequency range and compare thespectrum with the Vibration Criteria curves VC-A to VC-E, as defined by Colin G. Gordon in 1999.A suitable setup and measurement is shown in Fig.17.7.
Fig.17.7Left: Parameter setupRight: Display parameter selection
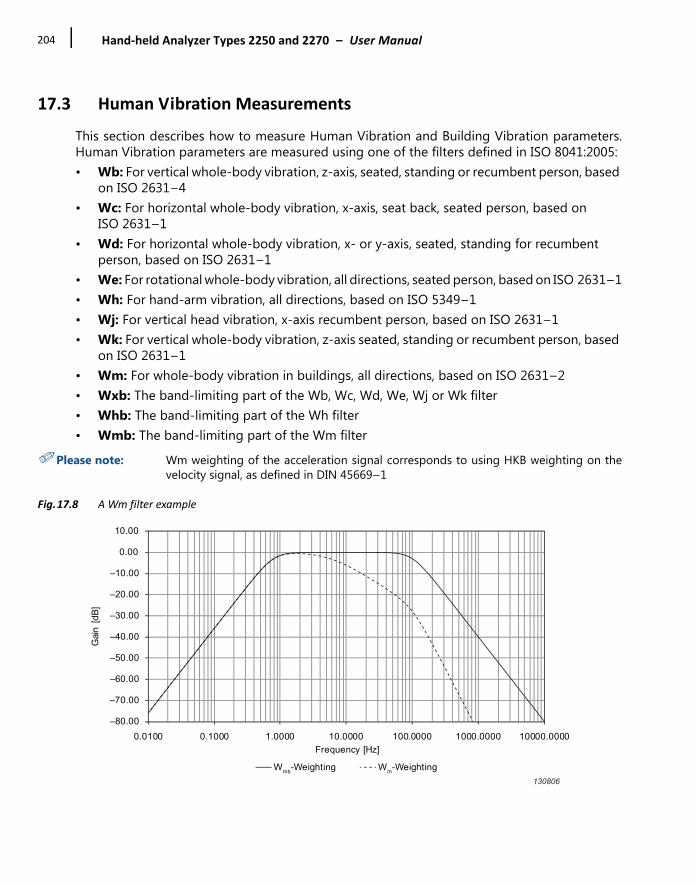
Hand‐held Analyzer Types 2250 and 2270 – User Manual204
17.3 Human Vibration Measurements
This section describes how to measure Human Vibration and Building Vibration parameters.Human Vibration parameters are measured using one of the filters defined in ISO 8041:2005:• Wb: For vertical whole-body vibration, z-axis, seated, standing or recumbent person, based
on ISO 2631–4• Wc: For horizontal whole-body vibration, x-axis, seat back, seated person, based on
ISO 2631–1• Wd: For horizontal whole-body vibration, x- or y-axis, seated, standing for recumbent
person, based on ISO 2631–1• We: For rotational whole-body vibration, all directions, seated person, based on ISO 2631–1• Wh: For hand-arm vibration, all directions, based on ISO 5349–1• Wj: For vertical head vibration, x-axis recumbent person, based on ISO 2631–1• Wk: For vertical whole-body vibration, z-axis seated, standing or recumbent person, based
on ISO 2631–1• Wm: For whole-body vibration in buildings, all directions, based on ISO 2631–2• Wxb: The band-limiting part of the Wb, Wc, Wd, We, Wj or Wk filter• Whb: The band-limiting part of the Wh filter• Wmb: The band-limiting part of the Wm filter
✐Please note: Wm weighting of the acceleration signal corresponds to using HKB weighting on thevelocity signal, as defined in DIN 45669–1
Fig.17.8 A Wm filter example
–80.00
–70.00
–60.00
–50.00
–40.00
–30.00
–20.00
–10.00
0.00
10.00
Gai
n [d
B]
0.0100 0.1000 1.0000 10.0000 100.0000 1000.0000 10000.0000Frequency [Hz]
Wmb-Weighting Wm-Weighting130806
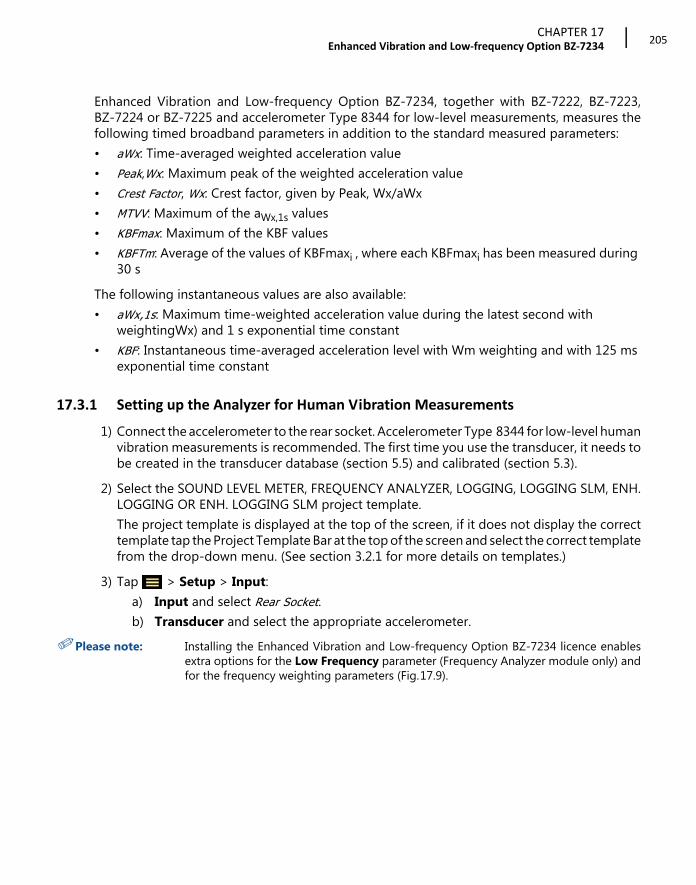
CHAPTER 17Enhanced Vibration and Low‐frequency Option BZ‐7234
205
Enhanced Vibration and Low-frequency Option BZ-7234, together with BZ-7222, BZ-7223,BZ-7224 or BZ-7225 and accelerometer Type 8344 for low-level measurements, measures thefollowing timed broadband parameters in addition to the standard measured parameters:• aWx: Time-averaged weighted acceleration value• Peak,Wx: Maximum peak of the weighted acceleration value• Crest Factor, Wx: Crest factor, given by Peak, Wx/aWx• MTVV: Maximum of the aWx,1s values• KBFmax: Maximum of the KBF values• KBFTm: Average of the values of KBFmaxi , where each KBFmaxi has been measured during
30 sThe following instantaneous values are also available:• aWx,1s: Maximum time-weighted acceleration value during the latest second with
weightingWx) and 1 s exponential time constant • KBF: Instantaneous time-averaged acceleration level with Wm weighting and with 125 ms
exponential time constant
17.3.1 Setting up the Analyzer for Human Vibration Measurements
1) Connect the accelerometer to the rear socket. Accelerometer Type 8344 for low-level humanvibration measurements is recommended. The first time you use the transducer, it needs tobe created in the transducer database (section 5.5) and calibrated (section 5.3).
2) Select the SOUND LEVEL METER, FREQUENCY ANALYZER, LOGGING, LOGGING SLM, ENH.LOGGING OR ENH. LOGGING SLM project template. The project template is displayed at the top of the screen, if it does not display the correcttemplate tap the Project Template Bar at the top of the screen and select the correct templatefrom the drop-down menu. (See section 3.2.1 for more details on templates.)
3) Tap > Setup > Input:a) Input and select Rear Socket.b) Transducer and select the appropriate accelerometer.
✐Please note: Installing the Enhanced Vibration and Low-frequency Option BZ-7234 licence enablesextra options for the Low Frequency parameter (Frequency Analyzer module only) andfor the frequency weighting parameters (Fig.17.9).

Hand‐held Analyzer Types 2250 and 2270 – User Manual206
Fig.17.9Example of additional parameters with the human vibration filters
4) Set Low Frequency to Extended.5) Set:
– Vibration Filters to Human Vibration.– Broadband Detector 1 and Broadband Detector 2 to the required weighting filters.– Broadband Peak as required.Frequency Analyzer module only:– Spectrum Weighting to Acc Linear or Vel, as required.
6) Tap > Setup > Units > Engineering Unit and select No (in dB) or Yes (in m/s2).✐Please note: If you want readouts in g instead of m/s2, tap the > Preferences > Vibration Unit
and select US/UK.
7) Tap to exit.
17.3.2 Controlling the Measurement
The measurement is controlled in the same way you would control a normal Sound Level Metermeasurement, using Start/Pause , Continue , Back-erase and Reset pushbuttons,see Chapter 3 for more details.
17.3.3 Displaying the Results
Tap on the broadband result readouts to select parameters from the Linear, peak, Max, Min orHuman Vibration group to select the human vibration results (Fig.17.10).

CHAPTER 17Enhanced Vibration and Low‐frequency Option BZ‐7234
207
Fig.17.10Selection of Low Frequency human vibration results
17.4 Setting Up the Frequency Analyzer Module for Very Low Frequencies
1) For:– Sound measurements: Mount your low-frequency microphone and low-frequency
adaptor on the preamplifier and connect it to the top socket (section 2.5.2). The first timeyou use the transducer, it needs to be created in the transducer database (section 5.5) andcalibrated (section 5.3)
– Vibration measurements: Connect the accelerometer to the rear socket. Brüel & Kjærrecommends accelerometer Type 8344 for low-level human vibration measurements. Ifit is your first time to use the transducer, it needs to be created in the transducer database(see section 5.5) and calibrated (see section 5.3)
2) Select the 2-Ch. FREQUENCY ANALYZER, LOGGING or ENH. LOGGING project template. The project template is displayed at the top of the screen, if it does not display the correcttemplate tap the project template bar at the top of the screen and select the correct templatefrom the drop-down menu. (See section 3.2.1 for more details on templates.)
3) Tap > Setup > Input:a) Input and select Rear Socket.b) Transducer and select the appropriate accelerometer.
✐Please note: Installing the Enhanced Vibration and Low-frequency Option BZ-7234 licence enablesextra options for the Low Frequency parameter (Frequency Analyzer module only) andfor the frequency weighting parameters (Fig.17.2).
4) Set Low Frequency to Very Low.

Hand‐held Analyzer Types 2250 and 2270 – User Manual208
✐Please note: Setting Low Frequency to Very Low for sound measurements requires use of the low-frequency microphones, possibly together with Low-frequency Adaptor UC-0211. Thesecombinations ensure that the measurements fulfil the 1/1-octave and 1/3-octave filterstandards; however, please consult Table C.5 to see how the combinations influence thedynamic range of your measurement.
5) Set Broadband (excl. Peak), Broadband Peak and Spectrum Weighting, as required.6) Tap to exit.
17.4.1 Controlling the Measurement
The measurement is controlled in the same way you would control a normal Sound Level Metermeasurement, using Start/Pause , Continue , Back-erase and Reset pushbuttons,see Chapter 3 for more details.
✐Please note: The low-frequency settings require much longer settling times of filters and detectors forcorrect results. The instrument automatically takes care of this and waits (after you pressStart ) for the needed settling time for the individual detectors.
17.4.2 Displaying the Results
The display frequency axis resolution may be adjusted by tapping the axis and selecting suitabledisplay frequency limits (Fig.17.11).
Fig.17.11Spectrum view with Low Frequency set to ‘Very Low’
17.4.3 Saving Results
Measurements are saved and can be opened later in the same way as described for the SoundLevel Meter project in Chapter 3.

209
Chapter 18Specifications
This chapter comprises the specifications that are needed for evaluation of analyzer performancecharacteristics and proper use of the analyzer. Some of the applicable sound level meterstandards require additional technical documentation, in particular for pattern evaluation (typeapproval) purposes, but have no bearing on normal use. The additional technical documentationis given in a separate Brüel & Kjær instruction manual (BE 1712).
Specifications – Hand-held Analyzer Type 2250/2270 Platform
Specifications apply to Type 2250/2270 fitted with Microphone Type 4189 and Microphone Preamplifier ZC‐0032
Microphone
SUPPLIED MICROPHONEType 4189: Prepolarized Free‐field ½ MicrophoneorType 4190: Free‐field ½ MicrophoneNominal Open‐circuit Sensitivity: 50 mV/Pa (corresponding to 26 dB re 1 V/Pa) ± 1.5 dBCapacitance: 14 pF (at 250 Hz)
MICROPHONE PREAMPLIFIER ZC‐0032Nominal Preamplifier Attenuation: 0.25 dBConnector: 10‐pin LEMOExtension Cables: Up to 100 m in length between the microphone preamplifier and Type 2250/2270, without degradation of the specificationsAccessory Detection: Windscreen UA‐1650 can be automatically detected when fitted over ZC‐0032
MICROPHONE POLARIZATION VOLTAGESelectable between 0 V and 200 V
SELF‐GENERATED NOISE LEVELTypical values at 23 °C for nominal microphone open‐circuit sensitivity:
Interface
KEYBOARDPushbuttons: 11 keys with backlight, optimized for measurement control and screen navigation
ON‐OFF BUTTONFunction: Press 1 s to turn on; press 1 s to enter standby; press for more than 5 s to switch off
STATUS INDICATORSLEDs: Red, amber and green
DISPLAYType: Transflective back‐lit colour touch screen240 320 dot matrixColour Schemes: Five different – optimized for different usage scenarios (day, night, etc.)Backlight: Adjustable level and on‐time
USER INTERFACEMeasurement Control: Using pushbuttons on keyboardSetup and Display of Results: Using stylus on touch screen or pushbuttons on keyboard
Weighting Microphone Electrical Total
“A” 14.6 dB 12.4 dB 16.6 dB
“B” 13.4 dB 11.5 dB 15.6 dB
“C” 13.5 dB 12.9 dB 16.2 dB
“Z” 5 Hz–20 kHz 15.3 dB 18.3 dB 20.1 dB
“Z” 3 Hz–20 kHz 15.3 dB 25.5 dB 25.9 dB

Hand‐held Analyzer Types 2250 and 2270 – User Manual210
Lock: Keyboard and touch screen can be locked and unlocked
USB INTERFACEHardware Versions 1 to 3: USB 1.1 OTG Mini B socketHardware Version 4: USB 2.0 OTG Micro AB and USB 2.0 Standard A sockets for Wi‐Fi Dongle UL‐1050, printer or weather station
MODEM INTERFACEConnection to Internet through GPRS/EDGE/HSPA modem connected through:• the Compact Flash slot (hardware versions 1 – 3)• the USB Standard A Socket (hardware version 4)Supports DynDNS for automatic update of IP address of host name
PRINTER INTERFACEPCL printers, Mobile Pro Spectrum thermal printer or Seiko DPU S245/S445 thermal printers can be connected to USB socket
MICROPHONE FOR COMMENTARYMicrophone, which utilizes Automatic Gain Control (AGC), is incorporated in underside of analyzer. Used to create voice annotations for attaching to measurements
CAMERA (TYPE 2270 ONLY)Camera with fixed focus and automatic exposure is incorporated in underside of analyzer.Used to create image annotations for attaching to measurementsImage Size: • Hardware versions 1 – 3: 640 × 480 pixels• Hardware version 4: 2048 × 1536 pixelsViewfinder Size: 212 × 160 pixelsFormat: jpg with exif information
Inputs/Outputs
COMPACTFLASH SOCKET (Hardware Version 1 to 3 only)Connection of CF memory card, CF modem, CF to serial interface, CF Ethernet interface or CF WLAN interface
SECURE DIGITAL SOCKET • 1 × SD socket for hardware versions 1 – 3• 2 × SD sockets for hardware version 4Connect SD and SDHC memory cards
LAN INTERFACE SOCKET Hardware Versions 1 to 3 (Type 2270 only):• Connector: RJ45 MDI• Speed: 10 Mbps• Protocol: TCP/IPHardware Version 4 (Types 2250 and 2270):• Connector: RJ45 Auto‐MDIX• Speed: 100 Mbps• Protocol: TCP/IP
INPUT SOCKET (2 ‐ TYPE 2270 ONLY)Connector: Triaxial LEMOInput Impedance: 1 MDirect Input: Max. input voltage: ±14.14 VpeakCCLD Input: Max. input voltage: ±7.07 VpeakCCLD Current/voltage: 4 mA/25 V
TRIGGER SOCKETConnector: Triaxial LEMOMax. Input Voltage: ±20 VpeakInput Impedance: >47 kPrecision: ±0.1 V
OUTPUT SOCKETConnector: Triaxial LEMOMax. Peak Output Level: ±4.46 VOutput Impedance: 50
HEADPHONE SOCKETConnector: 3.5 mm Minijack stereo socketMax. Peak Output Level: ±1.4 VOutput Impedance: 32 in each channel
Power
EXTERNAL DC POWER SUPPLY REQUIREMENTSUsed to charge the battery pack in the analyzerVoltage: 8 – 24 V DC, ripple voltage <20 mVCurrent Requirement: min. 1.5 APower Consumption: <2.5 W, without battery charging, <10 W when chargingCable Connector: LEMO Type FFA.00, positive at centre pin
EXTERNAL AC MAIN SUPPLY ADAPTORPart No.: ZG‐0426Supply Voltage: 100 – 120/200 – 240 V AC; 47 – 63 HzConnector: 2‐pin IEC 320
BATTERY PACKPart No.: QB‐0061, Rechargeable Li‐Ion batteryVoltage: 3.7 VCapacity: 5200 mAh nominalTypical Operating Time: • Single‐channel: >11 h (screen backlight dimmed); >10 h (full screen backlight)
• Dual‐channel: >10 h (full screen backlight)Use of external interfaces (LAN, USB, Wi‐Fi) will decrease battery operating time. Connecting a weather station or a GPS receiver can decrease battery operating with up to 20%. Connecting Wireless Adaptor UL‐1050 can decrease battery operating time up to 35%Battery Cycle Life: >500 complete charge/discharge cyclesBattery Aging: Approximately 20% loss in capacity per yearBattery Indicator: Remaining battery capacity and expected working time may be read out in % and in timeBattery Fuel Gauge: The battery is equipped with a built‐in fuel gauge, which continuously measures and stores the actual battery capacity in the battery unit

CHAPTER 18Specifications
211
Charge Time: In analyzer, typically 10 hours from empty at ambient temperatures below 30 °C. To protect the battery, charging will be terminated completely at ambient temperatures above 40 °C. At 30 to 40 °C charging time will be prolonged. With External Charger ZG‐0444 (optional accessory), typically 5 hoursNote: It is not recommended to charge the battery at temperatures below 0 °C (32 °F) or over 50 °C (122 °F). Doing this will reduce battery lifetime
CLOCKBack‐up battery powered clock. Drift <0.45 s per 24 hr period
Storage
INTERNAL FLASH‐RAM (NON‐VOLATILE) For user setups and measurement data: • Hardware versions 1 – 3: 20 MB• Hardware version 4: 512 MB
EXTERNAL SECURE DIGITAL MEMORY CARD SD and SDHC Card: For store/recall of measurement data
EXTERNAL COMPACT FLASH MEMORY CARD (G1 – 3 Only)CF Card: For store/recall of measurement data
USB MEMORY STICK (Hardware version 4 only) For store/recall of measurement data
Environmental
WARM‐UP TIMEFrom Power Off: <2 minFrom Standby: <10 s for prepolarized microphones
WEIGHT AND DIMENSIONS650 g (23 oz) including rechargeable battery300 93 50 mm (11.8 3.7 1.9) including preamplifier and microphone
User Interface
USERSMulti‐user concept with login. Users can have their own settings with jobs and projects totally independent of other users
PREFERENCESDate, Time and Number formats can be specified per user
LANGUAGEUser Interface in Catalan, Chinese (People’s Republic of China), Chinese (Taiwan), Croatian, Czech, Danish, English, Flemish, French, German, Hungarian, Japanese, Italian, Korean, Polish, Portuguese, Romanian, Russian, Serbian, Slovenian, Spanish, Swedish, Turkish and Ukrainian
HELPConcise context‐sensitive help in Chinese (People’s Republic of China), English, French, German, Italian, Japanese, Polish, Romanian, Serbian, Slovenian, Spanish and Ukrainian
UPDATE OF SOFTWAREUpdate to any version using BZ‐5503 through USB or update via Internet
REMOTE ACCESSConnect to the analyzer using Measurement Partner Suite BZ‐5503, using Measurement Partner Field App (iOS or Android smartphone app), using the 2250/2270 SDK (Software Development kit), using a REST interface through HTTP or using an Internet browser supporting JavaScript. The connection is password protectedTwo levels of protection: • Guest level: for viewing only• Administrator level: for viewing and full control of the analyzer
CLOUDConnect to Measurement Partner Cloud on cloud.bksv.com for transferring data to an archive in the cloud for storage or easy synchronization with Measurement Partner Suite BZ‐5503
WIRELESS Specifications apply to Wireless USB Adaptor UL‐1050Operating Frequency: 2.4 GHzData Rate: • IEEE 802.11n: up to 150 Mbps• IEEE 802.11g: up to 54 Mbps• IEEE 802.11b: up to 11 MbpsEncryption/Authentication:• 64/128‐bit WEP• WPA‐PSK• WPA2‐PSKRange: The range is similar to a standard WLAN unit, typically from 10 to 50 m (33 to 164 ft), depending on the environment and the number of other WLAN transmitters in the area (smartphones, Wi‐Fi, etc.)Power Requirements: Power Consumption: <1 W

Hand‐held Analyzer Types 2250 and 2270 – User Manual212
Software Specifications – Sound Level Meter Software BZ-7222
Conforms with the following National and International Standards:• IEC 61672–1 (2013) Class 1• IEC 60651 (1979) plus Amendment 1 (1993–02) and Amendment 2 (2000–10), Type 1
• IEC 60804 (2000–10), Type 1• DIN 45657 (1997– 07)• ANSI S1.4–1983 plus ANSI S1.4A–1985 Amendment, Type 1• ANSI S1.43–1997, Type 1Note: The International IEC Standards are adopted as European standards by CENELEC. When this happens, the letters IEC are replaced with EN and the number is retained. Type 2250/2270 also conforms to these EN Standards
Input
CHANNELS (Type 2270 only)All measurements are made from either Ch.1 or Ch.2
TRANSDUCERSTransducers are described in a transducer database with information on Serial Number, Nominal Sensitivity, Polarization Voltage, Free‐field Type, CCLD required, Capacitance and additional information. The analogue hardware is set up automatically in accordance with the selected transducer
CORRECTION FILTERSFor Microphone Types 4189, 4190, 4191, 4193, 4193 + UC‐0211, 4950, 4952, 4952+EH‐2152, 4955‐A, 4964, 4964 + UC‐0211 and 4184‐A, BZ‐7222 is able to correct the frequency response to compensate for sound field and accessories:Sound Field: Free field or diffuse field (for Types 4952 and 4184‐A only: 0° (Top) reference direction and 90° (Side) reference direction)Accessories: • Types 4189, 4190, 4964 and 4964 + UC‐0211 only: None, Windscreen UA‐1650 or Outdoor Microphone Kit UA‐1404
• Types 4191, 4193, 4193 + UC‐0211 and 4955‐A only: None or Windscreen UA‐1650
• Type 4950 only: None or Windscreen UA‐0237For Accelerometer Types 4397‐A, 4513, 4513‐001, 4513‐002, 4514, 4514‐001, 4514‐002, 4533‐B, 4533‐B‐001, 4533‐B‐002, 4534‐B, 4534‐B‐001, 4534‐B‐002, 8324, 8341, 8344, 8347‐C + 2647‐D the lower frequency limit will be optimized to match the specifications for the accelerometer
Analysis
DETECTORSParallel detectors on every measurement:• A‐ or B‐weighted (switchable): Broadband detector channel with three exponential time weightings (Fast, Slow, Impulse), one linearly averaging detector and one peak detector
• C‐ or Z‐weighted (switchable): As for A‐ or B‐weighted• Overload Detector: Monitors the overload outputs of all the frequency weighted channels
MEASUREMENTS FOR SOUND INPUTX = frequency weightings A or BY = frequency weightings C or ZV = frequency weightings A, B, C or ZU = time weightings F or SQ = exchange rate 4, 5 or 6 dBN = number between 0.1 and 99.9
For Display and Storage:
Start Time Stop Time Overload %
Elapsed Time LXeq LYeqLXE LYE LCeq–LAeqLXSmax LXFmax LXImax
LYSmax LYFmax LYImax
LXSmin LXFmin LXImin
LYSmin LYFmin LYImin
LXIeq LYIeq LAIeq–LAeqLAFTeq LAFTeq–LAeq Time Remaining
Lep,d Lep,dv E
Dose Proj. Dose Lvpeak#VPeaks(>NNNdB)
#VPeaks(>137dB)
#VPeaks(>135dB)
TVpeak LavUQ TWA
TWAv DoseUQ Proj. DoseUQ
LAeq,T1,mov,max LAeq,T2,mov,max LCeq,T1,mov,max
LCeq,T2,mov,max Leq,T1,mov,max Leq,T2,mov,max
Avg. RPM
Weather Data (requires weather station):
Wind Dir. avg. Wind Dir. min. Wind Dir. max.
Wind Speed avg. Wind Speed min. Wind Speed max.
Amb. Temp. Amb. Humidity Amb. Pressure
Rainfall

CHAPTER 18Specifications
213
MEASUREMENTS FOR VIBRATION INPUT
MEASUREMENTS FOR DIRECT INPUT
MEASURING RANGESWhen using Microphone Type 4189:Dynamic Range: From typical noise floor to max. level for a 1 kHz pure tone signal, A‐weighted: 16.6 to 140 dBPrimary Indicator Range: In accordance with IEC 60651: A‐weighted: 23.5 dB to 122.3 dBLinearity Range: In accordance with IEC 60804: A‐weighted: 21.4 dB to 140.8 dBLinear Operating Range: In accordance with IEC 61672: • A‐weighted: 1 kHz: 24.8 dB to 139.7 dB• C‐weighted: 25.5 dB to 139.7 dB• Z‐weighted: 30.6 dB to 139.7 dBPeak C Range: In accordance with IEC 61672: 1 kHz: 42.3 dB to 142.7 dB
SAMPLING FOR STATISTICSThe Statistics can be based on either LXF, LXS or LXeq:• Statistics LXFN1 – 7 or LXSN1 – 7 are based on sampling LXF or LXS, resp., every 10ms into 0.2 dB wide classes over 130 dB
• Statistics LXN1‐7 are based on sampling LXeq every second into 0.2 dB wide classes over 130 dB
Full distribution saved with measurementThe Std.Dev. (Standard Deviation) parameter is calculated from the statistics
RPM MEASUREMENTRPM is measured on the signal connected to Trigger input when Tacho is set to OnRange: 1 to 6 000 000 RPMGear Ratio: 10–5 to 1038. The displayed RPM is the measured RPM divided by the RPM gear ratio
Measurement Display and Control
MEASUREMENT DISPLAYSSLM: Measurement data displayed as numbers of various sizes and one quasi‐analog barMeasured sound data are displayed as dB values, vibration data as dB values or in physical units (SI units (m/s2) or US/UK units (g)), direct data as voltage in dB or V, housekeeping data as numbers in relevant format.Instantaneous measurement LXF or Fast Inst is displayed as a quasi‐analog bar
MEASUREMENT CONTROL Manual: Manually controlled single measurementAutomatic: Preset measurement time from 1 s to 24 hr in 1 s stepsManual Controls: Reset, Start, Pause, Back‐erase, Continue and Store the measurement manuallyAuto‐start: A total of 10 timers allow set up of measurement start times up to a month in advance. Each timer can be repeated. Measurements are automatically stored when completed
BACK‐ERASEThe last 5 s of data can be erased without resetting the measurement
Only for Display as Numbers or Quasi‐analog Bars:
LXS LXF LXILYS LYF LYILXS(SPL) LXF(SPL) LXI(SPL)LYS(SPL) LYF(SPL) LYI(SPL)LXN1 or LXUN1 LXN2 or LXUN2 LXN3 or LXUN3LXN4 or LXUN4 LXN5 or LXUN5 LXN6 or LXUN6LXN7 or LXUN7 LVpeak,1s Trig. Input Voltage
Std.Dev. LAeq,T1,mov LAeq,T2,mov
LCeq,T1,mov LCeq,T2,mov Leq,T1,mov
Leq,T2,mov Inst. RPM
Instantaneous Weather Data:
Wind Dir. Wind Speed
Instantaneous GPS Data:
Latitude Longitude
For Display and Storage:
Start Time Stop Time Overload %
Elapsed Time Time Remaining
aLinear aLin(1k–20kHz)
aFast max aF max(1k–20kHz)
aSlow max aS max(1k–20kHz)
aFast min aF min(1k–20kHz)
aPeak aTPeakCrest Factor Avg. RPM
Only for Display as Numbers or Quasi‐analog Bars:
aFast Inst aF Inst(1k–20kHz)
aSlow Inst aS Inst(1k–20kHz)
Inst RPM Trig. Input Voltage
Instantaneous GPS Data:
Latitude Longitude
For Display and Storage:
Start Time Stop Time Overload %
Elapsed Time Time Remaining
Linear Fast max Slow max
Fast min Slow min Peak
TPeak Crest Factor Avg. RPM
Only for Display as Numbers or Quasi‐analog Bars:
Fast Inst Slow Inst
Inst RPM Trig. Input Voltage
Instantaneous GPS Data:
Latitude Longitude

Hand‐held Analyzer Types 2250 and 2270 – User Manual214
Measurement Status
ON SCREENInformation such as overload and running/paused are displayed on screen as icons
TRAFFIC LIGHTSRed, yellow and green LEDs show measurement status and instantaneous overload as follows:• Yellow LED flash every 5 s = stopped, ready to measure• Green LED flashing slowly = awaiting calibration signal• Green LED on constantly = measuring• Yellow LED flashing slowly = paused, measurement not stored
• Red LED flashing quickly = intermittent overload, calibration failed
NOTIFICATIONSSends an SMS or email daily at a specified time or if an alarm condition is fulfilledAlarm Conditions:• Disk Space below set value• Trig. Input Voltage below set value• Internal Battery enters set state• Change in Measurement State• Reboot of analyzer
Signal MonitoringThe input signal can be monitored using an earphone/headphones connected to the headphone socket, or it can be fed to the output socket
OUTPUT SIGNALInput Conditioned: A‐, B‐, C‐ or Z‐weightedGain Adjustment: –60 dB to 60 dBLXF output (every ms) as a DC voltage between 0 V and 4 VDC output for calibration purposes: 0 dB 0 V and 200 dB 4 V
HEADPHONE SIGNALInput signal can be monitored using this socket with headphones/earphonesGain Adjustment: –60 dB to 60 dB
Annotations
VOICE ANNOTATIONSVoice annotations can be attached to measurements so that verbal comments can be stored together with the measurement
Playback: Playback of voice annotations can be listened to using an earphone/headphones connected to the headphone socketGain Adjustment: –60 dB to +60 dB
TEXT ANNOTATIONSText annotations can be attached to measurements so that written comments can be stored with the measurement
GPS ANNOTATIONSA text annotation with GPS information can be attached (Latitude, Longitude, Altitude and position error). Requires connection to a GPS receiver
IMAGE ANNOTATIONS (TYPE 2270 ONLY)Image annotations can be attached to measurements. Images can be viewed on the screen
CalibrationInitial calibration is stored for comparison with later calibrations
ACOUSTICUsing Sound Calibrator Type 4231 or custom calibrator. The calibration process automatically detects the calibration level when Sound Calibrator Type 4231 is used
ELECTRICALUses internally generated electrical signal combined with a typed‐in value of microphone sensitivity
CALIBRATION HISTORYUp to 20 of the last calibrations made are listed and can be viewed on the analyzer
Data Management
METADATAUp to 30 metadata annotations can be set per project (text from keyboard or text from pick list, number from keyboard or auto generated number)
PROJECT TEMPLATEDefines the display and measurement setups. Setups can be locked and password protected
PROJECTMeasurement data stored with the project template
JOBProjects are organized in jobsExplorer facilities for easy management of data (copy, cut, paste, delete, rename, open project, create job, set default project name)

CHAPTER 18Specifications
215
Software Specifications – Frequency Analysis Software BZ-7223
The specifications for BZ‐7223 also include the specifications for Sound Level Meter Software BZ‐7222.
StandardsConforms with the following National and International Standards:• IEC 61260–1 (2014), 1/1‐octave Bands and 1/3‐octave Bands, Class 1
• IEC 61260 (1995–07) plus Amendment 1 (2001–09), 1/1‐octave Bands and 1/3‐octave Bands, Class 0
• ANSI S1.11–1986, 1/1‐octave Bands and 1/3‐octave Bands, Order 3, Type 0 –C
• ANSI S1.11–2004, 1/1‐octave Bands and 1/3‐octave Bands, Class 0
• ANSI/ASA S1.11–2014 Part 1, 1/1‐octave Bands and 1/3‐octave Bands, Class 1
Input
CHANNELS (TYPE 2270 ONLY)All measurements are made from either Ch.1 or Ch.2
Frequency Analysis
CENTRE FREQUENCIES1/1‐oct. Band Centre Frequencies: 8 Hz to 16 kHz1/3‐oct. Band Centre Frequencies: 6.3 Hz to 20 kHz
MEASUREMENTS FOR SOUND INPUTX = frequency weightings A, B, C or Z, Y = time weightings F or SData for StorageFull Spectral Statistics
MEASUREMENTS FOR VIBRATION AND DIRECT INPUT
MEASURING RANGESWhen using Microphone Type 4189:Dynamic Range: From typical noise floor to max. level for a pure tone signal at 1 kHz 1/3‐octave: 1.1 to 140 dBLinear Operating Range: In accordance with IEC 61260, 1/3‐octave: 20.5 to 140 dB
SAMPLING FOR OCTAVE OR 1/3‐OCTAVE STATISTICSX = frequency weightings A or BThe Statistics can be based on either LXF or LXS:• Statistics LXFN1 – 7 or LXSN1 – 7 are based on sampling LXF or LXS, respectively, every Tms into 1 dB wide classes over 150 dB;
T = 100 for frequency range set to 12.5 – 20 kHzT = 200 for frequency range set to 6.3 – 20 kHzFull distribution can be saved with measurement
Displays
MEASUREMENT DISPLAYSSpectrum: One or two spectra superimposed + A/B and C/Z broadband barsTable: One or two spectra in tabular formY‐axis: Range: 5, 10, 20, 40, 60, 80, 100, 120, 140, 160 or 200 dB. Auto zoom or auto scale available. Sound data are displayed as dB values, vibration data as dB values or in physical units (SI units (m/s2) or US/UK units (g)), direct data as voltage in dB or VCursor: Readout of selected band
Generator
INTERNAL GENERATORBuilt‐in pseudo‐random noise generatorSpectrum: Selectable between Pink and WhiteCrest Factor:• Pink Noise: 4.4 (13 dB)• White Noise: 3.6 (11 dB)Bandwidth: Selectable:• Lower Limit: 50 Hz (1/3‐oct.) or 63 Hz (oct.)• Upper Limit: 10 kHz (1/3‐oct.) or 8 kHz (oct.)
Spectra for Display and Storage:
LXeq LXSmax LXFmax
LXSmin LXFmin
Spectra for Display Only:
LXS LXF LXYN1 LXYN2 LXYN3 LXYN4 LXYN5 LXYN6 LXYN7
Single Values:
SIL PSIL SIL3
LXeq(f1‐f2)*
NR NR Decisive Band
RC RC Classification
NCB NCB Classification
NC NC Decisive Band
Loudness Loudness Level
* where f1 and f2 are frequency bands in the spectrum
Spectra for Display and Storage:
Linear Fast max Slow max
Fast min Slow min
Spectra for Display Only:
Fast Inst Slow Inst
Single Values:
Linear (f1 – f2)*
* where f1 and f2 are frequency bands in the spectrum

Hand‐held Analyzer Types 2250 and 2270 – User Manual216
Output Level: Independent of bandwidth• Max.: 1 Vrms (0 dB)• Gain Adjustment: –60 to 0 dBWhen bandwidth is changed, the level for all bands is automatically adjusted to comply with the set output levelCorrection Filters: For Sound sources Type 4292, Type 4295 and Type 4296: Flat or Optimum Repetition Period: 175 sOutput Connector: Output socket
EXTERNAL GENERATORSelectable as alternative to Internal Generator (for microphone input only)To control external noise generator, set:• Levels: 0 V (Generator off), 4.5 V (Generator on)• Rise‐time and Fall‐time: 10 sThe noise generator is turned on and off automatically during the measurementEscape Time: 0 to 60 sBuild‐up Time: 1 to 10 sThe generator can be turned on and off manually for checking equipment and sound levels
Software Specifications – Logging Software BZ-7224
The specifications for BZ‐7224 include the specifications for Sound Level Meter Software BZ‐7222. BZ‐7224 adds:
Logging
MEASUREMENTSLogging: Measurement data logged at preset periods into files on:• SD Card: All hardware versions• CF Card: G1 – 3• USB Memory Stick: G4Logging Period: From 1 s to 24 hr with 1 s resolutionFast Logging: LAF, LAS and LAeq (sound input) or Fast Inst, Slow Inst and Linear (vibration and Direct input) can be logged every 100 ms, irrespective of logging period. For sound input you can also log LAF every 10 ms – this can only be stored and not displayed on the analyzer; it can be displayed on Measurement Partner Suite BZ‐5503Broadband Data Stored at each Logging Interval: All, or up to 10 selectable broadband sound data incl. Trig. Input Voltage, Avg. RPM, Weather data, and LAeq,T,mov (for vibration and direct input: up to 5 parameters)Broadband Statistics Stored at each Logging Interval: Full distribution, or none (sound input only)Spectrum Data Stored at each Logging Interval: All, or up to three selectable spectra (license for BZ‐7223 required)Spectral Statistics Stored at each Logging Interval: Full distribution, or none (sound input only, license for BZ‐7223 required)Logging Time: From 1 s to 31 days with 1 s resolutionMeasurement Total: For the logging time, in parallel with logging: All broadband data, statistics and spectra (license for BZ‐7223 required)
MARKERSOne data exclusion marker and four user‐definable markers for on‐line marking of sound categories heard during the measurement
Events can be set manually
TRIGGERSMarkers can be set and signal recordings can be started (license for BZ‐7226 required) when a broadband level is above or below a specified level
ANNOTATIONSOn‐line annotations with spoken comments, written notes or images (Type 2270 only)
Calibration
CHARGE INJECTION CALIBRATION (CIC)Injects an internally generated electrical signal in parallel with the microphone diaphragm. A manual CIC can be performed whenever there is no measurement in progressAn automatic CIC can be performed at the start and end of a logging measurement
Measurement DisplaysProfile: Graphical display of selectable measurement data versus time. Fast display of next or previous marker, profile overview of entire measurementY‐axis: Range: 5, 10, 20, 40, 60, 80, 100, 120, 140, 160 or 200 dB. Auto zoom or auto scale available. Sound data are displayed as dB values, vibration data as dB values or in physical units (SI units (m/s2) or US/UK units (g)), direct data as voltage in dB or V.X‐axis: Scroll facilitiesCursor: Readout of measurement data at selected time
NotificationsAlarm Conditions (in addition to those specified for BZ‐7222):• CIC failed• Trigger Level exceeded

CHAPTER 18Specifications
217
Software Specifications – Enhanced Logging Software BZ-7225
The specifications for BZ‐7225 include the specifications for Logging Software BZ‐7224. BZ‐7225 adds:
LoggingFor Display and Storage Ldn, Lden, Lday, Levening and LnightSelectable Day, Evening and Night periods and penalties (sound input only)Periodic Reports: Measurement data logged at a preset report period into files on: • SD Card: All hardware versions• CF Card: G1 – 3• USB Memory Stick: G4Report Period: From 1 min to 24 h with 1 min resolution Broadband Data and Statistics Stored at each Reporting Interval: All including Weather dataSpectrum Data Stored at each Reporting Interval: All (license for BZ‐7223 required)Spectral Statistics Stored at each Reporting Interval: Full distribution, or none (sound input only, license for BZ‐7223 required)Logging Time: From 1 s to 31 days with 1 s resolution or ContinuousData are saved in separate projects for every 24 hr of logging – at a user‐defined time of dayAutomatic reboot and resume of operation in case of power failure
TRIGGERS Signal Recording TimerFor periodically starting a signal recording (license for BZ‐7226 required) Level TriggersMarkers can be set and signal recordings can be started (license for BZ‐7226 required) when a broadband or frequency band level is above or below a specified level. Hold off time between triggers can be set. You can specify up to four independent Level Triggers to be active at four different times during the day
Calibration
CHARGE INJECTION CALIBRATION (CIC)Injects an internally generated electrical signal in parallel with the microphone diaphragm. A manual CIC can be performed whenever there is no measurement in progressAn automatic CIC can be performed at the start and end of a logging measurement. The CIC can be set to occur up to 4 times in each 24 hour periodCIC Duration: 10 s
NotificationsAlarm Conditions (in addition to those specified for BZ‐7224): LAeq for the latest Report Period exceeds a set threshold

Hand‐held Analyzer Types 2250 and 2270 – User Manual218
Software Specifications – Signal Recording Option BZ-7226
Signal Recording Option BZ‐7226 is enabled with a separate license. It works with all analyzer software: Sound Level Meter, Frequency Analysis, Logging Software, Enhanced Logging Software and Reverberation Time SoftwareFor data storage, Signal Recording requires:• SD Card: All hardware versions• CF Card: G1 – 3• USB Memory Stick: G4
RECORDED SIGNALA‐, B‐, C‐ or Z‐weighted signal from the measurement transducer
AUTOMATIC GAIN CONTROLThe average level of the signal is kept within a 40 dB range, or the gain can be fixed
SAMPLING RATE AND PRE‐RECORDINGThe signal is buffered for the pre‐recording of the signal. This allows the beginning of events to be recorded even if they are only detected later.
PLAYBACKPlayback of signal recordings can be listened to using the earphone/headphones connected to the headphone socket
RECORDING FORMATThe recording format is either 24‐ or 16‐bit wave files (extension .WAV) attached to the data in the project, easily played back afterwards on a PC using BZ‐5503, Type 7820 or 7825. Calibration information and possible tacho trigger information are stored in the .WAV file, allowing BZ‐5503 and PULSE to analyse the recordings
Functions with BZ‐7222 and BZ‐7223Manual Control of Recording: Recording can be manually started and stopped during a measurement using a pushbutton or an external signalAutomatic Control of Recording: Start of recording when measurement is started. Minimum and Maximum recording time can be preset
Functions with BZ‐7224 and BZ‐7225Manual Control of Recording (using Manual Event or Back‐erase pushbutton, or an external signal): Recording during all of the event, or for preset minimum and maximum duration. A Sound marker is set while recording. Selectable pre‐ and post‐recording timeManual Control of Recording (using touch screen): Recording for the selected time period (subject to the limitations of the pre‐recording buffer). A Sound marker is set for the selected time periodAutomatic Control of Recording: An event can be triggered when a broadband level is above or below a specified level. Recording during all of the event or for preset minimum and maximum duration. Selectable pre‐ and post‐recording time
Functions with BZ‐7227Automatic Control of Recording: Start of recording when measurement is started16‐bit recording format only
Software Specifications – Reverberation Time Software BZ-7227
StandardsConforms with the relevant parts of the following:• IEC 61672–1 (2013) Class 1• IEC 60651 (1979) plus Amendment 1 (1993–02) and Amendment 2 (2000–10), Type 1
• IEC 61260–1 (2014), 1/1‐octave Bands and 1/3‐octave Bands, Class 1
• ANSI S1.4–1983 plus ANSI S1.4A–1985 Amendment, Type 1
• IEC 61260 (1995–07) plus Amendment 1 (2001–09), 1/1‐octave Bands and 1/3‐octave Bands, Class 0
• ANSI S1.11–1986, 1/1‐octave Bands and 1/3‐octave Bands,
Order 3, Type 0–C• ANSI S1.11– 2004, 1/1‐octave Bands and 1/3‐octave Bands, Class 0
• ANSI/ASA S1.11–2014 Part 1, 1/1‐octave Bands and 1/3‐octave Bands, Class 1
• ISO 140• ISO 3382• ISO 354
Sampling Rate (kHz) 8 16 24 48
Maximum
Pre‐recording (s)16‐bit
G1 – 3 110 50 30 10
G4 470 230 150 70
MaximumPre‐recording (s)
24‐bit
G1 – 3 70 30 16 3
G4 310 150 96 43
Memory (KB/s) 16‐bit 16 32 48 96
Memory (KB/s) 24‐bit 24 48 72 144
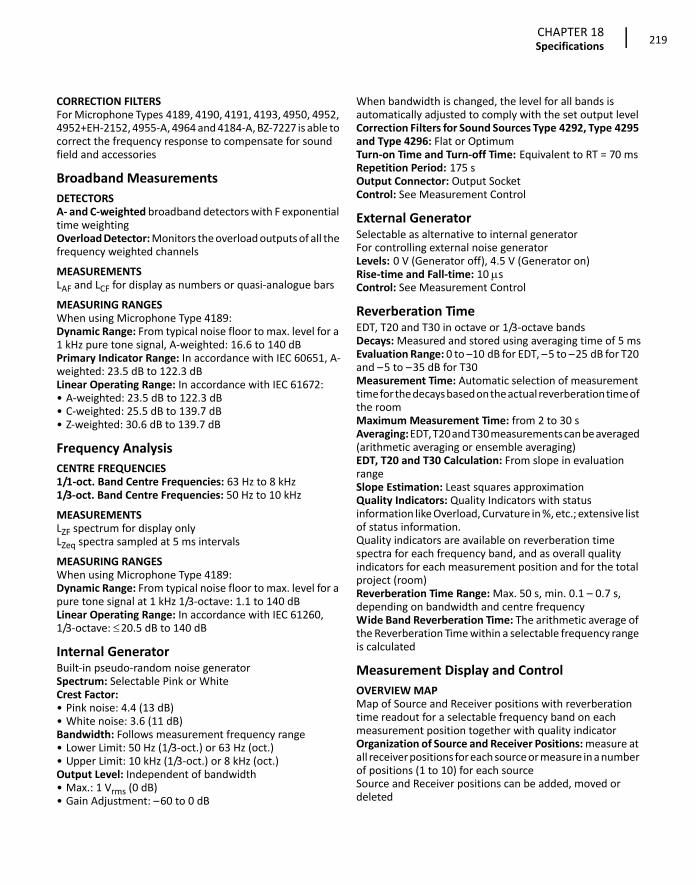
CHAPTER 18Specifications
219
CORRECTION FILTERSFor Microphone Types 4189, 4190, 4191, 4193, 4950, 4952, 4952+EH‐2152, 4955‐A, 4964 and 4184‐A, BZ‐7227 is able to correct the frequency response to compensate for sound field and accessories
Broadband Measurements
DETECTORSA‐ and C‐weighted broadband detectors with F exponential time weightingOverload Detector: Monitors the overload outputs of all the frequency weighted channels
MEASUREMENTSLAF and LCF for display as numbers or quasi‐analogue bars
MEASURING RANGESWhen using Microphone Type 4189:Dynamic Range: From typical noise floor to max. level for a 1 kHz pure tone signal, A‐weighted: 16.6 to 140 dBPrimary Indicator Range: In accordance with IEC 60651, A‐weighted: 23.5 dB to 122.3 dBLinear Operating Range: In accordance with IEC 61672:• A‐weighted: 23.5 dB to 122.3 dB• C‐weighted: 25.5 dB to 139.7 dB• Z‐weighted: 30.6 dB to 139.7 dB
Frequency Analysis
CENTRE FREQUENCIES1/1‐oct. Band Centre Frequencies: 63 Hz to 8 kHz1/3‐oct. Band Centre Frequencies: 50 Hz to 10 kHz
MEASUREMENTSLZF spectrum for display onlyLZeq spectra sampled at 5 ms intervals
MEASURING RANGESWhen using Microphone Type 4189:Dynamic Range: From typical noise floor to max. level for a pure tone signal at 1 kHz 1/3‐octave: 1.1 to 140 dBLinear Operating Range: In accordance with IEC 61260, 1/3‐octave: 20.5 dB to 140 dB
Internal GeneratorBuilt‐in pseudo‐random noise generatorSpectrum: Selectable Pink or WhiteCrest Factor:• Pink noise: 4.4 (13 dB)• White noise: 3.6 (11 dB)Bandwidth: Follows measurement frequency range• Lower Limit: 50 Hz (1/3‐oct.) or 63 Hz (oct.)• Upper Limit: 10 kHz (1/3‐oct.) or 8 kHz (oct.)Output Level: Independent of bandwidth• Max.: 1 Vrms (0 dB)• Gain Adjustment: –60 to 0 dB
When bandwidth is changed, the level for all bands is automatically adjusted to comply with the set output levelCorrection Filters for Sound Sources Type 4292, Type 4295 and Type 4296: Flat or OptimumTurn‐on Time and Turn‐off Time: Equivalent to RT = 70 msRepetition Period: 175 sOutput Connector: Output SocketControl: See Measurement Control
External GeneratorSelectable as alternative to internal generatorFor controlling external noise generatorLevels: 0 V (Generator off), 4.5 V (Generator on)Rise‐time and Fall‐time: 10 sControl: See Measurement Control
Reverberation TimeEDT, T20 and T30 in octave or 1/3‐octave bandsDecays: Measured and stored using averaging time of 5 msEvaluation Range: 0 to –10 dB for EDT, –5 to –25 dB for T20 and –5 to –35 dB for T30Measurement Time: Automatic selection of measurement time for the decays based on the actual reverberation time of the roomMaximum Measurement Time: from 2 to 30 sAveraging: EDT, T20 and T30 measurements can be averaged (arithmetic averaging or ensemble averaging)EDT, T20 and T30 Calculation: From slope in evaluation rangeSlope Estimation: Least squares approximationQuality Indicators: Quality Indicators with status information like Overload, Curvature in %, etc.; extensive list of status information.Quality indicators are available on reverberation time spectra for each frequency band, and as overall quality indicators for each measurement position and for the total project (room)Reverberation Time Range: Max. 50 s, min. 0.1 – 0.7 s, depending on bandwidth and centre frequencyWide Band Reverberation Time: The arithmetic average of the Reverberation Time within a selectable frequency range is calculated
Measurement Display and Control
OVERVIEW MAP Map of Source and Receiver positions with reverberation time readout for a selectable frequency band on each measurement position together with quality indicatorOrganization of Source and Receiver Positions: measure at all receiver positions for each source or measure in a number of positions (1 to 10) for each sourceSource and Receiver positions can be added, moved or deleted

Hand‐held Analyzer Types 2250 and 2270 – User Manual220
OVERVIEW TABLETable of measurement positions with reverberation time readout for selectable frequency band on each position together with quality indicatorPositions can be included/excluded from Room average
SOUND LEVEL SPECTRUMLZF spectrum plus A and C broadband barsY‐axis: Range: 5, 10, 20, 40, 60, 80, 100, 120, 140 or 160 dB. Auto zoom or auto scale availableCursor: Readout of selected bandQuality indicator for each frequency band
REVERBERATION TIME SPECTRUMOne or two spectra can be displayedY‐axis: Range: 0.5, 1, 2, 5, 10 or 20 s. Auto zoom availableCursor: Readout of selected bandQuality Indicator for each frequency band
REVERBERATION TIME SPECTRUM TABLEOne or two spectra can be displayed in tabular form
DECAYDecay curve for a position or the room average available for each frequency band Display of evaluation range and regression lineReadout of Curvature in %Y‐axis: Range: 5, 10, 20, 40, 60, 80, 100, 120, 140 or 160 dB. Auto zoom or auto scale available
MEASUREMENT CONTROL Measurement Sequence: Supports measuring:• at all receiver positions before using another source• at a receiver position for all sources before measuring at a new position
• at subsequent receiver positions without source information, or
• at manually selected source and receiver positionsDuring measurement, the instantaneous sound level spectrum is displayed. After measurement, the reverberation time is displayedInterrupted Noise Excitation: Measurements are started manually and can be automatically stored on completion of measurementThe noise generator is turned on and off automaticallyEscape Time: 0 to 60 sBuild‐up Time: 1 to 10 sNumber of Decays per Measurement: 1 to 100, ensemble averaged into one decay The generator can be turned on and off manually for checking equipment and sound levelsSerial Measurements: Selected frequency bands can be measured serially, that is, one by one in an automatic sequence. This can be done automatically in combination with the parallel measurement
Impulse Excitation: Manual start of first measurement. When level (say from starter pistol) exceeds the user‐selected trigger level, the decay is recorded and backwards integration performed (Schroeder method). The trigger can then be armed automatically for measuring at the next positionSignal Recording: (requires license for Signal Recording Option BZ‐7226) Recording of the Z‐weighted measured signal can be done at each position. For data storage, Signal Recording requires:• SD Card: All hardware versions• CF Card: G1 – 3• USB Memory Stick: G4
Measurement Status
ON SCREENInformation such as overload, awaiting trigger and running/paused are displayed on screen as icons
TRAFFIC LIGHTRed, yellow and green LEDs show measurement status and instantaneous overload as follows:• Yellow LED flashing every 5 s = stopped, ready to measure• Green LED flashing slowly = awaiting trigger or calibration signal
• Green LED on constantly = measuring• Yellow LED flashing slowly = paused, measurement not stored
• Red LED flashing quickly = intermittent overload, calibration failed
CalibrationInitial calibration is stored for comparison with later calibrations
ACOUSTICUsing Sound Calibrator Type 4231 or custom calibrator. The calibration process automatically detects the calibration level when Sound Calibrator Type 4231 is used
ELECTRICALUses internally generated electrical signal combined with a typed‐in value of microphone sensitivity
CALIBRATION HISTORYUp to 20 of the last calibrations made are listed and can be viewed on the analyzer
Signal MonitoringInput signal A‐, C‐ or Z‐weighted can be monitored using an earphone/headphones connected to the headphone socketHeadphone Signal: Input signal can be monitored using this socket with headphones/earphonesGain Adjustment: –60 dB to 60 dB

CHAPTER 18Specifications
221
Annotations
VOICE ANNOTATIONSVoice annotations can be attached to the Reverberation Time Project, to Sources, to Receivers and to measurements at each PositionPlayback: Playback of voice annotations or signal recordings can be listened to using earphone/headphones connected to the headphone socketGain Adjustment: –60 dB to +60 dB
TEXT AND IMAGE ANNOTATIONSText and image (Type 2270 only) annotations can be attached to the Reverberation Time Project, to Sources, to Receivers and to measurements at each Position
GPS ANNOTATIONSA text annotation with GPS information can be attached to the project (Latitude, Longitude, Altitude and position error). Requires connection to a GPS receiver
Data ManagementProject Template: Defines the display and measurement setupsProject: Measurement data for all positions defined in a room are stored with the Project Template Job: Projects are organized in JobsExplorer facilities for easy management of data (copy, cut, paste, delete, rename, open project, create job, set default project name)For specifications and details on documenting results in Qualifier Type 7830 and Qualifier Light Type 7831, please refer to Product Data BP 1691
Software Specifications – 2-channel Option BZ-7229
2‐channel Option BZ‐7229 is enabled with a separate license. It adds 2‐channel functionality to Sound Level Meter, Frequency Analysis, Logging, Enhanced Logging and Building Acoustics Software and to Signal Recording Option on Type 2270Note: 2‐channel Enhanced Logging is not available for hardware versions 1 – 3.Please refer to Product Data BP 2190 for 2‐channel Building Acoustics Software specificationsIn general the 2‐channel option adds an extra channel of measurement data. The two channels can have input from same type of transducers (such as two microphones) or two different transducers (such as one microphone and one accelerometer)
SELF‐GENERATED NOISE LEVELTypical values at 23 °C for nominal microphone open‐circuit sensitivity:
MEASURING RANGESThe full level measuring range is covered in two range settings: High Range for the least sensitive range and Low Range for the most sensitive rangeWhen using Microphone Type 4189:
Broadband AnalysisDynamic Range: From typical noise floor to max. level for a 1 kHz pure tone signal, A‐weighted: • High Range: 28.5 to 140 dB• Low Range: 16.6 to 110 dBPrimary Indicator Range: In accordance with IEC 60651, A‐weighted: • High Range: 41.7 dB to 122.3 dB• Low Range: 23.5 dB to 92.3 dBLinearity Range: In accordance with IEC 60804, A‐weighted: • High Range: 39.6 to 140.8 dB• Low Range: 21.4 to 110.8 dBLinear Operating Range: In accordance with IEC 61672: • A‐weighted: 1 kHz– High Range: 43.0 dB to 139.7 dB– Low Range: 24.8 dB to 109.7 dB
• C‐weighted: 1 kHz– High Range: 41.7 dB to 139.7 dB– Low Range: 25.5 dB to 109.7 dB
• Z‐weighted: 1 kHz– High Range: 45.9 dB to 139.7 dB– Low Range: 30.6 dB to 109.7 dB
High Range:
Weighting Microphone Electrical Total
“A” 14.6 dB 28.3 dB 28.5 dB
“B” 13.4 dB 26.9 dB 27.1 dB
“C” 13.5 dB 27.0 dB 27.2 dB
“Z” 5 Hz–20 kHz 15.3 dB 31.2 dB 31.3 dB
“Z” 3 Hz–20 kHz 15.3 dB 32.1 dB 32.2 dB
Low Range:
Weighting Microphone Electrical Total
“A” 14.6 dB 12.4 dB 16.6 dB
“B” 13.4 dB 11.5 dB 15.6 dB
“C” 13.5 dB 12.9 dB 16.2 dB
“Z” 5 Hz–20 kHz 15.3 dB 18.3 dB 20.1 dB
“Z” 3 Hz–20 kHz 15.3 dB 25.5 dB 25.9 dB
Low Range:
Weighting Microphone Electrical Total

Hand‐held Analyzer Types 2250 and 2270 – User Manual222
Peak C Range: In accordance with IEC 61672, 1 kHz: • High Range: 58.5 dB to 142.7 dB• Low Range: 42.3 dB to 112.7 dB
Frequency AnalysisDynamic Range: From typical noise floor to max. level for a pure tone signal at 1 kHz 1/3‐octave:• High Range: 18.5 to 140 dB• Low Range: 1.3 to 110 dBLinear Operating Range: In accordance with IEC 61260:• High Range: 39.3 to 140 dB• Low Range: 20.6 to 110 dB
Measurements with BZ‐7222 and BZ‐7223Two channels, each with all the data from the single channel measurement, except for common housekeeping parameters like Start Time, Elapsed Time, etc. and weather and GPS data.Underrange Detector: Monitors the underrange of all the frequency‐weighted detectors. Underrange is set if level is below lower limit of Linear Operating Range. Detectors available for both Ch. 1 and Ch. 2
AUTORANGEManual and automatic range controls are providedSpectrum Display (for BZ‐7223)Spectra from both channels can be superimposed. Data from different transducer types are displayed with individual Y‐axisSpectra for Display (microphone input):• Ch.1 – Ch.2 LXeq• Ch.2 – Ch.1 LXeqX = A, B, C or ZSpectra for Display (accelerometer or direct input):• Ch.1 – Ch.2 Linear• Ch.2 – Ch.1 LinearSingle Values for Display (microphone input):• Ch.1 – Ch.2 LXeq• Ch.2 – Ch.1 LXeq• Ch.1 – Ch.2 LYeq• Ch.2 – Ch.1 LYeq
X = A or B. Y = C or ZSingle Values for Display (accelerometer or direct input):• Ch.1 – Ch.2 Linear• Ch.2 – Ch.1 Linear• Ch.1 – Ch.2 Linear detector 2 (Acc. input only)• Ch.2 – Ch.1 Linear detector 2 (Acc. input only)
Measurements with BZ‐7224 and BZ‐7225Fast Logging: Up to a total of four of the 100 ms parameters from the two channels can be logged (incl. the 10 ms parameter for sound input)Broadband Data Stored at Each Logging Interval:All, or up to 10 selectable broadband values from the two channelsSpectrum Data Stored at each Logging Interval: All, or up to four selectable spectra from the two channels (license for BZ‐7223 required)2‐channel Signal Recording (license for BZ‐7226 required): 2‐channel Signal Recording is available in Sound Level Meter, Frequency Analysis, Logging and Enhanced Logging SoftwareThe signals from the two channels can be recorded into a “stereo” wave file of either 2 × 24‐bit or 2 × 16‐bitNote: 2 × 24‐bit at 48 kHz is not available for hardware versions 1 – 3
SAMPLING RATE AND PRE‐RECORDING FOR 2‐CHANNEL RECORDING
Sampling Rate (kHz) 8 16 24 48
MaximumPre‐recording (s)
16‐bit
G1 – 3 50 20 10 0
G4 230 110 70 30
Maximum
Pre‐recording (s)
24‐bit
G1 – 3 30 10 3 NA
G4 150 70 43 16
Memory (KB/s) 16‐bit 32 64 96 192
Memory (KB/s) 24‐bit 48 96 144 288

CHAPTER 18Specifications
223
Software Specifications – Tone Assessment Option BZ-7231
LICENSETone Assessment Option BZ‐7231 is enabled with a separate license and can be used with the FFT template (BZ‐7230) or with 1/3‐octave and logging template (BZ‐7223, BZ‐7224 and BZ‐7225))
FFT Based Tone Assessment (with BZ‐7230 Only)
STANDARDTone assessment is based on the measured FFT spectrum in accordance with ISO 1996:2007 Acoustics – Description, assessment and measurement of environmental noise – part 2: Determination of environmental noise levels. Annex C (informative) Objective method for assessing the audibility of tones in noise – Reference method
SPECTRA ASSESSEDAny displayed sound FFT spectrum (FFT, Ref or Max) may be assessedAssessment is made as post‐processing, that is, when measurement is paused or stopped
SETUP ACCORDING TO STANDARDSetups in violation of the standard are indicated as such on the display, you may then accept to apply the default setupTone assessment will be made if possible, in spite of standard violationsTone Seek Criterion: 0.1 to 4.0 dB in 0.1 dB steps
TONE AT CURSORA sinusoidal tone is available at the Headphone output, to help confirm identified tonesFrequency: the frequency is selected by the Main cursorGain: –70 dB to +10 dBOptions: The generated tone can be mixed with the input signal
TONE ASSESSMENT CURSORAll tones found are indicated in the display.The Tone cursor is initially placed at the most prominent tone, and can then be stepped through the tones found.You can also use the main cursor to step through the tones
RESULTSResults are displayed in the Tone panel and in the Value panelThey are not saved with the measurement
All Tones: Frequency, Tone level Lpti, Masking noise level Lpn, Audibility Lta, Critical Band CB, Tone vs. Noise Level difference Lts, Audibility criterion Lts,kritMost Prominent Tone: Tone Level Lpt, Adjustment Kt
QUALITY INDICATORSOn the display, a quality indicator (smiley) will indicate that a hint is available for tone assessment quality. Click on the indicator to see the hint
1/3‐octave Based Tone Assessment (with BZ‐7223/24/25 Only)Tone assessment is based on the measured 1/3‐octave spectrum in accordance with either the international ‘ISO 1996:2007 Acoustics – Description, assessment and measurement of environmental noise – part 2: Determination of environmental noise levels. Annex D (informative) Objective method for assessing the audibility of tones in noise – Simplified method’ or the Italian law ‘DM 16‐03‐1998: Ministero dell'ambiente, Decreto 16 marzo 1998’
SPECTRA ASSESSEDThe displayed 1/3‐octave spectrum (Leq, Lmax or Lmin) may be assessed. Assessment is made as post‐processing, that is, when measurement is paused or stopped
SETUP ACCORDING TO STANDARDSetups in violation of the standard are indicated as such on the display. You can then accept to apply the default setup. Tone assessment will be made if possible, in spite of standard violations. For tone assessment according to ISO 1996‐2, Annex D, you can set the division between the Low and Middle frequency range, the division between the Middle and High frequency range, and the limits for the level differences between adjacent bands.For tone assessment according to DM 16‐03‐1998, the tones are tested against loudness contours. Select between ISO 226: 1987 Free‐field, 1987 Diffuse‐field and 2003 Free‐field
RESULTSTones are indicated above the spectrum when Tone is selected as spectrum parameter. The resulting adjustment can be viewed on the Value panel. It is not saved with the measurement

Hand‐held Analyzer Types 2250 and 2270 – User Manual224
Software Specifications – Enhanced Vibration and Low Frequency Option BZ-7234
Enhanced Vibration and Low Frequency Option BZ‐7234 is enabled with a separate license. It adds G‐weighting and human vibration parameters and adds integration and double integration of the acceleration signal for vibration and displacement parameters to Sound Level Meter,
Frequency Analysis, Logging and Enhanced Logging Software and adds low frequency 1/1‐ and 1/3‐octave analysis to Frequency Analysis, Logging and Enhanced Logging Software
G‐weighting
Specifications for G‐weighting apply to Type 2250/2270 fitted with one of the Microphone Types 4193 or 4964 (both with or without the Low Frequency Adaptor UC‐0211) and Microphone Preamplifier ZC‐0032
StandardsConforms with the following national and international standards:• ISO 7196:1995• ANSI S1.42–2001 (R2011)
Analysis
DETECTORSG‐weighted (replacing C/Z‐weighted) broadband detectors with one 10 s exponential time weighting, one linearly averaging detector and one peak detector.
MEASUREMENTSY = time weightings F or S
MEASURING RANGESG‐weighted Linear Operating Range at G‐filter reference frequency 10 Hz
General Vibration
Specifications for General Vibration parameters apply to Type 2250/2270 fitted with an accelerometer
AnalysisConforms with the following International standards:• ISO 2954• ISO 10816 series
Analysis
DETECTORSAddition to the Acc Linear and Acc 1k‐20kHz settings for the two broadband detectors:
Spectra for Display and Storage (BZ‐7223 required):
LGeq LGSmax LGFmax
LGSmin LGFmin
Spectra for Display Only (BZ‐7223 required):
LGS LGF LGYN1LGYN2 LGYN3 LGYN4LGYN5 LGYN6 LGYN7
Single Values for Display and Storage:
LGeq LG10max LG10min
LGpeak TGpeak
Single Values for Display Only:
LG10 LGpeak,1s
Single Range:
Microphone Low (dB) High (dB)
4193 41.0 161.0
4194 + UC‐0211 44.1 151.4
4964 29.6 149.0
4964 + UC‐0211 32.6 139.3
High Range:
Microphone Low (dB) High (dB)
4193 41.6 161.0
4194 + UC‐0211 51.8 151.4
4964 30.3 149.0
4964 + UC‐0211 41.7 139.3
Low Range:
Microphone Low (dB) High (dB)
4193 41.0 131.0
4194 + UC‐0211 44.1 147.4
4964 29.6 119.0
4964 + UC‐0211 32.6 137.3
Vel 3 – 20 000 Hz Vel 0.3 – 1000 Hz Vel 10 – 1000 Hz
Vel 1 – 100 Hz Dis 10 – 1000 Hz Dis 30 – 300 Hz
Dis 1 – 100 Hz

CHAPTER 18Specifications
225
The weighting for the peak detector can be set to one of the settings chosen for the broadband detectors or Acc LinearThe weighting for the spectrum detectors can be set to Acc Linear or Vel 3 – 20000 Hz, Vel 0.3 – 1000 Hz, Vel 10 – 1000 Hz or Vel 1 – 100 Hz
Single Values for Display and Storage: Peak‐Peak for displacement
Human Vibration
Specifications for Human Vibration parameters apply to Type 2250/2270 fitted with an accelerometer.
StandardsConforms with the following International Standards:• ISO 8041:2005 • ISO 5349–1 • ISO 2631 series • DIN 45669‐1:2010–09
Analysis
DETECTORSTwo broadband detectors can each be set to one of the weightings:
Wmb is the band limiting part of Wm. Whb is the band limiting part of Wh and Wxb is the band limiting part of Wb, Wc, Wd, We, Wj and WkThe weighting for the peak detector can be set to one of the settings chosen for the broadband detectors or Acc Linear.The weighting for the spectrum detectors can be set to Acc Linear or Vel 0.3 – 1000 Hz or Vel 1 – 100 Hz
MEASUREMENTS
Low Frequency 1/1‐ and 1/3‐octave Analysis
Frequency Analysis
CENTRE FREQUENCIES1/1‐oct. Band Centre Frequencies: 1 Hz to 16 kHz1/3‐oct. Band Centre Frequencies: 0.8 Hz to 20 kHz
StandardsConforms with the following National and International Standards:• IEC 61260–1 (2014), 1/1‐octave Bands and 1/3‐octave Bands, Class 1
• IEC 61260 (1995–07) plus Amendment 1 (2001–09), 1/1‐octave Bands and 1/3‐octave Bands, Class 0
• ANSI S1.11–1986, 1/1‐octave Bands and 1/3‐octave Bands, Order 3, Type 0–C
• ANSI S1.11–2004, 1/1‐octave Bands and 1/3‐octave Bands, Class 0
• ANSI/ASA S1.11–2014 Part 1, 1/1‐octave Bands and 1/3‐octave Bands, Class 1
Sound MeasurementsLow‐frequency sound measurements require use of a low‐frequency microphone. This can be Type 4193 or Type 4964, both together with Low‐frequency Adaptor UC‐0211
Vibration MeasurementsBrüel & Kjær recommends Low‐level Accelerometer Type 8344 for low frequency vibration measurements
Acc Linear Vel 0.3 – 1000 Hz Vel 1 – 100 Hz
Wb Wc Wd
We Wj Wh
Wk Wm Wxb
Whb Wmb
Single Values for Display and Storage:
MTVV KBFmax KBFTmPeak‐Peak
Single Values for Display Only:
aW,1s KBF

Hand‐held Analyzer Types 2250 and 2270 – User Manual226
Specifications – Measurement Partner Suite BZ-5503
BZ‐5503 is included with Types 2250, 2250‐L and 2270 for easy synchronization of setups and data between the PC and hand‐held analyzer. BZ‐5503 is supplied on ENV DVD BZ‐5298
PC REQUIREMENTSOperating System: Windows® 7, 8.1 or 10 (all in 32‐bit or 64‐bit versions) Recommended PC: • Intel® Core™ i3• Microsoft®.NET 4.5• 2 GB of memory• Sound card• DVD drive• At least one available USB port• Solid State Drive
ON‐LINE DISPLAY OF TYPE 2250/2250‐L/2270 DATAMeasurements on the analyzer can be controlled from the PC and displayed on‐line with the PC, using the same user interface on the PC as on the analyzerDisplay: 1024 × 768 (1280 × 800 recommended)
DATA MANAGEMENTExplorer: Facilities for easy management of analyzers, Users, Jobs, Projects and Project Templates (copy, cut, paste, delete, rename, create)Data Viewer: View measurement data (content of projects)Synchronization: Project Templates and Projects for a specific user can be synchronized between PC and analyzer and between local and cloud archives. Measurement Partner Suite BZ‐5503 merges Measurement Partner Field App annotations with the corresponding analyzer project
USERSUsers of Type 2250/2270 can be created or deleted
EXPORT FACILITIESExcel®: Projects (or user‐specified parts) can be exported to Microsoft® Excel® (Excel 2003 – 2013 supported)
Brüel & Kjær Software: Projects can be exported* to Predictor‐LimA Type 7810, Acoustic Determinator Type 7816, Evaluator Type 7820, Protector Type 7825 or Qualifier (Light) Type 7830 (7831)
POST‐PROCESSINGMeasurement Partner Suite is a suite of modules, including post‐processing tools for data acquired with Type 2250/2270. The following post‐processing modules are available:• Logging Module BZ‐5503‐A• Spectrum Module BZ‐5503‐B• WAV File Analysis Module BZ‐5503‐CThese modules help to assess logging data and measured spectra, such as calculating contribution from markers on a logging profile or correcting spectra for background noise
HAND‐HELD ANALYZER SOFTWARE UPGRADES AND LICENSESThe software controls analyzer software upgrades and licensing of the analyzer applications
INTERFACE TO HAND‐HELD ANALYZERUSB, LAN or Internet connectionUSB Connection:• Hardware versions 1 – 3: USB ver. 1.1• Hardware version 4: USB ver. 2.0
LICENSE MOVERTo move a license from one analyzer to another use BZ‐5503, together with License Mover VP‐0647
LANGUAGEUser Interface in Chinese (People’s Republic of China), Chinese (Taiwan), Croatian, Czech, Danish, English, Flemish, French, German, Hungarian, Japanese, Italian, Korean, Polish, Portuguese, Romanian, Russian, Serbian, Slovenian, Spanish, Swedish, Turkish and Ukrainian
HELPConcise context‐sensitive help in English
* Not all data are available in all exports. The data exported are dependent on the type and target of the export.

CHAPTER 18Specifications
227
Ordering Information
Type 2250‐A Hand‐held Analyzer with Sound Level Meter Software BZ‐7222
Type 2250‐B Hand‐held Analyzer with Sound Level Meter BZ‐7222 and Frequency Analysis Software BZ‐7223
Type 2250‐C Hand‐held Analyzer with Sound Level Meter Software BZ‐7222 and Logging Software BZ‐7224
Type 2250‐D Hand‐held Analyzer with Sound Level Meter Software BZ‐7222, Frequency Analysis Software BZ‐7223 and Logging Software BZ‐7224
Type 2250‐E Hand‐held Analyzer with Sound Level Meter Software BZ‐7222, Frequency Analysis Software BZ‐7223, Enhanced Logging Software BZ‐7225 and Signal Recording Software BZ‐7226
Type 2270‐A Hand‐held Analyzer with Sound Level Meter Software BZ‐7222
Type 2270‐B Hand‐held Analyzer with Sound Level Meter BZ‐7222 and Frequency Analysis Software BZ‐7223
Type 2270‐C Hand‐held Analyzer with Sound Level Meter Software BZ‐7222 and Logging Software BZ‐7224
Type 2270‐D Hand‐held Analyzer with Sound Level Meter Software BZ‐7222, Frequency Analysis Software BZ‐7223 and Logging Software BZ‐7224
Type 2270‐E Hand‐held Analyzer with Sound Level Meter Software BZ‐7222, Frequency Analysis Software BZ‐7223, Enhanced Logging Software BZ‐7225 and Signal Recording Software BZ‐7226
Included with Hand‐held Analyzer Type 2250/2270: • Microphone: – Type 4189: 1/2 Prepolarized Free‐field Microphoneor
– Type 4190: 1/2 Free‐field Microphone• ZC‐0032: Microphone Preamplifier• AO‐1494: USB Standard A to USB Micro B Interface Cable for hardware version 4, 1.8 m (6 ft)
• AO‐1476: USB Standard A to USB Mini B Interface Cable for hardware versions 1 – 3, 1.8 m (6 ft)
• BZ‐5298: Environmental Software, including Measurement Partner Suite BZ‐5503
• UA‐1650: 90 mm dia. Windscreen with AutoDetect• UA‐1651: Tripod Extension for Hand‐held Analyzer• UA‐1673: Adaptor for Standard Tripod Mount• DH‐0696: Wrist Strap• KE‐0440: Travel Bag • KE‐0441: Protective Cover• FB‐0679: Hinged Cover (Type 2250 only)• FB‐0699: Hinged Cover (Type 2270 only)• HT‐0015: Earphones• UA‐1654: 5 Extra Styli• QB‐0061: Battery Pack• ZG‐0426: Mains Power Supply • UL‐1050: USB Wi‐Fi dongle for hand‐held analyzers for hardware version 4
Software and Accessories Available Separately
SOFTWARE MODULESBZ‐7223 Frequency Analysis SoftwareBZ‐7224 Logging Software (including memory
card)BZ‐7225 Enhanced Logging Software (including
memory card) BZ‐7225‐UPG Upgrade from Logging Software
BZ‐7224 to Enhanced Logging Software BZ‐7225 (does not include memory card)
BZ‐7226 Signal Recording OptionBZ‐7227 Reverberation Time SoftwareBZ‐7229 2‐channel Option (Type 2270 only)BZ‐7228 Building Acoustics SoftwareBZ‐7230 FFT SoftwareBZ‐7231 Tone Assessment OptionBZ‐7233 Sound Intensity Software (Type 2270
only)BZ‐7234 Enhanced Vibration and Low
Frequency Option
ANALYZER COMPONENTSZG‐0444 Charger for QB‐0061 Battery Pack

Hand‐held Analyzer Types 2250 and 2270 – User Manual228
CALIBRATIONType 4231 Sound Calibrator (fits in KE‐0440)Type 4226 Multifunction Acoustic CalibratorType 4228 PistonphoneType 4294 Calibration ExciterType 4294‐002 Calibration Exciter for Type 8344
MEASURINGType 3535‐A All‐weather Case (see Product Data
BP 2251)Type 4964 Low‐frequency MicrophoneType 8344 Low‐level AccelerometerAO‐0440‐D‐015 Signal Cable, LEMO to BNC Male, 1.5 m
(5 ft)AO‐0646 Sound Cable, LEMO to Minijack, 1.5 m
(5 ft)AO‐0697‐D‐030 Microphone Extension Cable, 10‐pin
LEMO, 3 m (10 ft)AO‐0697‐D‐100 Microphone Extension Cable, 10‐pin
LEMO, 10 m (33 ft)AO‐0701‐D‐030 Accelerometer Cable, LEMO to M3, 3 m
(10 ft)AO‐0702‐D‐030 Accelerometer Cable, LEMO to 10 – 32
UNF, 3 m (10 ft)AO‐0722‐D‐050 Accelerometer cable, LEMO to
MIL‐C‐5015, 5 m (16 ft)AO‐0726‐D‐030 Signal Cable, LEMO to SMB (for Tacho
Probe MM‐0360/2981), 3 m (10 ft)AO‐0727‐D‐010 Signal Cable, LEMO to BNC Female, 1 m
(3.3 ft)AO‐0727‐D‐015 Signal Cable, LEMO to BNC Female,
1.5 m (5 ft)JP‐1041 Dual 10‐pole AdaptorUA‐0587 TripodUA‐0801 Small TripodUA‐1317 Microphone HolderUA‐1404 Outdoor Microphone KitUA‐1672 AutoDetect Insert for UA‐1650UC‐0211 Low‐frequency AdaptorUL‐1009 SD Memory Card for hand‐held
analyzersUL‐1013 CF Memory Card for hand‐held
analyzers, for hardware versions 1 – 3UL‐1017 SDHC Memory Card for hand‐held
analyzersMM‐0256‐A Weather Station KitMM‐0316‐A Weather Station Kit
Included with MM‐0256‐A or MM‐0316‐A:• MM‐0256‐002: Six Parameter Weather Station (and mounting kit)
• MM‐0316‐002: Two Parameter Weather Station (and mounting kit)
• AO‐0657: USB Cable• AO‐0659: Cable M12 8‐pin (F) to LEMO 1‐B 8‐pin (M), 10 m (33.3 ft)
• BR 1779: Weather Station Field Guide• DB‐4364: Weather Station Pole Adapter• KE‐4334: Weather Station Carrying Case• QX‐0016: Screwdriver• QX‐1171: 2.5 mm Hex Wrench• UA‐1707‐A: Weather Station Tripod Adaptor• ZH‐0689: Weather Station USB Adaptor
MEASURING WITH REVERBERATION TIME SOFTWARE BZ‐7227Type 2734‐A Power Amplifier*
Type 2734‐B Power Amplifier with built‐in UL‐0256 Wireless Audio System*
UL‐0256 Wireless Audio System*
Type 4292‐L OmniPower Sound Source*
KE‐0449 Flight Case for Type 4292‐L*
KE‐0364 Tripod Carrying Case for Type 4292‐L Type 4224 Sound Source*
Type 4295 Omnidirectional Sound Source*
KE‐0392 Carrying Case for Type 4295*
AO‐0523‐D‐100 Cable, from Type 2250/2270 to power amplifier, 10 m (33 ft)
AO‐0524‐D‐100 Cable from Type 2250/2270 to Type 4224, 10 m (33 ft)
AQ‐0673 Cable, from power amplifier to sound source, 10 m (33 ft)
UA‐1476 Wireless Remote Control*
POST‐PROCESSINGType 7831 Qualifier LightType 7830 Qualifier
INTERFACINGBZ‐5503‐A Logging Module (see Product Data
BP 2430)BZ‐5503‐B Spectrum Module (see Product Data
BP 2430)BZ‐5503‐C WAV File Analysis Module (see Product
Data BP 2430)Type 7820 Evaluator – data viewing and
calculation softwareType 7825 Protector – software for calculation of
Personal Noise ExposureUL‐1016 10/100 Ethernet CF Card for hardware
versions 1 – 3
* For sound source systems and components, please see Product Data BP 1689 or BP 0066.

CHAPTER 18Specifications
229
UL‐1019 CF WLAN Card for Hand‐held Analyzers for hardware versions 1 – 3
UL‐0250 USB to RS–232 Converter for hardware version 4
Service Products
MAINTENANCE2250‐EW1 Extended Warranty, one year extension2250‐MW5 5‐year Warranty, including yearly
Accredited Calibration2270‐EW1 Extended Warranty, one year extension2270‐MW5 5‐year Warranty, including yearly
Accredited Calibration
ACCREDITED CALIBRATION2250‐CAI Accredited Initial Calibration of
Type 22502250‐CAF Accredited Calibration of Type 22502250‐CTF Traceable Calibration of Type 22502250‐TCF Conformance Test of Type 2250, with
certificate2270‐CAI Accredited Initial Calibration of
Type 22702270‐CAF Accredited Calibration of Type 22702270‐CTF Traceable Calibration of Type 22702270‐TCF Conformance Test of Type 2270, with
certificate

Hand‐held Analyzer Types 2250 and 2270 – User Manual230
Compliance with Environmental Standards
The CE marking is the manufacturer's declaration that the product meets the requirements of the applicable EU directivesRCM mark indicates compliance with applicable ACMA technical standards – that is, for telecommunications, radio communications, EMC and EMEChina RoHS mark indicates compliance with administrative measures on the control of pollution caused by electronic information products according to the Ministry of Information Industries of the People’s Republic of ChinaWEEE mark indicates compliance with the EU WEEE Directive
Safety EN/IEC 61010– 1, ANSI/UL 61010–1 and CSA C22.2 No.1010.1: Safety requirements for electrical equipment for measurement, control and laboratory use
EMC Emission EN/IEC 61000–6–3: Generic emission standard for residential, commercial and light industrial environmentsEN/IEC 61326: Electrical equipment for measurement, control and laboratory use – EMC requirementsCISPR 22: Radio disturbance characteristics of information technology equipment. Class B LimitsIEC 61672–1, IEC 61260, IEC 60651 and IEC 60804: Instrumentation standardsNote: The above is only guaranteed using accessories listed in this document
EMC Immunity EN/IEC 61000–6–2: Generic standard – Immunity for industrial environmentsEN/IEC 61326: Electrical equipment for measurement, control and laboratory use – EMC requirementsIEC 61672–1, IEC 61260, IEC 60651 and IEC 60804: Instrumentation standardsNote: The above is only guaranteed using accessories listed in this document
Temperature IEC 60068–2–1 & IEC 60068–2–2: Environmental Testing. Cold and Dry Heat.Operating Temperature: –10 to +50 °C (14 to 122 °F)Storage Temperature: –25 to +70 °C (–13 to 158 °F)
Humidity IEC 60068–2–78: Damp Heat: 93% RH (non‐condensing at +40 °C (104 °F)). Recovery time 2 4 hours
Mechanical Non‐operating: IEC 60068–2–6: Vibration: 0.3 mm, 20 m/s2, 10 – 500 HzIEC 60068–2–27: Bump: 1000 bumps at 400 m/s2 IEC 60068–2–27: Shock: 1000 m/s2, 6 directions
Enclosure IEC 60529 (1989): Protection provided by enclosures: IP 44*
* With preamplifier, extension cable or protection plug connected to the top socket and the hinged cover protecting the bottom connectors.
ADDITIONAL STANDARDS FOR MICRO USB WIRELESS ADAPTOR UL‐1050*
* From the D-Link Corporation declaration of conformance for Wireless N 150 Micro USB Adaptor DWA-121.
FCC GRANT OF EQUIPMENT AUTHORIZATION FOR MICRO USB WIRELESS ADAPTOR UL‐1050*
Safety EN 60950–1:2006+A11:2009+A1:2010 +A12:2011
FCC Identifier KA2WA121A1
FCC Rule Parts 15c
EMC Emission EN 301 489–1 V1.9.2EN 301 489–17 V2.2.1EN 55022: 2010+AC:2011
Frequency Range (MHz)
2412.0 – 2462.0
Output Watts 0.269
Spectrum & Health
EN 300 328 V1.7.1EN 62311:2008
EC Declaration of Conformity
1Tx1R 802.11bgn USB adapter
Restriction of Hazardous Substances
EN 50581:2012 C‐Tick Authorization
AS/NZS 4268: 2008+A1:2010

CHAPTER 18Specifications
231
231
Appendix ASetup Parameters
This appendix describes all the setup parameters included in a template.For 2-channel setup, some parameters are doubled – one for Ch.1 and one for Ch.2 (Type 2270only).

Hand‐held Analyzer Types 2250 and 2270 – User Manual232
A.1 Input
Table A.1 Input parameters
Parameter Values Comment
Input Channel Ch. 1
Ch. 2
Determines whether Input Ch. 1 or Input Ch. 2 is used for the measurement.(Available in Type 2270 1-channel templates only)
Loudness* Free-field
Diffuse-field
Auto
Determines whether Loudness and Loudness Level are calculated based on Free-field or Diffuse-field conditions. Set to Auto to follow the setting of Sound Field Correction. For an unknown microphone type, you can set Loudness to the condition matching your request.Available for microphone input only
Trigger Input† None
MATRON Handswitch
Voltage Level
Voltage for Monitoring
This parameter should be set to match the equipment connected to the Trigger Input socket on the connector panel of the analyzer.
Set it to None, if not used.
Set Trigger Input to MATRON Handswitch if the analyzer is being used in the MATRON system. This setting should also be used if you want to use the Handswitch ZH-0680 for manually triggering signal recordings.
✐Please note: This can only be used together with analyzers with serial numbers above 2479652.
Set Trigger Input to Voltage Level if you want to control signal recording by a voltage level generated by external equipment. The Voltage Level should generate at least 2 V for On and less than 1 V for Off. The duration of the steady level should be at least 1 s, so it can be recognized by the analyzer
Set Trigger Input to Voltage for Monitoring if you want to monitor the voltage at this input. This setting can be used together with Notifications – see section 8.4. This setting cannot be combined with MATRON Handswitch or Voltage Level
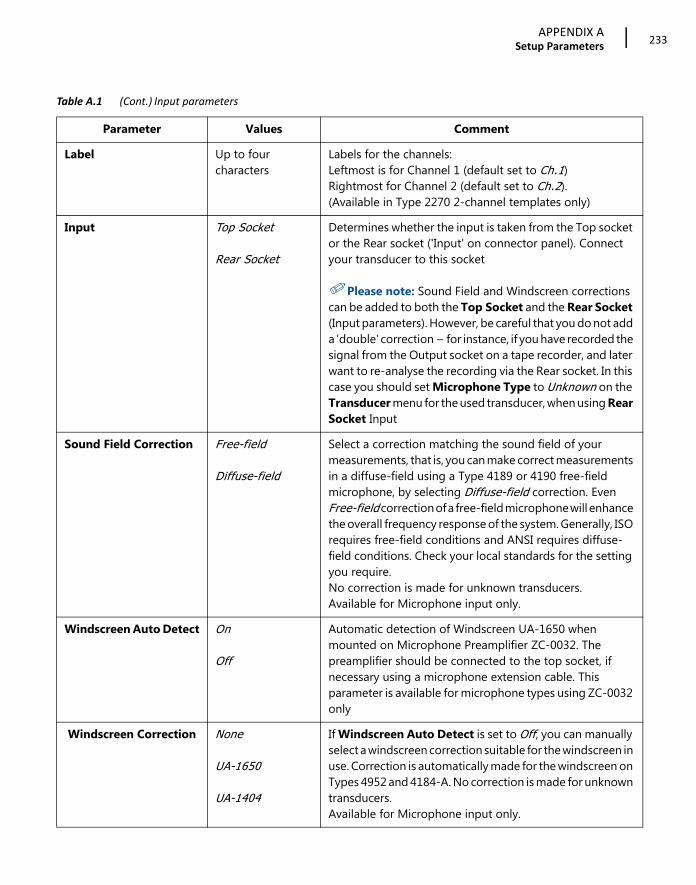
APPENDIX ASetup Parameters
233
Label Up to four characters
Labels for the channels:Leftmost is for Channel 1 (default set to Ch.1)Rightmost for Channel 2 (default set to Ch.2).(Available in Type 2270 2-channel templates only)
Input Top Socket
Rear Socket
Determines whether the input is taken from the Top socket or the Rear socket ('Input' on connector panel). Connect your transducer to this socket
✐Please note: Sound Field and Windscreen corrections can be added to both the Top Socket and the Rear Socket (Input parameters). However, be careful that you do not add a 'double' correction – for instance, if you have recorded the signal from the Output socket on a tape recorder, and later want to re-analyse the recording via the Rear socket. In this case you should set Microphone Type to Unknown on the Transducer menu for the used transducer, when using Rear Socket Input
Sound Field Correction Free-field
Diffuse-field
Select a correction matching the sound field of your measurements, that is, you can make correct measurements in a diffuse-field using a Type 4189 or 4190 free-field microphone, by selecting Diffuse-field correction. Even Free-field correction of a free-field microphone will enhance the overall frequency response of the system. Generally, ISO requires free-field conditions and ANSI requires diffuse-field conditions. Check your local standards for the setting you require.No correction is made for unknown transducers.Available for Microphone input only.
Windscreen Auto Detect On
Off
Automatic detection of Windscreen UA-1650 when mounted on Microphone Preamplifier ZC-0032. The preamplifier should be connected to the top socket, if necessary using a microphone extension cable. This parameter is available for microphone types using ZC-0032 only
Windscreen Correction None
UA-1650
UA-1404
If Windscreen Auto Detect is set to Off, you can manually select a windscreen correction suitable for the windscreen in use. Correction is automatically made for the windscreen on Types 4952 and 4184-A. No correction is made for unknown transducers.Available for Microphone input only.
Table A.1 (Cont.) Input parameters
Parameter Values Comment
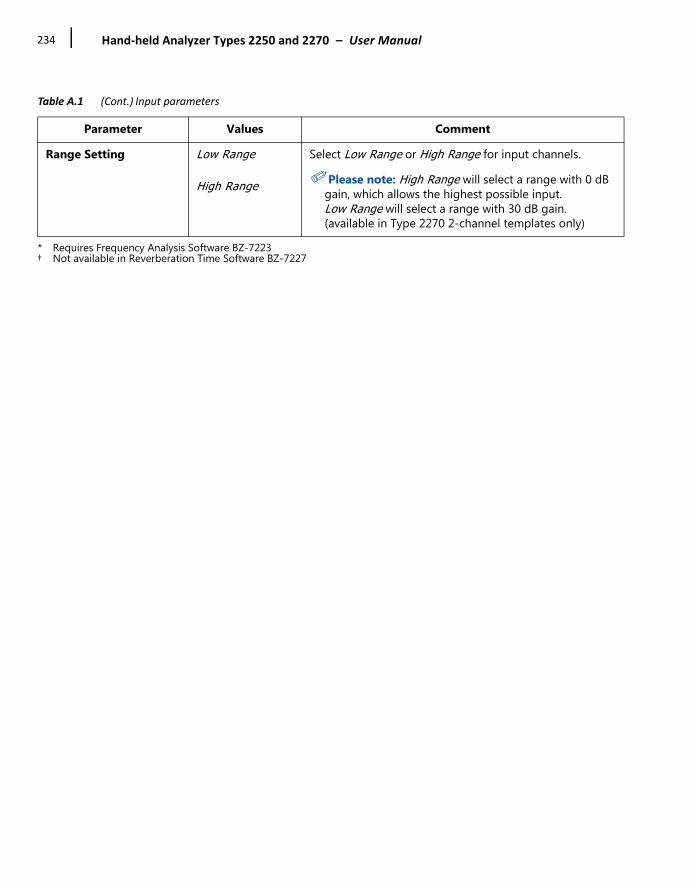
Hand‐held Analyzer Types 2250 and 2270 – User Manual234
Range Setting Low Range
High Range
Select Low Range or High Range for input channels.
✐Please note: High Range will select a range with 0 dB gain, which allows the highest possible input.Low Range will select a range with 30 dB gain. (available in Type 2270 2-channel templates only)
* Requires Frequency Analysis Software BZ-7223† Not available in Reverberation Time Software BZ-7227
Table A.1 (Cont.) Input parameters
Parameter Values Comment

APPENDIX ASetup Parameters
235
A.2 Frequency Settings
Table A.2 Frequency setting parameters*
Parameter Values Comment
Vibration Filters General
Human Vibration
(Accelerometer input only) Set to General for general vibration measurements. When Enhanced Vibration and Low Frequency Option BZ-7234 is present you can select Velocity and Displacement filters for the broadband detectors.
Set to Human Vibration (requires Enhanced Vibration and Low Frequency Option BZ-7234) for selecting human vibration filters for the broadband detectors.
Low Frequency* Normal
Extended
Very Low
Use this parameter to extend the low frequency of the broadband measurements and the frequency analysis. However, be aware that the measurements will be more sensitive to very low frequency noise such as wind noise.
Low Frequency = Normal:Frequency analysis*: 1/1-octave: 16 Hz – 16 kHz 1/3-octave: 12.5 Hz – 20 kHz
Low Frequency = Extended:Frequency analysis†: 1/1-octave: 8 Hz – 16 kHz1/3-octave: 6.3 Hz – 20 kHz
Low Frequency = Very Low:Frequency analysis*: 1/1-octave: 1 Hz – 16 kHz1/3-octave: 0.8 Hz – 20 kHz(Requires Enhanced Vibration and Low-frequency Option BZ-7234)For microphone input, this setting is only possible for microphone Types 4193 and 4964 with Low-frequency Adaptor UC-0211

Hand‐held Analyzer Types 2250 and 2270 – User Manual236
Broadband (excl. Peak) Microphone:A,ZA,CB,ZB,CA,G
Direct:Linear
All broadband parameters (except Lpeak) are measured simultaneously with two different frequency weightings –select the weightings for Microphone and Direct Input here
The G setting is available for Low Frequency = Extended or Very LowRequires Enhanced Vibration and Low-frequency Option BZ-7234
Broadband Peak Microphone:XCZG
Accelerometer:General Vibration:Acc LinearAcc 1 – 20 kHzVel 3 – 20000 HzVel 0.3 – 1000 HzVel 10 – 1000 HzVel 1 – 100 HzDis 10 – 1000 HzDis 3 – 300 HzDis 1 – 100 Hz
Human Vibration:Acc LinearVel 0.3 – 1000 HzVel 1 – 100 HzWmWbWcWdWeWjWkWhWmbWxbWhb
Direct:Linear
One broadband peak parameter Lpeak is measured.
Select the frequency weighting for Microphone or Direct input here.
✐Please note: X = frequency weighting A or B. ‘A’ requires that the Broadband (excl. Peak) parameter is set to AC or AZ. ‘B’ requires that the Broadband (excl. Peak) parameter is set to BC or BZ.
The G setting is available for Low Frequency = Extended or Very Low.Requires Enhanced Vibration and Low-frequency Option BZ-7234
Accelerometer:All settings, except Acc Linear and Acc 1k – 20kHz, requires Enhanced Vibration and Low-frequency Option BZ-7234.
The setting must be one of the chosen settings for Broadband Detector 1 or Broadband Detector 2 – or the setting Acc Linear
Table A.2 (Cont.) Frequency setting parameters*
Parameter Values Comment

APPENDIX ASetup Parameters
237
Broadband Detector 1 General Vibration:Acc LinearAcc 1 – 20 kHzVel 3 – 20000 HzVel 0.3 – 1000 HzVel 10 – 1000 HzVel 1 – 100 Hz
Human Vibration:Acc LinearVel 0.3 – 1000 HzVel 1 – 100 HzWmbWxbWhbWm
All broadband parameters (except Peak, Peak-Peak and Crest Factor) are measured simultaneously with two different frequency weightings – select the weighting for the first detector here (Accelerometer input only)
All settings, except Acc Linear and Acc 1k – 20kHz, require Enhanced Vibration and Low-frequency Option BZ-7234
Broadband Detector 2 General Vibration:Acc LinearAcc 1 – 20 kHzVel 3 – 20000 HzVel 0.3 – 1000 HzVel 10 – 1000 HzVel 1 – 100 HzDis 10 – 1000 HzDis 3 – 300 HzDis 1 – 100 Hz
Human Vibration:Acc LinearVel 0.3 – 1000 HzVel 1 – 100 HzWmWbWcWdWeWjWkWh
All broadband parameters (except Peak, Peak-Peak and Crest Factor) are measured simultaneously with two different frequency weightings – select the weighting for the second detector here (Accelerometer input only)
All settings, except Acc Linear and Acc 1k – 20kHz, require Enhanced Vibration and Low-frequency Option BZ-7234
Table A.2 (Cont.) Frequency setting parameters*
Parameter Values Comment

Hand‐held Analyzer Types 2250 and 2270 – User Manual238
Spectrum† Microphone:XCZG
Accelerometer:Acc LinearVel 3 – 20000 HzVel 0.3 – 1000 HzVel 10 – 1000 HzVel 1 – 100 Hz
Direct:Linear
The frequency analysis (1/1-octave or 1/3-octave) will be frequency weighted in accordance with this parameterNote: X = frequency weighting A or B. ‘A’ requires that the Broadband (excl. Peak) parameter is set to AC or AZ. ‘B’ requires that the Broadband (excl. Peak) parameter is set to BC or BZ.
The G setting is available for Low Frequency = Extended or Very LowRequires Enhanced Vibration and Low-frequency Option BZ-7234
Bandwidth‡ 1/1-octave
1/3-octave
Bandwidth of frequency analysis
Bottom F. for Special Leq**,††
0.8 Hz to Top Frequency
1/1-octave: 1 Hz – 16 kHz1/3-octave: 0.8 Hz – 20 kHz
✐Please note: The lower limit of the parameter depends on Low Frequency
Top Freq. for Special Leq†,‡‡
Bottom Frequency to 20 kHz
1/1-octave: 1 Hz – 16 kHz1/3-octave: 0.8 Hz – 20 kHz
* Not available in Reverberation Time Software BZ-7227.† Requires Frequency Analysis Software BZ-7223.‡ Requires Frequency Analysis Software BZ-7223 or Reverberation Time Software BZ-7227.** For BZ-7223, BZ-7224 and BZ-7225 only.†† Bottom F. for Special Leq is f1 in the parameter LXeq(f1 – f2)‡‡ Top F. for Special Leq is f2 in the parameter LXeq(f1 – f2)
Table A.2 (Cont.) Frequency setting parameters*
Parameter Values Comment
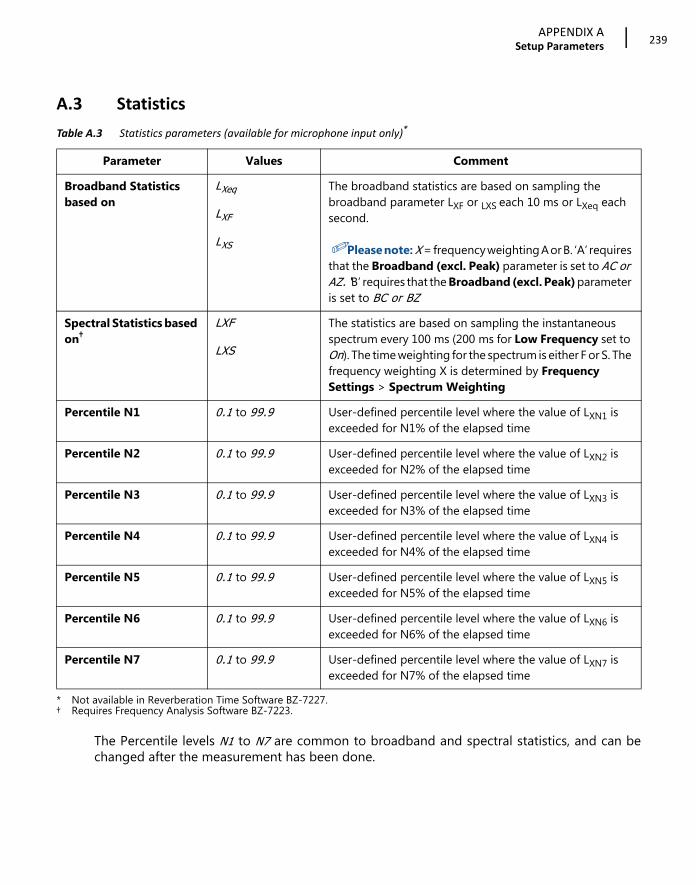
APPENDIX ASetup Parameters
239
A.3 Statistics
The Percentile levels N1 to N7 are common to broadband and spectral statistics, and can bechanged after the measurement has been done.
Table A.3 Statistics parameters (available for microphone input only)*
* Not available in Reverberation Time Software BZ-7227.
Parameter Values Comment
Broadband Statistics based on
LXeq
LXF
LXS
The broadband statistics are based on sampling the broadband parameter LXF or LXS each 10 ms or LXeq each second.
✐Please note: X = frequency weighting A or B. ‘A’ requires that the Broadband (excl. Peak) parameter is set to AC or AZ. ‘B’ requires that the Broadband (excl. Peak) parameter is set to BC or BZ
Spectral Statistics based on†
† Requires Frequency Analysis Software BZ-7223.
LXF
LXS
The statistics are based on sampling the instantaneous spectrum every 100 ms (200 ms for Low Frequency set to On). The time weighting for the spectrum is either F or S. The frequency weighting X is determined by Frequency Settings > Spectrum Weighting
Percentile N1 0.1 to 99.9 User-defined percentile level where the value of LXN1 is exceeded for N1% of the elapsed time
Percentile N2 0.1 to 99.9 User-defined percentile level where the value of LXN2 is exceeded for N2% of the elapsed time
Percentile N3 0.1 to 99.9 User-defined percentile level where the value of LXN3 is exceeded for N3% of the elapsed time
Percentile N4 0.1 to 99.9 User-defined percentile level where the value of LXN4 is exceeded for N4% of the elapsed time
Percentile N5 0.1 to 99.9 User-defined percentile level where the value of LXN5 is exceeded for N5% of the elapsed time
Percentile N6 0.1 to 99.9 User-defined percentile level where the value of LXN6 is exceeded for N6% of the elapsed time
Percentile N7 0.1 to 99.9 User-defined percentile level where the value of LXN7 is exceeded for N7% of the elapsed time
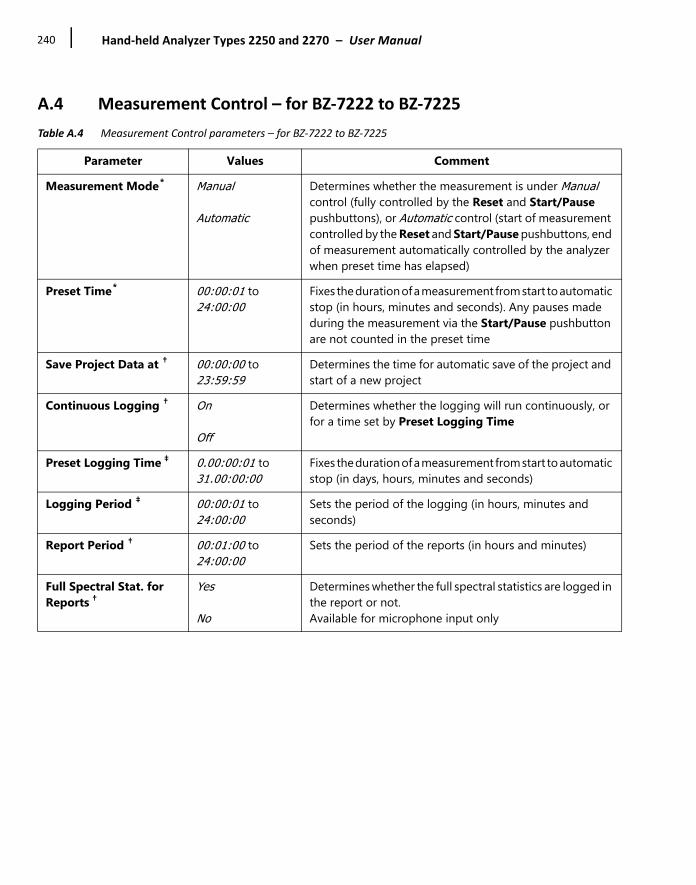
Hand‐held Analyzer Types 2250 and 2270 – User Manual240
A.4 Measurement Control – for BZ‐7222 to BZ‐7225
Table A.4 Measurement Control parameters – for BZ‐7222 to BZ‐7225
Parameter Values Comment
Measurement Mode* Manual
Automatic
Determines whether the measurement is under Manual control (fully controlled by the Reset and Start/Pause pushbuttons), or Automatic control (start of measurement controlled by the Reset and Start/Pause pushbuttons, end of measurement automatically controlled by the analyzer when preset time has elapsed)
Preset Time* 00:00:01 to 24:00:00
Fixes the duration of a measurement from start to automatic stop (in hours, minutes and seconds). Any pauses made during the measurement via the Start/Pause pushbutton are not counted in the preset time
Save Project Data at † 00:00:00 to 23:59:59
Determines the time for automatic save of the project and start of a new project
Continuous Logging † On
Off
Determines whether the logging will run continuously, or for a time set by Preset Logging Time
Preset Logging Time ‡ 0.00:00:01 to 31.00:00:00
Fixes the duration of a measurement from start to automatic stop (in days, hours, minutes and seconds)
Logging Period ‡ 00:00:01 to 24:00:00
Sets the period of the logging (in hours, minutes and seconds)
Report Period † 00:01:00 to 24:00:00
Sets the period of the reports (in hours and minutes)
Full Spectral Stat. for Reports †
Yes
No
Determines whether the full spectral statistics are logged in the report or not.Available for microphone input only

APPENDIX ASetup Parameters
241
Synchronize with Clock ‡ Yes
No
Select Yes to synchronize the logging and reporting intervals with whole minutes or hours, for example, if Logging Period is set to 00:01:00 (1 minute) and Report Period is set to 01:00:00 and you start the measurement at 8:12:33, then the first logging interval will be from 8:12:33 to 8:12:59 (27 seconds), the second will be from 8:13:00 to 8:13:59 (60 seconds), etc., and the first Report interval will be from 8:12:33 to 8:59:59 (48 min and 27 seconds), the second will be from 9:00:00 to 9:59:59 (1 hour), etc.
Select No if you want every logging and reporting interval to be exactly the specified Logging Period
T for LXeq,T,mov 00:01:00 to 01:00:00
Sets the averaging time T (in minutes) of the moving LAeq and moving LCeq. When the averaging time T has elapsed the LAeq,T,mov and LCeq,T,mov parameters will contain the LAeq and LCeq of the latest T minutes – updated every second. in addition, you also have Leq,T,mov = LCeq,T,mov –LAeq,T,mov. The LXeq,T,mov is not stored with the total data, but can be logged (BZ-7224 and BZ-7225). The LAeq,T,mov,max, LCeq,T,mov,max and the difference between the C- and A-weighted values for the complete measurement period are stored.
✐Please note: There are two sets of these parameters, allowing two simultaneous moving averages: for example, one with 15 min averaging time and one with 1 hour averaging time
Charge Injection Calibration ‡
On
Off
Set to On for making a CIC at the start and end of Logging. An Exclude marker is set on the profile and Total parameters are not updated during the CIC.Available for microphone input only
Daily CIC † None
Once
Twice
Three times
Four times
Determines whether CID is performed one to four times a day or not at all. An Exclude marker is set on the profile and Periodic Reports and Total parameters are not updated during the calibration. The results are saved together with the Total parameters.Available for microphone input only
Table A.4 (Cont.)Measurement Control parameters – for BZ‐7222 to BZ‐7225
Parameter Values Comment

Hand‐held Analyzer Types 2250 and 2270 – User Manual242
First Check † 00:00:00 to 23:59:59
Set time of day for first CIC check.
✐Please note: The Check times must be separated from each other by at least one minute. They should also differ by at least one minute from the time set in the Save Project Data at parameter.
Available for microphone input only
Second Check † 00:00:00 to 23:59:59
Set time of day for second CIC check.Available for microphone input only.
Third Check † 00:00:00 to 23:59:59
Set time of day for third CIC check.Available for microphone input only.
Fourth Check † 00:00:00 to 23:59:59
Set time of day for fourth CIC check.Available for microphone input only.
* For Sound Level Meter BZ-7222 and Frequency Analyzer BZ-7223 templates only.† For Enhanced Logging BZ-7225 templates only.‡ For Logging BZ-7224 and Enhanced Logging BZ-7225 templates only.
Table A.4 (Cont.)Measurement Control parameters – for BZ‐7222 to BZ‐7225
Parameter Values Comment

APPENDIX ASetup Parameters
243
A.5 Measurement Control – for Reverberation Time Software BZ‐7227
Table A.5 Measurement Control parameters – for Reverberation Time Software BZ‐7227
Parameter Values Comment
Map Based Measurement
No
Yes
If Map Based Measurement = Yes you can define the source positions and receiver positions graphically on a map – otherwise the measurements are just numbered from position number one (Pos 1) onwards
Meas. All Pos. for Each Source
No
Yes
Parameter only available if Map Based Measurement = Yes.
Set to Yes for measuring all positions for each source position.
Set to No for measuring a specific number of receiver positions per source position
No. of Positions per Source
1 to 10 Parameter only available if Meas. All Pos. for Each Source = NoSet number of receiver positions you want to measure per source
Increment Sources First
Receivers First
Manual
Parameter only available if Map Based Measurement = Yes.Allows you to select the quickest method of measurement, when positioning your analyzer in relation to source and receiver positions. (Typically, Sources First is best for Impulsive Excitation and Receivers First is best for Interrupted Noise excitation)
Automatic Save No
Yes
Set to Yes to automatically save the decay after each measurement
Max. Decay Time 1 to 30 s Sets the maximum duration of the decay measurement. If the decay finishes in a shorter time, decay measurement stops automatically.
✐Please note: If you set Max. Decay Time above 20 s, then the measurement will not stop before this time has elapsed

Hand‐held Analyzer Types 2250 and 2270 – User Manual244
Excitation Impulsive
Interrupted Noise
Select Impulsive to excite the room with an impulse. The analyzer triggers on the impulse, measures the impulse as a sequence of spectra with 5 ms intervals, and finally backwardly integrates the measurements to decay curves.
Select Interrupted Noise to excite the room with noise, interrupt the noise and measure the decays – all controlled by the analyzer
Number of Decays 1 to 99 Parameter only available if Excitation = Interrupted Noise.Specify the number of decays to be measured automatically and averaged together per position
Trigger Level 0 to 200 dB Parameter only available if Excitation = Impulsive.Specify the trigger level for the sound level in any frequency band – the measurement starts as soon as this level is exceeded. The measurement has a pre-trigger of 1 s
Trigger Repeat Off
On
Set to On to start a new measurement automatically, after saving the previous measurement (and after fulfilling the trigger conditions).Parameter only available if Excitation = Impulsive and = Yes
Measurement Mode Parallel
Serial
Combined
Parallel measures all bands in the spectrum simultaneously, Serial measures selected bands, and Combined first measures Parallel and then Serial in an automated sequence
Table A.5 (Cont.)Measurement Control parameters – for Reverberation Time Software BZ‐7227
Parameter Values Comment

APPENDIX ASetup Parameters
245
A.6 Logged Broadband (10/100 ms)
A.7 Logged Broadband
Table A.6 Logged Broadband (10/100 ms) parameters*
* For Logging (BZ-7224) and Enhanced Logging (BZ-7225) templates only.
Parameter Values Comment
Single channel:Parameter 1 to Parameter 3
2-channel templates (Type 2270 only):Parameter 1 to Parameter 4
Microphone:LAeq,LAF,LAF(10ms)LAS,Off
Accelerometer or Direct:Linear,Fast Inst,Slow Inst,Off
The selected parameter(s) will be logged every 100 ms, except LAF(10ms), which will be logged every 10 ms. LAeq or Linear will have an averaging time of 100 ms.
✐Please note: LAF(10ms) cannot be displayed by the instrument – use BZ-5503 MPS to display this parameter
Table A.7 Logged Broadband parameters*
Parameter Values Comment
Full Statistics Yes
No
Determines whether the full broadband statistics are logged or notAvailable for microphone input only
Broadband Parameters All
Selected
Determines whether All broadband parameters are logged or a Selected part is logged (up to 10 parameters for microphone input, otherwise up to 5 parameters)

Hand‐held Analyzer Types 2250 and 2270 – User Manual246
Parameter 1 to Parameter 10
Microphone:LXeqLYeqLCeq–LAeqLAeq,T1,movLAeq,T2,movLCeq,T1,movLCeq,T2,movDLeq,T1,movDLeq,T2,movLGeqLG10maxLG10minLXELYELVpeakLXFmaxLXSmaxLXImaxLYFmaxLYSmaxLYImaxLXFminLXSminLXIminLYFminLYSminLYIminLXIeqLYIeqLAIeq–LAeqLAFTeqLAFTeq–LAeqLavUQSILPSILSIL3LWeq(f1–f2)OverloadAvg. RPM
(Values continue on next page)
This parameter can be set if Broadband Parameters = Selected
X = frequency weightings A or B (controlled by Setup > Frequency Settings > BB (ex. peak) parameter)
Y = frequency weightings C or Z (controlled by Setup > Frequency Settings > BB (ex. peak) parameter)
V = frequency weightings A, B, C or Z (controlled by Setup > Frequency Settings > BB Peak parameter)
U = time weightings F or S (controlled by Setup > Occupational Health > Time Weighting for Lav parameter)
Q = exchange rate 4, 5 or 6 dB (controlled by Setup > Occupational Health > Exchange Rate for Lav parameter)
W = frequency weightings A, B, C or Z (controlled by Setup > Frequency Settings > Spectrum parameter)
f1 = Bottom frequency band (controlled by Setup > Frequency Settings > Bottom F. for Special Leq parameter)
f2 = Top frequency band (controlled by Setup > Frequency Settings > Top Freq. for Special Leq parameter).
✐Please note: The parameter values shown are for single-channel templates. For 2-channel templates (Type 2270 only) most of the values are available for both Ch.1 and Ch.2
Table A.7 (Cont.) Logged Broadband parameters*
Parameter Values Comment

APPENDIX ASetup Parameters
247
(Cont.) Parameter 1 to Parameter 10
Trig. Input VoltageWind Dir. avg.Wind Dir. min.Wind Dir. max.Wind Speed avg.Wind Speed min.Wind Speed max.Amb. TemperatureAmb. HumidityAmb. PressureRainfall
Accelerometer:Linear (Detector 1)Fast max (Detector 1)Slow max (Detector 1)Fast min (Detector 1)Slow min (Detector 1)Linear (Detector 2)Fast max (Detector 2)Slow max (Detector 2)Fast min (Detector 2)Slow min (Detector 2)PeakPeak-PeakCrest FactorLinear(f1-f2)OverloadTrig. Input VoltageAvg. RPMMTVVKBFmaxKBFTm
Linear:LinearPeakFast maxSlow maxFast minSlow minLinear(f1–f2)OverloadTrig. Input VoltageCrest FactorAvg. RPM
✐Please note: For Accelerometer and Direct Input, you can only select 5 parameters
* For Logging BZ-7224 and Enhanced Logging BZ-7225 templates only.
Table A.7 (Cont.) Logged Broadband parameters*
Parameter Values Comment

Hand‐held Analyzer Types 2250 and 2270 – User Manual248
A.8 Logged Spectrum
Table A.8 Logged Spectrum parameters*
* For Logging BZ-7224 and Enhanced Logging BZ-7225 templates only, requires Frequency Analysis Software BZ-7223.
Parameter Values Comment
Full Spectral Statistics Yes
No
Determines whether the full spectral statistics are logged or not
Spectrum Parameters All
Selected
None
Determines whether All spectrum parameters are logged, a Selected part of the parameters are logged (up to 3 parameters) or None are logged
Spectrum 1 to Spectrum 3
Microphone:LXeqLXFmaxLXSmaxLXFminLXSminOff
Accelerometer:LinearFast maxSlow maxFast minSlow minOff
Direct:LinearFast maxSlow maxFast minSlow minOff
These parameters can be set if Spectrum Parameters = Selected
X = frequency weightings A, B, C, Z or G (controlled by Setup > Frequency Settings > Spectrum parameter)
✐Please note: The parameter values shown are for single-channel templates. For 2-channel templates (Type 2270 only) the values are available for both Ch.1 and Ch.2

APPENDIX ASetup Parameters
249
A.9 Markers
Table A.9 Markers*
* For Logging BZ-7224 and Enhanced Logging BZ-7225 templates only
Parameter Values Comment
Marker 1 Text string Default set to Exclude. This marker can be set using the stylus in the profile or the Back-erase pushbutton during a measurement
Marker 2 Text string Default set to Manual. This marker can be set using the stylus in the profile or the Manual Event pushbutton during a measurement
Marker 3 Text string Default set to Level. This marker can be set using the stylus in the profile, or if the conditions for the level trigger are met during a measurement
Marker 4 and Marker 5 Text string These markers can be set using the stylus in the profile display
Marker 6 Text string Default set to Sound. This marker is set if a signal recording is made during a measurement
Pre-marker Time 0 to 5 s Specifies number of seconds marker 1, marker 2 or marker 3 will be set ahead of the point where the Back-erase or the Manual Event pushbuttons are pressed or the level trigger conditions are fulfilled

Hand‐held Analyzer Types 2250 and 2270 – User Manual250
A.10 Level Trigger
Table A.10 Level Trigger parameters*
Parameter Values Comment
Trigger On
Off
Set to On for setting Marker 3 (Level) when the Parameter fulfils the level trigger conditions (see below). The conditions are checked every second.Signal Recording† can also be controlled by these settings, see Setup > Signal Recording > Recording Control parameter
Start Slope Rising
Falling
Set to Rising to start when level goes above Start Level (and then stop when level goes below Stop Level).
Set to Falling to start when level goes below Start Level (and stop when level goes above Stop Level)
Start Level –100 to 200 dB Start trigger conditions are fulfilled, when level crosses Start Level (in accordance with Start Slope) for at least Start Duration seconds – set Start Level here
Start Duration 0 to 420 s Start trigger conditions are fulfilled, when level crosses Start Level (in accordance with Start Slope) for at least Start Duration seconds – set Start Duration here. The Start Duration will be limited by the internal recording buffer size and the Recording Quality and Resolution (Table A.13).
Stop Level –100 to 200 dB Stop trigger conditions are fulfilled, when level crosses Stop Level (in accordance with Start Slope) for at least Stop Duration seconds – set Stop Level here
Stop Duration 0 to 420 s Stop trigger conditions are fulfilled, when level crosses Stop Level (in accordance with Start Slope) for at least Stop Duration seconds – set Stop Duration here

APPENDIX ASetup Parameters
251
Parameter Microphone: LXeqLYeqLAeq,T1,movLAeq,T2,movLCeq,T1,movLCeq,T2,movLGeqLG10maxLG10minLVpeak LXFmax LXSmax LXImax LYFmax LYSmax LYImax LXFmin LXSmin LXImin LYFmin LYSmin LYImin LXF(SPL) LXS(SPL)LXI(SPL)LYF(SPL)LYS(SPL)LYI(SPL)
(Values continue on next page)
Select which parameter to monitor for the level trigger. The parameter is based on 1 second measurements and checked every second regardless of the logging period and logged parameters.
X = frequency weightings A or B (controlled by Setup > Frequency Settings > BB (ex. peak) parameter).
Y = frequency weightings C or Z (controlled by Setup > Frequency Settings > BB (ex. peak) parameter).
V = frequency weightings A, B, C or Z (controlled by Setup > Frequency Settings > BB Peak parameter)
✐Please note: The parameter values shown are for single-channel templates. For 2-channel templates (Type 2270 only) the values are available for both Ch.1 and Ch.2
Table A.10 (Cont.) Level Trigger parameters*
Parameter Values Comment

Hand‐held Analyzer Types 2250 and 2270 – User Manual252
(Cont.) Parameter Accelerometer:Linear (Detector 1)Fast max (Detector 1)Slow max (Detector 1)Fast min (Detector 1)Slow min (Detector 1)Linear (Detector 2)Fast max (Detector 2)Slow max (Detector 2)Fast min (Detector 2)Slow min (Detector 2)PeakPeak-PeakKBFmax
Direct:LinearPeakFast maxSlow maxFast minSlow min
* For Logging BZ-7224 templates only.† Requires license for Signal Recording BZ-7226.
Table A.10 (Cont.) Level Trigger parameters*
Parameter Values Comment
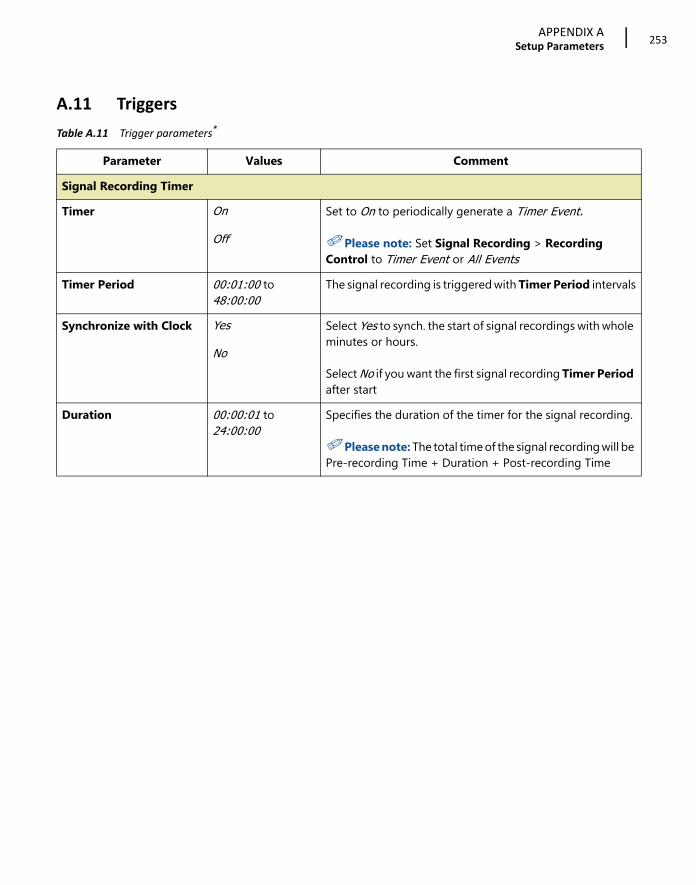
APPENDIX ASetup Parameters
253
A.11 Triggers
Table A.11 Trigger parameters*
Parameter Values Comment
Signal Recording Timer
Timer On
Off
Set to On to periodically generate a Timer Event.
✐Please note: Set Signal Recording > Recording Control to Timer Event or All Events
Timer Period 00:01:00 to 48:00:00
The signal recording is triggered with Timer Period intervals
Synchronize with Clock Yes
No
Select Yes to synch. the start of signal recordings with whole minutes or hours.
Select No if you want the first signal recording Timer Period after start
Duration 00:00:01 to 24:00:00
Specifies the duration of the timer for the signal recording.
✐Please note: The total time of the signal recording will be Pre-recording Time + Duration + Post-recording Time

Hand‐held Analyzer Types 2250 and 2270 – User Manual254
Level Trigger 1†‡
Trigger On
Off
Set to On for setting Marker 3 (Level) when the Trigger parameter fulfils the Level Trigger conditions (see below). The conditions are checked every second.Signal Recording can also be controlled by these settings, see Setup > Signal Recording > Recording Control
Start Time 00:00:00 to 23:59:59
Start Time defines when the level trigger is enabled. Triggering is limited to the enabled time
Stop Time 00:00:00 to 23:59:59
Stop Time defines when the level trigger is disabled. Triggering is limited to the enabled time
Hold Off 00:00:00 to 01:00:00
Hold Off specifies a time after a level trigger, where level triggering is disabled. Can be useful in reducing the number of triggers
Start Slope Rising
Falling
Set to Rising to start when level goes above Start Level (and then stop when level goes below Stop Level).Set to Falling to start when level goes below Start Level (and stop when level goes above Stop Level)
Start Level –100 to 200 dB Start trigger conditions are fulfilled, when level crosses Start Level (in accordance with Start Slope) for at least Start Duration seconds – set Start Level here
Start Duration 0 to 420 s Start trigger conditions are fulfilled, when level crosses Start Level (in accordance with Start Slope) for at least Start Duration seconds – set Start Duration here. The Start Duration will be limited by the internal recording buffer size and the Recording Quality and Resolution (Table A.13).
Stop Level –100 to 200 dB Stop trigger conditions are fulfilled, when level crosses Stop Level (in accordance with Start Slope) for at least Stop Duration seconds – set Stop Level here
Stop Duration 0 to 420 s Stop trigger conditions are fulfilled, when level crosses Stop Level (in accordance with Start Slope) for at least Stop Duration seconds – set Stop Duration here. The Stop Duration will be limited by the internal recording buffer size and the Recording Quality and Resolution (Table A.13)
Table A.11 (Cont.) Trigger parameters*
Parameter Values Comment

APPENDIX ASetup Parameters
255
Trigger Parameter Microphone: LXeqLYeqLAeq,T1,movLAeq,T2,movLCeq,T1,movLCeq,T2,movLGeqLG10maxLG10minLVpeak LXFmax LXSmax LXImax LYFmax LYSmax LYImax LXFmin LXSmin LXImin LYFmin LYSmin LYImin LXF(SPL) LXS(SPL)LXI(SPL)LYF(SPL)LYS(SPL)LYI(SPLLWeq(f1–f2)
(Values continue on next page)
Select which parameter to monitor for the level trigger. The parameter is based on 1 second measurements and checked every second regardless of the logging period and logged parameters.
X = frequency weightings A or B (controlled by Setup > Frequency Settings > BB (ex. peak)).
Y = frequency weightings C or Z (controlled by Setup > Frequency Settings > BB (ex. peak)).
V = frequency weightings A, B, C or Z (controlled by Setup > Frequency Settings > BB Peak)
W = frequency weightings A, B, C or Z (controlled by Setup > Frequency Settings > Spectrum)
(Comments continue on next page)
Table A.11 (Cont.) Trigger parameters*
Parameter Values Comment

Hand‐held Analyzer Types 2250 and 2270 – User Manual256
(Cont.) Trigger Parameter Accelerometer:Linear (Detector 1)Fast max (Detector 1)Slow max (Detector 1)Fast min (Detector 1)Slow min (Detector 1)Linear (Detector 2)Fast max (Detector 2)Slow max (Detector 2)Fast min (Detector 2)Slow min (Detector 2)PeakPeak-PeakLinear(f1 – f2)KBFmax
Direct:LinearPeakFast maxSlow maxFast minSlow minLinear(f1 – f2)
f1 = Lower freq. range (controlled by Setup > Frequency Settings > Bottom F. for Special Leq)
f2 = Upper freq. range (controlled by Setup > Frequency Settings > Top Freq. for Special Leq)
✐Please note: The parameter values shown are for single-channel templates. For 2-channel templates (Type 2270 only) the values are available for both Ch.1 and Ch.2
Level Trigger 2: Exactly the same parameters as Level Trigger 1
Level Trigger 3: Exactly the same parameters as Level Trigger 1
Level Trigger 4: Exactly the same parameters as Level Trigger 1
* For Enhanced Logging BZ-7225 templates only.† Up to four individual trigger settings can be set for non-overlapping time periods of the day.‡ Requires license for Signal Recording BZ-7226.
Table A.11 (Cont.) Trigger parameters*
Parameter Values Comment
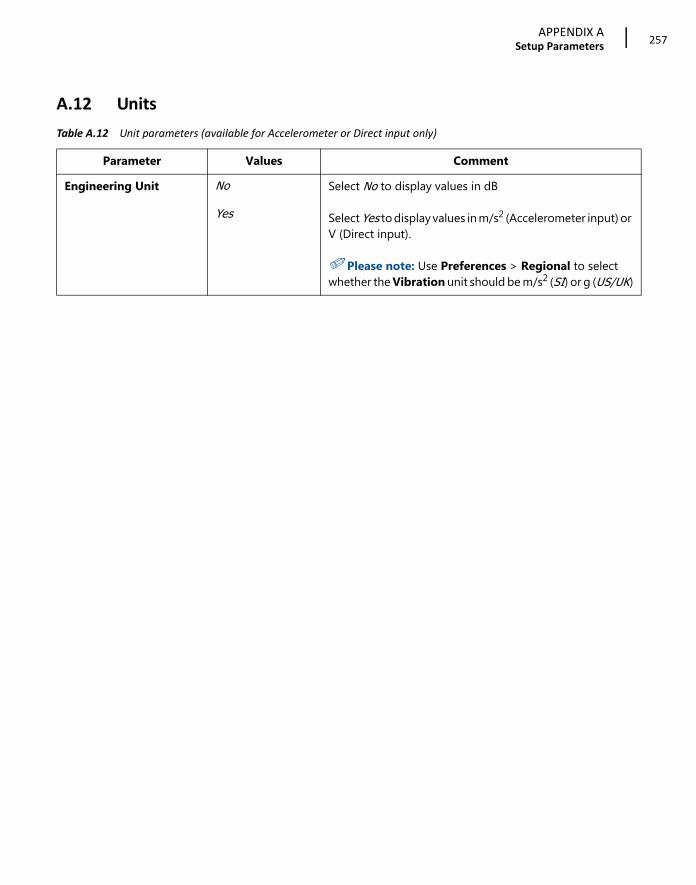
APPENDIX ASetup Parameters
257
A.12 Units
Table A.12 Unit parameters (available for Accelerometer or Direct input only)
Parameter Values Comment
Engineering Unit No
Yes
Select No to display values in dB
Select Yes to display values in m/s2 (Accelerometer input) or V (Direct input).
✐Please note: Use Preferences > Regional to select whether the Vibration unit should be m/s2 (SI) or g (US/UK)
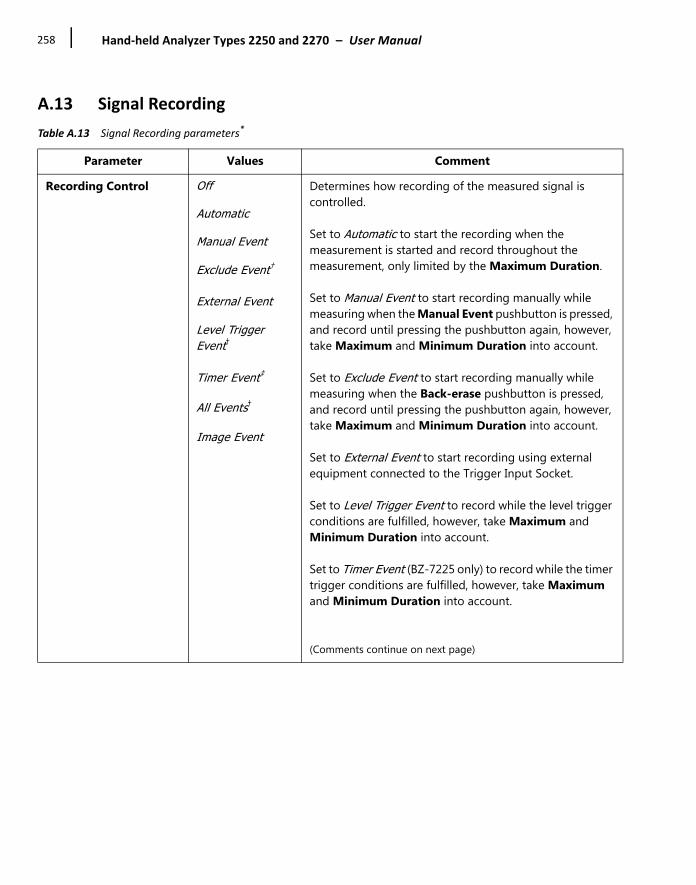
Hand‐held Analyzer Types 2250 and 2270 – User Manual258
A.13 Signal Recording
Table A.13 Signal Recording parameters*
Parameter Values Comment
Recording Control Off
Automatic
Manual Event
Exclude Event†
External Event
Level Trigger Event†
Timer Event‡
All Events†
Image Event
Determines how recording of the measured signal is controlled.
Set to Automatic to start the recording when the measurement is started and record throughout the measurement, only limited by the Maximum Duration.
Set to Manual Event to start recording manually while measuring when the Manual Event pushbutton is pressed, and record until pressing the pushbutton again, however, take Maximum and Minimum Duration into account.
Set to Exclude Event to start recording manually while measuring when the Back-erase pushbutton is pressed, and record until pressing the pushbutton again, however, take Maximum and Minimum Duration into account.
Set to External Event to start recording using external equipment connected to the Trigger Input Socket.
Set to Level Trigger Event to record while the level trigger conditions are fulfilled, however, take Maximum and Minimum Duration into account.
Set to Timer Event (BZ-7225 only) to record while the timer trigger conditions are fulfilled, however, take Maximum and Minimum Duration into account.
(Comments continue on next page)
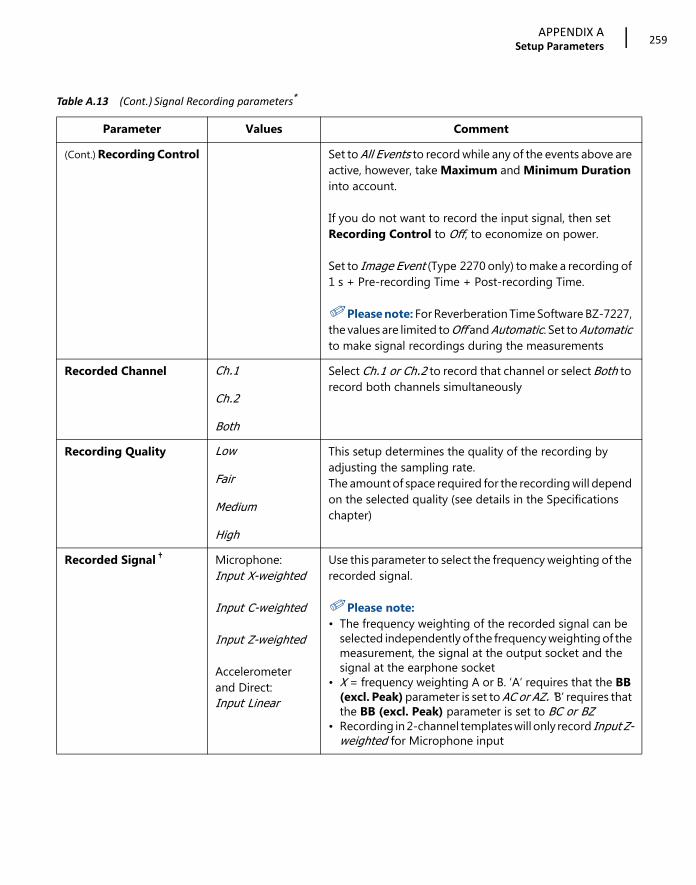
APPENDIX ASetup Parameters
259
(Cont.) Recording Control Set to All Events to record while any of the events above are active, however, take Maximum and Minimum Duration into account.
If you do not want to record the input signal, then set Recording Control to Off, to economize on power.
Set to Image Event (Type 2270 only) to make a recording of 1 s + Pre-recording Time + Post-recording Time.
✐Please note: For Reverberation Time Software BZ-7227, the values are limited to Off and Automatic. Set to Automatic to make signal recordings during the measurements
Recorded Channel Ch.1
Ch.2
Both
Select Ch.1 or Ch.2 to record that channel or select Both to record both channels simultaneously
Recording Quality Low
Fair
Medium
High
This setup determines the quality of the recording by adjusting the sampling rate.The amount of space required for the recording will depend on the selected quality (see details in the Specifications chapter)
Recorded Signal † Microphone: Input X-weighted
Input C-weighted
Input Z-weighted
Accelerometer and Direct:Input Linear
Use this parameter to select the frequency weighting of the recorded signal.
✐Please note: • The frequency weighting of the recorded signal can be
selected independently of the frequency weighting of the measurement, the signal at the output socket and the signal at the earphone socket
• X = frequency weighting A or B. ‘A’ requires that the BB (excl. Peak) parameter is set to AC or AZ. ‘B’ requires that the BB (excl. Peak) parameter is set to BC or BZ
• Recording in 2-channel templates will only record Input Z-weighted for Microphone input
Table A.13 (Cont.) Signal Recording parameters*
Parameter Values Comment
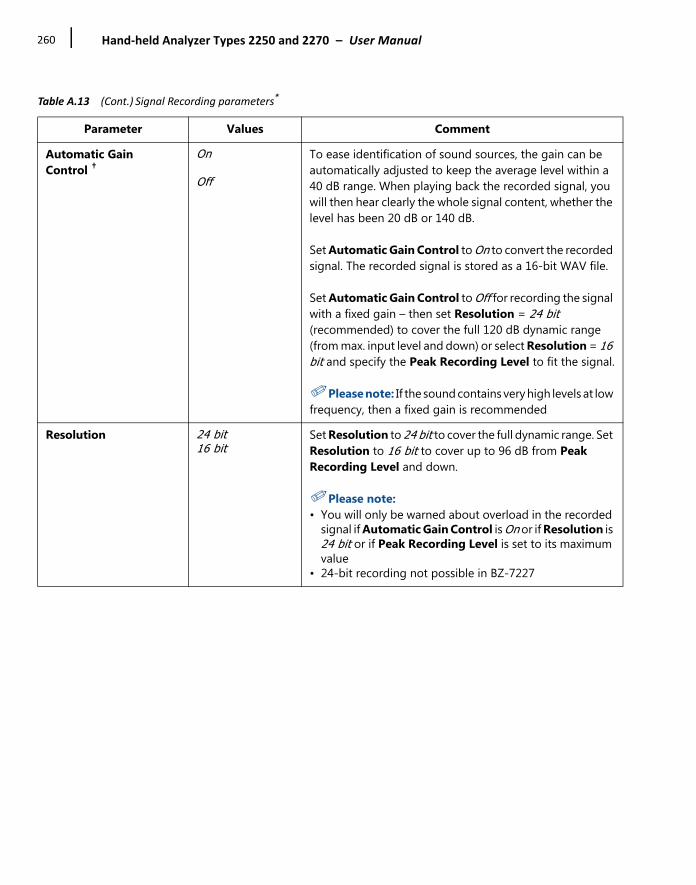
Hand‐held Analyzer Types 2250 and 2270 – User Manual260
Automatic Gain Control †
On
Off
To ease identification of sound sources, the gain can be automatically adjusted to keep the average level within a 40 dB range. When playing back the recorded signal, you will then hear clearly the whole signal content, whether the level has been 20 dB or 140 dB.
Set Automatic Gain Control to On to convert the recorded signal. The recorded signal is stored as a 16-bit WAV file.
Set Automatic Gain Control to Off for recording the signal with a fixed gain – then set Resolution = 24 bit (recommended) to cover the full 120 dB dynamic range (from max. input level and down) or select Resolution = 16 bit and specify the Peak Recording Level to fit the signal.
✐Please note: If the sound contains very high levels at low frequency, then a fixed gain is recommended
Resolution 24 bit16 bit
Set Resolution to 24 bit to cover the full dynamic range. Set Resolution to 16 bit to cover up to 96 dB from Peak Recording Level and down.
✐Please note:• You will only be warned about overload in the recorded
signal if Automatic Gain Control is On or if Resolution is 24 bit or if Peak Recording Level is set to its maximum value
• 24-bit recording not possible in BZ-7227
Table A.13 (Cont.) Signal Recording parameters*
Parameter Values Comment

APPENDIX ASetup Parameters
261
Peak Recording Level 145 dB135 dB125 dB115 dB105 dB95 dB85 dB75 dB
For Automatic Gain Control = Off and Resolution = 16 bit the recorded wave file has a dynamic range of up to 96 dB. When playing back on the analyzer, the dynamic range of the output is approx. 75 dB. When playing back on a PC it might be even lower. Set Peak Recording Level to fit the signal.The values for Peak Recording Level take the sensitivity of the attached transducer into account. The values shown in the list here are nominal values for a Type 4189 or 4190 microphone.
💡 Hint: Monitor the Lpeak value during a trial measurement before selecting the Peak Recording Level.
✐Please note: For recording in 2-channel templates the Peak Recording Level will automatically be set in accordance with Input > Range Setting (that is, High Range or Low Range)
Pre-recording Time † 0 to 470 s Recording is started the Pre-recording Time before the trigger conditions are fulfilled (for example, 5 s means the recording will be started 5 s before you hit the Manual Event pushbutton). This is possible because the recording is done continuously in an internal buffer, ready to be saved as a wave file. The Pre-recording Time is limited by this buffer size and the Recording Quality and Resolution (see details in the Specifications chapter)
Post-recording Time † 0 to 1:00:00:00 Use this parameter to specify how much extra you want to be recorded after the trigger conditions are no longer fulfilled
Duration Limit † On
Off
Use this parameter to enable the Minimum Duration and Maximum Duration parameters for overruling the duration of the signal recording determined by the trigger condition parameters
Minimum Duration † 00:00:00 to 1:00:00:00
When Duration Limit is On, then Minimum Duration will determine the minimum recording time regardless of the trigger conditions.The total record length will then (as a minimum) be the sum of Minimum Duration, Pre-recording Time and Post-recording Time
Table A.13 (Cont.) Signal Recording parameters*
Parameter Values Comment

Hand‐held Analyzer Types 2250 and 2270 – User Manual262
Maximum Duration † 00:00:00 to 7:00:00:00
When Duration Limit is set to On, then Maximum Duration will determine the maximum recording time regardless of the trigger conditions.The total record length will then (as a maximum) be the sum of Maximum Duration, Pre-recording Time and Post-recording Time.
✐Please note: If Maximum Duration = 00:00:00, then it is disabled and does not limit the duration
* Requires license for Signal Recording Option BZ-7226.† For Logging BZ-7224 and Enhanced Logging BZ-7225 templates only.‡ For Enhanced Logging BZ-7225 templates only.
Table A.13 (Cont.) Signal Recording parameters*
Parameter Values Comment
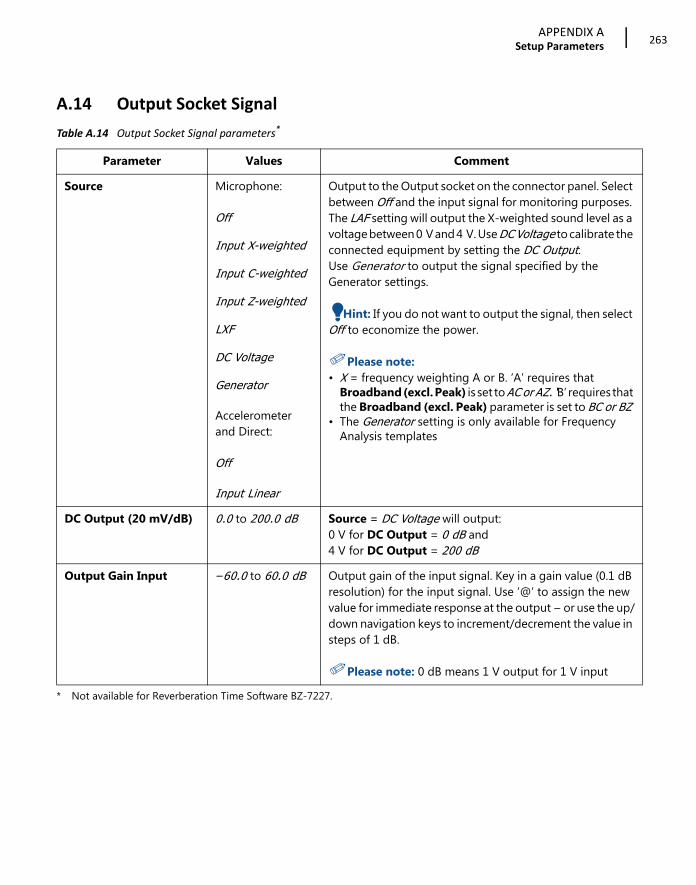
APPENDIX ASetup Parameters
263
A.14 Output Socket Signal
Table A.14 Output Socket Signal parameters*
* Not available for Reverberation Time Software BZ-7227.
Parameter Values Comment
Source Microphone:
Off
Input X-weighted
Input C-weighted
Input Z-weighted
LXF
DC Voltage
Generator
Accelerometer and Direct:
Off
Input Linear
Output to the Output socket on the connector panel. Select between Off and the input signal for monitoring purposes. The LAF setting will output the X-weighted sound level as a voltage between 0 V and 4 V. Use DC Voltage to calibrate the connected equipment by setting the DC Output.Use Generator to output the signal specified by the Generator settings.
💡 Hint: If you do not want to output the signal, then select Off to economize the power.
✐Please note: • X = frequency weighting A or B. ‘A’ requires that
Broadband (excl. Peak) is set to AC or AZ. ‘B’ requires that the Broadband (excl. Peak) parameter is set to BC or BZ
• The Generator setting is only available for Frequency Analysis templates
DC Output (20 mV/dB) 0.0 to 200.0 dB Source = DC Voltage will output: 0 V for DC Output = 0 dB and 4 V for DC Output = 200 dB
Output Gain Input –60.0 to 60.0 dB Output gain of the input signal. Key in a gain value (0.1 dB resolution) for the input signal. Use ‘@’ to assign the new value for immediate response at the output – or use the up/down navigation keys to increment/decrement the value in steps of 1 dB.
✐Please note: 0 dB means 1 V output for 1 V input

Hand‐held Analyzer Types 2250 and 2270 – User Manual264
A.15 Lden Periods
✐Please note: If Evening Start is set between Night Start and Day Start, then the Levening parameter willbe undefined.
Table A.15 Lden Periods parameters*
* For Enhanced Logging BZ-7225 templates and microphone input only.
Parameter Values Comment
Day Start 00:00:00 to 23:59:59
Determines the start of the day period for the Lday calculation
Evening Start 00:00:00 to 23:59:59
Determines the start of the evening period for the Levening calculation
Night Start 00:00:00 to 23:59:59
Determines the start of the night period for the Lnight calculation
Evening Penalty 0 to 20 dB The Evening Penalty will be added to Levening when calculating Lden
Night Penalty 0 to 20 dB The Night Penalty will be added to Lnight when calculating Lden

APPENDIX ASetup Parameters
265
A.16 Occupational Health
Table A.16 Occupational Health parameters*
Parameter Values Comment
Exposure Time 00:01:00 to 1.00:00:00
Set the Exposure Time to the actual time that you are exposed to noise during a workday. Used for calculation of Lep,d and Lep,d,v.
✐Please note: Exposure Time can be changed after the measurement has been done
Reference Time 00:01:00 to 5.00:00:00
Set the Reference Time as required for calculation of Sound Exposure Level or Time Weighed Average with a reference time other than 8 hours. Used for calculation of Lep,d,v and TWAv
Threshold Level 0 to 140 dB Any sound levels below the threshold value do not contribute to the Dose measurement data. The time resolution for this calculation is 1 s for calculation of Dose and ProjDose – and 10 ms for calculation of TWA, TWAv, DoseUQ and ProjDoseUQ.Used for calculation of Dose, ProjDose, TWA, TWAv, DoseUQ, ProjDoseUQ.U = Time Weighting for Lav: F or SQ = Exchange Rate for Lav: 4, 5 or 6 dB
Criterion Level 0 to 140 dB Criterion Level is the sound level allowed for an 8-hour period and would yield a 100% dose. The criterion level must be set according to the legislation with which you will have to comply.Used for calculation of Dose, ProjDose, DoseUQ, ProjDoseUQ.U = Time Weighting for Lav: F or SQ = Exchange Rate for Lav: 4, 5 or 6 dB
PeaksOver Level 0 to 200 dB Any peak levels that exceed the level set here will be counted.Used for calculation of #XPeaks(>NNNdB)X = A, B, C, Z or G, set by Setup > Frequency Settings > BB Peak, NNN is the PeaksOver Level
✐Please note: Two other peak counters are preset to count peaks over 135 dB and 137 dB, respectively

Hand‐held Analyzer Types 2250 and 2270 – User Manual266
A.17 Generator
Exchange Rate for Lav 4 dB
5 dB
6 dB
The increase in noise level that corresponds to a doubling of the noise level is determined by Exchange Rate for Lav. Set Exchange Rate for Lav as required by your local standards.Used for calculation of LavUQ, TWA, TWAv DoseUQ, ProjDoseUQ.U = Time Weighting for Lav: F or SQ = Exchange Rate for Lav: 4, 5 or 6 dB
✐Please note: TWA and TWAv require U = S and Q = 5
Time Weighting for Lav F
S
Lav will be time weighted in accordance with this parameter.Used for calculation of LavUQ, TWA, TWAv DoseUQ, ProjDoseUQ.U = Time Weighting for Lav: F or SQ = Exchange Rate for Lav: 4, 5 or 6 dB
✐Please note: TWA and TWAv require U = S and Q = 5
* Not available for Reverberation Time Software BZ-7227.
Table A.17 Generator parameters*
Parameter Values Comment
Generator Type Internal
External
Set to Internal to use the internal noise generator as specified below.
Set to External to switch an external generator on/off using a logic signal: On = 4.5 V; Off = 0 V.The generator signal appears at the Output Socket.
✐Please note: • For Reverberation Time Software BZ-7227, set
Measurement Control > Excitation = Interrupted Noise to enable the generator parameters.
• For Frequency Analysis Software BZ-7223, set Output Socket Signal > Source = Generator to enable the generator parameters
Table A.16 Occupational Health parameters*
Parameter Values Comment
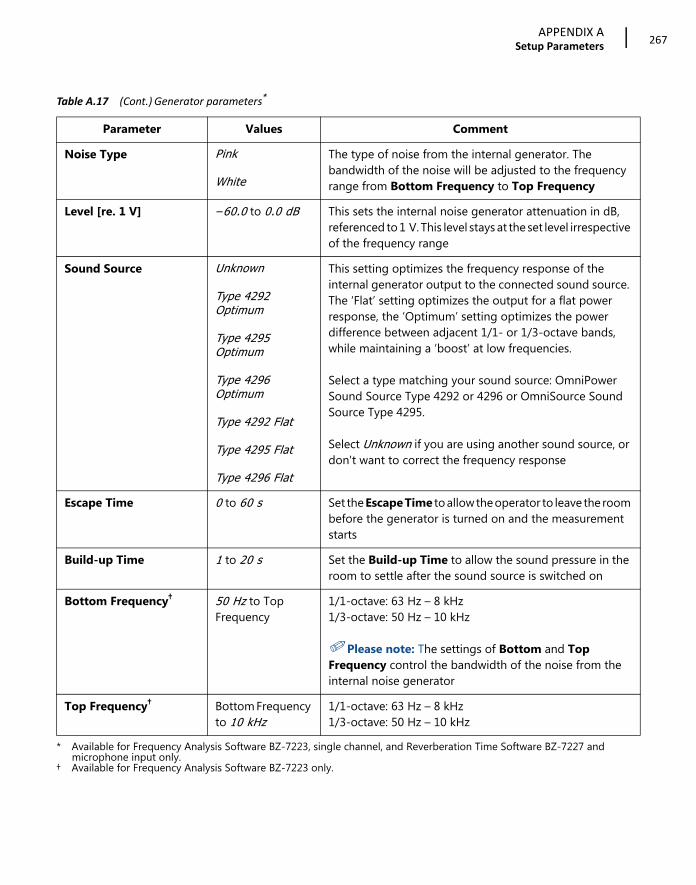
APPENDIX ASetup Parameters
267
Noise Type Pink
White
The type of noise from the internal generator. The bandwidth of the noise will be adjusted to the frequency range from Bottom Frequency to Top Frequency
Level [re. 1 V] –60.0 to 0.0 dB This sets the internal noise generator attenuation in dB, referenced to 1 V. This level stays at the set level irrespective of the frequency range
Sound Source Unknown
Type 4292 Optimum
Type 4295 Optimum
Type 4296 Optimum
Type 4292 Flat
Type 4295 Flat
Type 4296 Flat
This setting optimizes the frequency response of the internal generator output to the connected sound source. The ‘Flat’ setting optimizes the output for a flat power response, the ‘Optimum’ setting optimizes the power difference between adjacent 1/1- or 1/3-octave bands, while maintaining a ‘boost’ at low frequencies.
Select a type matching your sound source: OmniPower Sound Source Type 4292 or 4296 or OmniSource Sound Source Type 4295.
Select Unknown if you are using another sound source, or don't want to correct the frequency response
Escape Time 0 to 60 s Set the Escape Time to allow the operator to leave the room before the generator is turned on and the measurement starts
Build-up Time 1 to 20 s Set the Build-up Time to allow the sound pressure in the room to settle after the sound source is switched on
Bottom Frequency† 50 Hz to Top Frequency
1/1-octave: 63 Hz – 8 kHz1/3-octave: 50 Hz – 10 kHz
✐Please note: The settings of Bottom and Top Frequency control the bandwidth of the noise from the internal noise generator
Top Frequency† Bottom Frequency to 10 kHz
1/1-octave: 63 Hz – 8 kHz1/3-octave: 50 Hz – 10 kHz
* Available for Frequency Analysis Software BZ-7223, single channel, and Reverberation Time Software BZ-7227 andmicrophone input only.
† Available for Frequency Analysis Software BZ-7223 only.
Table A.17 (Cont.) Generator parameters*
Parameter Values Comment
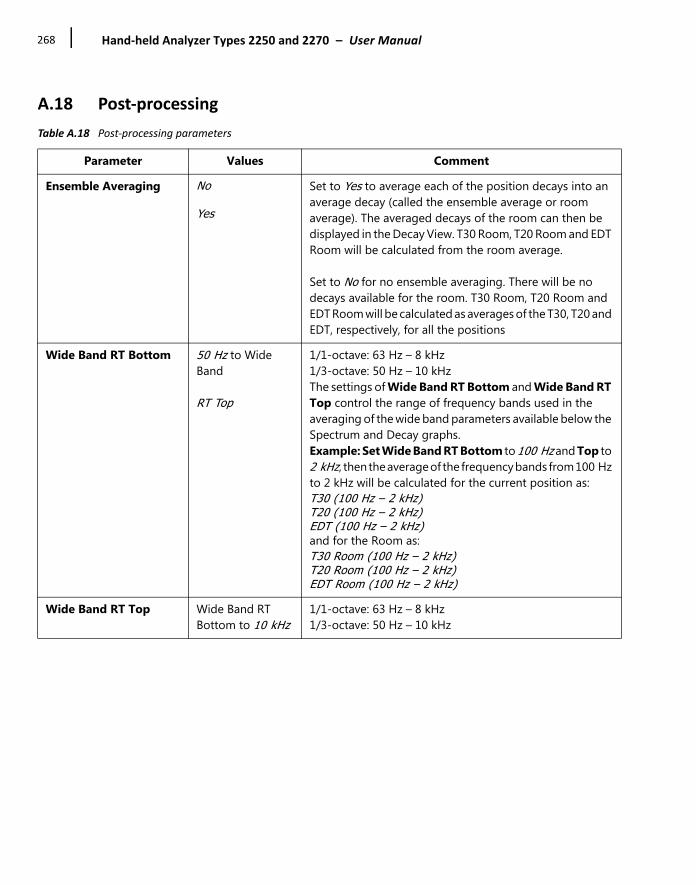
Hand‐held Analyzer Types 2250 and 2270 – User Manual268
A.18 Post‐processing
Table A.18 Post‐processing parameters
Parameter Values Comment
Ensemble Averaging No
Yes
Set to Yes to average each of the position decays into an average decay (called the ensemble average or room average). The averaged decays of the room can then be displayed in the Decay View. T30 Room, T20 Room and EDT Room will be calculated from the room average.
Set to No for no ensemble averaging. There will be no decays available for the room. T30 Room, T20 Room and EDT Room will be calculated as averages of the T30, T20 and EDT, respectively, for all the positions
Wide Band RT Bottom 50 Hz to Wide Band
RT Top
1/1-octave: 63 Hz – 8 kHz1/3-octave: 50 Hz – 10 kHzThe settings of Wide Band RT Bottom and Wide Band RT Top control the range of frequency bands used in the averaging of the wide band parameters available below the Spectrum and Decay graphs.Example: Set Wide Band RT Bottom to 100 Hz and Top to 2 kHz, then the average of the frequency bands from 100 Hz to 2 kHz will be calculated for the current position as:T30 (100 Hz – 2 kHz)T20 (100 Hz – 2 kHz)EDT (100 Hz – 2 kHz) and for the Room as:T30 Room (100 Hz – 2 kHz)T20 Room (100 Hz – 2 kHz)EDT Room (100 Hz – 2 kHz)
Wide Band RT Top Wide Band RT Bottom to 10 kHz
1/1-octave: 63 Hz – 8 kHz1/3-octave: 50 Hz – 10 kHz

APPENDIX ASetup Parameters
269
A.19 Tone Assessment
Table A.19 Tone assessment parameters
Parameter Values Comment
Tone Assessment On
Off
Set Tone Assessment to On to enable tone assessment functionality, then select the Tone parameter above the spectrum to display the results
Tone Standard ISO 1996:2-2007
DM 16-03-1998
Set the Tone Standard in accordance with your requirements:• ISO 1996:2-2007, Annex D is the objective method for
assessing the audibility of tones in noise – simplified method. This method uses 1/3-octave spectra
• DM 16-03-1998 assesses tone using 1/3-octave spectra according to Italian Law: Ministero dell’Ambiente, Decreto 16 marzo 1998
Adjustment 0.0 to 20 dB This is the adjustment you should add to LAeq if audible tones are found in the spectrum. The resulting adjustment can be read below the spectrum.
✐Please note: The adjustment is fixed to 5 dB in the DM 16-03-1998 standard
Low Freq. Last Band 12.5 to 315 Hz Set the frequency for the last band of the low frequency range of the assessment. Default is 125 Hz.The low frequency range is from the lowest measured frequency band to the value of the Low Freq. Last Band parameter.
✐Please note: Only available if Tone Standard is set to ISO 1996:2-2007
Middle Freq. Last Band 160 Hz to 20 kHz Set the frequency for the last band of the middle frequency range of the assessment. Default is 400 Hz.The middle frequency range is from one band higher than the Low Freq. Last Band parameter to the value of the Middle Freq. Last Band parameter.
✐Please note: Only available if Tone Standard is set to ISO 1996:2-2007

Hand‐held Analyzer Types 2250 and 2270 – User Manual270
Level Difference Low 0.1 to 100.0 dB Set the required level difference for detecting a tone in the low frequency range. Default is 15 dB.
✐Please note: Only available if Tone Standard is set to ISO 1996:2-2007
Level Difference Middle 0.1 to 100.0 dB Set the required level difference for detecting a tone in the middle frequency range. Default is 8 dB.
✐Please note: Only available if Tone Standard is set to ISO 1996:2-2007
Level Difference High 0.1 to 100.0 dB Set the required level difference for detecting a tone in the high frequency range. Default is 5 dB.
✐Please note: Only available if Tone Standard is set to ISO 1996:2-2007
ISO 226 1987 Free-field
1987 Diffuse-field
2003 Free-field
The tone is checked against levels in other frequency bands using normal equal loudness level contours defined by ISO 226. Select here which version of the standard to use.
✐Please note: Only available if Tone Standard is set to DM 16-03-1998
Table A.19 Tone assessment parameters
Parameter Values Comment

APPENDIX ASetup Parameters
271
A.20 RPM Measurements
Table A.20 RPM and tacho parameters for RPM measurements
Parameter Values Comment
Tacho OnOff
When Tacho is On, RPM measurements are done on the signal connected to Trigger input. The parameters for External Level, Hysteresis, Slope and CCLD/Pull Up are used for finding the tacho pulses – these are used to measure the RPM.When Tacho is Off, no RPM is measured
RPM Gear Ratio 10–5 to 1038 The displayed RPM are the measured RPM divided by the RPM Gear Ratio
External Level –20 to 20 V Determines the level of the signal applied on the trigger input that will cause a trigger. This parameter is enabled when Trigger Type is set to None/Tacho and Tacho is set to On.When setting the trigger level, please take a small offset at the trigger input into account. Typical values for the offset are between –70 mV and 200 mV
Hysteresis 0 to 10 V Determines the hysteresis on the external trigger. This parameter is enabled when Trigger Type is set to None/Tacho and Tacho is set to On
Slope RisingFalling
Determines the trigger slope on the external trigger. This parameter is enabled when Trigger Type is set to None/Tacho and Tacho is set to On
CCLD/Pull Up OnOff
For instruments with serial number 2630266 and above, this parameter is named CCLD. Use this parameter to switch on or off a CCLD power supply, depending on the requirements of the equipment you connect to the Trigger Input.
✐Please note: Laser Tachometer Probe MM-0360 requires CCLD set to On.
For instruments with serial number below 2630266, the parameter is named Pull Up. Use this parameter to ‘pull up’ the trigger input to +5 V (via a 7.5 k resistor). The CCLD/Pull Up parameter is enabled when Trigger Type is set to External or Tacho is set to On

Hand‐held Analyzer Types 2250 and 2270 – User Manual272
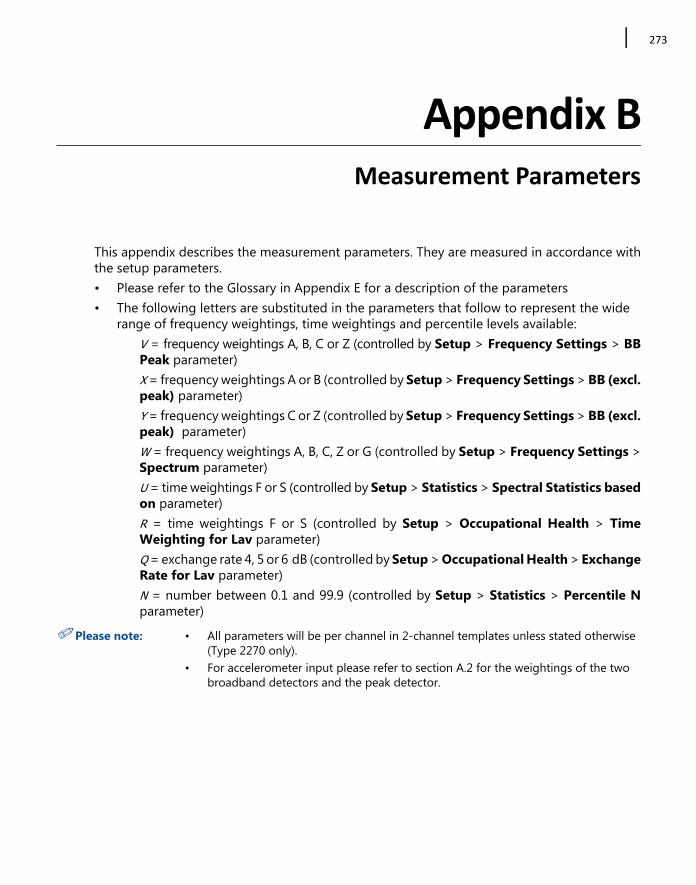
273
Appendix BMeasurement Parameters
This appendix describes the measurement parameters. They are measured in accordance withthe setup parameters.• Please refer to the Glossary in Appendix E for a description of the parameters• The following letters are substituted in the parameters that follow to represent the wide
range of frequency weightings, time weightings and percentile levels available:V = frequency weightings A, B, C or Z (controlled by Setup > Frequency Settings > BBPeak parameter)X = frequency weightings A or B (controlled by Setup > Frequency Settings > BB (excl.peak) parameter)Y = frequency weightings C or Z (controlled by Setup > Frequency Settings > BB (excl.peak) parameter)W = frequency weightings A, B, C, Z or G (controlled by Setup > Frequency Settings >Spectrum parameter)U = time weightings F or S (controlled by Setup > Statistics > Spectral Statistics basedon parameter)R = time weightings F or S (controlled by Setup > Occupational Health > TimeWeighting for Lav parameter)Q = exchange rate 4, 5 or 6 dB (controlled by Setup > Occupational Health > ExchangeRate for Lav parameter)N = number between 0.1 and 99.9 (controlled by Setup > Statistics > Percentile Nparameter)
✐Please note: • All parameters will be per channel in 2-channel templates unless stated otherwise (Type 2270 only).
• For accelerometer input please refer to section A.2 for the weightings of the two broadband detectors and the peak detector.

Hand‐held Analyzer Types 2250 and 2270 – User Manual274
B.1 Total Measurement (Microphone Input)
B.1.1 For Sound Level Meter Software BZ‐7222, Frequency Analysis Software BZ‐7223, Logging Software BZ‐7224 and Enhanced Logging Software BZ‐7225
The following parameters are measured within the Elapsed Time:Equivalent continuous sound levels:• LXeq • LYeq • LCeq – LAeq • LAeq,T1,mov (not saved with data) • LAeq,T1,mov,max • LAeq,T2,mov (not saved with data) • LAeq,T2,mov,max • LCeq,T1,mov (not saved with data) • LCeq,T1,mov,max • LCeq,T2,mov (not saved with data) • LCeq,T2,mov,max • ∆Leq,T1,mov (not saved with data) • ∆Leq,T1,mov,max • ∆Leq,T2,mov (not saved with data) • ∆Leq,T2,mov,max Sound exposure level:• LXE • LYE Peak sound level:• LVpeak • TVpeak Maximum time-weighted sound levels:• LXFmax • LXSmax • LXImax • LYFmax • LYSmax • LYImax
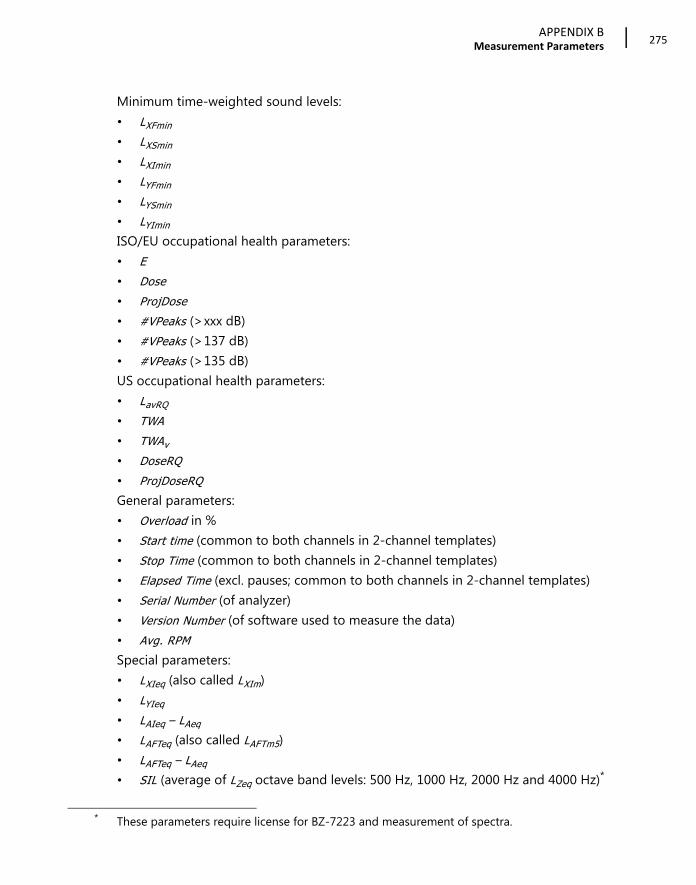
APPENDIX BMeasurement Parameters
275
Minimum time-weighted sound levels:• LXFmin • LXSmin • LXImin • LYFmin • LYSmin • LYImin ISO/EU occupational health parameters:• E • Dose • ProjDose • #VPeaks (>xxx dB) • #VPeaks (>137 dB) • #VPeaks (>135 dB) US occupational health parameters:• LavRQ • TWA • TWAv • DoseRQ • ProjDoseRQ General parameters:• Overload in % • Start time (common to both channels in 2-channel templates) • Stop Time (common to both channels in 2-channel templates) • Elapsed Time (excl. pauses; common to both channels in 2-channel templates) • Serial Number (of analyzer)• Version Number (of software used to measure the data)• Avg. RPM
Special parameters:• LXIeq (also called LXIm) • LYIeq • LAIeq – LAeq • LAFTeq (also called LAFTm5) • LAFTeq – LAeq • SIL (average of LZeq octave band levels: 500 Hz, 1000 Hz, 2000 Hz and 4000 Hz)*
* These parameters require license for BZ-7223 and measurement of spectra.

Hand‐held Analyzer Types 2250 and 2270 – User Manual276
• PSIL (average of LZeq octave band levels: 500 Hz, 1000 Hz and 2000 Hz)*• SIL3 (average of LZeq octave band levels: 1000 Hz, 2000 Hz and 4000 Hz)*• LWeq(f1 – f2) (sum of power values for LWeq frequency bands from f1 Hz to f2 Hz)*Noise indicators*:• Lday
• Levening
• Lnight• Lden• Ldn
Statistics to calculate percentile levels and std.dev.Low-frequency parameters (requires Enhanced Vibration and Low-frequency OptionBZ-7234):• LGeq• LG10max• LG10min• LGpeak• TGpeak• #GPeaks (>xxx dB)• #GPeaks (>137 dB)• #GPeaks (>135 dB)Weather data (requires connection to a weather station; common to both channels in2-channel templates):• Wind Dir. avg.
• Wind Dir. min.
• Wind Dir. max.
• Wind Speed avg.
• Wind Speed min.
• Wind Speed max.
• Amb. Temperature
• Amb. Humidity
• Amb. Pressure
• Rainfall
Spectrum parameters*:• LWeq • LWFmax • LWSmax
* These parameters are available for Enhanced Logging BZ-7225 only.

APPENDIX BMeasurement Parameters
277
• LWFmin • LWSmin Statistics to calculate percentile levels as spectra*
CIC results*:• CIC 1 Result • CIC 1 Dev. from Reference • CIC 2 Result
• CIC 2 Dev. from Reference • CIC 3 Result†
• CIC 3 Dev. f rom Reference† • CIC 4 Result† • CIC 4 Dev. f rom Reference† In addition to the parameters saved within the data (listed above), the following can beinserted in a project annotation as a GPS note:• Position as latitude and longitude• Altitude
• Position error (dependant on type of GPS unit)
B.2 Periodic Reports (Microphone Input)
B.2.1 For Enhanced Logging Software BZ‐7225
Parameters measured within a Periodic Report interval:Equivalent continuous sound levels:• LXeq • LYeq • LCeq – LAeq • LAeq,T1,mov,max
• LAeq,T2,mov,max • LCeq,T1,mov ,max
• LCeq,T2,mov ,max
• ∆Leq,T,mov ,max
• ∆Leq,T,mov ,max
* These parameters are available for Logging BZ-7224 only.† These parameters are available for Enhanced Logging BZ-7225 only.

Hand‐held Analyzer Types 2250 and 2270 – User Manual278
Sound exposure level:• LXE • LYE Peak sound level:• LVpeak • TVpeakMaximum time-weighted sound levels:• LXFmax • LXSmax • LXImax • LYFmax • LYSmax • LYImax Minimum time-weighted sound levels:• LXFmin • LXSmin • LXImin • LYFmin • LYSmin • LYImin ISO/EU occupational health parameters:• E
• Dose
• ProjDose
• #VPeaks (>xxx dB)• #VPeaks (>137 dB)• #VPeaks (>135 dB)US occupational health parameters:• LavRQ • TWA
• TWAv• DoseRQ
• ProjDoseRQ
General parameters:• Overload in %• Start time (common to both channels in 2-channel templates)• Stop Time (common to both channels in 2-channel templates)

APPENDIX BMeasurement Parameters
279
• Elapsed Time (excl. pauses; common to both channels in 2-channel templates)• Avg. RPM
Special parameters:• LXIeq (also called LXIm)• LYIeq • LAIeq – LAeq • LAFTeq (also called LAFTm5 )• LAFTeq – LAeq • SIL (average of LZeq octave band levels: 500 Hz, 1000 Hz, 2000 Hz and 4000 Hz)*• PSIL (average of LZeq octave band levels: 500 Hz, 1000 Hz and 2000 Hz)*• SIL3 (average of LZeq octave band levels: 1000 Hz, 2000 Hz and 4000 Hz)*• LWeq(f1 – f2) (sum of power values for LWeq frequency bands from f1 Hz to f2 Hz)*Statistics to calculate percentile levels and std.dev.Low-frequency parameters (requires Enhanced Vibration and Low-frequency OptionBZ-7234):• LGeq • LG10max • LG10min • LGpeak • TGpeak • #GPeaks (>xxx dB) • #GPeaks (>137 dB) • #GPeaks (> 135 dB) Weather data (requires connection to a weather station; common to both channels in 2-channel templates):• Wind Dir. avg. • Wind Dir. min. • Wind Dir. max. • Wind Speed avg. • Wind Speed min. • Wind Speed max. • Amb. Temperature • Amb. Humidity • Amb. Pressure • Rainfall
* These parameters require license for BZ-7223 and measurement of spectra.
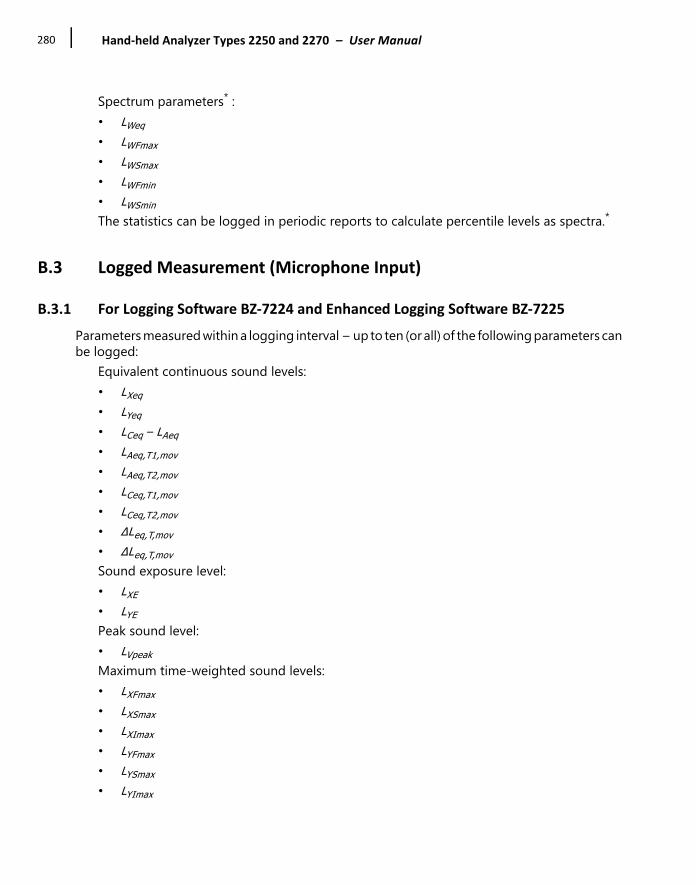
Hand‐held Analyzer Types 2250 and 2270 – User Manual280
Spectrum parameters* :• LWeq • LWFmax • LWSmax • LWFmin • LWSmin The statistics can be logged in periodic reports to calculate percentile levels as spectra.*
B.3 Logged Measurement (Microphone Input)
B.3.1 For Logging Software BZ‐7224 and Enhanced Logging Software BZ‐7225
Parameters measured within a logging interval – up to ten (or all) of the following parameters canbe logged:
Equivalent continuous sound levels:• LXeq • LYeq • LCeq – LAeq • LAeq,T1,mov • LAeq,T2,mov • LCeq,T1,mov • LCeq,T2,mov • ∆Leq,T,mov • ∆Leq,T,mov Sound exposure level:• LXE • LYE Peak sound level:• LVpeak Maximum time-weighted sound levels:• LXFmax • LXSmax • LXImax • LYFmax • LYSmax • LYImax

APPENDIX BMeasurement Parameters
281
Minimum time-weighted sound levels:• LXFmin • LXSmin • LXImin • LYFmin • LYSmin • LYImin US occupational health parameters:• LavRQ Special parameters:• LXIeq (also called LXIm)• LYIeq • LAIeq – LAeq • LAFTeq (also called LAFTm5 )• LAFTeq – LAeq • SIL (average of LZeq octave band levels: 500 Hz, 1000 Hz, 2000 Hz and 4000 Hz)*• PSIL (average of LZeq octave band levels: 500 Hz, 1000 Hz and 2000 Hz)*• SIL3 (average of LZeq octave band levels: 1000 Hz, 2000 Hz and 4000 Hz)*• LWeq(f1 – f2) (sum of power values for LWeq frequency bands from f1 Hz to f2 Hz)*• Avg. RPM
Voltage updated at approx. 5 s intervals and logged with logging period intervals:• Trig. Input Voltage (requires Trigger Input is set to Voltage for Monitoring)The following parameters are available per set of logged parameters:• Overload in % • Start time (common to both channels in 2-channel templates)• Stop Time (common to both channels in 2-channel templates)• Elapsed Time (excl. pauses; common to both channels in 2-channel templates)The Statistics can be logged to calculate percentile levels and std.dev. per logging interval.Low-frequency parameters (requires Enhanced Vibration and Low-frequency OptionBZ-7234):• LGeq • LG10max • LG10min • LGpeak
* These parameters require license for BZ-7223 and measurement of spectra.
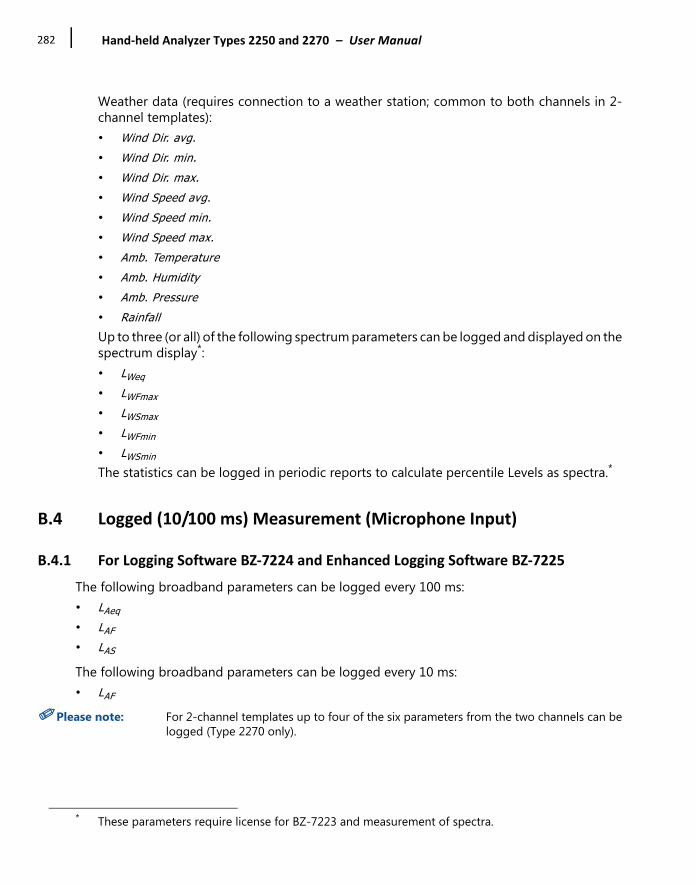
Hand‐held Analyzer Types 2250 and 2270 – User Manual282
Weather data (requires connection to a weather station; common to both channels in 2-channel templates):• Wind Dir. avg. • Wind Dir. min. • Wind Dir. max. • Wind Speed avg. • Wind Speed min. • Wind Speed max. • Amb. Temperature • Amb. Humidity • Amb. Pressure • Rainfall Up to three (or all) of the following spectrum parameters can be logged and displayed on thespectrum display*:• LWeq • LWFmax • LWSmax • LWFmin • LWSmin The statistics can be logged in periodic reports to calculate percentile Levels as spectra.*
B.4 Logged (10/100 ms) Measurement (Microphone Input)
B.4.1 For Logging Software BZ‐7224 and Enhanced Logging Software BZ‐7225
The following broadband parameters can be logged every 100 ms:• LAeq • LAF • LAS
The following broadband parameters can be logged every 10 ms:• LAF
✐Please note: For 2-channel templates up to four of the six parameters from the two channels can belogged (Type 2270 only).
* These parameters require license for BZ-7223 and measurement of spectra.

APPENDIX BMeasurement Parameters
283
B.5 Instantaneous Measured Parameters (available at any time; Microphone Input)
Instantaneous time-weighted sound levels:• LXF • LXS • LXI • LYF • LYS • LYI
Sound pressure levels (maximum time-weighted sound levels once per second):• LXF(SPL) • LXS(SPL) • LXI(SPL) • LYF(SPL) • LYS(SPL) • LYI(SPL)
Peak sound levels (maximum peak sound level once per second):• LVpeak,1s
Low-frequency parameters (requires Enhanced Vibration and Low-frequency Option BZ-7234):• LG10 • LGpeak,1s
Voltage updated at approx. 5 s intervals (common to both channels in 2-channel templates):• Trig. Input Voltage (requires Trigger Input is set to Voltage for Monitoring)Instantaneous RPM:• Inst. RPM
Instantaneous weather data (common to both channels in 2-channel templates):• Wind Dir. • Wind Speed Instantaneous GPS data (common to both channels in 2-channel templates):• Latitude • Longitude
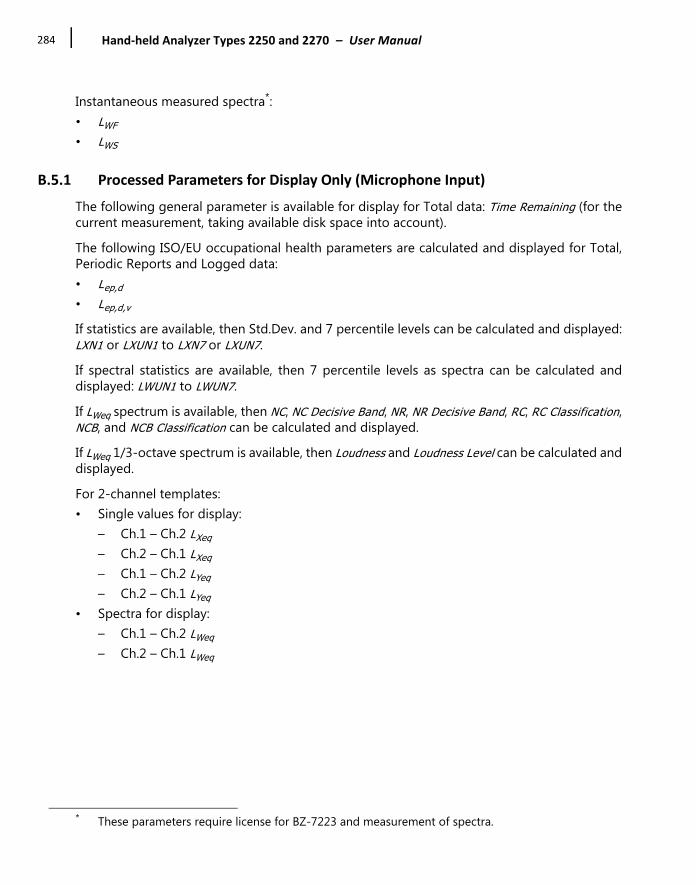
Hand‐held Analyzer Types 2250 and 2270 – User Manual284
Instantaneous measured spectra*:• LWF • LWS
B.5.1 Processed Parameters for Display Only (Microphone Input)
The following general parameter is available for display for Total data: Time Remaining (for thecurrent measurement, taking available disk space into account).The following ISO/EU occupational health parameters are calculated and displayed for Total,Periodic Reports and Logged data:• Lep,d • Lep,d,v If statistics are available, then Std.Dev. and 7 percentile levels can be calculated and displayed:LXN1 or LXUN1 to LXN7 or LXUN7.If spectral statistics are available, then 7 percentile levels as spectra can be calculated anddisplayed: LWUN1 to LWUN7.If LWeq spectrum is available, then NC, NC Decisive Band, NR, NR Decisive Band, RC, RC Classification,NCB, and NCB Classification can be calculated and displayed.If LWeq 1/3-octave spectrum is available, then Loudness and Loudness Level can be calculated anddisplayed.For 2-channel templates:• Single values for display:
– Ch.1 – Ch.2 LXeq – Ch.2 – Ch.1 LXeq – Ch.1 – Ch.2 LYeq – Ch.2 – Ch.1 LYeq
• Spectra for display:– Ch.1 – Ch.2 LWeq – Ch.2 – Ch.1 LWeq
* These parameters require license for BZ-7223 and measurement of spectra.

APPENDIX BMeasurement Parameters
285
B.6 Total Measurement (Accelerometer and Direct Input)
B.6.1 For Sound Level Meter Software BZ‐7222, Frequency Analysis Software BZ‐7223, Logging Software BZ‐7224 and Enhanced Logging Software BZ‐7225
The following parameters are measured within the elapsed time:Linear averaged levels:• Linear • Linear det. 2 (accelerometer input only)Peak levels:• Peak • TPeak • Peak-Peak (requires BZ-7234, accelerometer input only)Maximum time-weighted levels:• Fast max • Slow max • Fast max det. 2 (accelerometer input only)• Slow max det. 2 (accelerometer input only) Minimum time-weighted levels:• Fast min • Slow min • Fast min det. 2 (accelerometer input only)• Slow min det. 2 (accelerometer input only)General parameters:• Overload in % • Start time (common to both channels in 2-channel templates) • Stop Time (common to both channels in 2-channel templates) • Elapsed Time (excl. pauses; common to both channels in 2-channel templates)• Crest Factor • Avg. RPM Special parameters:• Linear(f1 – f2) (sum of power values for Linear frequency bands from f1 Hz to f2 Hz)* Low-frequency parameters (requires Enhanced Vibration and Low-frequency OptionBZ-7234 and accelerometer input):• MTVV • KBFmax
* These parameters require a license for BZ-7223 and spectra measurement.
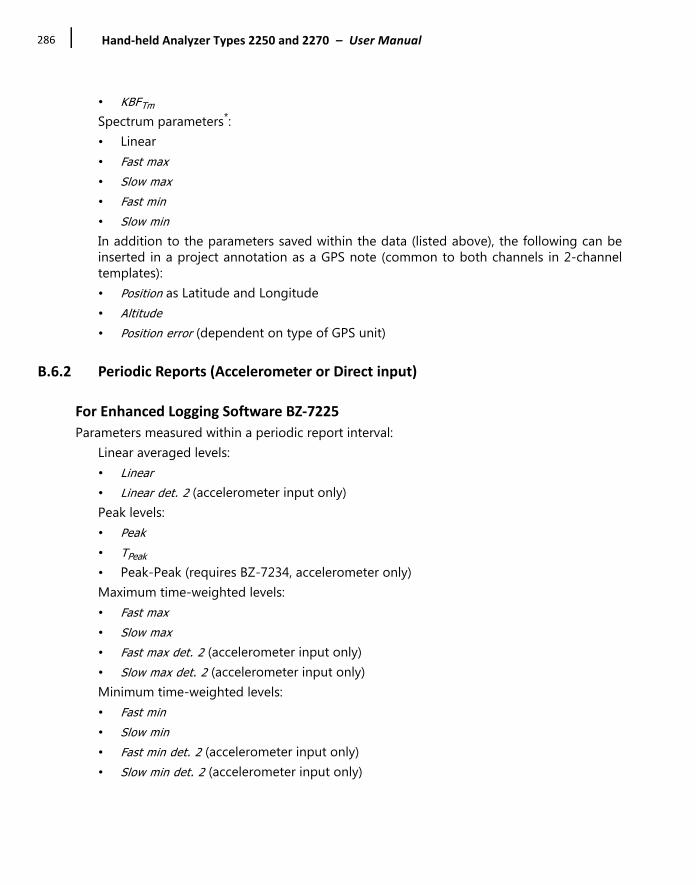
Hand‐held Analyzer Types 2250 and 2270 – User Manual286
• KBFTm Spectrum parameters*:• Linear• Fast max • Slow max • Fast min • Slow min In addition to the parameters saved within the data (listed above), the following can beinserted in a project annotation as a GPS note (common to both channels in 2-channeltemplates):• Position as Latitude and Longitude • Altitude • Position error (dependent on type of GPS unit)
B.6.2 Periodic Reports (Accelerometer or Direct input)
For Enhanced Logging Software BZ‐7225
Parameters measured within a periodic report interval:Linear averaged levels:• Linear • Linear det. 2 (accelerometer input only)Peak levels:• Peak • TPeak • Peak-Peak (requires BZ-7234, accelerometer only)Maximum time-weighted levels:• Fast max • Slow max • Fast max det. 2 (accelerometer input only)• Slow max det. 2 (accelerometer input only) Minimum time-weighted levels:• Fast min • Slow min • Fast min det. 2 (accelerometer input only)• Slow min det. 2 (accelerometer input only)

APPENDIX BMeasurement Parameters
287
General parameters:• Overload in % • Start time (common to both channels in 2-channel templates) • Stop Time (common to both channels in 2-channel templates) • Elapsed Time (excl. pauses; common to both channels in 2-channel templates)• Crest Factor • Avg. RPM Special parameters:• Linear(f1 – f2) (sum of power values for Linear frequency bands from f1 Hz to f2 Hz)* Low-frequency parameters (requires Enhanced Vibration and Low-frequency OptionBZ-7234 and accelerometer input):• MTVV • KBFmax • KBFTm Spectrum parameters*:• Linear
• Fast max • Slow max • Fast min • Slow min
B.6.3 Logged Measurement (Accelerometer or Direct input)
For Logging Software BZ‐7224 and Enhanced Logging Software BZ‐7225
Parameters measured within a logging interval - up to five (or all) of the following parameters canbe logged:
Linear averaged levels:• Linear • Linear det. 2 (accelerometer input only)Peak levels:• Peak • Peak-Peak (requires BZ-7234, accelerometer only)Maximum time-weighted levels:• Fast max • Slow max • Fast max det. 2 (accelerometer input only)
* These parameters require a license for BZ-7223 and spectra measurement.
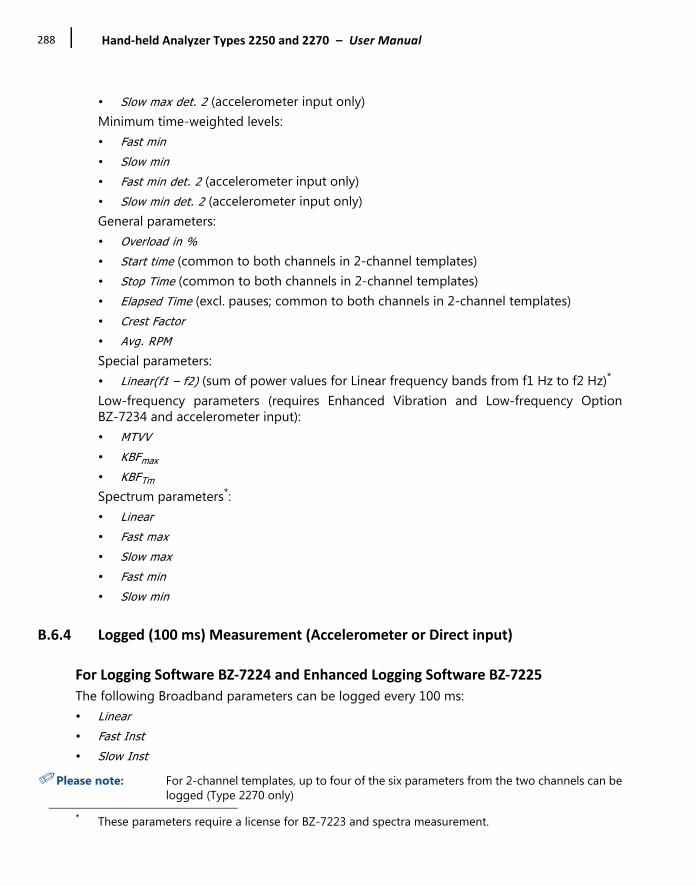
Hand‐held Analyzer Types 2250 and 2270 – User Manual288
• Slow max det. 2 (accelerometer input only) Minimum time-weighted levels:• Fast min • Slow min • Fast min det. 2 (accelerometer input only)• Slow min det. 2 (accelerometer input only) General parameters:• Overload in % • Start time (common to both channels in 2-channel templates) • Stop Time (common to both channels in 2-channel templates) • Elapsed Time (excl. pauses; common to both channels in 2-channel templates)• Crest Factor • Avg. RPM Special parameters:• Linear(f1 – f2) (sum of power values for Linear frequency bands from f1 Hz to f2 Hz)* Low-frequency parameters (requires Enhanced Vibration and Low-frequency OptionBZ-7234 and accelerometer input):• MTVV • KBFmax • KBFTm Spectrum parameters*:• Linear • Fast max • Slow max • Fast min • Slow min
B.6.4 Logged (100 ms) Measurement (Accelerometer or Direct input)
For Logging Software BZ‐7224 and Enhanced Logging Software BZ‐7225
The following Broadband parameters can be logged every 100 ms:• Linear • Fast Inst • Slow Inst
✐Please note: For 2-channel templates, up to four of the six parameters from the two channels can belogged (Type 2270 only)
* These parameters require a license for BZ-7223 and spectra measurement.

APPENDIX BMeasurement Parameters
289
B.6.5 Instantaneous Measured Parameters (Available at Any Time; Accelerometer or Direct input)
Instantaneous time-weighted levels:• Fast Inst • Slow Inst Low-frequency parameters (requires Enhanced Vibration and Low-frequency Option BZ-7234and accelerometer input):• aW,1s • KBF Voltage updated at approx. 5 s intervals (common to both channels in 2-channel templates):• Trig. Input Voltage (requires Trigger Input is set to Voltage for Monitoring)Instantaneous RPM:• Inst. RPM
Instantaneous GPS data (common to both channels in 2-Ch. templates):• Latitude • Longitude Instantaneous measured spectra*:• Fast Inst • Slow Inst
Processed Parameters for Display Only (Accelerometer or Direct input)
The following general parameter is available for display for total data: • Time Remaining (for the current measurement, taking available disk space into account)For 2-channel templates:• Single values for display:
– Ch.1 – Ch.2 Linear – Ch.2 – Ch.1 Linear – Ch.1 – Ch.2 Linear det. 2 (accelerometer input only) – Ch.2 – Ch.1 Linear det. 2 (accelerometer input only)
• Spectra for display: – Ch.1 – Ch.2 Linear – Ch.2 – Ch.1 Linear
* These parameters require a license for BZ-7223 and spectra measurement.

Hand‐held Analyzer Types 2250 and 2270 – User Manual290
B.6.6 Relationship Between Setup and Measurement Parameters
The measurement parameters are measured in accordance with the setup parameters. Thefollowing tables describe the relationship between the setup and measurement parameters.
Table B.1 General parameters
Table B.2 Noise indicators and statistics
Parameter LXeq LXE LXIeq LAFTeq LVpeak TVpeak LXYmax LXYminSound Field Correction
Windscreen Correction
Low Frequency
Broadband(excl. Peak)
Broadband Peak
Parameter Lday Levening Lnight Lden Ldn LXYNSound Field Correction
Windscreen Correction
Low Frequency
Broadband(excl. Peak) A A A A A
Broadband Statistics based on
Percentile N%
Day Start
Evening Start
Night Start
Evening Penalty
Night Penalty

APPENDIX BMeasurement Parameters
291
Table B.3 Occupational health parameters
B.7 Reverberation Time Measurement
B.7.1 For Reverberation Time Software BZ‐7227
The following parameters are measured or calculated at each position:
Decays
• Reverberation Decays (for each frequency band from Bottom Frequency to Top Frequency) based on sampling LZeq spectra at 5 ms intervals
Parameter Lep,d Lep,d,v E Dose Proj-Dose
#VPeaks(>NNNdB)
Lav-RQ TWA TWAv
Dose-RQ
Proj-DoseRQ
Sound Field Correction
Wind-screen Correction
Low Frequency
Broadband(excl. Peak) A A A A A A A A A A
Broadband Peak
Exposure Time
Reference Time
Threshold Level
Criterion Level
Peaks-Over Level
Exchange Rate for Lav 5 5
Time Weighting for Lav
S S

Hand‐held Analyzer Types 2250 and 2270 – User Manual292
Spectra
• T30 Spectrum • T20 Spectrum • EDT Spectrum
Single Number Values
• T30 (Wide Band RT Bottom – Wide Band RT Top) • T20 (Wide Band RT Bottom – Wide Band RT Top) • EDT (Wide Band RT Bottom – Wide Band RT Top)
The following parameters are calculated for the room as an average of all positions:
Decays
• Ensemble Averaged Reverberation Decays (for each frequency band from Bottom Frequency to Top Frequency)
Spectra
• T30 Spectrum • T20 Spectrum • EDT Spectrum
Single Number Values
• T30 (Wide Band RT Bottom – Wide Band RT Top) • T20 (Wide Band RT Bottom – Wide Band RT Top) • EDT (Wide Band RT Bottom – Wide Band RT Top) Quality indicators are given for each frequency band, in each reverberation time spectrum, andfor each reverberation time spectrum.
Instantaneous Measured Parameters (available at any time)
Instantaneous time-weighted sound levels:• LAF • LCF
Instantaneous measured spectra:• LZF
293
Appendix CAnalyzer Parameters
This appendix describes the parameters that are common to all users of the analyzer.

Hand‐held Analyzer Types 2250 and 2270 – User Manual294
C.1 Current Transducer
Table C.1 Current transducer parameters
Parameter Values Comment
Transducer (that is, connected to Top Socket) (Ch. 1 for Type 2270)
Name and serial number of transducer
This parameter selects which transducer is connected to the Top Socket (displayed in Setup > Input (Type 2250) or Setup > Input under Ch.1 (Type 2270) and at the top of Transducers Database)
Transducer (that is, connected to Top Socket or Ch. 2 for Type 2270)
Name and serial number of transducer
Type 2270 only.This parameter selects which transducer is connected to the Top Socket or Ch. 2 (displayed in Setup > Input under Ch.2 and at the top of Transducers Database)
Transducer (that is, connected to the Rear Socket/Ch. 1 of Type 2270)
Name and serial number of transducer
Type 2270 only.This parameter selects which transducer is connected to the Ch. 1 Rear Socket (displayed in Setup > Input under Ch.1 and at the top of Transducers Database)
Transducer(that is connected to Rear Socket or Ch. 2 of Type 2270)
Name and serial number of transducer
This parameter selects which transducer is used in the Rear Socket (displayed in Setup > Input (Type 2250) or Setup > Input under Ch.2 (Type 2270) and at the top of Transducers Database)
Input (no text is displayed)
Top Socket
Rear Socket
Determines whether the input is taken from the Top Socket, or the Rear Socket (‘Input’ on connector panel). Connect your transducer to this socket. This parameter is displayed in Setup > Input and on the second line of the Transducers Database
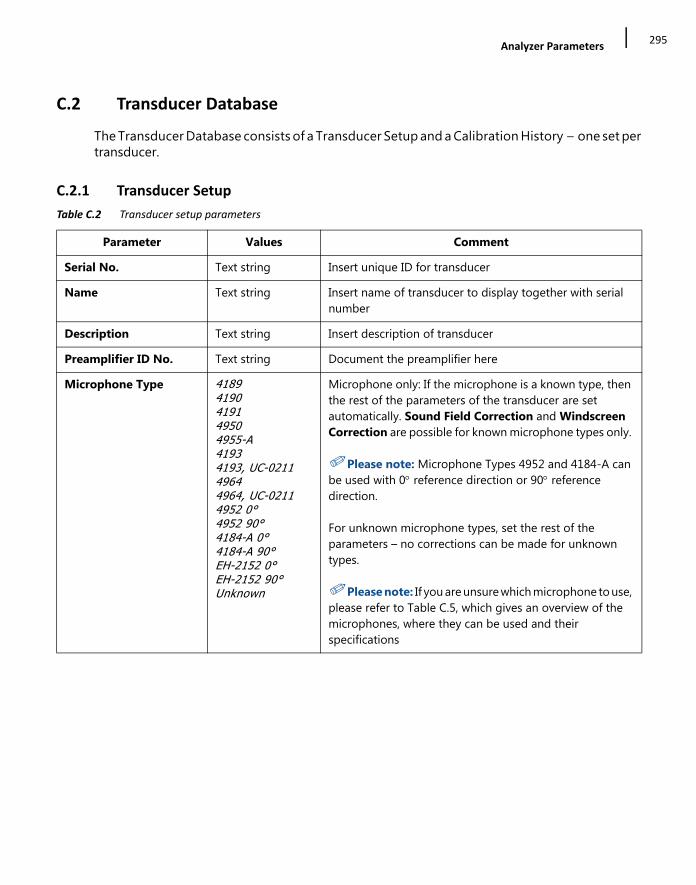
Analyzer Parameters295
C.2 Transducer Database
The Transducer Database consists of a Transducer Setup and a Calibration History – one set pertransducer.
C.2.1 Transducer Setup
Table C.2 Transducer setup parameters
Parameter Values Comment
Serial No. Text string Insert unique ID for transducer
Name Text string Insert name of transducer to display together with serial number
Description Text string Insert description of transducer
Preamplifier ID No. Text string Document the preamplifier here
Microphone Type 41894190419149504955-A41934193, UC-021149644964, UC-02114952 0°4952 90°4184-A 0°4184-A 90°EH-2152 0°EH-2152 90°Unknown
Microphone only: If the microphone is a known type, then the rest of the parameters of the transducer are set automatically. Sound Field Correction and Windscreen Correction are possible for known microphone types only.
✐Please note: Microphone Types 4952 and 4184-A can be used with 0 reference direction or 90 reference direction.
For unknown microphone types, set the rest of the parameters – no corrections can be made for unknown types.
✐Please note: If you are unsure which microphone to use, please refer to Table C.5, which gives an overview of the microphones, where they can be used and their specifications
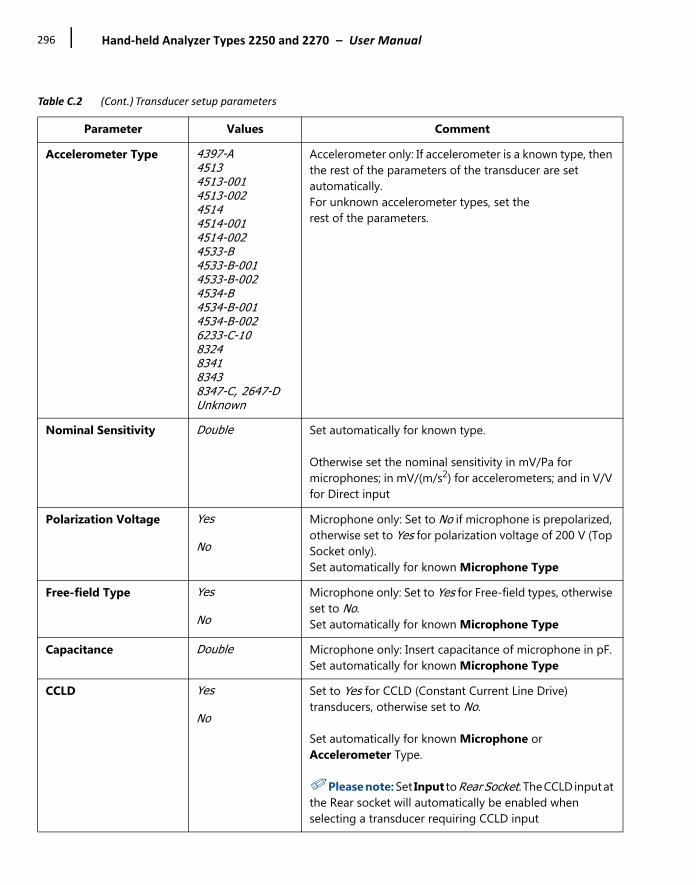
Hand‐held Analyzer Types 2250 and 2270 – User Manual296
Accelerometer Type 4397-A45134513-0014513-00245144514-0014514-0024533-B4533-B-0014533-B-0024534-B4534-B-0014534-B-0026233-C-108324834183438347-C, 2647-DUnknown
Accelerometer only: If accelerometer is a known type, then the rest of the parameters of the transducer are set automatically. For unknown accelerometer types, set therest of the parameters.
Nominal Sensitivity Double Set automatically for known type.
Otherwise set the nominal sensitivity in mV/Pa for microphones; in mV/(m/s2) for accelerometers; and in V/V for Direct input
Polarization Voltage Yes
No
Microphone only: Set to No if microphone is prepolarized, otherwise set to Yes for polarization voltage of 200 V (Top Socket only). Set automatically for known Microphone Type
Free-field Type Yes
No
Microphone only: Set to Yes for Free-field types, otherwise set to No. Set automatically for known Microphone Type
Capacitance Double Microphone only: Insert capacitance of microphone in pF. Set automatically for known Microphone Type
CCLD Yes
No
Set to Yes for CCLD (Constant Current Line Drive) transducers, otherwise set to No.
Set automatically for known Microphone or Accelerometer Type.
✐Please note: Set Input to Rear Socket. The CCLD input at the Rear socket will automatically be enabled when selecting a transducer requiring CCLD input
Table C.2 (Cont.) Transducer setup parameters
Parameter Values Comment

Analyzer Parameters297
C.2.2 Calibration History
Calibration Check CIC
Actuator
Microphone only: For microphone Type 4184-A you can select to check the calibration of the system using CIC or Actuator – for all other microphone types the setting is preset to CIC.
Weight Double Accelerometer only: Insert weight of the accelerometer in g. Set automatically for known Accelerometer type
Table C.3 Calibration history parameters
Parameter Values Comment
1. Calibration date & Time
YYYY-MM-DD hh:mm:ss
Initial
1. Sensitivity Double Initial mV/Pa
1. Preamplifier ID No. Text string Initial
1. User Text string Initial
1. Input Top Socket, Rear Socket
Initial
1. Calibration Type External,Internal Initial
1. Calibrator Serial No. Text string Initial
1. Comment Text string Initial
1. Analyzer Serial No. Text string Initial
2. Calibration date & Time
YYYY-MM-DD hh:mm:ss
2. Sensitivity Double
2. Preamplifier ID No. Text string
2. User Text string
2. Input Top Socket, Rear Socket
2. Calibration Type External,Internal
2. Calibrator Serial No. Text string
Table C.2 (Cont.) Transducer setup parameters
Parameter Values Comment
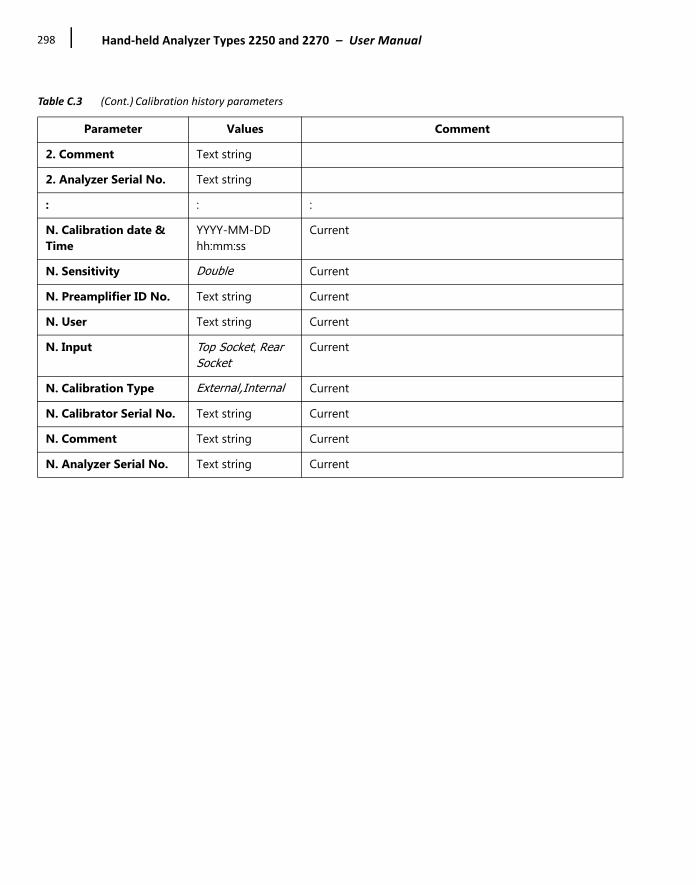
Hand‐held Analyzer Types 2250 and 2270 – User Manual298
2. Comment Text string
2. Analyzer Serial No. Text string
: : :
N. Calibration date & Time
YYYY-MM-DD hh:mm:ss
Current
N. Sensitivity Double Current
N. Preamplifier ID No. Text string Current
N. User Text string Current
N. Input Top Socket, Rear Socket
Current
N. Calibration Type External,Internal Current
N. Calibrator Serial No. Text string Current
N. Comment Text string Current
N. Analyzer Serial No. Text string Current
Table C.3 (Cont.) Calibration history parameters
Parameter Values Comment

Analyzer Parameters299
C.3 Calibration Setup
Table C.4 Calibration setup parameters
Parameter Values Comment
(Sound Level) Calibrator 4231
Custom
Select which calibrator to use
Calibration Level (for Custom Sound Level Calibrator)
0.00 to 200.00 dB re 20 µPa
Set calibration level for custom calibrator
Serial No. for 4231 Text string Serial number will be documented in calibration history
Serial No. for Custom Sound Level Calibrator
Text string Serial number will be documented in calibration history
(Acceleration) Calibrator 42944924--002Custom
Select which calibrator to use
Calibration Level (for custom Acceleration Calibrator)
0 to 1000 m/s2 Set calibration level for custom calibrator.
✐Please note: When displaying acceleration levels as dB the reference will be 1 µm/s2
Serial No. for 4294 Text string Serial number will be documented in calibration history
Serial No. for Custom Acceleration Calibrator
Text string Serial number will be documented in calibration history
Calibration Level (for Direct Input)
0 to 1000 V Set calibration level for Direct Input.
✐Please note: When displaying voltage levels as dB the reference will be 1 µV
Serial No. for Direct Input Calibrator
Text string Serial number will be documented in calibration history
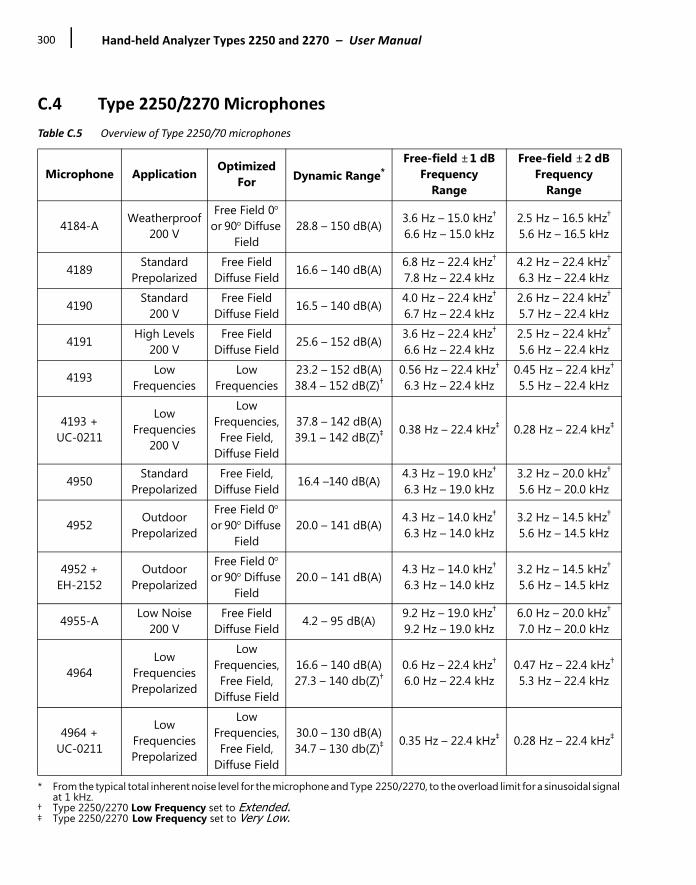
Hand‐held Analyzer Types 2250 and 2270 – User Manual300
C.4 Type 2250/2270 Microphones
Table C.5 Overview of Type 2250/70 microphones
Microphone Application OptimizedFor Dynamic Range*
* From the typical total inherent noise level for the microphone and Type 2250/2270, to the overload limit for a sinusoidal signal at 1 kHz.
Free-field ±1 dBFrequency
Range
Free-field ±2 dBFrequency
Range
4184-A Weatherproof200 V
Free Field 0or 90Diffuse
Field28.8 – 150 dB(A) 3.6 Hz – 15.0 kHz†
6.6 Hz – 15.0 kHz2.5 Hz – 16.5 kHz†
5.6 Hz – 16.5 kHz
4189 StandardPrepolarized
Free Field Diffuse Field 16.6 – 140 dB(A) 6.8 Hz – 22.4 kHz†
7.8 Hz – 22.4 kHz4.2 Hz – 22.4 kHz†
6.3 Hz – 22.4 kHz
4190 Standard200 V
Free Field Diffuse Field 16.5 – 140 dB(A) 4.0 Hz – 22.4 kHz†
6.7 Hz – 22.4 kHz2.6 Hz – 22.4 kHz†
5.7 Hz – 22.4 kHz
4191 High Levels200 V
Free Field Diffuse Field 25.6 – 152 dB(A) 3.6 Hz – 22.4 kHz†
6.6 Hz – 22.4 kHz2.5 Hz – 22.4 kHz†
5.6 Hz – 22.4 kHz
4193 LowFrequencies
LowFrequencies
23.2 – 152 dB(A)38.4 – 152 dB(Z)†
† Type 2250/2270 Low Frequency set to Extended.
0.56 Hz – 22.4 kHz†
6.3 Hz – 22.4 kHz0.45 Hz – 22.4 kHz†
5.5 Hz – 22.4 kHz
4193 + UC-0211
LowFrequencies
200 V
LowFrequencies,Free Field,
Diffuse Field
37.8 – 142 dB(A)39.1 – 142 dB(Z)‡
‡ Type 2250/2270 Low Frequency set to Very Low.
0.38 Hz – 22.4 kHz‡ 0.28 Hz – 22.4 kHz‡
4950 StandardPrepolarized
Free Field, Diffuse Field 16.4 –140 dB(A) 4.3 Hz – 19.0 kHz†
6.3 Hz – 19.0 kHz3.2 Hz – 20.0 kHz†
5.6 Hz – 20.0 kHz
4952 Outdoor Prepolarized
Free Field 0or 90Diffuse
Field20.0 – 141 dB(A) 4.3 Hz – 14.0 kHz†
6.3 Hz – 14.0 kHz3.2 Hz – 14.5 kHz†
5.6 Hz – 14.5 kHz
4952 +EH-2152
Outdoor Prepolarized
Free Field 0or 90Diffuse
Field20.0 – 141 dB(A) 4.3 Hz – 14.0 kHz†
6.3 Hz – 14.0 kHz3.2 Hz – 14.5 kHz†
5.6 Hz – 14.5 kHz
4955-A Low Noise 200 V
Free Field Diffuse Field 4.2 – 95 dB(A) 9.2 Hz – 19.0 kHz†
9.2 Hz – 19.0 kHz6.0 Hz – 20.0 kHz†
7.0 Hz – 20.0 kHz
4964Low
Frequencies Prepolarized
Low Frequencies, Free Field,
Diffuse Field
16.6 – 140 dB(A)27.3 – 140 db(Z)†
0.6 Hz – 22.4 kHz†
6.0 Hz – 22.4 kHz0.47 Hz – 22.4 kHz†
5.3 Hz – 22.4 kHz
4964 + UC-0211
Low Frequencies Prepolarized
Low Frequencies,Free Field,
Diffuse Field
30.0 – 130 dB(A)34.7 – 130 db(Z)‡ 0.35 Hz – 22.4 kHz‡ 0.28 Hz – 22.4 kHz‡

Analyzer Parameters301
Detailed specifications for the analyzer together with the different microphones are available.Please contact your local Brüel & Kjær representative if you need more information.The analyzer has correction filters to optimize the frequency response of each microphone. Therelevant filter is automatically applied when you select the microphone for input, be it via the topsocket, or the rear input socket.
Note for Microphone Type 4193 and Type 4964
Microphone Type 4193 is delivered with the Adaptor UC-0211; for Microphone Type 4964 it isordered separately.Adaptor UC-0211 is only used when measurements are made on signals that containcomponents at frequencies below 1 Hz that should be included in the measurement. This is onlyfor Low Frequency set to Very Low.It is not recommended to use the adaptor for other signals or settings because it reduces thedynamic range significantly.

Hand‐held Analyzer Types 2250 and 2270 – User Manual302

303
Appendix DPreferences
This appendix describes the unique set of parameters that can be set for each user on the analyzer.
D.1 Display Settings
For each colour scheme select the optimum choice of brightness for the traffic light and whetherthe backlight for the pushbuttons should be on or off. In addition, you can also change thenumber of decimal places on your dB results readout
Table D.1 Display settings
Parameter Values Comment
Colour Scheme Arcade Alhambra Indoor Outdoor Night
Select between five colour schemes, one optimized for outdoor use in bright conditions and one optimized for very dark conditions
Traffic Light Brightness Off Low Normal High
Key Backlight Off On
Backlight Brightness MinimumLevel 2 Level 3 Level 4 Level 5 Maximum
Select backlight brightness using the backlight icon at the bottom of the screen. Maximum level uses the most power
Resolution of Readings Normal
Extended
dB: Number of decimal places for values displayed:Normal: 1; Extended: 2.Engineering: Number of digits for values displayed: Normal: 3; Extended: 4.
✐Please note: This setting is for display only and has no effect on the measurement precision or resolution

Hand‐held Analyzer Types 2250 and 2270 – User Manual304
D.2 Power Settings
✐Please note: If the analyzer is externally powered, then the settings will be ignored.
Table D.2 Power settings
Parameter Values Comment
Backlight Dim After 30 sec.After 1 min.After 2 min.After 5 min.After 10 minNever
Select optimum value for full backlight on (brightness determined by Backlight Brightness) before the backlight is dimmed (if analyzer is left untouched)
Turn off Backlight After 1 min.After 2 min.After 5 min.After 10 min.After 30 min.Never
G1 – 3 analyzers only: Select optimum value for how long the backlight is dimmed before it is switched off
Standby After 1 min.After 2 min.After 5 min.After 10 min.After 30 min.Never
Select optimum value for ‘on’ period before the analyzer is set automatically to standby
Ext. Power Charge battery onlySwitch on and charge
G4 analyzers only: Determines whether the analyzer automatically switches on and charges the battery when connected to external power or only charges. G1 – 3 analyzers: This is determined by a small, switch at the back of the analyzer. Remove the internal battery pack to access the switch
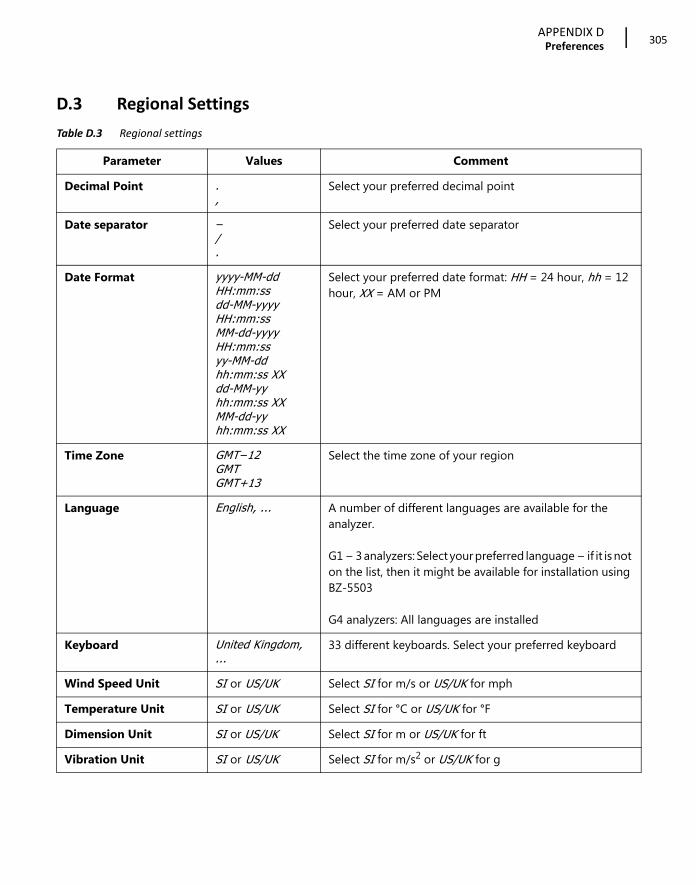
APPENDIX DPreferences
305
D.3 Regional Settings
Table D.3 Regional settings
Parameter Values Comment
Decimal Point .,
Select your preferred decimal point
Date separator –/.
Select your preferred date separator
Date Format yyyy-MM-dd HH:mm:ssdd-MM-yyyy HH:mm:ssMM-dd-yyyy HH:mm:ssyy-MM-dd hh:mm:ss XXdd-MM-yy hh:mm:ss XXMM-dd-yy hh:mm:ss XX
Select your preferred date format: HH = 24 hour, hh = 12 hour, XX = AM or PM
Time Zone GMT–12GMTGMT+13
Select the time zone of your region
Language English, ... A number of different languages are available for the analyzer.
G1 – 3 analyzers: Select your preferred language – if it is not on the list, then it might be available for installation using BZ-5503
G4 analyzers: All languages are installed
Keyboard United Kingdom, ...
33 different keyboards. Select your preferred keyboard
Wind Speed Unit SI or US/UK Select SI for m/s or US/UK for mph
Temperature Unit SI or US/UK Select SI for °C or US/UK for °F
Dimension Unit SI or US/UK Select SI for m or US/UK for ft
Vibration Unit SI or US/UK Select SI for m/s2 or US/UK for g
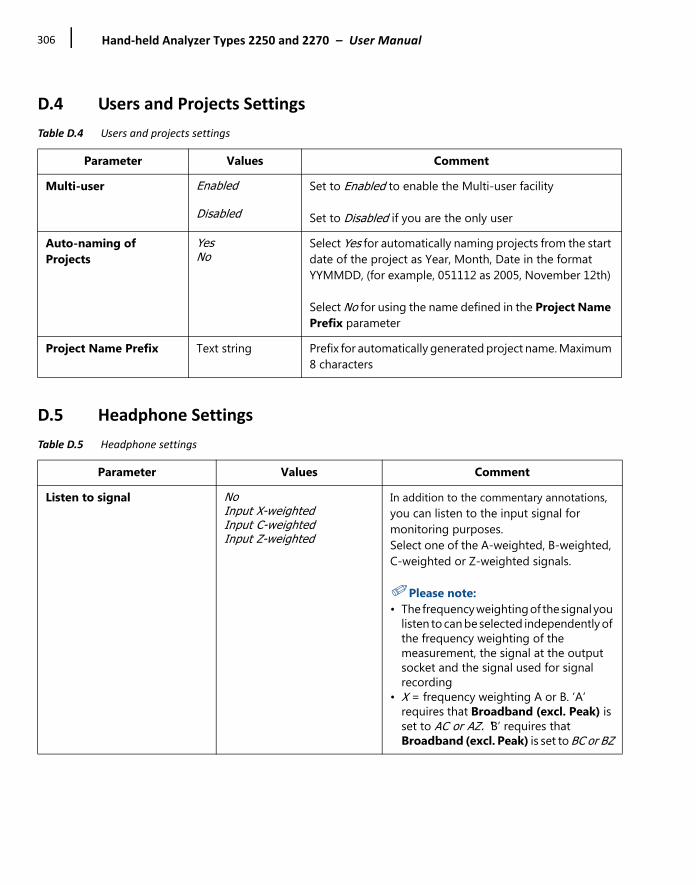
Hand‐held Analyzer Types 2250 and 2270 – User Manual306
D.4 Users and Projects Settings
D.5 Headphone Settings
Table D.4 Users and projects settings
Parameter Values Comment
Multi-user Enabled
Disabled
Set to Enabled to enable the Multi-user facility
Set to Disabled if you are the only user
Auto-naming of Projects
YesNo
Select Yes for automatically naming projects from the start date of the project as Year, Month, Date in the format YYMMDD, (for example, 051112 as 2005, November 12th)
Select No for using the name defined in the Project Name Prefix parameter
Project Name Prefix Text string Prefix for automatically generated project name. Maximum 8 characters
Table D.5 Headphone settings
Parameter Values Comment
Listen to signal NoInput X-weightedInput C-weightedInput Z-weighted
In addition to the commentary annotations, you can listen to the input signal for monitoring purposes.Select one of the A-weighted, B-weighted, C-weighted or Z-weighted signals.
✐Please note: • The frequency weighting of the signal you
listen to can be selected independently of the frequency weighting of the measurement, the signal at the output socket and the signal used for signal recording
• X = frequency weighting A or B. ‘A’ requires that Broadband (excl. Peak) is set to AC or AZ. ‘B’ requires that Broadband (excl. Peak) is set to BC or BZ
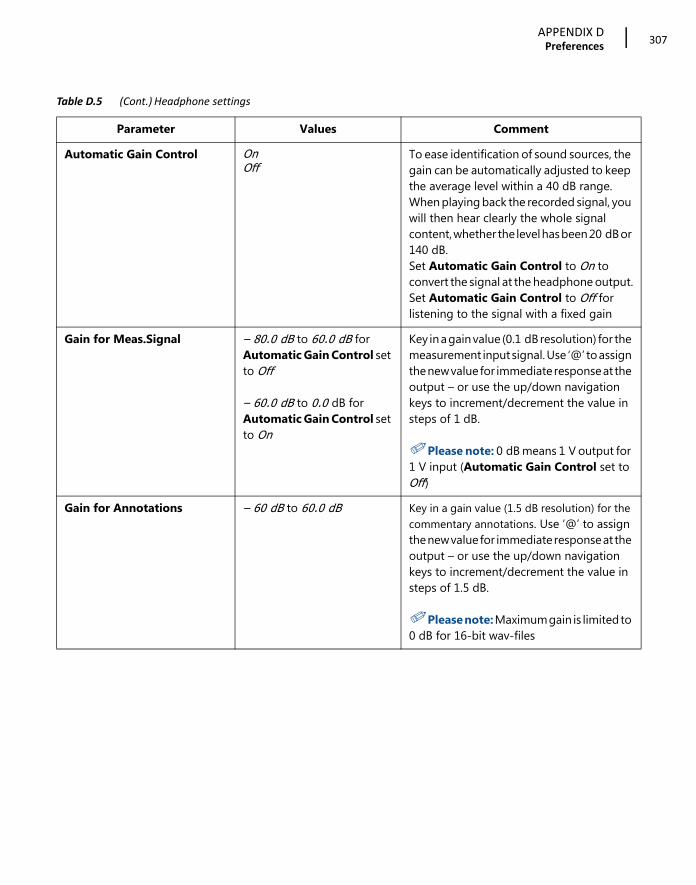
APPENDIX DPreferences
307
Automatic Gain Control OnOff
To ease identification of sound sources, the gain can be automatically adjusted to keep the average level within a 40 dB range. When playing back the recorded signal, you will then hear clearly the whole signal content, whether the level has been 20 dB or 140 dB.Set Automatic Gain Control to On to convert the signal at the headphone output.Set Automatic Gain Control to Off for listening to the signal with a fixed gain
Gain for Meas.Signal – 80.0 dB to 60.0 dB for Automatic Gain Control set to Off
– 60.0 dB to 0.0 dB for Automatic Gain Control set to On
Key in a gain value (0.1 dB resolution) for the measurement input signal. Use ‘@’ to assign the new value for immediate response at the output – or use the up/down navigation keys to increment/decrement the value in steps of 1 dB.
✐Please note: 0 dB means 1 V output for 1 V input (Automatic Gain Control set to Off)
Gain for Annotations – 60 dB to 60.0 dB Key in a gain value (1.5 dB resolution) for the commentary annotations. Use ‘@’ to assign the new value for immediate response at the output – or use the up/down navigation keys to increment/decrement the value in steps of 1.5 dB.
✐Please note: Maximum gain is limited to 0 dB for 16-bit wav-files
Table D.5 (Cont.) Headphone settings
Parameter Values Comment

Hand‐held Analyzer Types 2250 and 2270 – User Manual308
D.6 Printer Settings
Table D.6 Printer settings
Parameter Values Comment
Printer Used None
MPS
PCL
PCL Inkjet
PCL Laser
Seiko DPU
Select None if you do not have a printer connected to the analyzer.
Select MPS for a Mobile Pro Spectrum thermal printer from AM-TECH.
Select PCL for a printer accepting PCL printer language.
Select PCL Inkjet for an inkjet printer accepting PCL language.
Select PCL Laser for a laser printer accepting PCL language.
Select Seiko DPU for the DPU-S245 or DPU-S445 thermal printer model from Seiko Instruments.
See Chapter 8 for more details
Top Margin 0.0 to 20.0 cm Use Top Margin to position the print on the paper
Left Margin 0.0 to 20.0 cm Use Left Margin to position the print on the paper
Width 1.0 to 15.0 cm Use Width to set the size of the print
Height 1.4 to 20.0 cm Use Height to set the size of the print
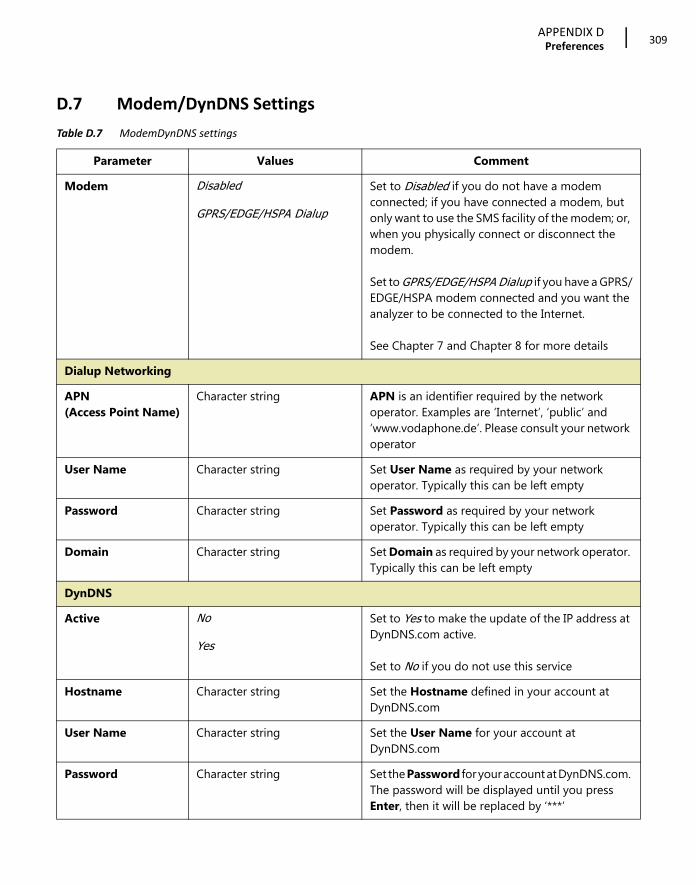
APPENDIX DPreferences
309
D.7 Modem/DynDNS Settings
Table D.7 ModemDynDNS settings
Parameter Values Comment
Modem Disabled
GPRS/EDGE/HSPA Dialup
Set to Disabled if you do not have a modem connected; if you have connected a modem, but only want to use the SMS facility of the modem; or, when you physically connect or disconnect the modem.
Set to GPRS/EDGE/HSPA Dialup if you have a GPRS/EDGE/HSPA modem connected and you want the analyzer to be connected to the Internet.
See Chapter 7 and Chapter 8 for more details
Dialup Networking
APN(Access Point Name)
Character string APN is an identifier required by the network operator. Examples are ‘Internet’, ‘public’ and ‘www.vodaphone.de’. Please consult your network operator
User Name Character string Set User Name as required by your network operator. Typically this can be left empty
Password Character string Set Password as required by your network operator. Typically this can be left empty
Domain Character string Set Domain as required by your network operator. Typically this can be left empty
DynDNS
Active No
Yes
Set to Yes to make the update of the IP address at DynDNS.com active.
Set to No if you do not use this service
Hostname Character string Set the Hostname defined in your account at DynDNS.com
User Name Character string Set the User Name for your account at DynDNS.com
Password Character string Set the Password for your account at DynDNS.com. The password will be displayed until you press Enter, then it will be replaced by ‘***’
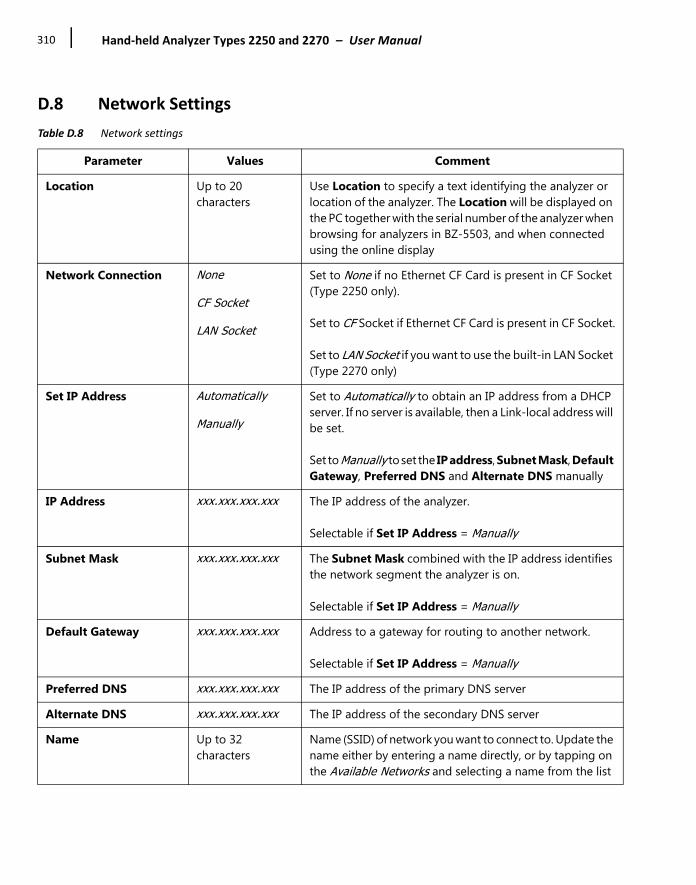
Hand‐held Analyzer Types 2250 and 2270 – User Manual310
D.8 Network Settings
Table D.8 Network settings
Parameter Values Comment
Location Up to 20 characters
Use Location to specify a text identifying the analyzer or location of the analyzer. The Location will be displayed on the PC together with the serial number of the analyzer when browsing for analyzers in BZ-5503, and when connected using the online display
Network Connection None
CF Socket
LAN Socket
Set to None if no Ethernet CF Card is present in CF Socket (Type 2250 only).
Set to CF Socket if Ethernet CF Card is present in CF Socket.
Set to LAN Socket if you want to use the built-in LAN Socket (Type 2270 only)
Set IP Address Automatically
Manually
Set to Automatically to obtain an IP address from a DHCP server. If no server is available, then a Link-local address will be set.
Set to Manually to set the IP address, Subnet Mask, Default Gateway, Preferred DNS and Alternate DNS manually
IP Address xxx.xxx.xxx.xxx The IP address of the analyzer.
Selectable if Set IP Address = Manually
Subnet Mask xxx.xxx.xxx.xxx The Subnet Mask combined with the IP address identifies the network segment the analyzer is on.
Selectable if Set IP Address = Manually
Default Gateway xxx.xxx.xxx.xxx Address to a gateway for routing to another network.
Selectable if Set IP Address = Manually
Preferred DNS xxx.xxx.xxx.xxx The IP address of the primary DNS server
Alternate DNS xxx.xxx.xxx.xxx The IP address of the secondary DNS server
Name Up to 32 characters
Name (SSID) of network you want to connect to. Update the name either by entering a name directly, or by tapping on the Available Networks and selecting a name from the list

APPENDIX DPreferences
311
Security Open
Shared
WPA PSK
WPA2 PSK
Select security as required by the network.
Open and Shared are for WEP (Wired Equivalent Privacy) Infrastructure mode.
WPA PSK is for WPA (Wi-Fi Protected Access) with Pre-shared Key (also called Personal mode).
WPA2 PSK – WPA2 is an enhanced version of WPA.
✐Please note: G1–3 only; automatically set for G4
Encryption None
WEP Enabled
AES Enabled
TKIP Enabled
Select Encryption as required by the network.
None is for Open security.
WEP Enabled is for Open and Shared security.
AES Enabled and TKIP Enabled are for WPA PSK and WPA2 PSK.
✐Please note: G1–3 only; automatically set for G4
Encryption Key Up to 32 characters
Insert the encryption key required by the network. The key will be displayed until you press Enter, then it will be replaced by ‘***’.
✐Please note: G1–3 only; automatically set for G4
Table D.8 (Cont.) Network settings
Parameter Values Comment
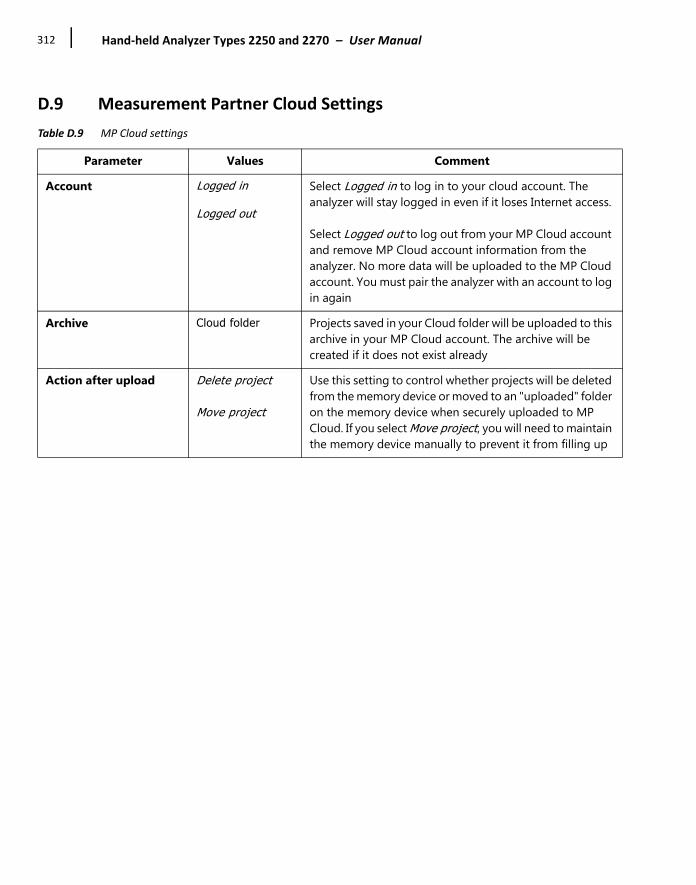
Hand‐held Analyzer Types 2250 and 2270 – User Manual312
D.9 Measurement Partner Cloud Settings
Table D.9 MP Cloud settings
Parameter Values Comment
Account Logged in
Logged out
Select Logged in to log in to your cloud account. The analyzer will stay logged in even if it loses Internet access.
Select Logged out to log out from your MP Cloud account and remove MP Cloud account information from the analyzer. No more data will be uploaded to the MP Cloud account. You must pair the analyzer with an account to log in again
Archive Cloud folder Projects saved in your Cloud folder will be uploaded to this archive in your MP Cloud account. The archive will be created if it does not exist already
Action after upload Delete project
Move project
Use this setting to control whether projects will be deleted from the memory device or moved to an "uploaded" folder on the memory device when securely uploaded to MP Cloud. If you select Move project, you will need to maintain the memory device manually to prevent it from filling up
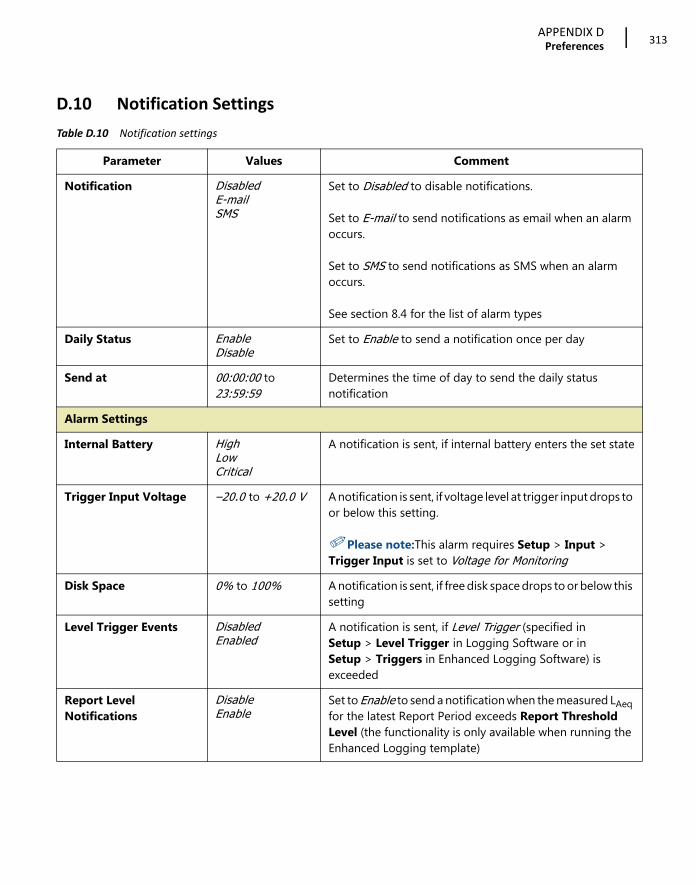
APPENDIX DPreferences
313
D.10 Notification Settings
Table D.10 Notification settings
Parameter Values Comment
Notification DisabledE-mailSMS
Set to Disabled to disable notifications.
Set to E-mail to send notifications as email when an alarm occurs.
Set to SMS to send notifications as SMS when an alarm occurs.
See section 8.4 for the list of alarm types
Daily Status EnableDisable
Set to Enable to send a notification once per day
Send at 00:00:00 to 23:59:59
Determines the time of day to send the daily status notification
Alarm Settings
Internal Battery HighLowCritical
A notification is sent, if internal battery enters the set state
Trigger Input Voltage –20.0 to +20.0 V A notification is sent, if voltage level at trigger input drops to or below this setting.
✐Please note:This alarm requires Setup > Input > Trigger Input is set to Voltage for Monitoring
Disk Space 0% to 100% A notification is sent, if free disk space drops to or below this setting
Level Trigger Events DisabledEnabled
A notification is sent, if Level Trigger (specified in Setup > Level Trigger in Logging Software or in Setup > Triggers in Enhanced Logging Software) is exceeded
Report Level Notifications
DisableEnable
Set to Enable to send a notification when the measured LAeq for the latest Report Period exceeds Report Threshold Level (the functionality is only available when running the Enhanced Logging template)

Hand‐held Analyzer Types 2250 and 2270 – User Manual314
Report Threshold Level –100.0 dB to 200.0 dB
A notification is sent when the measured LAeq (for Microphone input) or Linear (for Acceleration and Direct input) for the latest Report Period exceeds the set Report Threshold Level.
✐Please note:• If you specify a very low Report Threshold Level you will
receive a notification at the end of each Report Period• For 2-channel Enhanced Logging, the Report Threshold
Level is for Ch.1
Report Threshold Level 2
–100.0 dB to 200.0 dB
A notification is sent when the measured Ch.2 LAeq (for Microphone input) or Linear (for Acceleration and Direct input) for the latest Report Period exceeds the set Report Threshold Level 2. Only used in 2-ch Enhanced Logging.
To Character string The email address of the recipient of the email.Example: [email protected]
SMTP Character string Name of SMTP (simple mail transfer protocol) server.* Examples: gmail: smtp.gmail.com hotmail: smtp.live.com
SMTP Port 0 to 65535 Port used by SMTP server.* Typically this is 25, but for Gmail™/Google™ Mail and Microsoft® Hotmail® it is 587
SSL/TLS NoYes
Secure Socket Layer/Transport Layer Security.Set to Yes if required by email provider*, otherwise No. SSL/TLS is required by Gmail and Hotmail
Account Character string The Account is typically the email address used for sending the email.* Examples: [email protected] [email protected]
Table D.10 (Cont.) Notification settings
Parameter Values Comment

APPENDIX DPreferences
315
User Name Character string The User Name is typically the email address used for sending the email.* Examples: [email protected] [email protected]
If the email account is part of a domain, then it might be necessary to specify the domain as part of the user name.Example: Domain\UserName
Password Character string Insert the password required for the account.* The password will be displayed until you press Enter, then it will be replaced by ‘***’
SMS
Active NoYes
Set to Yes to activate the first phone number, otherwise set to No
Name Character string Name identifying first phone number
Phone Number Number The number of the first SMS recipient
Active NoYes
Set to Yes to activate the second phone number, otherwise set to No
Name Character string Name identifying second phone number
Phone Number Number The number of the second SMS recipient
* Please consult your email provider
Table D.10 (Cont.) Notification settings
Parameter Values Comment

Hand‐held Analyzer Types 2250 and 2270 – User Manual316
D.11 Remote Access Settings
✐Please note: The remote access parameters are common to all users of the analyzer.
Table D.11 Remote access settings
Parameter Values Comment
Web Server Disabled
Enabled
Set Web Server to Enabled to enable display and control of the analyzer on a web page – see section 7.4.
Set to Disabled to disable the Web server functionality
BZ-5503 Login Required Yes
No
Set to Yes to require user name and password for access to the instrument from BZ-5503 MPS or from the Type 2250/2270 SDK. Set to No for free access to the instrument.
✐Please note: If set to Yes, then you require BZ-5503 version 4.1 or higher to access the instrument
User Name Character string Define the user name required for full access to the web page, that is, view and control of the analyzer, and for access from BZ-5503 MPS and Type 2250/2270 SDK.Default: admin
Password Character string Define the password required for full access to the web page, and for access from BZ-5503 MPS and Type 2250/2270 SDK. The password will be displayed until you press Enter, then it will be replaced by ‘***’.Default: admin
Guest Login Required Yes
No
Set to Yes to require user name and password for login to the guest Web page.
Set to No for free access to the guest Web page
Guest User Name Character string Define the user name required for limited access to the Web page, that is view of the analyzer only.Default: guest
Guest Password Character string Define the password required for limited access to the Web page. The password will be displayed until you press Enter, then it will be replaced by ‘***’.Default: guest

APPENDIX DPreferences
317
D.12 Image Settings (Type 2270 only)
D.13 NMT Server Settings (Hardware Version 4 only)
For setup of NMT Server communication used by Noise Monitoring Software BZ-7232, see UserManual for Noise Monitoring Terminal Types 3639-A, B and C, BE 1818.
Table D.12 Image settings
Parameter Values Comment
Image Control View Finder
Manual Event
Set to View Finder to use the Viewfinder together with the Manual Event pushbutton to capture an image. The image can then be saved or rejected after capture.
Set to Manual Event to capture and save the image each time you press the Manual Event pushbutton

Hand‐held Analyzer Types 2250 and 2270 – User Manual318

319
Appendix EGlossary
A-weighting filter: Frequency weighting corresponding approximately to the 40 dB equal loudness
curve, that is to say, the human ear’s response at low to medium sound levels. It is by far the most commonly applied frequency weighting and is used for all levels of sound.
Avg. RPM The average RPM over the total averaging time.
aWx: Time-averaged (RMS) weighted acceleration value, averaged over the entire measurement period with frequency weighting Wx.
aWx,1s Maximum time-weighted acceleration value during the latest second with frequency weighting Wx and 1 s exponential time constant.
B-weighting filter: Frequency weighting corresponding approximately to the 70 dB equal loudness curve, that is to say, the human ear’s response at medium sound levels.
C-weighting filter: Frequency weighting corresponding to the 100 dB equal loudness curve, that is to say, the human ear’s response at fairly high sound levels. Mainly used when assessing peak values of high sound pressure levels.
Crest Factor Crest factor given by Peak/Linear (based on absolute acceleration values) over the entire measurement period, calculated for acceleration (or direct) signals only.
Criterion Level: Criterion Level is the maximum averaged sound level allowed for an 8-hour period. Used for calculation of Dose, ProjDose, DoseUQ and ProjDoseUQ, where U = F or S and Q = 4, 5 or 6 dB.

Hand‐held Analyzer Types 2250 and 2270 – User Manual320
Decibel (dB): The measurement unit for expressing the relative intensity of sound. A direct application of linear scales (in Pa) to the measurement of sound pressure leads to large and unwieldy numbers. As the ear responds logarithmically rather than linearly to stimuli, it is more practical to express acoustic parameters as a logarithmic ratio of the measured value to a reference value. This logarithmic ratio is called a decibel or dB. The advantage of using dB can be clearly seen in the below illustration. Here, the linear scale with its large numbers is converted into a manageable scale from 0 dB at the threshold of hearing (20 µPa) to 130 dB at the threshold of pain (100 Pa).
Our hearing covers a surprisingly wide range of sound pressures – a ratio of over a million to one. The dB scale makes the numbers manageable.

Glossary321
Dose, ProjDose: The Noise Dose is the equivalent averaged A-weighted Noise Level (taking the Threshold Level into account) using Exchange Rate = 3 for an 8 hour period (reference duration) relative to the maximum allowed (the Criterion Level) – expressed in percentage.
Example: If the Criterion Level is 85 dB and a person is exposed to a constant sound pressure level of 85 dB for 8 hours, then the Dose is 100%. A constant level 88 dB results in a Dose of 200% and a constant level of 82 dB results in a dose of 50%.The Projected Dose is the Noise Dose based on measurement duration less than 8 hours, assuming the sound level for the remaining time stays the same.
DoseUQ, ProjDoseUQ: The Noise Dose is the averaged A-weighted Noise Level (taking the Threshold Level into account) with Time Weighting U = F or S and Exchange Rate Q = 4, 5 or 6 for an 8 hour period (reference duration) relative to the maximum allowed (the Criterion Level) – expressed in percentage.
Example: If the Criterion Level is 90 dB and a person is exposed to a constant average sound level of 90 dB for 8 hours with Time Weighting S and Exchange Rate 5, then the DoseS5 is 100%. A constant level 95 dB results in a DoseS5 of 200% and a constant level of 85 dB results in a doseS5 of 50%.The Projected DoseS5 is the Noise DoseS5 based on measurement duration less than 8 hours, assuming the sound level for the remaining time stays the same.
E: Sound Exposure is the energy of the A-weighted sound calculated over the measurement time. The unit is Pa2h.
Exchange Rate: Exchange Rate is the increase in noise level that corresponds to a doubling of the noise level. The Exchange Rate is used for calculation of LavUQ, TWA, TWAv, DoseUQ and ProjDoseUQ, where U = F or S and Q = Exchange Rate: 4, 5 or 6 dB.
✐Please note: LAeq is always based on an Exchange Rate = 3.
Exposure Time: Exposure Time is the actual time that a person is exposed to noise during a workday. Used for calculation of Lep,d and Lep,d,v.
Fast Max: Maximum time-weighted acceleration, velocity, displacement or voltage level measured with Linear frequency weighting and Fast time weighting. It is the highest level occurring during the measurement time.
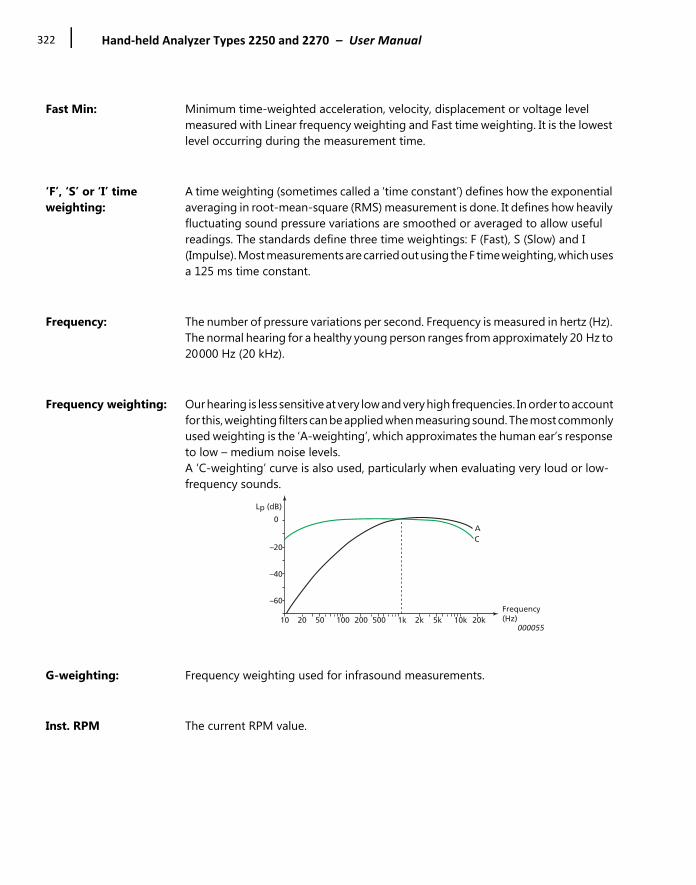
Hand‐held Analyzer Types 2250 and 2270 – User Manual322
Fast Min: Minimum time-weighted acceleration, velocity, displacement or voltage level measured with Linear frequency weighting and Fast time weighting. It is the lowest level occurring during the measurement time.
‘F’, ‘S’ or ‘I’ time weighting:
A time weighting (sometimes called a ‘time constant’) defines how the exponential averaging in root-mean-square (RMS) measurement is done. It defines how heavily fluctuating sound pressure variations are smoothed or averaged to allow useful readings. The standards define three time weightings: F (Fast), S (Slow) and I (Impulse). Most measurements are carried out using the F time weighting, which uses a 125 ms time constant.
Frequency: The number of pressure variations per second. Frequency is measured in hertz (Hz). The normal hearing for a healthy young person ranges from approximately 20 Hz to 20000 Hz (20 kHz).
Frequency weighting: Our hearing is less sensitive at very low and very high frequencies. In order to account for this, weighting filters can be applied when measuring sound. The most commonly used weighting is the ‘A-weighting’, which approximates the human ear’s response to low – medium noise levels. A ‘C-weighting’ curve is also used, particularly when evaluating very loud or low-frequency sounds.
G-weighting: Frequency weighting used for infrasound measurements.
Inst. RPM The current RPM value.
000055
Frequency(Hz)
0
Lp (dB)
10 20 50 100 200 500 1k 2k 5k 10k 20k
–20
–40
–60
AC
Glossary323
KBF: Instantaneous time-averaged acceleration level with Wm weighting and with 125 ms exponential time constant.
✐Please note: Wm weighting of the acceleration signal corresponds to using HKB weighting on the velocity signal, as defined in DIN 45669–1.
KBFmax: Maximum of the KBF values.
KBFTm: Average of the values of KBFmaxi, where each KBFmaxi has been measured during 30 s.
LAE: Sound Exposure Level – sometimes abbreviated SEL and sometimes called Single Event Level, is the Sound Exposure expressed as a level. The letter ‘A’ denotes that the A-weighting has been included.
LAeq: A widely used noise parameter that calculates a constant level of noise with the same energy content as the varying acoustic noise signal being measured. The letter ‘A’ denotes that the A-weighting has been included and ‘eq’ indicates that an equivalent level has been calculated. Hence, LAeq is the A-weighted equivalent continuous noise level.
LXeq,T,mov and ΔLeq,T,mov:
Moving (or sliding) X-weighted average (equivalent continuous noise level) for the latest T minutes. Updated every second during measurement. The parameter can be used to monitor the average noise level within T minutes, for example, to monitor that the noise level during a music event doesn't exceed a certain limit at any 15 minutes of observation time during the event.The value is equal to LXeq at the start of the measurement as long as the elapsed time less than or equal to T. Two values with frequency weighting X = A and C are measured simultaneously. ΔLeq,T,mov is calculated as the difference between LCeq,T,mov and LAeq,T,mov.
LXeq,T,mov,max and ΔLeq,T,mov,max:
The maximum of the LXeq,T,mov values during the measurement, only taking values into account where elapsed time is greater than or equal to T. Two values with frequency weighting X = A and C are measured simultaneously. ΔLeq,T,mov,max is calculated as the difference between LCeq,T,mov,max and LAeq,T,mov,max.

Hand‐held Analyzer Types 2250 and 2270 – User Manual324
LAF: The instantaneous time-weighted sound level, Lp, is available at any time. ‘A’ denotes that the A-frequency weighting is used. ‘F’ denotes that the Fast time-weighting is used.
LAFmax: Maximum time-weighted sound level measured with A-frequency weighting and Fast time weighting. It is the highest level of environmental noise occurring during the measurement time. It is often used in conjunction with another noise parameter (for example LAeq) to ensure a single noise event does not exceed a limit.
LAFmin: Minimum time-weighted sound level measured with A-frequency weighting and Fast time weighting. It is the lowest level of environmental noise occurring during the measurement time (time resolution is 1 s).
LAF90.0: The noise level exceeded for 90% of the measurement period with A-frequency weighting and Fast time weighting. The level is based on statistical analysis of a parameter (LAF or LAS) sampled at 10 ms intervals into 0.2 dB wide classes. The percentage is user-definable. An analysis of the statistical distributions of sound levels is a useful tool when assessing noise. The analysis not only provides useful information about the variability of noise levels, but is also prominent in many standards as the basis for assessing background noise. For example, LAF90 is used as an indicator of background noise levels while LAF10 or LAF5 are sometimes used to indicate the level of noise events.
LA90.0: The noise level exceeded for 90% of the measurement period with A-frequency weighting. The level is based on statistical analysis of LAeq sampled at 1 s intervals into 0.2 dB wide classes. The percentage is user-definable.
LAF(SPL): The Sound Pressure Level (maximum time-weighted sound level during the latest second) is available at any time. 'A' denotes that the A frequency weighting is used. ‘F’ denotes that the Fast time-weighting is used.
LAFTeq: Taktmaximal Mittelungspegel as defined by DIN 45641. LAFTeq has also been called LAFTm5 or LATm5F.
LavUQ: Average Sound Level with Time Weighting U = F or S and Exchange Rate Q = 4, 5 or 6. This is a widely used occupational health noise parameter in the USA, corresponding to the LAeq used otherwise.

Glossary325
LCpeak: Maximum peak sound level during a measurement. ‘C’ denotes that the C frequency weighting is used. Used for assessing possible damages to human hearing caused by very high short-duration noise levels.
LCpeak,1s: Maximum peak sound level during the latest second – is available at any time. ‘C’ denotes that the C frequency weighting is used. Used for monitoring the peak levels.
Lden, Lday, Levening, Lnight, Ln:
Noise Indicators for describing the annoyance due to exposure to environmental noise. Lden (day-evening-night noise indicator), Lday (day-noise indicator), Levening (evening-noise indicator) and Lnight (night-noise indicator) are defined by the European Union. They are based on LAeq over different periods: Lday over the day period from 7:00 to 19:00, Levening over the evening period from 19:00 to 23:00, Lnight over the night period from 23:00 to 7:00 and Lden over the whole day with a penalty of 5 dB(A) for the evening period and a penalty of 10 dB(A) for the night period. Ldn (day-night level) is defined by the Environmental Protection Agency (EPA) in the USA as a descriptor of noise level based on LAeq over the whole day with a penalty of 10 dB(A) for night time noise (from 22:00 to 7.00).
Lep,d: The Daily Noise Exposure Level is the average A-weighted noise exposure level for a nominal 8-hour working day. Lep,d is also known as LEX,8h. Lep,d is calculated from the measured LAE, the setting of Exposure Time and a Reference time of 8 h. Used for assessing the noise exposed to a worker during a working day – in accordance with ISO standards. The European Noise at Work Directive 2003/10/EC defines the following limit and action values:Exposure Limit Value: 87 dBUpper Exposure Action Value: 85 dBLower Exposure Action Value: 80 dB
Lep,d,v: The Daily Noise Exposure Level for a user-defined reference period. Lep,d,v is calculated from the measured LAE and the settings of Exposure Time and Reference Time. Used, for example, for calculating a Weekly Noise Exposure Level, by setting the Reference Time to 40 h.

Hand‐held Analyzer Types 2250 and 2270 – User Manual326
Loudness, Loudness Level:
Loudness is the subjective judgement of intensity of a sound by humans. Loudness depends upon the sound pressure and frequency of the stimulus and whether the sound field is diffuse- or free-field. The unit is the Sone. Loudness Level = 10*log2(Loudness) + 40. The unit is the Phone.The Zwicker method of calculation of stationary loudness based on 1/3-octave measurements is described in ISO 532 -1975, Method B.
Linear Weighting: ‘Linear’ frequency weighting is without any frequency weighting, that is, equivalent to LIN, Z or FLAT.
Linear: Time-averaged (RMS) weighted acceleration (or voltage) value, averaged over the entire measurement period with frequency weighting Linear.
LGeq: The G-weighted equivalent continuous noise level – used to assess infrasound.
LGpeak: Maximum peak sound level with G-weighting.
LG10: Instantaneous time-weighted sound level with G-weighting and 10 s exponential time constant.
LG10max: Maximum time-weighted sound level measured with G-weighting and 10 s exponential time constant.
LG10min: Minimum time-weighted sound level measured with G-weighting and 10 s exponential time constant.
LW: aW expressed in dB with reference 10–6 m/s2.
MTVV Maximum of the aW,1s values.
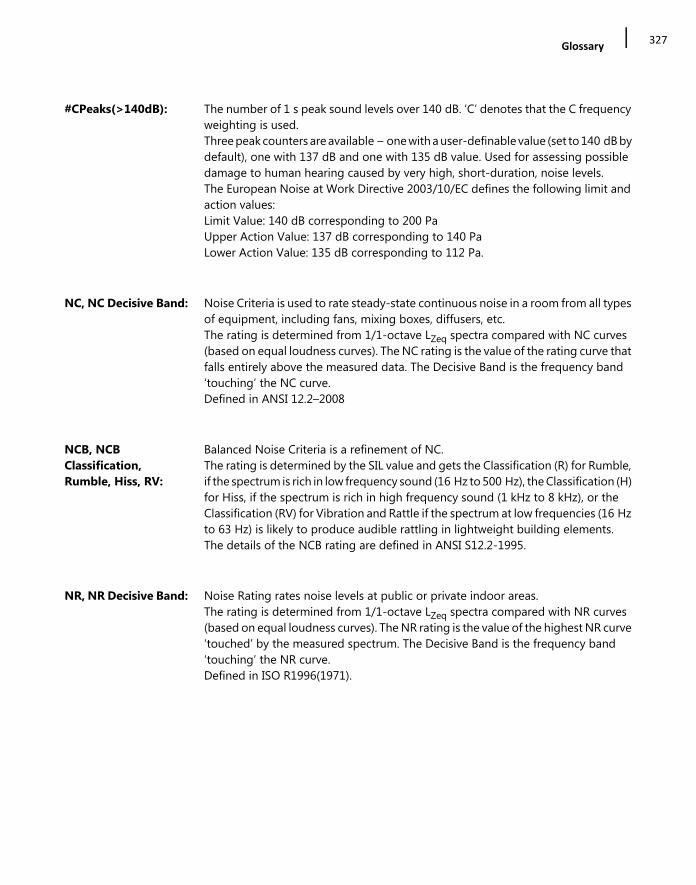
Glossary327
#CPeaks(>140dB): The number of 1 s peak sound levels over 140 dB. ‘C’ denotes that the C frequency weighting is used.Three peak counters are available – one with a user-definable value (set to 140 dB by default), one with 137 dB and one with 135 dB value. Used for assessing possible damage to human hearing caused by very high, short-duration, noise levels.The European Noise at Work Directive 2003/10/EC defines the following limit and action values:Limit Value: 140 dB corresponding to 200 PaUpper Action Value: 137 dB corresponding to 140 PaLower Action Value: 135 dB corresponding to 112 Pa.
NC, NC Decisive Band: Noise Criteria is used to rate steady-state continuous noise in a room from all types of equipment, including fans, mixing boxes, diffusers, etc.The rating is determined from 1/1-octave LZeq spectra compared with NC curves (based on equal loudness curves). The NC rating is the value of the rating curve that falls entirely above the measured data. The Decisive Band is the frequency band ‘touching’ the NC curve.Defined in ANSI 12.2–2008
NCB, NCB Classification, Rumble, Hiss, RV:
Balanced Noise Criteria is a refinement of NC.The rating is determined by the SIL value and gets the Classification (R) for Rumble, if the spectrum is rich in low frequency sound (16 Hz to 500 Hz), the Classification (H) for Hiss, if the spectrum is rich in high frequency sound (1 kHz to 8 kHz), or the Classification (RV) for Vibration and Rattle if the spectrum at low frequencies (16 Hz to 63 Hz) is likely to produce audible rattling in lightweight building elements.The details of the NCB rating are defined in ANSI S12.2-1995.
NR, NR Decisive Band: Noise Rating rates noise levels at public or private indoor areas. The rating is determined from 1/1-octave LZeq spectra compared with NR curves (based on equal loudness curves). The NR rating is the value of the highest NR curve ‘touched’ by the measured spectrum. The Decisive Band is the frequency band ‘touching’ the NR curve.Defined in ISO R1996(1971).
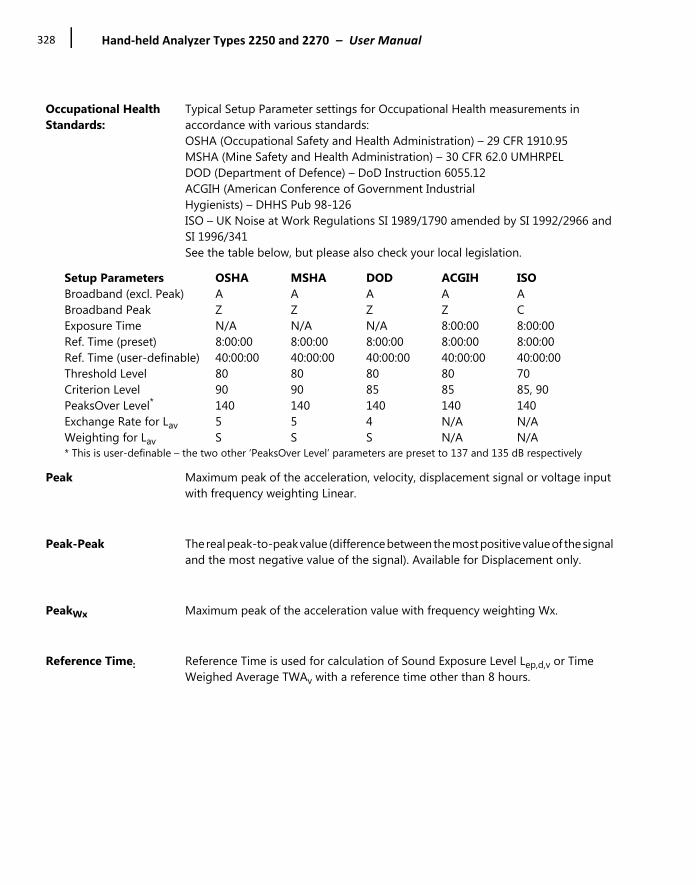
Hand‐held Analyzer Types 2250 and 2270 – User Manual328
Occupational Health Standards:
Typical Setup Parameter settings for Occupational Health measurements in accordance with various standards:OSHA (Occupational Safety and Health Administration) – 29 CFR 1910.95MSHA (Mine Safety and Health Administration) – 30 CFR 62.0 UMHRPELDOD (Department of Defence) – DoD Instruction 6055.12ACGIH (American Conference of Government Industrial Hygienists) – DHHS Pub 98-126ISO – UK Noise at Work Regulations SI 1989/1790 amended by SI 1992/2966 and SI 1996/341See the table below, but please also check your local legislation.
Setup Parameters OSHA MSHA DOD ACGIH ISOBroadband (excl. Peak) A A A A ABroadband Peak Z Z Z Z CExposure Time N/A N/A N/A 8:00:00 8:00:00Ref. Time (preset) 8:00:00 8:00:00 8:00:00 8:00:00 8:00:00Ref. Time (user-definable) 40:00:00 40:00:00 40:00:00 40:00:00 40:00:00Threshold Level 80 80 80 80 70Criterion Level 90 90 85 85 85, 90PeaksOver Level* 140 140 140 140 140Exchange Rate for Lav 5 5 4 N/A N/AWeighting for Lav S S S N/A N/A* This is user-definable – the two other ‘PeaksOver Level’ parameters are preset to 137 and 135 dB respectively
Peak Maximum peak of the acceleration, velocity, displacement signal or voltage input with frequency weighting Linear.
Peak-Peak The real peak-to-peak value (difference between the most positive value of the signal and the most negative value of the signal). Available for Displacement only.
PeakWx Maximum peak of the acceleration value with frequency weighting Wx.
Reference Time: Reference Time is used for calculation of Sound Exposure Level Lep,d,v or Time Weighed Average TWAv with a reference time other than 8 hours.
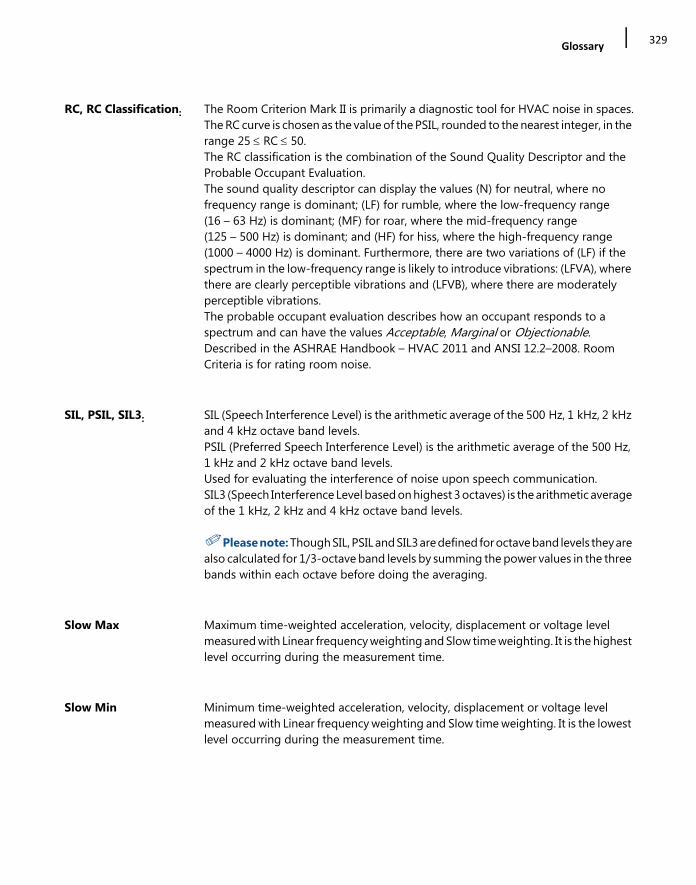
Glossary329
RC, RC Classification: The Room Criterion Mark II is primarily a diagnostic tool for HVAC noise in spaces.The RC curve is chosen as the value of the PSIL, rounded to the nearest integer, in the range 25 RC 50. The RC classification is the combination of the Sound Quality Descriptor and the Probable Occupant Evaluation.The sound quality descriptor can display the values (N) for neutral, where no frequency range is dominant; (LF) for rumble, where the low-frequency range (16 – 63 Hz) is dominant; (MF) for roar, where the mid-frequency range (125 – 500 Hz) is dominant; and (HF) for hiss, where the high-frequency range (1000 – 4000 Hz) is dominant. Furthermore, there are two variations of (LF) if the spectrum in the low-frequency range is likely to introduce vibrations: (LFVA), where there are clearly perceptible vibrations and (LFVB), where there are moderately perceptible vibrations. The probable occupant evaluation describes how an occupant responds to a spectrum and can have the values Acceptable, Marginal or Objectionable. Described in the ASHRAE Handbook – HVAC 2011 and ANSI 12.2–2008. Room Criteria is for rating room noise.
SIL, PSIL, SIL3: SIL (Speech Interference Level) is the arithmetic average of the 500 Hz, 1 kHz, 2 kHz and 4 kHz octave band levels.PSIL (Preferred Speech Interference Level) is the arithmetic average of the 500 Hz, 1 kHz and 2 kHz octave band levels.Used for evaluating the interference of noise upon speech communication.SIL3 (Speech Interference Level based on highest 3 octaves) is the arithmetic average of the 1 kHz, 2 kHz and 4 kHz octave band levels.
✐Please note: Though SIL, PSIL and SIL3 are defined for octave band levels they are also calculated for 1/3-octave band levels by summing the power values in the three bands within each octave before doing the averaging.
Slow Max Maximum time-weighted acceleration, velocity, displacement or voltage level measured with Linear frequency weighting and Slow time weighting. It is the highest level occurring during the measurement time.
Slow Min Minimum time-weighted acceleration, velocity, displacement or voltage level measured with Linear frequency weighting and Slow time weighting. It is the lowest level occurring during the measurement time.
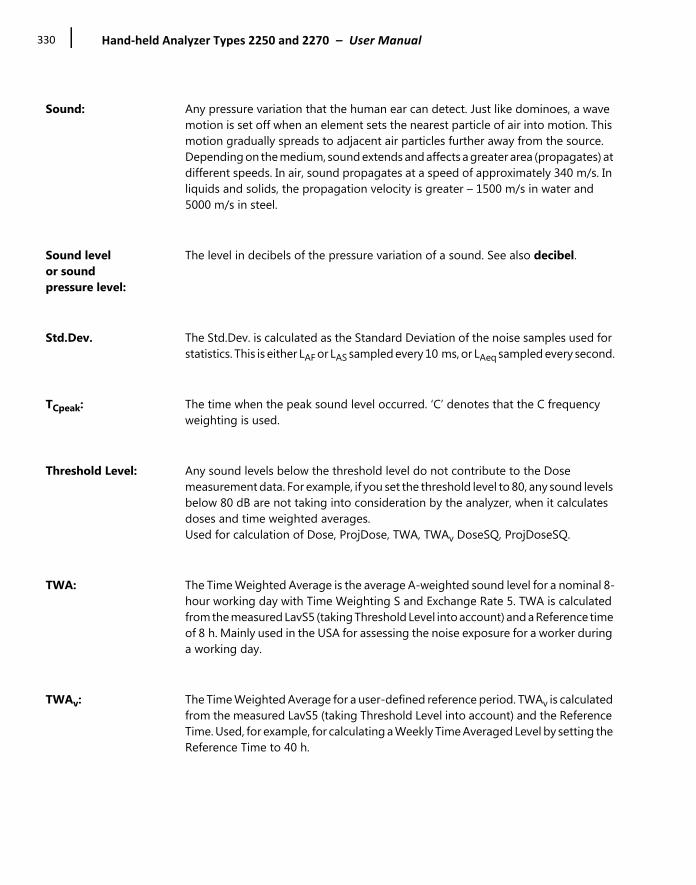
Hand‐held Analyzer Types 2250 and 2270 – User Manual330
Sound: Any pressure variation that the human ear can detect. Just like dominoes, a wave motion is set off when an element sets the nearest particle of air into motion. This motion gradually spreads to adjacent air particles further away from the source. Depending on the medium, sound extends and affects a greater area (propagates) at different speeds. In air, sound propagates at a speed of approximately 340 m/s. In liquids and solids, the propagation velocity is greater – 1500 m/s in water and 5000 m/s in steel.
Sound level or sound pressure level:
The level in decibels of the pressure variation of a sound. See also decibel.
Std.Dev. The Std.Dev. is calculated as the Standard Deviation of the noise samples used for statistics. This is either LAF or LAS sampled every 10 ms, or LAeq sampled every second.
TCpeak: The time when the peak sound level occurred. ‘C’ denotes that the C frequency weighting is used.
Threshold Level: Any sound levels below the threshold level do not contribute to the Dose measurement data. For example, if you set the threshold level to 80, any sound levels below 80 dB are not taking into consideration by the analyzer, when it calculates doses and time weighted averages.Used for calculation of Dose, ProjDose, TWA, TWAv DoseSQ, ProjDoseSQ.
TWA: The Time Weighted Average is the average A-weighted sound level for a nominal 8-hour working day with Time Weighting S and Exchange Rate 5. TWA is calculated from the measured LavS5 (taking Threshold Level into account) and a Reference time of 8 h. Mainly used in the USA for assessing the noise exposure for a worker during a working day.
TWAv: The Time Weighted Average for a user-defined reference period. TWAv is calculated from the measured LavS5 (taking Threshold Level into account) and the Reference Time. Used, for example, for calculating a Weekly Time Averaged Level by setting the Reference Time to 40 h.
Glossary331
Underrange Immediate underrange indicates that the broadband sound level is below the lower limit of the Linear Operating Range and is indicated separately for the two selectable frequency weightings and for the two channels (Type 2270 only). Immediate underrange is only indicated on the screen. No underrange information is saved with the final result of the measurement. In case of an underrange indication (2-channel measurements, High Range only), change to Low Range.The underrange indication is implemented as required by ISO 61672–1:2013 and does not account for the influence of self-generated noise from the microphone because the specifications for the lower limit of the Linear Operating Range apply for measurements of electrical signal inserted into the preamplifier through the applicable input device. This makes the underrange indication a dubious indicator of the quality of the measurement, especially on the more sensitive ranges.Example 1: Und. A – Immediate underrange for the A-weighted levelsExample 2: U1 AC – Immediate underrange in channel 1 for the A- and C-weighted levels
Wx Frequency weighting as defined in ISO 8041:2005:Wb: For vertical whole-body vibration, z-axis, seated, standing or recumbent person, based on ISO 2631–4Wc: For horizontal whole-body vibration, x-axis, seat back, seated person, based on ISO 2631–1Wd: For horizontal whole-body vibration, x- or y-axis, seated, standing for recumbent person, based on ISO 2631–1We: For rotational whole-body vibration, all directions, seated person, based on ISO 2631–1Wh: For hand-arm vibration, all directions, based on ISO 5349–1Wj: For vertical head vibration, x-axis recumbent person, based on ISO 2631–1Wk: For vertical whole-body vibration, z-axis seated, standing or recumbent person, based on ISO 2631–1Wm: For whole-body vibration in buildings, all directions, based on ISO 2631–2Wxb: The band-limiting part of the Wb, Wc, Wd, We, Wj or Wk filterWhb: The band-limiting part of the Wh filterWmb: The band-limiting part of the Wm filter
Z-weighting: ‘Zero’ frequency weighting is without any frequency weighting, that is, equivalent to Linear, LIN or FLAT.

Hand‐held Analyzer Types 2250 and 2270 – User Manual332
333
Index
Symbols
#CPeaks(>140dB).................................................. 327
Numerics
1/1‐ or 1/3‐octave Frequency Analysis ................. 1151/3‐octave Method............................................... 1712647‐D .................................................................. 2962‐channel Option BZ‐7229.................................... 1854184‐A ................................................. 212, 219, 3004189...................................... 55, 212, 219, 295, 3004190...................................... 55, 212, 219, 295, 3004191.............................................212, 219, 295, 3004193.............................................212, 219, 295, 3004231........................................................................ 534397‐A .................................................................. 2964513...................................................................... 2964514...................................................................... 2964533‐B .................................................................. 2964534‐B .................................................................. 2964950.............................................212, 219, 295, 3004952.............................................212, 219, 295, 3004952+EH‐2152 ..............................................212, 2194955..............................................................212, 2194955‐A ..........................................................295, 3004964.............................................212, 219, 295, 3006233‐C .................................................................. 2967820..................................................................36, 717825........................................................................ 717831........................................................................ 717841...................................................................... 1578324...................................................................... 2968341...................................................................... 2968343...................................................................... 2968347‐C .................................................................. 296
A
About Icon ............................................................ 103
About Menu..............................................................3Accelerometer Icon.................................................41Accept Pushbutton....................................................5Accredited Calibration ..........................................113Accredited/Traceable Calibration............................58Acoustic Calibration ................................................51Adaptor AO‐0657 ....................................................86Adaptor for Standard Tripod .....................................6Adaptor UC‐0211 ..................................................301Add Image to Current Measurement............... 28, 39Add New Timer Icon..............................................102Add Note to Current Measurement........................39Adding Comments on Profiles...............................133Adding Notes on Profiles.......................................133Adjust Gain of Annotation ......................................85Advanced use of the Analyzer
Tips and Tricks ..................................................79Alarm Settings.........................................................93Alhambra Colour Scheme .......................................80Alternative Measurement Method .........................16Analyzer
Assembling .......................................................14Basic Principles.................................................37Cleaning..........................................................112Components.......................................................4Display................................................................5Get to Know .....................................................31Handling Instructions .....................................112Screen.................................................................5Storing ............................................................112
Analyzer Parameters .............................................293Analyzer Reset............................................8, 12, 109Annotating
a Project .........................................................127the Profile during Measurement....................127
Annotations ............................................................64Editing ............................................................134Gain Adjustment ..............................................85
334
In Reverberation Time ................................... 159Inserting Annotations Using Explorer .............. 65Inserting Using Explorer................................... 65Paperclip Icon .................................................. 41Profile ............................................................ 127Sound Categories........................................... 133Viewing or Listening to .................................... 64
Annotations Icon .................................................... 41AO‐0440 ................................................................... 7AO‐0657.................................................................. 86AO‐0697.................................................................. 16AO‐0697 Microphone Extension Cable..................... 9AO‐0697‐D‐100....................................................... 16AO‐1476.................................................................... 7Applications
How to Update/Upgrade Them ..................... 103Installing, Updating and Upgrading ............... 103Optional ......................................................... 103Pre‐installed................................................... 103Temporarily Un‐install.................................... 106
Arcade Colour Scheme ........................................... 80Assembling your Analyzer ........................................ 3Asterisk
Next to Template ............................................. 24Automatic Measurements.................................... 101Automatic Update of Software............................. 104Auxiliary Parameters
in Reverberation Time Software .................... 163Average................................................................... 33Averaging Time ....................................................... 41A‐weighting ....................................................31, 319
B
Back‐erase Pushbutton.......................................5, 43Backlight Dim.......................................................... 81Backlight Icon .................................................42, 108Bandwidth Parameters ......................................... 239Basic Principles when using the Analyzer............... 37Battery Charge Indicator ....................................7, 12
Recalibration.................................................. 108Battery Icon .......................................................... 108Battery Pack QB‐0061............................................. 14
Troubleshooting............................................. 108Battery/power Status Icon ...............................11, 42Bottom F. for Special Leq Parameter .................... 238
Broadband Frequency Weighting ...........................23Broadband View .....................................................22Built‐in Help ............................................................36B‐weighting ...........................................................319BZ‐5298 ...................................................................36BZ‐5503 . 28, 36, 50, 65, 70, 87, 89, 103, 106, 111,
123, .....................................................141, 149, 171BZ‐5503‐A Logging Module.....................................71BZ‐5503‐B Spectrum Module..................................71BZ‐7222 .................................................................212BZ‐7222 Sound Level Meter Software................ 1, 32BZ‐7223 Frequency Analysis Software .......1, 34, 115BZ‐7224 Logging Software .........................1, 34, 123BZ‐7225 Enhanced Logging Software.........1, 34, 135BZ‐7226 Signal Recording Option...............1, 34, 141BZ‐7227 Reverberation Time Software ......1, 35, 151BZ‐7229 2‐channel Option1, 35, 103, 185, 221, 227BZ‐7230 FFT Analysis Software .............................171BZ‐7231 Tone Assessment Option.................. 35, 171
C
Calculating the Level Difference BetweenOne Band and the Adjacent Bands.................173
Calibration...............................................................51Accredited ......................................................113Acoustic............................................................51Electrical.................................................... 51, 55Filter ...............................................................113History ..............................................................55History Parameter ..........................................297Initial ..............................................................113Manual .............................................................52Regular Recalibration .....................................113Screen...............................................................39Settings.............................................................54Standard...........................................................52Vibration ..........................................................55
Calibration Interval .................................................58Calibration Reminder ..............................................57Calibration Reminder Tab........................................57Calibration Setup ..................................................299Calibrator
Sound Level ......................................................52Camera......................................................................6Camera Icon ............................................................29
335
Card SlotCF ....................................................................... 8SD...................................................................8, 9
Care, Cleaning and Storage................................... 112CCLD ..................................................................... 271CF Cards.................................................................. 12
Recommended............................................... 107Slot..................................................................... 8Troubleshooting............................................. 106
Character Keyboard................................................ 46Charge Injection Calibration.................. 58, 127, 138
CIC.................................................................. 125Charge Injection Calibration Parameter ............... 241Charging the Battery for the First Time .................. 14CIC ......................................................... 58, 127, 138
Theory.............................................................. 58With Active Level Trigger ............................... 138
CIC Ratio ...........................................................58, 59CIC Ref. Date ........................................................... 59CIC Reference Ratio ................................................ 59CIC Result
Parameters..................................................... 277CIC Result 1...................................................127, 138CIC Result 2........................................................... 127CIC Result 4........................................................... 138Cleaning the Analyzer........................................... 112Clock Display........................................................... 42Cloud ................................................................61, 65Cloud Icon............................................................... 42Cold Start................................................................ 20Colour Schemes...................................................... 80Commentary Icon.............................................41, 64Commentary Pushbutton ...................................5, 26Comments .............................................................. 64
Adding on Profiles.......................................... 133Microphone ....................................................... 5
Compact FlashCard Slot .......................................................... 12CF Cards ........................................................... 12Modems........................................................... 88
Conformance Test Certificate ............................... 114Connect RS–232 Modem
G4 Hardware.................................................... 88Hardware 1–3 .................................................. 88
Connect toa Printer ........................................................... 10
Analyzer............................................................90Analyzer via Internet Browser ..........................97GPS Receivers ...................................................97Mobile Phone...................................................69PC .....................................................................69Weather Stations..............................................97
ConnectingMicrophone Extension Cable ...........................16Preamplifier and Measurement Microphone ..15
ConnectorTriaxial LEMO....................................................10
Connector PanelG 1 – 3 ................................................................7G 4 ......................................................................8
Continuous Logging Parameter.............................137Controlling
Measurements .................................................43the Frequency Analysis Measurement...........116the Reverberation Time Measurement ..........157
Conventions Used in this Manual .............................1Copying Jobs/Projects .............................................63Cover
Hinged ................................................................6Crest Factor ...........................................................319Criterion Level.......................................................319Crossover Cable ......................................................90Current Transducer Parameter..............................294C‐weighting .................................................... 31, 319
D
Daily CIC Parameter ..............................................241Daily Noise Exposure Levels (Lep,d) or (LEX,8h) ........33Data Management ..................................................61Date Format ............................................................82Date Separator ........................................................82DDNS.......................................................................89Decay Graphs in Reverberation Time Software.....163Decay Tab in Reverberation Time Software ..........163Decay Time............................................................151Decibel (dB)...........................................................320Decimal Places
Number of ......................................................303Decimal Point ..........................................................82Default
Measurement Job/Path....................................63

336
Tone Assessment Measurement.................... 177Definition of Frequency Ranges .....................59, 173Definition of Reverberation Time ......................... 151Delete Timer Icon ................................................. 102Delete/Reconfigure Templates and Users ............ 111Deleting Jobs/Projects............................................ 63Description of Inputs/Outputs.................................. 7Description of Jobs and Projects ............................ 61DHCP....................................................................... 89Diffuse‐field Icon .................................................... 41DIRAC Room Acoustics Software Type 7841......... 157Direct Input Icon..................................................... 41Disconnecting
Preamplifier and Measurement Microphone .. 15Display
Enhanced Logging Results.............................. 138Frequency Analysis Results..116, 188, 190, 193,
198, ......................................................206, 208Locking............................................................. 50Logging Results .............................................. 127Reverberation Time Results ........................... 159Tone Assessment Results ............................... 179
Display Colour Schemes ......................................... 80Display Screen ....................................................5, 40Display Settings ...................................................... 79Displaying Noise Indicators .................................. 139DNS......................................................................... 88Document your Measurement ............................... 26Domain Name System ............................................ 88Dose...................................................................... 321DoseUQ ................................................................ 321Downgrade to an Earlier Version.......................... 105DSL Modem/Router................................................ 88Dual 10‐pole Adaptor JP‐1041............................9, 17Duration Parameter.............................................. 253Dynamic Domain Name System ............................. 89Dynamic Host Configuration Protocol .................... 89DynDNS .................................................................. 88DynDNS Settings..................................................... 86
E
Earphone Socket.................................................7, 10Economising On Power. .......................................... 85Edit Mode .........................................................47, 49Editing Annotations on Profiles ............................ 134
EH‐2152.................................................................295Elapsed Time ...........................................................41Electrical Calibration ...............................................51E‐mail Notifications.................................................96Email Notifications..................................................93Enhanced Logging
Display Results................................................138Options...........................................................136Set Up.............................................................136With Tone Assessment ...................................181
Enhanced Logging Measurement Screen..............138Enhanced Logging Software BZ‐7225............. 34, 106Equivalent Continuous Sound Level................. 32, 33
Parameters .....................................................277Ethernet Cable ........................................................90Ethernet Interface...................................................89Evaluator Type 7820......................................... 36, 71Event Marker.........................................................131Exchange Rate.......................................................321Exclude Marker ............................................ 131, 138Explorer Screen .......................................................38Exposure Time.......................................................321Ext. Power ...............................................................81Ext. Power Setting...................................................82Extended Microphone ............................................16External Event .......................................................142External Level........................................................271External Power Socket .................................7, 11, 14
F
f1 Parameter .........................................................256f2 Parameter .........................................................256Factory Default Resetting................................... 8, 12Fast Time Weighting................................................31FB‐0679 Hinged Cover...............................................6FFT Analysis Software BZ‐7230 .............................171File Format ............................................................106File Speed..............................................................106Filter Calibration ...................................................113First Check Parameter ...........................................242Formatting a Memory Card...................................107Fourth Check Parameter .......................................242Free‐field Icon .........................................................41Frequency .............................................................322Frequency Analysis

337
1/1‐ or 1/3‐octave .......................................... 115Display Results ....116, 188, 190, 193, 198, 206,
208Set up............................................................. 115
Frequency Analysis Software BZ‐7223............34, 115Frequency Weighting............................... 23, 31, 322Frequency Weighting Parameters ........................ 235Full Spectral Stat. for Reports Parameter ............. 240Full View................................................................. 47
G
G 4 ........................................................................3, 6Connector Panel ................................................ 8
Gear Ratio............................................................. 271General Parameters......................................275, 293Generator
Parameters..................................................... 266Set Up ............................................................ 116
Glossary ................................................................ 319Good Measurements.............................................. 14GPS Data................................................................. 33
Instantaneous ..........................................33, 283GPS data ................................................................. 33GPS Note ................................................. 27, 99, 277GPS Receiver........................................................... 27GPS Receivers
Connection ...................................................... 97Types................................................................ 98
G‐weighting .......................................................... 197
H
Hand‐held Analyzer ................................................ 32Handling the Analyzer .......................................... 112Hardware Maintenance........................................ 114Hardware Overview................................................ 13Hardware Setup...................................................... 13Hardware Version ...............................................3, 36
1 – 3 ................................................................... 74................................................................ 3, 6, 8
Headphone Settings ............................................... 85Help ........................................................................ 36Help Icon ..........................................................36, 42High Frequency Range.......................................... 173High Speed USB and LAN Interfaces......................... 6Hinged Cover FB‐0679 .............................................. 6
Hiss........................................................................327Hold Off Parameter ...................................... 137, 254How Do We Measure Reverberation Time?..........152How to Change Parameter Values...........................45How to Install New Applications ...........................103How to Manage the Project Templates...................48How to Move a License.........................................106How to Update/Upgrade Applications ..................103How to Use this Manual............................................1
Beginners ...........................................................2Experienced Users ..............................................2
HT‐0015.....................................................................7Hysteresis..............................................................271
I
IconAnnotations......................................................41Backlight...........................................................42Battery/power Status .......................................42Cloud ................................................................42Commentary ....................................................41Help ........................................................... 36, 42Input Microphone Parameter ..........................41Loudspeaker .....................................................26Main Menu.......................................................42No Windscreen Fitted ......................................41Overload...........................................................41Pause................................................................41PC .....................................................................41Power Supply Connected .................................42Running ............................................................41Stopped ............................................................41Text...................................................................27Transducers ......................................................41Windscreen Fitted/Diffuse Field ......................41
IEC 61672–1 standard .............................................14Image
Adding ..............................................................28Adding to Current Measurement .....................39View .................................................................29
Image Event ..........................................................142Image Icon...............................................................65Impulse Time Weighting .........................................31Impulse Trigger Parameter....................................245Impulsive Method.................................................156

338
Reverberation Time ....................................... 154Indicator, Status........................................................ 5Indoor Colour Scheme............................................ 80Initial Calibration .................................................. 113Input ...................................................................7, 11Input 1 .................................................................... 11Input Ch. 1 for Type 2270 ..................................... 232Input Ch. 2 for Type 2270 ....................................... 11Input for Microphone............................................... 9Input Microphone
Parameter Icon ................................................ 41Input Parameters
Channel 1 for Type 2270 ................................ 232For Type 2250 ................................................ 232For Type 2270 ................................................ 232
Inserting Annotations Using Explorer..................... 65Install
Applications ................................................... 103Language.......................................................... 83
Install Language.................................................... 103Instantaneous
GPS Data ..................................................33, 283Measured Spectra.......................................... 284Peak Sound Levels ........................................... 33Time‐weighted Sound Levels ........................... 33Weather Data ..........................................33, 283
Instantaneous GPS data ......................................... 34Instantaneous Measured Parameters ..... 33, 34, 283
Instantaneous Time‐weighted Sound Levels . 283Peak Sound Level ........................................... 283Sound Pressure Level..................................... 283
Instantaneous RPM .............................................. 283Instantaneous Time‐weighted parameters............. 34Instantaneous Time‐weighted Sound Level Parameters ........................................................... 283Internal Battery Pack ................................................ 6Internet Browsers
Connection via ................................................. 97Supported ........................................................ 97
Interrupted Noise Method ................................... 156Reverberation Time ....................................... 152
Introduction.............................................................. 1ISO 1996‐2, Annex D
Tone Assessment Calculations ....................... 172ISO/EU Occupational Health Parameters .....275, 278
J
Javascript Support...................................................97Jobs .........................................................................61JP‐1041......................................................................9
L
LA90.0 .....................................................................324LAE .................................................................. 33, 323LAeq ..........................................................32, 33, 323LAeq,T,mov ........................................................ 33, 323LAeq,T,mov,max .................................................. 33, 323LAF .................................................................. 33, 324LAF(SPL) ...................................................................324LAF90.0....................................................................324LAFmax............................................................. 33, 324LAFmin ....................................................................324LAFTeq.....................................................................324LAN..........................................................................41LAN Connection ......................................................89LAN Interface ............................................................6LAN Socket ......................................................... 8, 12Languages ...............................................................83
Install..............................................................103Last Calibration Date...............................................58Latitude...................................................................28LavS5.........................................................................33LavUQ .....................................................................324LCpeak.............................................................. 33, 325LCpeak,1s .......................................................... 33, 325Lday ........................................................................325Lden........................................................................325Lden Periods .........................................................264Lep,d.......................................................................325Lep,d,v.....................................................................325Leq ...........................................................................32Level Average
with Exchange Rates 4, 5 or 6 ..........................33Level Event Marker ...............................................131Level Trigger 1 Parameters....................................254Level Trigger 2 Parameters....................................256Level Trigger 3 Parameters....................................256Level Trigger 4 Parameters....................................256Level Trigger Parameters.......................................250Level Triggers ........................................................137Levening ..................................................................325

339
License Mover VP‐0647 ........................................ 106Licenses ................................................................ 103
How to Move Them ....................................... 106Link‐local................................................................. 89Listening to Annotations ........................................ 64Ln .......................................................................... 325Lnight ..................................................................... 325Locking
Pushbuttons and Display ................................. 50the Template.................................................... 47
Logged Broadband (100ms) Parameters.............. 245Logged Broadband Parameters ............................ 245Logged Measurement Parameters
Broadband Parameters .................................. 282Equivalent Continuous Sound Levels .....277, 280For Enhanced Logging Software ............280, 282For Logging Software .............................280, 282Maximum Time‐weighted Sound Levels 278, 280Minimum Time‐weighted Sound Levels.278, 281Parameters Available Per Logging Interval .... 281Parameters to be Logged and Displayed onSpectrum Display ........................................... 282Sound Exposure Level............................278, 280Special....................................................279, 281Statistics to Calculate..................................... 281US Occupational Health .........................278, 281
Logged Spectrum Parameters .............................. 248Logging ................................................................. 123
Display Results ............................................... 127Options .......................................................... 123Set Up ............................................................ 124With Signal Recording.................................... 144With Tone Assessment .................................. 180Without Frequency Analysis Software .......... 124
Logging Module BZ‐5503‐A .................................... 71Logging Period Parameter .................................... 240Logging Software BZ‐7224..................... 34, 106, 123Longitude................................................................ 28Loudness.......................................................120, 326Loudness Level .............................................120, 326Loudness Parameter............................................. 232Loudspeaker Icon ...........................................26, 156Low Frequency ............................276, 279, 281, 283Low Frequency Option BZ‐7234 ........................... 195Low Frequency Range .......................................... 173Low‐frequency.............................276, 279, 281, 283
LWeq.......................................................................284LWeq(f1‐f2).................................................... 246, 281LWUN1 Parameter ................................................284LWUN7 Parameter ................................................284LXE .........................................................................246LXeq(f1‐f2)..................................................... 120, 137LXN1 Parameter ....................................................284LXN7 Parameter ....................................................284LXUN1 Parameter..................................................284LXUN7 Parameter..................................................284LYE..........................................................................246LZeq........................................................................120
M
Main Menu Icon................................................. 5, 42Main Spectrum Icon..............................................117Mains Power Supply........................................... 7, 14Making your First Measurement.............................19Manual Calibration .................................................52Manual Event ........................................................142Manual Event Marker ...........................................131Manual Event Pushbutton ........................................5Manual Ext. Power Switch ......................................82Map Based Measurement Parameter ...................243Maps in Reverberation Time Software..................165Markers ...............................125, 130, 131, 249, 258
Editing ............................................................132Event ..............................................................131Exclude ...........................................................131Level Event .....................................................131Sound .............................................................131Use of Pushbuttons ........................................131With Types 7820 and 7825.............................131
Marking Sound Categories ....................................131Maximum Time‐weighted parameters....................33Maximum Time‐weighted Sound Levels ........ 33, 274
Parameters ............................................ 278, 280Measurement Control Parameters
for BZ‐7222 to BZ‐7225...................................240for Reverberation Time Software BZ‐7227 .....243
Measurement Feedback in the Status Field............22Measurement Microphone.......................................5
Connecting .......................................................15Disconnecting...................................................15Mounting the ...................................................14
340
Placing the ....................................................... 14Measurement Mode Parameter.....................23, 240Measurement Parameters.................................... 273Measurement Partner Cloud............................61, 65Measurement Partner Suite .............................31, 65Measurement Partner Suite BZ‐5503 .28, 36, 50, 70,
103, ................................... 106, 111, 123, 141, 171Measurements ....................................................... 20
Alternative Method ......................................... 16Convenient....................................................... 17Default Job/Path .............................................. 63Documenting ................................................... 26Making your First ............................................. 19Organising........................................................ 61Preparing ......................................................... 99Recalling........................................................... 64Reset ............................................................5, 43Saving............................................................... 24Serial .............................................................. 157Tone Assessment ........................................... 179with Graphical Position Management ........... 165
Memory DevicesFormatting ..................................................... 106
Metadata ..........................64, 65, 99, 100, 101, 214Metadata Tab ......................................................... 65Micro USB................................................................. 8Microphone
Extension Cable ................................................. 9Measurement .................................................... 5Mounting ......................................................... 17Secondary .......................................................... 5Type 4189 .......................................................... 9Type 4193 ...................................................... 301
Microphone Extension CableConnecting....................................................... 16
Microphone for Commentary................................... 5Microphone Holder UA‐1317 ................................. 17Microphone Input .................................................... 9Microphone Type Parameter................................ 295Microphones
Connecting Two Microphones ......................... 17Overview for Type 2250/2270........................ 300
Mid Frequency Range........................................... 173Mini USB................................................................... 7Minijack Earphone Socket ...................................... 10Minimum Time‐weighted parameters.................... 33
Minimum Time‐weighted Sound Level Parameters ....275, ............................................................. 278, 281Minimum Time‐weighted Sound Levels
(LAFmin) .............................................................33MM‐0256 ................................................................97MM‐0316 ................................................................97Mobile Phone Connection ......................................69Modem Settings......................................................86Modems
RS–232 Interface ..............................................88Settings.............................................................86Tested ...............................................................86USB Interface....................................................88
MountingAnalyzer............................................................15Measurement Microphone ..............................14Microphone......................................................17Outdoor Microphone Kit ..................................16Windscreen ......................................................15
Mounting ThreadFor Wrist Strap ...................................................6Tripod .................................................................6
Moving Equivalent Continuous Sound Level.. 33, 323Moving Jobs/Projects..............................................63MP Cloud.......................................................... 61, 65MPS.........................................................................86
See also Measurement Partner Suite...............28Multi‐user Facility ...................................................83
N
Navigating in Jobs ...................................................62Navigation Principles
Star Navigation Concept...................................37Navigation Pushbuttons..................................... 5, 44NC Decisive Band Parameter ................................284
Definition .......................................................327NC Parameter............................................... 120, 284
Definition .......................................................327NCB Classification Parameter................................284
Definition .......................................................327NCB Parameter............................................. 120, 284
Definition .......................................................327Network Connection...............................................69Network Settings.....................................................89
Parameters .......................................................91
341
New ApplicationsHow to Install Them....................................... 103
New User Set Up..................................................... 84Next Calibration Date ............................................. 58Night Colour Scheme.............................................. 80NMT Server Settings............................................. 317No Windscreen Fitted/Diffuse Field Icon ............... 41No Windscreen Fitted/Free‐field Icon.................... 41No Windscreen Icon ............................................... 41Noise Curve .......................................................... 120Noise Dose (Dose, DoseS5) .................................... 33Noise Indicators.................................................... 276Noise Parameters ................................................. 120Notes ...................................................................... 65
Add Note to Current Measurement................. 27Adding on Profiles.......................................... 133Adding to Current Measurement..................... 39
Notes Screen .......................................................... 99Notifications ........................................................... 93
Content ............................................................ 95NR Decisive Band Parameter ................................ 284
Definition ....................................................... 327NR Parameter ...............................................120, 284
Definition ....................................................... 327Number Keyboard .................................................. 45Number of Decimal Places ................................... 303Number of Peaks (#CPeaks(>140 dB)) .................... 33
O
Occupational Health Parameters.......................... 265Occupational Health Standards ............................ 328On‐screen Feedback ............................................... 44Ordering Information ........................................... 227Organising Measurements...................................... 61Outdoor Colour Scheme......................................... 80Outdoor Microphone Kit ........................................ 16
Mounting ......................................................... 16Output ...................................................................... 7Output of Headphone Socket ................................. 85Output Socket......................................................... 10Output Socket Signal Parameters ......................... 263Overload Icon ......................................................... 41Overload Parameter ............................................. 246Overview
of Smileys....................................................... 121
of Type 2250/2270 Microphones....................300Overview Tab in Reverberation Time Software.....159Overwriting a Locked Template ..............................48
P
Padlock Icon ............................................................47Paperclip .................................................................41Parallel Measurements .........................................157
Automated Sequence.....................................158Parameters
Analyzer..........................................................293General...........................................................293
Password.......................................................... 47, 97Pasting Jobs/Projects ..............................................63Pattern Evaluation.................................................209Pause Icon ...............................................................41PC Connection.........................................................69PC Icon ....................................................................41PCL ..........................................................................86Peak.........................................................................33Peak Sound Level ......................................... 278, 280Peak Sound Level Parameters ...................... 274, 283Peak Sound Levels...................................................33Percentile Levels (LAF90.0) .......................................33Performing a Manual CIC Calibration......................59Periodic Report Parameters
General Parameters........................................278Spectrum Parameters.....................................280
Periodic Reports........................................... 135, 277Placing the Measurement Microphone ..................14Point and Shoot.......................................................19Polarization Voltage Parameter ............................296Position ...................................................................28Post‐processing and Reporting ...............................71Post‐processing Parameters......................... 268, 269Power Consumption ...............................................81Power Off ................................................................30Power Settings ................................................. 80, 82Power Settings Screen ............................................81Power Supply Connected Icon ......................... 11, 42Power‐on Pushbutton ...............................................5Preamplifier ....................................................... 5, 15
Connecting .......................................................15Disconnecting...................................................15
Preferences ...........................................................303
342
Preferences Screen...........................................38, 79Prepare Measurements .......................................... 99Profile View ......................................... 128, 129, 139
Status Field .................................................... 128ProjDose ............................................................... 321ProjDoseUQ .......................................................... 321Project Name.......................................................... 61Project Template .................................................... 24
Edit Mode ........................................................ 49Enhanced Logging............................................ 24Frequency Analysis .......................................... 24Logging ............................................................ 24Re‐create.......................................................... 50Sound Level Meter.....................................21, 24
Project Template Bar .............................................. 40Projects................................................................... 61Protector Type 7825 ............................................... 71PSIL ...................................................... 120, 246, 329Pull Up .................................................................. 271PULSE Multi‐analyzer ............................................. 71Pushbuttons
Accept................................................................ 5Back‐erase....................................................5, 43Commentary................................................5, 26Locking............................................................. 50Manual Event..................................................... 5Navigation.......................................................... 5Power‐on ........................................................... 5Reset Measurement ....................................5, 43Save ...........................................................24, 43Start/Pause ........................................... 5, 21, 43Store .................................................................. 5Use of............................................................... 45
Q
Qualifier Light Type 7831........................................ 71Quality Indicators
In Frequency Analysis Software..................... 121In Reverberation Time Software .................... 169In Tone Assessment Software ........................ 181
Quick Start Guide ................................................... 19Quick View ............................................................. 47
R
Range Setting...............................186, 198, 206, 208
RC Classification ....................................................329RC Classification Parameter ..................................284RC Parameter ............................................... 120, 284
Definition .......................................................329Rear Socket ..................................... 11, 57, 106, 294Recalibration of Battery Charge Indicator.............108Recalling
Measurements .................................................64Saved Measurements ........... 183, 188, 190, 193
Recording Icon ......................................................143Recording Signals ......................................... 127, 141Re‐create Deleted Template....................................50Reference Spectrum Icon......................................117Reference Time .....................................................328Regional Settings.....................................................82Regional Settings Screen.........................................82Regular Recalibration............................................113Re‐installing Software ...........................................111Reminder Pop‐up ............................................. 58, 60Rental ....................................................................114Repair........................................................... 112, 113Report Period Parameter ............................. 137, 240Reset
Analyzer...............................................8, 12, 109Button at Bottom ................................8, 12, 109Measurement.............................................. 5, 43Options...........................................................109Pushbutton.................................................. 5, 43to Factory Default................................8, 12, 109
Resolution of Readings............................................80Result Selector ......................................................138Results
Display in Enhanced Logging Software...........138Display in Frequency Analysis Software ........116,
188, .............................190, 193, 198, 206, 208Display in Logging Software ...........................127Display in Reverberation Time Software ........159Display in Tone Assessment Software ............179
Re‐using Setups from Projects ................................64Reverberation Time.................................................24
Annotations....................................................159Decay Tab .......................................................163Definition .......................................................151Display Results................................................159Impulsive Excitation Method .........................154Interrupted Noise Method .............................152
343
Overview Tab ................................................. 159Parallel Measurements .................................. 157Serial Measurements..................................... 157Set Up ............................................................ 155Spectrum Tab................................................. 161Typical Measurement Setup .......................... 153
Reverberation Time Software BZ‐7227...........35, 151RPM Gear Ratio .................................................... 271Rumble .........................................................327, 329Running Icon........................................................... 41RV Parameter
Noise Criteria ................................................. 327
S
SaveEnhanced Logging Results.............................. 140Frequency Analysis Results............................ 121Logging Results .............................................. 134Measurement ............................................24, 63Periodically with Logging ............................... 123Reverberation Time Results ........................... 170Settings ............................................................ 49
Save As Icon............................................................ 49Save Icon................................................................. 49Save Project Data at Parameter............................ 137Save Pushbutton........................................ 24, 43, 63Saved Measurement
Viewing............................................................ 25Screen.................................................................5, 40SD Cards
Recommended............................................... 107Slot...............................................................9, 12Troubleshooting............................................. 106
SDHC Memory Cards .............................................. 12Second Check Parameter...................................... 242Secondary Microphone ............................................ 5Secure Digital
Card Slot .......................................................... 12High Capacity Memory Cards .......................... 12SD Cards........................................................... 12SDHC ................................................................ 12
SelectingDefault Measurement Job/Path ...................... 63Tone Assessment Option ............................... 175
Serial Measurements............................................ 157
Automated Sequence.....................................158Server Settings
NMT................................................................317Service and Repair ................................................112Services
Calibration......................................................113Filter Calibration.............................................113Hardware Maintenance .................................114Initial Calibration............................................113Regular Recalibration .....................................113Rental .............................................................114Repair .............................................................113Service Agreement .........................................113Training...........................................................114
Set UpEnhanced Logging ..........................................136Frequency Analyzer........................................115Generator .......................................................116Logging ...........................................................124New Users ........................................................84Reverberation Time........................................155Sound Level Meter Project Template ...............20Tone Assessment............................................175Transducer......................................................295
Setting up a Tone Assessment MeasurementDefault Setup .................................................177Manually using ISO 1996–2, Annex D ............176Manually using Italian Law.............................176
Setting up the AnalyzerBuilding Vibration ..........................................205
SettingsAlarm................................................................93DynDNS ............................................................86Modem.............................................................86
SetupEdit Mode.................................................. 47, 49G‐weighting....................................................197Parameters .....................................................231
Setup Screen ...........................................................38Shortcut Bar ..................................................... 40, 42Signal Recording...................................116, 138, 141
Import ..............................................................71Parameters .....................................................258Playback .........................................................130Setting ............................................................126Size .................................................................131

344
With PULSE Multi‐analyzer............................ 149With Reverberation Time............................... 157With Tone Assessment .................................. 178
Signal Recording Option BZ‐7226 .......... 34, 106, 141Signal Recording Timer ......................................... 137SIL ........................................................ 120, 246, 329SIL3 ...................................................... 120, 246, 329SLM (Sound Level Meter) ....................................... 31Slope of Trigger..................................................... 271Slot
for Compact Flash (CF) Cards........................... 12for Secure Digital (SD) Cards ............................ 12
Slow Time Weighting .............................................. 31Small Tripod......................................................15, 17Smileys
Codes and Remedies in Tone Assessment ..... 182In Frequency Analysis Software..................... 121In Reverberation Time Software .................... 169In Tone Assessment Software ........................ 181
SMS Notifications .............................................93, 95while Online..................................................... 96
SocketsTrigger Input ...................................................... 9
Software Version .................................................... 36Sound Calibrator...............................................52, 53Sound Category .................................................... 131Sound Definition................................................... 330Sound Exposure (E)................................................. 33Sound Exposure Level............................................. 33Sound Exposure Level Parameters ...... 274, 278, 280Sound Level .......................................................... 330Sound Level Calibration.......................................... 52Sound Level Meter
Definition ......................................................... 31Project Template........................................19, 20Set up............................................................... 20Standards....................................................... 209
Sound Level Meter SoftwareStart‐up............................................................ 20
Sound Level Meter Software BZ‐7222 .................... 32Sound Marker...............................................131, 145Sound Pressure Level......................................33, 330
Parameters..................................................... 283Special Parameters .............................. 275, 279, 281Specifications........................................................ 209
1/3‐octave Based Tone Assessment ............... 223
2250 Enhanced Logging Software BZ‐7225 ....2172250 Frequency Analysis Software BZ‐7223 ..2152250 Logging Software BZ‐7224.....................2162250 Reverberation Time Software BZ‐7227..2182250 Sound Level Meter Software BZ‐7222...212FFT Based Tone Assessment...........................223Sound Recording Option BZ‐7226 ..................218Tone Assessment Option BZ‐7231..................223Type 2250/2270 Platform ...................... 209, 229
Spectrum Graphin Reverberation Time Software.....................161
Spectrum Module BZ‐5503‐B..................................71Spectrum Parameters ...........................................276Spectrum Statistics ...............................................189Spectrum Tab
in Frequency Analysis Software .....................117in Reverberation Time Software.....................161
Spectrum Weighting .............................................189Standard Calibration ...............................................52Standards ................................................................14Standby Mode............................................20, 81, 82Star
Next to Template..............................................24Star Navigation Concept .........................................37Start Duration Parameter......................................254Start Level Parameter ...........................................254Start Slope Parameter...........................................254Start Time Parameter ............................................254Start/Pause Pushbutton...............................5, 21, 43Start‐up
Initial Sound Level Meter Screen .....................20Statistics Parameter ..................................... 239, 245Statistics to Calculate ............................................281Statistics to Calculate Percentile Levels ....... 276, 279Status Codes
In Tone Assessment Software ........................181Status Field....................................................... 40, 41
in Logging Profile............................................128in Reverberation Time Software.....................160
Status Indicator .........................................................5Stop Duration Parameter ......................................254Stop Level Parameter ............................................254Stop Time Parameter ............................................254Stopped Icon ...........................................................41Storage Settings Screen ..........................................85Store Pushbutton ......................................................5
345
Storing the Analyzer ............................................. 112Stylus ..................................................................5, 44
Usage ............................................................... 45Switch On and Charge Setting ................................ 82Switching Off .......................................................... 30Switching On........................................................... 20Synchronize with Clock Parameter ....................... 253
T
Table Format Icon................................................. 119Tables in Reverberation Time Software ................ 160Tacho .................................................................... 271Tacho Input............................................................. 10Tacho Probe Connection .......................................... 7TCpeak.................................................................... 330Template Explorer .................................................. 39Templates ............................................................... 24
Asterisks........................................................... 24Delete or Reconfigure.................................... 111
Temporarily Un‐install Applications...................... 106Text Icon ...........................................................27, 65Text Messages...................................................93, 95Theory of CIC .......................................................... 58Third Check Parameter ......................................... 242Threshold Level .................................................... 330Time for Peak.......................................................... 33Time for Peak Sound Levels (TCpeak) ....................... 33Time Remaining .................................................... 108Time Weighted Average (TWA)............................... 33Time Weightings .............................................31, 322Time Zone ............................................................... 82Timed Measured Parameters.................................. 33Timer Event Parameter ......................................... 258Timer Period Parameter ....................................... 253Timer Setup Screen............................................... 102Timers ................................................................... 101
Delete ............................................................ 102Setup................................................................ 40When Analyzer On......................................... 101with Switch‐on Time ...................................... 101
Tone Assessment .................................................. 116According to ISO 1996‐2, Annex D................. 172According to Italian Law ................................ 174Default Setup ................................................. 177Display Results ............................................... 179
Manual Measurement....................................176Measuring ......................................................179Set Up.............................................................175Smileys and Remedies....................................182Using Enhanced Logging Template.................181Using Logging Template..................................180With Signal Recording ....................................178
Tone Assessment Option BZ‐7231.................. 35, 171Top Freq. for Special Leq Parameter .....................238Top Socket ............................................................ 6, 9Total Measurement Parameters
CIC Results......................................................277Equivalent Continuous Sound Level ...............274For BZ‐7222 ....................................................274For BZ‐7223 ....................................................274For BZ‐7224 ....................................................274For BZ‐7225 ....................................................274General...........................................................275ISO/EU Occupational Health ..........................275Low‐frequency Parameters .. 276, 279, 281, 283Maximum Time‐weighted Sound Levels.........274Minimum Time‐weighted Sound Level...........275Peak Sound Level............................................274Sound Exposure Level ....................................274Special ............................................................275Spectrum........................................................276Statistics to Calculate Percentile Levels asspectra............................................................277US Occupational Health .................................275Weather Data Parameters..............................276
Total Parameter............................................ 127, 138Touch Screen...................................................... 5, 40
Troubleshooting .............................................108Touch‐sensitive Screen............................................40Traffic Light..............................................................44Training .................................................................114Transducer
Connecting .....................................................186Icons .................................................................41Setup ..............................................................295
Transducer Database...............................................55Transducer Parameters .........................................295Transducers Screen .................................................39Transfer
Data..................................................................69Templates .........................................................50
346
Triaxial LEMO connector ........................................ 10Trigger Input........................................................... 10
Socket ................................................................ 9Trigger Parameters ............................................... 253Triggers Parameter ............................................... 137Tripod ..................................................................... 15
Adaptor ............................................................. 6Extension Stem................................................ 15Mounting Thread............................................... 6Small.......................................................... 15, 17
Troubleshooting ................................................... 106Battery Charge Indicator ............................... 108Battery Pack .................................................. 108Reset Options ................................................ 109SD and CF Cards............................................. 106Touch Screen ................................................. 108USB Stick........................................................ 106When Selecting an Interval for Storing ......... 147When Setting a Marker ................................. 147
Turn off Backlight ................................................... 81TWA...................................................................... 330TWAv .................................................................... 330Type 2250
Input Parameters........................................... 232Type 2250/2270 Microphones.............................. 300Type 2270
Camera .............................................................. 6Channel 1 ........................................................ 11Channel 2 ........................................................ 11Connecting Two Microphones......................... 17High Speed USB and LAN Interfaces.................. 6Input Parameters........................................... 232Input Parameters Channel 1.......................... 232
Type 4189 Microphone ............................................ 9Type 4964............................................................. 301Type Approval ...................................................... 209
U
UA‐0587 ................................................................. 15UA‐0801 ........................................................... 15, 17UA‐1317 ................................................................. 17UA‐1404 ................................................................. 16UA‐1650 ................................................................. 15UA‐1651 ................................................................. 15UA‐1673 ................................................................... 6
UC‐0211 ...............................................212, 295, 300UL‐1019 .................................................................. 90Unlock.............................................................. 48, 50Update or Upgrade ............................................... 104Updating Applications .......................................... 103Upgrading Applications......................................... 103Upload to MP Cloud................................................ 67US Occupational Health Parameters....275, 278, 281USB Connection...................................................... 69USB Interface ....................................................... 6, 9USB Stick
Troubleshooting ............................................. 106USB Type A.............................................................. 88
Socket ................................................................ 9Use of
Navigation Pushbuttons................................... 44Pushbuttons for Controlling Measurements....43Stylus................................................................ 44
UsersDelete or Reconfigure .................................... 111New.................................................................. 84
Users and Projects ................................................ 306Users and Projects Parameter ................................ 83
V
Versions .................................................................. 36Vibration Calibration .............................................. 60View and Control Instrument Web Page ................ 77View Area ............................................................... 42View Instrument Web Page .................................... 76Viewing
Annotations ..................................................... 64Data.................................................................. 64Saved Measurement ........................................ 25
Viewing Data .......................................................... 64Views ...................................................................... 40Voltage.................................................................. 283VP‐0647 ................................................................ 106
W
Warm Start ............................................................. 20Weather.................................................................. 98Weather Data ............................... 33, 276, 279, 282
Instantaneous ......................................... 33, 283Weather Station MM‐0256..................................... 97

347
Weather Station MM‐0316 .................................... 97Weather Stations
Connection ...................................................... 97Types................................................................ 97
Web Page for Veiwing and Control......................... 77Welcome .................................................................. 1What is a Project Template?................................... 20What is the Hand‐held Analyzer? ........................... 32Wi‐Fi ....................................................................... 41
Parameters....................................................... 92Wi‐Fi Connection.................................................... 90Wind Parameters.................................................... 98Windscreen
Mounting ......................................................... 15Windscreen Fitted Icon .......................................... 41Windscreen Fitted/Diffuse Field Icon..................... 41
Wired Connection ...................................................90Wireless LAN
Connection .......................................................89WLAN ......................................................................89Wrist Strap
Mounting Thread ...............................................6
X
XL View ...................................................................22
Z
ZC‐0032............................................................ 15, 55ZG‐0426.............................................................. 7, 14Z‐weighting .............................................................31

348


USER MANUAL
www.bksv.com © Brüel & Kjær. All rights reserved.
Hand-held AnalyzerTypes 2250 and 2270
With Sound Level Meter Software BZ-7222,Frequency Analysis Software BZ-7223,Logging Software BZ-7224,Enhanced Logging Software BZ -7225,Signal Recording Option BZ-7226, Reverberation Time Software BZ-7227,2-channel Option BZ-7229Tone Assessment Option BZ-7231 and Enhanced Vibration and Low Frequency Option BZ-7234BE 1713 – 32English
ËBE-1713---|Î
BE17
13–
32