HAMMARBY SJÖSTAD - Energy...
131
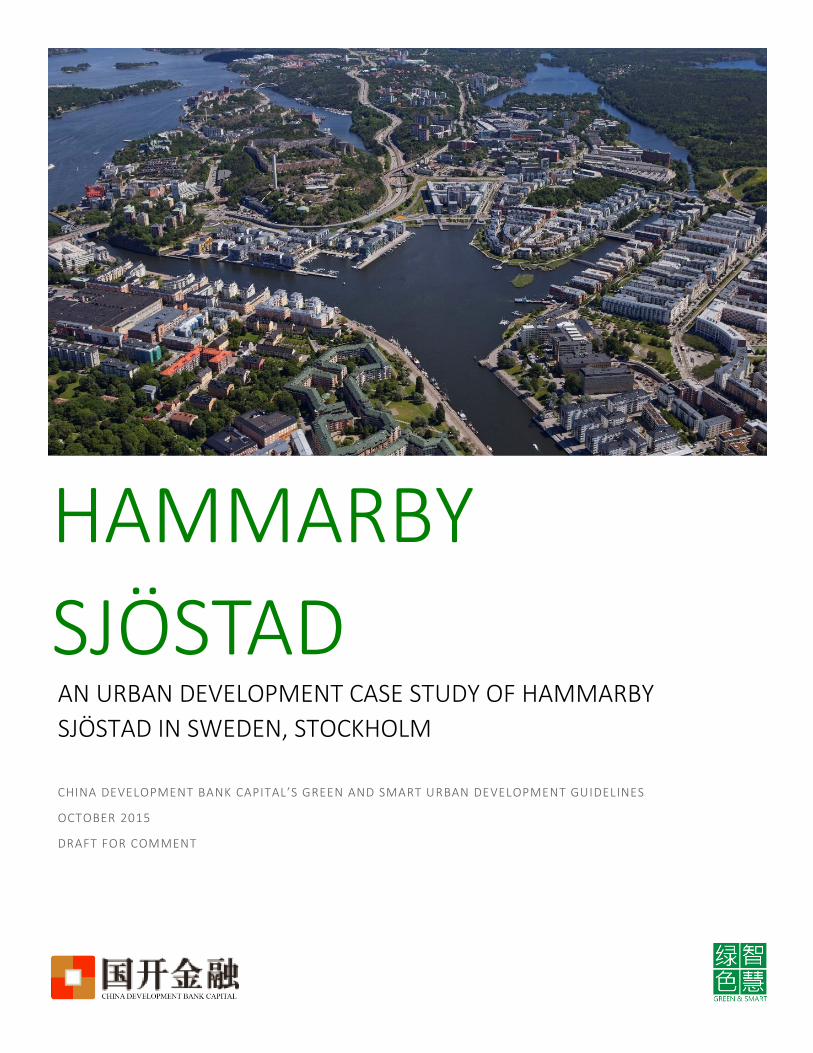
0 HAMMARBY SJÖSTAD AN URBAN DEVELOPMENT CASE STUDY OF HAMMARBY SJÖSTAD IN SWEDEN, STOCKHOLM CHINA DEVELOPMENT BANK CAPITAL’S GREEN AND SMART URBAN DEVELOPMENT GUIDELINES OCTOBER 2015 DRAFT FOR COMMENT
Transcript of HAMMARBY SJÖSTAD - Energy...
0
HAMMARBY
SJÖSTAD AN URBAN DEVELOPMENT CASE STUDY OF HAMMARBY
SJÖSTAD IN SWEDEN, STOCKHOLM
CHINA DEVELOPMENT BANK CAPITAL’S GREEN AND SMART URBAN DEVELOPMENT GUIDELINES
OCTOBER 2015
DRAFT FOR COMMENT
China Development Bank Capital (CDBC) was established in August 2009 and is the wholly-owned subsidiary of China
Development Bank, approved by State Council, with registered capital of RMB 50 billion. CDB Capital is primarily
involved in equity investment and has a total value RMB 300 billion assets under its management. CDBC is a
comprehensive and strategic investment platform with domestic and international business. CDBC’s four major
business segments are urban development, industrial investment, and overseas investment and fund management.
The first three segments (urban development, industrial investment, and overseas investment all serve China’s
urbanization, industrialization, and globalization.
Energy Innovation’s mission is to accelerate progress in clean energy by supporting the policies that most effectively
reduce greenhouse gas emissions. Through customized research and analysis for decision makers, we uncover the
strategies that will produce the largest results. We work closely with other experts, NGOs, the media, and the
private sector to ensure that our work complements theirs.
Energy Foundation China, established in Beijing in 1999, is a grantmaking charity organization dedicated to China’s
sustainable energy development. It is registered under the Ministry of Civil Affairs as Energy Foundation Beijing
Representative office and supervised by the National Development and Reform Commission of China. It is a part of
the Energy Foundation, which is based in San Francisco, California, U.S.A.
Our mission is to assist in China's transition to a sustainable energy future by promoting energy efficiency and
renewable energy. We support policy research, standard development, capacity building, and best practices
dissemination in the eight sectors of buildings, electric utilities, environmental management, industry, low-carbon
development, renewable energy, sustainable cities and transportation.
Sweco is the leading architecture and engineering consultancy in Europe. Our 14,500 engineers, architects and
environmental experts plan and design the communities and cities of the future.
We approach small analytical assignments and major design assignments with the same high level of commitment
and recognised expertise. Sweco carries out tens of thousands of assignments each year in around 70 countries
across the globe. Whatever challenge you’re facing, you can count on Sweco to solve it.
Authors:
Jonas Jernberg, Sweco
Sara Hedenskog, Sweco
CC Huang, Energy Innovation
Co-Authors and Contributors:
Lara Borges, Jean-Simon Patrik Waarenpäre, Sofia Klugman, Ma Jingjing, Anna Älgevik, Sweco
Martin Skillbäck, Project Director, Hammarby Sjöstad, City of Stockholm,
Martin Edfeldt, Planning Director, Hammarby Sjöstad, City of Stockholm,
Susanne Bäckström, Former Vice Planning Manager (12 years), Hammarby Sjöstad, City of Stockholm. Today regional Manager Sweco Architects,
Jonas Törnblom, Senior Vice President, Corporate Marketing & Public Affairs, Envac Group,
Allan Larsson, Former Finance Minister of Sweden, Resident Hammarby Sjöstad, Chairman of the ElectriCITY – Hammarby Sjöstad 2020(HS2020),
Örjan Svane, Professor Emeritus of sustainable urban development KTH Strategic Environmental Analysis fms, School of Architecture and the Built Environment.
FOREWORD At the United Nations General Assembly session in September 2015, President Xi Jinping committed
China to being a global leader in tackling climate change. Green, low-carbon, and smart new-type urban
development will play an important role in alleviating climate change. This development strategy has also
been the core objective of China Development Bank Capital’s (CDBC) efforts towards new-type
urbanization in the past few years.
As urban development practices have evolved, we profoundly feel that the ideals behind green and smart
development have already become common belief. Everyone wants to realize these ideals, but there is
still the question of how it can be done. Not only are there no successful case studies in China, there are
few internationally, and many of these experiences have been limited and dispersed in scope. We need to
integrate existing domestic and international experience with the conditions of China’s new-type urban
development to create a comprehensive and working model. Only then can we rapidly expand this model
and achieve significant progress.
Hence, two years ago, CDBC’s International Advisory Group for Green and Smart Urbanization began
work on CDBC’s Green and Smart Urban Development Guidelines with the intent to create a benchmark
for green and smart urban development to be used in China and internationally. In these two years, we
have gathered input from over a hundred urban planners, mayors, developers, experts, and other
industry players. We also surveyed international best practices in the context of China’s unique economic,
environmental, and social conditions. With this foundation, we created the 12 Green Guidelines and the
Six Smart Guidelines. We were careful not to create a long list of desirable options, but instead focused on
the most critical and foundational design elements of green, smart, livable, and economically successful
urban development. The design elements featured in the Green and Smart Urban Development
Guidelines are already in practice in a number of cities in both developed and developing countries. A
well-designed city can reduce congestion, improve air quality, reduce noise pollution, and decrease
energy use. It can create enjoyable spaces for everyone, from children to the elderly, and increases
options for daily life. It makes neighborhoods more attractive and livable, and creates cities with more
vitality and economic prosperity.
These guidelines include two case studies, one on the Pearl District and Brewery Blocks in Portland,
Oregon and the other on Hammarby Sjöstad in Stockholm, Sweden. These two cases show that our
guidelines can achieve both economic and environmental benefits. The case studies detail the
process to success, including the regulatory, financing, and technical mechanisms that were part of each
urban area’s development strategy.
12 GREEN GUIDELINES The 12 Green Guidelines fall into three key categories: urban form, transportation, and energy and resources. These guidelines are measurable and practical, and they concisely describe the foundations of sustainable urban development:
Urban Form: Urban growth boundary, Transit-Oriented Development, Mixed-Use, Small Blocks, Public Green Space
Transportation: Non-motorized Transit, Public Transit, Car Control
Energy and Resources: Green Buildings, Renewable and Distributed Energy, Waste Management, Water Efficiency
SIX SMART GUIDELINES The Six Smart Guidelines are designed to optimize the green guidelines. “Smart” provides for more optimal ways to achieve green results. When done in addition to the 12 Green Guidelines, smart technologies can capture additional economic, environmental, and social benefits. The Smart Guidelines fall into six key categories:
Smart Telecommunications
Smart Mobility
Smart Energy Management
Smart Governance
Smart Public Services
Smart Safety
The Six Smart Guidelines emphasize the importance data analysis and optimization. We focus on case
studies with returns on investment to demonstrate the application of these smart technologies.
As our time and experience is limited, this edition of CDBC’s Green and Smart Urban Development
Guidelines is still in development. Particularly as global green and smart practices evolve, these guidelines
will need to be added to and improved on. CDBC is an important player in China’s urbanization, and we
hope to collaborate with other players in China and internationally to put these guidelines into practice
and advance, for the long-term, the sustainable urban development of China. Moreover, we hope that
Chinese and international partners will continue to introduce us to global best practices and potential
collaborators. We hope to expand the perspective of Chinese urban developers and involve world-class
international developers in China’s urbanization process to create opportunities and achieve mutual
benefits.
Zuo Kun
Vice-President, China Development Bank Capital
October 2015
0
CONTENTS
FOREWORD ................................................................................................................................ iii
List of Acronyms.......................................................................................................................... 2
I. EXECUTIVE SUMMARY ............................................................................................................. 3
1.1 Overview of Hammarby and the 12 Green Guidelines ...................................................................... 4
1.2 Major Lessons ................................................................................................................................... 6
1.3 Major Economic and Social Achievements of Hammarby ................................................................. 7
1.4 Detailed Comparison of 12 Green Guidelines and Hammarby .......................................................... 9
2. INTRODUCTION ..................................................................................................................... 17
3. GOALS, MONITORING, AND THE HAMMARBY MODEL .......................................................... 21
3.1 Environmental Goals ....................................................................................................................... 21
3.2 Environmental Monitoring: The Environmental Load Profile .......................................................... 23
3.3 The Hammarby Model: Waste, Energy, Water & Sewage Eco-cycles .............................................. 26
4. THE DEVELOPMENT PROCESS ............................................................................................... 30
4.1 Role of the National, Regional, and Municipal Governments in Planning ....................................... 30
4.2 Overview of the General Planning Process ...................................................................................... 35
4.3 Master Planning & Land Development ............................................................................................ 39
4.4 Property Development .................................................................................................................... 46
4.5 Design Guidelines used for Hammarby Sjöstad ............................................................................... 49
5. FINANCING ............................................................................................................................ 54
5.1 Ownership Models in Hammarby Sjöstad ....................................................................................... 55
5.2 Funding Mechanisms ....................................................................................................................... 56
5.3 Financing for Implementation ......................................................................................................... 61
5.4 Land Allocation ................................................................................................................................ 65
6. KEY ACHIEVEMENTS .............................................................................................................. 67
6.1 Soil Remediation .............................................................................................................................. 69
6.2 Urban Form ..................................................................................................................................... 71
6.3 Transportation ................................................................................................................................. 73
6.4 Green Buildings ............................................................................................................................... 80
6.5 Energy.............................................................................................................................................. 85
6.6 Waste Management ........................................................................................................................ 90
6.7 Water Efficiency .............................................................................................................................. 99
7. MAJOR LESSONS ................................................................................................................. 102
7.1 Major Lessons ................................................................................................................................ 102
7.2 Overcoming Challenges ................................................................................................................. 104
REFERENCES ........................................................................................................................... 106
8. APPENDICES ........................................................................................................................ 109
Appendix 1: Relationship between Waste Systems and Urban Form and Transportation ................. 109
Appendix 2. Facts and Figures on Hammarby .................................................................................... 114
Appendix 3. Economic Development Trends in Hammarby ............................................................... 117
Appendix 4. Social Development Trends in Hammarby ...................................................................... 120
Appendix 5. Developers and Architects in Hammarby ....................................................................... 123
Appendix 6. Detailed Map of Hammarby ........................................................................................... 124
LIST OF ACRONYMS BREEAM: Building Research Establishment Environmental Assessment Methodology
CDBC: China Development Bank Capital
CHPP: Combined Heat and Power Plant
ELP: Environmental Load Profile
ESA: Environmental Systems Analysis
FAR: Floor Area Ratio
FÖP: In-depth General Plans
LCA: Life Cycle Assessment
LEED: Leadership in Energy & Environmental Design
LIP: Local Investment Program
MOHURD: Ministry of Housing and Urban-Rural Development (China)
NMT: Non-motorized Transit
ÖP: General Plans
PBL: Planning and Building Act
PPP: Private Public Partnership
RUFS: Regional Development Plan for the Stockholm Region
SGBC: Sweden Green Building Council
SLIP: Stockholm Local Investment Program
TOD: Transit-Oriented Development
UPDP: Urban Planning and Development Process
WWTP: Waste Water Treatment Plant
I. EXECUTIVE SUMMARY “Hammarby Sjöstad is a good example of not only focusing on the
short term aspects and getting short term profits but also investing for
the future and increasing revenue The cost for Hammarby was roughly
5 percent higher from a purely construction cost perspective but in
the end you get back roughly 25 percent more property value out on
the site over time which shows how real value is created over time.”
- Henrik Svanqvist, Director of Communities, Skanska
This case study is a part of China Development Bank Capital’s Green and Smart Urban Development
Guidelines. The study is framed around the 12 Green Guidelines, hereafter referred to as the “Green
Guidelines.” These 12 Green Guidelines define the foundational sustainability metrics that should be
used to evaluate an urban development project. Our study shows that the 12 Green Guidelines are
not only the foundation for sustainability, they are also key conditions for economic and social
success.
This case study provides a comprehensive look at the sustainable urban development process of
Hammarby Sjöstad. The study is organized around each of the Green Guidelines and expands on the
goals, processes, and mechanisms that made Hammarby Sjöstad a sustainable and economically
prosperous urban development.1
The outline of the report is as follows:
Section 1 Presents the main findings of the report. A table showing the guidelines applied to
Hammarby Sjöstad and the top lessons is provided to show the importance of the 12
Green Guidelines and the applications for other developments.
Section 2 General introduction to Hammarby Sjöstad.
Section 3 The foundational elements that acted as the basis of Hammarby’s development, including
the goals, monitoring, and Hammarby Model.
Section 4 The detailed planning process from master planning to property development, including
the role of the national, regional, and local governments; the key organizations involved in
Hammarby’s planning process; and the guidelines used in development.
1 This case study is a collection of facts, figures, and earlier writings. This means that the report is primarily based upon
secondary materials and the authors cannot be held accountable for their accuracy. The work has focused on compiling,
analyzing, and concluding existing material. Supporting material produced by Sweco includes some of the images, diagrams,
tables, and analysis.
Section 5 The key financing models that Hammarby used in its development process.
Section 6 Each Key Achievement (based on the 12 Green Guidelines) is presented in detail, including
soil remediation, urban form, transportation, waste, water, energy, and green buildings.
Section 7 Further extrapolates on the major lessons and also discusses challenges.
1.1 OVERVIEW OF HAMMARBY AND THE 12 GREEN GUIDELINES
Hammarby Sjöstad was designed as a comprehensive infrastructure project. The heating, transport,
and waste collection systems were intended to work in conjunction to reduce their long term usage of
energy and resources. The project meets high environmental standards in comparison with similar
developments internationally.
Hammarby Sjöstad demonstrates how high environmental targets can be met through the use of a
well-developed master plan, high levels of initial investment in infrastructure, and a focus on
environmentally-friendly housing and a high quality living environment.
Hammarby Sjöstad is an economically, environmentally, and socially successful district:
The district fulfills the 12 Green Guidelines: The 12 Green Guidelines were chosen to comprehensively evaluate an urban development from a high level. Hammarby is a great model for the value of the 12 Green Guidelines in defining a sustainable urban development.
The district is livable and attractive: A mix of housing units, parks and services are located within the Hammarby boundaries. It is easy to access the area from different parts of Stockholm. Located adjacent to the inner City of Stockholm, the area has become highly popular and is inhabited by a wide range of people.
The district is economically successful: Property and tax-assessment values have increased. The tax-assessment values have increased more in Hammarby Sjöstad compared to the City of Stockholm as a whole. Even though construction costs were approximately five percent higher than normal, the property value increased by 25 percent.
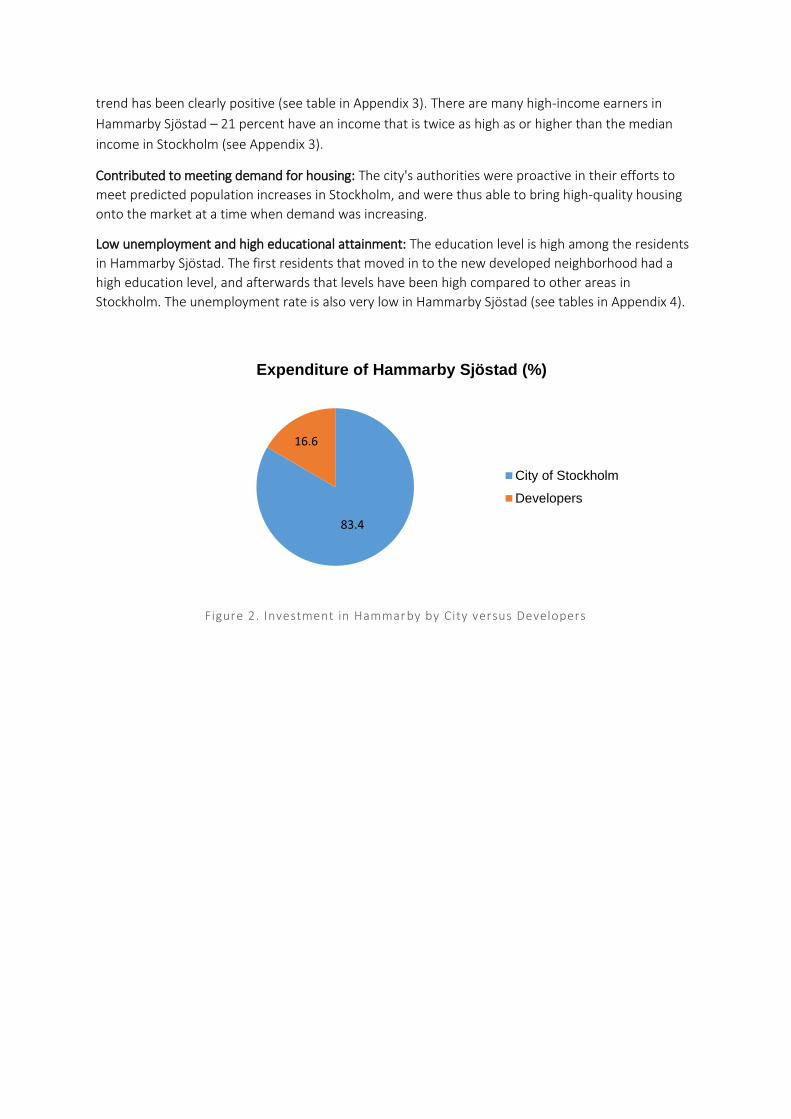
The district attracted private investment: Developers invested approximately 83 percent of the total expenditure of the project. The City of Stockholm contributed 17 percent. Funding from LIP Stockholm supported the development with 33 million Euros.
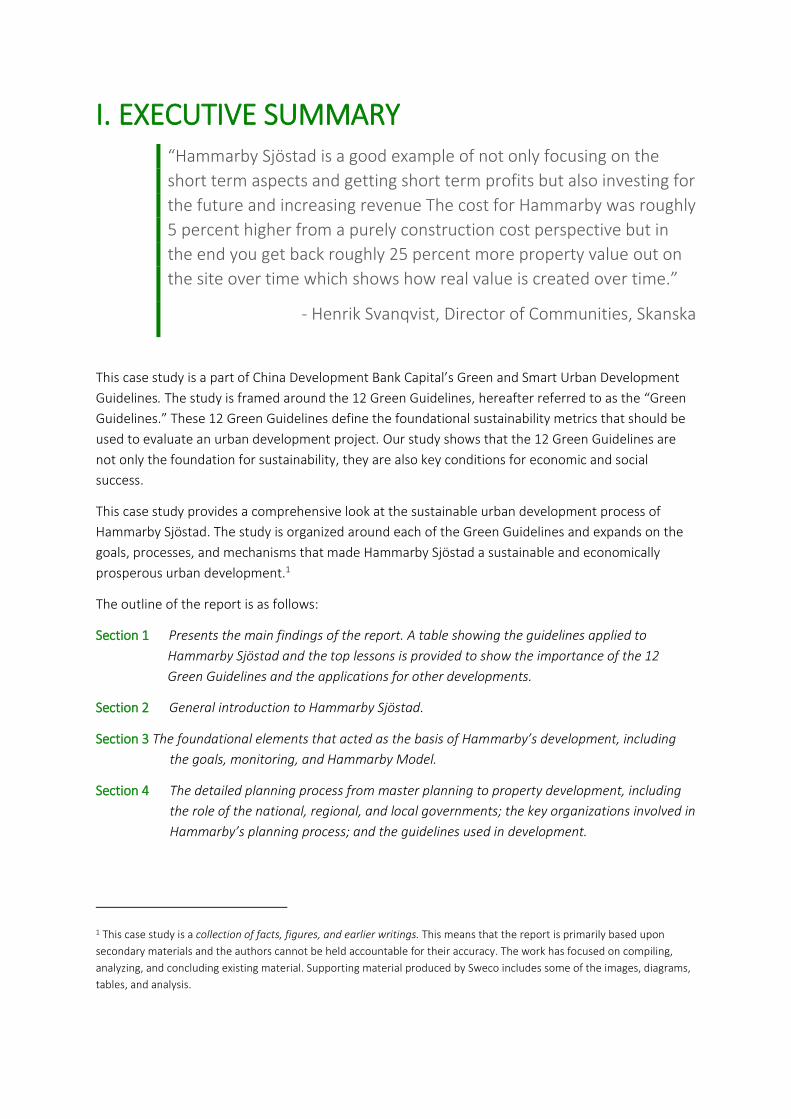
Table 1. 12 Green Guidelines applied to Hammarby Sjöstad 2
Urban
Growth
Boundary
Hammarby was developed on an old brownfield site. All contaminated soil was
sanitized prior to development. 100% of the developed land is remediated and
adapted for the district. Hammarby is located adjacent to the inner City of
Stockholm, approximately 3 km from the city center.
Transit-
Oriented
Development
The Floor Area Ratio (FAR) is higher close to public transit stations and public
transit stations are located centrally in commercial and business districts. The FAR
ranges from 1.2 to 2.3 in the entire district.
Mixed-use The job-housing ratio is about 0.53. Currently, there are 20,400 residents and
11,000 jobs. Many of the buildings also have commercial space on the bottom
floors and housing on top floors.
Small Blocks Typical block sizes are 50 x 70 or 70 x 100 meters. The general building layout
consists of blocks built around an inner courtyard.
Public Green
Space
A network of varied parks, green spaces, quays, plazas, and walkways runs through
the district providing space for outdoor activities. The amount of public green
space is about 19 percent of the total area.
Non-
motorized
Transit
The density of walking paths is about 25.8 km/km², the density of biking paths is
about 10.5 km/km2. There are special paths for biking linked to Stockholm’s public
bike share program Total distance of walking paths: 45 km; total distance of bicycle
paths: 18.5 km.
Public Transit Every residence is within 300 meters of a light rail tram stations. There are a
number of public transit options: the tramline, pedestrian and cycling
infrastructure, bike sharing, carpools, a ferry line, and bus line.
Car Control There are 0.55 parking spaces per household. Car ownership is low. There are 210
cars per 1000 residents.
Green
Buildings
The average building energy use in Hammarby is 113 kWh/m2/year. This is much
lower than the 2012 Swedish average, which is over 200 kWh/m2/year. The green
buildings in Hammarby are classified according to 4 different systems:
Environmental Building, Green Building, LEED and BREEAM.
Renewable
and District
Energy
Integrated district system with approximately 50 percent of energy produced from
renewable sources. 80% of the energy extracted from waste and wastewater is
being used in Hammarby.
Waste
Management
100% of waste is sorted and only 0.7% of waste goes to landfill. 50% of waste is
recovered as energy through the waste to energy system, 16% of waste is turned
into biogas, 33% is materials recycling, and 1% is hazardous waste. The amount of
waste delivered to the landfill is 60% less than comparable developments.
Water
Efficiency
100 percent of the water is recycled. All storm water is managed locally and
purified before release.
2 See Table 2 for an in-depth comparison of Hammarby’s metrics to those of the 12 Guidelines.
The successful development of Hammarby Sjöstad is a result of many coinciding factors; political,
economic, historical, and cultural. These are all important factors to really understand why Stockholm
is in the international forefront building and designing sustainable city districts.
1.2 MAJOR LESSONS
The following major lessons are presented as guidance and for future developments. The government
(national, regional, and local), developers, financial institutions, and technology providers can all learn
from these lessons. We hope that these major lessons will inspire fresh ways of thinking about
development and project management to encourage sustainability and economic prosperity.
1. Sustainable urban development requires a holistic approach and the 12 Green Guidelines offer the framework for this approach.
2. Prioritize densifying areas that are adjacent to the city, even if these are brownfields. 3. Various departments from the government, private sector, and academia must all be deeply
involved in the planning process. 4. A variety of channels (design and financial) must be used to change behaviors and mindsets. 5. Life-cycle assessments can reveal the true value of high environmental design standards.
1. Sustainable urban development requires a holistic approach and the 12 Green Guidelines offer the
framework for this approach.
The eco-cycle strategy (the Hammarby Model, see Section 3.3) takes into account three different
energy flows to find synergies. Taking into consideration all 12 of the Green Guidelines can help with
this holistic approach. For instance ,the urban form of Hammarby helped to decrease transportation
emissions, and the waste-to-energy system helped to decrease waste and improve energy efficiency.
2. Prioritize densifying areas that are adjacent to the city, even if these are brownfields.
Densify areas adjacent to the city. The soil remediation conducted by the City of Stockholm is a small
sacrifice when compared to the substantial advantage of developing near the city. This development
approach also makes it easier to integrate the transportation system and technologies for water and
energy (electricity, district heating and cooling) into the existing city infrastructure.
3. Various departments from the government, private sector, and academia must all be deeply involved
in the planning process.
Political will and decisions based on a broad political consensus and commitment be must achieved to
realize the project. The development of Hammarby Sjöstad is an example of the triple helix concept
where government, the private sector, and academia all interact and take part in the development. It
was vital that an interdisciplinary project group within the city administration together with the
developers, researchers and other stakeholders was formed at the beginning of the project.
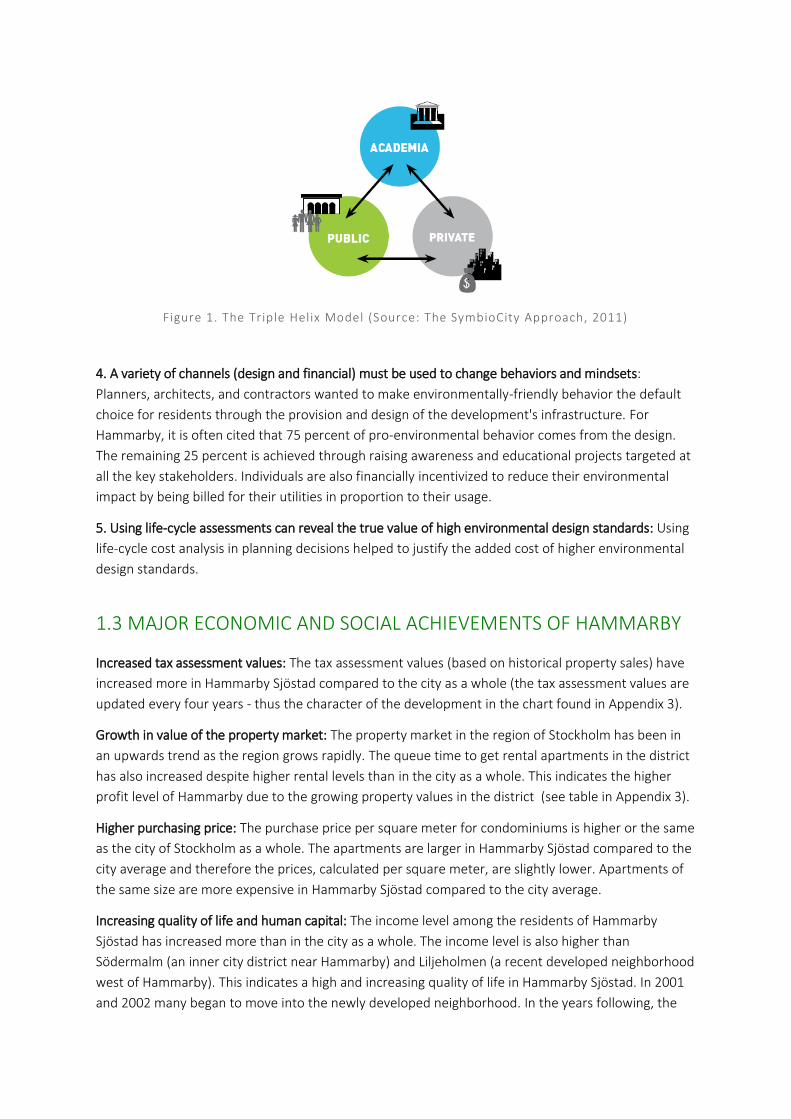
Figure 1. The Triple Helix Model (Source: The SymbioCity Approach, 2011)
4. A variety of channels (design and financial) must be used to change behaviors and mindsets:
Planners, architects, and contractors wanted to make environmentally-friendly behavior the default
choice for residents through the provision and design of the development's infrastructure. For
Hammarby, it is often cited that 75 percent of pro-environmental behavior comes from the design.
The remaining 25 percent is achieved through raising awareness and educational projects targeted at
all the key stakeholders. Individuals are also financially incentivized to reduce their environmental
impact by being billed for their utilities in proportion to their usage.
5. Using life-cycle assessments can reveal the true value of high environmental design standards: Using
life-cycle cost analysis in planning decisions helped to justify the added cost of higher environmental
design standards.
1.3 MAJOR ECONOMIC AND SOCIAL ACHIEVEMENTS OF HAMMARBY
Increased tax assessment values: The tax assessment values (based on historical property sales) have
increased more in Hammarby Sjöstad compared to the city as a whole (the tax assessment values are
updated every four years - thus the character of the development in the chart found in Appendix 3).
Growth in value of the property market: The property market in the region of Stockholm has been in
an upwards trend as the region grows rapidly. The queue time to get rental apartments in the district
has also increased despite higher rental levels than in the city as a whole. This indicates the higher
profit level of Hammarby due to the growing property values in the district (see table in Appendix 3).
Higher purchasing price: The purchase price per square meter for condominiums is higher or the same
as the city of Stockholm as a whole. The apartments are larger in Hammarby Sjöstad compared to the
city average and therefore the prices, calculated per square meter, are slightly lower. Apartments of
the same size are more expensive in Hammarby Sjöstad compared to the city average.
Increasing quality of life and human capital: The income level among the residents of Hammarby
Sjöstad has increased more than in the city as a whole. The income level is also higher than
Södermalm (an inner city district near Hammarby) and Liljeholmen (a recent developed neighborhood
west of Hammarby). This indicates a high and increasing quality of life in Hammarby Sjöstad. In 2001
and 2002 many began to move into the newly developed neighborhood. In the years following, the
trend has been clearly positive (see table in Appendix 3). There are many high-income earners in
Hammarby Sjöstad – 21 percent have an income that is twice as high as or higher than the median
income in Stockholm (see Appendix 3).
Contributed to meeting demand for housing: The city's authorities were proactive in their efforts to
meet predicted population increases in Stockholm, and were thus able to bring high-quality housing
onto the market at a time when demand was increasing.
Low unemployment and high educational attainment: The education level is high among the residents
in Hammarby Sjöstad. The first residents that moved in to the new developed neighborhood had a
high education level, and afterwards that levels have been high compared to other areas in
Stockholm. The unemployment rate is also very low in Hammarby Sjöstad (see tables in Appendix 4).
Figure 2. Investment in Hammar by by City versus Developers
83.4
16.6
Expenditure of Hammarby Sjöstad (%)
City of Stockholm
Developers
9
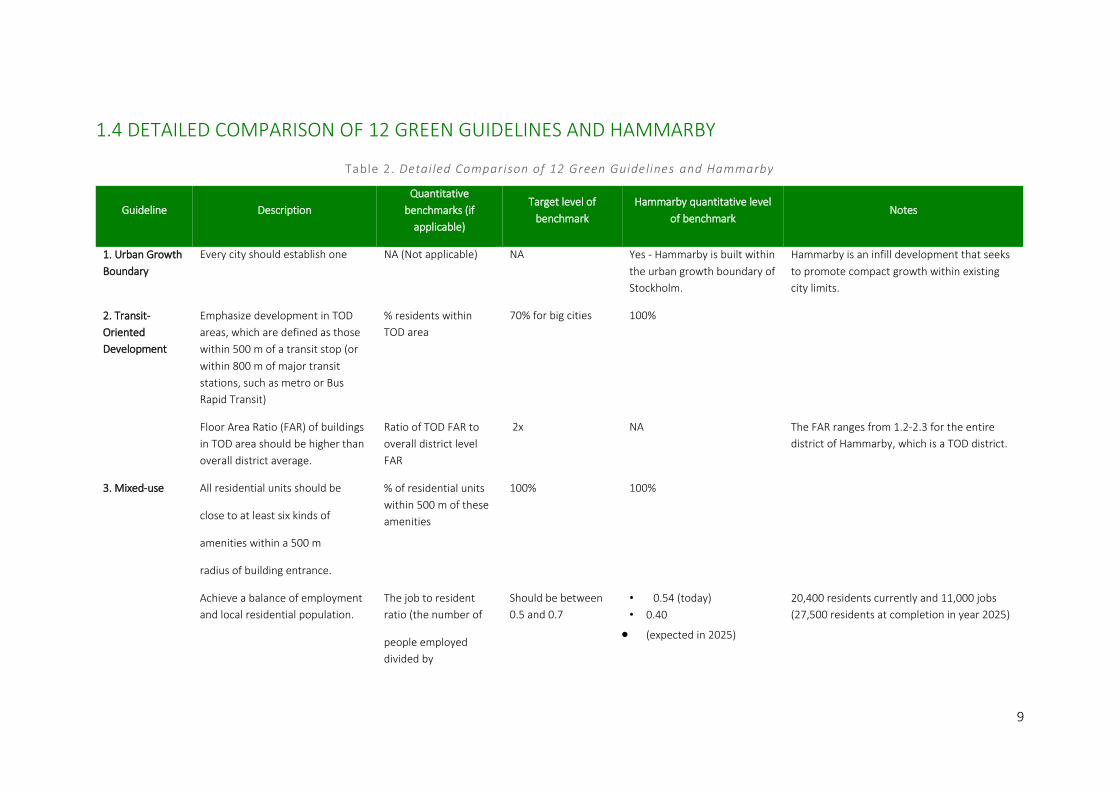
1.4 DETAILED COMPARISON OF 12 GREEN GUIDELINES AND HAMMARBY
Table 2. Detailed Comparison of 12 Green Guidelines and Hammarby
Guideline Description
Quantitative
benchmarks (if
applicable)
Target level of
benchmark
Hammarby quantitative level
of benchmark Notes
1. Urban Growth
Boundary
Every city should establish one NA (Not applicable) NA Yes - Hammarby is built within
the urban growth boundary of
Stockholm.
Hammarby is an infill development that seeks
to promote compact growth within existing
city limits.
2. Transit-
Oriented
Development
Emphasize development in TOD
areas, which are defined as those
within 500 m of a transit stop (or
within 800 m of major transit
stations, such as metro or Bus
Rapid Transit)
% residents within
TOD area
70% for big cities 100%
Floor Area Ratio (FAR) of buildings
in TOD area should be higher than
overall district average.
Ratio of TOD FAR to
overall district level
FAR
2x NA The FAR ranges from 1.2-2.3 for the entire
district of Hammarby, which is a TOD district.
3. Mixed-use
All residential units should be
close to at least six kinds of
amenities within a 500 m
radius of building entrance.
% of residential units
within 500 m of these
amenities
100% 100%
Achieve a balance of employment
and local residential population.
The job to resident
ratio (the number of
people employed
divided by
Should be between
0.5 and 0.7
• 0.54 (today)
• 0.40
(expected in 2025)
20,400 residents currently and 11,000 jobs
(27,500 residents at completion in year 2025)
the number of
residents)
4. Small Blocks Blocks should be small to promote
non-motorized transit
Blocks size as
measured by area
equal to 2 ha and 70%
of blocks should
comply with
this standard.
70% of blocks ≤ 2 ha.
(excluding industrial
areas)
100% Typical block sizes are 50x70 m and 70x100 m
5. Public Green
Space
Well distributed access to green
space
% of residents within
500 m of publicly
accessible green space
100% 100%
Sufficient quantity of green
space/blue space
% of land area devoted
to publicly accessible
green space/blue
space.
20-40% in
commercial areas
and higher levels in
residential areas
40% 19% of total area consists of public green
space with varied parks, green spaces, quays,
plazas and walkways.
40% of the area is green/blue areas such as
courtyards, lakes, and recreation grounds.
The Hammarby Lake occupies 25% of the blue
space area.
25 m2 per person of free space. For all
residents in Hammarby this implies an area of
650,000 m2 of public space.
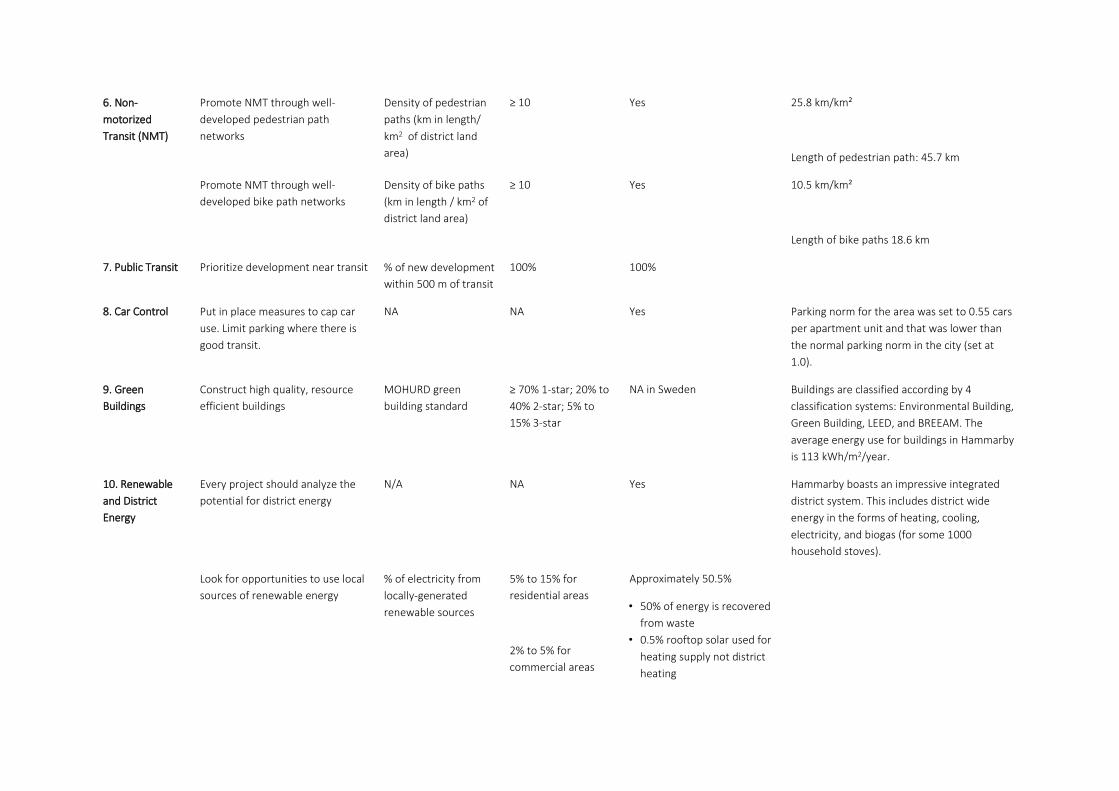
6. Non-
motorized
Transit (NMT)
Promote NMT through well-
developed pedestrian path
networks
Density of pedestrian
paths (km in length/
km2 of district land
area)
≥ 10 Yes 25.8 km/km²
Length of pedestrian path: 45.7 km
Promote NMT through well-
developed bike path networks
Density of bike paths
(km in length / km2 of
district land area)
≥ 10 Yes 10.5 km/km²
Length of bike paths 18.6 km
7. Public Transit Prioritize development near transit % of new development
within 500 m of transit
100% 100%
8. Car Control Put in place measures to cap car
use. Limit parking where there is
good transit.
NA
NA Yes Parking norm for the area was set to 0.55 cars
per apartment unit and that was lower than
the normal parking norm in the city (set at
1.0).
9. Green
Buildings
Construct high quality, resource
efficient buildings
MOHURD green
building standard
≥ 70% 1-star; 20% to
40% 2-star; 5% to
15% 3-star
NA in Sweden Buildings are classified according by 4
classification systems: Environmental Building,
Green Building, LEED, and BREEAM. The
average energy use for buildings in Hammarby
is 113 kWh/m2/year.
10. Renewable
and District
Energy
Every project should analyze the
potential for district energy
N/A NA Yes Hammarby boasts an impressive integrated
district system. This includes district wide
energy in the forms of heating, cooling,
electricity, and biogas (for some 1000
household stoves).
Look for opportunities to use local
sources of renewable energy
% of electricity from
locally-generated
renewable sources
5% to 15% for
residential areas
2% to 5% for
commercial areas
Approximately 50.5%
• 50% of energy is recovered
from waste
• 0.5% rooftop solar used for
heating supply not district
heating
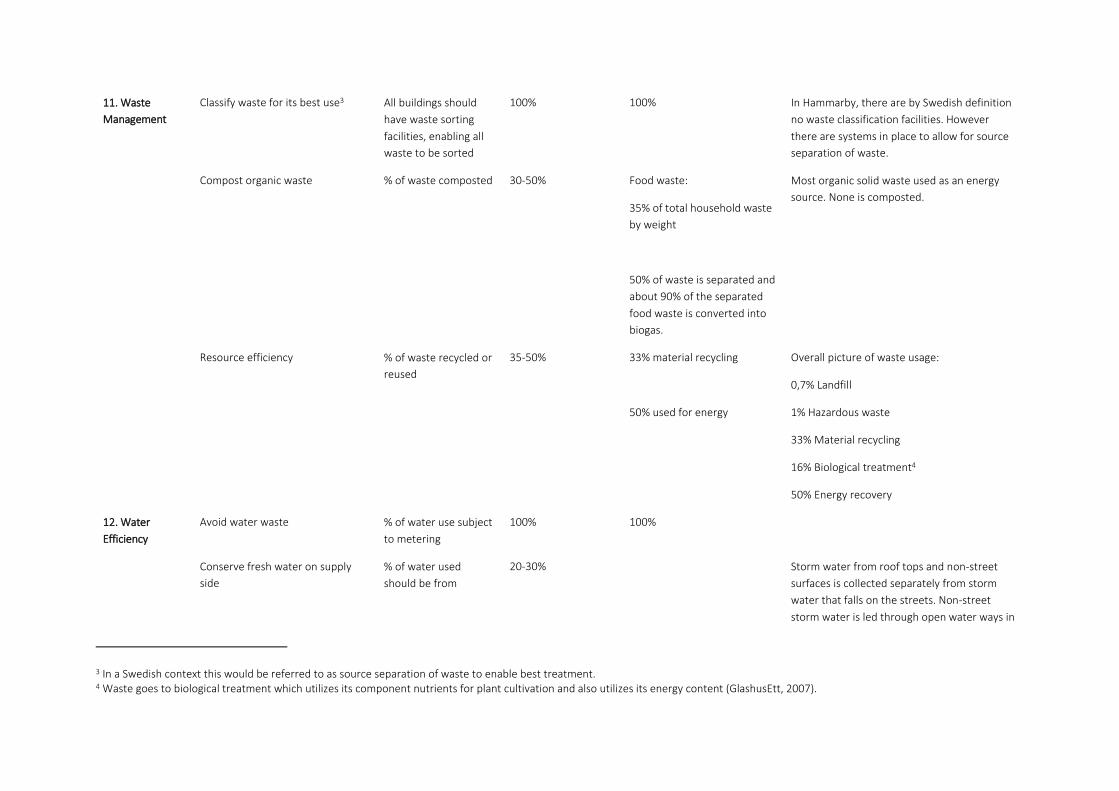
11. Waste
Management
Classify waste for its best use3 All buildings should
have waste sorting
facilities, enabling all
waste to be sorted
100% 100% In Hammarby, there are by Swedish definition
no waste classification facilities. However
there are systems in place to allow for source
separation of waste.
Compost organic waste % of waste composted 30-50% Food waste:
35% of total household waste
by weight
50% of waste is separated and
about 90% of the separated
food waste is converted into
biogas.
Most organic solid waste used as an energy
source. None is composted.
Resource efficiency % of waste recycled or
reused
35-50% 33% material recycling
50% used for energy
Overall picture of waste usage:
0,7% Landfill
1% Hazardous waste
33% Material recycling
16% Biological treatment4
50% Energy recovery
12. Water
Efficiency
Avoid water waste % of water use subject
to metering
100% 100%
Conserve fresh water on supply
side
% of water used
should be from
20-30% Storm water from roof tops and non-street
surfaces is collected separately from storm
water that falls on the streets. Non-street
storm water is led through open water ways in
3 In a Swedish context this would be referred to as source separation of waste to enable best treatment. 4 Waste goes to biological treatment which utilizes its component nutrients for plant cultivation and also utilizes its energy content (GlashusEtt, 2007).
rainwater or recycled
wastewater
the area into the surrounding lake water
system. Street storm water is purified before
being channelled into the fresh water system.
14
Detailed Description of Guidelines as applied to Hammarby Sjöstad
1. Urban Growth Boundary: The strategy used by the Stockholm City Planning Administration was to
re-use and transform old industrial sites and other brownfield sites into attractive mixed use areas
with beautiful parks and public green spaces. Hammarby Sjöstad is an excellent example of an
application of this strategy. Prior to development all the soil was sanitized. To avoid urban sprawl and
increase the use of public transportation, bicycling, and walking in the area, the City adapted the
concept of Smart Growth Theory. The theory focuses on concentrating urban growth in or nearby city
centers through integrated planning and Transit Oriented Development (TOD). 100% of the
developed land has been recreated and adapted for the City of Stockholm. Hammarby Sjöstad is
located approximately 3 km from the city center. Hammarby Sjöstad is part of an regional urban
planning strategy to create a polycentric urban structure as well as a city planning strategy to densify
and build the city inwards.
2. Transit Oriented Development: TOD is one of the key components integrated in the area. Fast and
attractive public transport combined with carpools and beautiful cycling and pedestrian paths have
been implemented in the area in order to reduce private car usage. The FAR number ranges from 1.2-
2.3 in the area. The FAR is higher along the main public transportation corridors due to the location of
mixed use functions. However, the FAR ratio does not vary that much at every bus/tram station since
the distance between stations are quite short which contributes to plots well connected to the public
transportation services.
3. Mixed-use: Today 20,400 residents inhabit the area in 9000 apartments and approximately 11,000
business places are available. The following area amenities can be found: schools, kindergartens, post
offices, banks, retail, clinics, petrol and biogas station, youth activity centers, hotels and restaurants.
Many services are concentrated along the central boulevard with prioritized public transport, walking,
and cycling.
4. Small blocks: Typical block size is 50 x 70 m or 70 x 100 m, exceptions are industry and schools.
Small blocks less than 1 ha dominate the area. The general building layout combines traditional
Stockholm inner city characteristics with Hammarby Sjöstad’s natural environment. Blocks are built
around inner courtyards. Average height is 18-24 meters, or 7 stories.
5. Public Green Space: 19% of the area is intended for public green space .The development stipulates
25 m2 of public green space per apartment unit. When the district is fully developed it will consist of
300,000 m2 of public space. The public green space of Hammarby Sjöstad is connected to the citywide
structure of green wedges and green links. The green networks also connects to walking and cycling
paths in surrounding nature preserves and to eco-ducts over larger roads
6. Non-motorized Transit: Hammarby Sjöstad has a total of 45 km of walking paths and 18.5 km of
cycling paths integrated into the area. Bicycling and walking was prioritized in the development and is
integrated into the citywide network. All roads have sidewalks. Safe bicycle paths are prioritized and
developed along all major routes. In Hammarby Sjöstad there are bicycle paths along the main
transportation corridors as well as traffic separated bicycle paths along waterfronts and through
residential areas.
7. Public Transit: Distance from housing to public transportation is 250-300 m at most. All blocks are
within 500 m distance from public transportation stations (bus and light rail) and have easy access to
convenient and beautiful pedestrian links. Carpools, bicycle sharing, and a ferry service are also
transportation alternatives found in the area.
8. Car control: Car ownership in Hammarby is low: 210 cars per 1000 residents. The parking norm for
the area is set to 0.55 cars per apartment unit, which was lowered from the development’s initial
target of 1 car per apartment. Public transport, bicycling, and walking are prioritized ahead of private
car use. Car pools were introduced. Ground level public parking is regulated and minimized to parking
along streets. All other parking is underground. Underground parking is organized by housing
associations or rental housing companies and put under buildings or as larger parking facilities under
open spaces or parks. Special parking lots are provided for disabled people and for carpool cars. In
order to minimize car use, the City of Stockholm fully developed the tram and bus line before
residents moved in.
9. Green Buildings: Buildings in Hammarby Sjöstad are classified according to the Sweden Green
Building Council (SGBC) environmental classification system. The four most used classification systems
in Sweden are Miljöbyggnad (Environmental Building), Green Building, BREEAM and LEED.
SGBC facilitates the process for citizens, property owners, tenants, and customers to
choose sustainable long term solutions in the built environment by making it easier to
understand the environmental certification and classifications systems of buildings and
neighborhoods.
The overall planning of land use, transportation, and the eco-cycle made it possible for
every building to achieve a high level of environmental performance. However, the
energy consumption of buildings did not reach the original goal which first was set at
60/m²/year. In 2005 the goal was revised to 100 kWh/m². Average energy consumption
in Sweden is 150 kWh/m², whereas in Hammarby it is 118 kWh/m².
10. Renewable and District Energy: Extraction of non-renewable energy resources
decreased 28-42% compared to comparable project in 2008 (Grontmij, 2008).
Greenhouse gas emissions decreased 29-37% compared to technology levels used in the
early 1990s (Grontmij, 2008).
100% of the buildings in Hammarby Sjöstad are heated by district heating. The base
production is from the waste incineration in the Combined Heat and Power plant and the
heat pumps in the wastewater treatment plant. Excess heat from WWTP is reused in the
district heating and cooling system for the city. Approximately 80% of the total energy
use in Hammarby Sjöstad is renewable.
11. Waste Management: In Hammarby Sjöstad waste is thoroughly sorted in practical
systems, with material and energy recycling maximized wherever possible.
12. Water Efficiency: In Hammarby Sjöstad, water use decreased by 41-46% per person
compared to early 1990’s levels. Water consumption was reduced through the use of
eco-friendly installations, low flush toilets, and air mixer taps. Eutrophication decreased
49-53% compared to early 1990s levels (Grontmij, 2008). Decreasing over-fertilization is
largely attributed to improvements at the Henrikdal Wastewater Treatment Plant.
2. INTRODUCTION
This section gives background on Hammarby Sjöstad and provides basic insight into what makes it an
exemplary example of sustainable development.
Throughout the years, a number of worldwide cities have adapted different strategies to develop
sustainable urban areas. Hammarby Sjöstad was one of the first projects that took the concept of
sustainable development to a higher level.
Sjöstaden, as it is called by the Stockholmers, is seen as a pilot project setting the stage for areas
being developed afterwards e.g. The Royal Seaport, a newly developed area within the Stockholm
boundary. There are three major concepts from Hammarby Sjöstad that significantly informed its
development strategy:
1. “Twice as good” Environmental Goals: Establishing the strong environmental goal of making everything “twice as good” in order to push the development’s sustainability objectives;
2. Environmental Load Profile: Creating the Environmental Load Profile (ELP), which allows for monitoring and gives feedback on the environmental performance of the built environment;
3. The Hammarby Model: Basing the project on the Hammarby Model, which uses resources in a cyclical loop, ensuring that the system is based on a life-cycle assessment and maximizes renewable resources usage.
A series of case studies showing “best practice examples” was conducted by the World Bank in 2010.
According to the World Bank report, “Stockholm is at the vanguard of green urban policymaking on an
international level, as shown by it winning the European Commission’s first Green Capital of Europe
award in 2010 and by the constant stream of global visitors the city attracts to its sites of ‘sustainable
urbanism’ (Rutherford, 2013).
In the early 1990’s, Stockholm's City Planning Administration predicted that population growth would
continue to be a trend for the city. The 1999 City Plan identified several areas across the city for
development, the majority of which were ex-industrial sites. The City Planning Administration planned
for these areas to be extensions of the city rather than new suburbs in order to meet the growing
demand for urban living.
A lot of the impetus behind Hammarby rose from the lessons that the City Planning Administration
learned from the Million Program. Large-scale housing development from 1965 to 1974 resulted in an
extra one million homes in Sweden. However, this transition revealed to the City Planning
Administration what a flawed development strategy looks like. First, the sprawled living conditions of
the new apartments was unattractive to urban dwellers, and there was insufficient demand for
apartments which made it difficult for property companies to get the apartments rented (The
Swedish National Board of Housing, The Million Program). Second, the low-quality of the initial
development means that the buildings from the Million Program are facing costly renovations. There
is also the problem of who should be responsible for paying for the renovations, the residents or the
landlords. Now, the City Planning Administration is conscious that this sprawled and unsustainable
development strategy is rife with problems. Hence, Hammarby and most of the new developments
near Stockholm are held to high design standards and paired with a sustainable development strategy
(SABO, 2009).
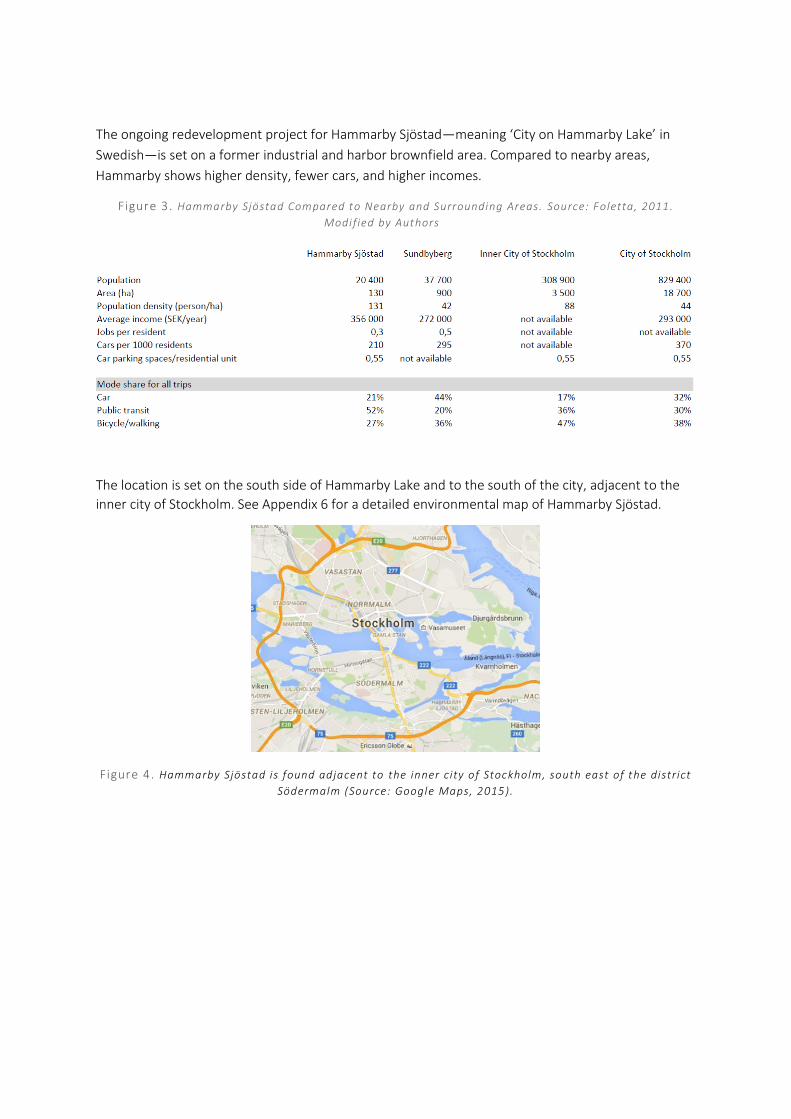
The ongoing redevelopment project for Hammarby Sjöstad—meaning ‘City on Hammarby Lake’ in
Swedish—is set on a former industrial and harbor brownfield area. Compared to nearby areas,
Hammarby shows higher density, fewer cars, and higher incomes.
Figure 3. Hammarby Sjöstad Compared to Nearby and Surrounding Areas. Source: Foletta, 2011.
Modified by Authors
The location is set on the south side of Hammarby Lake and to the south of the city, adjacent to the
inner city of Stockholm. See Appendix 6 for a detailed environmental map of Hammarby Sjöstad.
Figure 4. Hammarby Sjöstad is found adjacent to the inner city of Stockholm, south east of the district
Södermalm (Source: Google Maps, 2015).
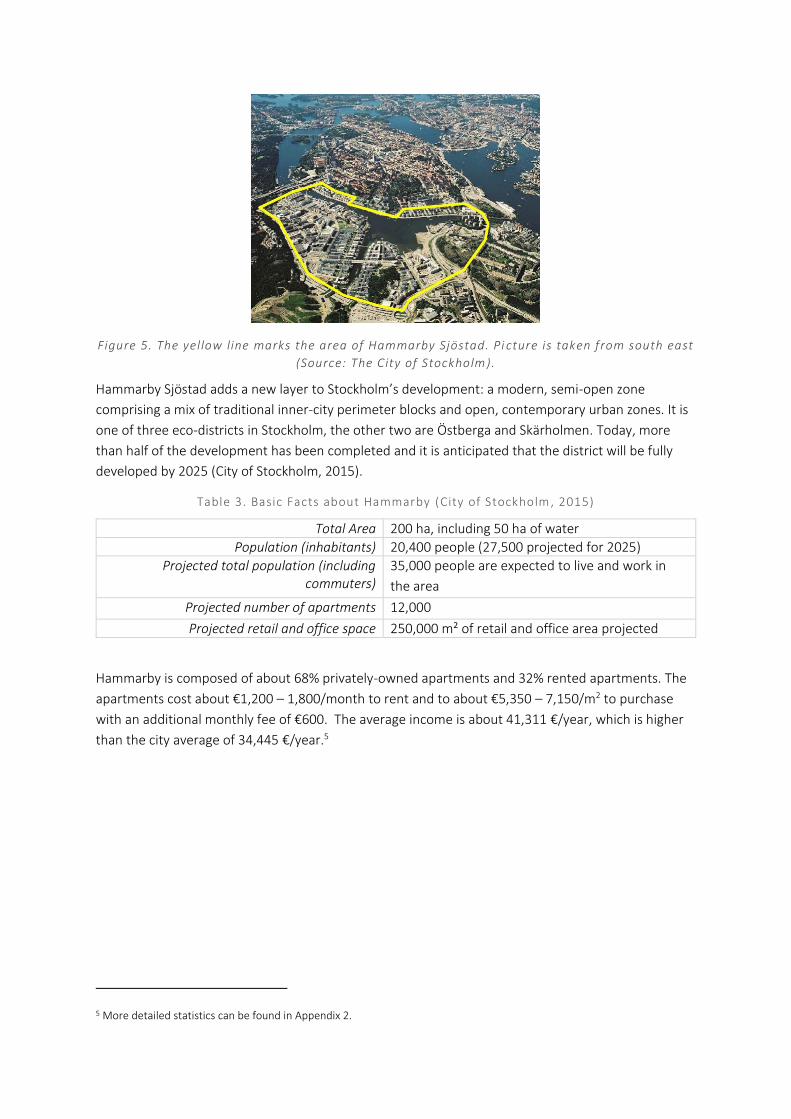
Figure 5. The yellow line marks the area of Hammarby Sjöstad. Pi cture is taken from south east
(Source: The City of Stockholm).
Hammarby Sjöstad adds a new layer to Stockholm’s development: a modern, semi-open zone
comprising a mix of traditional inner-city perimeter blocks and open, contemporary urban zones. It is
one of three eco-districts in Stockholm, the other two are Östberga and Skärholmen. Today, more
than half of the development has been completed and it is anticipated that the district will be fully
developed by 2025 (City of Stockholm, 2015).
Table 3. Basic Facts about Hammarby (City of Stockholm, 2015)
Total Area 200 ha, including 50 ha of water
Population (inhabitants) 20,400 people (27,500 projected for 2025)
Projected total population (including commuters)
35,000 people are expected to live and work in
the area
Projected number of apartments 12,000
Projected retail and office space 250,000 m² of retail and office area projected
Hammarby is composed of about 68% privately-owned apartments and 32% rented apartments. The
apartments cost about €1,200 – 1,800/month to rent and to about €5,350 – 7,150/m2 to purchase
with an additional monthly fee of €600. The average income is about 41,311 €/year, which is higher
than the city average of 34,445 €/year.5
5 More detailed statistics can be found in Appendix 2.
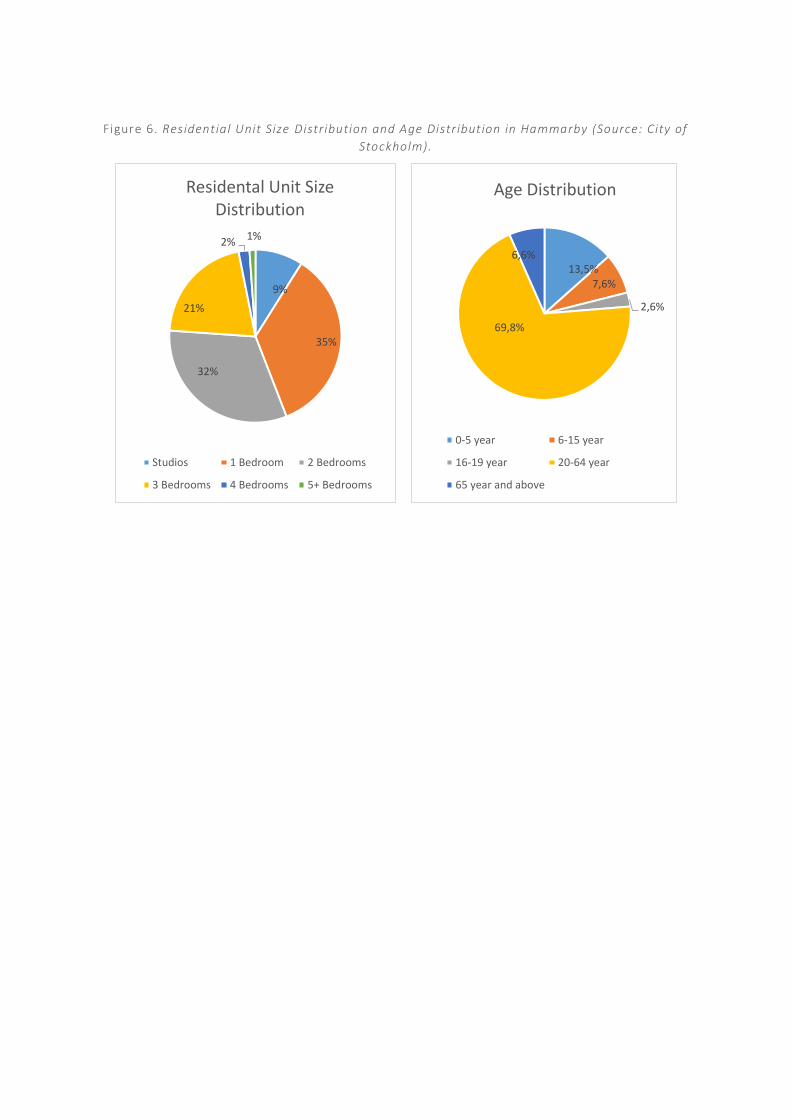
Figure 6. Residential Unit Size Distribution and Age Distribution in Hammarby (Source: City of
Stockholm).
9%
35%
32%
21%
2%1%
Residental Unit Size Distribution
Studios 1 Bedroom 2 Bedrooms
3 Bedrooms 4 Bedrooms 5+ Bedrooms
13,5%7,6%
2,6%
69,8%
6,6%
Age Distribution
0-5 year 6-15 year
16-19 year 20-64 year
65 year and above
3. GOALS, MONITORING, AND THE HAMMARBY
MODEL
“It is a place where you walk a lot, we don’t have a car. We are a part
of the car pool.” – Female Resident in Hammarby
This section will look at the foundational elements that acted as the basis for Hammarby’s development. This
includes:
1. Goals: The environmental goals embedded in the Environmental Program that guided Hammarby’s development and the key strategies that accompanied these goals.
2. Monitoring: The Environmental Load Profile, which is the monitoring tool used to assess the environmental performance of Hammarby.
3. The Hammarby Model: The Hammarby Model is an innovative closed-loop system that sustainably guides the flows of waste, energy, water, and sewage in Hammarby.
3.1 ENVIRONMENTAL GOALS
In the mid-1990s, there was strong interest from leading politicians in Stockholm to host the 2004
Olympic Games, and Hammarby Sjöstad was suggested as a site for the Olympic Village in the Swedish
application. Inspired by the UN Brundtland Report, Agenda 21, and the International Olympic
Committee’s call for an environmental focus in the applications, leading local policymakers in
Stockholm wanted to create a sustainable urban district in Hammarby Sjöstad. The outline of the
Environmental Program for Hammarby was inspired by the Sydney 2000 Olympics and aimed at
reducing the metabolic flows of the district to a minimum. It incorporated a guiding vision of
Hammarby Sjöstad, which stated:
The environmental performance of the city district should be twice as good as the
state of the art technology available in the present day construction field. As work
progresses, the stated operational goals must continue to evolve in this specific
direction. In order to achieve these goals, lifestyles need to be re-examined, new
technological solutions developed, and a more holistic view of planning implemented.
The city district is to be planned and built in accordance with the principles of the
natural cycles and Hammarby Sjöstad is to serve as a spearhead for the movement
towards ecological and environmentally friendly construction work and housing, and
be at the forefront of international striving for sustainable development in densely
populated urban areas.
The Environmental Program was adopted by the City Council in 1996. These overarching aims acted
as the starting point in the formulation of the operational goals for Hammarby Sjöstad.
The overall goal that came from the Environmental Program is that emissions from Hammarby were
to be 50% lower than the corresponding level for comparable housing areas from the early 1990s. To
obtain these goals, integrated planning, innovative solutions, and new technologies have been
necessary. In an interview, Martin Skillbäck, Head of Stockholm Planning Authority, stated, “The
environmental goals have changed over time. They have been tightened up and reformulated due to
new information about environmental friendly buildings solutions and new insights into how to
achieve eco-friendly neighborhoods.”
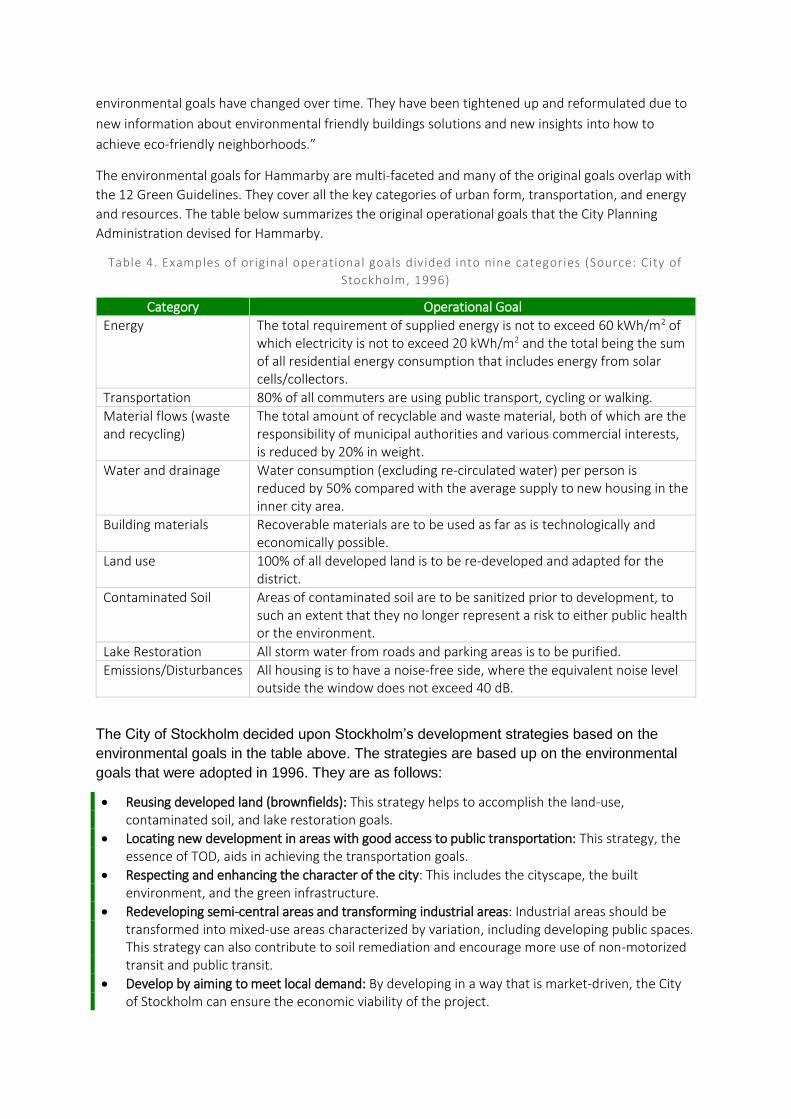
The environmental goals for Hammarby are multi-faceted and many of the original goals overlap with
the 12 Green Guidelines. They cover all the key categories of urban form, transportation, and energy
and resources. The table below summarizes the original operational goals that the City Planning
Administration devised for Hammarby.
Table 4. Examples of original operational goals divided into nine categories (Source: City of
Stockholm, 1996)
Category Operational Goal
Energy The total requirement of supplied energy is not to exceed 60 kWh/m2 of which electricity is not to exceed 20 kWh/m2 and the total being the sum of all residential energy consumption that includes energy from solar cells/collectors.
Transportation 80% of all commuters are using public transport, cycling or walking.
Material flows (waste and recycling)
The total amount of recyclable and waste material, both of which are the responsibility of municipal authorities and various commercial interests, is reduced by 20% in weight.
Water and drainage Water consumption (excluding re-circulated water) per person is reduced by 50% compared with the average supply to new housing in the inner city area.
Building materials Recoverable materials are to be used as far as is technologically and economically possible.
Land use 100% of all developed land is to be re-developed and adapted for the district.
Contaminated Soil Areas of contaminated soil are to be sanitized prior to development, to such an extent that they no longer represent a risk to either public health or the environment.
Lake Restoration All storm water from roads and parking areas is to be purified.
Emissions/Disturbances All housing is to have a noise-free side, where the equivalent noise level outside the window does not exceed 40 dB.
The City of Stockholm decided upon Stockholm’s development strategies based on the
environmental goals in the table above. The strategies are based up on the environmental
goals that were adopted in 1996. They are as follows:
Reusing developed land (brownfields): This strategy helps to accomplish the land-use, contaminated soil, and lake restoration goals.
Locating new development in areas with good access to public transportation: This strategy, the essence of TOD, aids in achieving the transportation goals.
Respecting and enhancing the character of the city: This includes the cityscape, the built environment, and the green infrastructure.
Redeveloping semi-central areas and transforming industrial areas: Industrial areas should be transformed into mixed-use areas characterized by variation, including developing public spaces. This strategy can also contribute to soil remediation and encourage more use of non-motorized transit and public transit.
Develop by aiming to meet local demand: By developing in a way that is market-driven, the City of Stockholm can ensure the economic viability of the project.
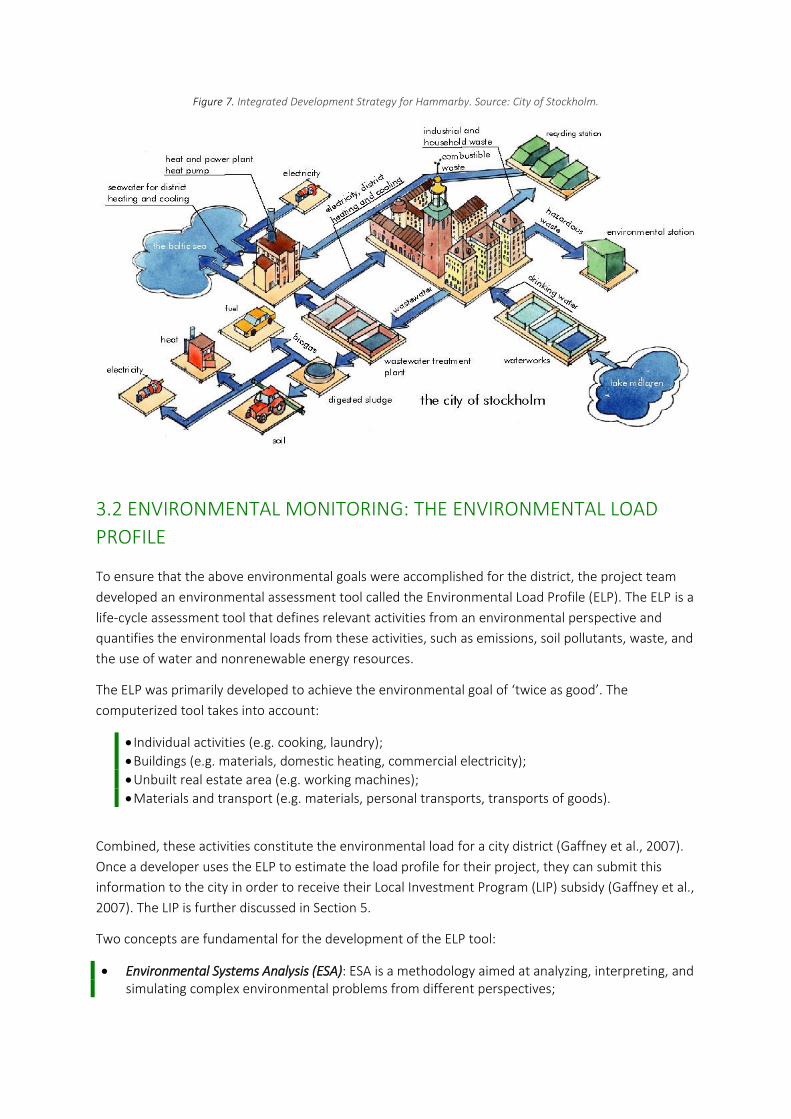
Figure 7. Integrated Development Strategy for Hammarby. Source: City of Stockholm.
3.2 ENVIRONMENTAL MONITORING: THE ENVIRONMENTAL LOAD
PROFILE
To ensure that the above environmental goals were accomplished for the district, the project team
developed an environmental assessment tool called the Environmental Load Profile (ELP). The ELP is a
life-cycle assessment tool that defines relevant activities from an environmental perspective and
quantifies the environmental loads from these activities, such as emissions, soil pollutants, waste, and
the use of water and nonrenewable energy resources.
The ELP was primarily developed to achieve the environmental goal of ‘twice as good’. The
computerized tool takes into account:
Individual activities (e.g. cooking, laundry);
Buildings (e.g. materials, domestic heating, commercial electricity);
Unbuilt real estate area (e.g. working machines);
Materials and transport (e.g. materials, personal transports, transports of goods).
Combined, these activities constitute the environmental load for a city district (Gaffney et al., 2007).
Once a developer uses the ELP to estimate the load profile for their project, they can submit this
information to the city in order to receive their Local Investment Program (LIP) subsidy (Gaffney et al.,
2007). The LIP is further discussed in Section 5.
Two concepts are fundamental for the development of the ELP tool:
Environmental Systems Analysis (ESA): ESA is a methodology aimed at analyzing, interpreting, and simulating complex environmental problems from different perspectives;
Life Cycle Assessment (LCA): The basic idea of LCA is to evaluate the total environmental impact of the whole life-cycle of a product, process, or activity. The assessment includes evaluation of environmental impacts from generation of raw materials, production, transports, use, reuse, maintenance, recycling and final disposal (that is, from cradle to grave) (Gaffney et al., 2007).
The uniqueness of the ELP is the ambition of understanding a whole city district and not just the
buildings or properties within it. Nevertheless, buildings, properties, and areas have functionalities
that are strongly linked to one another and a comprehensive approach in necessary. The ELP and
other similar assessment tools for the built environment can be a tool for urban planners and
developers in providing feedback on the environmental performance of the built environment
(Gaffney et al., 2007).
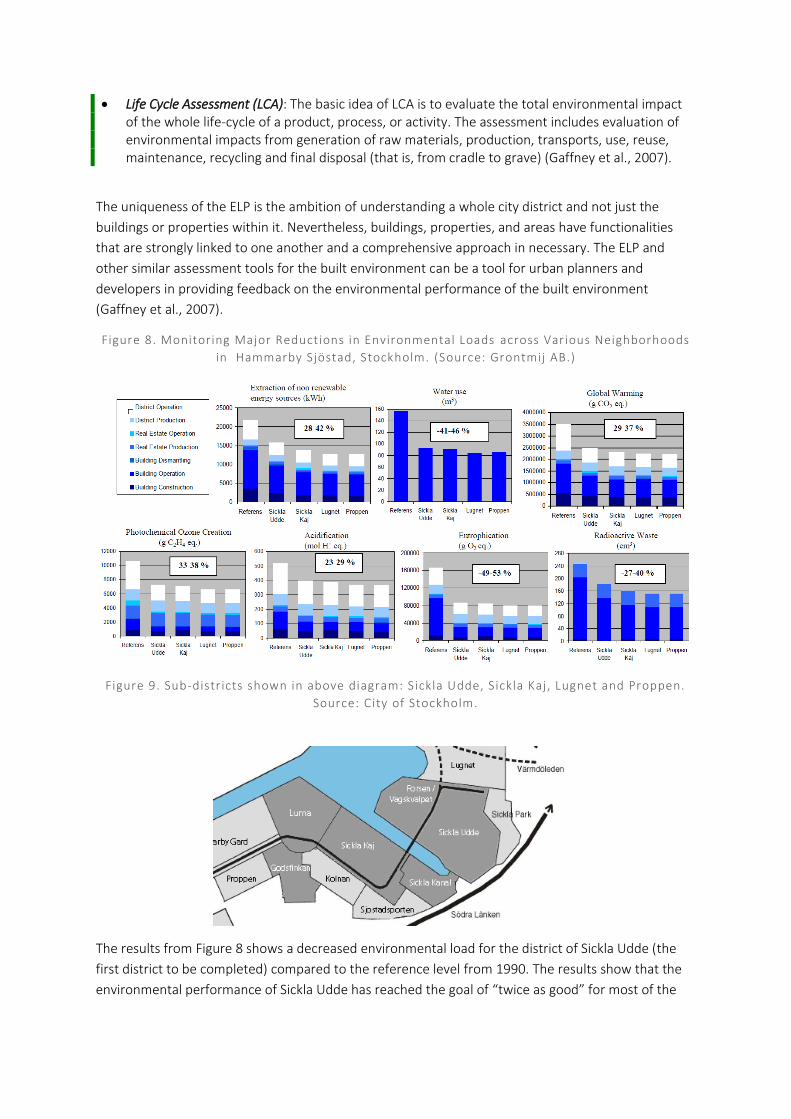
Figure 8. Monitoring Major Reductions in Environmental Loads across Various Neighborhoods
in Hammarby Sjöstad, Stockholm. (Source: Grontmij AB.)
Figure 9. Sub-distr icts shown in above diagram: Sickla Udde, Sickla Kaj, Lugnet and Proppen.
Source: City of Stockholm.
The results from Figure 8 shows a decreased environmental load for the district of Sickla Udde (the
first district to be completed) compared to the reference level from 1990. The results show that the
environmental performance of Sickla Udde has reached the goal of “twice as good” for most of the
environmental load categories, while the rest of the categories have seen an improvement of about
30 percent (Forsberg, 2003).
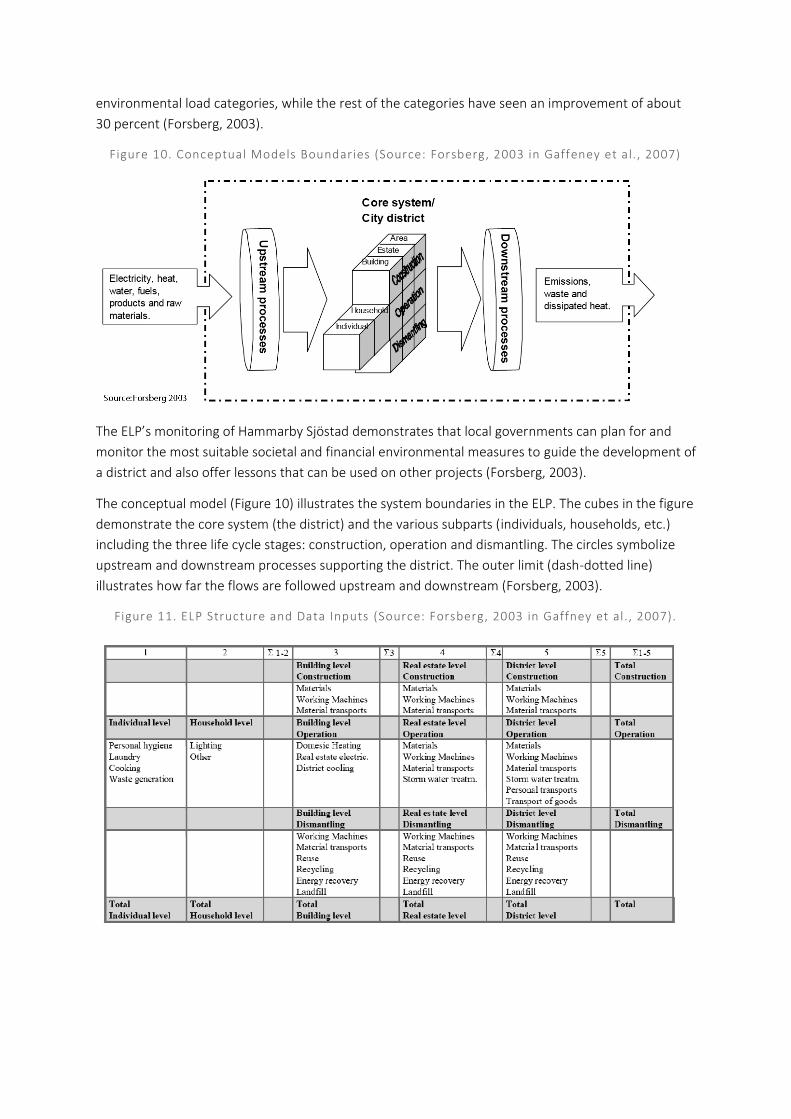
Figure 10. Conceptual Models Boundaries (Source: Forsberg, 2003 in Gaffeney et al. , 2007)
The ELP’s monitoring of Hammarby Sjöstad demonstrates that local governments can plan for and
monitor the most suitable societal and financial environmental measures to guide the development of
a district and also offer lessons that can be used on other projects (Forsberg, 2003).
The conceptual model (Figure 10) illustrates the system boundaries in the ELP. The cubes in the figure
demonstrate the core system (the district) and the various subparts (individuals, households, etc.)
including the three life cycle stages: construction, operation and dismantling. The circles symbolize
upstream and downstream processes supporting the district. The outer limit (dash-dotted line)
illustrates how far the flows are followed upstream and downstream (Forsberg, 2003).
Figure 11. ELP Structure and Data Inputs (Source: Forsberg, 2003 in Gaffney et al. , 2007).
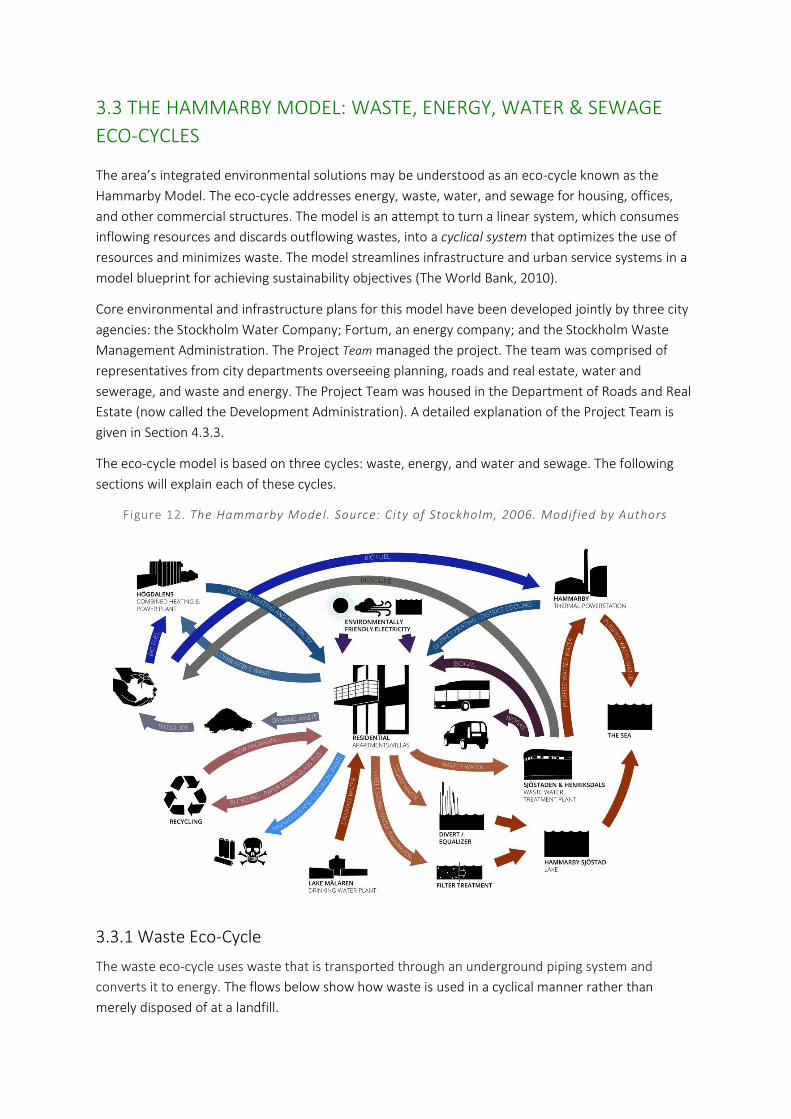
3.3 THE HAMMARBY MODEL: WASTE, ENERGY, WATER & SEWAGE
ECO-CYCLES
The area’s integrated environmental solutions may be understood as an eco-cycle known as the
Hammarby Model. The eco-cycle addresses energy, waste, water, and sewage for housing, offices,
and other commercial structures. The model is an attempt to turn a linear system, which consumes
inflowing resources and discards outflowing wastes, into a cyclical system that optimizes the use of
resources and minimizes waste. The model streamlines infrastructure and urban service systems in a
model blueprint for achieving sustainability objectives (The World Bank, 2010).
Core environmental and infrastructure plans for this model have been developed jointly by three city
agencies: the Stockholm Water Company; Fortum, an energy company; and the Stockholm Waste
Management Administration. The Project Team managed the project. The team was comprised of
representatives from city departments overseeing planning, roads and real estate, water and
sewerage, and waste and energy. The Project Team was housed in the Department of Roads and Real
Estate (now called the Development Administration). A detailed explanation of the Project Team is
given in Section 4.3.3.
The eco-cycle model is based on three cycles: waste, energy, and water and sewage. The following
sections will explain each of these cycles.
Figure 12. The Hammarby Model. Source: City of Stockholm, 2006. Modif ied by Authors
3.3.1 Waste Eco-Cycle
The waste eco-cycle uses waste that is transported through an underground piping system and
converts it to energy. The flows below show how waste is used in a cyclical manner rather than
merely disposed of at a landfill.
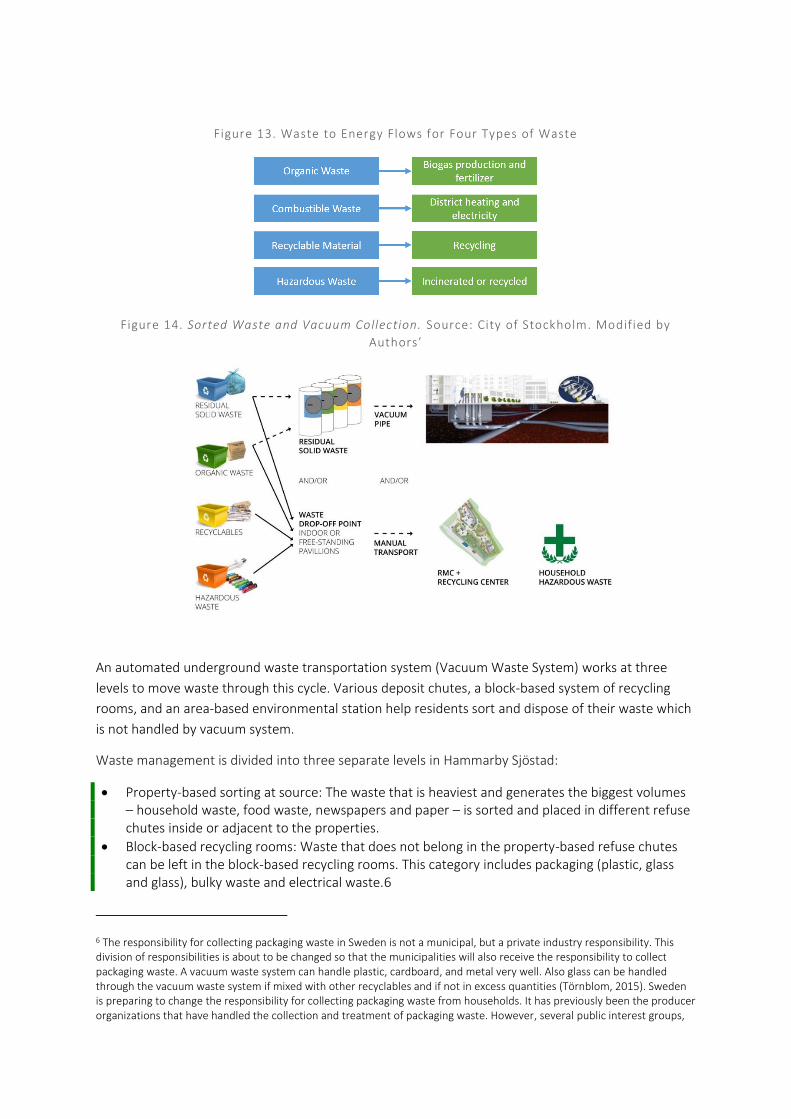
Figure 13. Waste to Energy Flows for Four Types of Waste
Figure 14. Sorted Waste and Vacuum Collection. Source: City of Stockholm. Modified by
Authors’
An automated underground waste transportation system (Vacuum Waste System) works at three
levels to move waste through this cycle. Various deposit chutes, a block-based system of recycling
rooms, and an area-based environmental station help residents sort and dispose of their waste which
is not handled by vacuum system.
Waste management is divided into three separate levels in Hammarby Sjöstad:
Property-based sorting at source: The waste that is heaviest and generates the biggest volumes – household waste, food waste, newspapers and paper – is sorted and placed in different refuse chutes inside or adjacent to the properties.
Block-based recycling rooms: Waste that does not belong in the property-based refuse chutes can be left in the block-based recycling rooms. This category includes packaging (plastic, glass and glass), bulky waste and electrical waste.6
6 The responsibility for collecting packaging waste in Sweden is not a municipal, but a private industry responsibility. This division of responsibilities is about to be changed so that the municipalities will also receive the responsibility to collect packaging waste. A vacuum waste system can handle plastic, cardboard, and metal very well. Also glass can be handled through the vacuum waste system if mixed with other recyclables and if not in excess quantities (Törnblom, 2015). Sweden is preparing to change the responsibility for collecting packaging waste from households. It has previously been the producer organizations that have handled the collection and treatment of packaging waste. However, several public interest groups,

Area-based collection stations: Hazardous waste such as paint, varnish and glue residues, nail polish, solvents, and batteries and chemicals are sorted and handed in to the area collection station.
3.3.2 Energy Eco-Cycle
Like any other city, Stockholm has an electric grid connected to a national grid. Electricity supply is
roughly half from nuclear and half from hydropower, with small amounts of energy from wind and
solar. Unlike cities in most other countries, Stockholm provides practically all of its buildings including
those of Hammarby Sjöstad with energy for heating and hot tap water via a citywide district heating
system. In parts of the city, district cooling is provided (Svane, 2013).
Table 5. Energy sources f lowing in and out of Hammarby Sjöstad
Energy sources
into Hammarby
• District heating from Högdalen’s heat and power plant (waste
incineration)
• District heating from Hammarby heat plant (uses waste heat from the
WWTP and heat from Lake Mälaren)
• Biofuel from forest industry
• Solar energy
• Electricity from the national electric grid
Energy sources
out from
Hammarby
• Electricity to the national electric grid from Högdalen’s heat and
power plant
• Biogas for vehicles from the WWTP
Synergies with
other technical
infrastructure
systems
• Purified wastewater to the sea
• Solid water treatment through waste incineration in Högdalen heat
and power plant
“Energy source into Hammarby” shows all the energy sources flowing in to Hammarby Sjöstad as
“energy sources out” shows the energy sources flowing out, mainly from the waste water treatment
plant and the heat and power treatment plant. The synergies from the technical systems are
presented in the last row.
Combustible waste is converted into district heating and electricity;
Biofuel from nature is converted into district heating and electricity;
Heat from treated wastewater is converted into district heating and district cooling;
Solar panels convert solar energy into electricity or to heat water (GlashusEtt).
politicians, and private citizens have been unsatisfied with the level of service the producer organizations have provided as well as the levels of collected material. By letting the municipalities handle the collection the goal is to provide better source separation services to households and thereby collect more recyclable materials. It is likely that the municipalities can optimize the collection more efficiently since they already are already collecting residual household waste. The producer organizations will still handle treatment of the collected materials (Älgevik, 2015).

3.3.3 Water & Sewage Eco-cycle
The water and sewage eco-cycle is based on first having a cyclical process where rainwater,
wastewater, and sewage are all integrated. Second, water consumption is reduced through the use of
eco-friendly installations, low flush toilets and air mixer taps.
For rainwater, the rain from yards and roofs is drained into Hammarby Lake, rather than into the
wastewater treatment plant. Rainwater from streets is treated locally using settling basins and then
drained into Hammarby Lake, rather than being drained into the wastewater treatment plant.
For sewage, a pilot wastewater treatment plant has been built specifically for the area in order to
evaluate new sewage treatment techniques. Digestion is used to extract biogas from the sewage
sludge. The residue (digested bio-solids) can then be used for fertilization (GlashusEtt).

4. THE DEVELOPMENT PROCESS
“The total expenditure of the project paid from the city is about 500
million Euros. The total volume with the developers is about 3000
million Euros (2500 million Euros from the developers) for the whole
area which means that the developers in the end take the greatest
risks. But still we think this is the most profitable way for the city [to
develop] when we get more taxpayers and at the same time the city is
growing.” - Lars Fränne, Head of Planning, Stockholm City
This section describes and provides insight into the entire development process for Hammarby.
1. The first section looks at the roles and responsibilities of the national, regional, and municipal governments in the planning process and how each level of government contributed to the sustainability goals.
2. We provide a high-level overview of the planning process in general, outlining the standard procedure.
3. We look at the specific master planning and land development process for Hammarby. This section will look at how the Project Team managed the planning and land development process while also presenting the key lessons for land development.
4. This section looks at property development and how developers were involved in the process.
5. Finally, we present the design guidelines that developers and architects had to follow for Hammarby. This will provide insight into how well-set constraints can breed creativity and innovation.
4.1 ROLE OF THE NATIONAL, REGIONAL, AND MUNICIPAL
GOVERNMENTS IN PLANNING
This section looks at the role of the national, regional, and local government in the planning process
and how responsibilities are divided. The figure below shows the high-level overview of the planning
process.
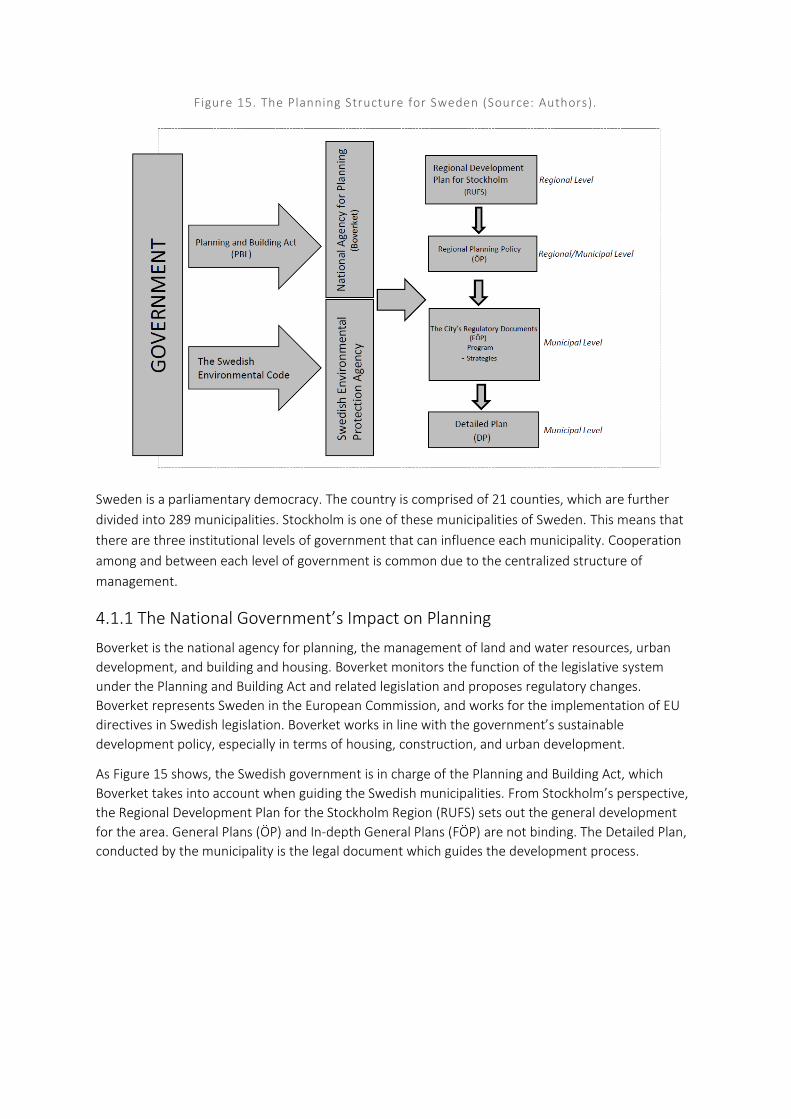
Figure 15. The Planning Structure for Sweden (Source: Authors).
Sweden is a parliamentary democracy. The country is comprised of 21 counties, which are further
divided into 289 municipalities. Stockholm is one of these municipalities of Sweden. This means that
there are three institutional levels of government that can influence each municipality. Cooperation
among and between each level of government is common due to the centralized structure of
management.
4.1.1 The National Government’s Impact on Planning
Boverket is the national agency for planning, the management of land and water resources, urban
development, and building and housing. Boverket monitors the function of the legislative system
under the Planning and Building Act and related legislation and proposes regulatory changes.
Boverket represents Sweden in the European Commission, and works for the implementation of EU
directives in Swedish legislation. Boverket works in line with the government’s sustainable
development policy, especially in terms of housing, construction, and urban development.
As Figure 15 shows, the Swedish government is in charge of the Planning and Building Act, which
Boverket takes into account when guiding the Swedish municipalities. From Stockholm’s perspective,
the Regional Development Plan for the Stockholm Region (RUFS) sets out the general development
for the area. General Plans (ÖP) and In-depth General Plans (FÖP) are not binding. The Detailed Plan,
conducted by the municipality is the legal document which guides the development process.
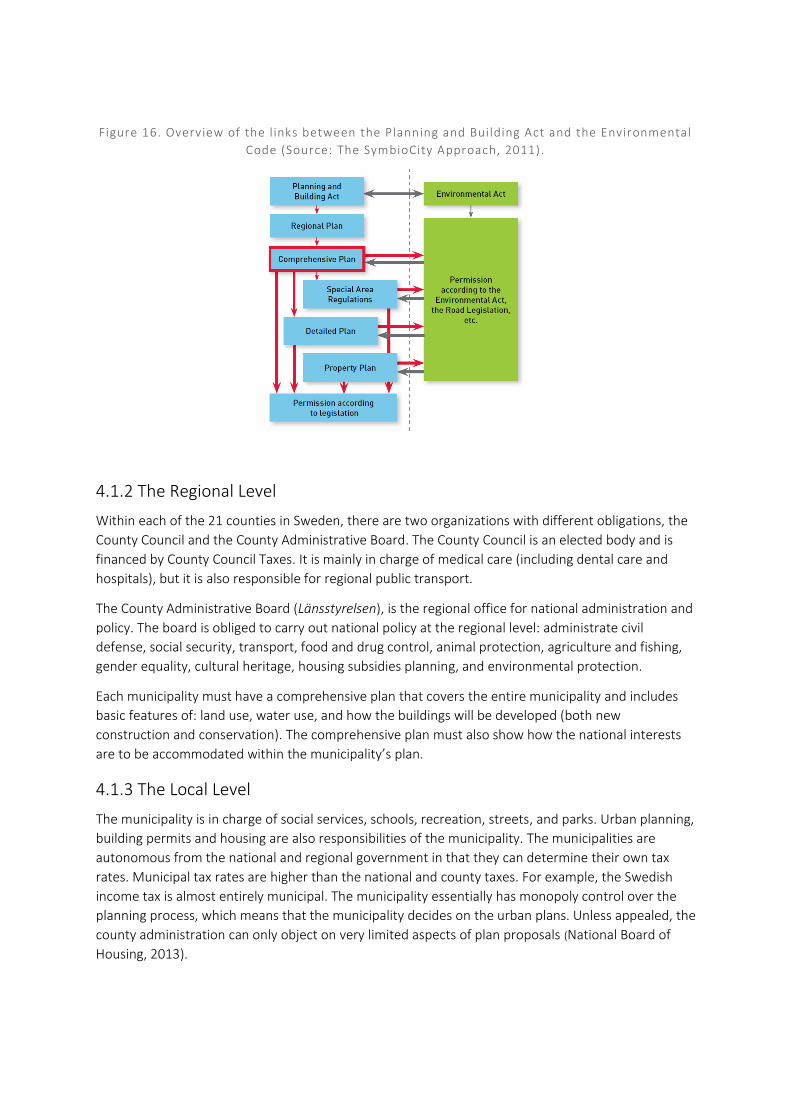
Figure 16. Overview of the l inks between the Planning and Building Act and the Environmental
Code (Source: The SymbioCity Approach, 2011).
4.1.2 The Regional Level
Within each of the 21 counties in Sweden, there are two organizations with different obligations, the
County Council and the County Administrative Board. The County Council is an elected body and is
financed by County Council Taxes. It is mainly in charge of medical care (including dental care and
hospitals), but it is also responsible for regional public transport.
The County Administrative Board (Länsstyrelsen), is the regional office for national administration and
policy. The board is obliged to carry out national policy at the regional level: administrate civil
defense, social security, transport, food and drug control, animal protection, agriculture and fishing,
gender equality, cultural heritage, housing subsidies planning, and environmental protection.
Each municipality must have a comprehensive plan that covers the entire municipality and includes
basic features of: land use, water use, and how the buildings will be developed (both new
construction and conservation). The comprehensive plan must also show how the national interests
are to be accommodated within the municipality’s plan.
4.1.3 The Local Level
The municipality is in charge of social services, schools, recreation, streets, and parks. Urban planning,
building permits and housing are also responsibilities of the municipality. The municipalities are
autonomous from the national and regional government in that they can determine their own tax
rates. Municipal tax rates are higher than the national and county taxes. For example, the Swedish
income tax is almost entirely municipal. The municipality essentially has monopoly control over the
planning process, which means that the municipality decides on the urban plans. Unless appealed, the
county administration can only object on very limited aspects of plan proposals (National Board of
Housing, 2013).
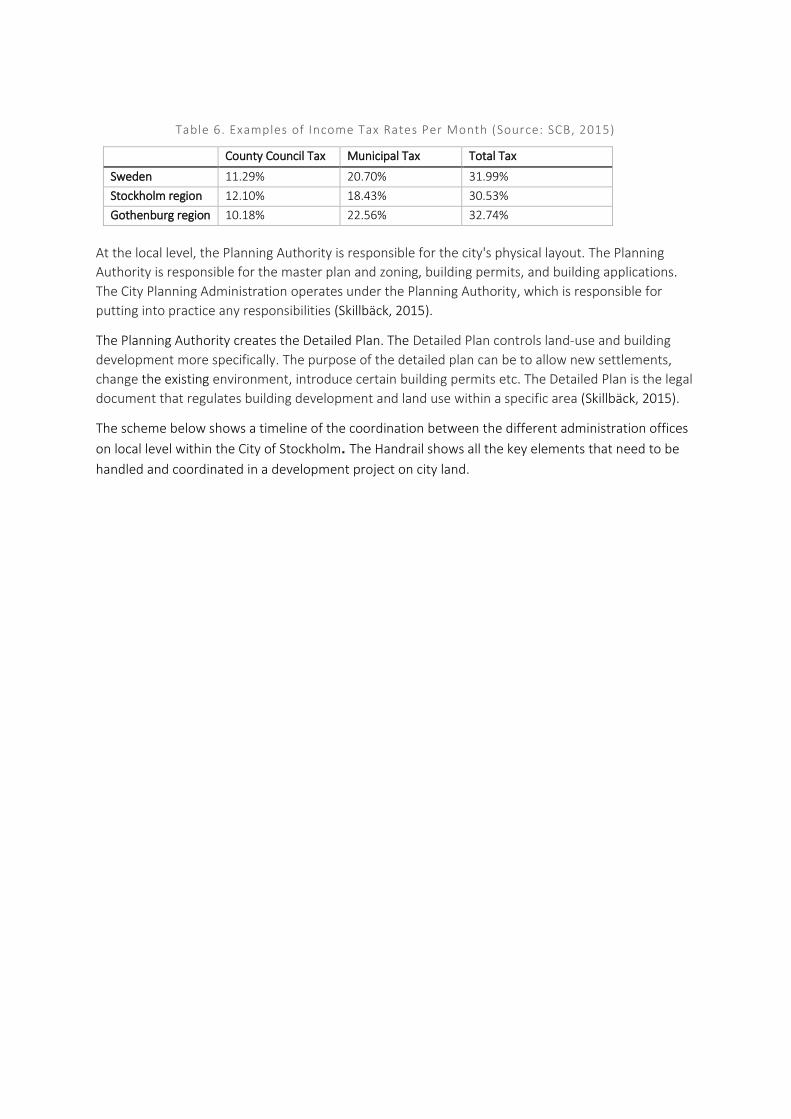
Table 6. Examples of Income Tax Rates Per Month (Source: SCB, 2015)
County Council Tax Municipal Tax Total Tax
Sweden 11.29% 20.70% 31.99%
Stockholm region 12.10% 18.43% 30.53%
Gothenburg region 10.18% 22.56% 32.74%
At the local level, the Planning Authority is responsible for the city's physical layout. The Planning
Authority is responsible for the master plan and zoning, building permits, and building applications.
The City Planning Administration operates under the Planning Authority, which is responsible for
putting into practice any responsibilities (Skillbäck, 2015).
The Planning Authority creates the Detailed Plan. The Detailed Plan controls land-use and building
development more specifically. The purpose of the detailed plan can be to allow new settlements,
change the existing environment, introduce certain building permits etc. The Detailed Plan is the legal
document that regulates building development and land use within a specific area (Skillbäck, 2015).
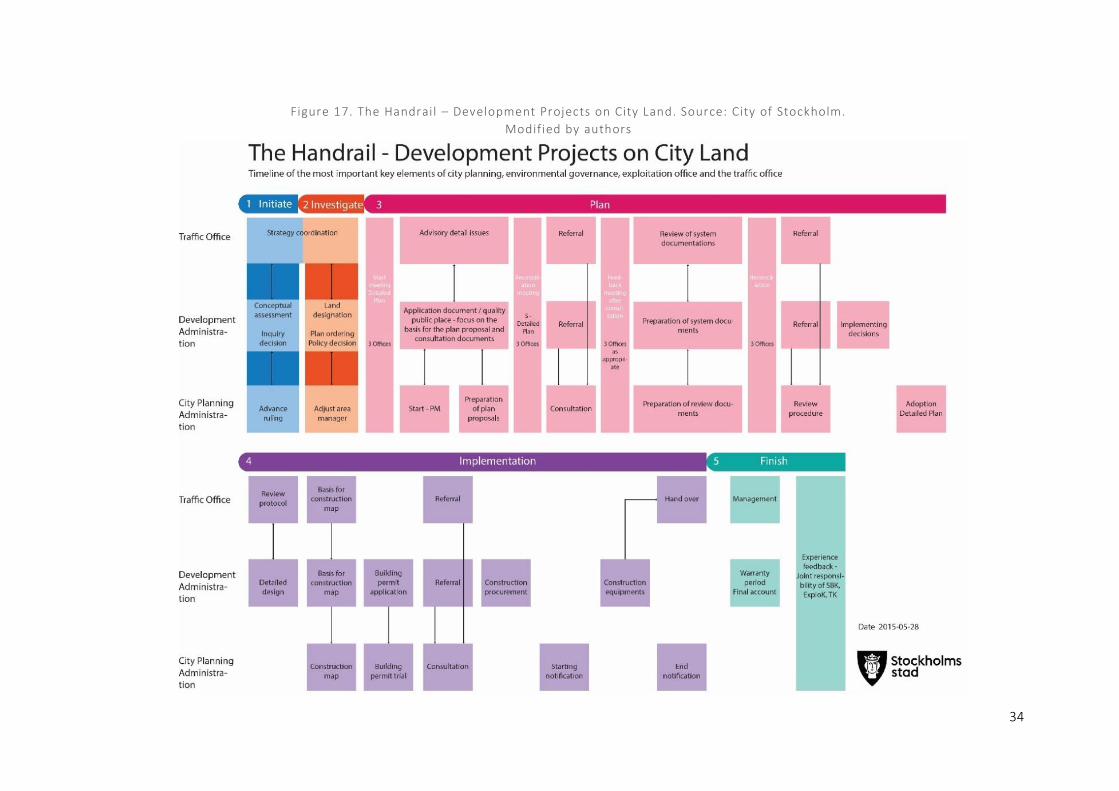
The scheme below shows a timeline of the coordination between the different administration offices
on local level within the City of Stockholm. The Handrail shows all the key elements that need to be
handled and coordinated in a development project on city land.
34
Figure 17. The Handrail – Development Projects on City Land. Source: City of Stockholm.
Modified by authors
35
4.2 OVERVIEW OF THE GENERAL PLANNING PROCESS
This section will look at the individual steps involved in the planning process and how the
responsibilities of the national, regional, and municipal governments are involved at each step.
4.2.1 The Standard Procedure
The standard planning process is regulated by the Planning and Building Act (PBL). This act examines
whether a proposed land-use decision is appropriate. In the process, public and private interests are
weighed against each other. The process involves all the stakeholders that might be affected by the
process and consults with each of them. A number of technical departments are also given the
opportunity to assess the proposal (Skillbäck, 2015).
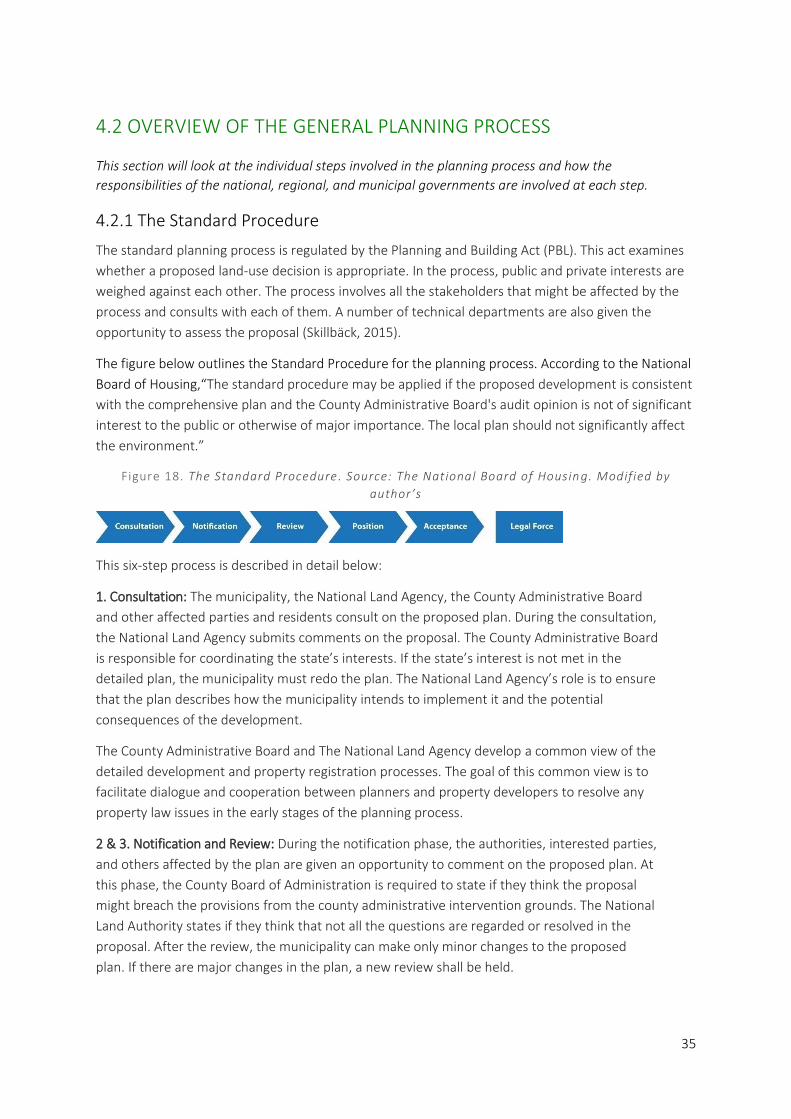
The figure below outlines the Standard Procedure for the planning process. According to the National
Board of Housing,“The standard procedure may be applied if the proposed development is consistent
with the comprehensive plan and the County Administrative Board's audit opinion is not of significant
interest to the public or otherwise of major importance. The local plan should not significantly affect
the environment.”
Figure 18. The Standard Procedure . Source: The National Board of Housin g. Modified by
author’s
This six-step process is described in detail below:
1. Consultation: The municipality, the National Land Agency, the County Administrative Board
and other affected parties and residents consult on the proposed plan. During the consultation,
the National Land Agency submits comments on the proposal. The County Administrative Board
is responsible for coordinating the state’s interests. If the state’s interest is not met in the
detailed plan, the municipality must redo the plan. The National Land Agency’s role is to ensure
that the plan describes how the municipality intends to implement it and the potential
consequences of the development.
The County Administrative Board and The National Land Agency develop a common view of the
detailed development and property registration processes. The goal of this common view is to
facilitate dialogue and cooperation between planners and property developers to resolve any
property law issues in the early stages of the planning process.
2 & 3. Notification and Review: During the notification phase, the authorities, interested parties,
and others affected by the plan are given an opportunity to comment on the proposed plan. At
this phase, the County Board of Administration is required to state if they think the proposal
might breach the provisions from the county administrative intervention grounds. The National
Land Authority states if they think that not all the questions are regarded or resolved in the
proposal. After the review, the municipality can make only minor changes to the proposed
plan. If there are major changes in the plan, a new review shall be held.
4. Position: The municipality compiles with the written comments from the notification and the
review. The report also states how the municipality has considered the comments received
from the review.
5. Acceptance: A detailed plan is adopted by the City Council. The City Council can also delegate
the decision to the municipality or Planning Authority.
6. Legal Force: Three weeks after the acceptance the detailed plan gains legal force if there are
no further complaints from the County Board of Administration. The detailed plan can be
appealed to the Land and Environmental Court (National Board of Housing, 2015).
4.2.2 Urban Planning and Development Process
The Standard Procedure presented above is used when a municipality already has a proposal for a
specific area. The Urban Planning and Development Process (UPDP), presented below, describes the
earlier steps which a developer/municipality needs to go through before the ideas becomes a feasible
plan. Steps 6-14 in the UPDP are comparable to the Standard Procedure process.
The following actors are the main decision-makers in the urban planning and development process.
Table 7. Main Actors in the Urban Planning and Development Process
Actor Description
Developers There are over 30 developers for Hammarby. The key developers are Skanska, JM, Familjebostäder, PEAB, NCC, Svenska Bostäder, among others. Please see Appendix 5 for a full list of developers and architects.
City Planning Authority
The City Planning Authority is responsible for developing detailed plans with building permits for the new buildings. The planning process is closely regulated in the Planning and Building Act, which states that different interests must be weighed and that public consultation must be completed. The City Planning Authority and the Development Administration collaborate but they have distinct responsibilities.
Development Administration
The Development Administration is responsible for general facilities like streets, squares, and parks. These facilities are built according to the city requirements when new local plans are developed. If the land is owned by the City, the public facilities are funded by the City. If the land is owned by a private actor, the developer pays for the public facilities. The Development Administration is also responsible for land allocation, sale, and leasehold tenure of land owned by the City.
Figure 19 shows the urban planning and development process in the city of Stockholm. The following
text gives translates and provides more detail for each of these steps and describes how relevant
actors are involved.
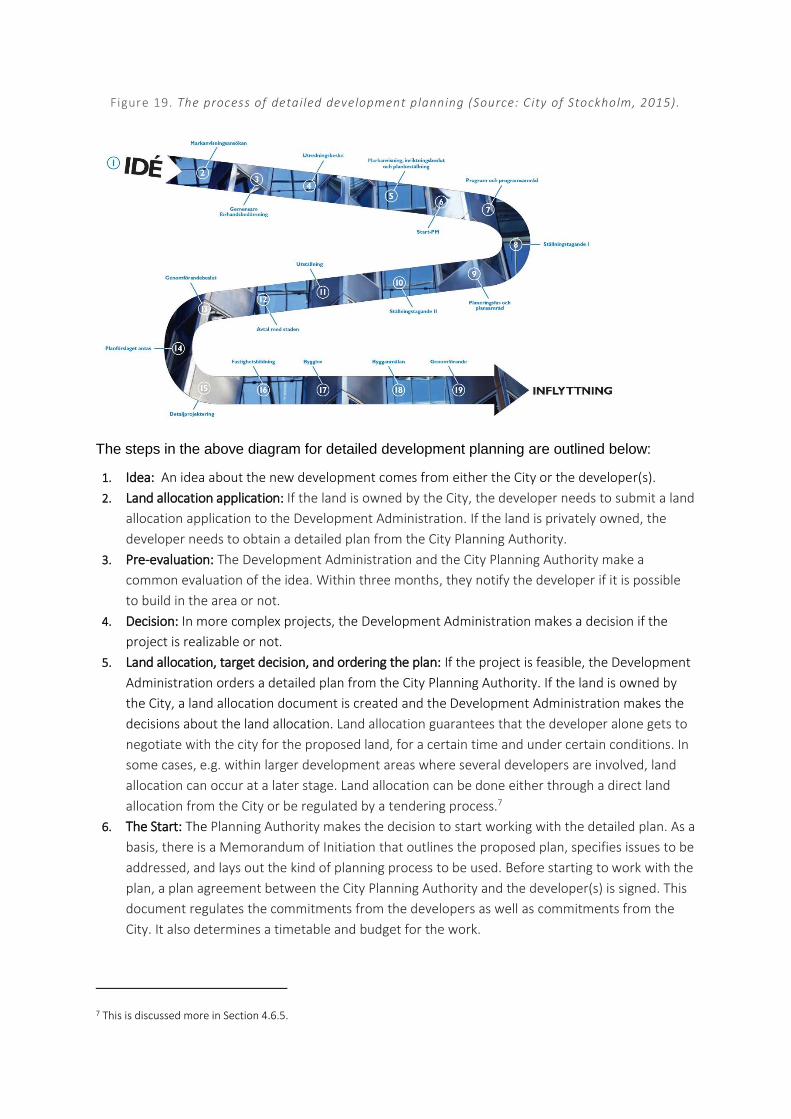
Figure 19. The process of detailed development planning (Source: City of Stockholm, 2015).
The steps in the above diagram for detailed development planning are outlined below:
1. Idea: An idea about the new development comes from either the City or the developer(s).
2. Land allocation application: If the land is owned by the City, the developer needs to submit a land
allocation application to the Development Administration. If the land is privately owned, the
developer needs to obtain a detailed plan from the City Planning Authority.
3. Pre-evaluation: The Development Administration and the City Planning Authority make a
common evaluation of the idea. Within three months, they notify the developer if it is possible
to build in the area or not.
4. Decision: In more complex projects, the Development Administration makes a decision if the
project is realizable or not.
5. Land allocation, target decision, and ordering the plan: If the project is feasible, the Development
Administration orders a detailed plan from the City Planning Authority. If the land is owned by
the City, a land allocation document is created and the Development Administration makes the
decisions about the land allocation. Land allocation guarantees that the developer alone gets to
negotiate with the city for the proposed land, for a certain time and under certain conditions. In
some cases, e.g. within larger development areas where several developers are involved, land
allocation can occur at a later stage. Land allocation can be done either through a direct land
allocation from the City or be regulated by a tendering process.7
6. The Start: The Planning Authority makes the decision to start working with the detailed plan. As a
basis, there is a Memorandum of Initiation that outlines the proposed plan, specifies issues to be
addressed, and lays out the kind of planning process to be used. Before starting to work with the
plan, a plan agreement between the City Planning Authority and the developer(s) is signed. This
document regulates the commitments from the developers as well as commitments from the
City. It also determines a timetable and budget for the work.
7 This is discussed more in Section 4.6.5.
7. Development program and joint consultation: If necessary, the City Planning Authority prepares a
program for consultation. Through the consultation, residents that live nearby have a chance to
provide input about the proposed land development. All comments given at the consultation are
documented. If the project is complex, the Planning Authority makes a formal statement about
them.
8. Position 1: The Planning Authority approves the program as a basis for development.
9. Planning: In this stage the plan becomes more precise and concrete. The Planning Authority also
makes a decision about the different interests from the developers. Questions that are handled
include: risks, noise, pollution, etc. The City conducts a pre-planning of public spaces and
facilities and makes a budget for the potential costs. If the land is owned by a private developer,
the City explains how the public facilities should be built. The second alternative is that the
developer provides a monetary contribution to the City, and then the City will build the public
facilities. Once the proposed plan is ready, another joint consultation takes place. The
consultation follows the same pattern as the one in step 7.
10. Position 2: The Planning Authority gives directions on if to proceed with the plan or if to stop it.
11. Exhibition: The “final” plan is out for exhibition approximately for three weeks. This is the last
chance for other stakeholders to comment on the development.
12. An agreement with the city: Done in parallel with the exhibition, there is an agreement between
the developers and the Development Administration. The agreement regulates access to the
City's land, clarifies other responsibilities, and sets quality standards for the design, environment,
and energy issues. If the land is privately owned, the Development Authority creates a contract
with the developer that regulates how and who that will be responsible for the costs of the
public facilities. If the developer owns the land the developer must pay the costs. If the City owns
the land the Development Administration needs to pay the costs.
13. Decision of implementation: After the exhibition, the Development Authority makes a decision
about implementing the plan.
14. Adopting the plan: The proposed plan goes to the Planning Authority for adoption. Larger plans
go to the City Council for adoption. If the plan does not get appealed within three weeks, it is
considered accepted.
15. Projecting: When the plan is accepted, the developers and the City can start with their separate
detailed projections e.g. the City starts to prepare the ground and the developers make sure
their construction documents are in order.
16. Property formation: This step is conducted by the land surveyors. If the land is owned by the City,
the Development Authority can sell the land to a developer. However, the developer has to
abide by all the decisions made on the piece of land.
17. Building permit: A building permit is required in most cases when there is a new development or a change is being made to an existing development. A building permit should be sought in advance by the developer or other person involved in the project. The decision is made by the Planning Authority in most cases.
18. Building application: This has to be filled in by the developer at least three weeks before starting site development.
19. Implementation: The developer is responsible for having all the permits and contracts. When the development is completed and the City gains control, the developer receives a final document. Residents can now move in (City of Stockholm, 2015).
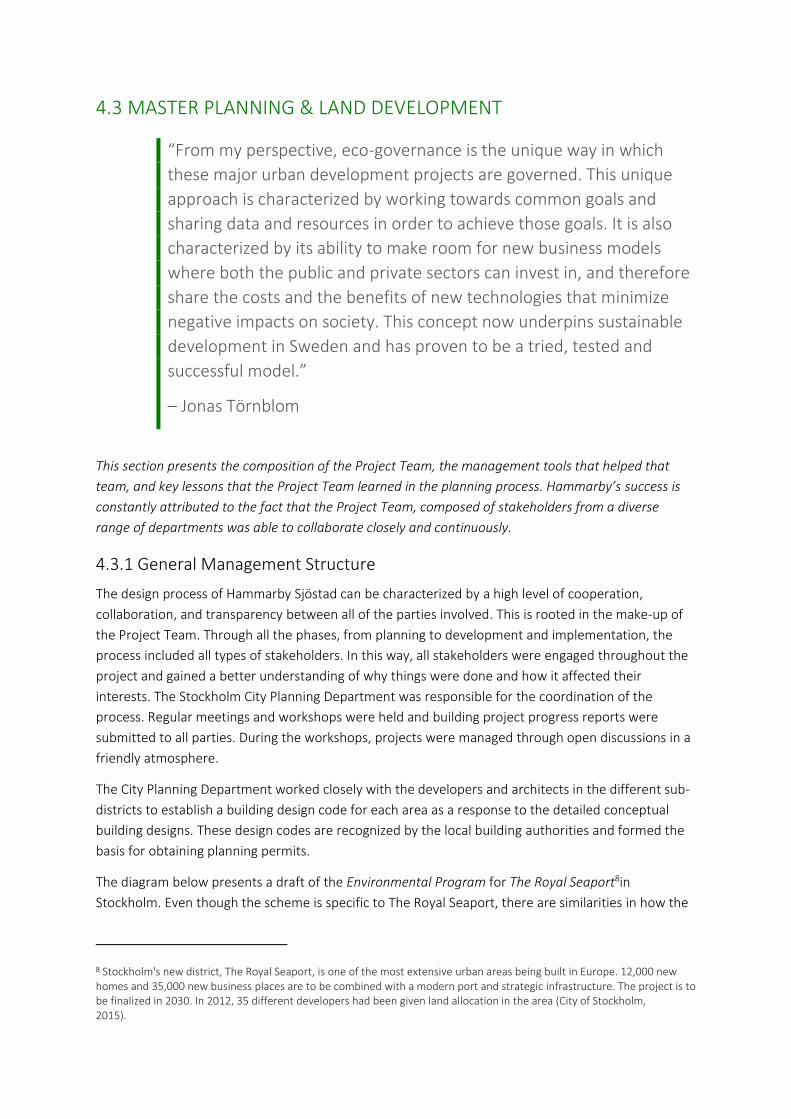
4.3 MASTER PLANNING & LAND DEVELOPMENT
“From my perspective, eco-governance is the unique way in which
these major urban development projects are governed. This unique
approach is characterized by working towards common goals and
sharing data and resources in order to achieve those goals. It is also
characterized by its ability to make room for new business models
where both the public and private sectors can invest in, and therefore
share the costs and the benefits of new technologies that minimize
negative impacts on society. This concept now underpins sustainable
development in Sweden and has proven to be a tried, tested and
successful model.”
– Jonas Törnblom
This section presents the composition of the Project Team, the management tools that helped that
team, and key lessons that the Project Team learned in the planning process. Hammarby’s success is
constantly attributed to the fact that the Project Team, composed of stakeholders from a diverse
range of departments was able to collaborate closely and continuously.
4.3.1 General Management Structure
The design process of Hammarby Sjöstad can be characterized by a high level of cooperation,
collaboration, and transparency between all of the parties involved. This is rooted in the make-up of
the Project Team. Through all the phases, from planning to development and implementation, the
process included all types of stakeholders. In this way, all stakeholders were engaged throughout the
project and gained a better understanding of why things were done and how it affected their
interests. The Stockholm City Planning Department was responsible for the coordination of the
process. Regular meetings and workshops were held and building project progress reports were
submitted to all parties. During the workshops, projects were managed through open discussions in a
friendly atmosphere.
The City Planning Department worked closely with the developers and architects in the different sub-
districts to establish a building design code for each area as a response to the detailed conceptual
building designs. These design codes are recognized by the local building authorities and formed the
basis for obtaining planning permits.
The diagram below presents a draft of the Environmental Program for The Royal Seaport8in
Stockholm. Even though the scheme is specific to The Royal Seaport, there are similarities in how the
8 Stockholm's new district, The Royal Seaport, is one of the most extensive urban areas being built in Europe. 12,000 new homes and 35,000 new business places are to be combined with a modern port and strategic infrastructure. The project is to be finalized in 2030. In 2012, 35 different developers had been given land allocation in the area (City of Stockholm, 2015).
different focus areas have specific goals. It shows how overall goals were intimately connected with a
specific area or sector and this drove the planning process. All of the focus areas presented in the
diagram were also included in Hammarby Sjöstad9.
Figure 20. Example of Environmental Program for the Royal Seaport in Stockholm. Source: City
of Stockholm, 2009. Modified by Authors
4.3.2 The Design Process
The design process involves four major steps:
1. Creating the strategic masterplan; 2. Creating details master plans for the sub-districts; 3. Setting design codes for each sub-district; 4. Appointing development teams that work on each designated plot of land within the sub-
districts. The figure below shows each of these steps.
9 Found in the table is the abbreviation Op case which shall be read as operational goals. The operational goals under each
focus area indicate what needs to be done and how things are to be done.
Figure 21. Hammarby Sjöstad Design Process. Source: Gaffney et al., 2007.
These steps are further explained below:
1. Creating the Strategic Master Plan: The design process starts with the Strategic Master Plan, the
preparation of which was led by Stockholm’s City Planning Office. The plan got divided into twelve
sub-districts, which are being implemented as a series of development phases, six of which have been
developed to date.
2. Creating the Detailed Master Plans: Following completion of the Strategic Master Plan, the City
selects three to four architects/master planners in the private sector who are appointed to test the
Strategic Master Plan and draw up more detailed proposals for the sub-district. A design process
termed “parallel sketches” has been adopted in the preparation of Detailed Master Plan for each sub-
district. The chief planner at the City Planning Office responsible for Hammarby Sjöstad emphasizes
that they try to choose new architects for each sub-district, where possible, and that they encourage
young architects and up-and coming firms to take part. The City evaluates the sketches and
assimilates the best features from each to arrive at an agreed upon detailed Master Plan (CABE 2007).
The figure below shows the sub-districts in Hammarby for which there are Detailed Master Plans for
each of them.
Figure 22. Sub-Districts in Hammarby. Source: Gaffney et al. , 2007.
3. Setting design codes for each sub-district: To support the Detailed Master Plans, the City’s planning
and design team then prepares a design code for each sub-district in close partnership with the
chosen developers and architects for each plot. The design code is taken through the local authority’s
political process and is added as an appendix to the development agreement between the City and
the development partners. The aim is to establish a level of quality for the development that both the
City and developer can agree on (CABE 2007). More details on the design codes are outlined in
Section 4.4.
4. Appointment of development teams: Finally, the City invites a consortium of developers and
architects to direct their attention to each plot of land or individual buildings within each sub-district.
Many developers are invited in order to ensure architectural diversity and a fine grain to the
development, but under the umbrella of a unifying code.
The diversity of design is due to the fact that each street block, and sometimes even each building
and courtyard, are designed by different architects and landscape architects working closely with the
individual clients or developers. Detailed conceptual building models at a scale of 1:200 were
developed through a series of competitions arranged by the Stockholm City Planning Department
where architecture firms were invited to submit ideas. A few different architectural firms in the
private sector were appointed to develop building typologies that would be suitable for the area’s
sub-districts.
Each sub-district typically has between four and eleven plots depending on the size and complexity of
the development. Different teams of developers and architects take forward development on
identified blocks. Over 30 different developers have been identified. Key developers are Skanska,
Family Housing, Swedish Housing, HSB, SKB and Borätt. Over 30 different architects have been
appointed and the project has involved various engineers, surveyors and contractors, which have
been appointed by individual development teams (CABE 2007; Gaffney et al., 2007).
4.3.3 The Project Team
Hammarby Sjöstad involves a variety of actors: several city administrations; the municipal companies
for water, waste, and energy; and the regional public transport company Storstockholms Lokaltrafik
(SL). Private developers, municipal housing companies, architects, and other consultants also played
important roles (Svane et al., 2011).
In 1997, the city authorities appointed a Project Team composed of staff from two different
organisations: the City Planning Administration and the Development Administration of Stockholm.
Both of the administrations assigned staff specifically to the Hammarby project to collaborate with
developers, architects, public sector stakeholders, and Stockholm residents (Svane, 2002).
Kerstin Blix, environmental manager, mentions that the reason for creating the separate Project Team
was due to time pressure and the high targets set in the application for the Olympics (Blix in
Magnusson & Nilsson, 2012).
Figure 23. Organization of the Project Team for Hammarby Sjöstad (Source: Nilsson &
Magnusson, 2012. Modif ied by Authors).
Roles and People (1997):
Head of Project Team: Leif Bergman (1997), Göran Träff (1999), Lars Fränne and Martin Skillbäck.
Head of Development Administration: Gunilla Wastesson
Head of Planning: Jan Inge-Hagström, Vice project leader: Susanne Bäckström
Head of Landscape: Kristina Menyes (från ca 1999)
Head of Environmental issues: Kerstin Blix
Head of Information: Åsa Bodén
Head of Municipal service: Björn Cederquist
Head of Implementaion: Erling Magnusson (Source: Bäckström, 2015)
At first, the Project Team, was outside the ordinary organization of departments within the City of
Stockholm The idea was that the Project Team should be neutral in its contacts with the other
companies and departments, thus being able to be an effective mediator if conflicts or disagreements
were to arise. However, one disadvantage was that the main part of the City’s estimated investment –
SEK 2 billion – would be directed the ordinary way, out of the team’s control. In 1998, the political
majority shifted, and as a result the Team became part of the City’s Streets and Real Estate
Administration (Svane, 2002). Fryxell stated that, “Most of the credit of the job with Hammarby
Sjöstad has to be given to the City Planning Administration and the Development Administration of
Stockholm.”
Figure 24. Interdisciplinary planning between polit icians, developers , and administrations in
an early phase.
Source: Swedish Energy Agency, 2011.
The City’s directive to the Project Team is that they should guide and influence all stakeholders, public
as well as private, to realize the environmental objectives of the project. The City’s politicians decided
on the environmental objectives. Its administrations and companies, the municipal and private
developers, and the contractors and consultants were jointly responsible for realizing the objectives
(Svane, 2002).
The Project Team of Hammarby Sjöstad was responsible for the design and implementation of the
master plan for the area. The Project Team was responsible for planning, finances, land
decontamination, and construction of bridges pipes, streets and parks within the district (Bäckström,
2015).
Figure 25. Model for Hammarby Sjöstad made by the City Planning Department. Source:
Authors
4.3.3 Management Tools
The Project Team used three main channels to better manage the project: their authority in the
Streets and Real Estate Administration, plans and building permits, and the Environmental Load
Profile.
Since the Project Team had authority in the Streets and Real Estate Administration, the Project Team
could influence developers and future real estate owners. For example, this could take place through
development contracts negotiated through the Streets and Real Estate Administration. Beyond this,
the Project Team could also use plans and building permits to enforce and manage the planning
process (Svane, 2002).10
The Environmental Load Profile, discussed in Section 3, was also an important tool for management.
The first calculations utilizing ELP were made in the summer of 2000. During the competition
arranged by the Team for the developers, it was extensively used as an evaluation tool. Later in the
process, the ELP will also quantify to what extent the developers and contractors succeed in realizing
the project’s environmental objectives. By then, the ELP is also expected to highlight the outstanding
ideas and solutions, and to inspire further improvements in the later phases of the project (Svane Ö
2002).
4.3.4 Key Lessons from the Project Team’s Working Experience
From the experience of Hammarby’s Project Team, the following lessons can be extracted:
1. Prioritize close collaboration between different departments: Regarding the close collaboration
between the different departments at the Stockholm municipality, Susanne Bäckström, the Vice
Project Leader for the planning of Hammarby,11 mentioned that one of the most important and
challenging things was to make all the different departments at the Stockholm municipality to work
together in the Project Team that was devoted to plan Hammarby Sjöstad. This group consisted of
eleven people and had their own project office at the site. This was a great success. Another
important organizational arrangement was that the executing group (constructors etc.) was involved
in the planning process. From this they had a good understanding already from the start concerning
the intentions and direction for Hammarby Sjöstad (Bäckström, 2012).
2. Involve the developers as early as possible: Bäckström (2012) emphasizes the importance of creating
an environmental program as early as possible and to involve developers as quickly as possible. This
way, the developers do not see the program as a burden but instead as an important starting point
for the project. It is also important to get input from the developers regarding their view of the
project.
10 As of now, we know little about how and to what effect the formal environmental tools just mentioned have been used. 11 Susanne Bäckström worked with Hammarby Sjöstad for a period of ten years, from start in 1995 until 2005, so it is a
project that lies close to her heart. She was employed at Stockholm Planning Department as vice project leader for the
planning of Hammarby Sjöstad where she took part of concepts and ideas, master planning, detailed planning and design
guidelines. Since 2005 Susanne has been chef planning architect at Sweco Architects office in Stockholm.
3. Decide on Environmental Program first, and use as guiding framework: The fact that the master plan
was decided before the Environmental Program made some of the planning methods in conflict with
the environmental goals. Hence, it is important that the environmental goals drive every step of the
process.
The detailed plans were not primarily based on the Environmental Program, but rather on the older
master plan. Making sure the residences had a view of the lake was given priority, even though the
result would be large window areas facing the north, which somewhat impacted the energy efficiency
goals. Due to the use of energy-efficient windows, the energy use was still acceptable to achieve the
environmental objectives. Car parking is another example of conflict between environmental
objectives and other goals (Svane, 2002).
Most of the architects involved in the competition for the structure plan have been appointed to
continue their work on the project. The developers chose their architects from those partaking in the
competition not because of their specific knowledge of environmental issues, but rather because of
their skill in the planning and design of housing (Svane, 2002).
The municipal housing company Familjebostäder had one conflict with the team concerning the
design of a pilot project building, where the southern facade has solar cells for producing electricity
integrated into its design. This was adopted by the developer, but initially not by the city planner.
Here, two aesthetic ideals clashed, but in the end the planner accepted that the pilot project should
prioritize the local production of energy (Svane et al., 2011).
4. Difficult goals can encourage innovation: The difficult goal of “twice as good” for environmental
achievement pushed the Project Team to use innovative methods. Since the environmental objectives
were tough, new methods, tools and solutions were needed in the development process. Mutual
learning concerning the environmental issues was one such tool, the search for new technical
solutions another (Svane Ö, 2002).
5. Assign clear responsibilities that are aimed at achieving specific goals: Bäckström (2012) believes that
the motivation of the developers would be even higher if the structure of the organizations managing
each goal where more clear. When the goals were designed there was no explanation of who had
control over each goal. Early targets, clear objectives, and a structure for how these goals could be
monitored and measured is something that Bäckström sees as important to share with the developers
for future projects.
4.4 PROPERTY DEVELOPMENT
This section focuses on the development process of Hammarby Sjöstad and on property development
(mainly from a developer’s perspective). It also presents how the City and the Project Team attracted
developers. One main reason for the success of Hammarby was the smooth transitions and interaction
between the planning, development, and implementation processes. Bäckström (2012) also adds that
all three processes must interact with each other.
4.4.1 Policies towards Developers
In an agreement on land development, the developers are regulated in the following aspects:
The developers must undertake the design and construction of the land area to meet the City's
general requirements and goals for energy efficient solutions and choice of renewable energy in
new construction projects.
In addition to the City's general requirements, builders in Hammarby Sjöstad shall meet the
requirements and pursue objectives in accordance with the Environmental Program for Hammarby
Sjöstad.
The developers must provide energy data on the development process to the city.
Water policy and waste policy are also regulated in the development contract from the City.
4.4.2 Attracting Developers to Hammarby Sjöstad
Hammarby’s inherent characteristics attracted developers, but the Project Team and the City also
created incentives to attract developers. Inherently, developers were attracted to work in Hammarby
for a few key reasons:
1. Ambition to create a cutting-edge and sustainable reputation: Hammarby was an environmentally-
friendly neighborhood. Developers were attracted to the idea of being involved in the building of
one of the world’s first large-scale eco-friendly neighborhoods and creating a reputation for
themselves around these goals.
2. Location: The location chosen to prevent sprawl was close to the inner city of Stockholm since it
was an infill development. The location close to Stockholm makes it an attractive location, which is
a great incentive for developers to bid for the land.
3. Ease of access to utilities: The location and relevant policies also made it easy to connect to the
water and and electricity grid, which could often be a huge headache for developers (Skillbäck,
2015).
Moreover, the Project Team used initial funding, competitions, discussions, and negotiations to
attract and engage developers.
1. Initial funding: Early on in the environmental management process, the City’s politicians promised
SEK 200 million (22 million Euro) to finance the extra costs of environmental measures and
technologies. This attracted many developers to the project even though the funding ended up not
being available to developers. The funding was instead used for innovations related to the Hammarby
Model.
Somewhat later, the national government offered the LIP subsidy for investments in environmentally
friendly technology (Svane, 2005). When the City sells land as part of a development agreement, the
level of the subsidy is also a part of negotiations.
In principle, the Project Team’s officers from the Roads and Real Estate Office could have set
conditions concerning, for example, environmental objectives and land use price as a policy
instrument: the developer gets the land at a lower price if he or she promises to realize a set of
environmental objectives. In practice, this was only used minimally on Sickla Udde, as the City did not
own the land (Gaffney et al., 2007). However, for where the City owns the land, this could be an
effective policy instrument to incent developers to work on projects with difficult environmental
objectives.
2. Competitions: To inspire the developers, the project team held two competitions: The Best
Proposition and the Greenhouse for Creative Ideas competitions. Following each competition, the City
worked on compiling and disseminating the ideas and experiences gained from the competition. A
‘Best Building’ competition was also open to all the developers in Hammarby Sjöstad (Gaffney et al.,
2007).
3. Discussions and negotiations: The Environmental Officer of the team has put significant effort into
encouraging the developers and contractors. She has organized seminars, discussions on
infrastructural systems etc. She has used the ELP to gain and disseminate knowledge among the
stakeholders. Information documents from the City’s Environmental and Health Office have
contributed too (Hult and Corner, 1998). The evaluation tool, the seminars, and discussions are all
informal tools in the environmental management process (Svane, 2002). The developers have also co-
operated in compiling a report that evaluates different technical solutions that might comply with the
environmental objectives (Svane, 2002).
Bäckström's (2012) experience shows that developers could be more involved in the environmental
initiatives. She believes that a persistent problem is the short timeframe during which developers are
involved. This is also emphasized by Kerstin Blix, the Environmental Manager for the project. Many
developers just build to sell with a contract period of two years. Sustainable investments often do not
result in short term economic benefits, but rather become profitable after a longer period of time. If
the contract period could be extended to 10 years, the developers might be more invested in the
environmental initiatives. Blix's experience in the Hammarby Sjöstad project shows that if developers
were contracted to also manage their buildings rather than just construction, they were more eager
to spend more time and effort on the environmental initiatives (Magnusson & Nilsson, 2012).
4.4.3 Choosing the Developers
When choosing a developer, the City of Stockholm takes into account the developer’s economic
status, stability, and interest in long-term management of the building. The City also takes into
account how the developer has met the City´s requirements for land allocation policies of previous
projects. A third element that the City considers is how the developer’s work will contribute to making
the housing market in Hammarby more competitive.
There are also conditions for land allocation. These are outlined below.
1. A land allocation is limited to two years from the Development Committee’s decision. If a binding agreement of land development cannot be met in these two years the City makes a new land allocation. The Development Administration may grant an extension. A condition for extension is that the developer actively pursued the project and the delay is not attributed to the developer.
2. A land allocation may be withdrawn during the specified period if the developer violates any of the City’s requirements or if the developer and the City cannot agree on the price.
3. The developer is responsible for all financial risks associated with detailed design planning. Any design planning that has a connection with the planning work should be made in consultation with the city.
4. Projects canceled due to a decision during the detailed planning process give no right to compensation or new land allocation as compensation.
5. At the City's request, the developers have to build special housing, facilities for children and the elderly, as well as certain types of dwellings.
6. Land allocation may not be transferred without the city's permission. This also applies transfers to affiliated/daughter companies.

7. The recipient of land allocation for the tenancy shall have contracts or concluding agreements with the housing office in connection with instructions.
8. The developer must follow general requirements of City Council or the Development Committee. For example, they might request that the developer integrates various forms of social housing and custom homes in new housing (Administration Development, Land Allocation Policy).
4.5 DESIGN GUIDELINES USED FOR HAMMARBY SJÖSTAD
This section presents the different guidelines that developers and architects had to use for Hammarby.
The design process is notable for the extremely high degree of local authority and leadership, which
permeates every stage from the development of the master plan to construction. The City’s ownership
of the land in Hammarby Sjöstad significantly affected the City’s ability to implement and control the
design.
The City and the developers established design codes in order to establish a common understanding
of the upcoming development. The design code is rather comprehensive and sets out principles under
several headings:
- Urban Form
- Architectural Style
- Building Design
- Public Space
4.5.1 Urban Form
Specifications for urban form fall under the following three categories:
District character: Hammarby should combine traditional inner city (European) built form with
modern architectural influences and draw inspiration from Hammarby Sjöstad’s natural
environment. Key to this character is the mix of businesses and uses, density, built form
(blocks built around inner courtyard or play area), public spaces, and the relationship to the
water.
Layout, form, and structure: This included guidelines for each block, key landmark buildings,
public spaces and pedestrian routes. The guidelines are not prescriptive with regards to which
materials are to be used or the number of stories, but a descriptive rationale behind the
concept for each block or key buildings is set out, which makes clear the principles which
should apply, but leaves significant scope for innovation.
New Urbanism principals: These principles are found in the project’s approach towards
achieving sustainability. These strategies include minimum impact development, eco-friendly
technologies, respecting ecology and the value of natural systems, energy efficiency,
minimizing use of nonrenewable fuels, increasing local production, and increasing walking,
and reducing automobile dependency (Gaffney et al., 2007).

Figure 26. Housing development by the waterfront. Source: Authors
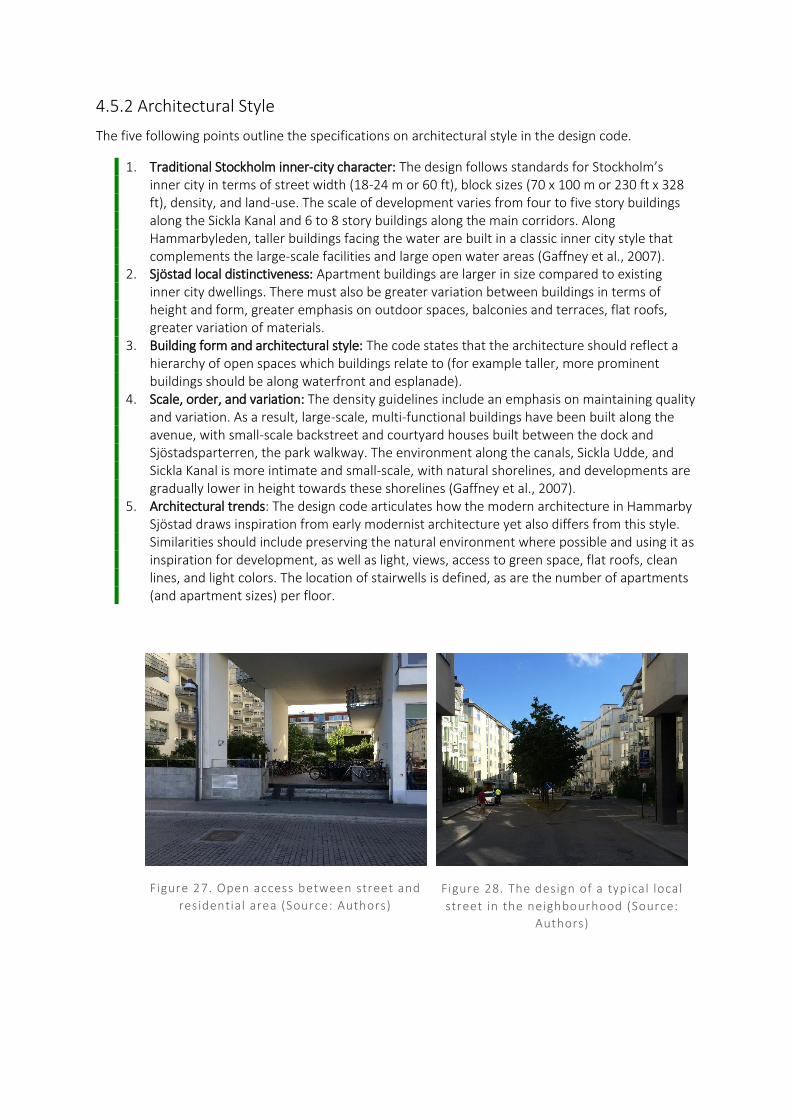
4.5.2 Architectural Style
The five following points outline the specifications on architectural style in the design code.
1. Traditional Stockholm inner-city character: The design follows standards for Stockholm’s inner city in terms of street width (18-24 m or 60 ft), block sizes (70 x 100 m or 230 ft x 328 ft), density, and land-use. The scale of development varies from four to five story buildings along the Sickla Kanal and 6 to 8 story buildings along the main corridors. Along Hammarbyleden, taller buildings facing the water are built in a classic inner city style that complements the large-scale facilities and large open water areas (Gaffney et al., 2007).
2. Sjöstad local distinctiveness: Apartment buildings are larger in size compared to existing inner city dwellings. There must also be greater variation between buildings in terms of height and form, greater emphasis on outdoor spaces, balconies and terraces, flat roofs, greater variation of materials.
3. Building form and architectural style: The code states that the architecture should reflect a hierarchy of open spaces which buildings relate to (for example taller, more prominent buildings should be along waterfront and esplanade).
4. Scale, order, and variation: The density guidelines include an emphasis on maintaining quality and variation. As a result, large-scale, multi-functional buildings have been built along the avenue, with small-scale backstreet and courtyard houses built between the dock and Sjöstadsparterren, the park walkway. The environment along the canals, Sickla Udde, and Sickla Kanal is more intimate and small-scale, with natural shorelines, and developments are gradually lower in height towards these shorelines (Gaffney et al., 2007).
5. Architectural trends: The design code articulates how the modern architecture in Hammarby Sjöstad draws inspiration from early modernist architecture yet also differs from this style. Similarities should include preserving the natural environment where possible and using it as inspiration for development, as well as light, views, access to green space, flat roofs, clean lines, and light colors. The location of stairwells is defined, as are the number of apartments (and apartment sizes) per floor.
Figure 27. Open access between street and
residential area (Source: Authors)
Figure 28. The design of a typical local
street in the neighbourhood (Source:
Authors)
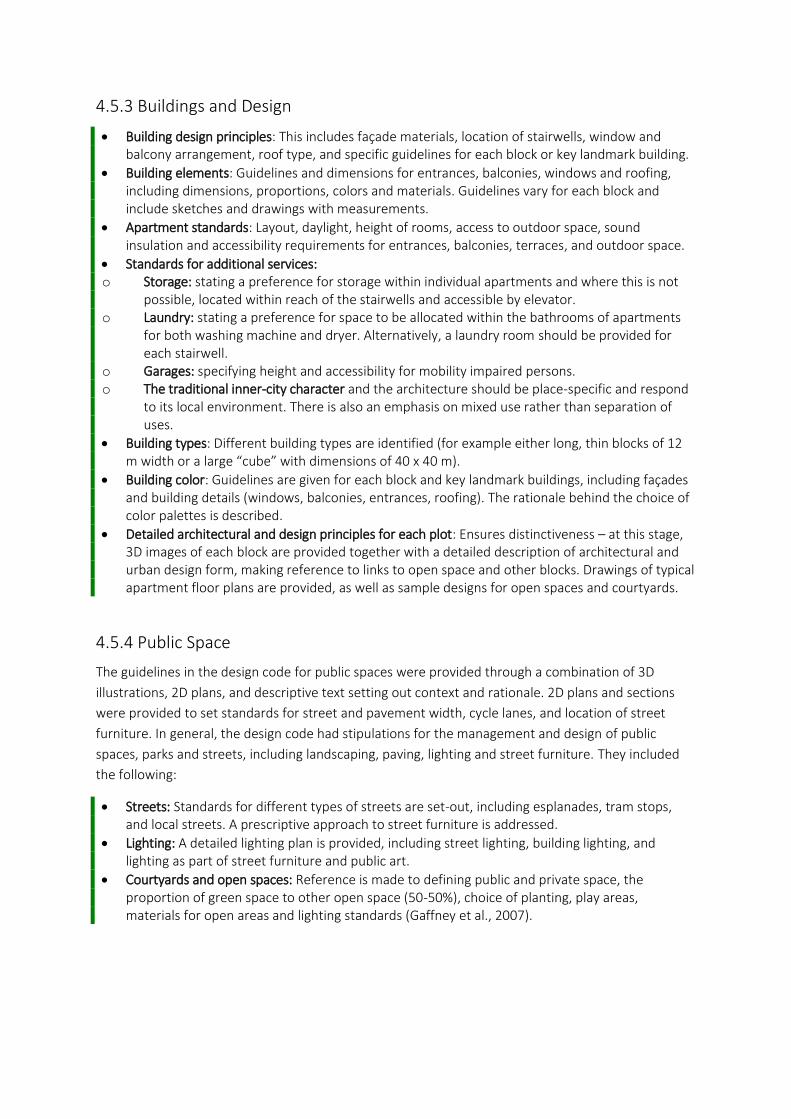
4.5.3 Buildings and Design
Building design principles: This includes façade materials, location of stairwells, window and balcony arrangement, roof type, and specific guidelines for each block or key landmark building.
Building elements: Guidelines and dimensions for entrances, balconies, windows and roofing, including dimensions, proportions, colors and materials. Guidelines vary for each block and include sketches and drawings with measurements.
Apartment standards: Layout, daylight, height of rooms, access to outdoor space, sound insulation and accessibility requirements for entrances, balconies, terraces, and outdoor space.
Standards for additional services: o Storage: stating a preference for storage within individual apartments and where this is not
possible, located within reach of the stairwells and accessible by elevator. o Laundry: stating a preference for space to be allocated within the bathrooms of apartments
for both washing machine and dryer. Alternatively, a laundry room should be provided for each stairwell.
o Garages: specifying height and accessibility for mobility impaired persons. o The traditional inner-city character and the architecture should be place-specific and respond
to its local environment. There is also an emphasis on mixed use rather than separation of uses.
Building types: Different building types are identified (for example either long, thin blocks of 12 m width or a large “cube” with dimensions of 40 x 40 m).
Building color: Guidelines are given for each block and key landmark buildings, including façades and building details (windows, balconies, entrances, roofing). The rationale behind the choice of color palettes is described.
Detailed architectural and design principles for each plot: Ensures distinctiveness – at this stage, 3D images of each block are provided together with a detailed description of architectural and urban design form, making reference to links to open space and other blocks. Drawings of typical apartment floor plans are provided, as well as sample designs for open spaces and courtyards.
4.5.4 Public Space
The guidelines in the design code for public spaces were provided through a combination of 3D
illustrations, 2D plans, and descriptive text setting out context and rationale. 2D plans and sections
were provided to set standards for street and pavement width, cycle lanes, and location of street
furniture. In general, the design code had stipulations for the management and design of public
spaces, parks and streets, including landscaping, paving, lighting and street furniture. They included
the following:
Streets: Standards for different types of streets are set-out, including esplanades, tram stops, and local streets. A prescriptive approach to street furniture is addressed.
Lighting: A detailed lighting plan is provided, including street lighting, building lighting, and lighting as part of street furniture and public art.
Courtyards and open spaces: Reference is made to defining public and private space, the proportion of green space to other open space (50-50%), choice of planting, play areas, materials for open areas and lighting standards (Gaffney et al., 2007).

Figure 29. Hammarby´s close connection with water contributes to a calm and peaceful l iv ing
environment (Source: Authors).
Figure 30. Hammarby´s industr ial
history visible in the area (Source:
Authors).
Figure 31. The main boulevard with
the l ight rail , car lanes and bicycle
path (Source: Authors).
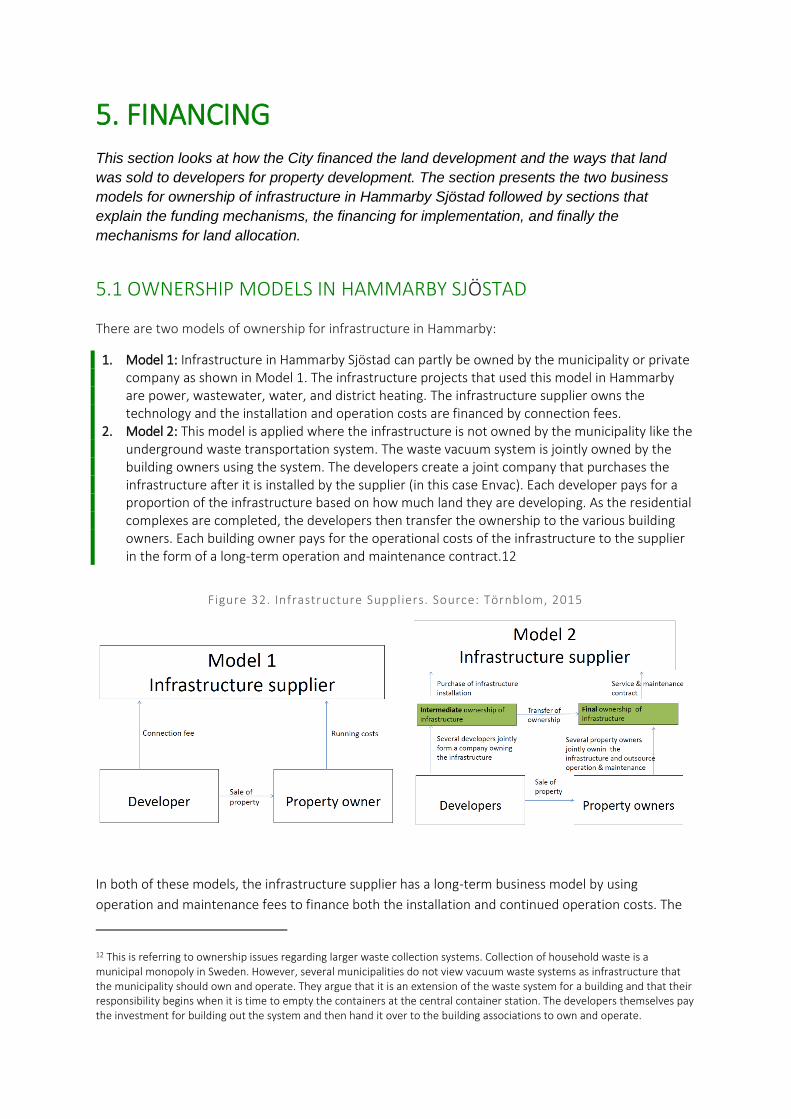
5. FINANCING
This section looks at how the City financed the land development and the ways that land
was sold to developers for property development. The section presents the two business
models for ownership of infrastructure in Hammarby Sjöstad followed by sections that
explain the funding mechanisms, the financing for implementation, and finally the
mechanisms for land allocation.
5.1 OWNERSHIP MODELS IN HAMMARBY SJÖSTAD
There are two models of ownership for infrastructure in Hammarby:
1. Model 1: Infrastructure in Hammarby Sjöstad can partly be owned by the municipality or private company as shown in Model 1. The infrastructure projects that used this model in Hammarby are power, wastewater, water, and district heating. The infrastructure supplier owns the technology and the installation and operation costs are financed by connection fees.
2. Model 2: This model is applied where the infrastructure is not owned by the municipality like the underground waste transportation system. The waste vacuum system is jointly owned by the building owners using the system. The developers create a joint company that purchases the infrastructure after it is installed by the supplier (in this case Envac). Each developer pays for a proportion of the infrastructure based on how much land they are developing. As the residential complexes are completed, the developers then transfer the ownership to the various building owners. Each building owner pays for the operational costs of the infrastructure to the supplier in the form of a long-term operation and maintenance contract.12
Figure 32. Infrastructure Suppliers. Source: Törnblom, 2015
In both of these models, the infrastructure supplier has a long-term business model by using
operation and maintenance fees to finance both the installation and continued operation costs. The
12 This is referring to ownership issues regarding larger waste collection systems. Collection of household waste is a municipal monopoly in Sweden. However, several municipalities do not view vacuum waste systems as infrastructure that the municipality should own and operate. They argue that it is an extension of the waste system for a building and that their responsibility begins when it is time to empty the containers at the central container station. The developers themselves pay the investment for building out the system and then hand it over to the building associations to own and operate.
reason Model 1 is chosen for most of the infrastructure projects is because the infrastructure
suppliers are public companies or private-public companies.
The advantages of Model 2 are that financial risks are reallocated to different parties depending on
which stage the development is in. The developers bear the risk when they are developing the land
but have the greatest incentive to manage this risk since they can sell the property. Then, the
property owners bear the risk of the infrastructure once they obtain the property from the
developers.
5.2 FUNDING MECHANISMS
The funding bodies for the Hammarby Sjöstad project include the City of Stockholm, Stockholm
Transport, the National Road Administration, and private funding. However, major funding allocations
distributed through the City were received from the national government through the Local
Investment Program (Stockholm LIP, 2003).
5.2.1 Funding from the Local Investment Program
The LIP represents Sweden’s largest single environmental initiative. The Swedish Parliament
earmarked SEK 6.2 billion (for all of Sweden) in grants for LIPs over the period 1998–2002 with the
aim of improving ecological sustainability. The programs covered all aspects of sustainability including
improving energy efficiency, increasing renewable energy, ensuring proper treatment for air and
water emissions, increasing biodiversity, and creating livable and sustainable residential areas.
In 2002, the Local Investment Program got replaced by the Climate Investment Program (Klimp).
Klimp maintained the subsidy levels from LIP but had a stronger focus on measures to reduce
greenhouse gas emissions and improving energy efficiency (SEPA, 2005).
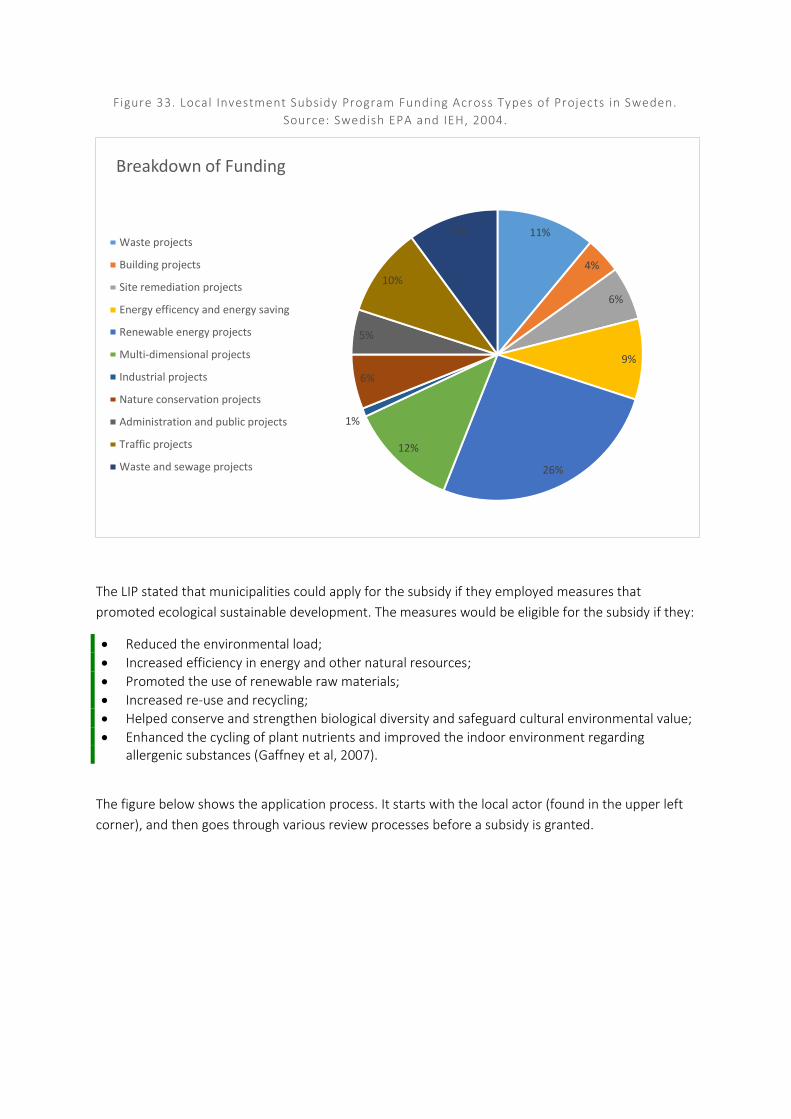
Figure 33. Local Investment Subsidy Program Funding Across Types of Projects in Sweden.
Source: Swedish EPA and IEH, 2004.
The LIP stated that municipalities could apply for the subsidy if they employed measures that
promoted ecological sustainable development. The measures would be eligible for the subsidy if they:
Reduced the environmental load;
Increased efficiency in energy and other natural resources;
Promoted the use of renewable raw materials;
Increased re-use and recycling;
Helped conserve and strengthen biological diversity and safeguard cultural environmental value;
Enhanced the cycling of plant nutrients and improved the indoor environment regarding allergenic substances (Gaffney et al, 2007).
The figure below shows the application process. It starts with the local actor (found in the upper left
corner), and then goes through various review processes before a subsidy is granted.
11%
4%
6%
9%
26%
12%
1%
6%
5%
10%
10%
Breakdown of Funding
Waste projects
Building projects
Site remediation projects
Energy efficency and energy saving
Renewable energy projects
Multi-dimensional projects
Industrial projects
Nature conservation projects
Administration and public projects
Traffic projects
Waste and sewage projects
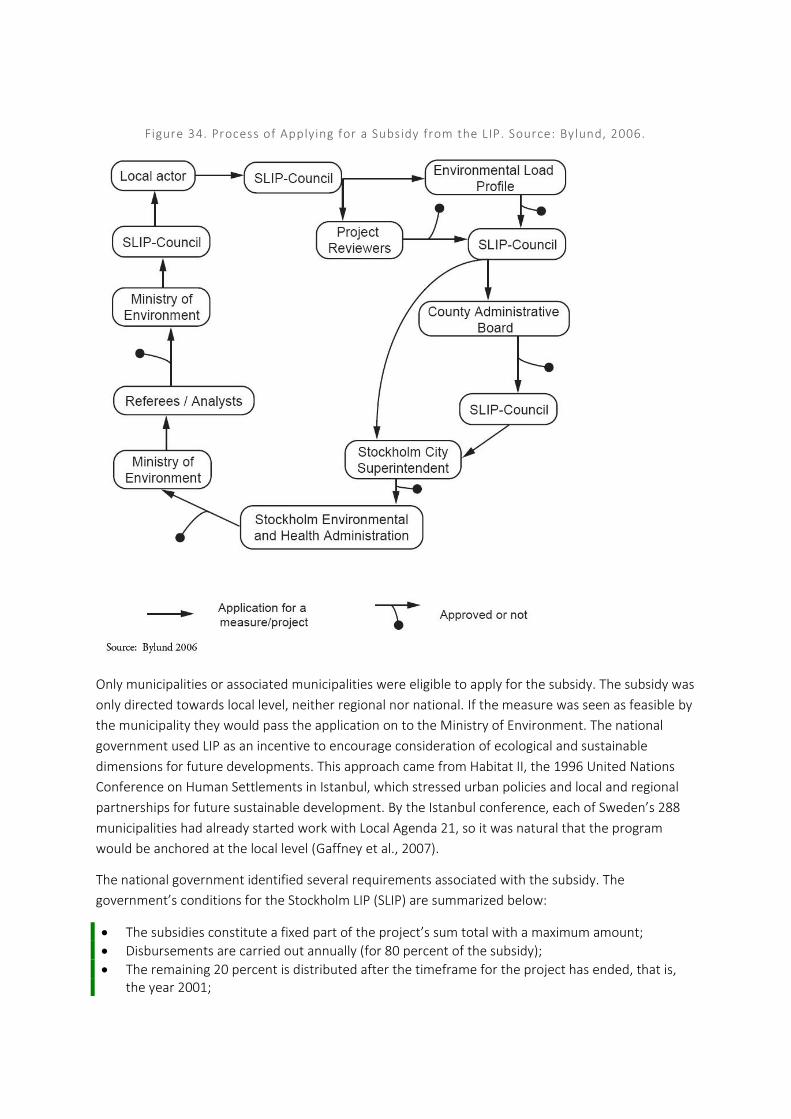
Figure 34. Process of Applying for a Subsidy from the LIP. Source: Bylund, 2006.
Only municipalities or associated municipalities were eligible to apply for the subsidy. The subsidy was
only directed towards local level, neither regional nor national. If the measure was seen as feasible by
the municipality they would pass the application on to the Ministry of Environment. The national
government used LIP as an incentive to encourage consideration of ecological and sustainable
dimensions for future developments. This approach came from Habitat II, the 1996 United Nations
Conference on Human Settlements in Istanbul, which stressed urban policies and local and regional
partnerships for future sustainable development. By the Istanbul conference, each of Sweden’s 288
municipalities had already started work with Local Agenda 21, so it was natural that the program
would be anchored at the local level (Gaffney et al., 2007).
The national government identified several requirements associated with the subsidy. The
government’s conditions for the Stockholm LIP (SLIP) are summarized below:
The subsidies constitute a fixed part of the project’s sum total with a maximum amount;
Disbursements are carried out annually (for 80 percent of the subsidy);
The remaining 20 percent is distributed after the timeframe for the project has ended, that is, the year 2001;

The progress of the project is to be accounted for annually, any deviations and changes in the projects that may occur must be reported;
Repayment is required for non-realized projects.
Figure 35. Subsidies from the Swedish Government (SEK Mill ion)
As shown above, the majority of the subsidy (67% of the SEK 400 million) was earmarked for
development and demonstration projects. The remaining 33% was to be used to encourage better
buildings, procure technology, developing the ELP (Environmental Load Profile, explained in Section
3.2), and information sharing.
LIP was identified as important in achieving the operational goals of the environmental program for
Hammarby Sjöstad. The LIP supported the following projects:
Central Wastewater Treatment Plant: The LIP supported the construction of the Hammarby Sjöstadsverk, the central waste water treatment plant in Stockholm that was next to Hammarby Sjöstad, where methods were developed to improve wastewater treatment both in Hammarby Sjöstad and in other districts.
Biogas technology: LIP was also the catalyst for Stockholm Water to invest in biogas solutions. In turn the investment from Stockholm Water has led to technological development, reduced energy consumption, lower emissions and the waste water treatment plants have become sources of renewable energy for Hammarby (The Environmental Protection Agency, 2008). Two biogas-plants are being built with the money from LIP, one located north west of Stockholm in Bromma and one in the Hammarby area close by the Henriksdals WWTP. One aim was to increase production of purified biogas for vehicle fuel. Another aim was to reduce the treatment plant’s energy consumption and carbon dioxide emissions by replacing fossil fuels with biogas (The Environmental Protection Agency, 2008).
Other technologies: The LIP also helped to initiate the installation of solar cells, solar panels, fuel cells, biogas stoves, green roofs, and the development of local storm water treatment in Hammarby Sjöstad (Brandt & Pandis, 2011).
60
15
6
9270
5
35
Subsidies from the Swedish Government (SEK Million)
Technology Procurement Co-operative Procurement
Knowledge Transference Environmental Load Profile
Development and Demostration Projects Incentive for Best Proposition
Incentive for Best Building
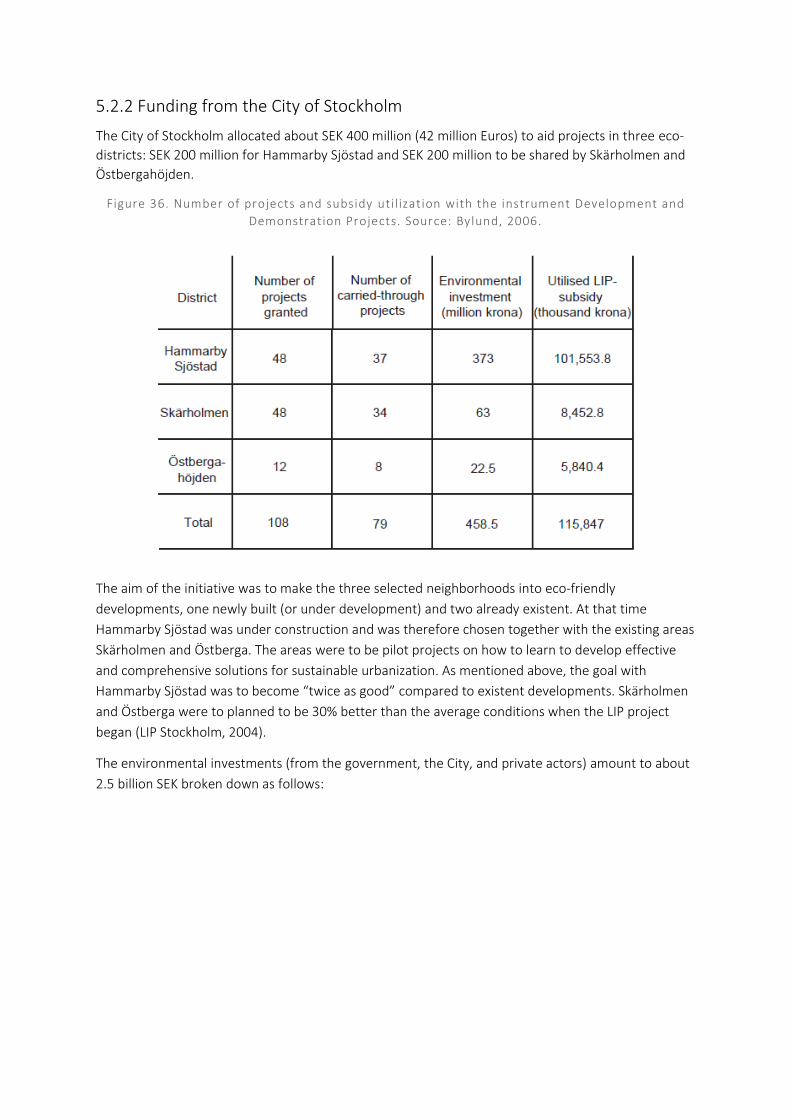
5.2.2 Funding from the City of Stockholm
The City of Stockholm allocated about SEK 400 million (42 million Euros) to aid projects in three eco-
districts: SEK 200 million for Hammarby Sjöstad and SEK 200 million to be shared by Skärholmen and
Östbergahöjden.
Figure 36. Number of projects and subsidy util ization with the instrument Development and
Demonstration Projects. Source: Bylund, 2006.
The aim of the initiative was to make the three selected neighborhoods into eco-friendly
developments, one newly built (or under development) and two already existent. At that time
Hammarby Sjöstad was under construction and was therefore chosen together with the existing areas
Skärholmen and Östberga. The areas were to be pilot projects on how to learn to develop effective
and comprehensive solutions for sustainable urbanization. As mentioned above, the goal with
Hammarby Sjöstad was to become “twice as good” compared to existent developments. Skärholmen
and Östberga were to planned to be 30% better than the average conditions when the LIP project
began (LIP Stockholm, 2004).
The environmental investments (from the government, the City, and private actors) amount to about
2.5 billion SEK broken down as follows:
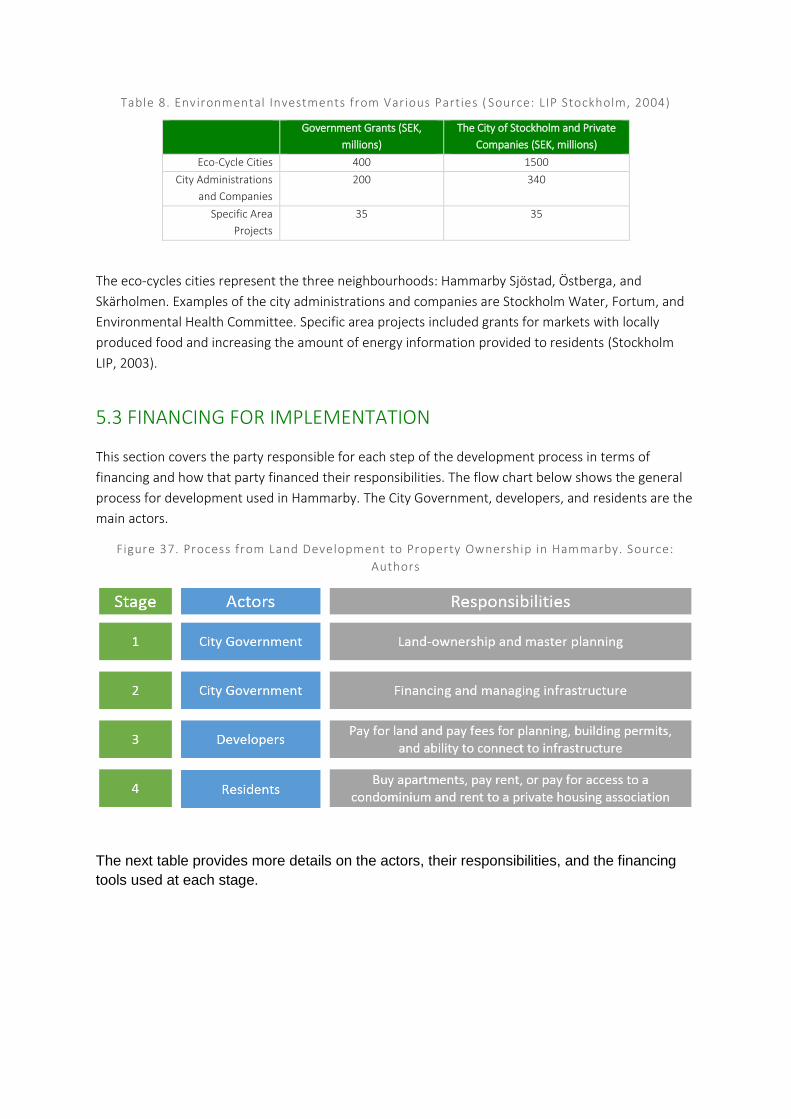
Table 8. Environmental Investments from Various Parties ( Source: LIP Stockholm, 2004)
Government Grants (SEK,
millions)
The City of Stockholm and Private
Companies (SEK, millions)
Eco-Cycle Cities 400 1500
City Administrations
and Companies
200 340
Specific Area
Projects
35 35
The eco-cycles cities represent the three neighbourhoods: Hammarby Sjöstad, Östberga, and
Skärholmen. Examples of the city administrations and companies are Stockholm Water, Fortum, and
Environmental Health Committee. Specific area projects included grants for markets with locally
produced food and increasing the amount of energy information provided to residents (Stockholm
LIP, 2003).
5.3 FINANCING FOR IMPLEMENTATION
This section covers the party responsible for each step of the development process in terms of
financing and how that party financed their responsibilities. The flow chart below shows the general
process for development used in Hammarby. The City Government, developers, and residents are the
main actors.
Figure 37. Process from Land Development to Property Ownership in Hammarby. Source:
Authors
The next table provides more details on the actors, their responsibilities, and the financing
tools used at each stage.
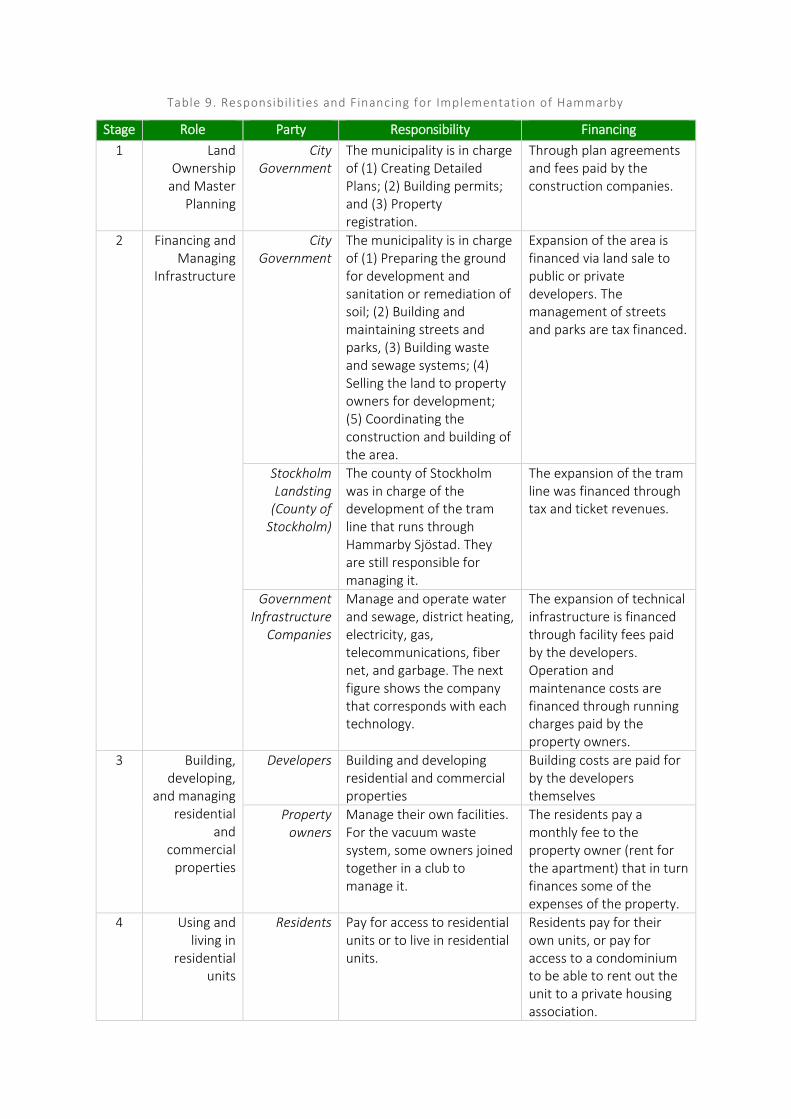
Table 9. Responsibil ities and Financing for Implementation of Hammarby
Stage Role Party Responsibility Financing
1 Land Ownership
and Master Planning
City Government
The municipality is in charge of (1) Creating Detailed Plans; (2) Building permits; and (3) Property registration.
Through plan agreements and fees paid by the construction companies.
2 Financing and Managing
Infrastructure
City Government
The municipality is in charge of (1) Preparing the ground for development and sanitation or remediation of soil; (2) Building and maintaining streets and parks, (3) Building waste and sewage systems; (4) Selling the land to property owners for development; (5) Coordinating the construction and building of the area.
Expansion of the area is financed via land sale to public or private developers. The management of streets and parks are tax financed.
Stockholm Landsting
(County of Stockholm)
The county of Stockholm was in charge of the development of the tram line that runs through Hammarby Sjöstad. They are still responsible for managing it.
The expansion of the tram line was financed through tax and ticket revenues.
Government Infrastructure
Companies
Manage and operate water and sewage, district heating, electricity, gas, telecommunications, fiber net, and garbage. The next figure shows the company that corresponds with each technology.
The expansion of technical infrastructure is financed through facility fees paid by the developers. Operation and maintenance costs are financed through running charges paid by the property owners.
3 Building, developing,
and managing residential
and commercial
properties
Developers Building and developing residential and commercial properties
Building costs are paid for by the developers themselves
Property owners
Manage their own facilities. For the vacuum waste system, some owners joined together in a club to manage it.
The residents pay a monthly fee to the property owner (rent for the apartment) that in turn finances some of the expenses of the property.
4 Using and living in
residential units
Residents Pay for access to residential units or to live in residential units.
Residents pay for their own units, or pay for access to a condominium to be able to rent out the unit to a private housing association.
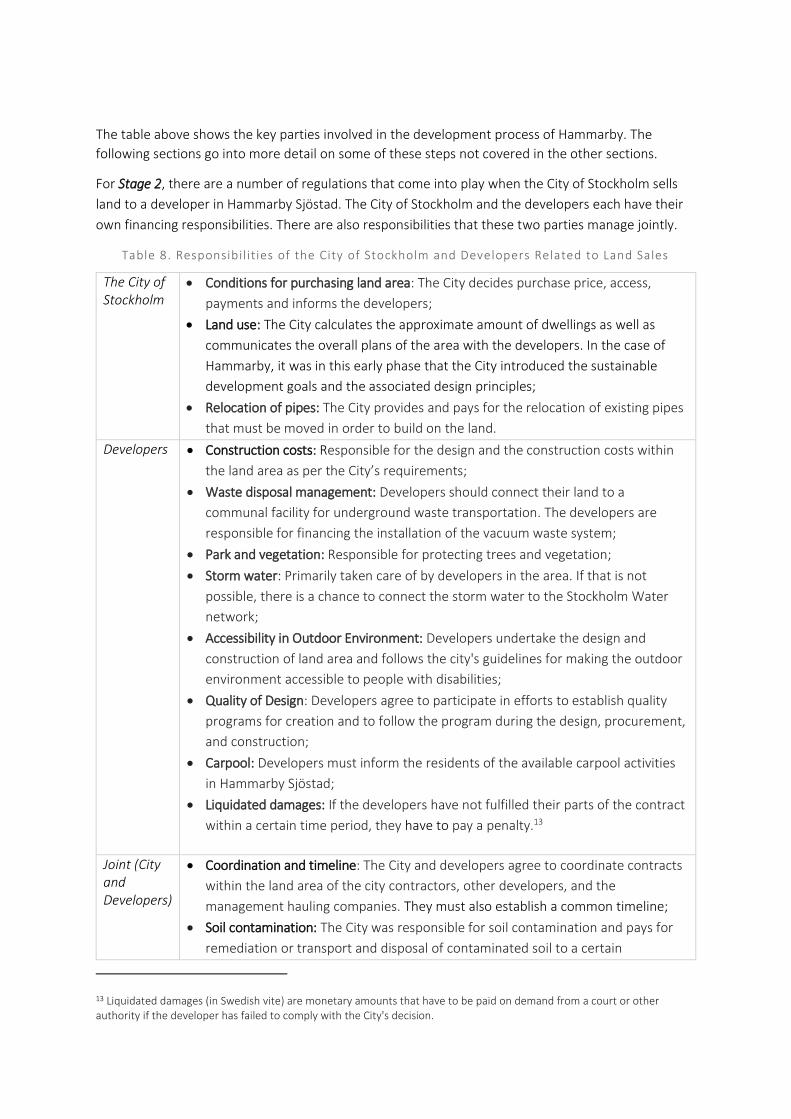
The table above shows the key parties involved in the development process of Hammarby. The
following sections go into more detail on some of these steps not covered in the other sections.
For Stage 2, there are a number of regulations that come into play when the City of Stockholm sells
land to a developer in Hammarby Sjöstad. The City of Stockholm and the developers each have their
own financing responsibilities. There are also responsibilities that these two parties manage jointly.
Table 8. Responsibil ities of the City of Stockholm and Developers Related to Land Sales
The City of Stockholm
Conditions for purchasing land area: The City decides purchase price, access,
payments and informs the developers;
Land use: The City calculates the approximate amount of dwellings as well as
communicates the overall plans of the area with the developers. In the case of
Hammarby, it was in this early phase that the City introduced the sustainable
development goals and the associated design principles;
Relocation of pipes: The City provides and pays for the relocation of existing pipes
that must be moved in order to build on the land.
Developers Construction costs: Responsible for the design and the construction costs within
the land area as per the City’s requirements;
Waste disposal management: Developers should connect their land to a
communal facility for underground waste transportation. The developers are
responsible for financing the installation of the vacuum waste system;
Park and vegetation: Responsible for protecting trees and vegetation;
Storm water: Primarily taken care of by developers in the area. If that is not
possible, there is a chance to connect the storm water to the Stockholm Water
network;
Accessibility in Outdoor Environment: Developers undertake the design and
construction of land area and follows the city's guidelines for making the outdoor
environment accessible to people with disabilities;
Quality of Design: Developers agree to participate in efforts to establish quality
programs for creation and to follow the program during the design, procurement,
and construction;
Carpool: Developers must inform the residents of the available carpool activities
in Hammarby Sjöstad;
Liquidated damages: If the developers have not fulfilled their parts of the contract
within a certain time period, they have to pay a penalty.13
Joint (City and Developers)
Coordination and timeline: The City and developers agree to coordinate contracts
within the land area of the city contractors, other developers, and the
management hauling companies. They must also establish a common timeline;
Soil contamination: The City was responsible for soil contamination and pays for
remediation or transport and disposal of contaminated soil to a certain
13 Liquidated damages (in Swedish vite) are monetary amounts that have to be paid on demand from a court or other authority if the developer has failed to comply with the City's decision.
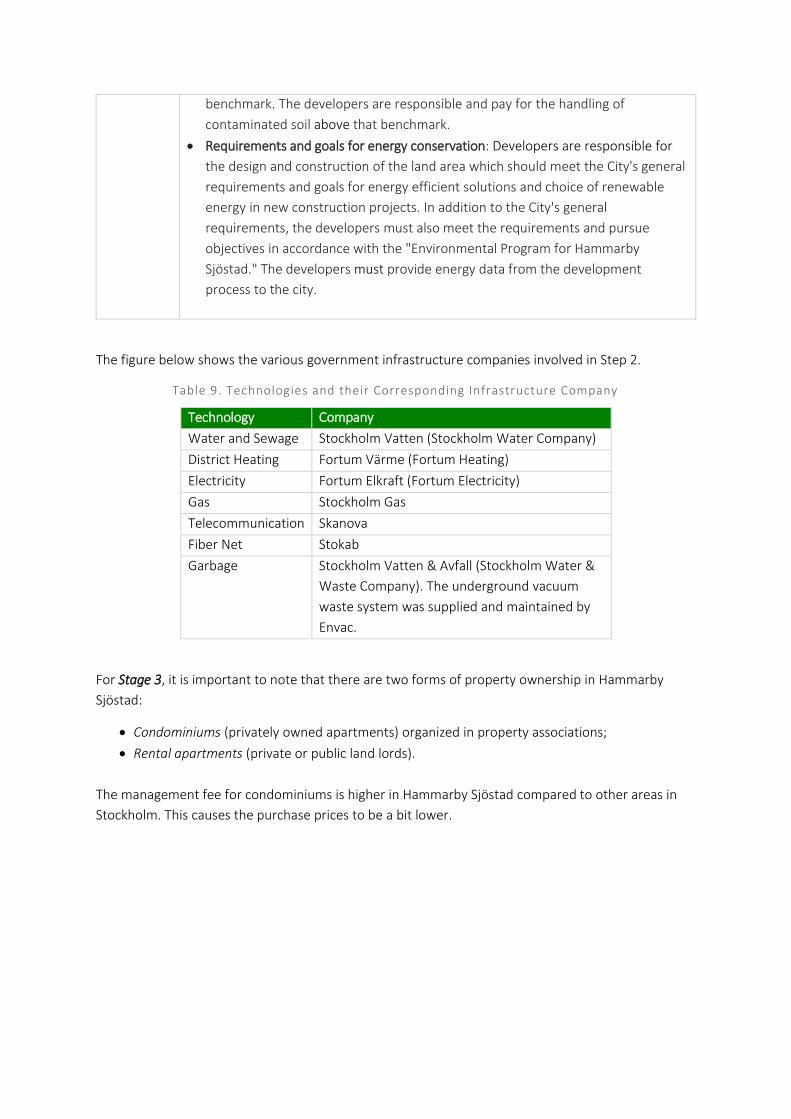
benchmark. The developers are responsible and pay for the handling of
contaminated soil above that benchmark.
Requirements and goals for energy conservation: Developers are responsible for
the design and construction of the land area which should meet the City's general
requirements and goals for energy efficient solutions and choice of renewable
energy in new construction projects. In addition to the City's general
requirements, the developers must also meet the requirements and pursue
objectives in accordance with the "Environmental Program for Hammarby
Sjöstad." The developers must provide energy data from the development
process to the city.
The figure below shows the various government infrastructure companies involved in Step 2.
Table 9. Technologies and their Corresponding Infrastructure Company
Technology Company
Water and Sewage Stockholm Vatten (Stockholm Water Company)
District Heating Fortum Värme (Fortum Heating)
Electricity Fortum Elkraft (Fortum Electricity)
Gas Stockholm Gas
Telecommunication Skanova
Fiber Net Stokab
Garbage Stockholm Vatten & Avfall (Stockholm Water &
Waste Company). The underground vacuum
waste system was supplied and maintained by
Envac.
For Stage 3, it is important to note that there are two forms of property ownership in Hammarby
Sjöstad:
Condominiums (privately owned apartments) organized in property associations;
Rental apartments (private or public land lords).
The management fee for condominiums is higher in Hammarby Sjöstad compared to other areas in
Stockholm. This causes the purchase prices to be a bit lower.
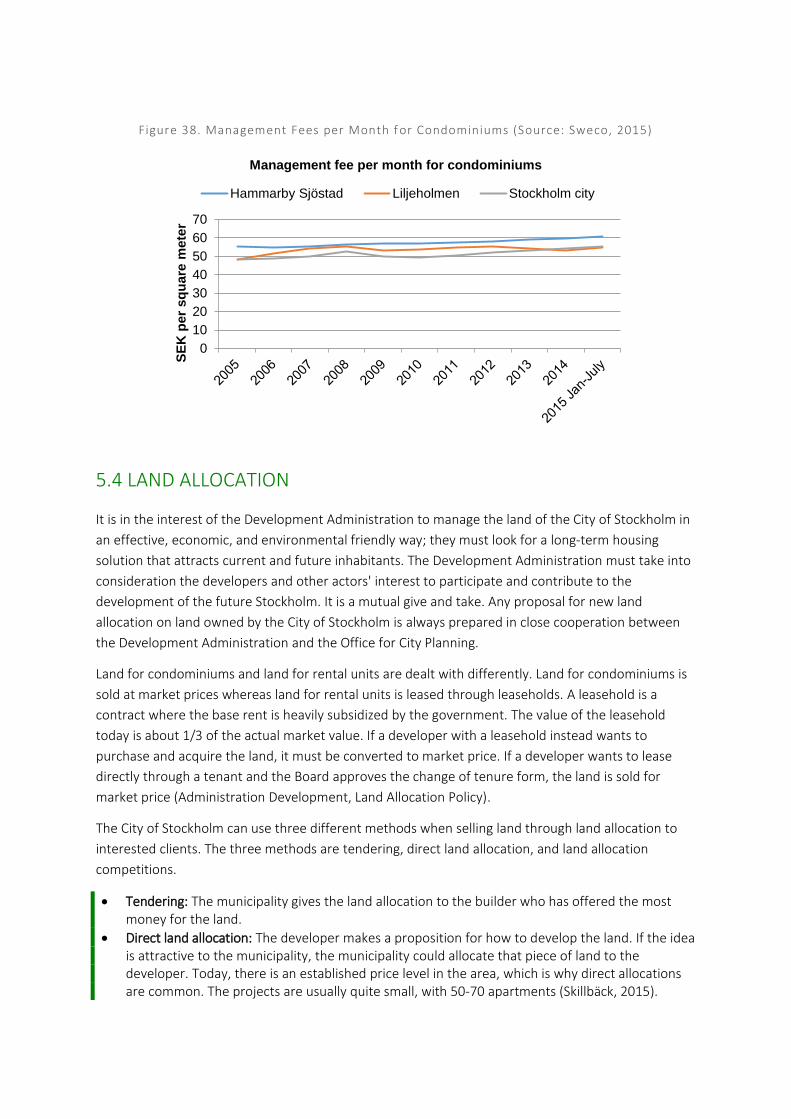
Figure 38. Management Fees per Month f or Condominiums (Source: Sweco, 2015)
5.4 LAND ALLOCATION
It is in the interest of the Development Administration to manage the land of the City of Stockholm in
an effective, economic, and environmental friendly way; they must look for a long-term housing
solution that attracts current and future inhabitants. The Development Administration must take into
consideration the developers and other actors' interest to participate and contribute to the
development of the future Stockholm. It is a mutual give and take. Any proposal for new land
allocation on land owned by the City of Stockholm is always prepared in close cooperation between
the Development Administration and the Office for City Planning.
Land for condominiums and land for rental units are dealt with differently. Land for condominiums is
sold at market prices whereas land for rental units is leased through leaseholds. A leasehold is a
contract where the base rent is heavily subsidized by the government. The value of the leasehold
today is about 1/3 of the actual market value. If a developer with a leasehold instead wants to
purchase and acquire the land, it must be converted to market price. If a developer wants to lease
directly through a tenant and the Board approves the change of tenure form, the land is sold for
market price (Administration Development, Land Allocation Policy).
The City of Stockholm can use three different methods when selling land through land allocation to
interested clients. The three methods are tendering, direct land allocation, and land allocation
competitions.
Tendering: The municipality gives the land allocation to the builder who has offered the most money for the land.
Direct land allocation: The developer makes a proposition for how to develop the land. If the idea is attractive to the municipality, the municipality could allocate that piece of land to the developer. Today, there is an established price level in the area, which is why direct allocations are common. The projects are usually quite small, with 50-70 apartments (Skillbäck, 2015).
0
10
20
30
40
50
60
70
SE
K p
er
sq
uare
mete
rManagement fee per month for condominiums
Hammarby Sjöstad Liljeholmen Stockholm city

Land allocation competition: The municipality announces a competition. The developers make propositions and the municipality awards the land allocation to the builder that has the best idea. In Hammarby Sjöstad, there have been a few land allocation competitions. The ones that have been conducted have in the end been selected based on price. The developer that offers the most money for the land will receive it. This additional funding was also important so that the City could reward public housing companies as well as smaller tenancy builders in order to get mixed income housing (Skillbäck, 2015).
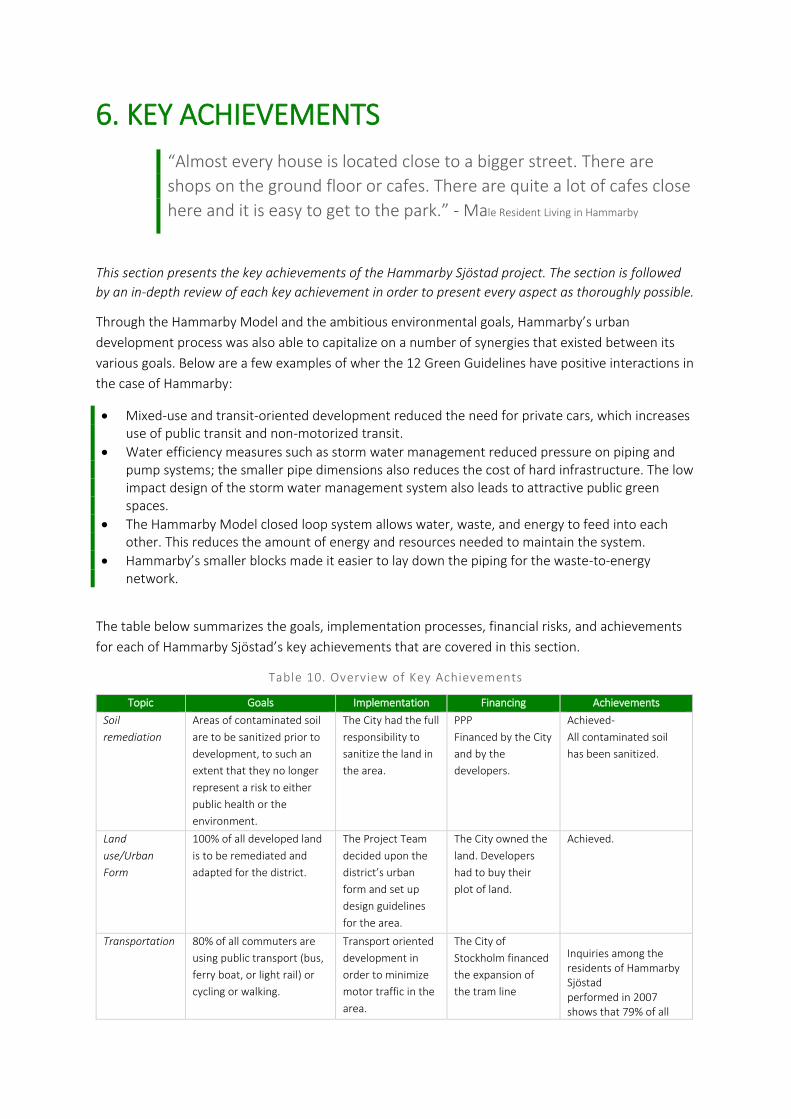
6. KEY ACHIEVEMENTS
“Almost every house is located close to a bigger street. There are
shops on the ground floor or cafes. There are quite a lot of cafes close
here and it is easy to get to the park.” - Male Resident Living in Hammarby
This section presents the key achievements of the Hammarby Sjöstad project. The section is followed
by an in-depth review of each key achievement in order to present every aspect as thoroughly possible.
Through the Hammarby Model and the ambitious environmental goals, Hammarby’s urban
development process was also able to capitalize on a number of synergies that existed between its
various goals. Below are a few examples of wher the 12 Green Guidelines have positive interactions in
the case of Hammarby:
Mixed-use and transit-oriented development reduced the need for private cars, which increases use of public transit and non-motorized transit.
Water efficiency measures such as storm water management reduced pressure on piping and pump systems; the smaller pipe dimensions also reduces the cost of hard infrastructure. The low impact design of the storm water management system also leads to attractive public green spaces.
The Hammarby Model closed loop system allows water, waste, and energy to feed into each other. This reduces the amount of energy and resources needed to maintain the system.
Hammarby’s smaller blocks made it easier to lay down the piping for the waste-to-energy network.
The table below summarizes the goals, implementation processes, financial risks, and achievements
for each of Hammarby Sjöstad’s key achievements that are covered in this section.
Table 10. Overview of Key Achievements
Topic Goals Implementation Financing Achievements
Soil
remediation
Areas of contaminated soil
are to be sanitized prior to
development, to such an
extent that they no longer
represent a risk to either
public health or the
environment.
The City had the full
responsibility to
sanitize the land in
the area.
PPP
Financed by the City
and by the
developers.
Achieved-
All contaminated soil
has been sanitized.
Land
use/Urban
Form
100% of all developed land
is to be remediated and
adapted for the district.
The Project Team
decided upon the
district’s urban
form and set up
design guidelines
for the area.
The City owned the
land. Developers
had to buy their
plot of land.
Achieved.
Transportation 80% of all commuters are
using public transport (bus,
ferry boat, or light rail) or
cycling or walking.
Transport oriented
development in
order to minimize
motor traffic in the
area.
The City of
Stockholm financed
the expansion of
the tram line
Inquiries among the residents of Hammarby Sjöstad performed in 2007 shows that 79% of all
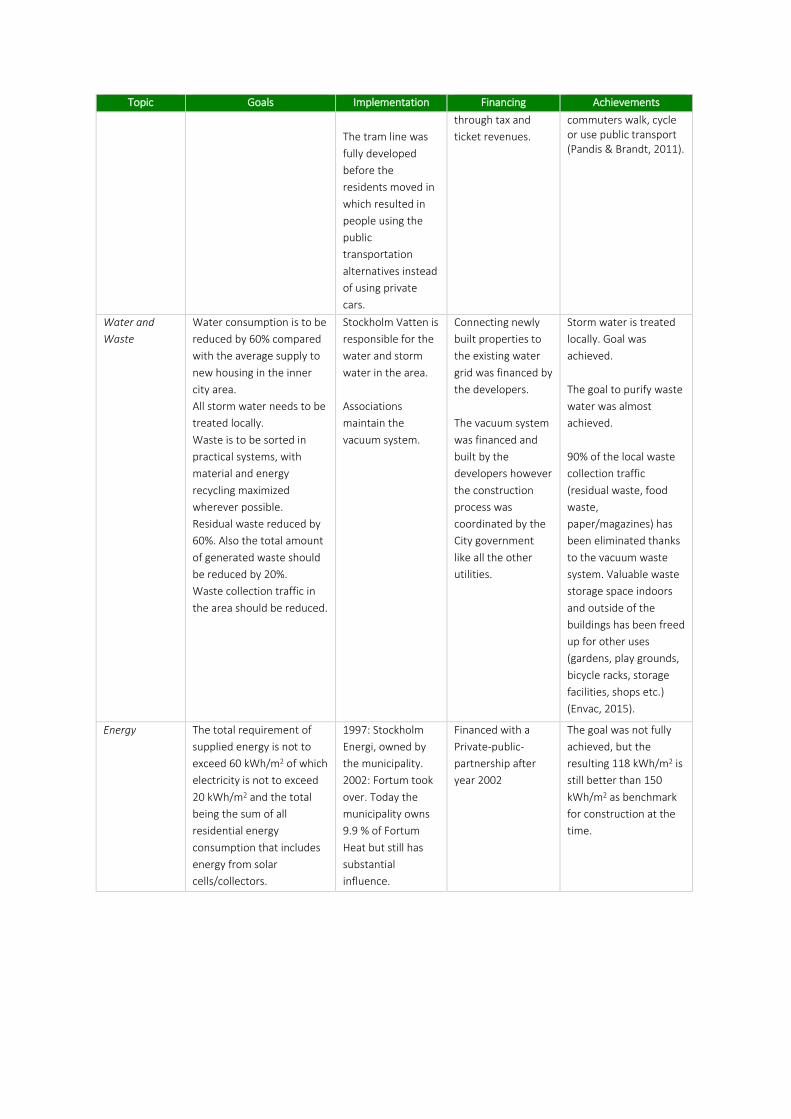
Topic Goals Implementation Financing Achievements
The tram line was
fully developed
before the
residents moved in
which resulted in
people using the
public
transportation
alternatives instead
of using private
cars.
through tax and
ticket revenues.
commuters walk, cycle or use public transport (Pandis & Brandt, 2011).
Water and
Waste
Water consumption is to be
reduced by 60% compared
with the average supply to
new housing in the inner
city area.
All storm water needs to be
treated locally.
Waste is to be sorted in
practical systems, with
material and energy
recycling maximized
wherever possible.
Residual waste reduced by
60%. Also the total amount
of generated waste should
be reduced by 20%.
Waste collection traffic in
the area should be reduced.
Stockholm Vatten is
responsible for the
water and storm
water in the area.
Associations
maintain the
vacuum system.
Connecting newly
built properties to
the existing water
grid was financed by
the developers.
The vacuum system
was financed and
built by the
developers however
the construction
process was
coordinated by the
City government
like all the other
utilities.
Storm water is treated
locally. Goal was
achieved.
The goal to purify waste
water was almost
achieved.
90% of the local waste
collection traffic
(residual waste, food
waste,
paper/magazines) has
been eliminated thanks
to the vacuum waste
system. Valuable waste
storage space indoors
and outside of the
buildings has been freed
up for other uses
(gardens, play grounds,
bicycle racks, storage
facilities, shops etc.)
(Envac, 2015).
Energy The total requirement of
supplied energy is not to
exceed 60 kWh/m2 of which
electricity is not to exceed
20 kWh/m2 and the total
being the sum of all
residential energy
consumption that includes
energy from solar
cells/collectors.
1997: Stockholm
Energi, owned by
the municipality.
2002: Fortum took
over. Today the
municipality owns
9.9 % of Fortum
Heat but still has
substantial
influence.
Financed with a
Private-public-
partnership after
year 2002
The goal was not fully
achieved, but the
resulting 118 kWh/m2 is
still better than 150
kWh/m2 as benchmark
for construction at the
time.
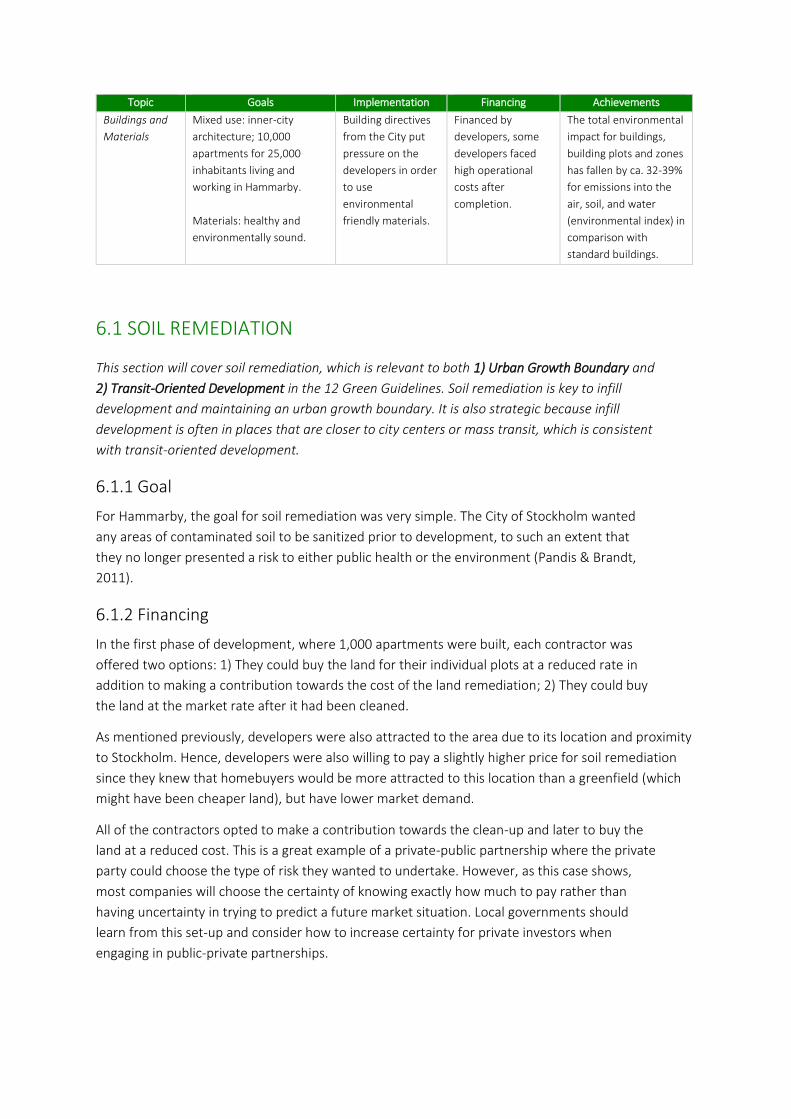
Topic Goals Implementation Financing Achievements
Buildings and
Materials
Mixed use: inner-city
architecture; 10,000
apartments for 25,000
inhabitants living and
working in Hammarby.
Materials: healthy and
environmentally sound.
Building directives
from the City put
pressure on the
developers in order
to use
environmental
friendly materials.
Financed by
developers, some
developers faced
high operational
costs after
completion.
The total environmental
impact for buildings,
building plots and zones
has fallen by ca. 32-39%
for emissions into the
air, soil, and water
(environmental index) in
comparison with
standard buildings.
6.1 SOIL REMEDIATION
This section will cover soil remediation, which is relevant to both 1) Urban Growth Boundary and
2) Transit-Oriented Development in the 12 Green Guidelines. Soil remediation is key to infill
development and maintaining an urban growth boundary. It is also strategic because infill
development is often in places that are closer to city centers or mass transit, which is consistent
with transit-oriented development.
6.1.1 Goal
For Hammarby, the goal for soil remediation was very simple. The City of Stockholm wanted
any areas of contaminated soil to be sanitized prior to development, to such an extent that
they no longer presented a risk to either public health or the environment (Pandis & Brandt,
2011).
6.1.2 Financing
In the first phase of development, where 1,000 apartments were built, each contractor was
offered two options: 1) They could buy the land for their individual plots at a reduced rate in
addition to making a contribution towards the cost of the land remediation; 2) They could buy
the land at the market rate after it had been cleaned.
As mentioned previously, developers were also attracted to the area due to its location and proximity
to Stockholm. Hence, developers were also willing to pay a slightly higher price for soil remediation
since they knew that homebuyers would be more attracted to this location than a greenfield (which
might have been cheaper land), but have lower market demand.
All of the contractors opted to make a contribution towards the clean-up and later to buy the
land at a reduced cost. This is a great example of a private-public partnership where the private
party could choose the type of risk they wanted to undertake. However, as this case shows,
most companies will choose the certainty of knowing exactly how much to pay rather than
having uncertainty in trying to predict a future market situation. Local governments should
learn from this set-up and consider how to increase certainty for private investors when
engaging in public-private partnerships.
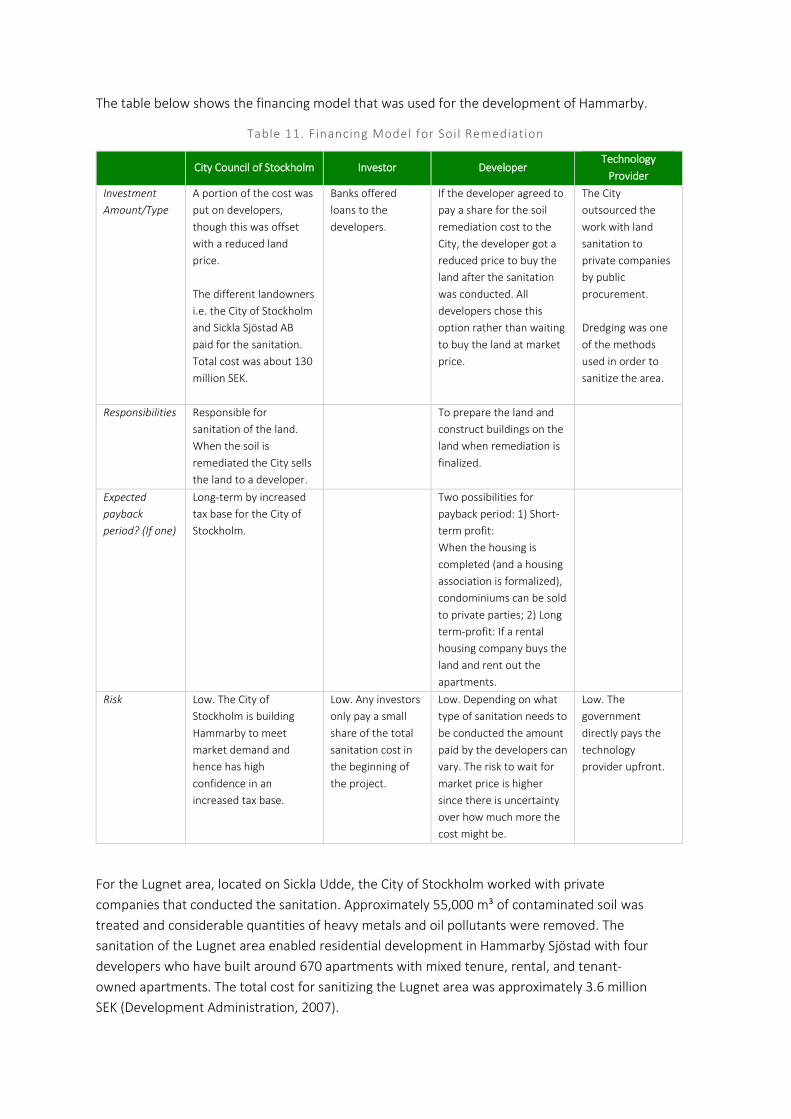
The table below shows the financing model that was used for the development of Hammarby.
Table 11. Financing Model for Soil Remediation
City Council of Stockholm Investor Developer Technology
Provider
Investment
Amount/Type
A portion of the cost was
put on developers,
though this was offset
with a reduced land
price.
The different landowners
i.e. the City of Stockholm
and Sickla Sjöstad AB
paid for the sanitation.
Total cost was about 130
million SEK.
Banks offered
loans to the
developers.
If the developer agreed to
pay a share for the soil
remediation cost to the
City, the developer got a
reduced price to buy the
land after the sanitation
was conducted. All
developers chose this
option rather than waiting
to buy the land at market
price.
The City
outsourced the
work with land
sanitation to
private companies
by public
procurement.
Dredging was one
of the methods
used in order to
sanitize the area.
Responsibilities Responsible for
sanitation of the land.
When the soil is
remediated the City sells
the land to a developer.
To prepare the land and
construct buildings on the
land when remediation is
finalized.
Expected
payback
period? (If one)
Long-term by increased
tax base for the City of
Stockholm.
Two possibilities for
payback period: 1) Short-
term profit:
When the housing is
completed (and a housing
association is formalized),
condominiums can be sold
to private parties; 2) Long
term-profit: If a rental
housing company buys the
land and rent out the
apartments.
Risk Low. The City of
Stockholm is building
Hammarby to meet
market demand and
hence has high
confidence in an
increased tax base.
Low. Any investors
only pay a small
share of the total
sanitation cost in
the beginning of
the project.
Low. Depending on what
type of sanitation needs to
be conducted the amount
paid by the developers can
vary. The risk to wait for
market price is higher
since there is uncertainty
over how much more the
cost might be.
Low. The
government
directly pays the
technology
provider upfront.
For the Lugnet area, located on Sickla Udde, the City of Stockholm worked with private
companies that conducted the sanitation. Approximately 55,000 m³ of contaminated soil was
treated and considerable quantities of heavy metals and oil pollutants were removed. The
sanitation of the Lugnet area enabled residential development in Hammarby Sjöstad with four
developers who have built around 670 apartments with mixed tenure, rental, and tenant-
owned apartments. The total cost for sanitizing the Lugnet area was approximately 3.6 million
SEK (Development Administration, 2007).
6.1.2 Implementation
The City of Stockholm and the Environment & Health Administration completed the monitoring for
the soil remediation process in Hammarby Sjöstad, ensuring that the requisite standards were met to
avoid harming either the environment or people’s health. The contamination was substantial – for
example, in the sub-district of Sickla Udde alone, the earth excavated contained 130 tons of oils and
grease, and 180 tons of heavy metals (GlashusEtt, 2007).
6.1.4 Achievements
The goal of remediating the entire area was achieved. All areas of contaminated soil were
sanitized prior to development (Pandis & Brandt, 2007). This helped the City of Stockholm
achieve its goal of infill development, which was attractive to both residents and developers.
Developers are attracted to building in a location that has easy access to Stockholm.
While projects that involve soil remediation can be more costly upfront, they are also often in
areas that are strategically located closer to existing businesses or city centers. This can attract
developers and also ensure that the land sells much more quickly, which helps both the City
and developers pay lower interest on any loans they took out for the project.
6.2 URBAN FORM
This section covers Urban Form, which is relevant to most of the Urban Form guidelines in the 12
Green Guidelines, but specifically, 1) Urban growth boundary; 2) Transit-oriented Development; 3)
Mixed-use; 4) Small Blocks; and 5) Public Green Space.
Urban Form in terms of Green Guidelines:
Urban growth boundary: Stockholm City Planning Strategy is to re-use and transform old industrial and other brownfield sites into attractive mixed use areas with beautiful parks and green public spaces. Hammarby Sjöstad is an excellent example of an application of this strategy. Smart Growth Theory is applied to the project by focusing on concentrating urban growth in/nearby city centers by integrated planning and Transit Oriented Development (TOD) to avoid urban sprawl and increase the use of public transportation, bicycling and walking. Hammarby Sjöstad is part of an urban regional planning strategy to create a Polycentric Urban Structure as well as a City Planning Strategy to densify and build the city inwards.
Mixed-use: Hammarby will contain approximately 26,500 residents and 11,000 business places at completion. About 20,000 residents are living in the area today. In the area amenities include schools, post offices, banks, retails, clinics, activity centers, and restaurants, concentrated along the central boulevard with prioritized public transport, walking, and cycling. The residents can easily reach the services by foot or bike. Depending on where in Hammarby Sjöstad the residents live the proximity to services do vary. Grocery stores are for example spread out in the neighborhood in order to provide for different areas of Hammarby.
Small blocks: Small blocks less than 1 ha dominate. Typical block size 50 x 70 m, 70 x 100 m. Exceptions are industry and schools.
Public green space: 100% of the residents live within 500 m of public accessible space. The initial goal for the development was to provide 25 m2 of public green space per apartment unit, for a total of 300,000 m2 in the district. So far a total of 280,000 m2 has been completed. The development also has a goal to provide 15 m2 of private courtyard space per apartment unit.
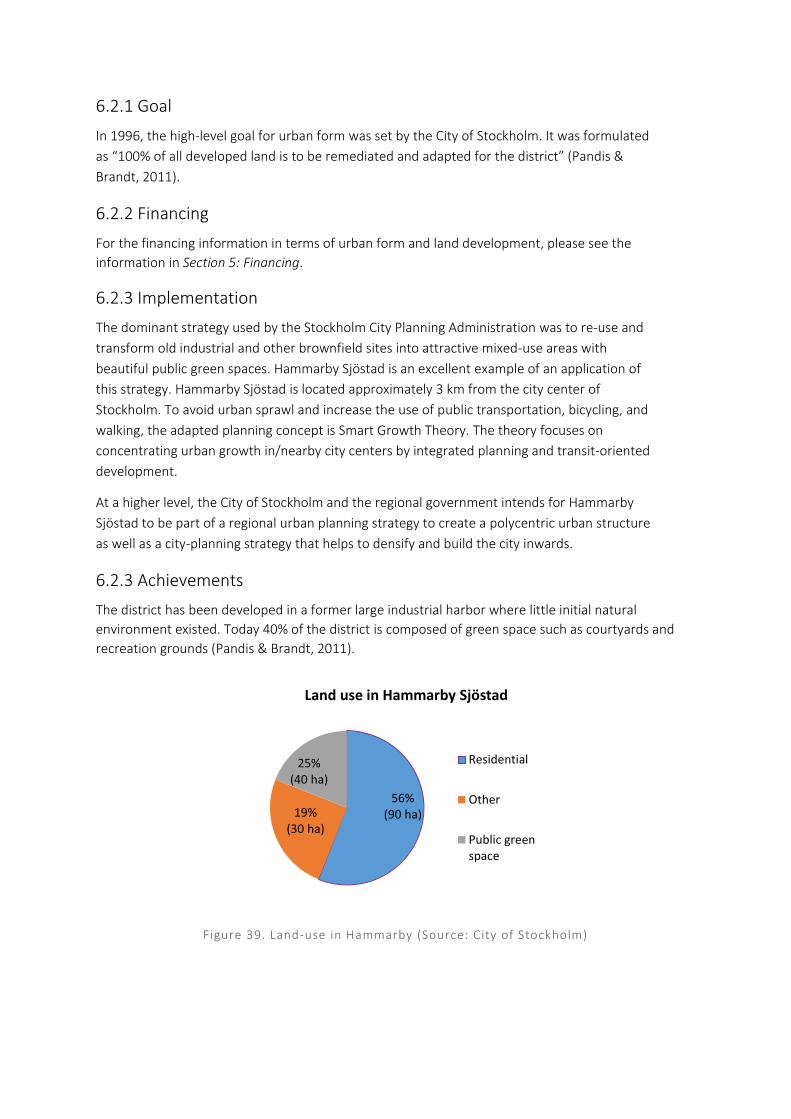
6.2.1 Goal
In 1996, the high-level goal for urban form was set by the City of Stockholm. It was formulated
as “100% of all developed land is to be remediated and adapted for the district” (Pandis &
Brandt, 2011).
6.2.2 Financing
For the financing information in terms of urban form and land development, please see the
information in Section 5: Financing.
6.2.3 Implementation
The dominant strategy used by the Stockholm City Planning Administration was to re-use and
transform old industrial and other brownfield sites into attractive mixed-use areas with
beautiful public green spaces. Hammarby Sjöstad is an excellent example of an application of
this strategy. Hammarby Sjöstad is located approximately 3 km from the city center of
Stockholm. To avoid urban sprawl and increase the use of public transportation, bicycling, and
walking, the adapted planning concept is Smart Growth Theory. The theory focuses on
concentrating urban growth in/nearby city centers by integrated planning and transit-oriented
development.
At a higher level, the City of Stockholm and the regional government intends for Hammarby
Sjöstad to be part of a regional urban planning strategy to create a polycentric urban structure
as well as a city-planning strategy that helps to densify and build the city inwards.
6.2.3 Achievements
The district has been developed in a former large industrial harbor where little initial natural
environment existed. Today 40% of the district is composed of green space such as courtyards and
recreation grounds (Pandis & Brandt, 2011).
Figure 39. Land-use in Hammarby (Source: City of Stockholm)
56%(90 ha)19%
(30 ha)
25%(40 ha)
Land use in Hammarby Sjöstad
Residential
Other
Public greenspace
6.3 TRANSPORTATION
This section covers transportation, which includes 6) Non-motorized transit; 7) Public transit; and 8)
Car Control from the Green Guidelines.
Transportation in Hammarby in terms of the Green Guidelines:
Non-motorized transit: More than 10 km in length per square kilometer of built up area of biking and walking paths. Bicycling and walking shall be prioritized in the development. Bicycling and walking paths of the area shall be integrated with the city wide network. All roads shall have sidewalks. Safe bicycle paths shall be prioritized and developed along all mayor routes. In Hammarby Sjöstad there are bicycle paths along the main transportation corridors as well as traffic separated bicycle paths along waterfronts and through majority residential areas. Bicycle and walking paths are also connected also with traffic separated bridges and to the citywide bicycle and walking network. The density of walking paths is 25.8 km/km² and the density of bicycle paths is 10.5 km/km².
Public transit: Distance to public transportation is a maximum of 250-300 m for residents, accessed by attractive walkways.
Car control: Initially the parking norm for the area was set to 0.7 cars per apartment unit, lower than normal parking norm in the city when planning commenced. Public transport, bicycling, and walking were prioritized ahead of private car use. Car pools were introduced. On ground public parking is regulated and limited to parking along streets. All other parking was built underground. The parking norm for the area today is 0.55.
6.3.1 Goal
In 2012 the City of Stockholm Traffic Administration published an Urban Mobility Strategy which took
capacity, accessibility, attractiveness, and sustainability into account in the Stockholm area. The
strategy describes how walking, cycling, and public transit are to be prioritized in Stockholm. This
publication is a key tool used to fulfill the goals emphasized in Vision 2030.14 According to the Traffic
Administration, “We need to promote the development of those means of transport that are most
efficient in terms of usage of space and transportation. Increased city density provides a varied urban
environment where several points can be reached on foot or by bicycle, as well as the basis for
frequent, high-capacity public transport in all of the city’s districts” (Traffic Administration, 2015).
In 1996, the goal for transportation in Hammarby was set by the City of Stockholm. The goal
was that 80% of all commuting should be by public transit, cycling, or walking. Also, the City
wanted 15% of all vehicle motor transportation to be powered by renewable energy (bio-based
or electrical (Pandis & Brandt, 2011).
6.3.2 Financing
Financing for the light rail in Hammarby was done through the Stockholm County Council and the City
of Stockholm Transport Administration. This model is similar to a build and operate model where the
relevant government administrations uses public procurement to have a technology provider build
the projects and also operate them.
14 Vision 2030 is a strategic document showing the general description of Stockholm’s development towards year 2030. (City of Stockholm, 2014)
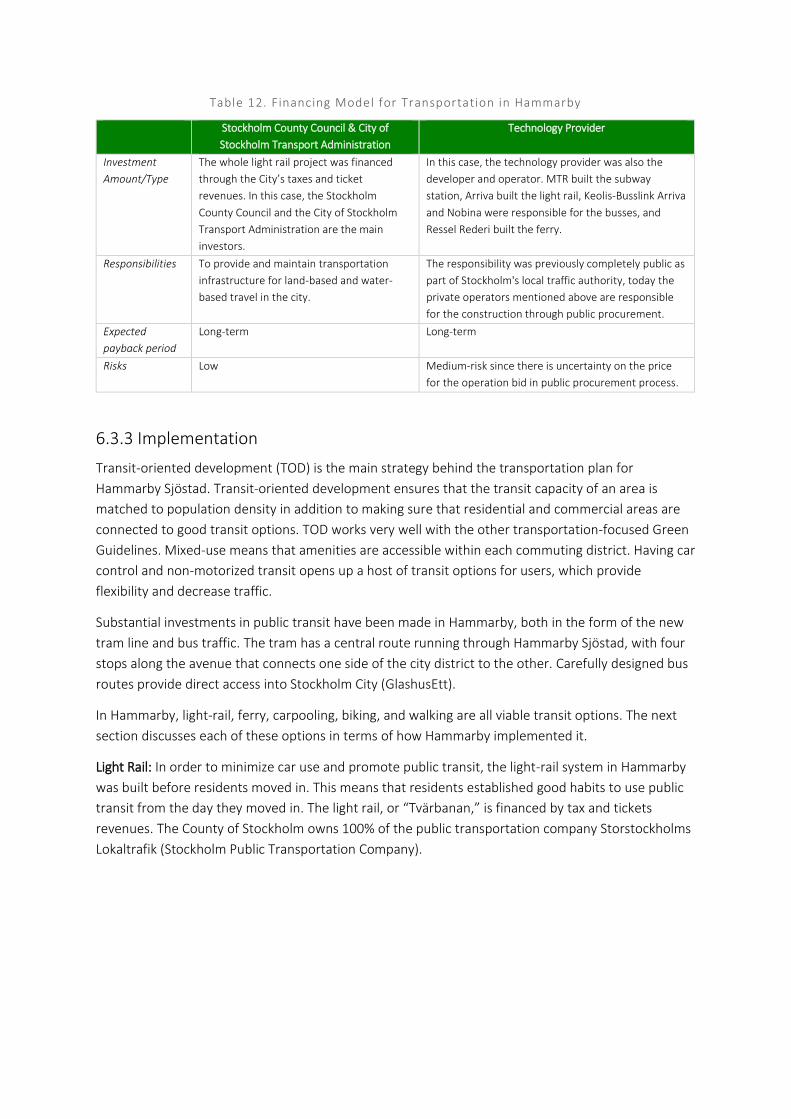
Table 12. Financing Model for Transportation in Hammarby
Stockholm County Council & City of
Stockholm Transport Administration
Technology Provider
Investment
Amount/Type
The whole light rail project was financed
through the City’s taxes and ticket
revenues. In this case, the Stockholm
County Council and the City of Stockholm
Transport Administration are the main
investors.
In this case, the technology provider was also the
developer and operator. MTR built the subway
station, Arriva built the light rail, Keolis-Busslink Arriva
and Nobina were responsible for the busses, and
Ressel Rederi built the ferry.
Responsibilities To provide and maintain transportation
infrastructure for land-based and water-
based travel in the city.
The responsibility was previously completely public as
part of Stockholm's local traffic authority, today the
private operators mentioned above are responsible
for the construction through public procurement.
Expected
payback period
Long-term Long-term
Risks Low Medium-risk since there is uncertainty on the price
for the operation bid in public procurement process.
6.3.3 Implementation
Transit-oriented development (TOD) is the main strategy behind the transportation plan for
Hammarby Sjöstad. Transit-oriented development ensures that the transit capacity of an area is
matched to population density in addition to making sure that residential and commercial areas are
connected to good transit options. TOD works very well with the other transportation-focused Green
Guidelines. Mixed-use means that amenities are accessible within each commuting district. Having car
control and non-motorized transit opens up a host of transit options for users, which provide
flexibility and decrease traffic.
Substantial investments in public transit have been made in Hammarby, both in the form of the new
tram line and bus traffic. The tram has a central route running through Hammarby Sjöstad, with four
stops along the avenue that connects one side of the city district to the other. Carefully designed bus
routes provide direct access into Stockholm City (GlashusEtt).
In Hammarby, light-rail, ferry, carpooling, biking, and walking are all viable transit options. The next
section discusses each of these options in terms of how Hammarby implemented it.
Light Rail: In order to minimize car use and promote public transit, the light-rail system in Hammarby
was built before residents moved in. This means that residents established good habits to use public
transit from the day they moved in. The light rail, or “Tvärbanan,” is financed by tax and tickets
revenues. The County of Stockholm owns 100% of the public transportation company Storstockholms
Lokaltrafik (Stockholm Public Transportation Company).
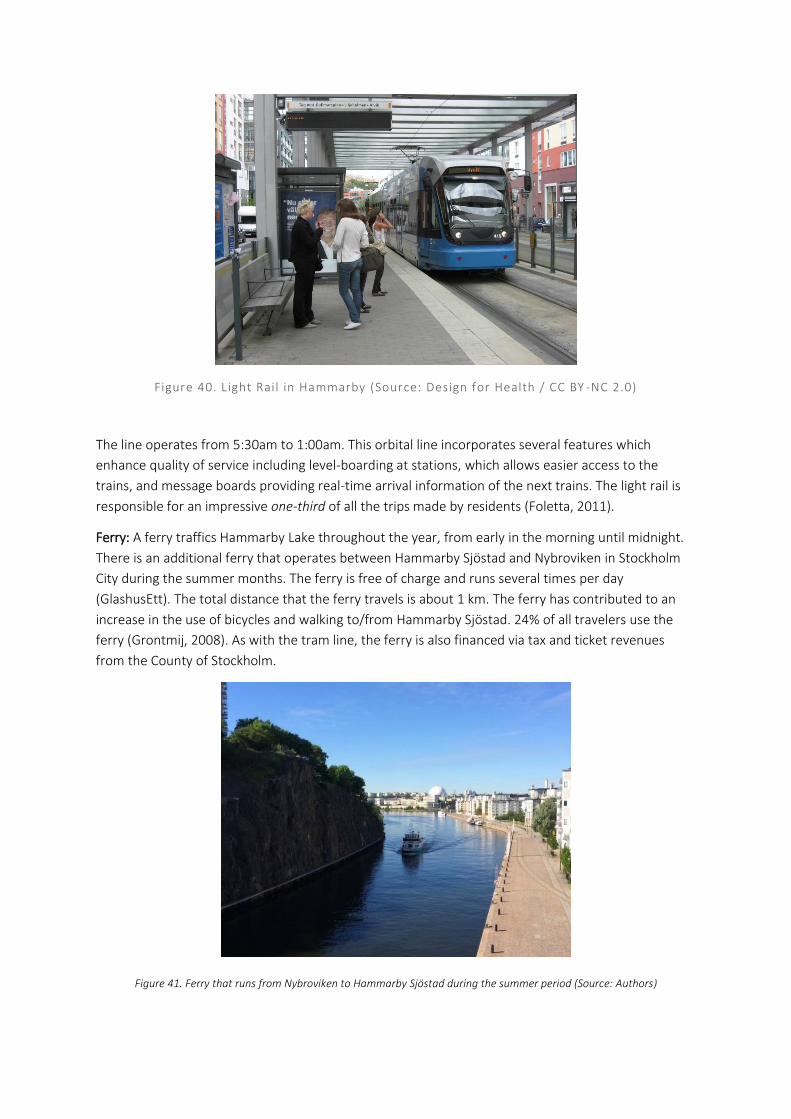
Figure 40. Light Rail in Hammarby (Source: Design for Health / CC BY -NC 2.0)
The line operates from 5:30am to 1:00am. This orbital line incorporates several features which
enhance quality of service including level-boarding at stations, which allows easier access to the
trains, and message boards providing real-time arrival information of the next trains. The light rail is
responsible for an impressive one-third of all the trips made by residents (Foletta, 2011).
Ferry: A ferry traffics Hammarby Lake throughout the year, from early in the morning until midnight.
There is an additional ferry that operates between Hammarby Sjöstad and Nybroviken in Stockholm
City during the summer months. The ferry is free of charge and runs several times per day
(GlashusEtt). The total distance that the ferry travels is about 1 km. The ferry has contributed to an
increase in the use of bicycles and walking to/from Hammarby Sjöstad. 24% of all travelers use the
ferry (Grontmij, 2008). As with the tram line, the ferry is also financed via tax and ticket revenues
from the County of Stockholm.
Figure 41. Ferry that runs from Nybroviken to Hammarby Sjöstad during the summer period (Source: Authors)
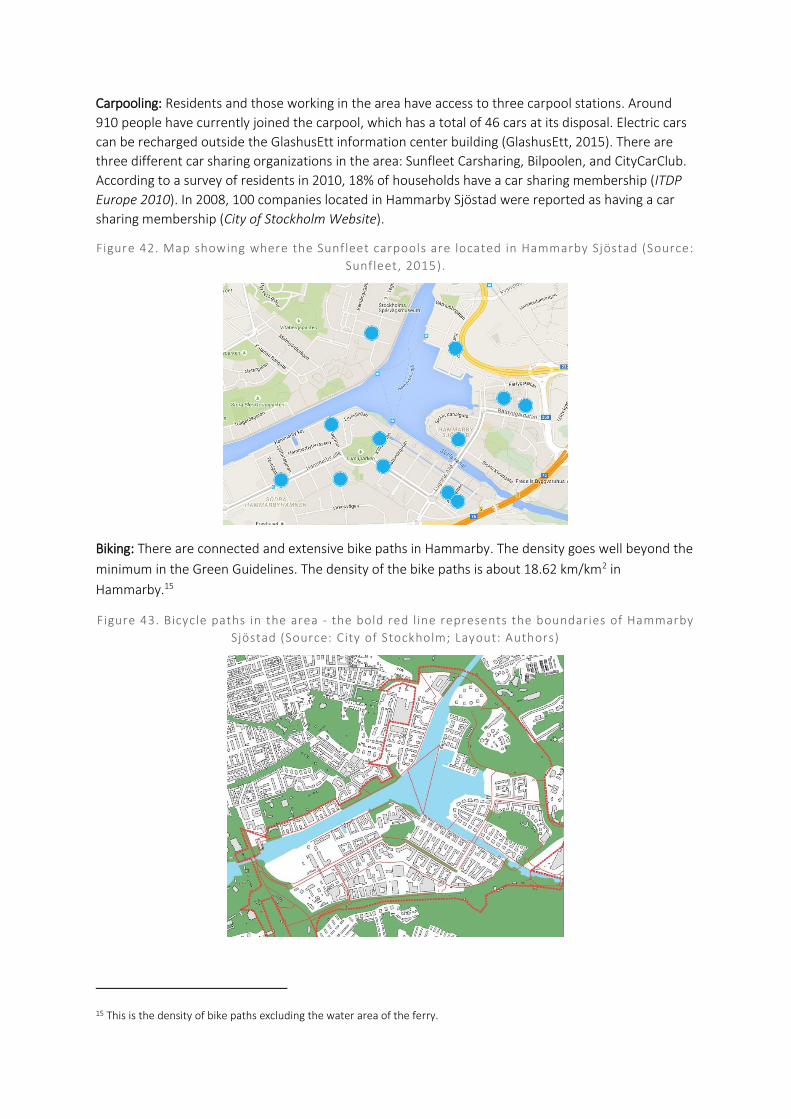
Carpooling: Residents and those working in the area have access to three carpool stations. Around
910 people have currently joined the carpool, which has a total of 46 cars at its disposal. Electric cars
can be recharged outside the GlashusEtt information center building (GlashusEtt, 2015). There are
three different car sharing organizations in the area: Sunfleet Carsharing, Bilpoolen, and CityCarClub.
According to a survey of residents in 2010, 18% of households have a car sharing membership (ITDP
Europe 2010). In 2008, 100 companies located in Hammarby Sjöstad were reported as having a car
sharing membership (City of Stockholm Website).
Figure 42. Map showing where the Sunfleet carpools are located in Hammarby Sjöstad (Source:
Sunfleet, 2015).
Biking: There are connected and extensive bike paths in Hammarby. The density goes well beyond the
minimum in the Green Guidelines. The density of the bike paths is about 18.62 km/km2 in
Hammarby.15
Figure 43. Bicycle paths in the area - the bold red l ine represents the boundaries of Hammarby
Sjöstad (Source: City of Stockholm; Layout: Authors)
15 This is the density of bike paths excluding the water area of the ferry.
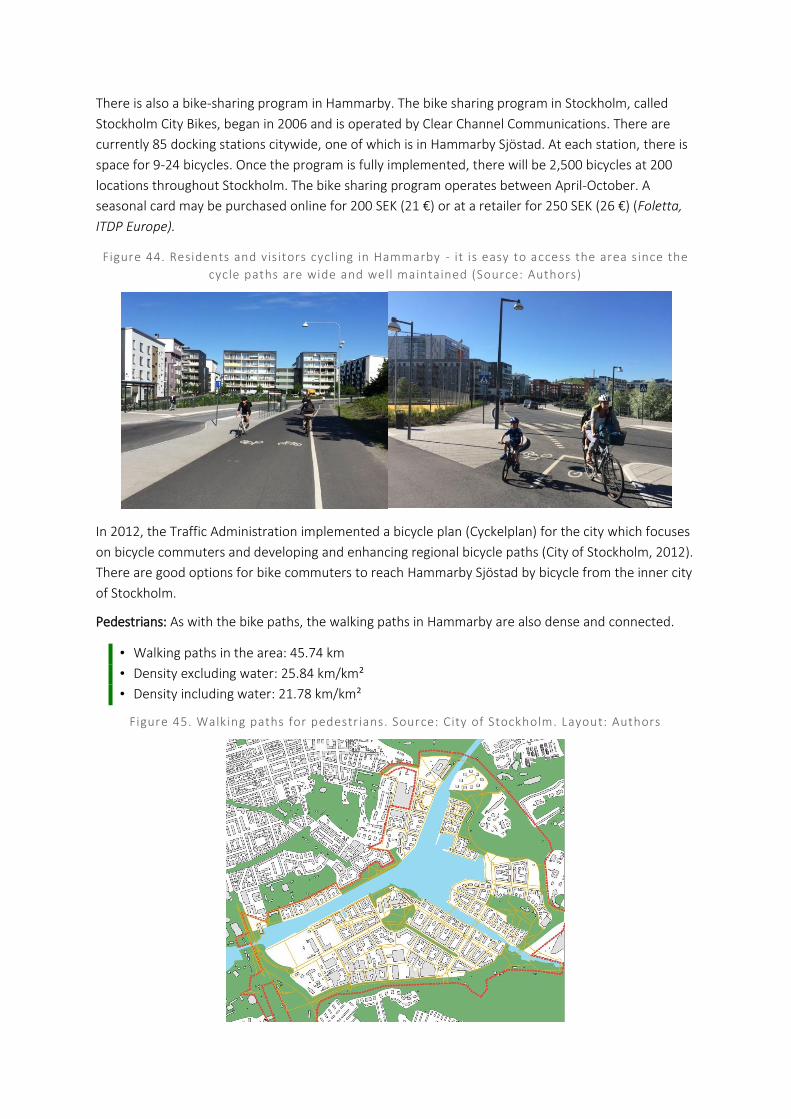
There is also a bike-sharing program in Hammarby. The bike sharing program in Stockholm, called
Stockholm City Bikes, began in 2006 and is operated by Clear Channel Communications. There are
currently 85 docking stations citywide, one of which is in Hammarby Sjöstad. At each station, there is
space for 9-24 bicycles. Once the program is fully implemented, there will be 2,500 bicycles at 200
locations throughout Stockholm. The bike sharing program operates between April-October. A
seasonal card may be purchased online for 200 SEK (21 €) or at a retailer for 250 SEK (26 €) (Foletta,
ITDP Europe).
Figure 44. Residents and visitors cycling in Hammarby - it is easy to access the area since the
cycle paths are wide and well maintained (Source: Authors)
In 2012, the Traffic Administration implemented a bicycle plan (Cyckelplan) for the city which focuses
on bicycle commuters and developing and enhancing regional bicycle paths (City of Stockholm, 2012).
There are good options for bike commuters to reach Hammarby Sjöstad by bicycle from the inner city
of Stockholm.
Pedestrians: As with the bike paths, the walking paths in Hammarby are also dense and connected.
• Walking paths in the area: 45.74 km
• Density excluding water: 25.84 km/km²
• Density including water: 21.78 km/km²
Figure 45. Walking paths for pedestr ians. Source: City of Stockholm. Layout: Authors
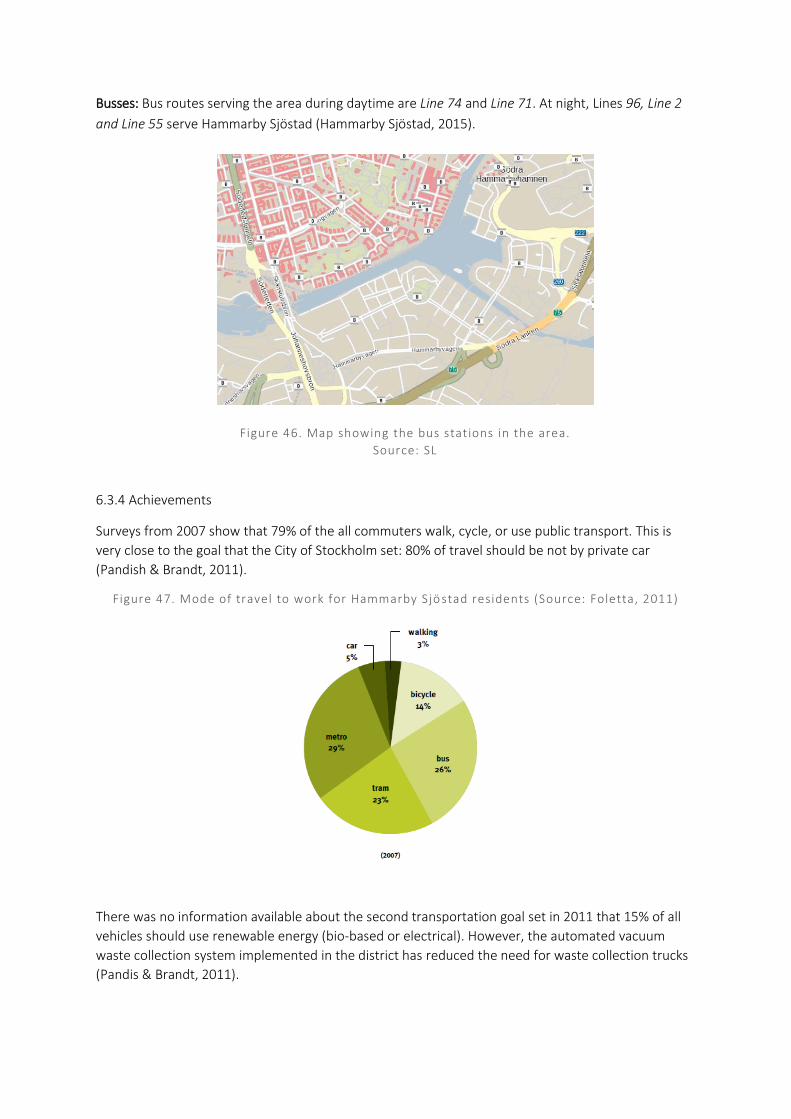
Busses: Bus routes serving the area during daytime are Line 74 and Line 71. At night, Lines 96, Line 2
and Line 55 serve Hammarby Sjöstad (Hammarby Sjöstad, 2015).
6.3.4 Achievements
Surveys from 2007 show that 79% of the all commuters walk, cycle, or use public transport. This is
very close to the goal that the City of Stockholm set: 80% of travel should be not by private car
(Pandish & Brandt, 2011).
Figure 47. Mode of travel to work for Hammarby Sjö stad residents (Source: Foletta, 2011)
There was no information available about the second transportation goal set in 2011 that 15% of all
vehicles should use renewable energy (bio-based or electrical). However, the automated vacuum
waste collection system implemented in the district has reduced the need for waste collection trucks
(Pandis & Brandt, 2011).
Bus stations in Hammarby Sjöstad.
Source: Reseplanerare (2015)
Figure 46. Map showing the bus stations in the area.
Source: SL
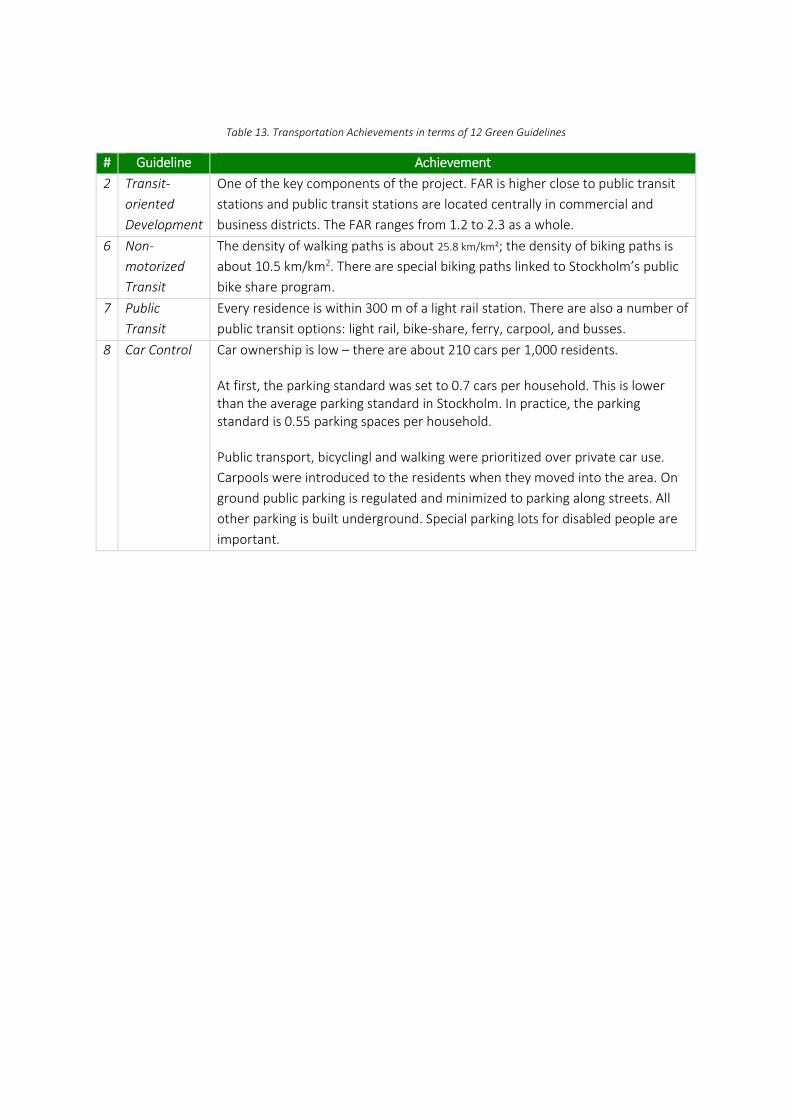
Table 13. Transportation Achievements in terms of 12 Green Guidelines
# Guideline Achievement
2 Transit-
oriented
Development
One of the key components of the project. FAR is higher close to public transit
stations and public transit stations are located centrally in commercial and
business districts. The FAR ranges from 1.2 to 2.3 as a whole.
6 Non-
motorized
Transit
The density of walking paths is about 25.8 km/km²; the density of biking paths is
about 10.5 km/km2. There are special biking paths linked to Stockholm’s public
bike share program.
7 Public
Transit
Every residence is within 300 m of a light rail station. There are also a number of
public transit options: light rail, bike-share, ferry, carpool, and busses.
8 Car Control Car ownership is low – there are about 210 cars per 1,000 residents. At first, the parking standard was set to 0.7 cars per household. This is lower than the average parking standard in Stockholm. In practice, the parking standard is 0.55 parking spaces per household. Public transport, bicyclingl and walking were prioritized over private car use.
Carpools were introduced to the residents when they moved into the area. On
ground public parking is regulated and minimized to parking along streets. All
other parking is built underground. Special parking lots for disabled people are
important.
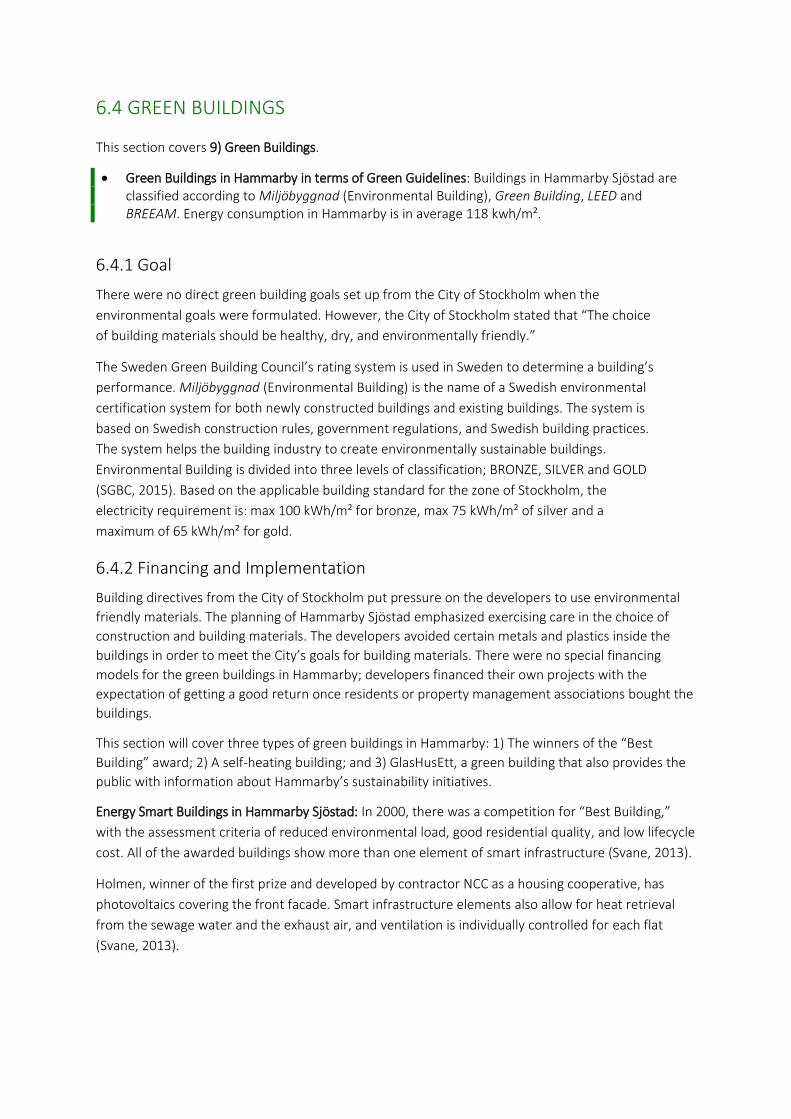
6.4 GREEN BUILDINGS
This section covers 9) Green Buildings.
Green Buildings in Hammarby in terms of Green Guidelines: Buildings in Hammarby Sjöstad are classified according to Miljöbyggnad (Environmental Building), Green Building, LEED and BREEAM. Energy consumption in Hammarby is in average 118 kwh/m².
6.4.1 Goal
There were no direct green building goals set up from the City of Stockholm when the
environmental goals were formulated. However, the City of Stockholm stated that “The choice
of building materials should be healthy, dry, and environmentally friendly.”
The Sweden Green Building Council’s rating system is used in Sweden to determine a building’s
performance. Miljöbyggnad (Environmental Building) is the name of a Swedish environmental
certification system for both newly constructed buildings and existing buildings. The system is
based on Swedish construction rules, government regulations, and Swedish building practices.
The system helps the building industry to create environmentally sustainable buildings.
Environmental Building is divided into three levels of classification; BRONZE, SILVER and GOLD
(SGBC, 2015). Based on the applicable building standard for the zone of Stockholm, the
electricity requirement is: max 100 kWh/m² for bronze, max 75 kWh/m² of silver and a
maximum of 65 kWh/m² for gold.
6.4.2 Financing and Implementation
Building directives from the City of Stockholm put pressure on the developers to use environmental
friendly materials. The planning of Hammarby Sjöstad emphasized exercising care in the choice of
construction and building materials. The developers avoided certain metals and plastics inside the
buildings in order to meet the City’s goals for building materials. There were no special financing
models for the green buildings in Hammarby; developers financed their own projects with the
expectation of getting a good return once residents or property management associations bought the
buildings.
This section will cover three types of green buildings in Hammarby: 1) The winners of the “Best
Building” award; 2) A self-heating building; and 3) GlasHusEtt, a green building that also provides the
public with information about Hammarby’s sustainability initiatives.
Energy Smart Buildings in Hammarby Sjöstad: In 2000, there was a competition for “Best Building,”
with the assessment criteria of reduced environmental load, good residential quality, and low lifecycle
cost. All of the awarded buildings show more than one element of smart infrastructure (Svane, 2013).
Holmen, winner of the first prize and developed by contractor NCC as a housing cooperative, has
photovoltaics covering the front facade. Smart infrastructure elements also allow for heat retrieval
from the sewage water and the exhaust air, and ventilation is individually controlled for each flat
(Svane, 2013).
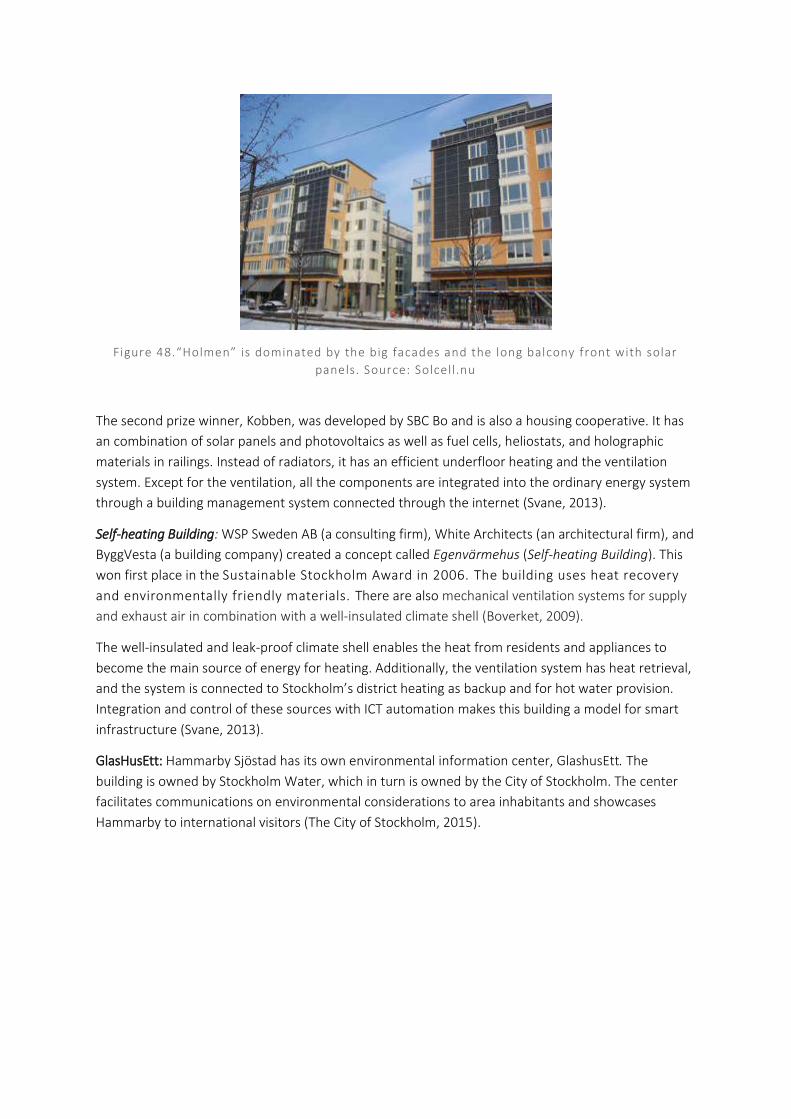
Figure 48.“Holmen” is dominated by the big facades and the long balcony front with solar
panels. Source: Solcell .nu
The second prize winner, Kobben, was developed by SBC Bo and is also a housing cooperative. It has
an combination of solar panels and photovoltaics as well as fuel cells, heliostats, and holographic
materials in railings. Instead of radiators, it has an efficient underfloor heating and the ventilation
system. Except for the ventilation, all the components are integrated into the ordinary energy system
through a building management system connected through the internet (Svane, 2013).
Self-heating Building: WSP Sweden AB (a consulting firm), White Architects (an architectural firm), and
ByggVesta (a building company) created a concept called Egenvärmehus (Self-heating Building). This
won first place in the Sustainable Stockholm Award in 2006. The building uses heat recovery
and environmentally friendly materials. There are also mechanical ventilation systems for supply
and exhaust air in combination with a well-insulated climate shell (Boverket, 2009).
The well-insulated and leak-proof climate shell enables the heat from residents and appliances to
become the main source of energy for heating. Additionally, the ventilation system has heat retrieval,
and the system is connected to Stockholm’s district heating as backup and for hot water provision.
Integration and control of these sources with ICT automation makes this building a model for smart
infrastructure (Svane, 2013).
GlasHusEtt: Hammarby Sjöstad has its own environmental information center, GlashusEtt. The
building is owned by Stockholm Water, which in turn is owned by the City of Stockholm. The center
facilitates communications on environmental considerations to area inhabitants and showcases
Hammarby to international visitors (The City of Stockholm, 2015).
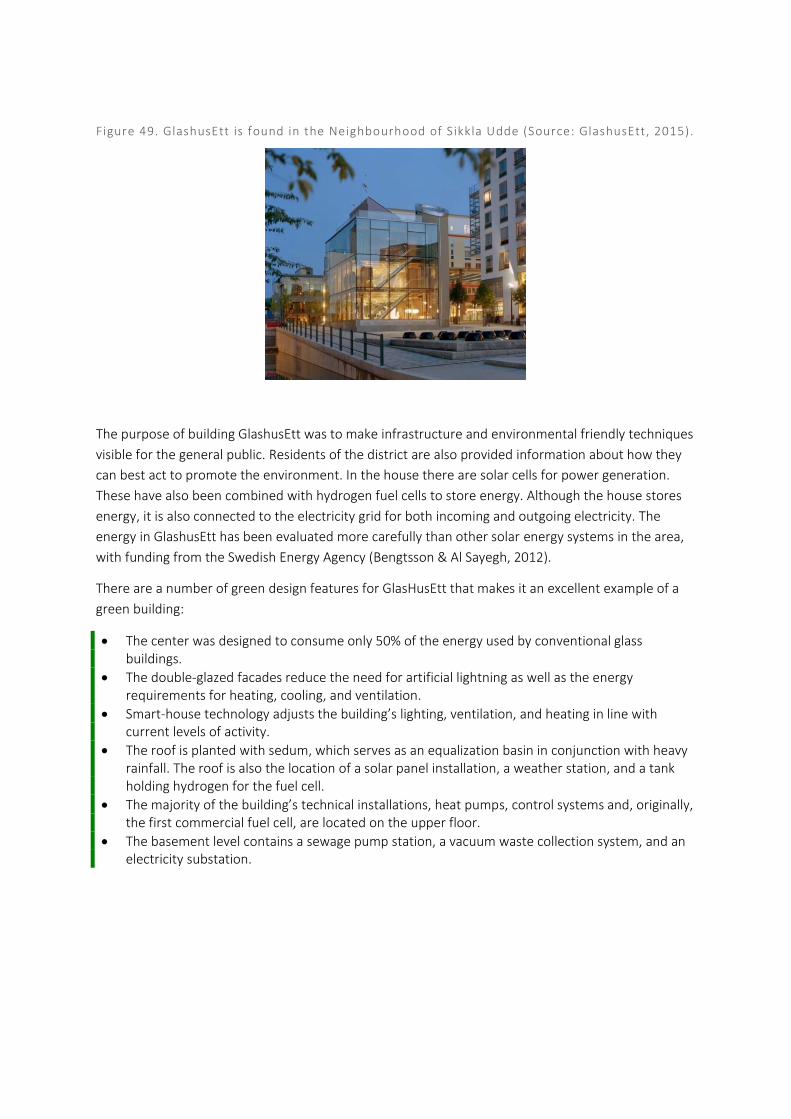
Figure 49. GlashusEtt is found in the Neighbourhood of Sikkla Udde (Source: GlashusEtt, 2015).
The purpose of building GlashusEtt was to make infrastructure and environmental friendly techniques
visible for the general public. Residents of the district are also provided information about how they
can best act to promote the environment. In the house there are solar cells for power generation.
These have also been combined with hydrogen fuel cells to store energy. Although the house stores
energy, it is also connected to the electricity grid for both incoming and outgoing electricity. The
energy in GlashusEtt has been evaluated more carefully than other solar energy systems in the area,
with funding from the Swedish Energy Agency (Bengtsson & Al Sayegh, 2012).
There are a number of green design features for GlasHusEtt that makes it an excellent example of a
green building:
The center was designed to consume only 50% of the energy used by conventional glass buildings.
The double-glazed facades reduce the need for artificial lightning as well as the energy requirements for heating, cooling, and ventilation.
Smart-house technology adjusts the building’s lighting, ventilation, and heating in line with current levels of activity.
The roof is planted with sedum, which serves as an equalization basin in conjunction with heavy rainfall. The roof is also the location of a solar panel installation, a weather station, and a tank holding hydrogen for the fuel cell.
The majority of the building’s technical installations, heat pumps, control systems and, originally, the first commercial fuel cell, are located on the upper floor.
The basement level contains a sewage pump station, a vacuum waste collection system, and an electricity substation.
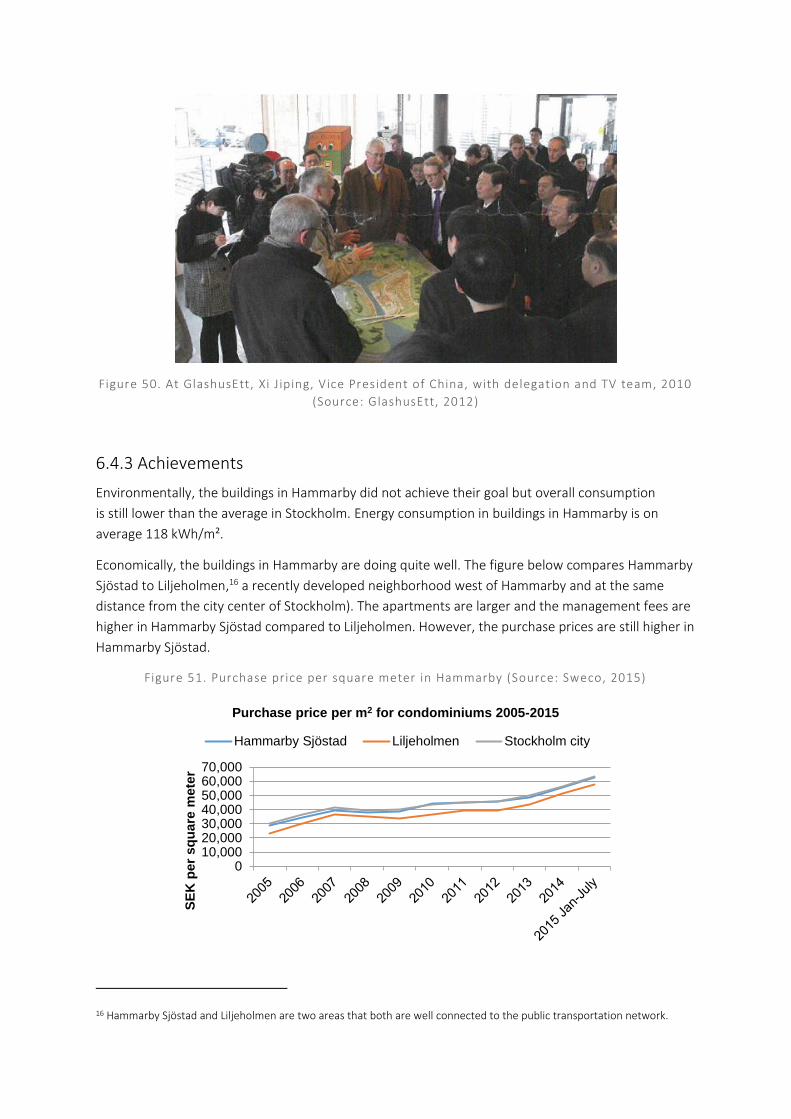
Figure 50. At GlashusEtt, Xi J iping, Vice President of China, with delegation and TV team, 2010
(Source: GlashusEtt, 2012)
6.4.3 Achievements
Environmentally, the buildings in Hammarby did not achieve their goal but overall consumption
is still lower than the average in Stockholm. Energy consumption in buildings in Hammarby is on
average 118 kWh/m².
Economically, the buildings in Hammarby are doing quite well. The figure below compares Hammarby
Sjöstad to Liljeholmen,16 a recently developed neighborhood west of Hammarby and at the same
distance from the city center of Stockholm). The apartments are larger and the management fees are
higher in Hammarby Sjöstad compared to Liljeholmen. However, the purchase prices are still higher in
Hammarby Sjöstad.
Figure 51. Purchase price per square meter in Hammarby (Source: Sweco, 2015)
16 Hammarby Sjöstad and Liljeholmen are two areas that both are well connected to the public transportation network.
010,00020,00030,00040,00050,00060,00070,000
SE
K p
er
sq
uare
mete
r
Purchase price per m2 for condominiums 2005-2015
Hammarby Sjöstad Liljeholmen Stockholm city
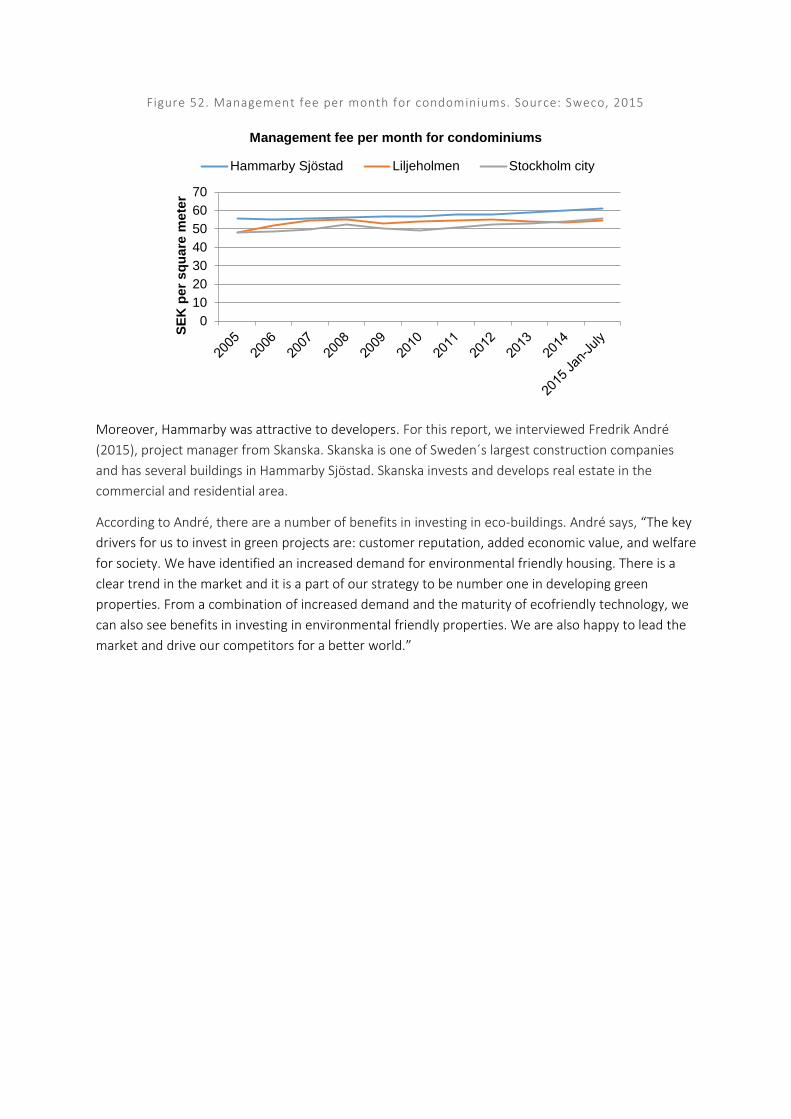
Figure 52. Management fee per month for condominiums. Source: Sweco, 2015
Moreover, Hammarby was attractive to developers. For this report, we interviewed Fredrik André
(2015), project manager from Skanska. Skanska is one of Sweden´s largest construction companies
and has several buildings in Hammarby Sjöstad. Skanska invests and develops real estate in the
commercial and residential area.
According to André, there are a number of benefits in investing in eco-buildings. André says, “The key
drivers for us to invest in green projects are: customer reputation, added economic value, and welfare
for society. We have identified an increased demand for environmental friendly housing. There is a
clear trend in the market and it is a part of our strategy to be number one in developing green
properties. From a combination of increased demand and the maturity of ecofriendly technology, we
can also see benefits in investing in environmental friendly properties. We are also happy to lead the
market and drive our competitors for a better world.”
0
10
20
30
40
50
60
70S
EK
per
sq
uare
mete
r
Management fee per month for condominiums
Hammarby Sjöstad Liljeholmen Stockholm city
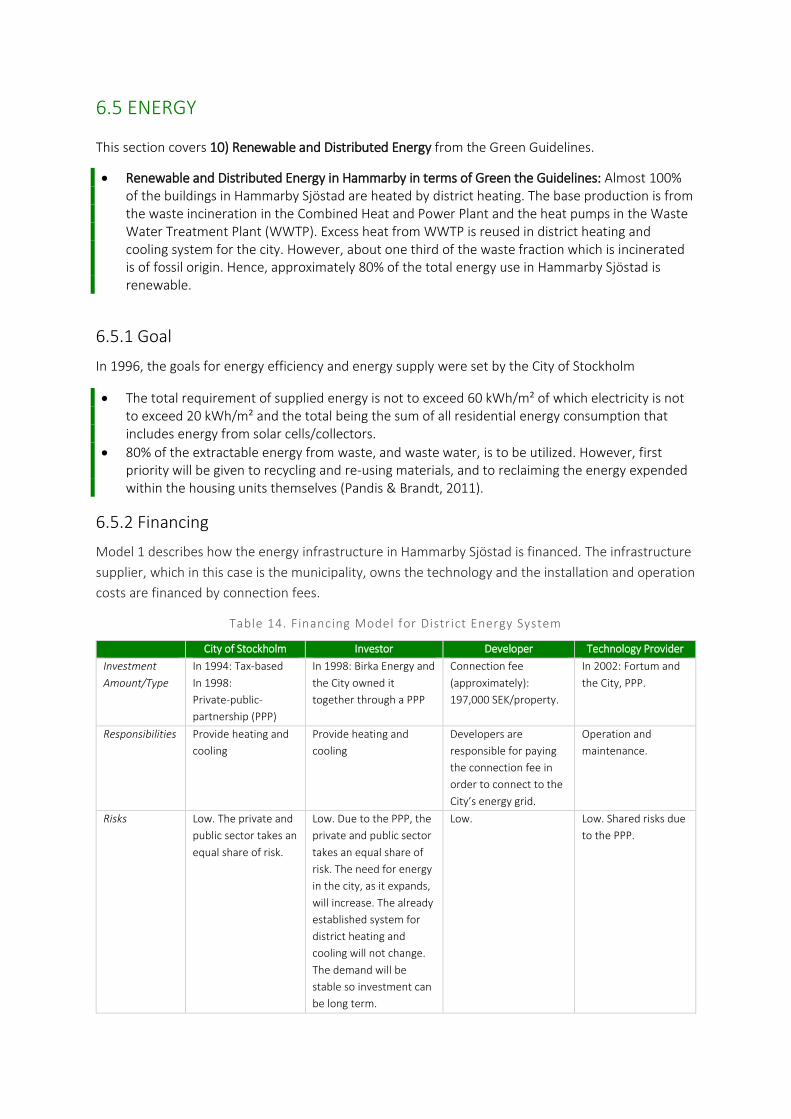
6.5 ENERGY
This section covers 10) Renewable and Distributed Energy from the Green Guidelines.
Renewable and Distributed Energy in Hammarby in terms of Green the Guidelines: Almost 100% of the buildings in Hammarby Sjöstad are heated by district heating. The base production is from the waste incineration in the Combined Heat and Power Plant and the heat pumps in the Waste Water Treatment Plant (WWTP). Excess heat from WWTP is reused in district heating and cooling system for the city. However, about one third of the waste fraction which is incinerated is of fossil origin. Hence, approximately 80% of the total energy use in Hammarby Sjöstad is renewable.
6.5.1 Goal
In 1996, the goals for energy efficiency and energy supply were set by the City of Stockholm
The total requirement of supplied energy is not to exceed 60 kWh/m² of which electricity is not to exceed 20 kWh/m² and the total being the sum of all residential energy consumption that includes energy from solar cells/collectors.
80% of the extractable energy from waste, and waste water, is to be utilized. However, first priority will be given to recycling and re-using materials, and to reclaiming the energy expended within the housing units themselves (Pandis & Brandt, 2011).
6.5.2 Financing
Model 1 describes how the energy infrastructure in Hammarby Sjöstad is financed. The infrastructure
supplier, which in this case is the municipality, owns the technology and the installation and operation
costs are financed by connection fees.
Table 14. Financing Model for Distr ict Energy System
City of Stockholm Investor Developer Technology Provider
Investment
Amount/Type
In 1994: Tax-based
In 1998:
Private-public-
partnership (PPP)
In 1998: Birka Energy and
the City owned it
together through a PPP
Connection fee
(approximately):
197,000 SEK/property.
In 2002: Fortum and
the City, PPP.
Responsibilities Provide heating and
cooling
Provide heating and
cooling
Developers are
responsible for paying
the connection fee in
order to connect to the
City’s energy grid.
Operation and
maintenance.
Risks Low. The private and
public sector takes an
equal share of risk.
Low. Due to the PPP, the
private and public sector
takes an equal share of
risk. The need for energy
in the city, as it expands,
will increase. The already
established system for
district heating and
cooling will not change.
The demand will be
stable so investment can
be long term.
Low. Low. Shared risks due
to the PPP.
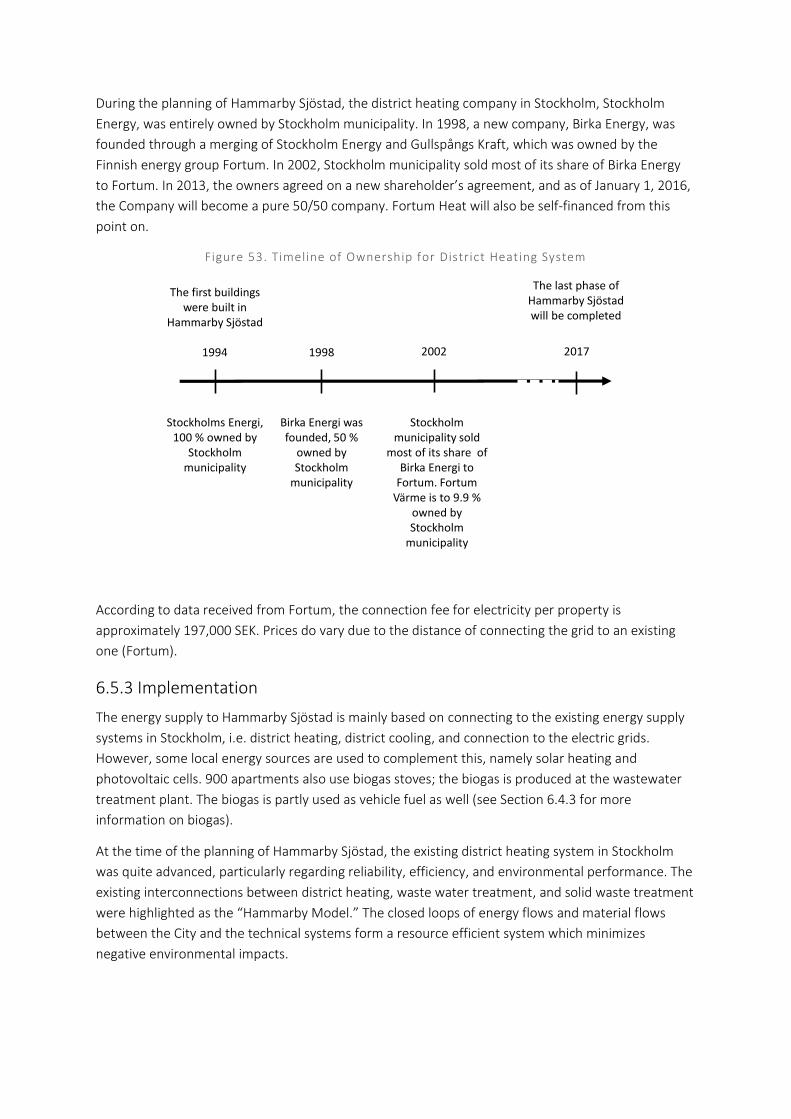
During the planning of Hammarby Sjöstad, the district heating company in Stockholm, Stockholm
Energy, was entirely owned by Stockholm municipality. In 1998, a new company, Birka Energy, was
founded through a merging of Stockholm Energy and Gullspångs Kraft, which was owned by the
Finnish energy group Fortum. In 2002, Stockholm municipality sold most of its share of Birka Energy
to Fortum. In 2013, the owners agreed on a new shareholder’s agreement, and as of January 1, 2016,
the Company will become a pure 50/50 company. Fortum Heat will also be self-financed from this
point on.
Figure 53. Timeline of Ownership for District Heating System
According to data received from Fortum, the connection fee for electricity per property is
approximately 197,000 SEK. Prices do vary due to the distance of connecting the grid to an existing
one (Fortum).
6.5.3 Implementation
The energy supply to Hammarby Sjöstad is mainly based on connecting to the existing energy supply
systems in Stockholm, i.e. district heating, district cooling, and connection to the electric grids.
However, some local energy sources are used to complement this, namely solar heating and
photovoltaic cells. 900 apartments also use biogas stoves; the biogas is produced at the wastewater
treatment plant. The biogas is partly used as vehicle fuel as well (see Section 6.4.3 for more
information on biogas).
At the time of the planning of Hammarby Sjöstad, the existing district heating system in Stockholm
was quite advanced, particularly regarding reliability, efficiency, and environmental performance. The
existing interconnections between district heating, waste water treatment, and solid waste treatment
were highlighted as the “Hammarby Model.” The closed loops of energy flows and material flows
between the City and the technical systems form a resource efficient system which minimizes
negative environmental impacts.
The first buildingswere built in
Hammarby Sjöstad
Stockholms Energi, 100 % owned by
Stockholm municipality
1998
Birka Energi wasfounded, 50 %
owned by Stockholm
municipality
Stockholm municipality sold
most of its share ofBirka Energi to
Fortum. Fortum Värme is to 9.9 %
owned by Stockholm
municipality
1994 2017
The last phase ofHammarby Sjöstad will be completed
2002

Figure 54. Energy loop in Hammarby Sjöstad. Source: City of Stockholm, 2006. Modif ied by
Authors’
Some of the heat in the district heating system is produced by heat pumps which use the heat in the
treated sewer water from the neighboring wastewater treatment plant. The sewer water originates
from Hammarby Sjöstad and other parts of Stockholm. Additional heat is produced in a Combined
Heat and Power Plant (CHPP) and bio-oil boilers. Cooling is produced by the same heat pumps.
The heat plant Hammarby verket, is the largest plant in the world that uses heat from treated sewage
water. The facility contains seven heat pumps, two bio-oil boilers, and two electric boilers. The
electric boilers are used for peak loads. The annual heat production from the heat pumps is about
1,000 GWh.17 This is more than is needed within Hammarby Sjöstad so the leftover heat is distributed
to southern parts of Stockholm as well.
Since the 1990s, the fuel mix in the district heating system has changed several times. The production
capacity in the waste incineration plant has been expanded from 90 MW in the 1990s to 276 MW
since year 2005.
17 Environmental report 2012, Fortum
Figure 55. Fuel mix in the south distr ict heating system in Stockholm.
Another change was the new connection between the south and the central district heating system in
2008. The interconnection allows a more efficient use of the heat production plants. However, the
interconnection has decreased the environmental performance of Hammarby Sjöstad since the
central system uses a greater portion of fossil fuel in the production mix compared to the south
system which only Hammarby Sjöstad was connected to before 2008. However, the share of fossil
fuels in the fuel mix has been reduced in Fortum’s system, from 21% in year 2010 to 11% in 2014.18
The increased interconnection with the district heating systems in other parts of Stockholm has added
fossil fuel to Hammarby Sjöstad’s fuel sources. However, district heating in Stockholm as a whole has
achieved increased efficiency and environmental performance.
In Hammarby, there are also solar water heaters on the roofs of buildings. The heat from the sun is
sufficient to meet all the demand for hot tap water in the building. There are also examples of
photovoltaic systems integrated in the building design.
In photovoltaic cells, solar energy is transformed into electrical energy. In Sweden, the energy from a single
solar cell module covering one square meter provides around 100 kWh per year, which is equivalent to the
energy used by three m2 of housing space. Solar panels on residential buildings often provide sufficient energy
to meet half of the annual hot water requirements of the buildings in Sweden.
Figure 56. Use of solar cells on facades Source: Stockholm City
18 Environmental report 2014, Fortum
Bio-oil
Heat pumps
using heat
from the
WWTP
Waste
incineration in
the CHPP
The solar cells have been installed on both roofs and facades of buildings. On the roof, the solar cells
cover an area of 118 m2. The equivalent installed surface of the facade is 109 m2. The roof has an
angle of 16 degrees. The installation consists of 304 modules with solar cells. The cost for ceiling
installation is estimated at € 6.7/W all inclusive. Synergy is achieved when parts of the installation
replaces conventional solar shading.
6.5.4 Achievements
Hammarby Sjöstad has not achieved the energy targets which were set out in its initial plan.
According to a 2009 report from KTH, the energy use exceeds the target levels in all the buildings. The
average use was between 142-165 kWh/m2 /year. The building with the lowest consumption used 95
kWh/m2 /year, more than 50% higher than the target levels. The least efficient building consumed
almost four times more energy than was initially planned for.19
A study from year 2013 found that energy demand was 118 kWh/m2 on average.20 A citizens’
initiative, HS2020, has been founded with the goal to reach an energy performance below 100
kWh/m2 through system optimization and improved energy management.
Figure 57. Energy demand Hammarby Sjöstad.
In a revaluation of the environmental targets in 2004-2005, the energy targets were adjusted to 100
kWh/m2/year. Even though this adjustment was implemented, most buildings monitored still used
higher energy rates than expected. In the report Under 100 (2013), the result indicates that 86
percent of the buildings use more energy than 100 kWh/m2/year (HS2020).
According to Pandis & Brandt (2011), 95% of the residual waste from Hammarby Sjöstad was
combusted at the Högdalen Combined Heat and Power Plant, utilizing 90–100% of the energy content
of the waste.
19 Pandis, S., Brandt, N., (2009). utvärdering av Hammarby Sjöstads miljöprofilering – vilka erfarenheter ska tas med till nya stadsutvecklingsprojekt i Stockholm, Avdelningen för industriell ekologi KTH, ISSN: 1402-7615. 20 Under 100 – att lyckas med energi i Hammarby Sjöstad. Energiprojektet inom HS2020. Förstudie finansierad av BeBo, september 2013.
Target level: 60 kWh/sqm
Current level: 118 kWh/sqm
Ener
gy d
em
and
6.6 WASTE MANAGEMENT
The waste management system in Hammarby is unique and a central part of their eco-cycle program –
this section covers 11) Waste Management.
Waste Management in Hammarby in terms of the Green Guidelines: Household waste sorted at source in practical systems, with material and energy recycling maximized wherever possible. Waste use: 0.7% landfill, 1% hazardous waste, 33% material recycling, 16% biological treatment, and 50% energy recovery.
6.6.1 Goals
In 1996, the goals for waste management and recycling were set by the City of Stockholm:
The total amount of recyclable and waste material, both of which are the responsibility of municipal authorities and various commercial interests, is to have been reduced by 20% in weight (compared to similar developments at that time);
The total amount of material delivered to the landfill, the remaining fraction after recycling and energy recovery, is to have been reduced by 60% in weight (compared to similar developments at that time);
The source-sorting of waste is to be extended in accordance with regulations applying to producer responsibility, and should at least include the following categories: organic material, textiles, environmentally harmful waste, and hazardous waste (Pandish & Brandt, 2011).
6.6.2 Financing
The way that the stationary vacuum system was constructed in Hammarby is unique. In Hammarby,
the City of Stockholm did not invest in the vacuum waste system. In most cases, municipalities build
the vacuum system and finance it with two types of fees: 1) Connection fees paid by developers; 2)
Regular fees from the individuals or companies living in or operating the buildings.
Instead, in Hammarby, the vacuum waste system was financed and built by the developers. The
City invested in other types of facilities for waste handling such as: collection of household
waste, treatment of the waste, providing recycling centers, recycling stations and the mobile
collection-station for bulky waste, electronic waste and hazardous waste, as well as
administration and information about waste management in Stockholm.
Currently, the vacuum system in Hammarby is owned and serviced by a local property organization.
There is discussion that this is not the ideal ownership model for the vacuum system. There is an
ongoing discussion in the City Hall if it can be taken over by the municipality which is considered to be
the preferred solution in the long term. The operation and maintenance of the vacuum waste system
in Hammarby is outsourced to the supplier of the system, a company called Envac, through mid- and
long-term contracts.
Table 15. Financing Model for Vacuum System
City of Stockholm Developer/Operator Technology Provider
Investment
Amount/Type
Did not invest in the vacuum
waste system, but did invest in
other aspects of the waste
collection system, as described
in “Responsibilities”
Private Investment through
construction companies.
Local property
organizations contract the
operation and maintenance
Responsibilities Coordinated the construction
process of the vacuum waste
system, collecting household
waste, treatment of the waste,
providing recycling centers and
the mobile collection station
for bulky waste, electronic
waste and hazardous waste
administration, and
information on waste
management in Stockholm.
Financed and built by the
developers through a joint-property
association. The construction
process was coordinated by the City
of Stockholm. The operation and
maintenance of the vacuum waste
system is outsourced to the
property owners to the supplier of
the system, Envac.
Collecting of waste by
entrepreneurs publicly
procured by Stockholm
Water
Expected
payback
period? (If one)
There is no estimated payback
time but the City of Stockholm
has a reduced 50% (of unit
cost) tariff for properties
connected to the stationary
waste vacuum system which
balances the local operational
and maintenance costs.
Risks Low. Private investors bore the
main cost while the City paid
for the supporting aspects.
Low. The guarantees on the tariffs
by the City meant the developers
had a strong incentive to minimize
costs but still make the system as
efficient as possible since they still
pay for tariffs per unit of waste
incinerated. The vacuum system in
Hammarby is still owned and
serviced by different local property
organizations, and this ownership
model is currently under question.
The stationary vacuum suction system that is implemented in one part of Hammarby Sjöstad
(Hammarby Gård, some 2,100 apartments) had a total investment cost of 44.2 million SEK (about 4.7
million Euros). The property owners in Hammarby Sjöstad own the facility through a joint-property
association. The City of Stockholm compensates the joint-property association by charging a greatly
reduced rate. The company Envac is commissioned by the joint-property associations for the
operation and maintenance of the facilities (Envac, 2005).
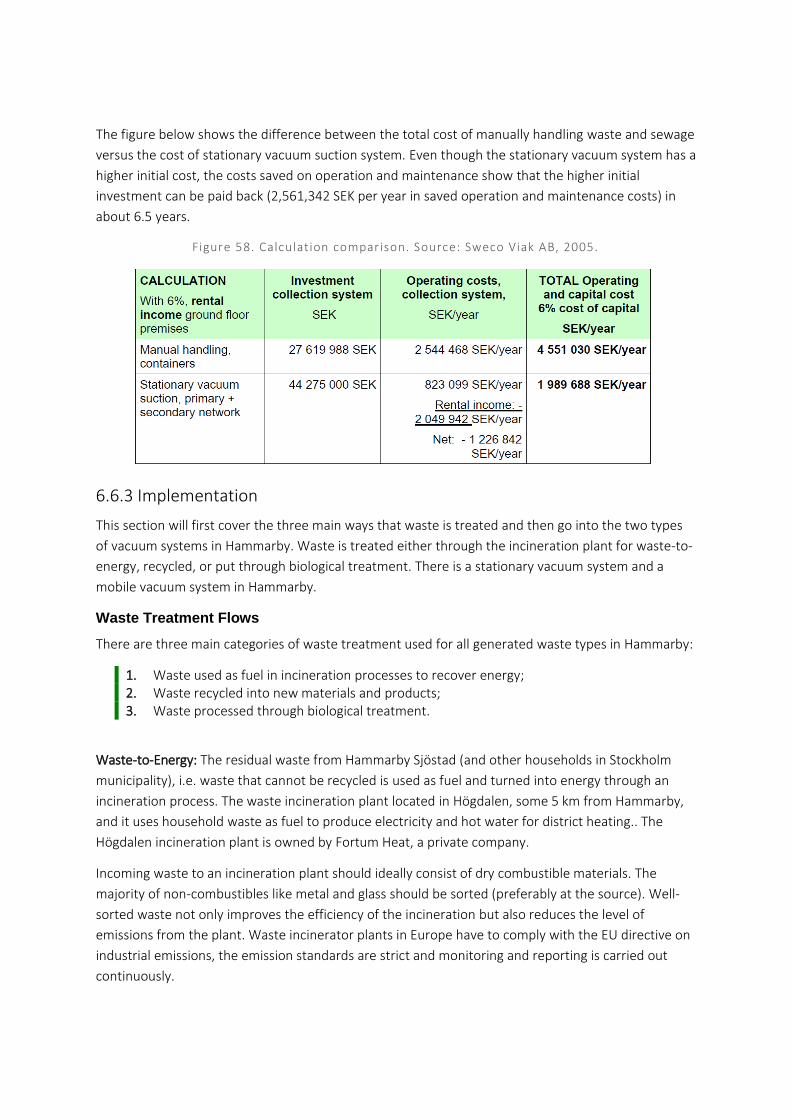
The figure below shows the difference between the total cost of manually handling waste and sewage
versus the cost of stationary vacuum suction system. Even though the stationary vacuum system has a
higher initial cost, the costs saved on operation and maintenance show that the higher initial
investment can be paid back (2,561,342 SEK per year in saved operation and maintenance costs) in
about 6.5 years.
Figure 58. Calculation comparison. Source: Sweco Viak AB, 2005.
6.6.3 Implementation
This section will first cover the three main ways that waste is treated and then go into the two types
of vacuum systems in Hammarby. Waste is treated either through the incineration plant for waste-to-
energy, recycled, or put through biological treatment. There is a stationary vacuum system and a
mobile vacuum system in Hammarby.
Waste Treatment Flows
There are three main categories of waste treatment used for all generated waste types in Hammarby:
1. Waste used as fuel in incineration processes to recover energy; 2. Waste recycled into new materials and products; 3. Waste processed through biological treatment.
Waste-to-Energy: The residual waste from Hammarby Sjöstad (and other households in Stockholm
municipality), i.e. waste that cannot be recycled is used as fuel and turned into energy through an
incineration process. The waste incineration plant located in Högdalen, some 5 km from Hammarby,
and it uses household waste as fuel to produce electricity and hot water for district heating.. The
Högdalen incineration plant is owned by Fortum Heat, a private company.
Incoming waste to an incineration plant should ideally consist of dry combustible materials. The
majority of non-combustibles like metal and glass should be sorted (preferably at the source). Well-
sorted waste not only improves the efficiency of the incineration but also reduces the level of
emissions from the plant. Waste incinerator plants in Europe have to comply with the EU directive on
industrial emissions, the emission standards are strict and monitoring and reporting is carried out
continuously.
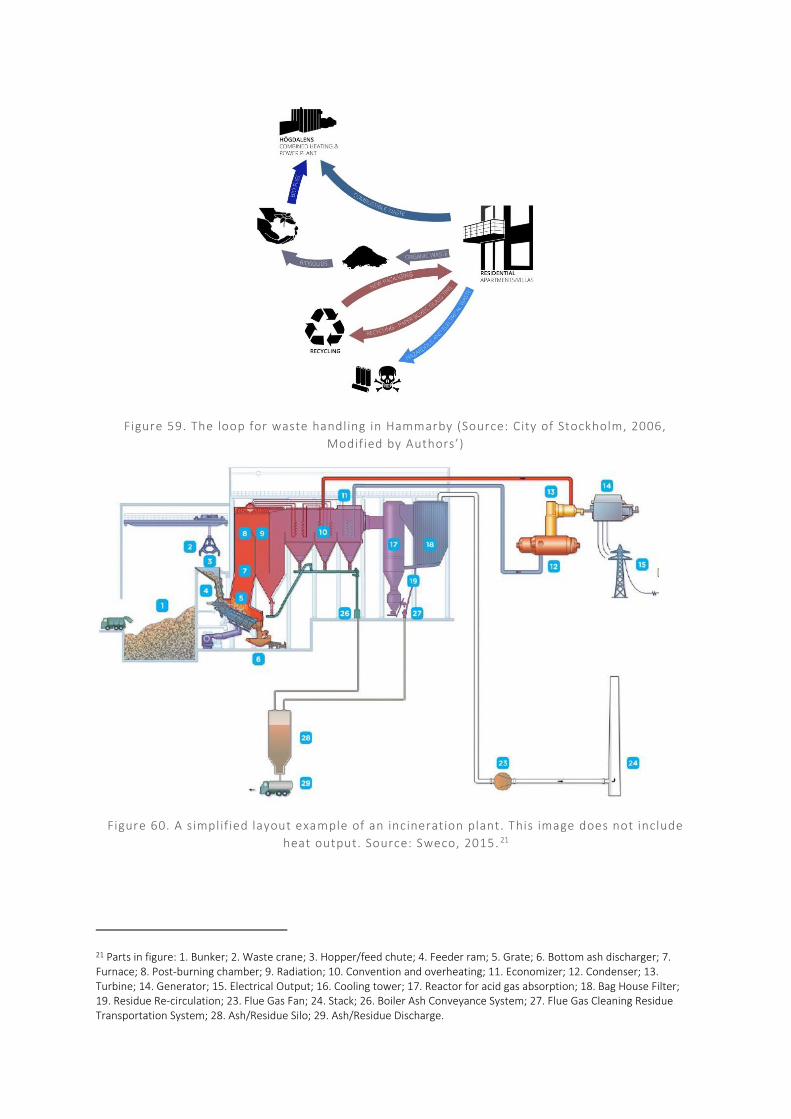
Figure 59. The loop for waste handling in Hammarby (Source: City of Stockholm, 2006,
Modified by Authors’)
Figure 60. A simplif ied layout example of an incineration plant. This image does not include
heat output. Source: Sweco, 2015. 21
21 Parts in figure: 1. Bunker; 2. Waste crane; 3. Hopper/feed chute; 4. Feeder ram; 5. Grate; 6. Bottom ash discharger; 7. Furnace; 8. Post-burning chamber; 9. Radiation; 10. Convention and overheating; 11. Economizer; 12. Condenser; 13. Turbine; 14. Generator; 15. Electrical Output; 16. Cooling tower; 17. Reactor for acid gas absorption; 18. Bag House Filter; 19. Residue Re-circulation; 23. Flue Gas Fan; 24. Stack; 26. Boiler Ash Conveyance System; 27. Flue Gas Cleaning Residue Transportation System; 28. Ash/Residue Silo; 29. Ash/Residue Discharge.
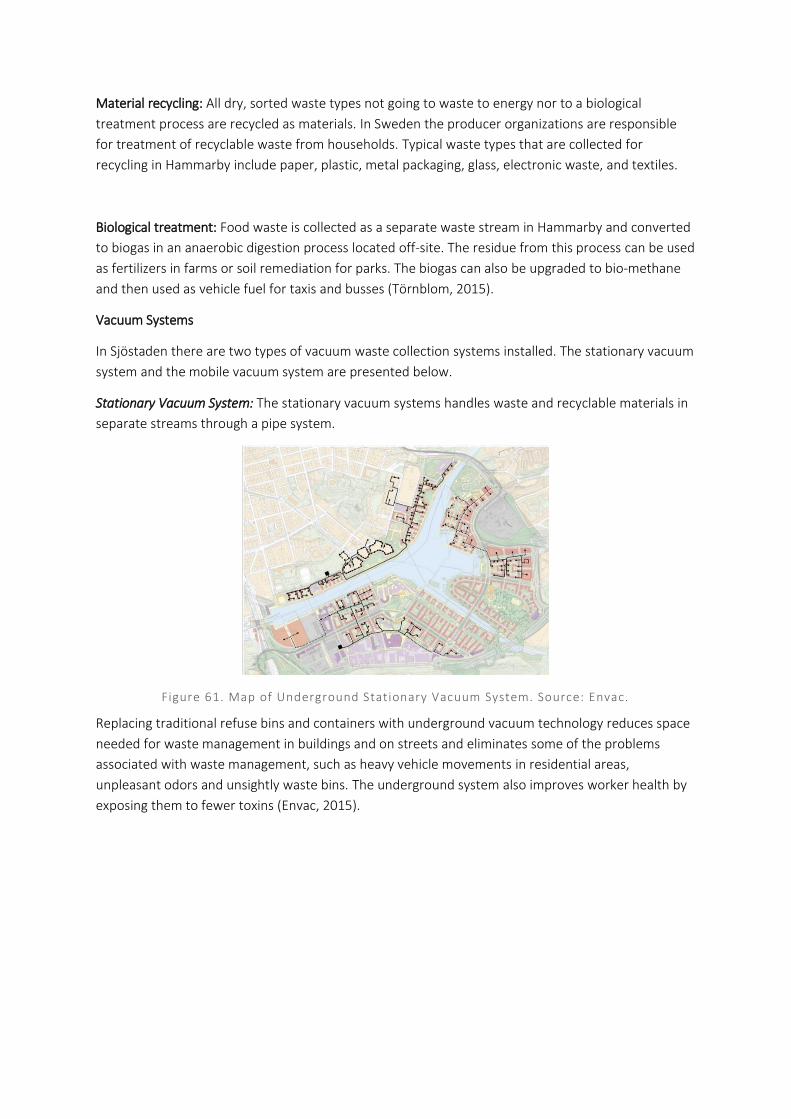
Material recycling: All dry, sorted waste types not going to waste to energy nor to a biological
treatment process are recycled as materials. In Sweden the producer organizations are responsible
for treatment of recyclable waste from households. Typical waste types that are collected for
recycling in Hammarby include paper, plastic, metal packaging, glass, electronic waste, and textiles.
Biological treatment: Food waste is collected as a separate waste stream in Hammarby and converted
to biogas in an anaerobic digestion process located off-site. The residue from this process can be used
as fertilizers in farms or soil remediation for parks. The biogas can also be upgraded to bio-methane
and then used as vehicle fuel for taxis and busses (Törnblom, 2015).
Vacuum Systems
In Sjöstaden there are two types of vacuum waste collection systems installed. The stationary vacuum
system and the mobile vacuum system are presented below.
Stationary Vacuum System: The stationary vacuum systems handles waste and recyclable materials in
separate streams through a pipe system.
Figure 61. Map of Underground Stationary Vacuum System. Source: Envac.
Replacing traditional refuse bins and containers with underground vacuum technology reduces space
needed for waste management in buildings and on streets and eliminates some of the problems
associated with waste management, such as heavy vehicle movements in residential areas,
unpleasant odors and unsightly waste bins. The underground system also improves worker health by
exposing them to fewer toxins (Envac, 2015).
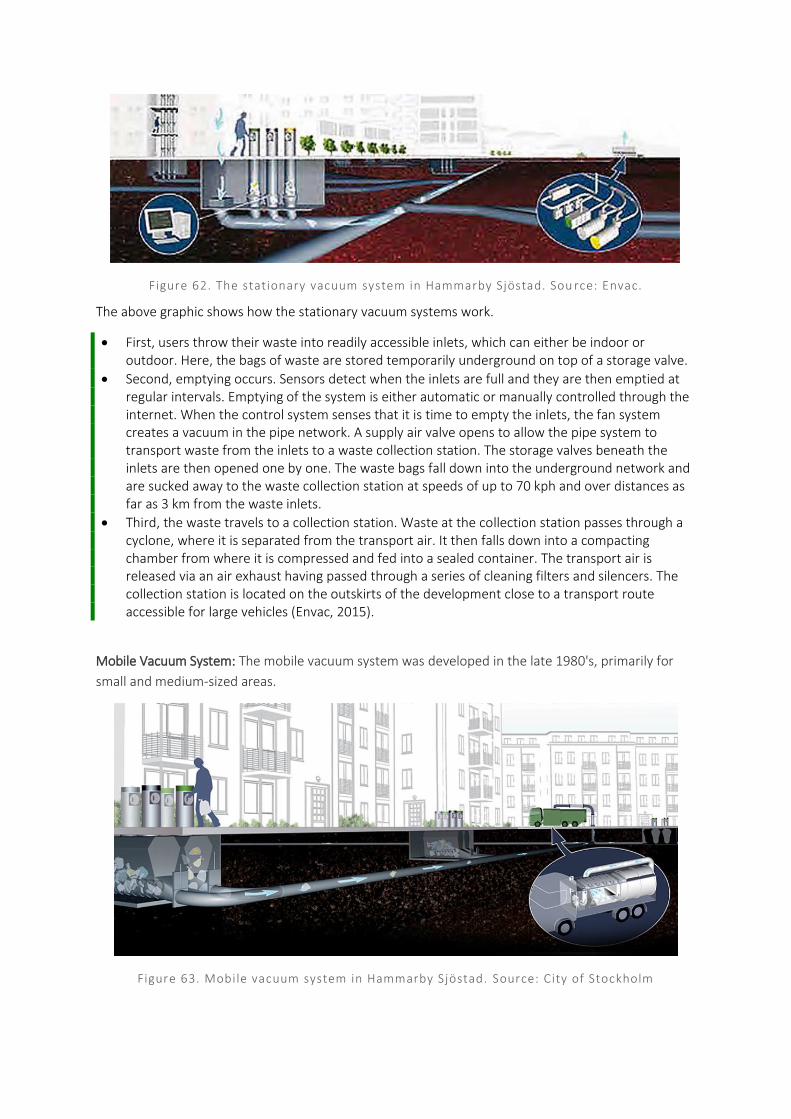
Figure 62. The stationary vacuum system in Hammarby Sjöstad. Sou rce: Envac.
The above graphic shows how the stationary vacuum systems work.
First, users throw their waste into readily accessible inlets, which can either be indoor or outdoor. Here, the bags of waste are stored temporarily underground on top of a storage valve.
Second, emptying occurs. Sensors detect when the inlets are full and they are then emptied at regular intervals. Emptying of the system is either automatic or manually controlled through the internet. When the control system senses that it is time to empty the inlets, the fan system creates a vacuum in the pipe network. A supply air valve opens to allow the pipe system to transport waste from the inlets to a waste collection station. The storage valves beneath the inlets are then opened one by one. The waste bags fall down into the underground network and are sucked away to the waste collection station at speeds of up to 70 kph and over distances as far as 3 km from the waste inlets.
Third, the waste travels to a collection station. Waste at the collection station passes through a cyclone, where it is separated from the transport air. It then falls down into a compacting chamber from where it is compressed and fed into a sealed container. The transport air is released via an air exhaust having passed through a series of cleaning filters and silencers. The collection station is located on the outskirts of the development close to a transport route accessible for large vehicles (Envac, 2015).
Mobile Vacuum System: The mobile vacuum system was developed in the late 1980's, primarily for
small and medium-sized areas.
Figure 63. Mobile vacuum system in Hammarby Sjöstad. Source: City of Stockholm
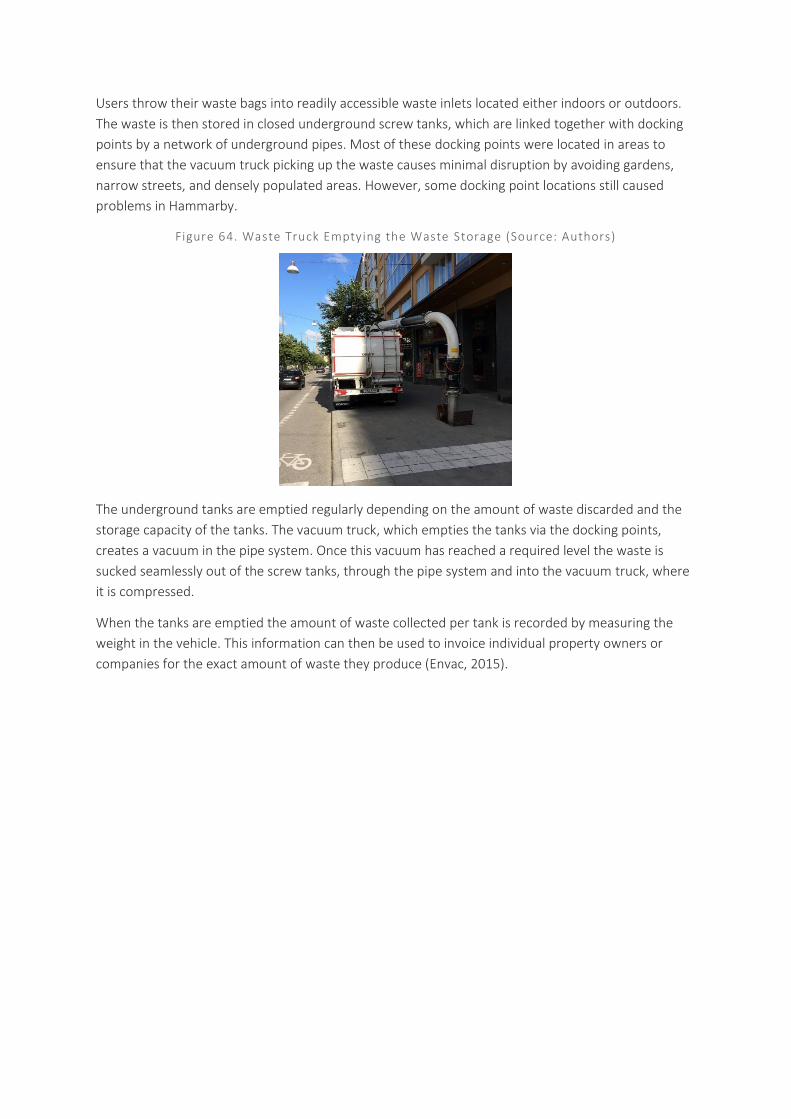
Users throw their waste bags into readily accessible waste inlets located either indoors or outdoors.
The waste is then stored in closed underground screw tanks, which are linked together with docking
points by a network of underground pipes. Most of these docking points were located in areas to
ensure that the vacuum truck picking up the waste causes minimal disruption by avoiding gardens,
narrow streets, and densely populated areas. However, some docking point locations still caused
problems in Hammarby.
Figure 64. Waste Truck Emptying the Waste Storage (Source: Authors)
The underground tanks are emptied regularly depending on the amount of waste discarded and the
storage capacity of the tanks. The vacuum truck, which empties the tanks via the docking points,
creates a vacuum in the pipe system. Once this vacuum has reached a required level the waste is
sucked seamlessly out of the screw tanks, through the pipe system and into the vacuum truck, where
it is compressed.
When the tanks are emptied the amount of waste collected per tank is recorded by measuring the
weight in the vehicle. This information can then be used to invoice individual property owners or
companies for the exact amount of waste they produce (Envac, 2015).
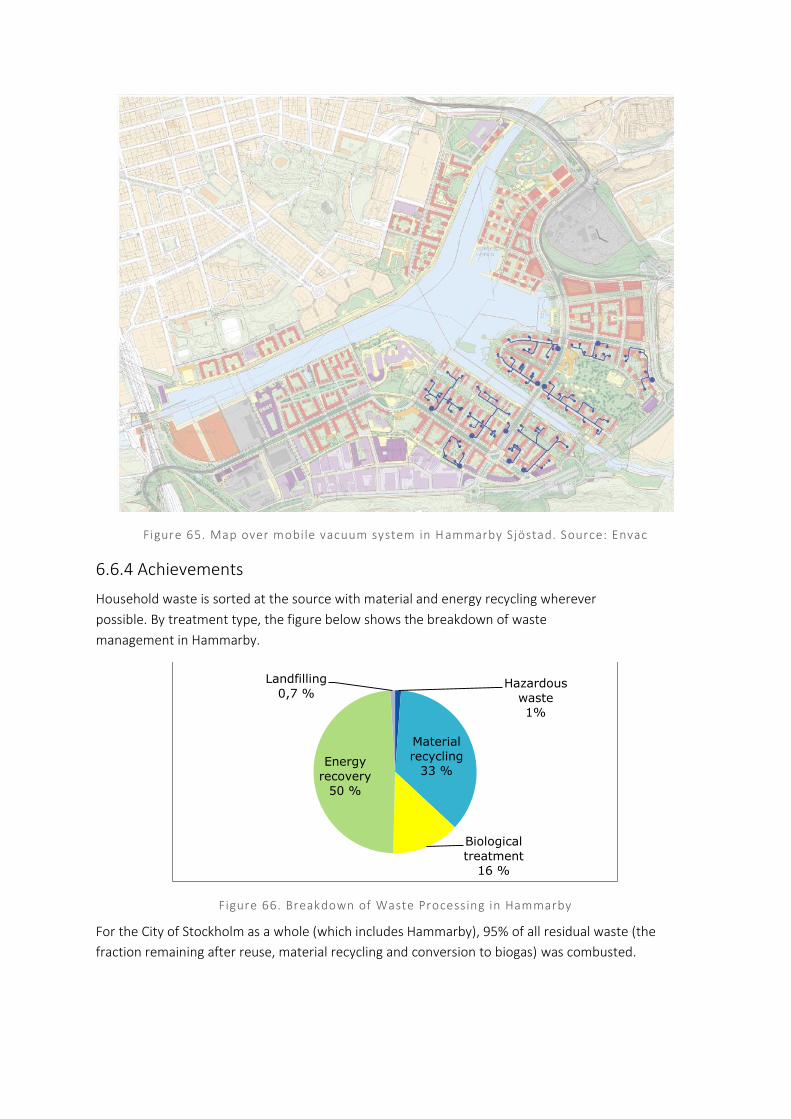
Figure 65. Map over mobile vacuum system in H ammarby Sjöstad. Source: Envac
6.6.4 Achievements
Household waste is sorted at the source with material and energy recycling wherever
possible. By treatment type, the figure below shows the breakdown of waste
management in Hammarby.
Figure 66. Breakdown of Waste Processing in Hammarby
For the City of Stockholm as a whole (which includes Hammarby), 95% of all residual waste (the
fraction remaining after reuse, material recycling and conversion to biogas) was combusted.
Hazardous
waste1%
Material
recycling33 %
Biological
treatment16 %
Energy
recovery50 %
Landfilling
0,7 %
Beyond achieving the sustainability metrics, the waste vacuum system also allows Hammarby to enjoy
a number of other advantages.
Table 16. Advantages of Vacuum Waste System Over Traditional System
Technical
Advantages
Inlet design is flexible: The inlets can be customized to suit an individual development or streetscape
and placed indoors on each floor, in the doorway, at the street level, or outside of the buildings. They
can be wall-mounted or freestanding, both indoor and outdoor.
Easy to upgrade or retrofit: The vacuum waste technology can be adapted to suit each individual
project depending on the development’s design and requirements. Extending the system to adjacent
properties, areas or entire districts is technically straightforward as new pipework can be added on to
the existing underground infrastructure. This system can be installed into large-scale new commercial
and residential developments as well as retrofitted into existing buildings and developments. It can
also be integrated into individual properties and rows of terraces.
Economic
Advantages
No need for collection vehicles: The vacuum system reduces need to manually empty bins and waste
collection vehicles are no longer necessary to make frequent visits inside the residential area. This
reduces the amount of pollution from waste collection vehicles on the roads whilst creating a safer
environment for residents. Resources traditionally associated with manually emptying bins can be
reallocated and waste collection cycles can be made more regularly and at less cost. The developers
also benefit from the vacuum system in the reduced need for road access, road width, and turning
point radiuses.
No need for land for waste storage: The vacuum waste system requires much less ground space for
intermediate waste storage. The areas that would be used for waste storage can now be used for
other purposes, such as green space, additional storage space, or for commercial units on the ground
floor level. When this extra space is taken into account, the vacuum waste system is economically
beneficial to most multi-family residential developments in Sweden.
Overall lower operation and maintenance costs: The initial cost of the investment is offset by space
savings and lower operation and maintenance costs (Envac, 2015). The vacuum waste technology is a
long-term investment with significant financial and environmental advantages. It makes areas cleaner,
reduces carbon emissions, and increases the sustainability of the environments in which it operates. It
also greatly reduces the storage need for containers and bins in waste rooms or in the public realm.
Social
Advantages
Inlet placement can build community: The versatility of the vacuum waste system allows a greater
flexibility with regard to the location of the waste disposal inlets since they do not have to have access
to a street for truck collection. The inlet points can therefore be designed and located from a
convenience and “sociability” perspective. They create natural meeting points for the residents and
their central positioning allow for a soft neighborhood behavioral watch. Hence, discipline is good and
waste segregation is high.
Improved hygiene: Hygiene is improved for people in the area and for waste collection operative staff,
who gets less exposure to the waste. The system is hermetically sealed and the waste will not attract
pests or insects or release unpleasant odors.
However, the waste system is not perfect and Hammarby encountered a number of challenges in the
process:
After the vacuum waste system was completed, the City felt that a better ownership model would be for the city to have financed and built the system and then had the developers pay a connection fee, like the whole other utilities systems are completed in Stockholm.
The mobile system used for the first phase of the project has been less efficient than the stationary systems. The environmental benefits are greater with the stationary system and the operation and maintenance costs are also lower.
For maintenance, property associations are in charge but they are not always the best equipped to handle the system. Many property owners are in favor of the City having responsibility for the vacuum system.
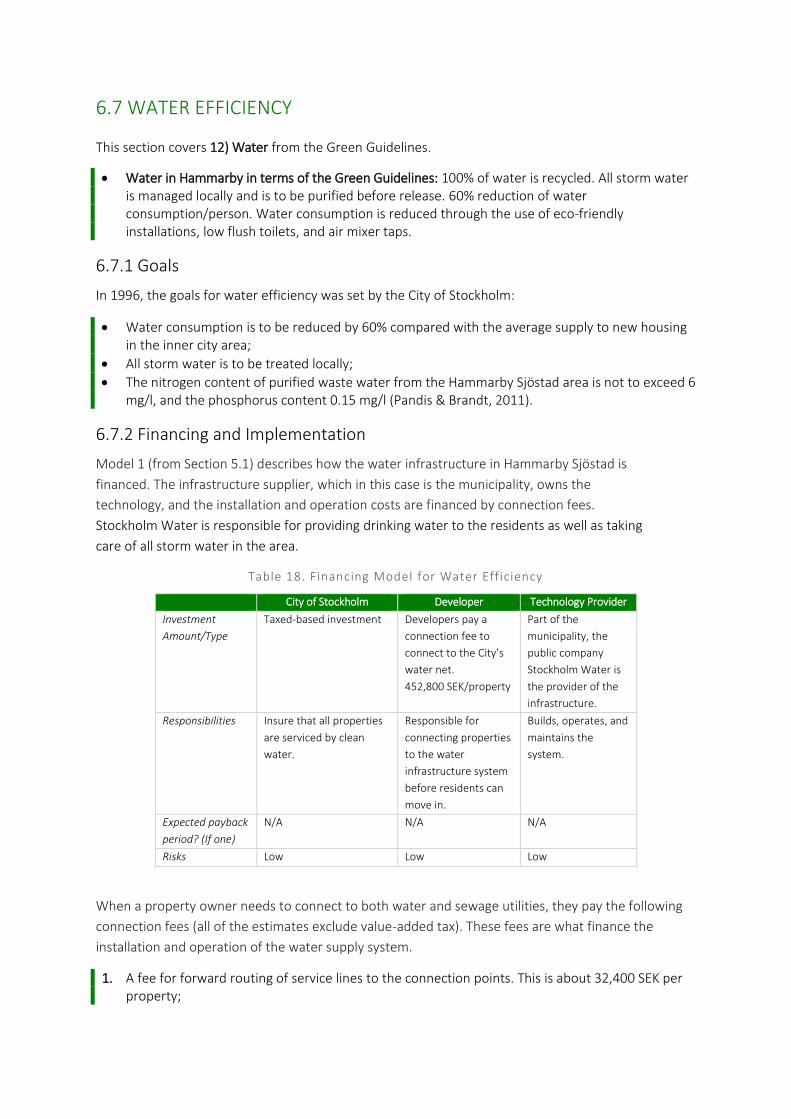
6.7 WATER EFFICIENCY
This section covers 12) Water from the Green Guidelines.
Water in Hammarby in terms of the Green Guidelines: 100% of water is recycled. All storm water is managed locally and is to be purified before release. 60% reduction of water consumption/person. Water consumption is reduced through the use of eco-friendly installations, low flush toilets, and air mixer taps.
6.7.1 Goals
In 1996, the goals for water efficiency was set by the City of Stockholm:
Water consumption is to be reduced by 60% compared with the average supply to new housing in the inner city area;
All storm water is to be treated locally;
The nitrogen content of purified waste water from the Hammarby Sjöstad area is not to exceed 6 mg/l, and the phosphorus content 0.15 mg/l (Pandis & Brandt, 2011).
6.7.2 Financing and Implementation
Model 1 (from Section 5.1) describes how the water infrastructure in Hammarby Sjöstad is
financed. The infrastructure supplier, which in this case is the municipality, owns the
technology, and the installation and operation costs are financed by connection fees.
Stockholm Water is responsible for providing drinking water to the residents as well as taking
care of all storm water in the area.
Table 18. Financing Model for Water Eff iciency
City of Stockholm Developer Technology Provider
Investment
Amount/Type
Taxed-based investment Developers pay a
connection fee to
connect to the City’s
water net.
452,800 SEK/property
Part of the
municipality, the
public company
Stockholm Water is
the provider of the
infrastructure.
Responsibilities Insure that all properties
are serviced by clean
water.
Responsible for
connecting properties
to the water
infrastructure system
before residents can
move in.
Builds, operates, and
maintains the
system.
Expected payback
period? (If one)
N/A N/A N/A
Risks Low Low Low
When a property owner needs to connect to both water and sewage utilities, they pay the following
connection fees (all of the estimates exclude value-added tax). These fees are what finance the
installation and operation of the water supply system.
1. A fee for forward routing of service lines to the connection points. This is about 32,400 SEK per property;
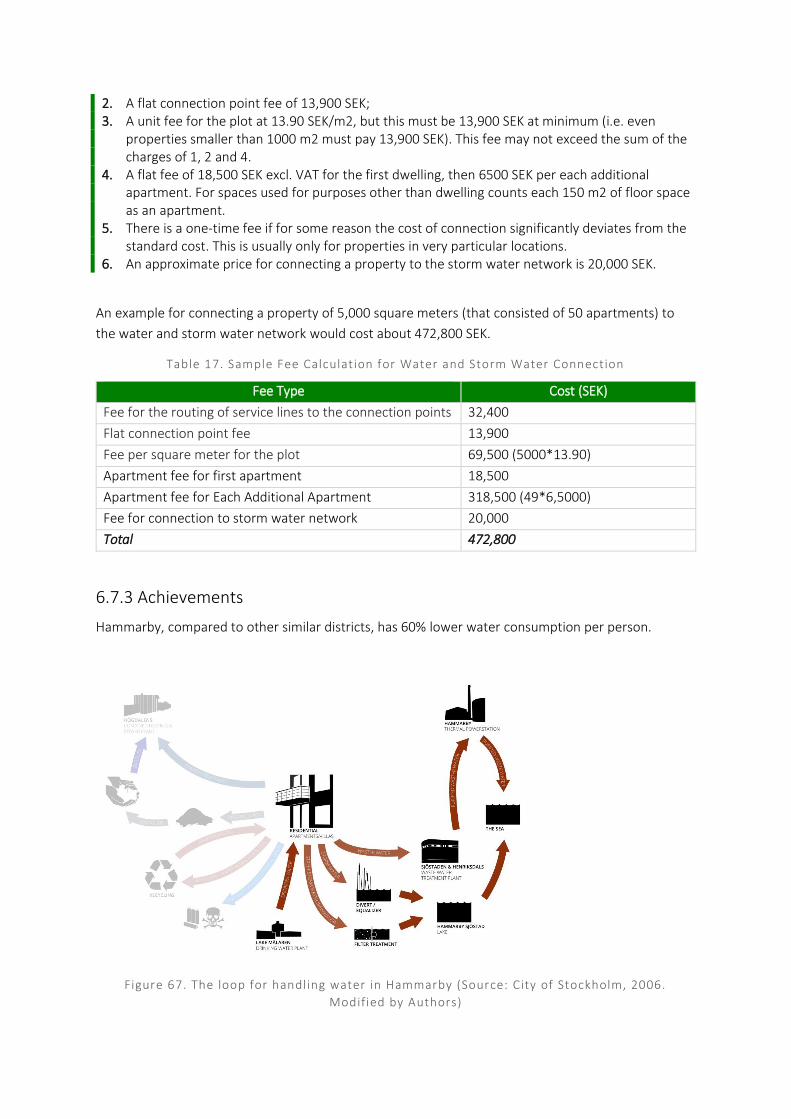
2. A flat connection point fee of 13,900 SEK; 3. A unit fee for the plot at 13.90 SEK/m2, but this must be 13,900 SEK at minimum (i.e. even
properties smaller than 1000 m2 must pay 13,900 SEK). This fee may not exceed the sum of the charges of 1, 2 and 4.
4. A flat fee of 18,500 SEK excl. VAT for the first dwelling, then 6500 SEK per each additional apartment. For spaces used for purposes other than dwelling counts each 150 m2 of floor space as an apartment.
5. There is a one-time fee if for some reason the cost of connection significantly deviates from the standard cost. This is usually only for properties in very particular locations.
6. An approximate price for connecting a property to the storm water network is 20,000 SEK.
An example for connecting a property of 5,000 square meters (that consisted of 50 apartments) to
the water and storm water network would cost about 472,800 SEK.
Table 17. Sample Fee Calculation for Water and Storm Water Connection
Fee Type Cost (SEK)
Fee for the routing of service lines to the connection points 32,400
Flat connection point fee 13,900
Fee per square meter for the plot 69,500 (5000*13.90)
Apartment fee for first apartment 18,500
Apartment fee for Each Additional Apartment 318,500 (49*6,5000)
Fee for connection to storm water network 20,000
Total 472,800
6.7.3 Achievements
Hammarby, compared to other similar districts, has 60% lower water consumption per person.
Figure 67. The loop for handling water in Hammarby (Source: City of Stockholm, 2006.
Modified by Authors)

All storm water is also locally managed. Water consumption is reduced through the use of eco-
friendly installations, low-flush toilets, and air mixer taps. Moreover, the wastewater from Hammarby
Sjöstad passing through the Henriksdal wastewater treatment plant contains 0.13 mg phosphorus/l
which means that the phosphorus goal was achieved (GlashusEtt; Pandis&Brandt, 2011).
7. MAJOR LESSONS
This section expands on the major lessons first summarized in Section 1.2.
7.1 MAJOR LESSONS
The most important lessons to stress from Hammarby Sjöstad’s experience are:
1. Sustainable urban development requires a holistic approach and the 12 Green Guidelines offer the framework for this approach.
2. Prioritize densifying areas that are adjacent to the city, even if these are brownfields. 3. Various departments from the government, private sector, and academia must all be deeply
involved in the planning process. 4. A variety of channels (design and financial) must be used to change behaviors and mindsets: 5. Life-cycle assessments can reveal the true value of high environmental design standards.
This section will cover each of these lessons in more depth.
1. Sustainable urban development requires a holistic approach and the 12 Green Guidelines offer the
framework for this approach.
The eco-cycle strategy (the Hammarby Model, see Section 3.3) takes into account three different
energy flows to find synergies. Taking into consideration all 12 of the Green Guidelines can help with
this holistic approach. The urban form of Hammarby helped to decrease transportation emissions,
and the waste-to-energy system helped to decrease waste and improve energy efficiency.
Use integrated system solutions for material, waste, and energy: The Hammarby Model addresses
energy, waste, water, and sewage. This also means that environmental and infrastructure plans for
this area have been developed jointly by three city agencies: the Stockholm Water Company, the
energy company Fortum, and the Stockholm Waste Management Administration. The model has
become internationally renowned since it consumes inflowing resources and discards outflowing
wastes into a cyclical system that optimizes the use of resources and minimizes waste. There are a
number of synergies. For example, the storm water solutions are both aesthetically pleasing and have
created great public spaces for residents to enjoy.
Set holistic and clear environmental goals: In 1996, the governing politicians of Stockholm
implemented environmental goals in order to have a chance of hosting the Olympic is 2004. A strict
environmental program was drawn up with the aim of achieving a 50% reduction in the overall
environmental impact in comparison with a “normal” district built in the beginning 1990s. The
environmental goals cover all the key categories of urban form, transportation, and energy and
resources. The goals also worked as a quality assurance in order to make sure that the developers had
delivered the quality they had promised.
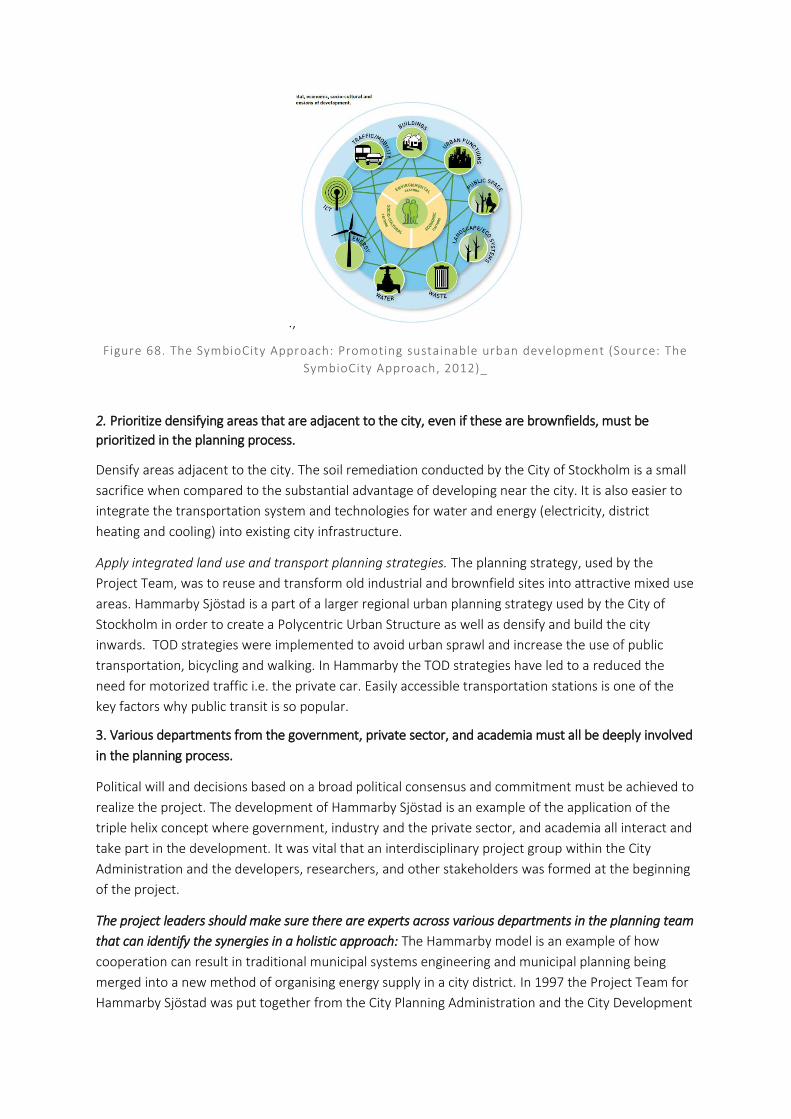
.,
Figure 68. The SymbioCity Approach: Promoting sustainable urban development (Source: The
SymbioCity Approach, 2012)_
2. Prioritize densifying areas that are adjacent to the city, even if these are brownfields, must be
prioritized in the planning process.
Densify areas adjacent to the city. The soil remediation conducted by the City of Stockholm is a small
sacrifice when compared to the substantial advantage of developing near the city. It is also easier to
integrate the transportation system and technologies for water and energy (electricity, district
heating and cooling) into existing city infrastructure.
Apply integrated land use and transport planning strategies. The planning strategy, used by the
Project Team, was to reuse and transform old industrial and brownfield sites into attractive mixed use
areas. Hammarby Sjöstad is a part of a larger regional urban planning strategy used by the City of
Stockholm in order to create a Polycentric Urban Structure as well as densify and build the city
inwards. TOD strategies were implemented to avoid urban sprawl and increase the use of public
transportation, bicycling and walking. In Hammarby the TOD strategies have led to a reduced the
need for motorized traffic i.e. the private car. Easily accessible transportation stations is one of the
key factors why public transit is so popular.
3. Various departments from the government, private sector, and academia must all be deeply involved
in the planning process.
Political will and decisions based on a broad political consensus and commitment must be achieved to
realize the project. The development of Hammarby Sjöstad is an example of the application of the
triple helix concept where government, industry and the private sector, and academia all interact and
take part in the development. It was vital that an interdisciplinary project group within the City
Administration and the developers, researchers, and other stakeholders was formed at the beginning
of the project.
The project leaders should make sure there are experts across various departments in the planning team
that can identify the synergies in a holistic approach: The Hammarby model is an example of how
cooperation can result in traditional municipal systems engineering and municipal planning being
merged into a new method of organising energy supply in a city district. In 1997 the Project Team for
Hammarby Sjöstad was put together from the City Planning Administration and the City Development
Administration. The team comprised people with different expertise and had all different
responsibilities within the project. Cooperation between the team members helped to make
Hammarby successful.
4. A variety of channels (design and financial) must be used to change behaviors and mindsets.
The growing interest in environmental solutions led to the decision to build an environmental
information center – GlashusEtt. The center was designed to consume only 50% of the energy used by
a conventional glass building. Smart-house technology adjusts the building’s lighting, ventilation, and
heating in line with current levels of activity. GlashusEtt is backed by the Development Administration,
Stockholm Water, and Fortum Energy, which is jointly owned by the City of Stockholm. The Traffic and
Waste Management Administration is also a co-partner.
GlashusEtt was an important part of the major environmental initiative from the City of Stockholm. It
functions as an information center for both residents and visitors. Residents can get advice and
recommendations on how to create a more environmental friendly lifestyle and visitors can have a
look at the different technologies installed in the building.
5. Using life-cycle assessments can reveal the true value of high environmental design standards.
Using life-cycle cost analysis in planning decisions helped to justify the added cost of higher
environmental design standards.
A continuous evaluation process is required to analyze enhancement of different technologies. The
importance to follow up how the different technologies have performed is a key aspect in order to
push the building standards for environmental friendly solutions.
It is important to reevaluate, update, and follow-up. In Hammarby Sjöstad the use of the
environmental tools Environmental Load Profile and Life-Cycle Assessment have contributed to
feedback on the environmental performance of the built environment and have also helped to justify
the added cost of higher environmental design standards. New goals based on changes in technology
have also been added so that Hammarby’s environmental performance is not stagnant.
Updated models are being created with the experience from Hammarby Sjöstad, in order to enhance
and further develop other areas in Stockholm e.g. the Royal Seaport development. International
certification systems are also beginning to be used.
7.2 OVERCOMING CHALLENGES
The Hammarby project is not yet fully completed, but there have been several evaluations of the
project. The evaluations have looked at the strengths and weakness of Hammarby’s development
strategy. These challenges are outlined here. It is important that local governments and developers
learn from mistakes so that they can be fixed or prevented in the future.
Problems and challenges for Hammarby Sjöstad:
The environmental program began too late in the planning process. This resulted in contradictions
between different goals in the project, and difficulties in the implementing the environmental
program (Rutherford, 2013).
There was a conflict of environmental goals with livability preferences: The planners wanted to achieve
ambitious environmental goals but also integrate the housing area into the natural surroundings.
Many green spaces and parks were planned and a good view on the Hammarby Lake was important
for the design of many buildings. Many windows therefore face the lake but this also has the negative
effect that it can affect the temperature in the apartments as heat radiates through the windows. ln
summer, temperatures can reach high levels because of poor air circulation in some of the buildings
(Poldermans, 2005).
An even more important issue concerning the apartment windows is their sheer size. The use of
glass in modern apartments is common and large windows are often desired by the inhabitants.
However, in an environmentally sustainable housing project, large windows do not fit into the
strategy to reduce energy use. Even if the windows were four layers thick to provide adequate
insulation, a wall is still up to five times better for conserving heat (Poldermans, 2005).
The parking cap has become controversial. Another important change in the remainder of the project
concerns car parking spaces. There have been a number of discussions about the number of parking
spaces as well as their location. With the initial environmental goals, reliance on private vehicles was
planned to be significantly reduced in Hammarby Sjöstad. The initial car parking standards were very
stringent: 0.25 parking spaces per apartment (0.4 if guest and workplace parking were included).
However, a new political party took over and the parking situation became politicized. It was soon
decided to raise the number of parking places in Hammarby Sjöstad to 0.7 per apartment. This
measure was in conflict with the environmental goals to reduce emissions and could also form an
obstacle to raise the mode share for public transit (Poldermans, 2005).
Follow-up of the goals has shown a lack of systematic gathering of data and results. It is also evident
that there was nothing written in the environmental program of Hammarby Sjöstad from 1996 that
outlined follow-up for evaluating the goals and who should take responsibility for the evaluation
(Rutherford, 2013).
REFERENCES André, Fredrik. 2015. Interview.
“Bicycle Paths in Hammarby Sjöstad.” n.d. Reseplanerare. http://reseplanerare.trafiken.nu
/bin/query.exe/sn?L=vs_bikealone.
Bostader, Svenska. n.d. “Real Estate Unit ‘Viken’” http://www.erseus.se/viewNavMenu
.do?menuID=9&oid=375.
Boverket. 2009. “39 Goda Exempel På Hållbart Byggande Ifrån Bygga-Bo-Dialogen .”
———. 2015. “Standard and Extended Planning Procedure.” http://www.boverket.se/sv/PBL-
kunskapsbanken/detaljplanering/detaljplaneprocessen/standardforfarande/.
Bäckström, Susanne. 2012. “Hammarby Sjöstad.” Sweco.
Cervero, Robert, and Cathleen Sullivan. 2010. “Toward Green TODs.” Institute of Transportation
Studies, University of California Berkeley. http://www.its.berkeley.edu/sites/default/files
/publications/UCB/2010/VWP/UCB-ITS-VWP-2010-7.pdf.
City of Stockholm. 2014. “Gångplan För Stockholm. Remisshandling.”
“Eco2 Cities: Ecological Cities as Economic Cities, Case Stockholm, Sweden.” 2010. The World Bank.
“Facts and Figures.” 2015. The City of Stockholm. http://bygg.stockholm.se/Alla-projekt
/hammarby-sjostad/In-english/Facts-and-figures/.
Foletta, Nicole. 2011. “Case Study: Hammarby Sjöstad.” ITDP.
Forsberg. 2003. “Environmental Assessment of the Urban Environment – Development and First
Application of the Environmental Load Profile for Hammarby Sjöstad.” Department of Chemical
Engineering and Technology, The Royal institute of Technology.
Fryxell, Stellan. 2008. “Hammarby- a Model for Green Living?”
Gaffney, Andrea, Vinita Huang, Kristin Maravilla, and Nadine Souboutin. 2007. “Hammarby Sjöstad-
Stockholm, Sweden: A Case Study.” Urban Design in Planning.
GlashusEtt. 2010. “GlashusEtt 10 år.” City of Stockholm, Stockholm Water and Fortum.
———. n.d. “Hammarby Sjöstad – a New City District with Emphasis on Water and Ecology.” City of
Stockholm.
“Good Environmental Choice ‘Bra Miljöval.’” n.d. Ecolabel Index. http://www.ecolabelindex
.com/ecolabel/good-environmental-choice-bra-miljoval.
“Hammarby Sjostad, Stockholm, Sweden, 1995 to 2015- Building a `Green’ City Extension.” n.d. Future
Communities. http://www.futurecommunities.net/case-studies/hammarby-sjostad-stockholm-
sweden-1995-2015.
“Kommunikationer I Sjöstaden.” 2013. Sjostadsliv. March 20. http://www.sjostadsliv.se/guide
/kommunikationer/.
LIP Office. 2004. “Final Report: 1.2 Development and Demonstration Projects.” Local Investment
Program Stockholm.
“Low Impact Development (LID).” n.d. Environmental Protection Agency. http://water.epa
.gov/polwaste/green/.
Magnusson, Kristin, and Michaela Nilsson. n.d. “Swedish Project Management Towards Sustainable
Urban Development.” Stockholm, Sweden: The Royal Institute of Technology.
“Movac--Mobile Vacuum Systems.” n.d. Envac. http://www.envacgroup.com/products-and-
services/our_products/movac-mobile-vacuum-systems.
“NCC Holmen.” 2015. Solcell. http://www.solcell.nu/ViewPlant.aspx?pl_id=155.
“Norra Djurgårdsstaden.” 2015. The City of Stockholm. http://bygg.stockholm.se/Alla-projekt
/norra-djurgardsstaden/.
“Planning Process (Planprocessen).” n.d. Stockholms Stad. http://www.stockholm.se
/TrafikStadsplanering/Stadsutveckling/Stadsplanering/Planprocessen/.
Poldermans, C. 2005. “The Case of Hammarby Sjöstad.” Institute of Human Geography. University of
Stockholm.
“Processen – Så Går Det till.” 2015. The City of Stockholm. http://bygg.stockholm.se/Sa-vaxer-
staden/Dialog-och-samrad/Processen/?acceptcookies=true.
Reyn. 2012. “Phase 02: Hammarby Sjöstad [Transportation System].” Remote Conditions. June 25.
http://remoteconditions.blogspot.se/2012/06/phase-02-hammarby-sjostad.html.
Rutherford, Jonathan. 2013. “Hammarby Sjöstad and the Rebundling of Infrastructure Systems in
Stockholm.” In. Paris. http://www.enpc.fr/sites/default/files/files/Rutherford%20Hammarby
%20Sjöstad%20121213.pdf.
SABO. 2009. “Hem För Miljoner. Förutsättningar För Upprustning Av Miljonprogrammet –
Rekordårens Bostäder.” http://www.sabo.se/SiteCollectionDocuments/hemformiljoner
_rapport_lu.pdf.
Sayegh, Safi Al, Tobias Bengtsson, Nenad Glodic, and Catharina Erlich. 2012. “Solar Energy in
Hammarby Sjöstad.”
“Skattesatser 2015 I Kommuner, Län Och Hela Riket .” 2015. Statistical Central Bureau.
http://www.scb.se/sv_/Hitta-statistik/Statistik-efter-amne/Offentlig-ekonomi/Finanser-for-den-
kommunala-sektorn/Kommunalskatterna/11849/11856/67873/.
“Stationary Vacuum System.” n.d. Envac. http://www.envacgroup.com/products-and-
services/our_products/envac-stationary-vacuum-system.
Stockholm LIP. 2003. “Verksamhetsrapport.”
Svane. 2014, August 26.
Svane, O, J Wangel, L.A Engberg, and J Palm. 2011. “Compromise and Learning When Negotiating
Sustainability: The Brownfield Development of Hammarby Sjöstad.” International Journal of Urban
Sustainable Development.
Svane, Orjan. 2013. “Energy Efficiency in Hammarby Sjöstad, Stockholm through ICT and Smarter
Infrastructure – Survey and Potentials.” KTH Royal Institute of Technology, Environmental Strategies
Research.
Swedish Green Building Council. 2015. “Vår Verksamhet.” https://www.sgbc.se/var-verksamhet/.
SymbioCity. 2011. “The SymbioCity Approach- a Conceptual Framework for Sustainable Urban
Development.” SKL International.
The City of Stockholm. 2012. “Cykelplan.” [http://www.stockholm.se/cykla.
The City Planning Administration. n.d. “Kvalitetsprogram För Gestaltning Av Sicka Kaj.”
The Development Administration. 2007. “Slutrapport För Projekt Inom Miljömiljarden.”
“The Million Program.” 2015. The Swedish National Board of Housing.
http://www.boverket.se/sv/samhallsplanering/stadsutveckling/miljonprogrammet/.
The National Board of Housing. 2013. “Swedish National Board of Housing, Building and Planning.”
The Street and Real Estate Administration. 2002. “Hammarby Sjöstad – BoStad02.”
The Swedish Environmental Protection Agency. 2005. “Sju år Med LIP & Klimp.”
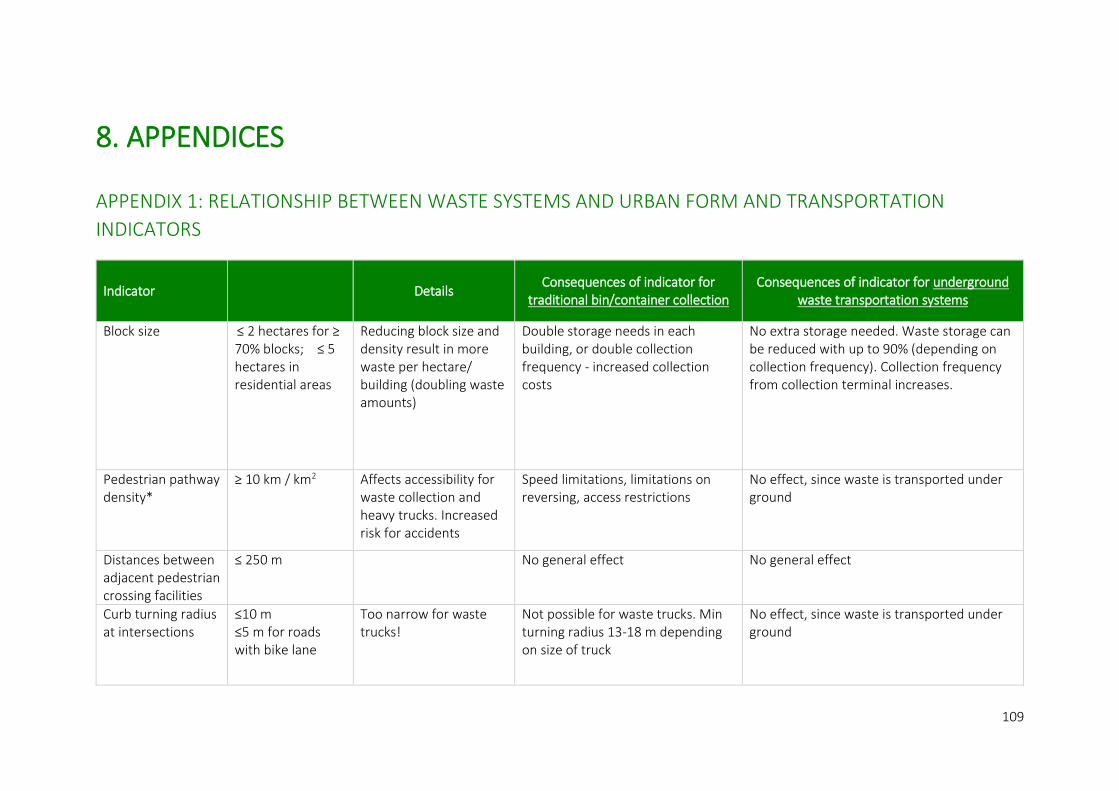
109
8. APPENDICES
APPENDIX 1: RELATIONSHIP BETWEEN WASTE SYSTEMS AND URBAN FORM AND TRANSPORTATION
INDICATORS
Indicator Details Consequences of indicator for
traditional bin/container collection Consequences of indicator for underground
waste transportation systems
Block size ≤ 2 hectares for ≥ 70% blocks; ≤ 5 hectares in residential areas
Reducing block size and density result in more waste per hectare/ building (doubling waste amounts)
Double storage needs in each building, or double collection frequency - increased collection costs
No extra storage needed. Waste storage can be reduced with up to 90% (depending on collection frequency). Collection frequency from collection terminal increases.
Pedestrian pathway density*
≥ 10 km / km2 Affects accessibility for waste collection and heavy trucks. Increased risk for accidents
Speed limitations, limitations on reversing, access restrictions
No effect, since waste is transported under ground
Distances between adjacent pedestrian crossing facilities
≤ 250 m No general effect No general effect
Curb turning radius at intersections
≤10 m ≤5 m for roads with bike lane
Too narrow for waste trucks!
Not possible for waste trucks. Min turning radius 13-18 m depending on size of truck
No effect, since waste is transported under ground
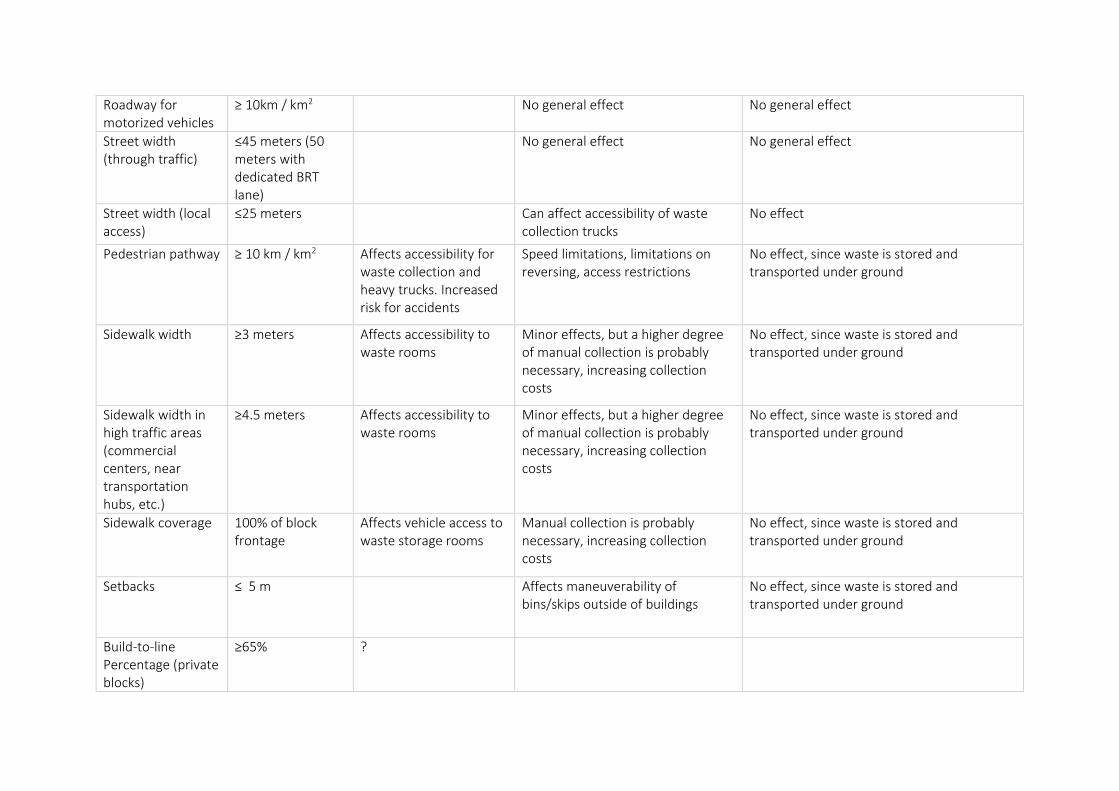
Roadway for motorized vehicles
≥ 10km / km2 No general effect No general effect
Street width (through traffic)
≤45 meters (50 meters with dedicated BRT lane)
No general effect No general effect
Street width (local access)
≤25 meters Can affect accessibility of waste collection trucks
No effect
Pedestrian pathway ≥ 10 km / km2 Affects accessibility for waste collection and heavy trucks. Increased risk for accidents
Speed limitations, limitations on reversing, access restrictions
No effect, since waste is stored and transported under ground
Sidewalk width ≥3 meters Affects accessibility to waste rooms
Minor effects, but a higher degree of manual collection is probably necessary, increasing collection costs
No effect, since waste is stored and transported under ground
Sidewalk width in high traffic areas (commercial centers, near transportation hubs, etc.)
≥4.5 meters Affects accessibility to waste rooms
Minor effects, but a higher degree of manual collection is probably necessary, increasing collection costs
No effect, since waste is stored and transported under ground
Sidewalk coverage 100% of block frontage
Affects vehicle access to waste storage rooms
Manual collection is probably necessary, increasing collection costs
No effect, since waste is stored and transported under ground
Setbacks ≤ 5 m Affects maneuverability of bins/skips outside of buildings
No effect, since waste is stored and transported under ground
Build-to-line Percentage (private blocks)
≥65% ?
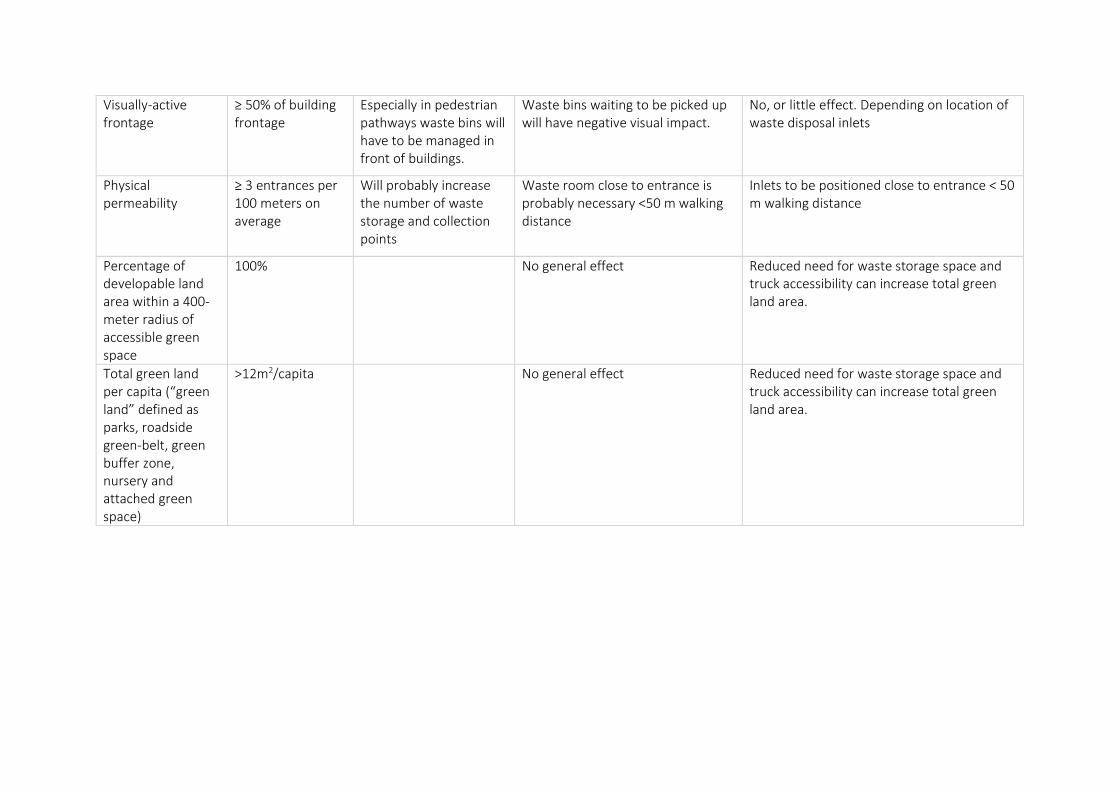
Visually-active frontage
≥ 50% of building frontage
Especially in pedestrian pathways waste bins will have to be managed in front of buildings.
Waste bins waiting to be picked up will have negative visual impact.
No, or little effect. Depending on location of waste disposal inlets
Physical permeability
≥ 3 entrances per 100 meters on average
Will probably increase the number of waste storage and collection points
Waste room close to entrance is probably necessary <50 m walking distance
Inlets to be positioned close to entrance < 50 m walking distance
Percentage of developable land area within a 400-meter radius of accessible green space
100% No general effect Reduced need for waste storage space and truck accessibility can increase total green land area.
Total green land per capita (“green land” defined as parks, roadside green-belt, green buffer zone, nursery and attached green space)
>12m2/capita No general effect Reduced need for waste storage space and truck accessibility can increase total green land area.
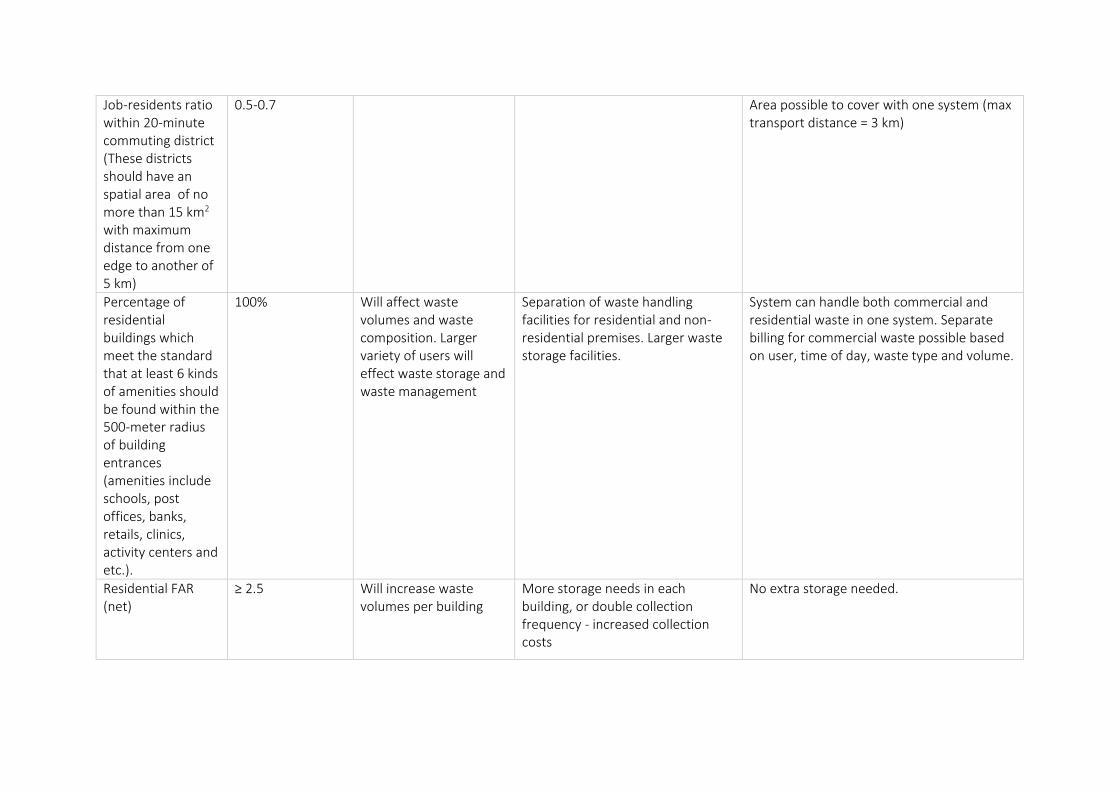
Job-residents ratio within 20-minute commuting district (These districts should have an spatial area of no more than 15 km2 with maximum distance from one edge to another of 5 km)
0.5-0.7 Area possible to cover with one system (max transport distance = 3 km)
Percentage of residential buildings which meet the standard that at least 6 kinds of amenities should be found within the 500-meter radius of building entrances (amenities include schools, post offices, banks, retails, clinics, activity centers and etc.).
100% Will affect waste volumes and waste composition. Larger variety of users will effect waste storage and waste management
Separation of waste handling facilities for residential and non-residential premises. Larger waste storage facilities.
System can handle both commercial and residential waste in one system. Separate billing for commercial waste possible based on user, time of day, waste type and volume.
Residential FAR (net)
≥ 2.5 Will increase waste volumes per building
More storage needs in each building, or double collection frequency - increased collection costs
No extra storage needed.
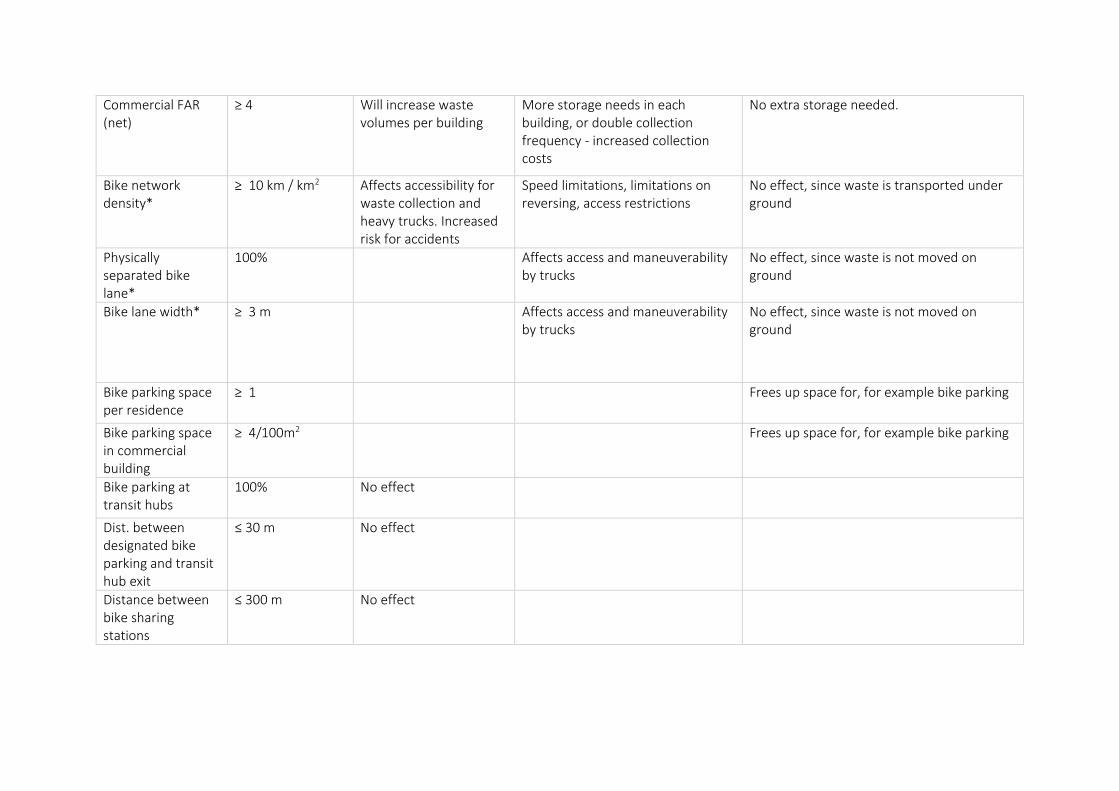
Commercial FAR (net)
≥ 4 Will increase waste volumes per building
More storage needs in each building, or double collection frequency - increased collection costs
No extra storage needed.
Bike network density*
≥ 10 km / km2 Affects accessibility for waste collection and heavy trucks. Increased risk for accidents
Speed limitations, limitations on reversing, access restrictions
No effect, since waste is transported under ground
Physically separated bike lane*
100% Affects access and maneuverability by trucks
No effect, since waste is not moved on ground
Bike lane width* ≥ 3 m Affects access and maneuverability by trucks
No effect, since waste is not moved on ground
Bike parking space per residence
≥ 1 Frees up space for, for example bike parking
Bike parking space in commercial building
≥ 4/100m2 Frees up space for, for example bike parking
Bike parking at transit hubs
100% No effect
Dist. between designated bike parking and transit hub exit
≤ 30 m No effect
Distance between bike sharing stations
≤ 300 m No effect
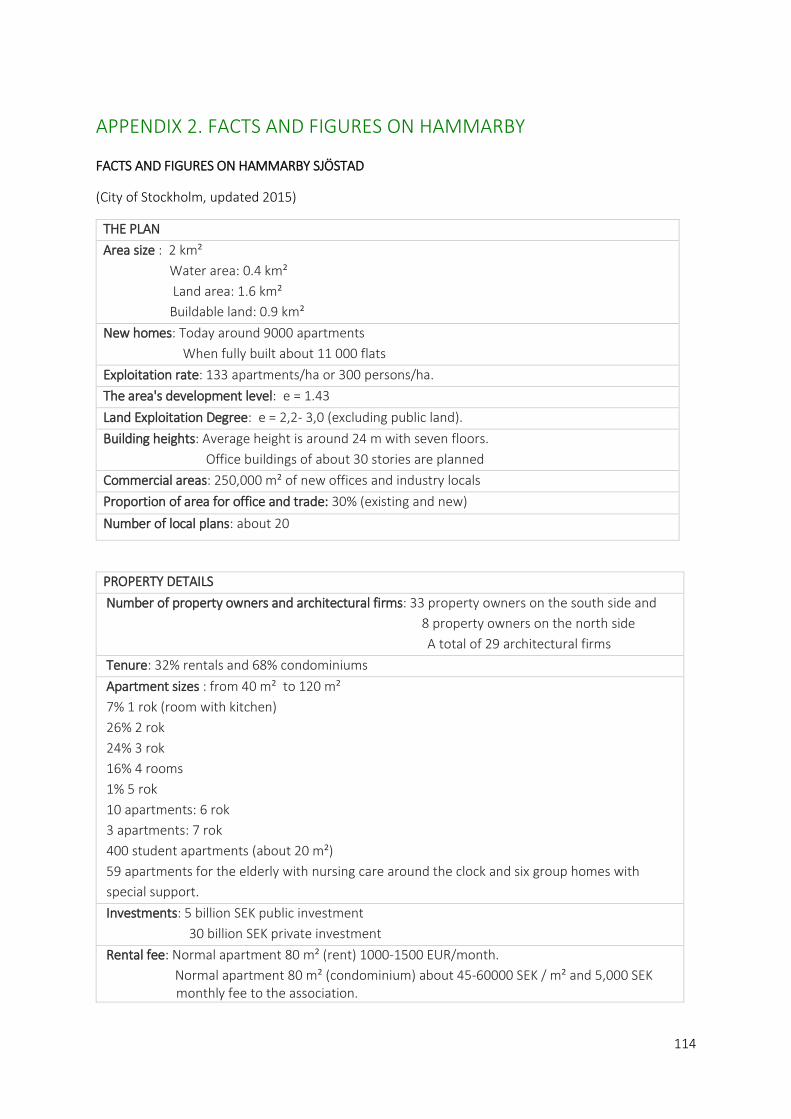
114
APPENDIX 2. FACTS AND FIGURES ON HAMMARBY
FACTS AND FIGURES ON HAMMARBY SJÖSTAD
(City of Stockholm, updated 2015)
THE PLAN
Area size : 2 km²
Water area: 0.4 km²
Land area: 1.6 km²
Buildable land: 0.9 km²
New homes: Today around 9000 apartments
When fully built about 11 000 flats
Exploitation rate: 133 apartments/ha or 300 persons/ha.
The area's development level: e = 1.43
Land Exploitation Degree: e = 2,2- 3,0 (excluding public land).
Building heights: Average height is around 24 m with seven floors.
Office buildings of about 30 stories are planned
Commercial areas: 250,000 m² of new offices and industry locals
Proportion of area for office and trade: 30% (existing and new)
Number of local plans: about 20
PROPERTY DETAILS
Number of property owners and architectural firms: 33 property owners on the south side and
8 property owners on the north side
A total of 29 architectural firms
Tenure: 32% rentals and 68% condominiums
Apartment sizes : from 40 m² to 120 m²
7% 1 rok (room with kitchen)
26% 2 rok
24% 3 rok
16% 4 rooms
1% 5 rok
10 apartments: 6 rok
3 apartments: 7 rok
400 student apartments (about 20 m²)
59 apartments for the elderly with nursing care around the clock and six group homes with
special support.
Investments: 5 billion SEK public investment
30 billion SEK private investment
Rental fee: Normal apartment 80 m² (rent) 1000-1500 EUR/month.
Normal apartment 80 m² (condominium) about 45-60000 SEK / m² and 5,000 SEK monthly fee to the association.
GREEN AND PUBLIC SPACE
Goal: To set aside 25 m² of free space per apartment (corresponding to a total 0.3 km²) and
15 m² of private farm land per apartment. Currently: 0.28 km² completed
(excluding private farm land).
Car parking: 4 000 parking spaces in garages (private and public: 0.55/apartment)
3 000 street parking spaces (public spaces: 0.15/apartment)
POPULATION DATA - Residents - Ages - Income - Unemployment
Population: Today about 20 400 people
At completion about 27 500 people (in year 2025)
Average household size: 2.27 (2.19 condominium and 2.37 rentals)
Average apartment size: condominium 3 rok
rentals 2.7 rok
Age: 0-5 year 13.5%
6-15 year 7.6%
16-19 year 2.6%
20-64 year 69.8%
65 and above 6.6%
Average income (2014): 421 000 SEK / year. Average of the city 332 000 SEK / year (persons aged 16
and over)
Unemployment (2014): 1.7%
Average in the city 3.7%
Number of workers (2013): 8,000 people
EDUCATION AND CULTURE
8 primary schools (6-16 years) approximately 2,500 children
2 more schools are planned for at least 625 children
17 kindergartens (1-5 years) is today available for approximately 2 030 children
2 High-schools in the area (Kulturama and Fryshuset)
Other amenities: Library, Civic / theater, chapel (Swedish Church), Environmental Resource Center
SOCIAL SERVICES AND CATEGORY ACCOMMODATION
Retirement homes: 59 apartment with attention and care around the clock
Homes for the mentally retarded: 6 homes with 5 apartments in each home
Student Apartments: 400 apartments
Others: Care center, maternal and child care
CAR OWNERSHIP
Percentage of households with a car: 62% (2007)
(66% in year 2005)
Number of cars per household: 0.7 (2007)

(0.75 in year 2005)
Carpool Operations: 3 companies with 46 green cars
available
COMMUNICATIONS - Mode of the daily trips
Public transport: 52%
Private car: 21%
Walking and Cycling: 27%
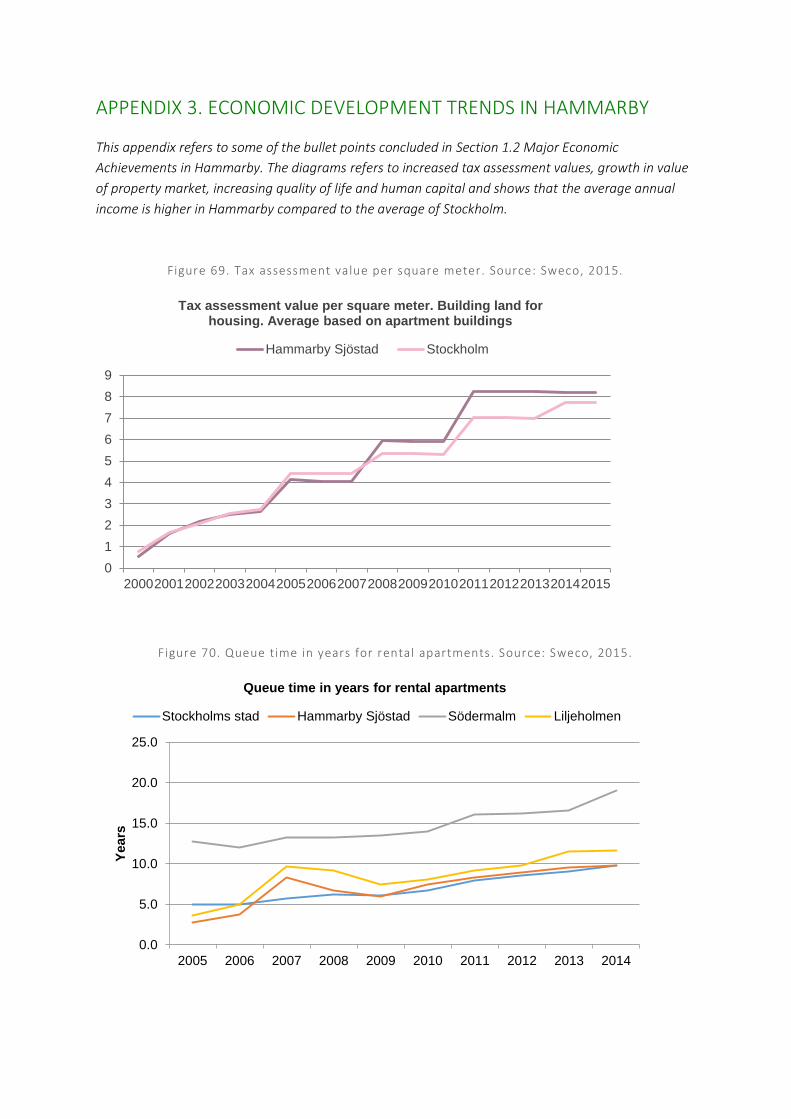
APPENDIX 3. ECONOMIC DEVELOPMENT TRENDS IN HAMMARBY
This appendix refers to some of the bullet points concluded in Section 1.2 Major Economic
Achievements in Hammarby. The diagrams refers to increased tax assessment values, growth in value
of property market, increasing quality of life and human capital and shows that the average annual
income is higher in Hammarby compared to the average of Stockholm.
Figure 69. Tax assessment value per square meter. Source: Sweco, 2015.
Figure 70. Queue time in years for rental apartments. Source: Sweco, 2015.
0
1
2
3
4
5
6
7
8
9
2000200120022003200420052006200720082009201020112012201320142015
Tax assessment value per square meter. Building land for housing. Average based on apartment buildings
Hammarby Sjöstad Stockholm
0.0
5.0
10.0
15.0
20.0
25.0
2005 2006 2007 2008 2009 2010 2011 2012 2013 2014
Years
Queue time in years for rental apartments
Stockholms stad Hammarby Sjöstad Södermalm Liljeholmen
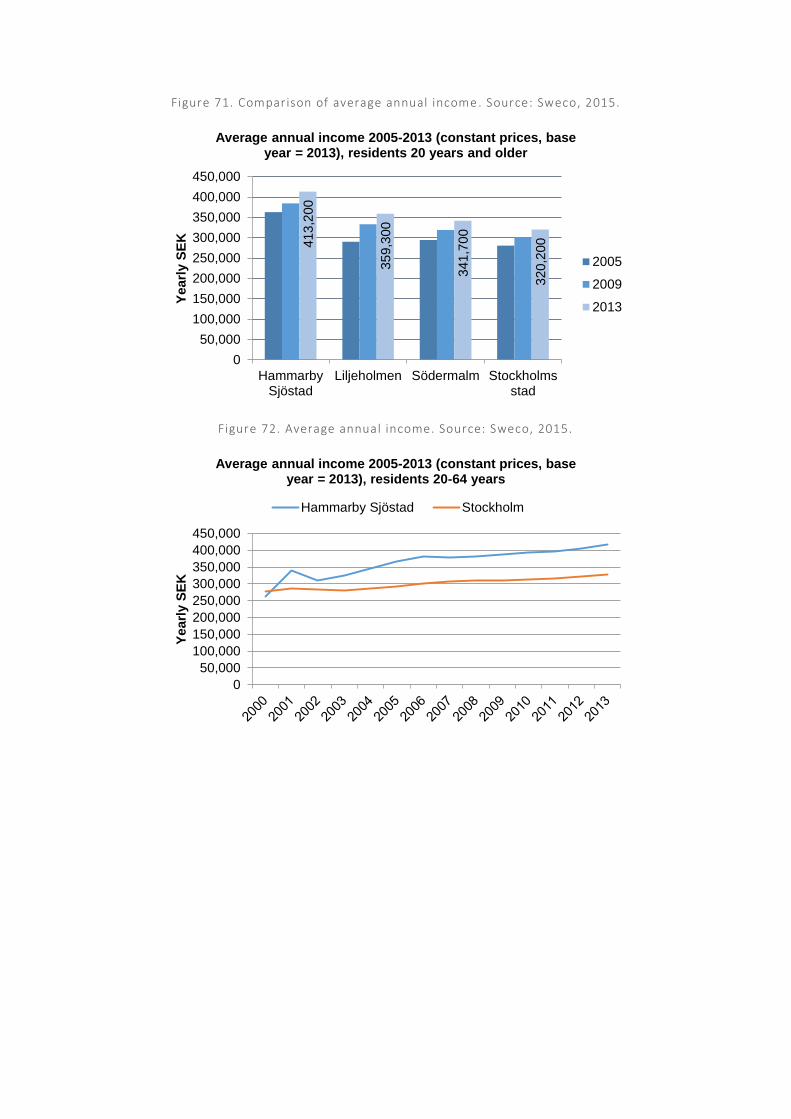
Figure 71. Comparison of average annual income . Source: Sweco, 2015.
Figure 72. Average annual income. Source: Sweco, 2015.
413,2
00
359,3
00
341,7
00
320,2
00
0
50,000
100,000
150,000
200,000
250,000
300,000
350,000
400,000
450,000
HammarbySjöstad
Liljeholmen Södermalm Stockholmsstad
Yearl
y S
EK
Average annual income 2005-2013 (constant prices, base year = 2013), residents 20 years and older
2005
2009
2013
0
50,000
100,000
150,000
200,000
250,000
300,000
350,000
400,000
450,000
Yearl
y S
EK
Average annual income 2005-2013 (constant prices, base year = 2013), residents 20-64 years
Hammarby Sjöstad Stockholm
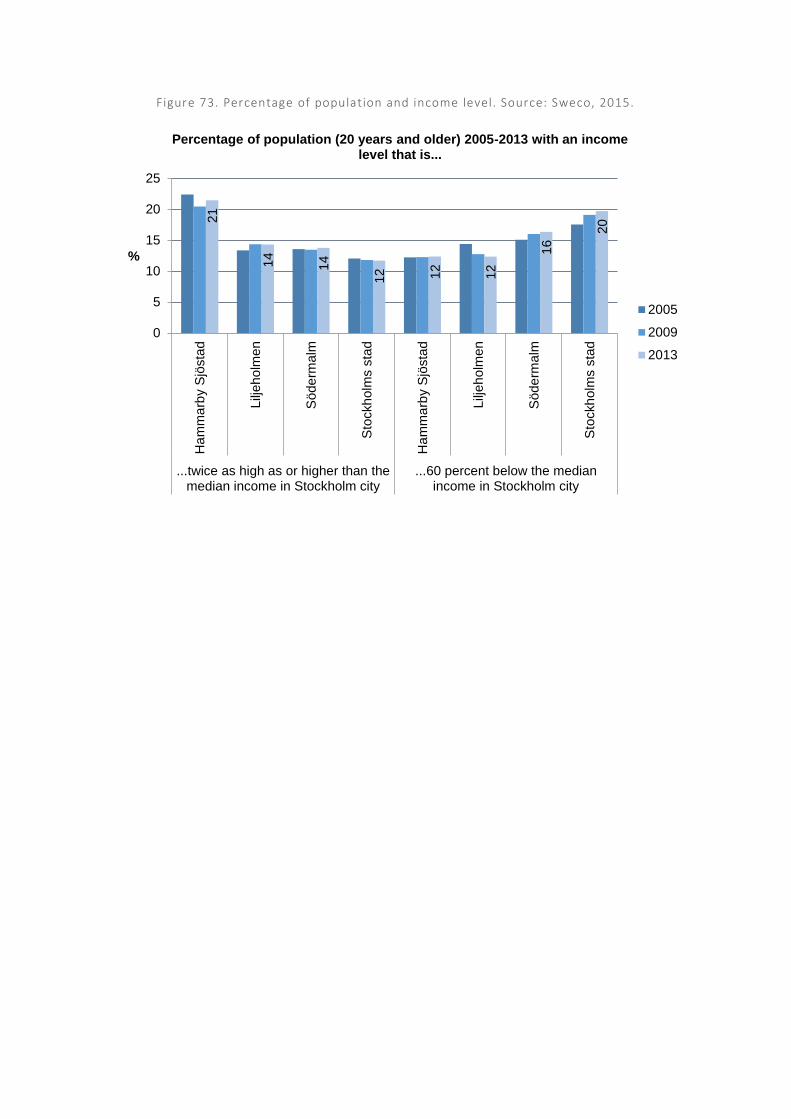
Figure 73. Percentage of population and income level. Source: Sweco, 2015.
21
14
14
12 12
12
16
20
0
5
10
15
20
25
Ha
mm
arb
y S
jösta
d
Lilj
eh
olm
en
Söde
rmalm
Sto
ckh
olm
s s
tad
Ha
mm
arb
y S
jösta
d
Lilj
eh
olm
en
Söde
rmalm
Sto
ckh
olm
s s
tad
...twice as high as or higher than themedian income in Stockholm city
...60 percent below the medianincome in Stockholm city
%
Percentage of population (20 years and older) 2005-2013 with an income level that is...
2005
2009
2013
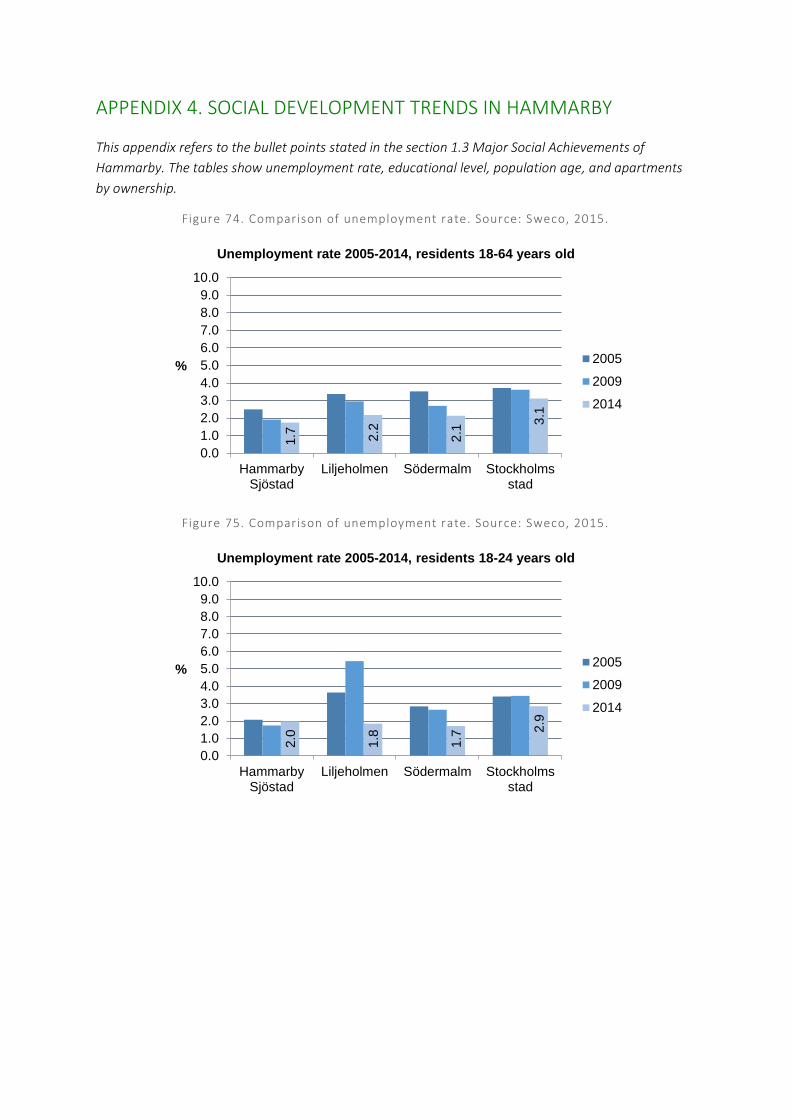
APPENDIX 4. SOCIAL DEVELOPMENT TRENDS IN HAMMARBY
This appendix refers to the bullet points stated in the section 1.3 Major Social Achievements of
Hammarby. The tables show unemployment rate, educational level, population age, and apartments
by ownership.
Figure 74. Comparison of unemployment rate. Source: Sweco, 2015.
Figure 75. Comparison of unemployment rate. Source: Sweco, 2015.
1.7 2.2
2.1
3.1
0.0
1.0
2.0
3.0
4.0
5.0
6.0
7.0
8.0
9.0
10.0
HammarbySjöstad
Liljeholmen Södermalm Stockholmsstad
%
Unemployment rate 2005-2014, residents 18-64 years old
2005
2009
2014
2.0
1.8
1.7
2.9
0.0
1.0
2.0
3.0
4.0
5.0
6.0
7.0
8.0
9.0
10.0
HammarbySjöstad
Liljeholmen Södermalm Stockholmsstad
%
Unemployment rate 2005-2014, residents 18-24 years old
2005
2009
2014
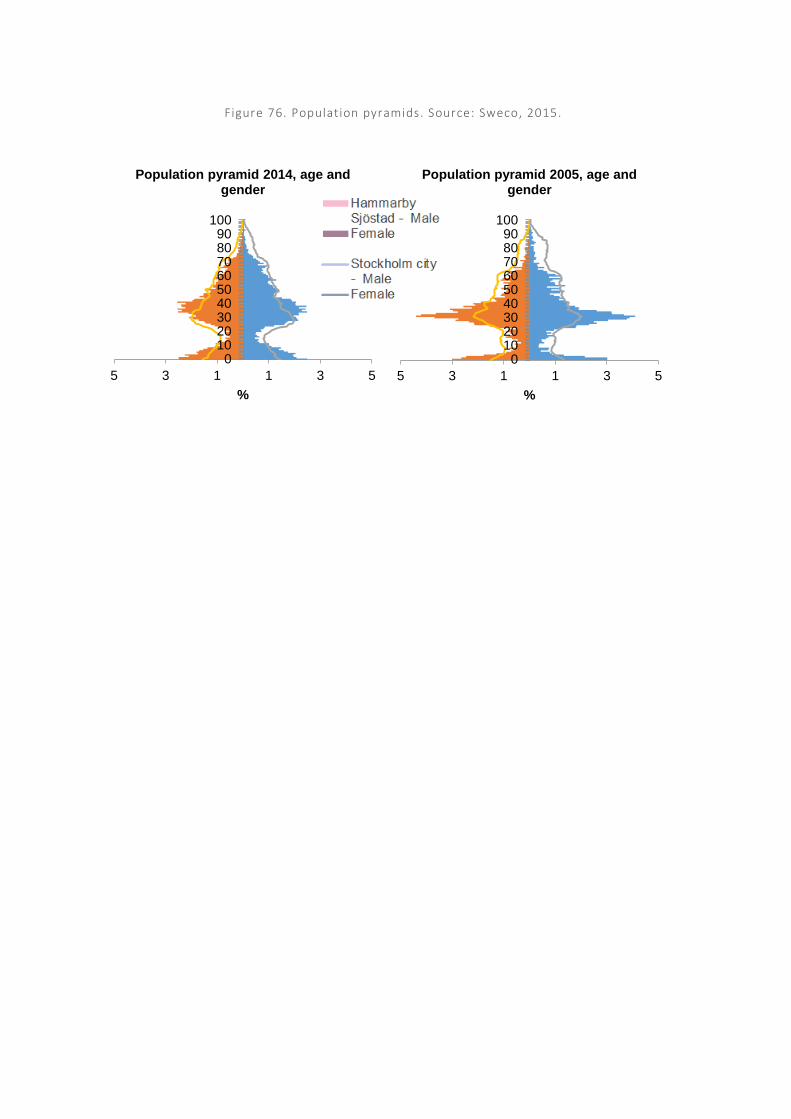
5 3 1 1 3 5
0102030405060708090
100
%
Population pyramid 2014, age and gender
5 3 1 1 3 5
0102030405060708090
100
%
Population pyramid 2005, age and gender
Figure 76. Population pyramids. Source: Sweco, 2015.
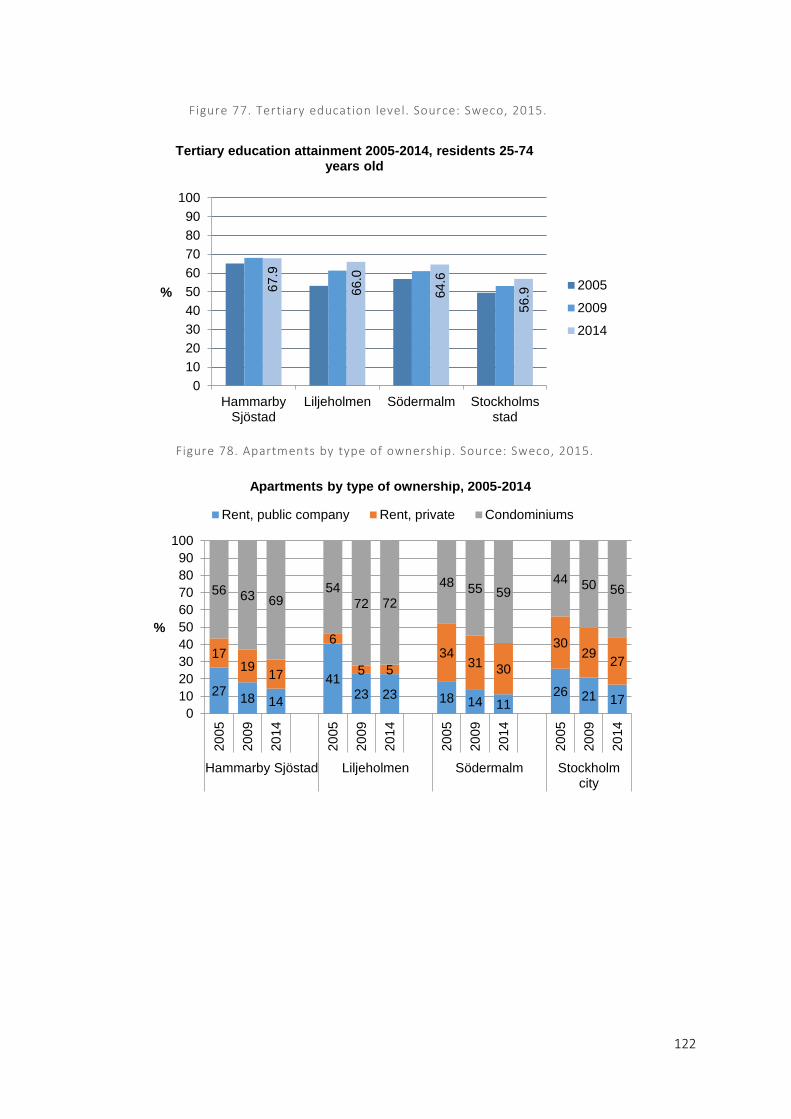
122
2718 14
4123 23 18 14 11
26 21 17
1719
17
6
5 5
3431
30
3029
27
56 63 6954
72 72
48 55 5944 50 56
0
10
20
30
40
50
60
70
80
90
100
20
05
20
09
20
14
20
05
20
09
20
14
20
05
20
09
20
14
20
05
20
09
20
14
Hammarby Sjöstad Liljeholmen Södermalm Stockholmcity
%
Apartments by type of ownership, 2005-2014
Rent, public company Rent, private Condominiums
Figure 78. Apartments by type of ownership. Source: Sweco, 2015.
67.9
66.0
64.6
56.9
0
10
20
30
40
50
60
70
80
90
100
HammarbySjöstad
Liljeholmen Södermalm Stockholmsstad
%
Tertiary education attainment 2005-2014, residents 25-74 years old
2005
2009
2014
Figure 77. Tertiary education level. Source: Sweco, 2015.
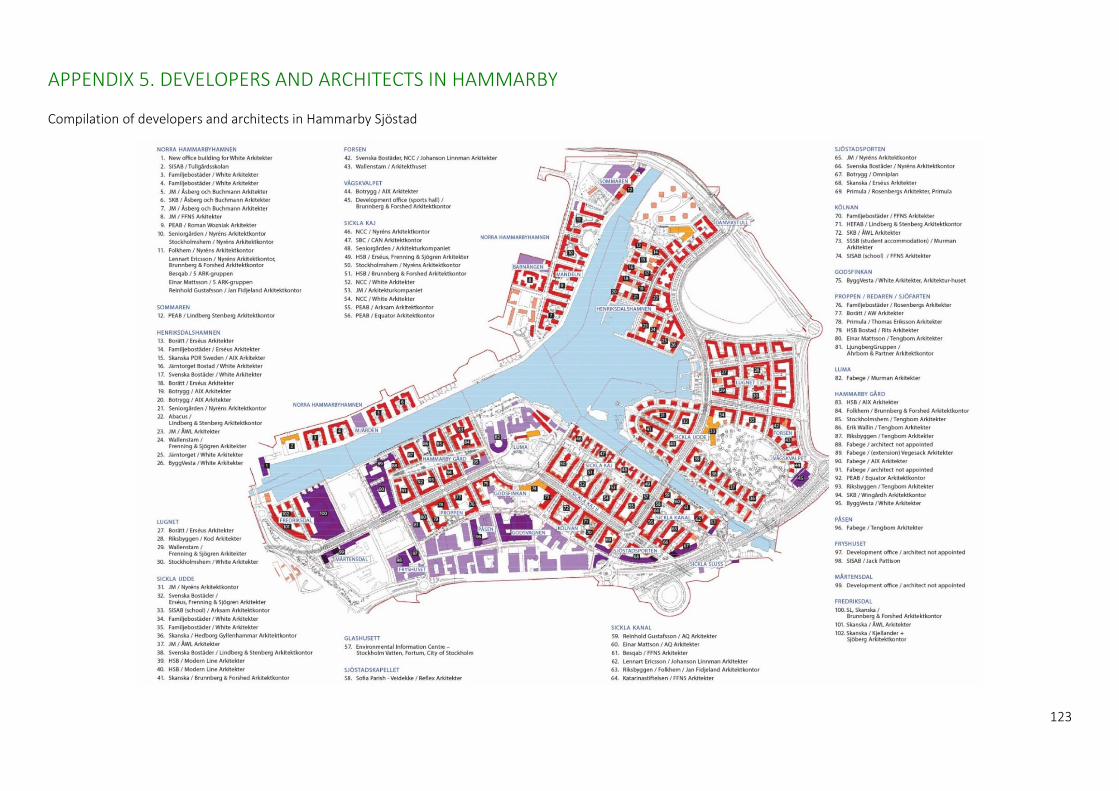
123
APPENDIX 5. DEVELOPERS AND ARCHITECTS IN HAMMARBY
Compilation of developers and architects in Hammarby Sjöstad Appendix 5
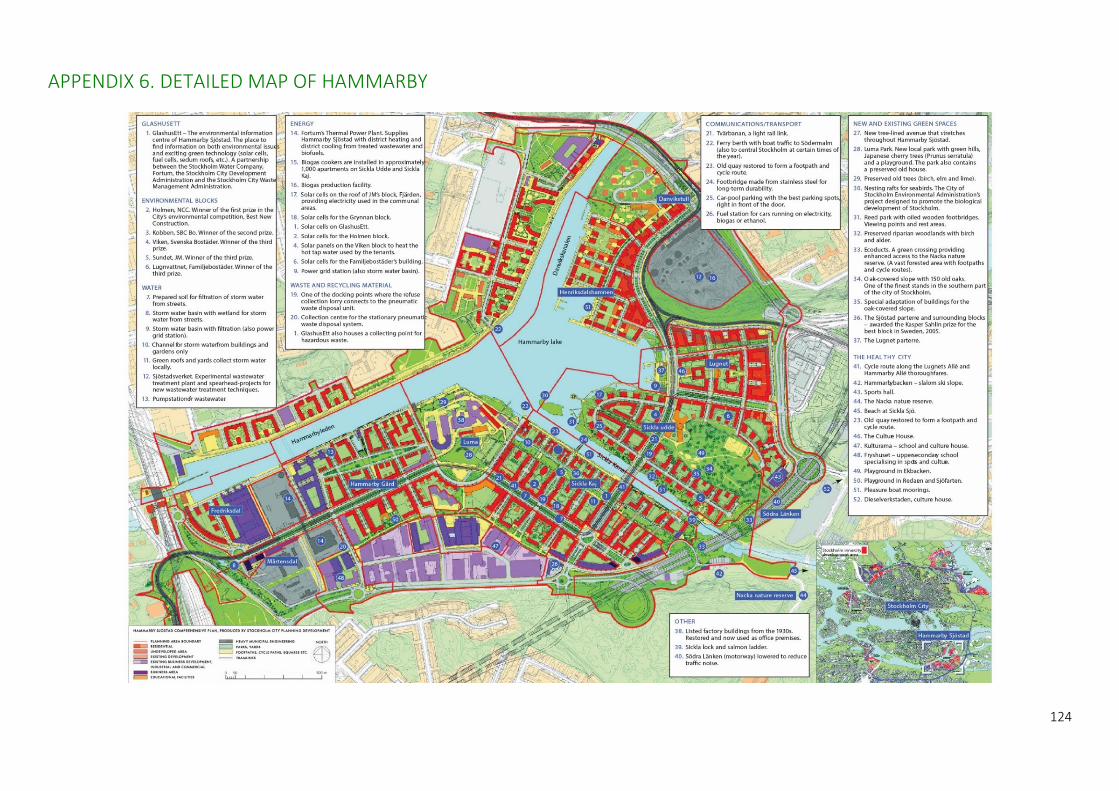
124
APPENDIX 6. DETAILED MAP OF HAMMARBY

125