Halton’s Nonprofit & Voluntary Sector Labour Force Study€™s Nonprofit & Voluntary Sector...
23
Halton’s Nonprofit & Voluntary Sector Labour Force Study WORKING PAPER SERIES No. 2 Halton Human Services Sector Labour Force Profile March 2006
Transcript of Halton’s Nonprofit & Voluntary Sector Labour Force Study€™s Nonprofit & Voluntary Sector...

Halton’s Nonprofit & Voluntary Sector Labour Force Study
WORKING PAPER SERIES
No. 2
Halton Human Services Sector Labour Force Profile
March 2006
© 2006 Community Development Halton, all rights reserved. Copies of this document may be reproduced non-commercially for the purpose of community awareness or community development with appropriate recognition to Community Development Halton (CDH). In all other cases, permission must be sought from CDH. Electronic copies of this report are available from: Community Development Halton 860 Harrington Court Burlington, ON L7N 3N4 Phone: (905) 632-1975 Fax: (905) 632-0778 Email: [email protected] Web: www.cdhalton.ca
A United Way member agency Human Resources and Skills Development Canada (HRSDC) funded this research initiative on the Halton Nonprofit and Voluntary Sector Labour Force to increase awareness of the labour force issues of this sector composed of both paid workers and volunteers.

List of Figures FIGURE 1. MATCHING ICNPA AND NAICS HUMAN SERVICES ......................................................................................5 FIGURE 2. INDUSTRY SECTORS WITH > 50% FEMALE WORKERS, HALTON, 2001............................................................7 FIGURE 3. FEMALE WORKERS BY HS SECTOR INDUSTRY GROUPS, HALTON, 2001.........................................................7 FIGURE 4. AGE DISTRIBUTION OF ALL INDUSTRY WORKERS BY GENDER, HALTON, 2001 .............................................8 FIGURE 5. AGE DISTRIBUTION OF HS WORKERS BY GENDER, HALTON, 2001 ................................................................8 FIGURE 6. AVERAGE AGE OF WORKERS BY HS SECTOR INDUSTRY GROUPS BY GENDER, HALTON, 2001 ......................9 FIGURE 7. INTERNAL MIGRANTS BY HS SECTOR INDUSTRY GROUPS, HALTON (1996-2001) ........................................10 FIGURE 8. RECENT IMMIGRANTS BY HS SECTOR INDUSTRY GROUPS, HALTON ............................................................11 FIGURE 9. VISIBLE MINORITY WORKERS BY HS SECTOR INDUSTRY GROUPS, HALTON, 2001......................................11 FIGURE 10. FULL/PART TIME WORKERS BY HS SECTOR INDUSTRY GROUPS, HALTON, 2001........................................12 FIGURE 11. HOURS WORKED (>40 HRS/WK) BY HS SECTOR INDUSTRY GROUPS, HALTON, 2001.................................13 FIGURE 12. WORKERS WITH POSTSECONDARY EDUCATION BY INDUSTRY SECTORS, HALTON, 2001 ...........................14 FIGURE 13. WORKERS WITH POSTSECONDARY EDUCATION BY HS SECTOR INDUSTRY GROUPS, HALTON, 2001...........14 FIGURE 14. WORKERS BY MAJOR FIELD OF STUDY BY ALL SECTORS AND HS SECTOR, HALTON, 2001.......................15 FIGURE 15. WORKERS BY OCCUPATIONS BY ALL SECTOR AND HS SECTOR, HALTON, 2001 ........................................16 FIGURE 16. AVERAGE EMPLOYMENT INCOME BY INDUSTRY SECTORS, HALTON, 2000 ...............................................17 FIGURE 17. AVERAGE EMPLOYMENT INCOME BY HS SECTOR INDUSTRY GROUPS, HALTON, 2000...............................18 FIGURE 18. INCOME-GENDER DIFFERENTIALS BY INDUSTRY SECTORS, HALTON, 2000 ...............................................19 FIGURE 19. INCOME-GENDER DIFFERENTIALS BY HS SECTOR INDUSTRY GROUPS, HALTON, 2000...............................20
List of Tables TABLE 1. MAJOR ACTIVITY GROUPINGS - ICNPO .........................................................................................................2 TABLE 2. HUMAN SERVICES SECTOR ACTIVITY AREAS - ICNPO...................................................................................2 TABLE 3. HUMAN SERVICES SECTOR INDUSTRY GROUP - NAICS .................................................................................4 TABLE 4. HUMAN SERVICE SECTOR SAMPLE ORGANIZATIONS ......................................................................................5

Introduction This working paper is a component of the Halton Nonprofit and Voluntary Sector Labour Force Study. The objective of the Labour Force Study is to understand the characteristics of the nonprofit and voluntary human service sector workforce, paid and nonpaid, in order to plan and invest strategically in the development of this sector’s human resources. The study findings will inform the deliberation of Halton Regional Chairman’s Roundtable on the Nonprofit and Voluntary Sector, the Halton Executive Director’s Group, and the Halton Major Funders Committee in the area of human resources planning for the nonprofit and voluntary sector. The labour force profile helps us to understand better the workforce in this important but sometimes overlooked sector. It examines the socio-demographic characteristics of the workforce in each of the industry groups within the human services sector. The profile also complements the findings of the Halton nonprofit human services survey (conducted in February and March 2006) that collects information on organization structure and status, human resources issues and challenges with both paid employees and volunteers, financial picture and pressures of the sector.
Data Source The data used to develop the labour force profile are from the 2001 Census of Population. The 2001 Census is not only the most detailed and reliable source of information on the socio-demographic characteristics of the population, it also enables a comparison to be made across time periods. However, the labour force statistics in the Census Profile Series are available only by major industry sector classification and have no cross tabulation with other socio-demographic variables. The Profile Series data are not suitable for the study of industry sub sector or industry groups such as human services. Community Development Halton (CDH) had purchased two custom tabulations of the labour force statistics from Statistics Canada. The data files contain data on labour force by detailed industry and occupation classifications cross-tabulated by selected socio-demographic variables. The cross-tabulated data are available for Canada, Ontario, Toronto, Hamilton, Peel and Halton and its four area municipalities. It is important to note that labour force statistics from the Census are related to place of residence (worker) and not place of work (employment).
Halton’s Nonprofit & Voluntary Sector Labour Force Study 1 Working Paper Series – No. 2

Defining Human Services (HS) Sector What should be included in the human services sector for this study in Halton? In order to determine which organizations/activities should be included in the human services sector in the study, the National Survey of Non-Profit and Voluntary Organizations (Statistics Canada, 2003 revised) is used as a guide. The National Survey adopts an international classification system for all nonprofit and voluntary sector organizations developed at Johns Hopkins Comparative Nonprofit Sector Project and modified for use in Canada. The modified International Classification of Nonprofit Organizations (ICNPO) identifies 15 major activity groupings (Table 1).
Table 1. Major Activity Groupings - ICNPO Group Major Activity Groupings 1 Arts and culture 2 Sports and recreation 3 Education and research 4 Universities and colleges 5 Health 6 Hospitals 7 Social Services 8 Environment 9 Development and housing 10 Law, advocacy and politics 11 Grant-making, fundraising and voluntarism promotion 12 International 13 Religion 14 Business and professional associations and unions 15 Not elsewhere classified
Among the 14 categories of organization, six categories have been selected based on their close association with the delivery of human services activities. As listed in (Table 2), the selected categories are: social services, health, development and housing, law, advocacy and politics, education and research, grant-making, fundraising, and voluntarism promotion. Within each category, certain activity areas are excluded from the study because they are less relevant to human services.
Table 2. Human Services Sector Activity Areas - ICNPO Category Activity areas Social Services • Child welfare, child services, and day-care
• Youth services and youth welfare • Family services • Services for the handicapped • Services for the elderly • Self-help and other personal social services • Disaster/emergency prevention and control • Temporary shelters • Refugee assistance • Income support and maintenance • Material assistance
Halton’s Nonprofit & Voluntary Sector Labour Force Study 2 Working Paper Series – No. 2

Health • Mental health treatment • Crisis intervention • Public health and wellness education • Health treatment, primarily outpatient
Less relevant • Rehabilitative medical services • Emergency medical services
Development and Housing
• Community and neighbourhood organization • Social development • Housing associations • Housing assistance • Job training programs • Vocational counselling and guidance • Vocational rehabilitation and sheltered workshops
Less relevant • Economic development
Law, Advocacy and politics
• Advocacy organizations • Civil rights associations • Ethnic associations • Civic associations • Legal services • Rehabilitation of offenders • Victim support
Less relevant • Consumer protection associations • Political parties and organizations
Education and research
• Adult/continuing education • Social sciences, policy studies
Less relevant • Vocational/technical schools • Science and technology
Grant-making, fundraising and voluntarism promotion
• Voluntarism promotion and support Less relevant
• Grant-making foundations • Fundraising organizations
On the other hand, Statistics Canada uses a different classification system to categorize the labour force in the Census. The North American Industry Classification System (NAICS-1997) classifies organizations solely on the basis on their economic activities. As such, no distinction is made between for-profit, nonprofit and voluntary sectors. The NAICS has a hierarchical structure. It divides the economy into 20 sectors (2-digit code). Each sector is then subdivided into sub sectors (3-digit code), industry groups (4-digit code) and industries (5-digit code). In order to identify NAICS organizations (industry groups) that provide or perform similar functions as those in the six ICNPO categories, a matching process was made at the activity area level (e.g. refugee services). Activities areas of the six ICNPO categories are entered into a keyword search process within the NAICS sectors looking for compatible industry groups or industries. For an industry group to be selected, the majority of its associated industries (5-digit code) has to provide similar ICNPO functions.
Halton’s Nonprofit & Voluntary Sector Labour Force Study 3 Working Paper Series – No. 2
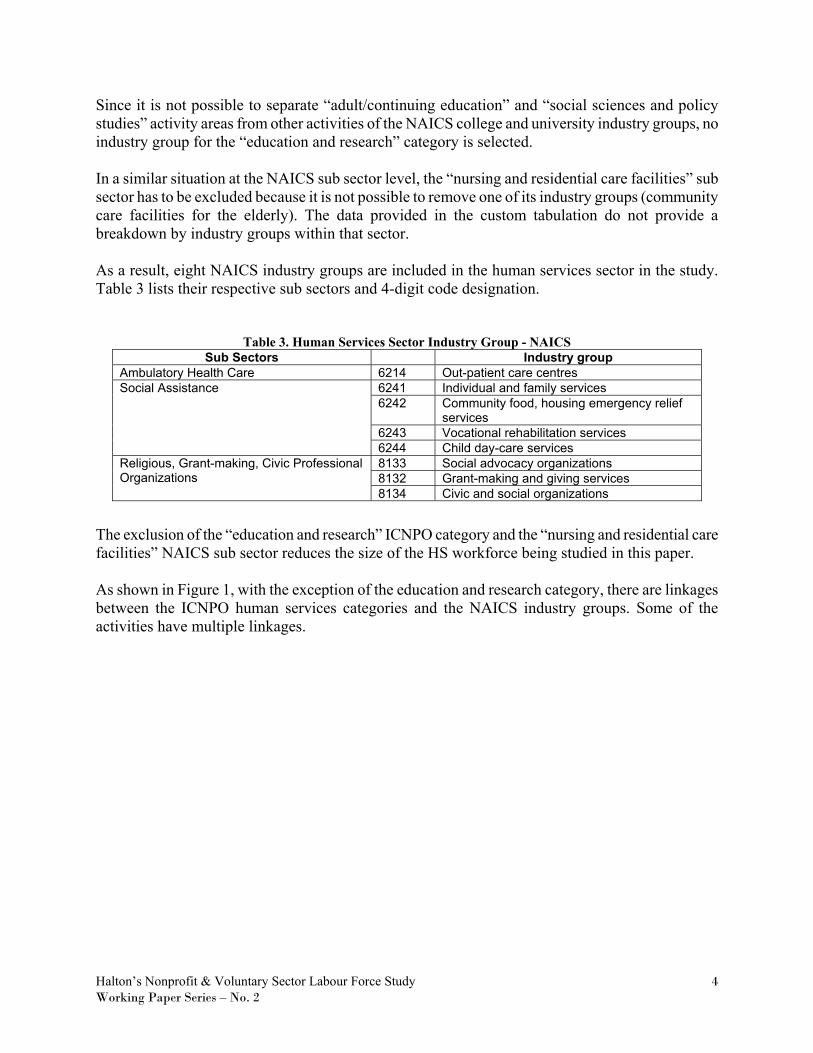
Since it is not possible to separate “adult/continuing education” and “social sciences and policy studies” activity areas from other activities of the NAICS college and university industry groups, no industry group for the “education and research” category is selected. In a similar situation at the NAICS sub sector level, the “nursing and residential care facilities” sub sector has to be excluded because it is not possible to remove one of its industry groups (community care facilities for the elderly). The data provided in the custom tabulation do not provide a breakdown by industry groups within that sector. As a result, eight NAICS industry groups are included in the human services sector in the study. Table 3 lists their respective sub sectors and 4-digit code designation.
Table 3. Human Services Sector Industry Group - NAICS Sub Sectors Industry group
Ambulatory Health Care 6214 Out-patient care centres 6241 Individual and family services 6242 Community food, housing emergency relief
services 6243 Vocational rehabilitation services
Social Assistance
6244 Child day-care services 8133 Social advocacy organizations 8132 Grant-making and giving services
Religious, Grant-making, Civic Professional Organizations
8134 Civic and social organizations
The exclusion of the “education and research” ICNPO category and the “nursing and residential care facilities” NAICS sub sector reduces the size of the HS workforce being studied in this paper. As shown in Figure 1, with the exception of the education and research category, there are linkages between the ICNPO human services categories and the NAICS industry groups. Some of the activities have multiple linkages.
Halton’s Nonprofit & Voluntary Sector Labour Force Study 4 Working Paper Series – No. 2

Social Services
Health
Development and Housing
Law and Advocacy
Education andResearch
VoluntarismPromotion/support
Ambulatory Health Care
Social Assistance
Religious, Grant-making, Civic
Professional org.
6214
62416242
6243
6244
8132
8133
8134
ICNPO Human Services Sector
Sub Sectors Industry groups*(8)
* Refer to Table 3 for list of industry groups
Figure 1. Matching ICNPA and NAICS Human Services
Table 4 lists sample organizations of each of the eight industry groups within the HS sector. According to NAICS, child day-care services do not include services of individuals providing baby-sitting or nanny services which belong to a different category.
Table 4. Human Service Sector Sample Organizations Human Services Sector Sample Organizations
Out-patient care centres birth control clinic, planned parenthood, outpatient mental health, community health centres, public health clinics
Individual and family services Big Sister/Brother Services, Family location services, rape crisis centres, Refugee services, family counselling, outreach programs
Food, housing, emergency services
Food banks, Meals on wheels, soup kitchens, halfway group homes, disaster services, refugee settlement services
Vocational rehabilitation services
Employment training programs, Handicapped workshop, Rehabilitation counselling, vocational, sheltered workshops
Child day-care services Child care centres, Nursery schools, Pre-kindergarten care services (except when part of elementary school system)
Grant-making and giving services
Charitable trust, United fund councils, Grant-making foundations, Voluntary health organization, Federated charitable organizations
Social advocacy organizations Community advocacy groups, social services advocacy, accident prevention association, neighbourhood development groups
Civic and social organizations Alumni associations, Community associations, Ethnic associations, Membership associations, Civic or social, Scouting organizations
Halton’s Nonprofit & Voluntary Sector Labour Force Study 5 Working Paper Series – No. 2

Development of Labour Force Profile Two custom tabulations of the labour force statistics from the 2001 Census were purchased from Statistics Canada. One table contains data on labour force by detailed industry classification by selected labour force, demographic, cultural, education and income characteristics and by gender. The second table contains data on labour force by detailed occupation classifications by selected labour force, demographic, cultural, education and income characteristics and by gender. Data on both tables are available for Canada, Ontario, Toronto, Hamilton, Peel and Halton and its four area municipalities. In Halton, about 70% of the HS sector labour force worked in the social assistance sub sector, 18% in grant-making, social advocacy and civil organizations (part of religious, grant-making, civic and professional organization sub sector) and the remaining 12% in the out-patient services of the ambulatory health care sub sector.
Gender At the provincial level, there was no significant gender difference in the labour force in 2001 (i.e. 51.5% – female workers, 48.5% – male workers). However, the HS sector presents a different picture. As an industry sector, it has a predominant female workforce. Female worker representation was about 85% in Ontario. Halton’s average was over 87% which was higher than those of Peel, Hamilton and Toronto. As shown in Figure 2, Halton’s female participation in the HS sector was the highest among all industry sectors. Within the HS sector, the child day-care services had the highest percentage (97%), almost all workers in the child day-care services were females (Figure 3). The percentage for the individual and family services was just below the sector average. Both the vocational rehabilitation services and civic and social organizations had the lowest percentages (71%) within the sector.
Halton’s Nonprofit & Voluntary Sector Labour Force Study 6 Working Paper Series – No. 2

51.9%
52.0%
53.6%
53.8%
56.0%
73.8%
84.0%
87.5%
0% 20% 40% 60% 80% 100%
Other services (excl. public admin)
Real estate and rental and leasing
Retail trade
Finance and insurance
Accommodation and food services
Educational services
Health care and social assistance
HS Sector
% Female Workers
Source: Statistics Canada, 2001 Census custom tabulation
Figure 2. Industry Sectors with > 50% female workers, Halton, 2001
51%
71%
71%
72%
79%
79%
84%
87%
97%
0% 20% 40% 60% 80% 100%
All Sectors
Civic and social organizations
Vocational rehabilitation services
Social advocacy organizations
Food, housing, emergency services
Grant-making and giving services
Out-patient care centres
Individual and family services
Child day-care services
% Female Workers
HS Sector87.5%
Source: Statistics Canada, 2001 Census custom tabulation
Figure 3. Female Workers by HS Sector industry groups, Halton, 2001
Halton’s Nonprofit & Voluntary Sector Labour Force Study 7 Working Paper Series – No. 2

Average Age The average age of HS sector workers was 39 years, slightly younger than the average age of workers in all industries (40 years). Figure 4 and Figure 5 show the age distribution of workers in all industries and the HS sector respectively. The most noticeable difference is the higher proportion of female workers under 44 years in the HS sector as compared to all industries. There are also higher percentages of female HS workers in the 25-34 and 35-44 age groups. Among all industry workers, both genders had the same proportion in the 35-44 and 45-54 age groups.
0%
5%
10%
15%
20%
25%
30%
15-19 20-24 25-34 35-44 45-54 55-64 65 +
Age
% W
orke
rs
Female MaleSource: Statistics Canada, 2001 Census Custom Tabulation
Figure 4. Age Distribution of All industry Workers by gender, Halton, 2001
0%
5%
10%
15%
20%
25%
30%
15-19 20-24 25-34 35-44 45-54 55-64 65 +
Age
% o
f wor
kers
Female MaleSource: Statistics Canada, 2001 Census Custom Tabulation
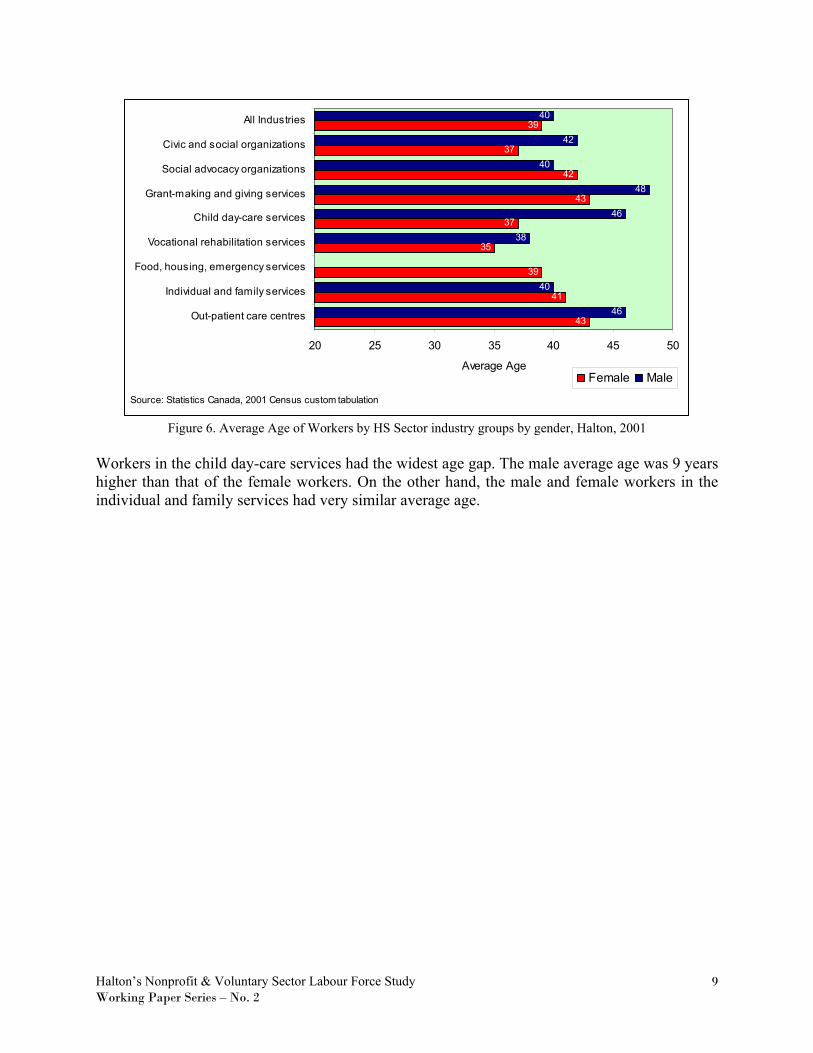
Figure 5. Age Distribution of HS Workers by gender, Halton, 2001 As shown in Figure 6, there are variations in average age by gender as well as by industries within the HS sector. Workers in the grant-making and giving services had the highest average age of 44 years as compared to the lowest average age (36 years) of the vocational rehabilitation services workers.
Halton’s Nonprofit & Voluntary Sector Labour Force Study 8 Working Paper Series – No. 2
43
41
39
35
37
43
42
37
39
46
40
38
46
48
40
42
40
20 25 30 35 40 45 50
Out-patient care centres
Individual and family services
Food, housing, emergency services
Vocational rehabilitation services
Child day-care services
Grant-making and giving services
Social advocacy organizations
Civic and social organizations
All Industries
Average AgeFemale Male
Source: Statistics Canada, 2001 Census custom tabulation
Figure 6. Average Age of Workers by HS Sector industry groups by gender, Halton, 2001
Workers in the child day-care services had the widest age gap. The male average age was 9 years higher than that of the female workers. On the other hand, the male and female workers in the individual and family services had very similar average age.
Halton’s Nonprofit & Voluntary Sector Labour Force Study 9 Working Paper Series – No. 2

Mobility, Recent Immigrants and Visible Minority About 23% of all workers moved to Halton from a different municipality between 1996 and 2001. They are the internal migrants. As shown in Figure 7, about one in three of the workers in the social advocacy organizations lived in a different town or city between 1996 and 2001. On the other hand, only 15% of the workers in the food, emergency services and civic and social organizations were internal migrants
15%
15%
18%
21%
22%
24%
25%
26%
31%
0% 10% 20% 30% 40%
Civic and social organizations
Food, housing, emergency services
Child day-care services
HS Sector
Grant-making and giving services
Individual and family services
Vocational rehabilitation services
Out-patient care centres
Social advocacy organizations
% Workers
All sectors23%
Source: Statistics Canada, 2001 Census custom tabulation
Figure 7. Internal Migrants by HS sector industry groups, Halton (1996-2001) Recent immigrants are immigrants who migrated to Canada between 1996 and 2001. About 2% of all workers were recent immigrants. Among the eight industry groups within the HS sector, only three groups had recent immigrant workers (Figure 8). The individual and family services and child day-care services groups had slightly higher proportion of recent immigrant than the HS sector and all sectors averages.
Halton’s Nonprofit & Voluntary Sector Labour Force Study 10 Working Paper Series – No. 2

0.0%
0.0%
0.0%
0.0%
0.0%
1.6%
2.0%
2.9%
2.9%
0% 1% 2% 3% 4%
Food, housing, emergency services
Vocational rehabilitation services
Grant-making and giving services
Social advocacy organizations
Civic and social organizations
Out-patient care centres
HS Sector
Child day-care services
Individual and family services
% Workers
All sectors2%
Source: Statistics Canada, 2001 Census custom tabulation
Figure 8. Recent Immigrants by HS sector industry groups, Halton Visible minority population represented over 8% of all workers in Halton. The HS sector had a similar representation. As shown in Figure 9, three industry groups led by civic and social organizations had higher averages. Only 4% of the workers in the out-patient care centres were visible minority.
0.0%
3.9%
5.1%
5.4%
7.7%
8.1%
8.5%
10.5%
11.6%
0% 5% 10% 15%
Food, housing, emergency services*
Out-patient care centres
Vocational rehabilitation services
Grant-making and giving services
Child day-care services
HS Sector
Social advocacy organizations
Individual and family services
Civic and social organizations
% Workers
All sectors8.2%
Source: Statistics Canada, 2001 Census custom tabulation
* not included due to sample size
Figure 9. Visible Minority Workers by HS sector industry groups, Halton, 2001
Halton’s Nonprofit & Voluntary Sector Labour Force Study 11 Working Paper Series – No. 2

Full/Part Time Work According to Statistics Canada, workers working 30 hours or more per week are categorized as full time workers and part time workers work less than 30 hours. As shown in Figure 10, the HS sector had a higher proportion of part time workers. About 1 in 5 (22%) of the labour force in Halton was part time workers. In the HS sector, about 1 in 3 (30%) of the workers was part time workers. Close to half (48%) of workers in both food, emergency services and civic and social organizations worked part time. On the other hand, the social advocacy organizations had the lowest percentage of part time workers. The average is lower than both the HS sector and all industries.
54%
54%
70%
70%
71%
71%
72%
75%
78%
80%
46%
46%
30%
30%
29%
29%
28%
25%
22%
20%
Civic and social organizations
Food, housing, emergency services
HS Sector
Child day-care services
Grant-making and giving services
Individual and family services
Out-patient care centres
Vocational rehabilitation services
All Industries
Social advocacy organizations
% workers
Full Time Part timeSource: Statistics Canada, 2001 Census Custom Tabulation
Figure 10. Full/Part time workers by HS Sector industry groups, Halton, 2001
Hours Worked Over all, about one third of all workers in Halton worked more than 40 hours per week. The lead sectors are construction, transportation and warehousing and wholesale trade. As shown in Figure 11, in the HS sector, about one quarter (25%) of the workers worked more than 40 hours per week. The averages for both the social advocacy organizations and the child day-care services are above the sector average. It is interesting to note that the child day-care services had a lower proportion (70%) of full time workers than the social advocacy organizations (80%) but they both had the same proportion (31%) of workers working more than 40 hours weekly.
Halton’s Nonprofit & Voluntary Sector Labour Force Study 12 Working Paper Series – No. 2
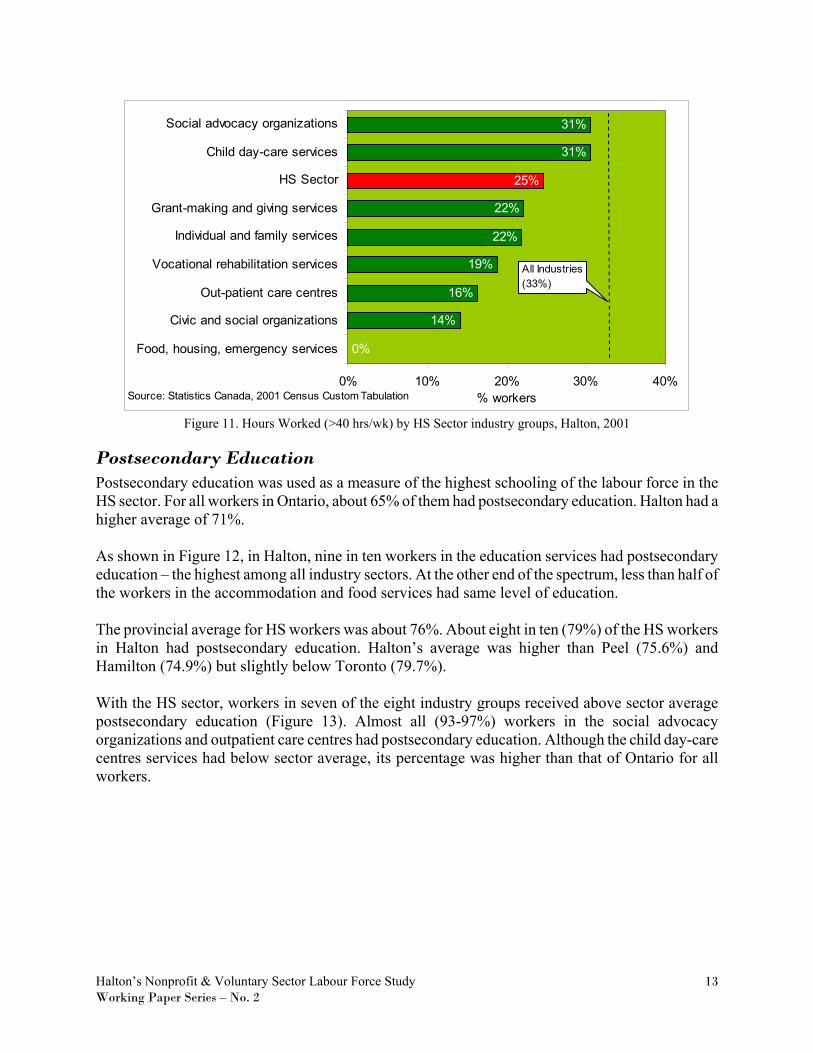
0%
14%
16%
19%
22%
22%
25%
31%
31%
0% 10% 20% 30% 40%
Food, housing, emergency services
Civic and social organizations
Out-patient care centres
Vocational rehabilitation services
Individual and family services
Grant-making and giving services
HS Sector
Child day-care services
Social advocacy organizations
% workers
All Industries(33%)
Source: Statistics Canada, 2001 Census Custom Tabulation
Figure 11. Hours Worked (>40 hrs/wk) by HS Sector industry groups, Halton, 2001
Postsecondary Education Postsecondary education was used as a measure of the highest schooling of the labour force in the HS sector. For all workers in Ontario, about 65% of them had postsecondary education. Halton had a higher average of 71%. As shown in Figure 12, in Halton, nine in ten workers in the education services had postsecondary education – the highest among all industry sectors. At the other end of the spectrum, less than half of the workers in the accommodation and food services had same level of education. The provincial average for HS workers was about 76%. About eight in ten (79%) of the HS workers in Halton had postsecondary education. Halton’s average was higher than Peel (75.6%) and Hamilton (74.9%) but slightly below Toronto (79.7%). With the HS sector, workers in seven of the eight industry groups received above sector average postsecondary education (Figure 13). Almost all (93-97%) workers in the social advocacy organizations and outpatient care centres had postsecondary education. Although the child day-care centres services had below sector average, its percentage was higher than that of Ontario for all workers.
Halton’s Nonprofit & Voluntary Sector Labour Force Study 13 Working Paper Series – No. 2
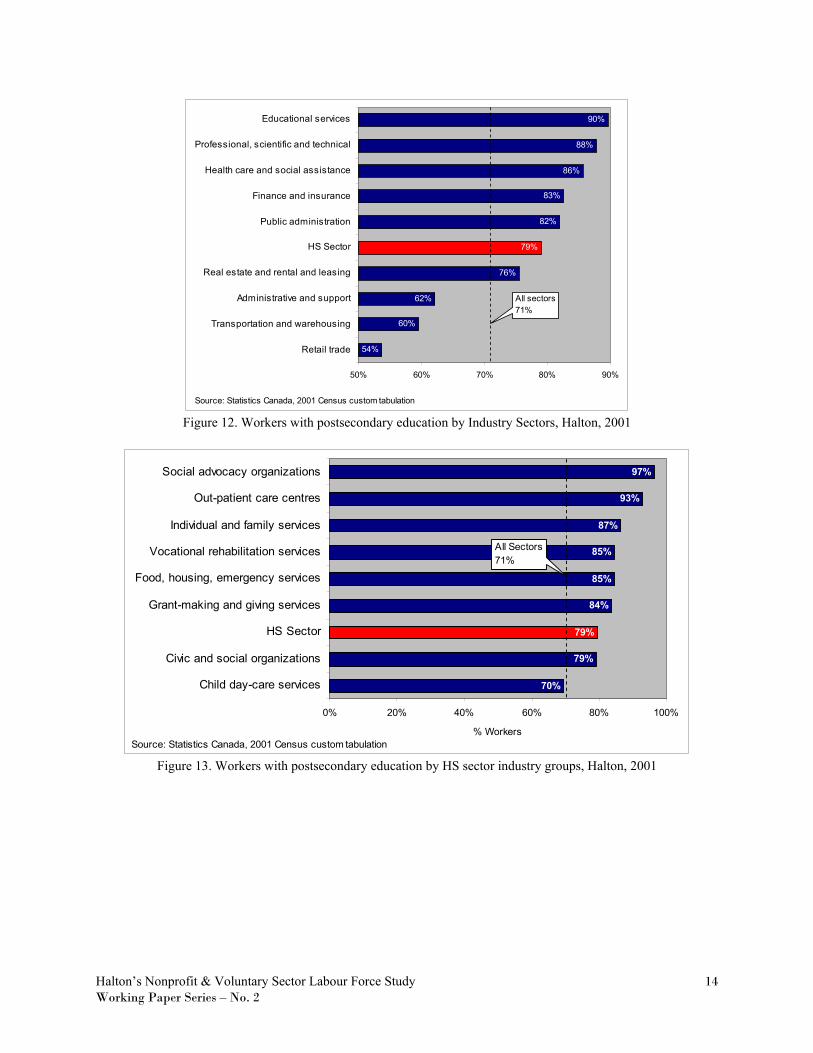
54%
60%
62%
76%
79%
82%
83%
86%
88%
90%
50% 60% 70% 80% 90%
Retail trade
Transportation and warehousing
Administrative and support
Real estate and rental and leasing
HS Sector
Public administration
Finance and insurance
Health care and social assistance
Professional, scientific and technical
Educational services
All sectors71%
Source: Statistics Canada, 2001 Census custom tabulation
Figure 12. Workers with postsecondary education by Industry Sectors, Halton, 2001
70%
79%
79%
84%
85%
85%
87%
93%
97%
0% 20% 40% 60% 80% 100%
Child day-care services
Civic and social organizations
HS Sector
Grant-making and giving services
Food, housing, emergency services
Vocational rehabilitation services
Individual and family services
Out-patient care centres
Social advocacy organizations
% WorkersSource: Statistics Canada, 2001 Census custom tabulation
All Sectors71%
Figure 13. Workers with postsecondary education by HS sector industry groups, Halton, 2001
Halton’s Nonprofit & Voluntary Sector Labour Force Study 14 Working Paper Series – No. 2

Major Field of Study Major field of study refers to the main subject area of a person’s highest degree, certificate or diploma at the postsecondary level. In Halton the percentage distribution of major field of study is quite different between all workers and the HS workers. As shown in Figure 14, the most popular field of study for all workers was commerce, management and business administration. Over 1 in 4 (27%) workers with postsecondary education studied commerce, management and business administration as compared to about 13% of the HS sector workers. The percentage of workers in all sectors with specialization in applied science technologies and trades was four times higher than workers in the HS sector. Half of the HS workers were in social sciences and related areas and education, recreational and counselling services as compared to one fifth for all workers.
4%
5%
5%
6%
6%
9%
9%
12%
17%
27%
1%
2%
3%
1%
7%
19%
24%
26%
4%
13%
0% 10% 20% 30%
Agricultural, biological, food sciences
Mathematics, computer and physical sciences
Fine and applied arts
Engineering and applied sciences
Humanities and related
Health professions and related
Educational, recreational and counselling services
Social sciences and related
Applied science technologies and trades
Commerce, management and business
% w orkers w ith postsecondary education
All sectors HS sector
Source: Statistics Canada, 2001 Census custom tabulation
Figure 14. Workers by Major Field of Study by All sectors and HS sector, Halton, 2001
Halton’s Nonprofit & Voluntary Sector Labour Force Study 15 Working Paper Series – No. 2

Occupation Occupation describes the type of work an individual does in a work place. The National Occupational Classification – Statistics (NOC-S) 2001 used by Statistics Canada has ten major occupation categories. As shown in Figure 15, the HS sector was over represented in two major occupation categories (social science, education and government; and health) and under represented in all others. Over half of the HS workers were in an occupation designated as social science, education, and government service as compared to 8% for all workers. Within the social assistance sub sector which includes child day-care services, individual and family services, vocational rehabilitation services, the major occupations were: early childhood educators and assistants, child care and home support workers, community and social services workers. Within the health occupation, the majority of the HS sector workers were registered nurses, nurse supervisors, health and related technicians. The percentage of HS sector workers (9%) in management was about half of that for all sectors (17%).
2%
3%
4%
5%
8%
8%
10%
17%
20%
23%
0%
2%
11%
0%
1%
54%
1%
9%
10%
11%
0% 10% 20% 30% 40% 50% 60%
Occupations unique to primary industry
Art, culture, recreation and sport
Health
Occupations unique to processing, manufacturing
Natural and applied sciences
Social science, education, government
Trades, transport and equipment operators
Management
Business, finance and administration
Sales and service
All sectors HS sector
Source: Statistics Canada, 2001 Census custom tabulation
Figure 15. Workers by Occupations comparing all sectors and HS sector, Halton, 2001
Halton’s Nonprofit & Voluntary Sector Labour Force Study 16 Working Paper Series – No. 2
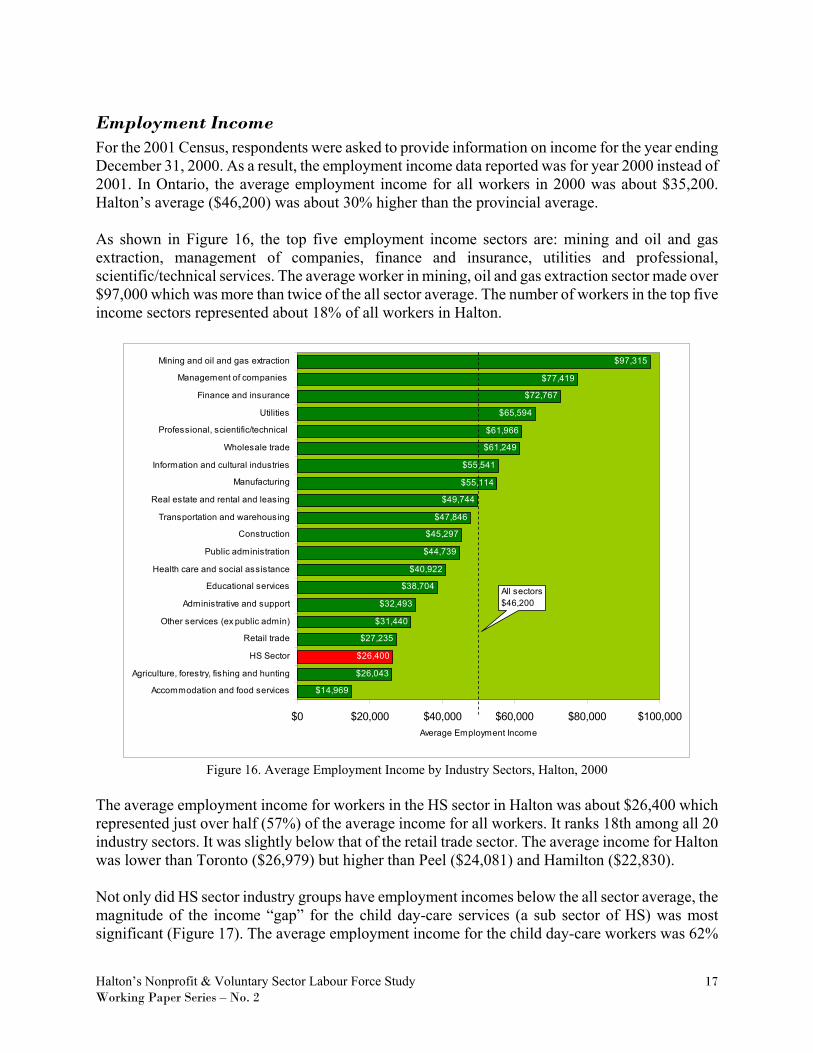
Employment Income For the 2001 Census, respondents were asked to provide information on income for the year ending December 31, 2000. As a result, the employment income data reported was for year 2000 instead of 2001. In Ontario, the average employment income for all workers in 2000 was about $35,200. Halton’s average ($46,200) was about 30% higher than the provincial average. As shown in Figure 16, the top five employment income sectors are: mining and oil and gas extraction, management of companies, finance and insurance, utilities and professional, scientific/technical services. The average worker in mining, oil and gas extraction sector made over $97,000 which was more than twice of the all sector average. The number of workers in the top five income sectors represented about 18% of all workers in Halton.
$14,969
$26,043
$26,400
$27,235
$31,440
$32,493
$38,704
$40,922
$44,739
$45,297
$47,846
$49,744
$55,114
$55,541
$61,249
$61,966
$65,594
$72,767
$77,419
$97,315
$0 $20,000 $40,000 $60,000 $80,000 $100,000
Accommodation and food services
Agriculture, forestry, fishing and hunting
HS Sector
Retail trade
Other services (ex public admin)
Administrative and support
Educational services
Health care and social assistance
Public administration
Construction
Transportation and warehousing
Real estate and rental and leasing
Manufacturing
Information and cultural industries
Wholesale trade
Professional, scientific/technical
Utilities
Finance and insurance
Management of companies
Mining and oil and gas extraction
Average Employment Income
All sectors$46,200
S S C C Figure 16. Average Employment Income by Industry Sectors, Halton, 2000
The average employment income for workers in the HS sector in Halton was about $26,400 which represented just over half (57%) of the average income for all workers. It ranks 18th among all 20 industry sectors. It was slightly below that of the retail trade sector. The average income for Halton was lower than Toronto ($26,979) but higher than Peel ($24,081) and Hamilton ($22,830). Not only did HS sector industry groups have employment incomes below the all sector average, the magnitude of the income “gap” for the child day-care services (a sub sector of HS) was most significant (Figure 17). The average employment income for the child day-care workers was 62%
Halton’s Nonprofit & Voluntary Sector Labour Force Study 17 Working Paper Series – No. 2

below the average for all workers and 35% below the average for HS sector workers. In other words, the child day-care workers earned 38 cents for every dollar an average worker in Halton made.
$17,403
$25,304
$31,985
$33,522
$35,761
$37,627
$38,576
$41,900
$26,454
$10,000 $20,000 $30,000 $40,000 $50,000
Child day-care services
Civic and social organizations
HS Sector
Individual and family services
Vocational rehabilitation services
Food, housing, emergency services
Grant-making and giving services
Out-patient care centres
Social advocacy organizations
Average 2000 Employment Income
All sectors$46,200
Source: Statistics Canada, 2001 Census custom tabulation
Figure 17. Average Employment Income by HS sector industry groups, Halton, 2000
Income-Gender Differential Income-gender differential measures the difference in employment income by gender. Since the current female worker income still falls behind male worker income, the income-gender differential is expressed as a percent of the male worker income. A higher percentage means a narrower income gap. In Ontario, the income-gender differential was 63% which means that on average, female workers earned only 63 cents for every dollar the male workers made. Halton’s income-gender gap for all workers was wider than the province at 54%. Figure 18 shows income-gender differentials for all industry sectors. Female workers in the construction sector had the narrowest income gap. On the other hand, female workers in health care and social assistance sector and mining and gas extraction sector made less than 40% of that made by the male workers.
Halton’s Nonprofit & Voluntary Sector Labour Force Study 18 Working Paper Series – No. 2
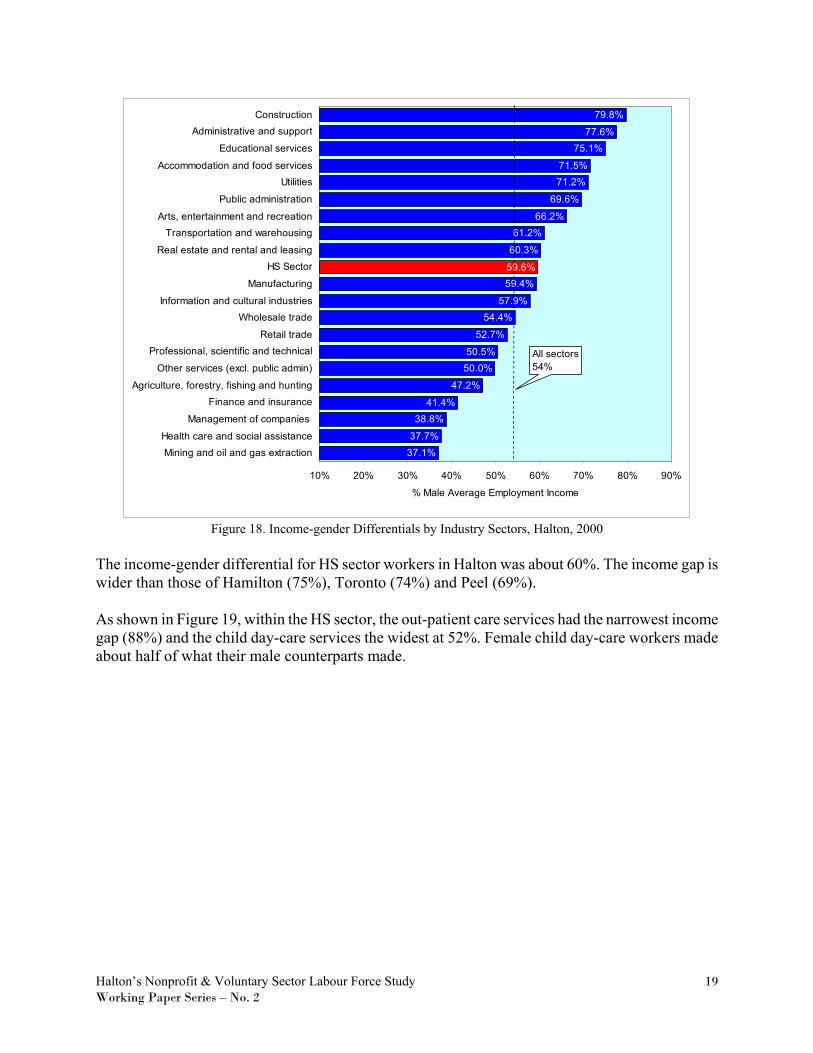
37.1%37.7%
38.8%41.4%
47.2%
50.0%50.5%
52.7%
54.4%57.9%
59.4%
60.3%
61.2%66.2%
69.6%
71.2%71.5%
75.1%77.6%
79.8%
59.6%
10% 20% 30% 40% 50% 60% 70% 80% 90%
Mining and oil and gas extractionHealth care and social assistance
Management of companies
Finance and insuranceAgriculture, forestry, fishing and hunting
Other services (excl. public admin)
Professional, scientific and technicalRetail trade
Wholesale tradeInformation and cultural industries
Manufacturing
HS SectorReal estate and rental and leasing
Transportation and warehousingArts, entertainment and recreation
Public administration
UtilitiesAccommodation and food services
Educational services
Administrative and supportConstruction
% Male Average Employment Income
All sectors54%
Figure 18. Income-gender Differentials by Industry Sectors, Halton, 2000
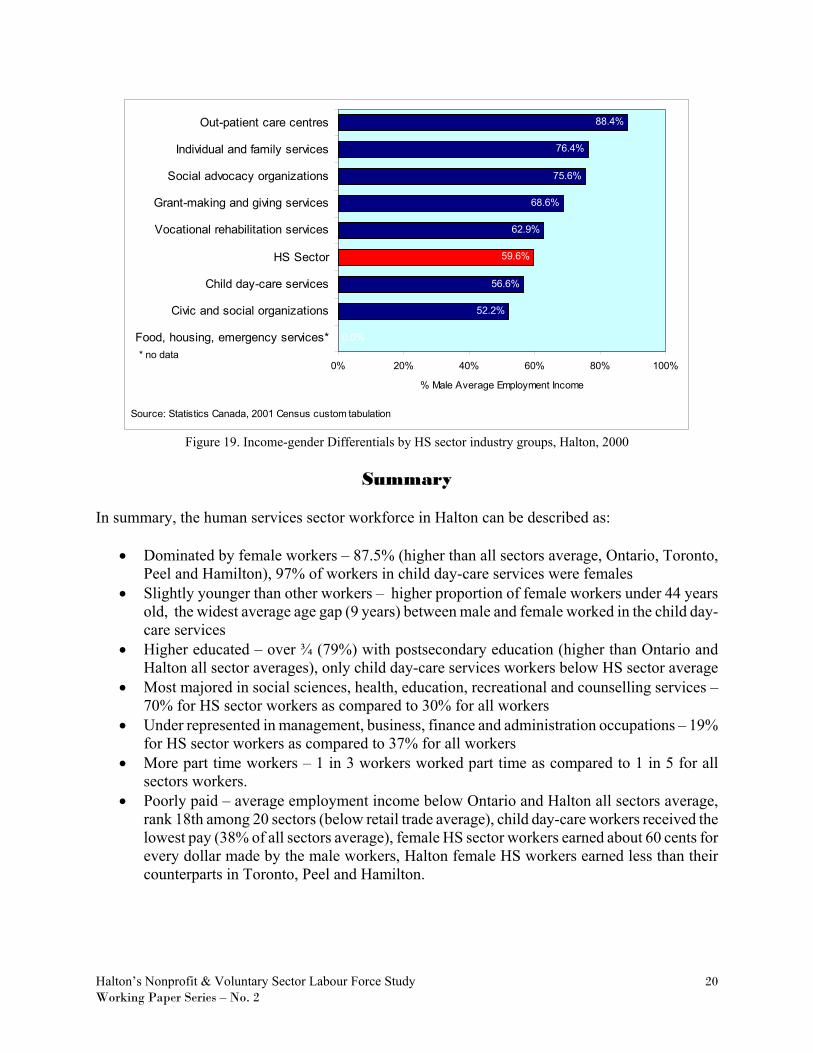
The income-gender differential for HS sector workers in Halton was about 60%. The income gap is wider than those of Hamilton (75%), Toronto (74%) and Peel (69%). As shown in Figure 19, within the HS sector, the out-patient care services had the narrowest income gap (88%) and the child day-care services the widest at 52%. Female child day-care workers made about half of what their male counterparts made.
Halton’s Nonprofit & Voluntary Sector Labour Force Study 19 Working Paper Series – No. 2
0.0%
52.2%
56.6%
62.9%
68.6%
75.6%
76.4%
88.4%
59.6%
0% 20% 40% 60% 80% 100%
Food, housing, emergency services*
Civic and social organizations
Child day-care services
HS Sector
Vocational rehabilitation services
Grant-making and giving services
Social advocacy organizations
Individual and family services
Out-patient care centres
% Male Average Employment Income
Source: Statistics Canada, 2001 Census custom tabulation
* no data
Figure 19. Income-gender Differentials by HS sector industry groups, Halton, 2000
Summary
In summary, the human services sector workforce in Halton can be described as:
• Dominated by female workers – 87.5% (higher than all sectors average, Ontario, Toronto, Peel and Hamilton), 97% of workers in child day-care services were females
• Slightly younger than other workers – higher proportion of female workers under 44 years old, the widest average age gap (9 years) between male and female worked in the child day-care services
• Higher educated – over ¾ (79%) with postsecondary education (higher than Ontario and Halton all sector averages), only child day-care services workers below HS sector average
• Most majored in social sciences, health, education, recreational and counselling services – 70% for HS sector workers as compared to 30% for all workers
• Under represented in management, business, finance and administration occupations – 19% for HS sector workers as compared to 37% for all workers
• More part time workers – 1 in 3 workers worked part time as compared to 1 in 5 for all sectors workers.
• Poorly paid – average employment income below Ontario and Halton all sectors average, rank 18th among 20 sectors (below retail trade average), child day-care workers received the lowest pay (38% of all sectors average), female HS sector workers earned about 60 cents for every dollar made by the male workers, Halton female HS workers earned less than their counterparts in Toronto, Peel and Hamilton.
Halton’s Nonprofit & Voluntary Sector Labour Force Study 20 Working Paper Series – No. 2