half year results presentation to 31 December 2015
32
1 half year results presentation to 31 December 2015
Transcript of half year results presentation to 31 December 2015

1
half year results presentation to 31 December 2015

Disclaimer and Non-IFRS Information
Disclaimer
The material in this presentation has been prepared by carsales.com Limited (ASX: CAR) ABN 91 074 444 018
(“carsales") and is general background information about carsales’ activities current as at the date of this
presentation. The information is given in summary form and does not purport to be complete. In particular you are
cautioned not to place undue reliance on any forward looking statements regarding our belief, intent or
expectations with respect to carsales’ businesses, market conditions and/or results of operations, as although due
care has been used in the preparation of such statements, actual results may vary in a material manner.
Information in this presentation, including forecast financial information, should not be considered as advice or a
recommendation to investors or potential investors in relation to holding, purchasing or selling securities. Before
acting on any information you should consider the appropriateness of the information having regard to these
matters, any relevant offer document and in particular, you should seek independent financial advice.
Non-IFRS Financial Information
carsales' results are reported under International Financial Reporting Standards (IFRS). This presentation also
includes certain non-IFRS measures including, “proforma”, “underlying” and “look through”. These measures are
used internally by management to assess the performance of our business and our associates, make decisions on
the allocation of resources and assess operational management. Non-IFRS measures have not been subject to
audit or review. All numbers listed as reported comply with IFRS.
2

Table of Contents
Key Messages 4 – 6
Reported Group Financial Performance 7 – 9
carsales Domestic 10 – 14
carsales International 15 – 19
Outlook 20 – 21
New Product Releases 22 – 27
Appendix 28 – 31
3

4
Key Messages to 31 December 2015

5
Organisational Structure

• Another record half year result.
• Reported H1 FY16 pcp growth in revenue of 11%, EBITDA of 12% and NPAT* of
10%. NPAT* (before one-off gains) up 8% to $50m.
FINANCIAL OVERVIEW
INTERNATIONAL OVERVIEW
• Completed the acquisition of 65% of SoloAutos in Mexico during the half.
• Strong local currency growth for Webmotors with revenue up 14% on pcp and
SKENCARSALES with revenue up 22% on pcp.
DOMESTIC OVERVIEW
• Solid revenue growth across most core business streams and particular strength in Q2.
• Strong performances from adjacent businesses including Stratton, Redbook Inspect
and Tyresales.
• Overall EBITDA margins up 1% on pcp to 49%.
6
Overview of H1 FY16
REPORTED REVENUE up 11% to $167m
REPORTED EBITDA up 12% to $82m
REPORTED NPAT* up 10% to $51m
* NPAT stated above is post non-controlling interests – i.e. amounts attributable to carsales’ shareholders.

7
Reported Group Financial Performance to 31 December 2015

8
• Solid growth in revenue rising to $167.3m, up by 11% on pcp.
• Operating expenses (before Interest and D&A) up 10% on pcp.
• EBITDA up 12% on pcp to $81.5m.
• NPAT up 10% on pcp to $51.3m, growth rate slightly subdued
partially as a result of one-time NCI inclusion of Redbook inspect.
• D&A increased by $2.0m reflecting Stratton acquisition intangible
asset amortisation.
• Underlying solid growth in profits from associates (up 72% on pcp),
offset by acquisition intangible asset amortisation, adverse FX in
Brazil and inclusion of Ratesetter for the first time.
• Gain on associate dilution reflects top-up of iCar stake to 20.2% in
August 2015.
• Reported EPS up 1.8 cents per share to 21.4, up 9% on pcp. EPS
before one-off gains of 20.9 cents per share, up 1.3 cents (7%) on
the prior year.
• Interim FY16 dividend of 17.8 cents per share up 10% on pcp (FY15
interim dividend of 16.2 cents per share).
Source: carsales
$A Millions Growth
Year Ending 31 December 2015 H1 FY15 H1 FY16 $'s %
Revenue
Online Advertising 105.9 115.8 9.9 9%
Data & Research 15.2 16.4 1.2 8%
International 1.4 1.7 0.3 24%
Finance and Related Services 28.4 33.4 5.0 17%
Total Revenue 150.9 167.3 16.4 11%
Operating Expenses (Before Interest and D&A) 78.0 85.8 7.8 10%
EBITDA 72.9 81.5 8.6 12%
EBITDA Margin 48% 49%
D&A 2.1 4.1 2.0 95%
EBIT 70.8 77.4 6.6 9%
Net Interest Expense 4.1 4.2 0.1 3%
Profit Before Tax 66.7 73.2 6.5 10%
Income Tax Expense 20.6 22.9 2.3 11%
Profits from Associates 2.5 2.8 0.3 12%
Gain on associate dilution - 0.9 0.9 n/a
Outside Equity Interests (1.9) (2.7) (0.8) 43%
Net Profit After Tax 46.7 51.3 4.6 10%
Earnings Per Share (cents) 19.6 21.4 1.8 9%
Millions
CAGR 11.6% CAGR 14.0%
REPORTED REVENUE REPORTED EBITDA REPORTED NPAT (post NCI)
Financial Overview
CAGR 17.6%
Millions Millions

Reported Debt and Cash flow
Continued strong operating cash flows Comfortable credit metrics
9
Reported Leverage Ratio (Net debt / Annualised EBITDA)
Reported Operating Cash flow (column) and conversion from EBITDA to cash (line)
• Reported Net Debt* of ~$200m as at 31 December 2015. ~$12m increase on 30 June 2015 due to investments.
* Net debt includes total borrowings less total cash as at 31 December 2015 per published balance sheet. Ratios above are based on reported financial outcomes and may vary with bank covenant definitions.
Reported Net Interest Cover (Annualised EBITDA / Annualised Net Interest Expense)
Millions
See slide 29 regarding the disclosure of non-IFRS Information
• Solid cash conversion of earnings with Operating cash flow / EBITDA at 62%, consistent with pcp.

10
carsales Domestic
to 31 December 2015

Domestic Revenue Performance - Summary 11
H1 FY16 SEGMENT REVENUE $A Millions Growth
Year Ending 31 December 2015 H1 FY15 H1 FY16 $'s %
Domestic Revenue
Dealer 53.8 58.8 5.0 9%
Private 21.2 24.4 3.2 15%
Display 30.9 32.6 1.7 6%
Data, Research and Services 15.2 16.4 1.2 8%
Finance and Related Services 28.4 33.4 5.0 17%
Total Domestic Revenue 149.5 165.6 16.1 11%
Automotive Enquiry Volumes for the period Automotive Inventory at 31 December

12
CAGR 10.6%
Dealer revenue up 9% on pcp to $58.8m Pleasing used car dealer enquiry volumes up 4.3% and improving new car enquiry volumes with Q2 showing positive pcp growth.
Solid growth in depth products and pricing improvements continue to expand yields.
Dealer used car inventory once again up 7% on pcp. New car inventory up 20% on pcp with OEM’s continuing to remove blocking rules.
Private revenue up 15% on pcp to $24.4m Strong revenue growth from tyresales B2C and pleasing performance from Redbook Inspect (previously Auto Inspect).
Private automotive ad volumes and time to sell similar to H1 FY15. Good signs from the free under $3k campaign launched in late calendar 2015.
Total inventory up 3% on pcp to around 75,000 cars as at 31 December 2015.
Automotive volume and yield growth from depth products continue to perform well with the second premium ad price rise in 6 months (September & December) to $135 having no impact on volume.
CAGR 11.1%
Millions
Domestic Revenue Performance by Segment
Millions
Millions
Millions
Dealer
Private

13
CAGR 15.0%
CAGR 10.7%
Millions
Domestic Revenue Performance by Segment
Millions
Millions
Millions
Data, Research and Services revenue up 8% to $16.4m
Continued solid pcp revenue growth from both Livemarket and Livetrade, driven by
volume growth.
Strong domestic Redbook revenue growth in the half.
Finance and Related Services Revenue up 17% to $33.4m
Strong ongoing organic growth in finance and related services.
Integration of Ratesetter onto carsales site completed in Jan 2016. Ratesetter
continues to make good progress while also investing in its market opportunity.
All About Finance acquired by Stratton in September and rebranded to provide
access to marine and other finance markets and complement their core market
offering.
Display revenue up 6% to $32.6m
Improvement in revenue trend growth to 6% on pcp (H1 FY15 3% on pcp). OEM inventory returning is a positive for potential future display growth. Some encouraging signs in the relationships with advertisers and OEMs as we continue to invest in data, analytics and insights to support the needs of these customers. Focus on innovation in display products continuing.
Data, Research and Services
Display

14
Domestic Market Overview
Sources: 1. Nielsen Online Ratings, Unique Audience, average Oct - Dec 2015. 2. Nielsen Mobile Ratings, average Oct - Dec
2015. 3. carsales internal data, Webtrends, Dec 2014 - Dec 2015. 4. carsales internal data, Webtrends, Dec 2015. 5. AUS [app]
design awards, 2013 Best Mobile Expanded Service or Application, 2014 Best Mobile Expanded Service or Application, 2015 Best
Expanded Service or Application. 6. Nielsen Online Ratings, Time per Person, Dec 2015. 7. Symphony Analytics and Research, Average Preference – Averaged across prefer this the MOST for buying a new car, Dec 2015.
3
4
5
6
7

15
carsales International to 31 December 2015

16
International Portfolio
See slide 29 regarding the disclosure of non-IFRS Information
• International Key Highlights
• Strong double digit revenue growth rates across International.
• Business model progression continues in all of our businesses to support future growth.
• SoloAutos acquisition completed in the Half.
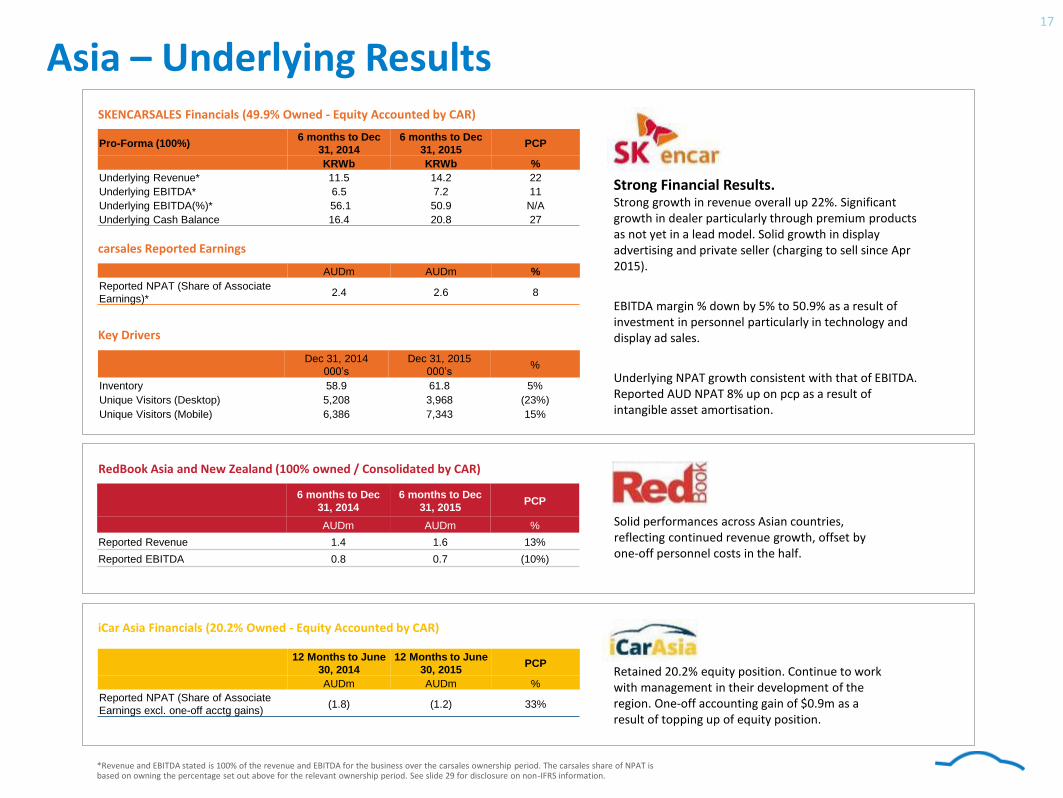
Asia – Underlying Results 17
*Revenue and EBITDA stated is 100% of the revenue and EBITDA for the business over the carsales ownership period. The carsales share of NPAT is based on owning the percentage set out above for the relevant ownership period. See slide 29 for disclosure on non-IFRS information.
Strong Financial Results. Strong growth in revenue overall up 22%. Significant growth in dealer particularly through premium products as not yet in a lead model. Solid growth in display advertising and private seller (charging to sell since Apr 2015).
EBITDA margin % down by 5% to 50.9% as a result of investment in personnel particularly in technology and display ad sales.
Underlying NPAT growth consistent with that of EBITDA. Reported AUD NPAT 8% up on pcp as a result of intangible asset amortisation.
Retained 20.2% equity position. Continue to work with management in their development of the region. One-off accounting gain of $0.9m as a result of topping up of equity position.
Pro-Forma (100%) 6 months to Dec
31, 2014
6 months to Dec
31, 2015 PCP
KRWb KRWb %
Underlying Revenue* 11.5 14.2 22
Underlying EBITDA* 6.5 7.2 11
Underlying EBITDA(%)* 56.1 50.9 N/A
Underlying Cash Balance 16.4 20.8 27
SKENCARSALES Financials (49.9% Owned - Equity Accounted by CAR)
carsales Reported Earnings
AUDm AUDm %
Reported NPAT (Share of Associate
Earnings)* 2.4 2.6 8
Key Drivers
Dec 31, 2014
000’s
Dec 31, 2015
000’s %
Inventory 58.9 61.8 5%
Unique Visitors (Desktop) 5,208 3,968 (23%)
Unique Visitors (Mobile) 6,386 7,343 15%
12 Months to June
30, 2014
12 Months to June
30, 2015 PCP
AUDm AUDm %
Reported NPAT (Share of Associate
Earnings excl. one-off acctg gains) (1.8) (1.2) 33%
6 months to Dec
31, 2014
6 months to Dec
31, 2015 PCP
AUDm AUDm %
Reported Revenue 1.4 1.6 13%
Reported EBITDA 0.8 0.7 (10%)
iCar Asia Financials (20.2% Owned - Equity Accounted by CAR)
RedBook Asia and New Zealand (100% owned / Consolidated by CAR)
Solid performances across Asian countries, reflecting continued revenue growth, offset by one-off personnel costs in the half.

Latin America – Underlying Results
WebMotors solid top line growth Solid revenue growth overall with dealer and private both performing strongly. Display providing some challenges as OEMs manage their advertising spend to cater for current economic conditions.
Investments in people, marketing and advertising now at sustainable levels, which should see the business positioned for margin improvements.
Underlying NPAT growth consistent with growth in EBITDA but impacted by one off financial income adjustment. Carsales reported NPAT (AUD) impacted by adverse exchange rate and amortisation of intangible assets.
Webmotors continues to perform very strongly against its nearest competitors at both an inventory and traffic level. 70% increase in dealer leads compared to pcp reflecting success of operational improvements.
Pro-Forma (100%) 6 Months to Dec
31, 2014
6 Months to Dec
31, 2015 PCP
BRLm BRLm %
Underlying Revenue 44.3 50.4 14%
Underlying EBITDA 12.8 14.2 10%
Underlying EBITDA (%) 28% 28% -
Underlying NPAT 14.5 18.6 28%
Underlying Cash Balance 204.3 217.6 7%
WebMotors Financials (30% owned - Equity Accounted by CAR)
carsales Reported Earnings
AUDm AUDm %
Reported NPAT
(Share of Associate Earnings) 2.0 1.9 (3%)
Key Drivers
Dec 31, 2014
000’s
Dec 31, 2015
000’s %
Inventory 205.0 272.6 33%
Unique Visitors (Desktop) 6,518 4,794 (27%)
Unique Visitors (Mobile)
2,684 2,929 9%
18
Revenue and EBITDA stated is 100% of the revenue and EBITDA for the business over the carsales ownership period. The carsales share of NPAT is based on owning the percentage set out above for the relevant ownership period. See slide 29 for disclosure on non-IFRS information.
Pro-Forma (100%) Oct 2 to Dec 31,
2014
Oct 2 to Dec 31,
2015 PCP
MXPm MXPm %
Reported Revenue N/A 1.9 N/A
Reported EBITDA N/A (1.3) N/A
Reported EBITDA (%) N/A N/A N/A
Reported NPAT N/A (1.5) N/A
Reported Cash Balance N/A 49.5 N/A
SoloAutos Financials (65% owned – Consolidated by CAR)
SoloAutos Pleasing performance since acquisition for SoloAutos.
Focus on developing and executing roadmap to drive commercial opportunities as envisaged.

19
Outlook to 31 December 2015

Performance Outlook
H2 FY16 has commenced well with January once again proving to be an
attractive month for car buyers in the domestic business.
We continue to monitor our performance and market conditions. Assuming
these are stable we anticipate revenue and EBITDA growth will remain solid,
with NPAT to grow more moderately.
carsales Domestic Outlook
Expect ongoing development of the business models in Korea and Brazil to
continue and subject to market conditions being maintained in these
markets we expect to see moderate local currency earnings growth for
each.
20
carsales International Outlook

21
New Product Releases to 31 December 2015

22
Desktop and App Notification Centre

23
New Car Launches

24
2015 Carsales Car Of The Year

25
Owner and Expert Reviews

26
Free Basic Ads

27
Instant Offer in Ad creation

28
Appendix to 31 December 2015

Overview of carsales Non-IFRS Financial Information
What is IFRS and non-IFRS financial information?
• IFRS financial information is financial information that is presented in accordance with all relevant accounting standards.
• Non-IFRS financial information is financial information that is presented other than in accordance with all relevant accounting standards. For example:
• Revenue or Profit information calculated on a basis other than under accounting standard definitions or calculated with accounting standards and then adjusted eg; “proforma”, “underlying” or “look through”;
What non-IFRS financial information does carsales disclose in its half year and year end results presentations?
• carsales presents reported financial information for its business segments, associates and investments where applicable IFRS financial information exists. The financial information presented is sourced directly from financial information prepared in accordance with all relevant accounting standards and has been subject to either review or audit by carsales external auditors (PwC).
• In carsales investor presentations the company aims to provide equal or greater prominence to IFRS financial information. However, we also present or refer to non-IFRS financial information. Please note, all information labelled “Reported” in this presentation complies with IFRS.
• Non-IFRS financial information is calculated based on statutory IFRS financial information and adjusted to show either a position excluding significant items which have been removed OR presented based on carsales’ effective equity ownership interest of an entity’s underlying revenue, EBITDA or NPAT.
• Any non-IFRS financial information is clearly labelled as “underlying” or “look-through” to differentiate it from reported/IFRS financial information.
• carsales provides reconciliations on the face of slides, appendices and in footnotes of presentations in order to allow the reader to clearly reconcile between the IFRS and non-IFRS financial information.
Why does carsales disclose non-IFRS financial information in its half year and full year results presentations? • Since March 2013 carsales has invested in businesses in Malaysia, Thailand, Indonesia, South Korea, Mexico and Brazil and has become a
global portfolio of online automotive assets – as such carsales management believes that the presentation of additional non-IFRS information in its half year and full year results presentations provides readers of these documents with a greater understanding into the way in which management analyses the business as well as meaningful insights into the financial conditions of carsales overall performance.
• The Australian Securities and Investment Commission (“ASIC”) acknowledges the relevance of non-IFRS financial information in providing “meaningful insight” as long as it does not mislead the reader.
29

NOTE: carsales “Look Through” methodology is: For equity accounted associates: Add the total revenue or EBITDA for the period of ownership within the reporting period (e.g. carsales investments in iCar Asia, WebMotors and SK ENCARSALES were owned for the entire reporting period) multiplied by the % ownership (30% for WebMotors, 49.9% for SKENCARSALES and 20.2% for iCar Asia over the period). For consolidated associates/subsidiaries, revenue and EBITDA attributable to associates has been eliminated (i.e. total revenue and EBITDA multiplied by carsales percentage ownership remains as the look through revenue and EBITDA). All numbers for iCar Asia are carsales management estimates. Some “Look Through” numbers involve the disclosure of non IFRS information - Refer to carsales “Look Through” P&L Analysis slide and Disclosure of Non IFRS slide 29 for further details.
Look Through Revenue and EBITDA Performance
Look Through Revenue ($m) Look Through EBITDA ($m)
30
CAGR 16.2% CAGR 13.8%
Millions Millions

carsales “Look Through” P&L Analysis
NOTE: carsales “Look Through” methodology is: For equity accounted associates: Add the total revenue or EBITDA for the period of ownership within the reporting period (e.g. carsales investments in iCar Asia, WebMotors and SK ENCARSALES were owned for the entire reporting period) multiplied by the % ownership (30% for WebMotors, 49.9% for SKENCARSALES and 20.2% for iCar Asia over the period). For consolidated associates/subsidiaries, revenue and EBITDA attributable to associates has been eliminated (i.e. total revenue and EBITDA multiplied by carsales percentage ownership remains as the look through revenue and EBITDA). All numbers for iCar Asia are carsales management estimates. Some “Look Through” numbers involve the disclosure of non IFRS information - Refer to carsales “Look Through” P&L Analysis slide and Disclosure of Non IFRS slide 29 for further details.
* Investments in Tyresales (owned 50% from 1 July 2013), Auto Exchange (owned 50% from 1 July 2013), Stratton Finance (owned 50.1% from 15th July 2014), Auto Inspect (owned 50.1% from 26 June 2015) and Ratesetter (owned 15% from 12 March 2015) are presented with Domestic Investments.
31