![Barco 6 months ended Barco/Investor relations...Barco | 6 months ended 30 June 2012 3 KEY FIGURES 2012 2011 [ in thousands of euro ] 1st half 1st half Net sales 530,994 490,300 Gross](https://static.fdocuments.in/doc/165x107/5ae250537f8b9ad47c8cf484/barco-6-months-ended-barcoinvestor-relationsbarco-6-months-ended-30-june-2012.jpg)
Half year results for the six months ended 30 …/media/Files/A/Atkins-Corporate/...Half year...
39
Half year financial report for the six months ended 30 September 2016 Good overall results, with underlying profit before tax up 14.0%, full year outlook unchanged Design, engineering and project management consultancy WS Atkins plc (Atkins or the Group) today announces its unaudited results for the six months ended 30 September 2016. FINANCIAL SUMMARY Note Six months to 30 Sept 2016 Six months to 30 Sept 2015 Change Income Statement - unaudited Revenue £994.7m £904.6m 10.0% Underlying operating profit 1 £65.3m £59.0m 10.7% Underlying operating margin 2 6.6% 6.5% 0.1pp Underlying profit before tax 3 £63.6m £55.8m 14.0% Underlying profit after tax £47.7m £43.0m 10.9% Underlying diluted EPS 4 48.2p 42.8p 12.6% Statutory operating profit £23.5m £60.0m (60.8)% Statutory operating margin 2.4% 6.6% (4.2)pp Statutory profit before tax £22.4m £53.8m (58.4)% Statutory diluted EPS 22.6p 42.9p (47.3)% Dividend 5 12.5p 11.7p 6.8% People Staff numbers at 30 September 6 18,339 18,609 (1.5)% Average staff numbers 18,335 18,506 (0.9)% Net (debt)/funds 7 £(90.3)m £141.1m (164.0)% Work in hand 8 84.1% 84.3% (0.2)pp HIGHLIGHTS Financial highlights - Revenue up 10.0% to £994.7m, up 4.0% on a constant currency basis - Underlying operating profit up 10.7%, underlying constant currency operating profit up 4.3% - Underlying profit before tax of £63.6m, up 14% - Underlying diluted EPS up 12.6%, interim dividend up 6.8% - Net borrowings of £90.3m at September 2016, following acquisition of EnergySolutions’ project, products and technology (PP&T) business Operational summary - Significant increase in UK and Europe profit, up 32.2% supported by strong markets and improved operational delivery - Good first half performance in North America, underpinned by two major transportation projects - Middle East impacted by more difficult transportation and infrastructure markets and demobilisation of metro projects; good wins in Dubai property market - Energy business continues to face challenging market conditions in oil and gas, North American oil and gas impairment of £23.3m in the period - First major PP&T project in US (DUF6) secured and integration progressing well Commenting on the results, Uwe Krueger, chief executive officer, said: “Despite challenges in some markets, we have delivered good underlying profitability and the near term outlook in our UK and North American businesses is particularly positive. We are confident that our focus on differentiation in nuclear, digital innovation and advisory will deliver further growth over the longer term. Our outlook for the full year is unchanged.”
Transcript of Half year results for the six months ended 30 …/media/Files/A/Atkins-Corporate/...Half year...

Half year financial report for the six months ended 30 September 2016 Good overall results, with underlying profit before tax up 14.0%, full year outlook unchanged Design, engineering and project management consultancy WS Atkins plc (Atkins or the Group) today announces its unaudited results for the six months ended 30 September 2016.
FINANCIAL SUMMARY
Note Six months to 30 Sept 2016
Six months to 30 Sept 2015
Change
Income Statement - unaudited Revenue £994.7m £904.6m 10.0% Underlying operating profit 1 £65.3m £59.0m 10.7% Underlying operating margin 2 6.6% 6.5% 0.1pp Underlying profit before tax 3 £63.6m £55.8m 14.0% Underlying profit after tax £47.7m £43.0m 10.9% Underlying diluted EPS 4 48.2p 42.8p 12.6% Statutory operating profit £23.5m £60.0m (60.8)% Statutory operating margin 2.4% 6.6% (4.2)pp Statutory profit before tax £22.4m £53.8m (58.4)% Statutory diluted EPS 22.6p 42.9p (47.3)% Dividend 5 12.5p 11.7p 6.8% People Staff numbers at 30 September 6 18,339 18,609 (1.5)% Average staff numbers 18,335 18,506 (0.9)% Net (debt)/funds 7 £(90.3)m £141.1m (164.0)% Work in hand 8 84.1% 84.3% (0.2)pp
HIGHLIGHTS Financial highlights
- Revenue up 10.0% to £994.7m, up 4.0% on a constant currency basis
- Underlying operating profit up 10.7%, underlying constant currency operating profit up 4.3%
- Underlying profit before tax of £63.6m, up 14%
- Underlying diluted EPS up 12.6%, interim dividend up 6.8%
-
Net borrowings of £90.3m at September 2016, following acquisition of EnergySolutions’ project, products and technology (PP&T) business
Operational summary
- Significant increase in UK and Europe profit, up 32.2% supported by strong markets and improved operational delivery
- Good first half performance in North America, underpinned by two major transportation projects
-
Middle East impacted by more difficult transportation and infrastructure markets and demobilisation of metro projects; good wins in Dubai property market
-
Energy business continues to face challenging market conditions in oil and gas, North American oil and gas impairment of £23.3m in the period
- First major PP&T project in US (DUF6) secured and integration progressing well Commenting on the results, Uwe Krueger, chief executive officer, said: “Despite challenges in some markets, we have delivered good underlying profitability and the near term outlook in our UK and North American businesses is particularly positive. We are confident that our focus on differentiation in nuclear, digital innovation and advisory will deliver further growth over the longer term. Our outlook for the full year is unchanged.”

Notes: 1. Underlying operating profit is profit before exceptional items (£2.8m), impairment of goodwill (£18.5m), amortisation and impairment
of acquired intangibles (£18.7m), and deferred acquisition payments (£1.8m). 2. Underlying operating margin is the value of underlying operating profit expressed as a percentage of revenue. 3. Underlying profit before tax additionally excludes profit on disposal of business of £0.6m (2015: loss £3.0m). 4. Underlying diluted EPS is based on underlying profit after tax and allows for the dilutive effect of share options. 5. Interim dividend declared for the six months to 30 September. 6. Staff numbers are shown on a full-time equivalent basis, including agency staff. 7. Net debt/funds comprise cash and cash equivalents plus financial assets and loan notes receivable less borrowings. 8. Work in hand is the value of revenue to date plus contracted and committed work at 30 September that is scheduled for the
remainder of the financial year, expressed as a percentage of the forecast revenue for the year. 9. Constant currency is used as a comparative measure to remove the impact of foreign exchange.
Enquiries Heath Drewett, Group finance director
+ 44 (0) 20 7121 2000
Kate Moy, Group investor relations director
+ 44 (0) 20 7121 2000
Matt Graydon, Group PR director
+ 44 (0) 20 7121 2000
Notes to editors 1. Atkins Atkins (www.atkinsglobal.com) is one of the world’s most respected design, engineering and project management consultancies, employing some 18,300 people across the UK, North America, Middle East, Asia Pacific and Europe. We build long-term trusted partnerships to create a world where lives are enriched through the implementation of our ideas. You can view Atkins’ recent projects on our website. 2. Attachments Attached to this announcement are: the overview of the period, business review, financial review, table of principal risks and uncertainties, statement of going concern, statement of directors’ responsibilities, the unaudited: consolidated income statement, consolidated statement of comprehensive income, consolidated balance sheet, consolidated statement of cash flows, consolidated statement of changes in equity, notes to the condensed consolidated interim financial information and the independent auditor’s review report. 3. Analyst Presentation A presentation for analysts will be held today at the Lincoln Centre at 0830. Dial-in details are available from +44 (0) 20 7353 4200 for those wishing to join the presentation by conference call. A webcast of the presentation will be available via the Company’s website, www.atkinsglobal.com. 4. Cautionary Statement This announcement has been prepared for the shareholders of Atkins as a whole and its sole purpose and use is to assist shareholders to exercise their governance rights. In particular, this announcement has not been audited or otherwise independently verified and no warranty is given as to its accuracy or completeness (other than any such warranty which is mandatorily implied by statute). Atkins and its directors and employees are not responsible for any other purpose or use or to any other person in relation to this announcement and their responsibility to shareholders shall be limited to that which is imposed by statute. This announcement contains indications of likely future developments and other forward looking statements that are subject to risk factors associated with, among other things, the economic and business circumstances occurring from time to time in the countries, sectors and business segments in which the Group operates. These and other factors could adversely affect the Group’s results, strategy and prospects. Forward looking statements involve risks, uncertainties and assumptions. They relate to events and/or depend on circumstances in the future which could cause actual results and outcomes to differ materially from those currently expected. No obligation is assumed to update any forward looking statements, whether as a result of new information, future events or otherwise. Nothing in this announcement should be construed as a profit forecast.

OVERVIEW Results The Group has delivered good underlying results for the six months to 30 September 2016, supported by the acquisition of PP&T and favourable currency effects. Underlying operating profit was £65.3m (2015: £59.0m), up 10.7% year on year, on revenue for the six months up some 10.0% to £994.7m (2015: £904.6m). Underlying organic constant currency operating profit was up 3.9% while revenue was down 2.4% on the same basis. Underlying profit before tax was £63.6m (2015: £55.8m). We believe underlying profit is a more representative measure of performance, removing the items that may give a distorted view of performance. It is arrived at after adding back impairment of goodwill of £18.5m (2015: £nil), amortisation and impairment of acquired intangible assets of £18.7m (2015: £3.9m), deferred acquisition payments of £1.8m (2015: £1.6m), exceptional transaction and integration costs of £2.8m (2015: £nil), profit on disposal of fixed assets of £nil (2015: £6.5m) and businesses of £0.6m (2015: loss of £3.0m). Underlying diluted earnings per share were up 12.6% to 48.2p (2015: 42.8p). Our UK and Europe business (45% of Group revenue) has delivered a very good first half despite delays and cancellations in the commissioning of some major rail projects. The UK Government’s continued commitment to infrastructure investment has resulted in generally strong markets and to date the EU Referendum result has had minimal impact on our business. North America (22% of Group revenue) had a particularly good first half, with our two major projects progressing well. Although the recent election result is likely to bring a period of uncertainty, we believe our work on the Purple Line and project NEON will help us to deliver good volume growth and margin progression this year. Middle East (11% of Group revenue) traded in line with our expectations in the first half of the year in a challenging environment. While the sustained low oil price and consequent changes to spending priorities are increasing uncertainty in the region, the Howard Humphreys acquisition that completed on 3 October 2016 provides a further platform for growth for us in East Africa. Asia Pacific (6% of Group) traded in line with our expectations and our strategy of geographic and market diversification continues. Energy (16% of Group revenue) continues to face challenges in some of its oil and gas markets and we have reviewed and impaired the carrying value of goodwill and intangible assets in our North America oil and gas business by £23.3m. The green light on the Hinkley Point C new build nuclear project is an encouraging signal of commitment from the UK Government to building crucial energy infrastructure. In the period, we have incurred £3.6m of trading investment in our new Acuity advisory business. Staff numbers have risen 1.6% since 31 March 2016 to 18,339, including some 600 colleagues who joined the Group when we completed the acquisition of PP&T in April 2016. The Group moved from a net funds position at 31 March 2016 of £191.7m to a net debt position of £90.3m at 30 September 2016, as a consequence of the acquisition of PP&T and the seasonal working capital outflow. Outlook for the year The Group has delivered a good underlying first half performance and the outlook for the full year remains unchanged. Dividend The Board has declared an interim dividend of 12.5p per share, representing an increase of 6.8% on last year. The interim dividend will be paid on 6 January 2017 to all shareholders on the register on 25 November 2016.

BUSINESS REVIEW
UK and Europe
Key performance indicators Six months to
30 Sept 2016 Six months to 30 Sept 2015
Change
Revenue £451.2m £458.7m (1.6)% Operating profit £39.4m £29.8m 32.2% Operating margin 8.7% 6.5% 2.2pp Work in hand 81% 83% (2)pp Staff numbers at 30 September 9,274 9,865 (6.0)% Average staff numbers 9,360 9,724 (3.7)%
Our UK and Europe business delivered a very good first half. Our operating margin improved 2.2pp to 8.7% on revenue of £451.2m (2015: £458.7m). Operating profit rose 32.2% to £39.4m. Closing staff numbers at 9,360 were down 3.7%, reflecting some projects transferred to our Energy business and headcount reductions made during the period following a slowdown in our pipeline of rail signalling projects. In a continued drive for market focus and operating efficiencies, we restructured in the first half to create a new infrastructure division and also integrated our Scandinavian business into our transportation division. Transportation had a mixed first half. In the UK, delays and cancellations in Network Rail’s signalling programme resulted in resource reductions, however Crossrail and the overall electrification programme remain healthy. We have successfully mobilised on both High Speed 2 and East West Rail. The feasibility study for the proposed Crossrail 2 project continues and positions were secured on frameworks for Transport for London and Transport for Greater Manchester. Work on the A14 and smart motorways programme continues and our intelligent mobility capability is growing with several small wins on autonomous vehicle projects. In Scandinavia, we are mobilising on the Aarhus-Lindholm electrification project for Banedanmark. Infrastructure delivered a good performance in the first half after a smooth transition to its new structure. Our pipeline of work from water utility clients is healthy and we were appointed to the Thames Water Professional Services Framework, while strengthening our position in water consultancy services with a number of other framework wins. Significant programmes of work are being delivered to UK airports, in particular at Heathrow. We support the findings of the airports commission and are positioning ourselves to support Heathrow’s expansion, while working with colleagues in the Middle East and in Europe as they investigate international aviation opportunities. Our aerospace, defence, security and technology business has made a strong start to the year with a number of wins in both defence and security. However, the aerospace market remains challenging. Faithful+Gould had a successful first half, with revenue slightly higher than in the prior year. Growth was primarily in project management services in the South East. Although unsuccessful on the rebid of the SCAPE framework, we were appointed to the Pagabo framework and continue to deliver on our pipeline of work for the education sector, local government and in support of EDF on Hinkley Point C. Outlook We have secured work in hand at 30 September 2016 of 81% (2015: 83%) of this year’s forecast revenue, which gives us confidence as we look into the second half. We see a healthy pipeline of opportunities as the infrastructure market remains supported by continuing investment. The EU Referendum result has had minimal impact on our business to date, although we will closely monitor developments from this as well as any potential investment impact from the forthcoming Autumn Statement. We are also exploring niche acquisitions to strengthen our digital and technology skills base.

North America
Key performance indicators Six months to
30 Sept 2016 Six months to 30 Sept 2015
Change
Revenue £221.9m £177.7m 24.9% Operating profit £15.3m £8.5m 80.0% Operating margin 6.9% 4.8% 2.1pp Work in hand 86% 83% 3pp Staff numbers at 30 September 2,849 2,752 3.5% Average staff numbers 2,780 2,759 0.8%
Our North American business had a particularly good first half with an 80.0% increase in operating profit, at a margin of 6.9% (2015: 4.8%). Revenue rose 24.9% (10.1% rise on a constant currency basis). Headcount increased to 2,849 (2015: 2,752), reflecting the major Purple Line and project NEON wins last year. Our technical professional organisation is seeing improved productivity and we are increasingly utilising the Group’s global design centre capabilities in India. Our Department of Transportation (DOT) business delivered a stable performance with work on project NEON, for the Nevada DOT, progressing very well. Public and private performed well on a broad range of projects in the half as it exited non-core business services and rationalised offices. As anticipated, the federal market has seen reduced volume with a slower release of task orders in advance of the election, however overall performance has been good. Our work on contracts for the National Guard and FEMA is ongoing. Intermodal had a mixed first half with a slower start on Purple Line work at the beginning of the period than had been anticipated and some headwinds in aviation. Purple Line resources are now fully mobilised and the project is making good progress. Collaboration with our Asia Pacific resources has increased our presence in the rail market with a number of small wins. Overall Faithful+Gould has delivered a stable performance in the aviation, manufacturing and pharmaceuticals markets, and achieved a successful renewal of the Bruce Power framework in the period. Outlook Work in hand at 30 September 2016 is 86% of this year’s forecast revenue (2015: 83%). While we do not expect to see a short-term benefit from the five-year Transportation Bill, our work on Purple Line and project NEON will help us to deliver good volume growth and margin progression this year. Our focus is now on the successful delivery of these two key projects and securing other major infrastructure opportunities within our pipeline. Our outlook for the rest of the year is positive.
Middle East
Key performance indicators Six months to
30 Sept 2016 Six months to 30 Sept 2015
Change
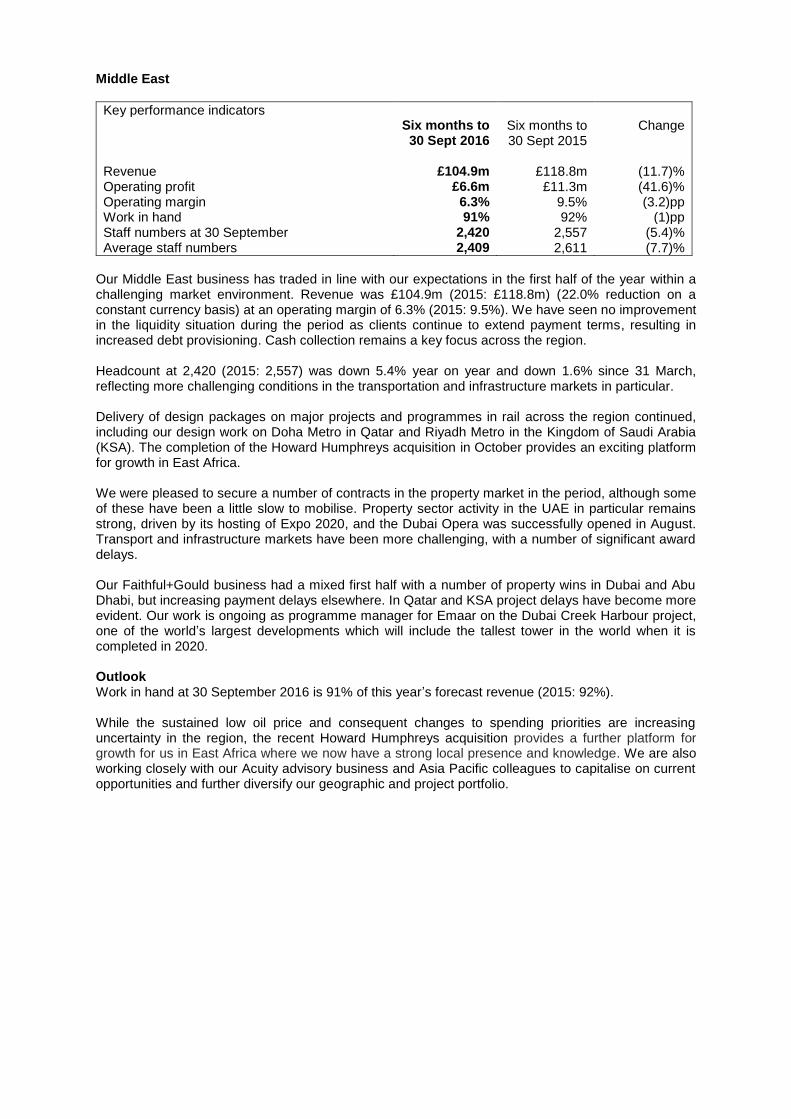
Revenue £104.9m £118.8m (11.7)% Operating profit £6.6m £11.3m (41.6)% Operating margin 6.3% 9.5% (3.2)pp Work in hand 91% 92% (1)pp Staff numbers at 30 September 2,420 2,557 (5.4)% Average staff numbers 2,409 2,611 (7.7)%
Our Middle East business has traded in line with our expectations in the first half of the year within a challenging market environment. Revenue was £104.9m (2015: £118.8m) (22.0% reduction on a constant currency basis) at an operating margin of 6.3% (2015: 9.5%). We have seen no improvement in the liquidity situation during the period as clients continue to extend payment terms, resulting in increased debt provisioning. Cash collection remains a key focus across the region. Headcount at 2,420 (2015: 2,557) was down 5.4% year on year and down 1.6% since 31 March, reflecting more challenging conditions in the transportation and infrastructure markets in particular. Delivery of design packages on major projects and programmes in rail across the region continued, including our design work on Doha Metro in Qatar and Riyadh Metro in the Kingdom of Saudi Arabia (KSA). The completion of the Howard Humphreys acquisition in October provides an exciting platform for growth in East Africa. We were pleased to secure a number of contracts in the property market in the period, although some of these have been a little slow to mobilise. Property sector activity in the UAE in particular remains strong, driven by its hosting of Expo 2020, and the Dubai Opera was successfully opened in August. Transport and infrastructure markets have been more challenging, with a number of significant award delays. Our Faithful+Gould business had a mixed first half with a number of property wins in Dubai and Abu Dhabi, but increasing payment delays elsewhere. In Qatar and KSA project delays have become more evident. Our work is ongoing as programme manager for Emaar on the Dubai Creek Harbour project, one of the world’s largest developments which will include the tallest tower in the world when it is completed in 2020. Outlook Work in hand at 30 September 2016 is 91% of this year’s forecast revenue (2015: 92%). While the sustained low oil price and consequent changes to spending priorities are increasing uncertainty in the region, the recent Howard Humphreys acquisition provides a further platform for growth for us in East Africa where we now have a strong local presence and knowledge. We are also working closely with our Acuity advisory business and Asia Pacific colleagues to capitalise on current opportunities and further diversify our geographic and project portfolio.

Asia Pacific
Key performance indicators Six months to
30 Sept 2016 Six months to 30 Sept 2015
Change
Revenue £57.3m £51.6m 11.0% Operating profit £4.1m £3.4m 20.6% Operating margin 7.2% 6.6% 0.6pp Work in hand 90% 84% 6pp Staff numbers at 30 September 1,288 1,461 (11.8)% Average staff numbers 1,307 1,499 (12.8)%
Our Asia Pacific business has traded in line with our expectations. Revenue increased 11.0% to £57.3m (2015: £51.6m) at an operating margin of 7.2% (2015: 6.6%). Headcount reduced to 1,288 (2015: 1,461), a decrease of 11.8% as we streamlined our businesses in mainland China and Hong Kong. Our strategy of geographic and market diversification continues, supported by our new Acuity advisory business which is focused on opportunities in southeast Asia and the Middle East. Our multi-disciplinary offering with Faithful+Gould provides a more integrated service for private sector clients in the region. In Hong Kong, we continue to diversify our service offering and project portfolio in the infrastructure sector and were particularly pleased to secure the airfield facilities design consultancy for Hong Kong airport. We are also exploring new sectors, for example waste incineration. We have seen some early signs of an improvement in the mainland China property market, but remain cautious as to whether this will be sustained. Our overseas work with Chinese contractors continues with new project wins secured in Africa and the Middle East in the property, transport and energy sectors. We are also supporting Chinese developers in outbound investments in urban development. In southeast Asia, our work to support Prasarana in a client advisory role on the delivery of its LRT3 light railway project in Malaysia is progressing well. Our Faithful+Gould business experienced a slowdown in mainland China due to reduced direct investment there by its international clients, although by contrast it enjoyed growth overall in the rest of Asia. Outlook Work in hand at 30 September 2016 is 90% of this year’s forecast revenue (2015: 84%). We remain cautious around the property market in mainland China and are monitoring the political situation in Hong Kong. The Group’s newly established presence in Kenya and Tanzania is producing project leads with Chinese clients in property and transportation, in addition to infrastructure finance support and technical advisory opportunities for our Acuity business in Asia. Our immediate outlook remains unchanged and the region continues to offer attractive, medium-term growth.

Energy
Key performance indicators Six months to
30 Sept 2016 Six months to 30 Sept 2015
Change
Revenue £154.9m £97.8m 58.4% Operating profit £8.4m £7.1m 18.3% Operating margin 5.4% 7.3% (1.9)pp Work in hand 82% 83% (1)pp Staff numbers at 30 September 2,373 1,887 25.8% Average staff numbers 2,352 1,830 28.5%
Our Energy business continues to face challenges in some of its oil and gas markets while nuclear, power and renewables performed more in line with our expectations. Revenue rose 58.4% to £154.9m (2015: £97.8m), reflecting the acquisition of PP&T which completed in April and contributed revenue of £58.1m in the period. The reduced year on year margin of 5.4% (2015: 7.3%) reflects the difficult market conditions. In order to gain further operating efficiencies the business has restructured along regional lines in the period, although our global strategy and client engagement model is unchanged. Headcount increased 25.8% to 2,373 (2015: 1,887) with some 600 colleagues joining from PP&T, partially offset by rationalisation in our oil and gas business. The trading environment for our oil and gas businesses in the UK and North America remains very challenging. During the period we took further steps to restructure the business and, as a consequence, reviewed and impaired the carrying value of goodwill and acquired intangible assets in our North America oil and gas business by £23.3m. By contrast, our Middle East oil and gas business has continued to trade well and in the UK we were recently awarded an extension to our existing asset integrity framework agreement with Repsol Sinopec Resources UK. Nuclear overall had an improving first half. In September, we were delighted to win our first major nuclear contract in the US since completing the acquisition of PP&T. The US Department of Energy (DOE) has selected us, along with our joint venture partners Westinghouse and Fluor, to operate depleted uranium hexafluoride (DUF6) conversion over a five-year period at facilities in Kentucky and Ohio. However, product sales to Japan, associated with the treatment of decontaminated water at the Fukushima site, continue to be slower than anticipated. Against a good prior year, power has seen a stable first half with a successful rebid for National Grid ’s three-year framework. Renewables maintains a leading position in offshore wind engineering and design in the UK with recent installations for Statoil and DONG. Work is continuing as engineering partner on Hexicon’s multi-turbine offshore wind floating platform and we have now also secured the detailed design work on the project. Outlook Work in hand at 30 September 2016 was 82% (2015: 83%) of forecast revenue for the year. Actions to adapt to the more cost conscious oil and gas market continue, although we will maintain our capability in anticipation of an eventual upturn in the sector. Our safety and asset integrity expertise continues to be in demand and represents a good long-term market, as evidenced by the Repsol award. The integration of PP&T is progressing well and the recent DOE contract win marks a major step in our efforts to establish a greater footprint in the US nuclear market. The green light on the Hinkley Point C new build nuclear project is an encouraging signal of commitment from the UK Government to building crucial energy infrastructure and presents potential future opportunities. The outlook for our Energy business overall remains positive.

FINANCIAL REVIEW Revenue and operating profit performance for the six months to 30 September 2016 is discussed in more detail in the preceding Business Review. Results The Group has delivered good underlying results for the six months to 30 September 2016, reporting underlying operating profit of £65.3m (2015: £59.0m), up 10.7% year on year. Underlying operating profit is arrived at after adding back impairment of goodwill £18.5m (2015: £nil), amortisation and impairment of acquired intangible assets of £18.7m (2015: £3.9m), deferred acquisition payments of £1.8m (2015: £1.6m), exceptional transaction and integration costs of £2.8m (2015: £nil) and profit on disposal of fixed assets of £nil (2015: £6.5m). Underlying profit before tax was £63.6m (2015: £55.8) and is arrived at after adjusting for the items mentioned above and additionally the profit on disposal of businesses of £0.6m (2015: loss of £3.0m). Reported profit before tax was £22.4m (2015: £53.8m).
30 Sept
2016 30 Sept
2015 31 March
2016 £m Profit before tax 22.4 53.8 131.1 Adjusted for:
Exceptional items 2.8 (6.5) (4.7) Impairment of goodwill 18.5 - - Amortisation and impairment of acquired intangibles 18.7 3.9 6.3 Deferred acquisition payments 1.8 1.6 3.2 Net (profit)/loss on disposal of businesses (0.6) 3.0 3.1
Underlying profit before tax 63.6 55.8 139.0
Pensions Pension costs The cost of the Group’s defined benefit pension schemes for the six months to 30 September 2016 amounted to £5.2m (2015: £6.0m), of which net finance costs represented £3.9m (2015: £4.8m). Funding Under the last agreed recovery plan the Group will contribute £33.6m to the Atkins Pension Plan (the Plan) for the year ending 31 March 2017, with annual contributions escalating by 2.5% each year until 31 March 2025. The Plan is closed to the future accrual of benefit and all defined benefit members of the Plan were transferred to a defined contribution section for future service where it was clear they did not benefit from a statutory or contractual right to a final salary pension. Negotiations with the Trustee on the latest triennial valuation as at 31 March 2016 are ongoing. IAS 19 (revised 2011) – valuation and accounting treatment The Group determines pension scheme funding with reference to actuarial valuations, but for reporting purposes uses IAS 19 (revised 2011). Under this Standard the Group recognised an increased retirement benefit liability net of deferred tax of £333.5m (30 September 2015: £214.8m; 31 March 2016: £216.0m) due primarily to a reduction in the discount rate in the period to 2.4% (31 March: 3.5%). The 30 September 2016 figures now include £10.0m (net of deferred tax) of net retirement benefit assets acquired as part of the PP&T acquisition. The key assumptions used in the IAS 19 (revised 2011) valuation are detailed in note 18 to the condensed consolidated interim financial information. Income tax The Group’s income tax expense for the six months ended 30 September 2016 was £0.2m (2015: £10.7m) giving a reported effective tax rate of 0.9% (2015: 19.9%). The Group’s underlying effective tax rate of 25.0% (2015: 23.0%) is different from the Group’s reported effective tax rate due to the tax impact of acquisition intangibles amortisation, impairment of goodwill and acquired intangible assets, exceptional external fees and integration costs and deferred acquisition payments. The underlying effective tax rate is higher than the UK statutory tax rate of 20% (2015: 20%) primarily due to the geographic mix of the Group’s profit.
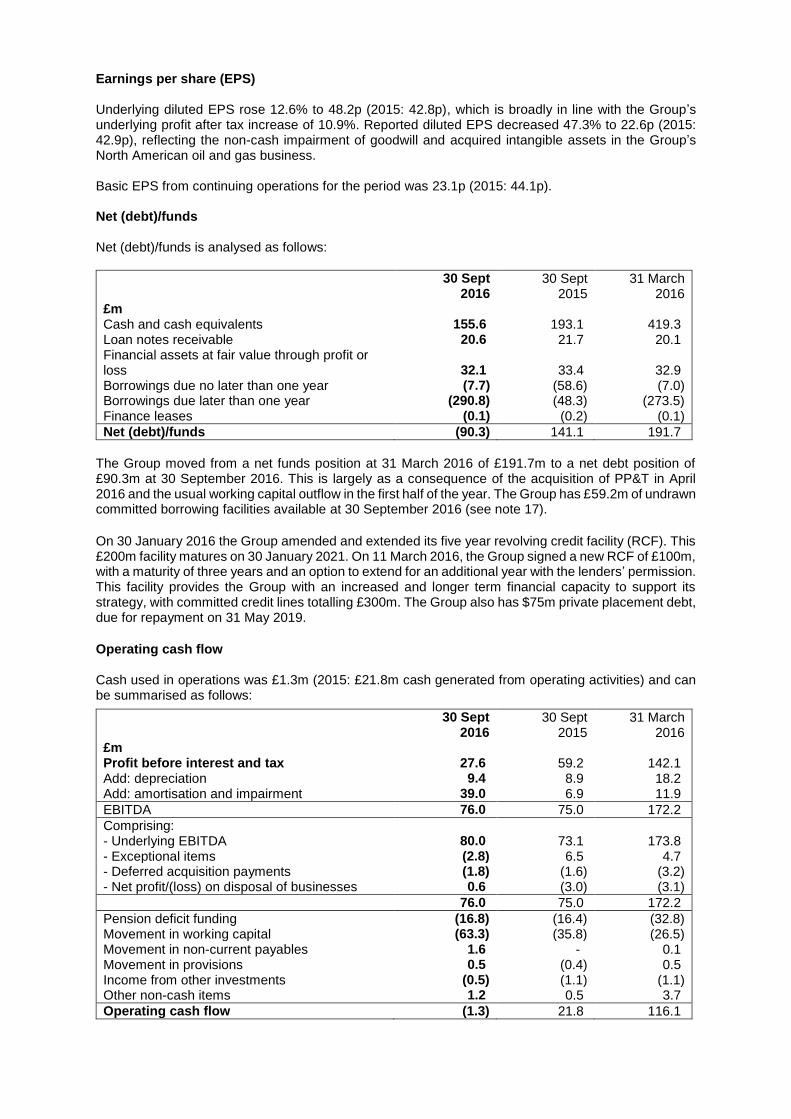
Earnings per share (EPS) Underlying diluted EPS rose 12.6% to 48.2p (2015: 42.8p), which is broadly in line with the Group’s underlying profit after tax increase of 10.9%. Reported diluted EPS decreased 47.3% to 22.6p (2015: 42.9p), reflecting the non-cash impairment of goodwill and acquired intangible assets in the Group’s North American oil and gas business. Basic EPS from continuing operations for the period was 23.1p (2015: 44.1p). Net (debt)/funds Net (debt)/funds is analysed as follows:
30 Sept
2016 30 Sept
2015 31 March
2016 £m Cash and cash equivalents 155.6 193.1 419.3 Loan notes receivable 20.6 21.7 20.1 Financial assets at fair value through profit or loss 32.1 33.4 32.9 Borrowings due no later than one year (7.7) (58.6) (7.0) Borrowings due later than one year (290.8) (48.3) (273.5) Finance leases (0.1) (0.2) (0.1)
Net (debt)/funds (90.3) 141.1 191.7
The Group moved from a net funds position at 31 March 2016 of £191.7m to a net debt position of £90.3m at 30 September 2016. This is largely as a consequence of the acquisition of PP&T in April 2016 and the usual working capital outflow in the first half of the year. The Group has £59.2m of undrawn committed borrowing facilities available at 30 September 2016 (see note 17).
On 30 January 2016 the Group amended and extended its five year revolving credit facility (RCF). This £200m facility matures on 30 January 2021. On 11 March 2016, the Group signed a new RCF of £100m, with a maturity of three years and an option to extend for an additional year with the lenders’ permission. This facility provides the Group with an increased and longer term financial capacity to support its strategy, with committed credit lines totalling £300m. The Group also has $75m private placement debt, due for repayment on 31 May 2019.
Operating cash flow Cash used in operations was £1.3m (2015: £21.8m cash generated from operating activities) and can be summarised as follows:
30 Sept
2016 30 Sept
2015 31 March
2016 £m Profit before interest and tax 27.6 59.2 142.1 Add: depreciation 9.4 8.9 18.2 Add: amortisation and impairment 39.0 6.9 11.9
EBITDA 76.0 75.0 172.2
Comprising: - Underlying EBITDA 80.0 73.1 173.8 - Exceptional items (2.8) 6.5 4.7 - Deferred acquisition payments (1.8) (1.6) (3.2) - Net profit/(loss) on disposal of businesses 0.6 (3.0) (3.1)
76.0 75.0 172.2
Pension deficit funding (16.8) (16.4) (32.8) Movement in working capital (63.3) (35.8) (26.5) Movement in non-current payables 1.6 - 0.1 Movement in provisions 0.5 (0.4) 0.5 Income from other investments (0.5) (1.1) (1.1) Other non-cash items 1.2 0.5 3.7
Operating cash flow (1.3) 21.8 116.1

The year on year deterioration in working capital is primarily due to a combination of increased lockup in our North American business (reflecting its significant growth in the period), extended payment terms experienced in the Middle East and some cash flow timing issues on a couple of projects in PP&T. RISKS The Group Risk Committee, meets periodically and considers new strategic, financial and operational risks as they arise and identifies actions to mitigate those risks. The Board reviews the work undertaken by this committee. Key risks and their mitigation have not changed significantly in the period from those disclosed on pages 38 to 41 of the annual financial statements for the year ended 31 March 2016. The key risks and mitigation are summarised below:
Risk Mitigation
Economic outlook - Reductions or delays in government investment in infrastructure - Reduced levels of spend and clients’ ability to pay
Increased diversification and focus on growth areas - Increased use of our Indian global design centres - Staff redeployment - Credit checks
Financial - Limitations on ability to invest in growth - Managing defined benefit pension schemes
Ongoing review of the Group’s trading and funding position, and de-risking of the defined benefit pension schemes
Geopolitical Political instability
Focus on geographies with stable trading environments and use of latest professional risk and security information
Market - Changes in contracting environment - Increased pressure on pricing and margins
Robust review procedures
Regulatory/legal restrictions preventing trade Use of external advice and investment in staff training and communication
Strategic acquisition and integration Robust acquisition processes and thorough due diligence, integration plans and implementation plans
Crisis event Group crisis management plan in place
Health, safety and environmental shortcomings
Implementation of worldwide safety standards and mandatory accident and near-miss reporting. Development of a security standard
Physical and data security compromised - Safety and security of our people - Cyber crime
Use of appropriate data protection measures and staff training
Projects - Poor project management - Client dissatisfaction and reputational damage
Training programmes to embed project management best practice, project director technical reviews and online project management systems. Project controls and operational reviews of performance and delivery
Staff recruitment and retention Regular succession planning reviews together with business review of metrics, annual performance appraisals and personal development plans
Technical delivery Robust review procedures, training and technical centres of excellence. Development of a technical assurance standard
Notwithstanding that no new key risks have been identified in the period, we continue to manage a number of potential risks and uncertainties which could have a material impact on our long-term performance. Many of these risks are common to other companies and we assess them to establish the principal risks for the Group. While the EU Referendum result has had minimal impact on our business to date, we will closely monitor developments. Effective risk management continues to be embedded in our governance framework, which is summarised in the Corporate governance report on pages 61 to 68 of the annual financial statements for the year ended 31 March 2016.
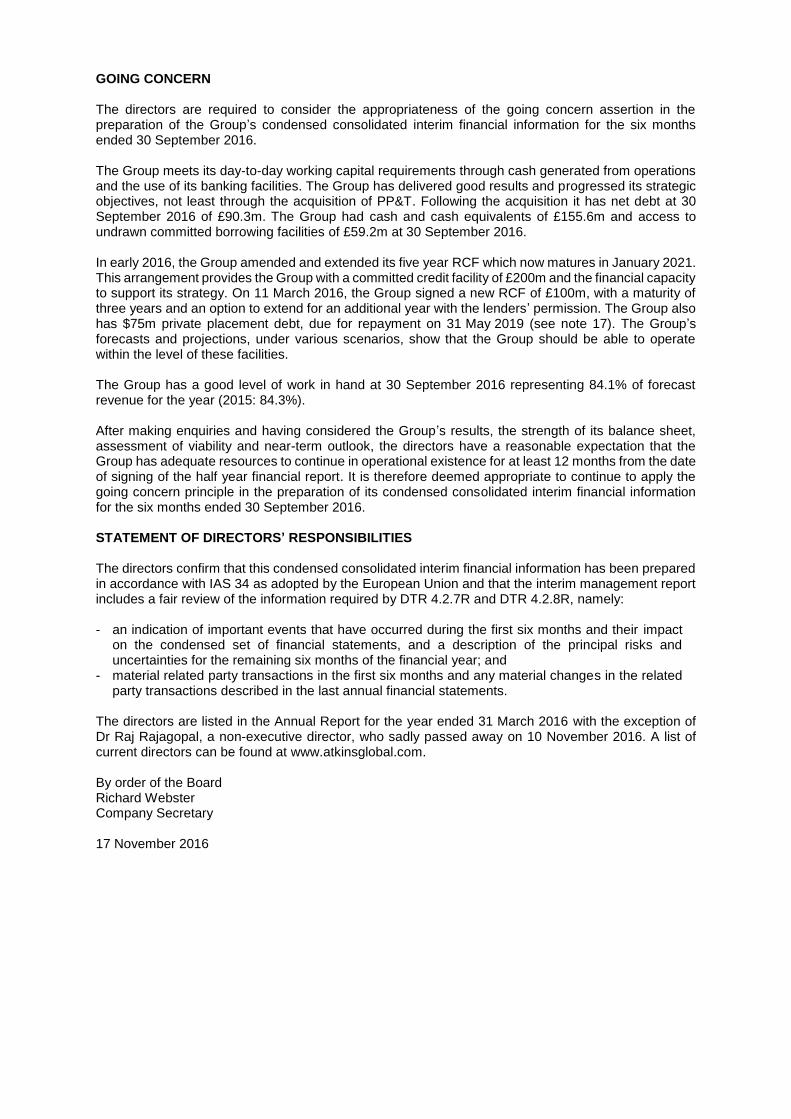
GOING CONCERN The directors are required to consider the appropriateness of the going concern assertion in the preparation of the Group’s condensed consolidated interim financial information for the six months ended 30 September 2016. The Group meets its day-to-day working capital requirements through cash generated from operations and the use of its banking facilities. The Group has delivered good results and progressed its strategic objectives, not least through the acquisition of PP&T. Following the acquisition it has net debt at 30 September 2016 of £90.3m. The Group had cash and cash equivalents of £155.6m and access to undrawn committed borrowing facilities of £59.2m at 30 September 2016. In early 2016, the Group amended and extended its five year RCF which now matures in January 2021. This arrangement provides the Group with a committed credit facility of £200m and the financial capacity to support its strategy. On 11 March 2016, the Group signed a new RCF of £100m, with a maturity of three years and an option to extend for an additional year with the lenders’ permission. The Group also has $75m private placement debt, due for repayment on 31 May 2019 (see note 17). The Group’s forecasts and projections, under various scenarios, show that the Group should be able to operate within the level of these facilities. The Group has a good level of work in hand at 30 September 2016 representing 84.1% of forecast revenue for the year (2015: 84.3%). After making enquiries and having considered the Group’s results, the strength of its balance sheet, assessment of viability and near-term outlook, the directors have a reasonable expectation that the Group has adequate resources to continue in operational existence for at least 12 months from the date of signing of the half year financial report. It is therefore deemed appropriate to continue to apply the going concern principle in the preparation of its condensed consolidated interim financial information for the six months ended 30 September 2016. STATEMENT OF DIRECTORS’ RESPONSIBILITIES The directors confirm that this condensed consolidated interim financial information has been prepared in accordance with IAS 34 as adopted by the European Union and that the interim management report includes a fair review of the information required by DTR 4.2.7R and DTR 4.2.8R, namely: - an indication of important events that have occurred during the first six months and their impact
on the condensed set of financial statements, and a description of the principal risks and uncertainties for the remaining six months of the financial year; and
- material related party transactions in the first six months and any material changes in the related party transactions described in the last annual financial statements.
The directors are listed in the Annual Report for the year ended 31 March 2016 with the exception of Dr Raj Rajagopal, a non-executive director, who sadly passed away on 10 November 2016. A list of current directors can be found at www.atkinsglobal.com. By order of the Board Richard Webster Company Secretary 17 November 2016

Consolidated income statement for the six months ended 30 September 2016
Unaudited Unaudited Audited
Six months to Six months to Year to
30 Sept 2016 30 Sept 2015 31 March 2016 Note £m £m £m
Revenue
5 994.7 904.6 1,861.9
Cost of sales (615.8) (550.3) (1,109.2)
Gross profit 378.9 354.3 752.7 Administrative expenses (355.4) (294.3) (609.3) Operating profit 5 23.5 60.0 143.4
Comprising: - Underlying operating profit 65.3 59.0 148.2 - Exceptional items 8 (2.8) 6.5 4.7 - Impairment of goodwill 15 (18.5) - - - Impairment of acquired intangibles 14 (4.8) - - - Amortisation of acquired intangibles (13.9) (3.9) (6.3) - Deferred acquisition payments (1.8) (1.6) (3.2)
23.5 60.0 143.4
Net profit/(loss) on disposal of businesses 6 0.6 (3.0) (3.1) Income from other investments 0.5 1.1 1.1 Share of post-tax profit from joint ventures 3.0 1.1 0.7 Profit before interest and tax 27.6 59.2 142.1 Finance income 9 2.6 1.7 4.0 Finance costs 9 (7.8) (7.1) (15.0) Net finance costs 9 (5.2) (5.4) (11.0) Profit before tax 22.4 53.8 131.1
Comprising: - Underlying profit before tax 63.6 55.8 139.0 - Exceptional items 8 (2.8) 6.5 4.7 - Amortisation of acquired intangibles (13.9) (3.9) (6.3) - Impairment of goodwill 15 (18.5) - - - Impairment of acquired intangibles 14 (4.8) - - - Deferred acquisition payments (1.8) (1.6) (3.2) - Net profit/(loss) on disposal of
businesses 6 0.6 (3.0) (3.1)
22.4 53.8 131.1
Income tax expense 10 (0.2) (10.7) (27.7) Profit for the period 22.2 43.1 103.4
Profit attributable to: Owners of the parent 22.5 42.9 103.2 Non-controlling interests (0.3) 0.2 0.2
22.2 43.1 103.4
Earnings per share Basic earnings per share 12 23.1p 44.1p 106.0p Diluted earnings per share 12 22.6p 42.9p 103.0p Underlying diluted earnings per share 12 48.2p 42.8p 107.3p
The accompanying notes form an integral part of this condensed consolidated interim financial information.
Consolidated statement of comprehensive income for the six months ended 30 September 2016
Unaudited Unaudited Audited
Six months to Six months to Year to
30 Sept 2016 30 Sept 2015 31 March 2016 Note £m £m £m
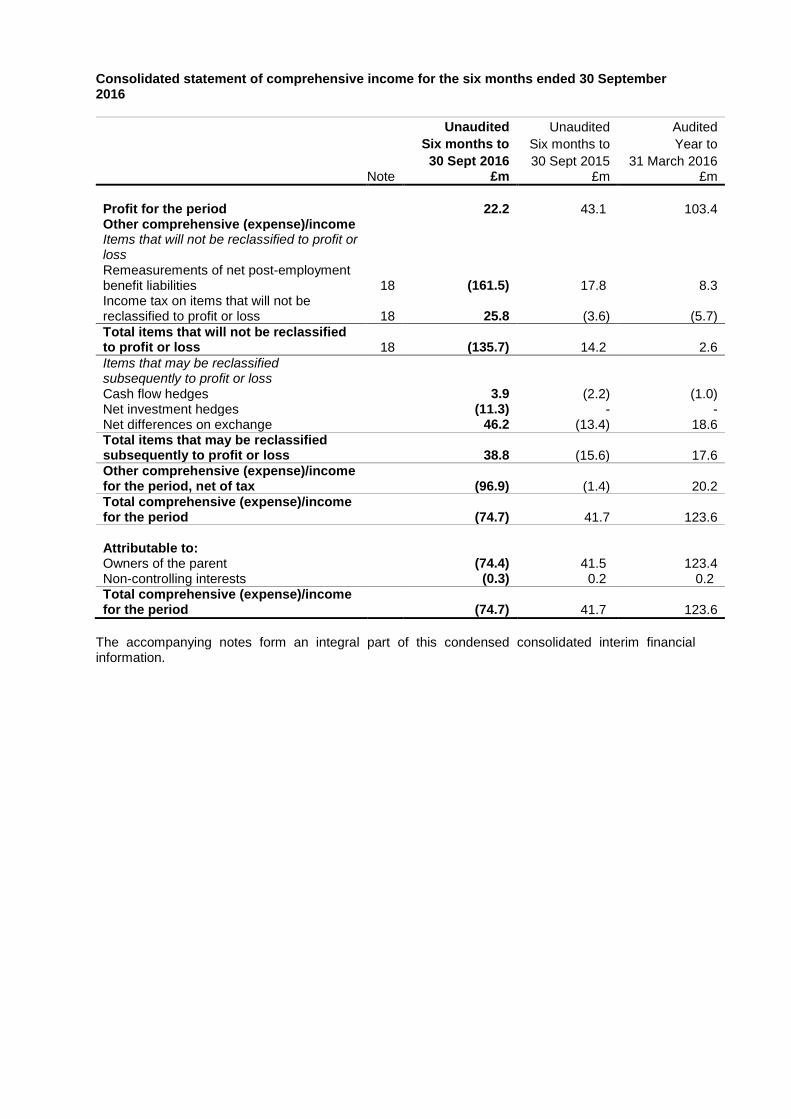
Profit for the period 22.2 43.1 103.4 Other comprehensive (expense)/income Items that will not be reclassified to profit or loss
Remeasurements of net post-employment benefit liabilities 18 (161.5) 17.8 8.3 Income tax on items that will not be reclassified to profit or loss 18 25.8 (3.6) (5.7)
Total items that will not be reclassified to profit or loss 18 (135.7) 14.2 2.6
Items that may be reclassified subsequently to profit or loss Cash flow hedges 3.9 (2.2) (1.0) Net investment hedges (11.3) - - Net differences on exchange 46.2 (13.4) 18.6 Total items that may be reclassified subsequently to profit or loss 38.8 (15.6) 17.6 Other comprehensive (expense)/income for the period, net of tax (96.9) (1.4) 20.2 Total comprehensive (expense)/income for the period (74.7) 41.7 123.6 Attributable to: Owners of the parent (74.4) 41.5 123.4 Non-controlling interests (0.3) 0.2 0.2 Total comprehensive (expense)/income for the period (74.7) 41.7 123.6
The accompanying notes form an integral part of this condensed consolidated interim financial information.

Consolidated balance sheet as at 30 September 2016
Unaudited Unaudited Audited 30 Sept 2016 30 Sept 2015 31 March 2016 Note £m £m £m
Assets Non-current assets Goodwill 15 374.4 236.3 253.2 Other intangible assets 14 195.0 46.7 46.8 Property, plant and equipment 13 51.9 51.7 51.9 Investments in joint ventures 11.5 4.8 4.3 Deferred income tax assets 86.5 72.8 66.5 Derivative financial instruments 16 5.6 0.6 2.0 Post-employment benefit assets 18 12.0 - - Other receivables 22.5 27.0 29.1
759.4 439.9 453.8
Current assets Trade and other receivables 609.5 451.9 480.0 Financial assets at fair value through profit or loss 16 32.1 33.4 32.9 Cash and cash equivalents 155.6 193.1 419.3 Derivative financial instruments 16 3.8 0.5 1.3
801.0 678.9 933.5
Liabilities Current liabilities Borrowings 17 (7.8) (58.7) (7.0) Trade and other payables (553.2) (454.4) (483.0) Derivative financial instruments 16 (0.9) (0.5) (0.5) Current income tax liabilities (30.0) (30.3) (28.3) Provisions for other liabilities and charges (2.2) (0.7) (1.1)
(594.1) (544.6) (519.9) Net current assets 206.9 134.3 413.6
Non-current liabilities Borrowings 17 (290.8) (48.4) (273.6) Provisions for other liabilities and charges (2.2) (2.3) (2.8) Post-employment benefit liabilities 18 (436.3) (286.2) (285.8) Derivative financial instruments 16 (0.7) (1.0) (1.0) Deferred income tax liabilities (45.8) (11.2) (11.7) Other non-current liabilities (4.9) (3.2) (3.2)
(780.7) (352.3) (578.1)
Net assets 185.6 221.9 289.3
Capital and reserves Ordinary shares 19 0.5 0.5 0.5 Share premium account 62.4 62.4 62.4 Merger reserve 8.9 8.9 8.9 Retained earnings 114.2 149.7 217.2 Equity attributable to owners of the parent 186.0 221.5 289.0
Non-controlling interests (0.4) 0.4 0.3 Total equity 185.6 221.9 289.3
The accompanying notes form an integral part of this condensed consolidated interim financial information.
Consolidated statement of cash flows for the six months ended 30 September 2016
Unaudited Unaudited Audited
Six months to Six months to Year to
30 Sept 2016 30 Sept 2015 31 March 2016
Note £m £m £m
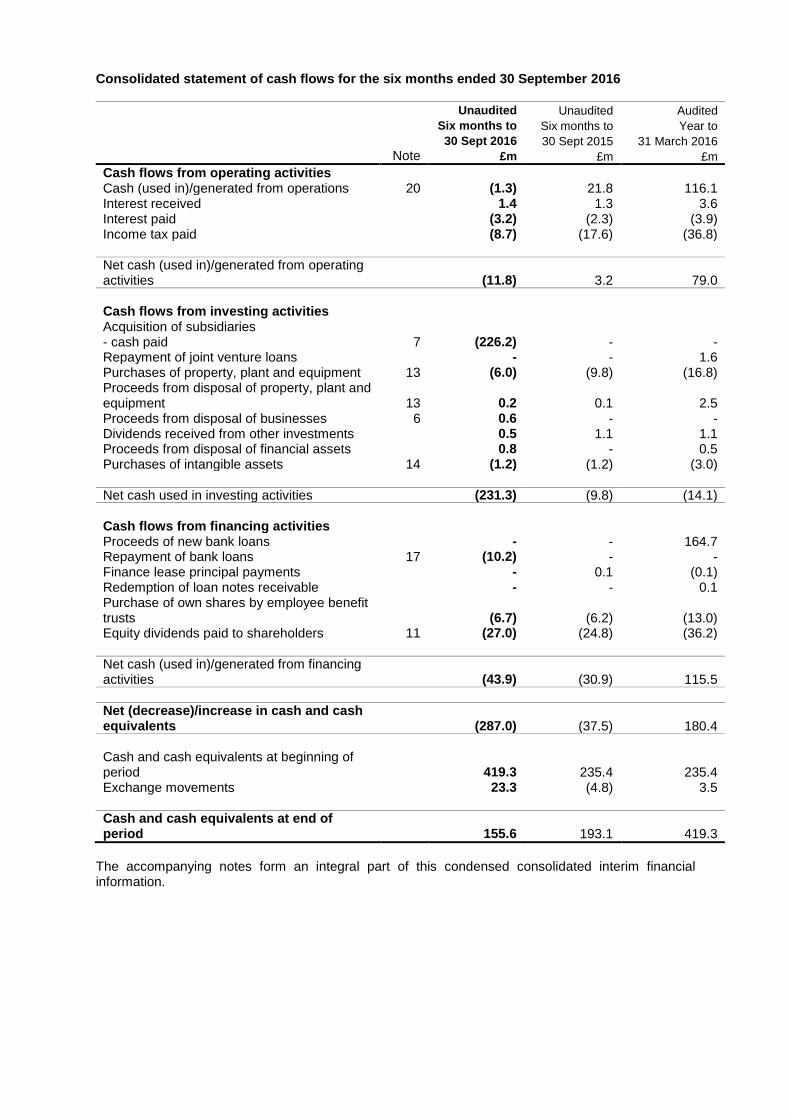
Cash flows from operating activities Cash (used in)/generated from operations 20 (1.3) 21.8 116.1 Interest received 1.4 1.3 3.6 Interest paid (3.2) (2.3) (3.9) Income tax paid (8.7) (17.6) (36.8)
Net cash (used in)/generated from operating activities (11.8) 3.2 79.0
Cash flows from investing activities Acquisition of subsidiaries - cash paid 7 (226.2) - - Repayment of joint venture loans - - 1.6 Purchases of property, plant and equipment 13 (6.0) (9.8) (16.8) Proceeds from disposal of property, plant and equipment 13 0.2 0.1 2.5 Proceeds from disposal of businesses 6 0.6 - - Dividends received from other investments 0.5 1.1 1.1 Proceeds from disposal of financial assets 0.8 - 0.5 Purchases of intangible assets 14 (1.2) (1.2) (3.0)
Net cash used in investing activities (231.3) (9.8) (14.1)
Cash flows from financing activities Proceeds of new bank loans - - 164.7 Repayment of bank loans 17 (10.2) - - Finance lease principal payments - 0.1 (0.1) Redemption of loan notes receivable - - 0.1 Purchase of own shares by employee benefit trusts (6.7) (6.2) (13.0) Equity dividends paid to shareholders 11 (27.0) (24.8) (36.2)
Net cash (used in)/generated from financing activities (43.9) (30.9) 115.5
Net (decrease)/increase in cash and cash equivalents (287.0) (37.5) 180.4
Cash and cash equivalents at beginning of period 419.3 235.4 235.4 Exchange movements 23.3 (4.8) 3.5 Cash and cash equivalents at end of period 155.6 193.1 419.3
The accompanying notes form an integral part of this condensed consolidated interim financial information.

Consolidated statement of changes in equity as at 30 September 2016
Attributable to owners of the parent
Share Non-
Ordinary premium Merger Retained controlling Total
shares account reserve earnings interests equity
Unaudited Note £m £m £m £m £m £m
Balance at 1 April 2016 0.5 62.4 8.9 217.2 0.3 289.3 Profit/(loss) for the period
- - - 22.5 (0.3) 22.2
Remeasurements of net post-employment benefit liabilities
- - - (161.5) - (161.5) Income tax on items that will not be reclassified to profit or loss
- - - 25.8 - 25.8
Cash flow hedges - - - 3.9 - 3.9
Net investment hedges - - - (11.3) - (11.3) Net differences on exchange
- - - 46.2 - 46.2
Other comprehensive expense for the period
- - - (96.9) - (96.9)
Total comprehensive expense for the period
- - - (74.4) (0.3) (74.7)
Dividends to owners of the parent
11 - - - (27.0) - (27.0)
Share-based payments - - - 4.7 - 4.7 Tax credit relating to share-based payments
- - - 0.4 - 0.4
Employee benefit trusts
- - - (6.7) - (6.7)
Total contributions by and distributions to owners of the parent, recognised directly in equity
- - - (28.6) - (28.6)
Acquisition of non-controlling interest
- - - - (0.3) (0.3)
Derecognition of non-controlling interest
- - - - (0.1) (0.1)
Balance at 30 September 2016
0.5 62.4 8.9 114.2 (0.4) 185.6

Attributable to owners of the parent
Share Non-
Ordinary premium Merger Retained controlling Total
shares account reserve earnings interests equity
Unaudited Note £m £m £m £m £m £m
Balance at 1 April 2015 0.5 62.4 8.9 133.0 0.2 205.0
Profit for the period - - - 42.9 0.2 43.1
Remeasurements of net post-employment benefit liabilities
- - - 17.8 - 17.8 Income tax on items that will not be reclassified to profit or loss
- - - (3.6) - (3.6)
Cash flow hedges - - - (2.2) - (2.2) Net differences on exchange
- - - (13.4) - (13.4)
Other comprehensive expense for the period
- - - (1.4) - (1.4)
Total comprehensive income for the period
- - - 41.5 0.2 41.7
Dividends to owners of the parent
11 - - - (24.8) - (24.8)
Share-based payments - - - 5.2 - 5.2 Tax credit relating to share-based payments
- - - 1.0 - 1.0
Employee benefit trusts - - - (6.2) - (6.2) Total contributions by and distributions to owners of the parent, recognised directly in equity
- - - (24.8) - (24.8)
Balance at 30 September 2015
0.5 62.4 8.9 149.7 0.4 221.9

Attributable to owners of the parent
Share Non-
Ordinary premium Merger Retained controlling Total
shares account reserve earnings interests Equity
Audited Note £m £m £m £m £m £m
Balance at 1 April 2015 0.5 62.4 8.9 133.0 0.2 205.0
Profit for the year - - - 103.2 0.2 103.4
Remeasurements of net post-employment benefit liabilities
- - - 8.3 - 8.3 Income tax on items that will not be reclassified to profit or loss
- - - (5.7) - (5.7)
Cash flow hedges - - - (1.0) - (1.0) Net differences on exchange
- - - 18.6 - 18.6
Other comprehensive income for the year
- - - 20.2 - 20.2
Total comprehensive income for the year
- - - 123.4 0.2 123.6
Dividends to owners of the parent
11 - - - (36.2) (0.1) (36.3)
Share-based payments - - - 9.4 - 9.4 Tax credit relating to share-based payments
- - - 0.6 - 0.6
Employee benefit trusts - - - (13.0) - (13.0) Total contributions by and distributions to owners of the parent, recognised directly in equity
- - - (39.2) (0.1) (39.3)
Balance at 31 March 2016
0.5 62.4 8.9 217.2 0.3 289.3
The merger reserve relates to the issue of shares in respect of previous acquisitions. The accompanying notes form an integral part of this condensed consolidated interim financial information.

Notes to the condensed consolidated interim financial information for the six months ended 30 September 2016 (unaudited) 1. General information WS Atkins plc (the Company) is a public limited company, which is listed on the London Stock Exchange and is incorporated and domiciled in England and Wales with company number 1885586. Copies of this half year report are available from the Company’s registered office: Woodcote Grove, Ashley Road, Epsom, Surrey, KT18 5BW, England, and may be viewed on the Atkins website www.atkinsglobal.com. This condensed consolidated interim financial information was approved for issue on 17 November 2016. This condensed consolidated interim financial information does not comprise statutory accounts within the meaning of section 434 of the Companies Act 2006. Statutory accounts for the year ended 31 March 2016 were approved by the Board of directors on 15 June 2016 and delivered to the Registrar of Companies. The report of the auditor on those accounts was unqualified, did not contain an emphasis of matter paragraph and did not contain any statement under section 498 of the Companies Act 2006. This condensed consolidated interim financial information has been reviewed by the Group’s auditor, not audited. The review report is included. 2. Basis of preparation This condensed consolidated interim financial information for the six months ended 30 September 2016 has been prepared in accordance with the Disclosure Guidance and Transparency Rules Sourcebook of the Financial Conduct Authority (previously the Financial Services Authority) and with IAS 34, Interim financial reporting, as adopted by the European Union. The condensed consolidated interim financial information should be read in conjunction with the annual Financial Statements for the year ended 31 March 2016, which have been prepared in accordance with International Financial Reporting Standards (IFRSs) as adopted by the European Union. Going concern basis The directors have a reasonable expectation that the Group has adequate resources to continue in operational existence for at least 12 months from the date of signing the half year financial report and therefore continue to adopt the going concern basis in preparing this condensed consolidated interim financial information. 3. Accounting policies The accounting policies adopted are consistent with those of the consolidated Financial Statements for the year ended 31 March 2016, as described in those annual Financial Statements. There are no new IFRSs or IFRICs that are effective for the first time for this interim period that would be expected to have a material impact on the Group. 4. Estimates The preparation of interim financial information requires management to make judgements, estimates and assumptions that affect the application of accounting policies and the reported amounts of assets and liabilities, income and expense. Actual results may differ from these estimates. In preparing this condensed consolidated interim financial information, the significant judgements made by management in applying the Group’s accounting policies and the key sources of estimation uncertainty were the same as those that applied to the consolidated Financial Statements for the year ended 31 March 2016. The accounting areas involving a higher degree of judgement or complexity, or areas where assumptions and estimates are significant to this condensed consolidated interim financial information are in relation to contract accounting, goodwill, defined benefit pension schemes, tax, research and development and joint arrangements.

Taxes on income for the six months ended 30 September 2016 are accrued using the estimated underlying tax rate that is expected to apply for the year as a whole, as adjusted for material non-underlying items arising in the six month period. 5. Segmental information The chief operating decision maker has been identified as the chief executive officer (CEO) and the Group finance director. The CEO and the Group finance director review the Group’s internal reporting in order to assess performance and allocate resources. Management has determined the operating segments based on these reports. The Group’s operating segments for management purposes predominantly reflect its key geographical markets. The segments are: UK and Europe, North America, Middle East, Asia Pacific and Energy. Details of the business activities and the economic environment in which each segment operates are given in the Business Review. The CEO and the Group finance director assess the performance of the operating segments based on operating profit before interest and tax. Information provided to the CEO and the Group finance director is measured in a manner consistent with that in the condensed consolidated interim financial information.
Share of
post-tax
(loss)/ profit
Inter from
External segment Operating Operating joint Total
Six months to revenue trade Revenue profit margin ventures assets
30 September 2016 £m £m £m £m % £m £m
UK and Europe 448.2 3.0 451.2 39.4 8.7 (0.3) 503.7 North America 219.8 2.1 221.9 15.3 6.9 - 343.8
Middle East 111.5 (6.6) 104.9 6.6 6.3 - 158.3
Asia Pacific 55.3 2.0 57.3 4.1 7.2 - 91.7 Energy 155.4 (0.5) 154.9 8.4 5.4 3.3 425.4
Total for segments 990.2 - 990.2 73.8 7.5 3.0 1,522.9
Group items: Joint ventures reported above
- - - (4.9) -
Investment in Acuity and unallocated central items
- - 4.5 (45.4) -
Unallocated central assets 37.5
Total for Group 990.2 - 994.7 23.5 2.4 3.0 1,560.4
Share of
post-tax
(loss)/ profit
Inter from
External segment Operating Operating joint Total
Six months to revenue trade Revenue profit margin ventures assets
30 September 2015 £m £m £m £m % £m £m
UK and Europe 438.8 19.9 458.7 29.8 6.5 (0.1) 458.8
North America 177.0 0.7 177.7 8.5 4.8 - 293.3
Middle East 137.0 (18.2) 118.8 11.3 9.5 - 140.5
Asia Pacific 45.9 5.7 51.6 3.4 6.6 - 76.3
Energy 105.9 (8.1) 97.8 7.1 7.3 1.2 110.7
Total for segments 904.6 - 904.6 60.1 6.6 1.1 1,079.6
Group items: Joint ventures reported above
- - - (1.1) -
Unallocated central items - - - 1.0 -
Unallocated central assets 39.2
Total for Group 904.6 - 904.6 60.0 6.6 1.1 1,118.8
Share of
post-tax
profit
Inter from
External segment Operating Operating joint Total
Year to revenue trade Revenue profit margin ventures assets
31 March 2016 £m £m £m £m % £m £m
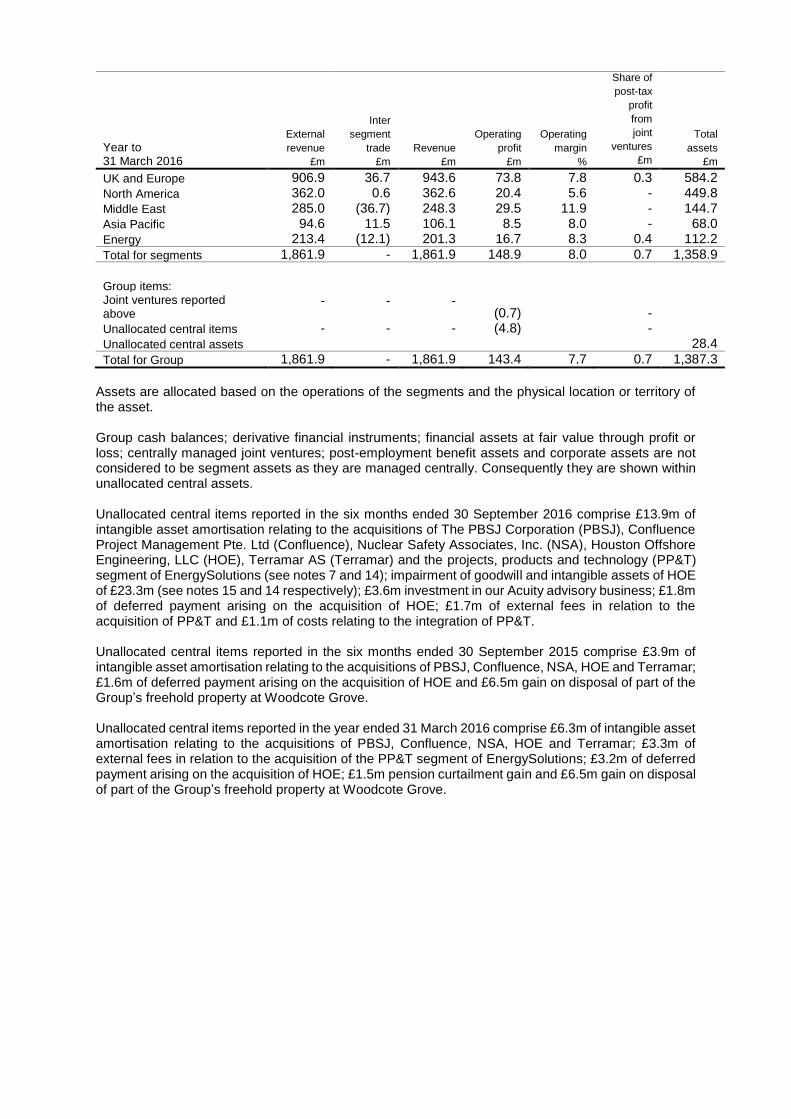
UK and Europe 906.9 36.7 943.6 73.8 7.8 0.3 584.2
North America 362.0 0.6 362.6 20.4 5.6 - 449.8
Middle East 285.0 (36.7) 248.3 29.5 11.9 - 144.7
Asia Pacific 94.6 11.5 106.1 8.5 8.0 - 68.0
Energy 213.4 (12.1) 201.3 16.7 8.3 0.4 112.2
Total for segments 1,861.9 - 1,861.9 148.9 8.0 0.7 1,358.9
Group items: Joint ventures reported above
- - - (0.7)
-
Unallocated central items - - - (4.8) -
Unallocated central assets 28.4
Total for Group 1,861.9 - 1,861.9 143.4 7.7 0.7 1,387.3
Assets are allocated based on the operations of the segments and the physical location or territory of the asset. Group cash balances; derivative financial instruments; financial assets at fair value through profit or loss; centrally managed joint ventures; post-employment benefit assets and corporate assets are not considered to be segment assets as they are managed centrally. Consequently they are shown within unallocated central assets. Unallocated central items reported in the six months ended 30 September 2016 comprise £13.9m of intangible asset amortisation relating to the acquisitions of The PBSJ Corporation (PBSJ), Confluence Project Management Pte. Ltd (Confluence), Nuclear Safety Associates, Inc. (NSA), Houston Offshore Engineering, LLC (HOE), Terramar AS (Terramar) and the projects, products and technology (PP&T) segment of EnergySolutions (see notes 7 and 14); impairment of goodwill and intangible assets of HOE of £23.3m (see notes 15 and 14 respectively); £3.6m investment in our Acuity advisory business; £1.8m of deferred payment arising on the acquisition of HOE; £1.7m of external fees in relation to the acquisition of PP&T and £1.1m of costs relating to the integration of PP&T. Unallocated central items reported in the six months ended 30 September 2015 comprise £3.9m of intangible asset amortisation relating to the acquisitions of PBSJ, Confluence, NSA, HOE and Terramar; £1.6m of deferred payment arising on the acquisition of HOE and £6.5m gain on disposal of part of the Group’s freehold property at Woodcote Grove. Unallocated central items reported in the year ended 31 March 2016 comprise £6.3m of intangible asset amortisation relating to the acquisitions of PBSJ, Confluence, NSA, HOE and Terramar; £3.3m of external fees in relation to the acquisition of the PP&T segment of EnergySolutions; £3.2m of deferred payment arising on the acquisition of HOE; £1.5m pension curtailment gain and £6.5m gain on disposal of part of the Group’s freehold property at Woodcote Grove.

A reconciliation of segmental analysis to profit for the period attributable to owners of the parent and non-controlling interests:
Six months to Six months to Year to
30 Sept 2016 30 Sept 2015 31 March 2016 £m £m £m
Operating profit
23.5 60.0 143.4
Net profit/(loss) on disposal of businesses 0.6 (3.0) (3.1) Income from other investments 0.5 1.1 1.1 Share of post-tax profit from joint ventures 3.0 1.1 0.7
Profit before interest and tax 27.6 59.2 142.1 Finance income 2.6 1.7 4.0 Finance costs (7.8) (7.1) (15.0) Net finance costs (5.2) (5.4) (11.0) Profit before tax 22.4 53.8 131.1
6. Net profit/(loss) on disposal of businesses
Six months to Six months to Year to
30 Sept 2016 30 Sept 2015 31 March 2016 £m £m £m
Profit/(loss) on disposal of businesses WS Atkins (Portugal) CEPI Limitada - (3.0) (3.1) UK highways services 0.6 - - Net profit/(loss) on disposal 0.6 (3.0) (3.1)
WS Atkins (Portugal) CEPI Limitada In July 2015, the Group announced the completion of its disposal of WS Atkins (Portugal) CEPI Limitada to an international investment fund. All staff and assets were transferred on 24 June 2015. While the assets and liabilities of the Portuguese business represent a disposal group, the business was not reported as a discontinued operation at 30 September 2015 or 31 March 2016 as it did not represent a major line of business. The Portuguese business was reported within the UK and Europe operating segment (note 5) prior to its disposal. UK highways services On 27 February 2013 contracts were exchanged to dispose of the Group’s UK highways services business, which formed part of the UK highways and transportation business, to Skanska Construction UK Limited (Skanska), a wholly owned subsidiary of Skanska AB. The business was sold for a cash consideration of £16.0m (subject to certain completion adjustments), together with a deferred conditional amount of £2.0m. Of the available deferred consideration, £0.5m was received and recognised as a profit on disposal for the year ended 31 March 2015. During the six months ended 30 September 2016, a further £0.6m of deferred consideration was received and recognised.

7. Business combinations PP&T segment of EnergySolutions On 11 April 2016 the Group acquired the PP&T segment of EnergySolutions for a cash consideration of US$318.0m (approximately £224.0m). PP&T is a 600-person nuclear business that delivers a wide range of technical engineering and programme management services for the decontamination and decommissioning of high hazard government nuclear facilities. The acquisition strengthens the Group’s nuclear multidisciplinary capability with bases in the UK, North America and China. At 30 September 2016, the fair value of acquired assets, liabilities and goodwill for this business combination were determined on a provisional basis, pending finalisation of the post-acquisition review of the fair value of the acquired net assets. Under IFRS 3, Business combinations, adjustments to these provisional values can be made within one year of the date of acquisition relating to facts and circumstances that existed at the acquisition date. The following table summarises the consideration paid for PP&T and the fair value of assets acquired and liabilities assumed at the acquisition date: Consideration at 11 April 2016
US$m £m
Initial cash consideration 318.0 224.0 Completion working capital adjustment 3.2 2.2
Total consideration 321.2 226.2
Fair value amounts recognised at the acquisition date for each major class of assets and liabilities assumed are as follows:
US$m £m
Acquired customer relationships (included in Intangible assets) 157.5 110.9 Intellectual property (included in Intangible assets) 54.8 38.6 Net retirement benefit assets 17.0 12.0 Investments in joint ventures 4.7 3.3 Property, plant and equipment 0.6 0.4 Trade and other receivables 35.9 25.3 Deferred income tax liabilities (61.8) (43.5) Trade and other payables (40.5) (28.5)
Total identifiable net assets 168.2 118.5
Goodwill 153.0 107.7
Total consideration 321.2 226.2
Acquisition-related costs of £2.8m were charged to administrative expenses in the consolidated income statement for the six months ended 30 September 2016. The fair value of trade and other receivables is £25.3m and includes trade receivables of £13.8m. The gross contractual amount for trade receivables due is £15.7m, £1.9m of which is expected to be uncollectable. As at the date of acquisition, two letters of credit were in issue totalling $0.5m (£0.4m). The revenue and underlying profit before tax included in the Group consolidated statement of comprehensive income since 11 April 2016 contributed by PP&T were £58.1m and £3.4m respectively. Had PP&T been consolidated from 1 April 2016, the Group’s consolidated income statement for the six months ended 30 September 2016 would show revenue of £998.2m and profit before tax of £26.4m.

8. Exceptional items Exceptional items are disclosed separately on the face of the consolidated income statement and in the notes to the condensed consolidated interim financial information where it is necessary to do so to provide further understanding of the financial performance of the Group. They are items of income or expense that have been shown separately due to the significance of their nature or amount.
Six months to Six months to Year to 30 Sept 2016 30 Sept 2015 31 March 2016 £m £m £m
Profit on disposal of property - 6.5 6.5 Exceptional costs in relation to acquisition of PP&T (2.8) - (3.3) Curtailment gain relating to one-off pension events - - 1.5
Exceptional items (2.8) 6.5 4.7
The above exceptional items are included within administrative expenses in the consolidated income statement. In November 2015, the Group signed an agreement to acquire PP&T and the transaction was completed on 11 April 2016. As at 31 March 2016, £3.3m was classified as an exceptional item and related only to transaction fees. For the six months ended 30 September 2016, £2.8m has been classified as an exceptional item and is a combination of residual transaction fees and integration costs. The sale of part of the Group’s Woodcote Grove property in Epsom was completed on 30 September 2015 and resulted in a pre and post-tax profit on disposal of £6.5m being recognised at 31 March 2016 (refer to note 13 for further information). There was no tax on the profit on disposal as the taxable gain will be reduced to nil by indexation allowance. The Railways Pension Scheme recognised a curtailment gain of £1.5m for the year ended 31 March 2016. Further information about this is disclosed in note 30 to the notes to the financial statements of the 31 March 2016 Annual Report. 9. Net finance costs
Six months to Six months to Year to 30 Sept 2016 30 Sept 2015 31 March 2016 £m £m £m
Interest payable on borrowings 3.1 1.5 3.2 Unwinding of discount on vacant property - - 0.1 Unwinding of discount on contingent and deferred consideration 0.1 0.1 0.4 Net finance costs on net post-employment benefit liabilities 4.4 5.2 10.6 Other finance costs 0.2 0.3 0.7
Finance costs 7.8 7.1 15.0
Interest receivable on short term deposits (0.3) (0.5) (0.8) Interest income on financial assets at fair value through profit or loss (0.8) - (0.3) Unwinding of discount on deferred consideration receivable on the sale of Woodcote Grove (0.3) - (0.3) Interest receivable on loan notes (1.2) (1.2) (2.4) Other finance income - - (0.2)
Finance income (2.6) (1.7) (4.0)
Net finance costs 5.2 5.4 11.0

10. Income taxes The Group’s income tax expense from continuing operations for the six months ended 30 September 2016 is estimated using the effective tax rate on profits of 0.9% (30 September 2015: 19.9%; 31 March 2016: 21.1%). The Group’s underlying effective tax rate is 25.0% (30 September 2015: 23.0%, 31 March 2016: 22.5%), calculated using the estimated underlying effective tax rate on annual profits. The effective tax rate on profits for the six months ended 30 September 2016 is lower than the Group’s underlying effective tax rate due to the tax impact of goodwill impairment, amortisation of acquisition intangibles and exceptional fees relating to acquisitions. The underlying effective tax rate is higher than the UK statutory tax rate of 20% (30 September 2015: 20%; 31 March 2016: 20%) primarily due to the geographic mix of the Group’s profit. 11. Dividends
Six months Six months Year to to 30 Sept to 30 Sept 31 March 2016 2015 2016 £m £m £m
Final dividend paid for the year ended 31 March 2016 (2015) 27.0 24.8 24.8
Interim dividend paid for the period ended 30 September 2015 - - 11.4
Dividends recognised in the period 27.0 24.8 36.2
Interim dividend declared for the period ended 30 September 2016 (2015) 12.2 11.4 11.4
Final dividend paid for the year ended 31 March 2016 - - 27.0
Dividends relating to the period 12.2 11.4 38.4
Six months Six months Year to to 30 Sept to 30 Sept 31 March 2016 2015 2016 pence pence pence
Final dividend paid for year ended 31 March 2016 (2015) 27.8 25.5 25.5
Interim dividend paid for period ended 30 September 2015 - - 11.7
Dividends recognised in the period 27.8 25.5 37.2
Interim dividend declared for the period ended 30 September 2016 (2015) 12.5 11.7 11.7
Final dividend paid for the year ended 31 March 2016 - - 27.8
Dividends relating to the period 12.5 11.7 39.5
12. Earnings per share (EPS) Basic EPS is calculated by dividing the earnings attributable to ordinary shareholders by the weighted average number of shares in issue during the period, excluding shares held by the employee benefit trusts (EBTs) which have not unconditionally vested in the employees and shares held in treasury. Diluted EPS is the basic EPS after allowing for the dilutive effect of the conversion into ordinary shares of the number of options and awards outstanding during the period. The options and awards relate to discretionary employee share plans.

Reconciliations of the earnings and weighted average number of shares used in the calculations are set out below:
Six months to Six months to Year to
30 Sept 2016 30 Sept 2015 31 March 2016
number (‘000) number (‘000) number (‘000)
Number of shares Weighted average number of shares used in basic and underlying basic EPS 97,261 97,306 97,366
Effect of dilutive securities - share options 2,426 2,766 2,796 Weighted average number of shares used in diluted and underlying diluted EPS 99,687 100,072 100,162
£m £m £m
Earnings
Profit for the period attributable to owners of the parent 22.5 42.9 103.2
Net (profit)/ loss on disposal of businesses (net of tax) (0.6) 3.0 3.1
Exceptional items (net of tax) 2.2 (6.5) (4.7)
Impairment of goodwill (net of tax) 11.3 - -
Deferred acquisition payments (net of tax) 1.1 1.0 2.0
Impairment of acquired intangibles (net of tax) 2.9 - -
Amortisation of acquired intangibles (net of tax) 8.6 2.4 3.9
Underlying earnings 48.0 42.8 107.5
pence pence pence
Basic earnings per share 23.1 44.1 106.0
Diluted earnings per share 22.6 42.9 103.0
Underlying basic earnings per share 49.4 44.0 110.4
Underlying diluted earnings per share 48.2 42.8 107.3
13. Property, plant and equipment Additions to property, plant and equipment during the six months ended 30 September 2016 amounted to £6.0m (30 September 2015: £9.8m; 31 March 2016: £16.9m). The Group acquired £0.4m of property, plant and equipment through the acquisition of subsidiary undertakings (30 September 2015: £nil; 31 March 2016: £nil). The net book value of disposals during the six months ended 30 September 2016 amounted to £0.1m (30 September 2015: £1.6m; 31 March 2016: £1.6m). The net book value of property, plant and equipment at 30 September 2016 amounted to £51.9m (30 September 2015: £51.7m; 31 March 2016: £51.9m). The Group had £5.0m of capital expenditure contracted for but not incurred at 30 September 2016 (30 September 2015: £3.1m; 31 March 2016: £3.8m). The depreciation charge for the period is £9.4m (30 September 2015: £8.9m; 31 March 2016: £18.2m) and is included in administrative expenses in the consolidated income statement. 14. Other intangible assets Additions to intangible assets during the six months ended 30 September 2016 amounted to £1.2m (30 September 2015: £1.2m; 31 March 2016: £3.0m). During the six months ended 30 September 2016 the Group acquired £149.5m of intangible assets through the acquisition of subsidiary undertakings (30 September 2015: £nil; 31 March 2016: £nil). The net book value of intangible assets at 30 September 2016 amounted to £195.0m (30 September 2015: £46.7m; 31 March 2016: £46.8m). The net book value of disposals during the six months ended 30 September 2016 amounted to £nil (30 September 2015: £nil; 31 March 2016: £0.2m). The amortisation charge for the period is £15.7m (30 September 2015: £6.9m; 31 March 2016: £11.9m) and is included in administrative expenses in the consolidated income statement. The impairment charge for the period of £4.8m (30 September 2015: £nil; 31 March 2016: £nil) is included in administrative expenses in the consolidated income statement and arises from the impairment review of the North America oil and gas cash generating unit (CGU).

15. Goodwill
Six months to Six months to Year to
30 Sept 2016 30 Sept 2015 31 March 2016
£m £m £m
At beginning of period 253.2 244.4 244.4 Acquisition of subsidiaries 107.7 - - Impairment of goodwill (18.5) - - Exchange differences 32.0 (8.1) 8.8
At end of period 374.4 236.3 253.2
CGUs Following the reorganisation of our global Energy business into five regional divisions, which took effect on 1 August 2016, the CGUs for the purpose of testing goodwill allocated to the Energy operating segment have changed. In accordance with IAS 36, this reorganisation requires a reallocation of goodwill previously allocated to the CGUs of the former reporting structure. There was no change to the goodwill allocation at the operating segment level. Impairment Goodwill is not amortised but is tested for impairment in accordance with IAS 36, Impairment of assets, at least annually or more frequently if events or changes in circumstances indicate a potential impairment, in accordance with the accounting policy set out in the 2016 annual Financial Statements. The impairment test involves comparing the carrying value of the CGU or group of CGUs to which goodwill has been allocated to its recoverable amount. The recoverable amount is based on the higher of fair value less costs to sell and value in use. The value in use calculations require the use of estimates including projected future cash flows and other future events. Details of the growth rate and discount rate assumptions made are disclosed in the Group’s annual Financial Statements at 31 March 2016. As a result of the above reorganisation, the carrying amount of goodwill in the North America oil and gas CGU that arose from the acquisition of the oil and gas offshore engineering business, HOE, was reviewed during the period and has been fully impaired, resulting in a loss of £18.5m. This loss has been included in administrative expenses in the consolidated income statement. Sensitivities Goodwill of £158.0m (31 March 2016: £151.5m) is allocated to the North America operating segment arising on the acquisition of PBSJ. The Group’s 31 March 2016 annual Financial Statements disclosed the changes in the calculation assumptions that would cause the value in use of the North America group of CGUs to fall below the carrying value of the goodwill. There were no triggering events at 30 September 2016. For all other CGUs or groups of CGUs, there have been no events or changes in circumstances that would require additional review of the carrying value of the goodwill before the Group ’s annual testing for impairment is carried out at 31 March 2017. The condensed consolidated interim financial information does not include all the information and disclosures required in the annual Financial Statements in respect of the Group’s impairment test for goodwill and should be read in conjunction with the Group’s annual Financial Statements at 31 March 2016. There have been no changes to the Group’s approach to goodwill impairment testing since that date. 16. Financial risk management Financial risk factors The Group’s activities expose it to a variety of financial risks: market risk (including foreign exchange risk, interest rate risk and price risk), credit risk and liquidity risk. The Group’s overall risk management programme focuses on the unpredictability of financial markets and seeks to minimise potential adverse effects on the Group’s financial performance. The Group uses derivative financial instruments to hedge certain risk exposures.

The condensed consolidated interim financial information does not include all financial risk management information and disclosures required in the annual financial statements and should be read in conjunction with the Group’s annual Financial Statements as at 31 March 2016. There have been no changes to risk management policies since 31 March 2016. Liquidity risk Compared to the position at 31 March 2016, there was no material change in the contractual undiscounted cash flows of the Group’s non-derivative financial liabilities in the period. Fair value estimation The following table analyses the Group’s financial instruments carried at fair value, by valuation method. The different levels have been defined as follows: Level 1 financial instruments The fair value of financial instruments traded in active markets is based on quoted market prices at the Balance Sheet date. A market is regarded as active if quoted prices are readily and regularly available from an exchange, dealer, broker, industry group, pricing service or regulatory agency and those prices represent actual and regularly occurring market transactions on an arm’s length basis. The quoted market price used for financial assets held by the Group is the mid market price. Level 2 financial instruments The fair value of financial instruments that are not traded in an active market is determined by using valuation techniques. These valuation techniques maximise the use of observable market data where it is available and rely as little as possible on estimates. If all significant inputs required to fair value an instrument are observable, the instrument is included in Level 2. The fair value of certificates of deposit is calculated as the present value of the future cash flows, discounted at an appropriate market rate of interest. The fair value of forward foreign exchange contracts is determined using quoted forward exchange rates at the reporting date and yield curves derived from quoted interest rates matching the maturities of the foreign exchange contracts. Level 3 financial instruments The fair value of financial instruments for an asset or liability that are not based on observable market data (that is, unobservable inputs) are Level 3 financial instruments. Level 3 valuation technique and significant unobservable inputs The contingent consideration at 30 September 2016 related to an acquisition made by PP&T prior to its acquisition by the Group and has been recorded at fair value in the acquisition balance sheet. The main Level 3 inputs used in estimating the contingent consideration payment are based on revenue targets for the next 7.75 years. PP&T prepares detailed forecasts on this acquisition and updates these on a quarterly basis as part of its normal operating processes. These forecasts are based on past experience. The fair value of the contingent consideration arrangement was £3.9m ($5.5m) at the PP&T acquisition date and is discounted at an annual discount rate of 2.4%. The comparative figures for September 2015 and March 2016 related to a previous acquisition by the Group which has been released during the six months ended 30 September 2016. Level 3 inter-relationship between significant unobservable inputs and fair value measurement The estimated fair value of the Level 3 financial instrument would increase if there was a change in either the annual revenue or the risk-adjusted discount rate. Level 3 sensitivity analysis A reasonable possible change to annual revenue of 5% and a change of 100bps to the discount rate, holding other inputs constant, would not result in a significant change in the fair value. Specific valuation techniques used to value financial instruments include: - The fair value of derivatives used for hedging are provided by The Royal Bank of Scotland, HSBC,
Barclays and Bank of America Merrill Lynch. - The fair value of all marketable securities, with the exception of life insurance policies, are
provided by the financial institutions holding the Group’s funds and investments. - The fair value of life insurance policies are provided by the Group’s insurance companies.

The Group’s assets and liabilities that are measured at fair value are set out below.
Level 1 Level 2 Level 3 Total
30 September 2016 £m £m £m £m
Assets Derivatives used for hedging - foreign exchange contracts - 9.4 - 9.4 Financial assets at fair value through profit or loss:
Marketable securities - floating rate notes 5.2 - - 5.2 - fixed interest securities 23.7 - - 23.7 - life insurance policies - 3.2 - 3.2
Total assets 28.9 12.6 - 41.5
Liabilities Financial liabilities at fair value through profit or loss:
- contingent consideration - - 4.1 4.1 Derivatives used for hedging - foreign exchange contracts - 1.6 - 1.6
Total liabilities - 1.6 4.1 5.7
Level 1 Level 2 Level 3 Total
30 September 2015 £m £m £m £m
Assets Derivatives used for hedging - foreign exchange contracts - 1.1 - 1.1 Financial assets at fair value through profit or loss:
Marketable securities - floating rate notes 5.5 - - 5.5 - fixed interest securities 20.5 - - 20.5 - UK treasury bills 4.9 - - 4.9 - life insurance policies - 2.5 - 2.5
Total assets 30.9 3.6 - 34.5
Liabilities Financial liabilities at fair value through profit or loss:
- contingent consideration - - 2.9 2.9 Derivatives used for hedging - foreign exchange contracts - 1.5 - 1.5
Total liabilities - 1.5 2.9 4.4
Level 1 Level 2 Level 3 Total
31 March 2016 £m £m £m £m
Assets Derivatives used for hedging - foreign exchange contracts - 3.3 - 3.3 Financial assets at fair value through profit or loss:
Marketable securities - floating rate notes 5.8 - - 5.8 - fixed interest securities 24.2 - - 24.2 - life insurance policies - 2.9 - 2.9
Total assets 30.0 6.2 - 36.2
Liabilities Financial liabilities at fair value through profit or loss:
- contingent consideration - - 1.9 1.9 Derivatives used for hedging - foreign exchange contracts - 1.5 - 1.5
Total liabilities - 1.5 1.9 3.4

There have been no significant changes in the business or economic circumstances that affect the fair value of the Group’s financial assets and financial liabilities. There have been no changes to the classification of the Group’s financial instruments carried at fair value between Level 1, Level 2 and Level 3 at 30 September 2016, 30 September 2015 or 31 March 2016. The fair value of the following financial assets and liabilities approximate their carrying amount: - Trade and other receivables - Cash and cash equivalents - Borrowings - Trade and other payables.
17. Borrowings 30 Sept 2016 30 Sept 2015 31 March 2016
£m £m £m
Current Bank loans 7.7 58.6 7.0 Finance leases 0.1 0.1 -
7.8 58.7 7.0
Non-current Bank loans 232.9 - 220.9 Finance leases - 0.1 0.1 Private placement debt 57.9 48.3 52.6
290.8 48.4 273.6
298.6 107.1 280.6
Movements in borrowings are analysed as follows:
Six months to Six months to Year to
30 Sept 2016 30 Sept 2015 31 March 2016
£m £m £m
At beginning of period 280.6 111.3 111.3 Additions to finance leases - 0.1 - Loan draw down - - 164.1 Repayment of borrowings (10.2) - - Difference on exchange 28.2 (4.3) 5.2 At end of period 298.6 107.1 280.6
The Group has the following undrawn committed borrowing facilities available expiring as follows: 30 Sept 2016 30 Sept 2015 31 March 2016
£m £m £m
Later than two years and no later than five years 59.2 141.2 71.9
All of the Group’s undrawn committed borrowing facilities will be subject to floating rates of interest. On 30 January 2016 the Group amended and extended its five year RCF. This £200m facility matures on 30 January 2021. On 11 March 2016, the Group signed a new RCF of £100m, with a maturity of three years. There will be an option to extend for an additional year with the lenders’ permission. This facility provides the Group with an increased and longer term financial capacity to support its strategy on favourable terms, and committed credit lines totalling £300m. The total letters of credit in issue under the committed facilities at 30 September 2016 were £0.2m (30 September 2015: £0.2m; 31 March 2016: £0.2m). The £100m facility has the following lenders, Bank of America Merrill Lynch International Limited, Barclays Bank plc, HSBC Bank plc and National Westminster Bank plc. The £200m facility additionally has the following lenders, The National Bank of Abu Dhabi PJSC London Branch, Abbey National Treasury Services plc and United Overseas Bank Limited London Branch.

The Group’s borrowing facilities include a number of undertakings and financial covenants. Compliance with these covenants is monitored. As at 30 September 2016, and since, there have been no breaches. In the financial year ended 31 March 2013, the Group raised $75m through the successful execution of its debut issue in the US private placement market. The proceeds were used to repay drawn funds under the Group’s existing banking facilities. The private placement is due for repayment on 31 May 2019 and carries a nominal interest rate of 4.38%. 18. Post-employment benefit liabilities 30 Sept 2016 30 Sept 2015 31 March 2016
£m £m £m
Net retirement benefit liabilities (413.8) (268.5) (265.3) Other post-employment benefit liabilities (22.5) (17.7) (20.5)
(436.3) (286.2) (285.8)
Net retirement benefit assets 12.0 - -
Net post-employment benefit liabilities (424.3) (286.2) (285.8)
a) Net retirement benefit liabilities The Group, through trustees, operates a number of defined benefit and defined contribution pension schemes. The two main defined benefit schemes are the Atkins Pension Plan (the Plan) and the Railways Pension Scheme, both of which are funded final salary schemes. The assets of both schemes are held in separate trustee-administered funds. Other pension schemes include the Atkins McCarthy Pension Scheme in the Republic of Ireland, which is a final salary funded defined benefit scheme, Terramar AS Pension Plan in Norway, and a range of defined contribution schemes or equivalent. As part of the acquisition on 11 April 2016 (refer note 7), the Group took over the EnergySolutions Section of the Magnox Group of the Electricity Supply Pension Scheme (ESPS). At 30 September 2016 this scheme reported net retirement benefit assets of £12m. The Plan is closed to the future accrual of benefits; all defined benefit members of the Plan were transferred to a defined contribution section for future service where it was clear they did not benefit from a statutory or contractual right to a final salary pension. The Atkins McCarthy Pension Plan was closed to future accrual of benefits for members who do not benefit from a statutory or contractual right to a final salary pension on 31 March 2009. These members transferred to the Personal Retirement Savings Accounts - Ireland (PRSA - Irish Life) scheme with effect from 1 April 2009. The Terramar AS Pension Plan was closed to new entrants on 1 January 2009. It is a funded pension scheme and is managed by DNB (Norway’s largest financial services group). In order to obtain full pension entitlements, the scheme participants are required to complete 30 years of pensionable service prior to them obtaining the right to a life-long retirement pension corresponding to the difference between 66% of the employee’s salary at retirement and estimated benefits from the Norwegian National Insurance Scheme. Economic and actuarial assumptions comply with prevailing technical recommendations in Norway. The defined benefit sections of all pension schemes are mostly closed to new entrants, who are offered membership of the defined contribution section.

The main assumptions used for the IAS 19 valuation of the retirement benefit liabilities for the Plan and the Railways Pension Scheme are listed in the table below:
30 Sept 30 Sept 31 March
2016 2015 2016
Price inflation
RPI 3.00% 3.10% 2.90%
CPI 1.90% 2.10% 1.90%
Rate of increase of pensions in payment
Limited Price Indexation (RPI-based) 2.80% 2.90% 2.80%
Limited Price Indexation (CPI-based) 2.00% 2.20% 2.00%
Limited Price Indexation to 2.5% 2.50% 2.50% 2.50%
Fixed 5.00% 5.00% 5.00%
Rate of increase in salaries
Atkins Pension Plan 4.50% 4.60% 4.40%
Railways Pension Scheme (uncapped) 5.25% 5.35% 5.15%
Railways Pension Scheme (RPI capped) 3.00% 3.10% 2.90%
Railways Pension Scheme (CPI capped) 1.90% 2.10% 1.90%
Rate of increase for deferred pensioners
Atkins Pension Plan 3.00% 3.10% 2.90%
Railways Pension Scheme 1.90% 2.10% 1.90%
Discount rate 2.40% 3.90% 3.50%
Longevity at age 65 for current pensioners
Men 24.3 years 24.2 years 24.3 years
Women 26.2 years 26.1 years 26.2 years
Longevity at age 65 for future pensioners (current age 45)
Men 26.6 years 26.5 years 26.6 years
Women 28.5 years 28.4 years 28.5 years
The components of the defined benefit pension cost are as follows:
Six months Six months Year to
to 30 Sept to 30 Sept 31 March
2016 2015 2016
£m £m £m
Cost of sales
Current service cost 1.3 1.2 2.6
Administrative expenses - - 0.2
Curtailment gain - - (1.5)
Total charge 1.3 1.2 1.3
Net interest expense 3.9 4.8 9.7
Total charge to income statement for defined benefit schemes 5.2 6.0 11.0
Statement of comprehensive income
Gain/(loss) on pension scheme assets 310.0 (97.6) (9.6)
Changes in assumptions (471.5) 115.4 17.9 Remeasurements (loss)/gain recognised in other comprehensive (expense)/income (161.5) 17.8 8.3
Net deferred and income tax credited/(charged) to equity 25.8 (3.6) (5.7)
Remeasurements (loss)/gain (net of tax) (135.7) 14.2 2.6
Net retirement benefit liabilities comprise the following:
30 Sept 30 Sept 31 March
2016 2015 2016
£m £m £m
Defined benefit obligation (2,348.1) (1,720.5) (1,821.9)
Fair value of plan assets 1,946.3 1,452.0 1,556.6
Net retirement benefit liabilities (401.8) (268.5) (265.3)
Income tax on net retirement benefit liabilities 68.3 53.7 49.3
Net post-tax retirement benefit liabilities (333.5) (214.8) (216.0)
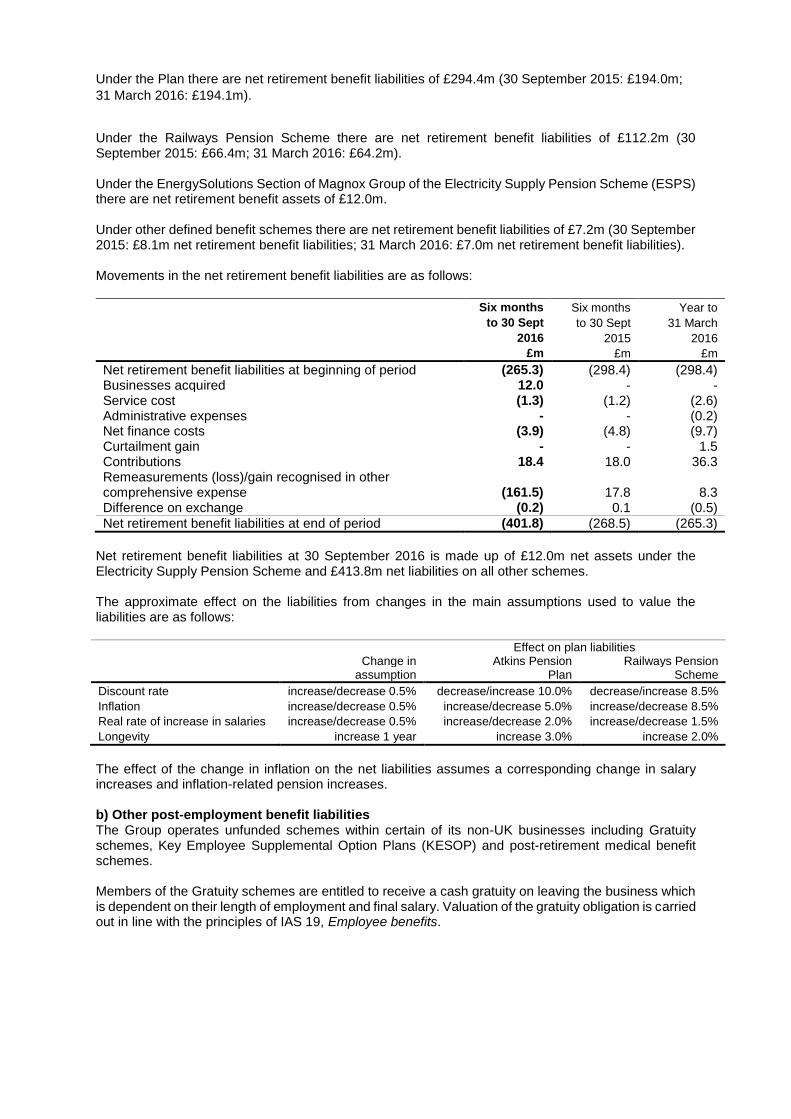
Under the Plan there are net retirement benefit liabilities of £294.4m (30 September 2015: £194.0m;
31 March 2016: £194.1m).
Under the Railways Pension Scheme there are net retirement benefit liabilities of £112.2m (30 September 2015: £66.4m; 31 March 2016: £64.2m). Under the EnergySolutions Section of Magnox Group of the Electricity Supply Pension Scheme (ESPS) there are net retirement benefit assets of £12.0m. Under other defined benefit schemes there are net retirement benefit liabilities of £7.2m (30 September 2015: £8.1m net retirement benefit liabilities; 31 March 2016: £7.0m net retirement benefit liabilities). Movements in the net retirement benefit liabilities are as follows:
Six months Six months Year to
to 30 Sept to 30 Sept 31 March
2016 2015 2016
£m £m £m
Net retirement benefit liabilities at beginning of period (265.3) (298.4) (298.4) Businesses acquired 12.0 - - Service cost (1.3) (1.2) (2.6) Administrative expenses - - (0.2) Net finance costs (3.9) (4.8) (9.7) Curtailment gain - - 1.5 Contributions 18.4 18.0 36.3 Remeasurements (loss)/gain recognised in other comprehensive expense (161.5) 17.8 8.3 Difference on exchange (0.2) 0.1 (0.5)
Net retirement benefit liabilities at end of period (401.8) (268.5) (265.3)
Net retirement benefit liabilities at 30 September 2016 is made up of £12.0m net assets under the Electricity Supply Pension Scheme and £413.8m net liabilities on all other schemes. The approximate effect on the liabilities from changes in the main assumptions used to value the liabilities are as follows: Effect on plan liabilities Change in Atkins Pension Railways Pension assumption Plan Scheme
Discount rate increase/decrease 0.5% decrease/increase 10.0% decrease/increase 8.5%
Inflation increase/decrease 0.5% increase/decrease 5.0% increase/decrease 8.5%
Real rate of increase in salaries increase/decrease 0.5% increase/decrease 2.0% increase/decrease 1.5%
Longevity increase 1 year increase 3.0% increase 2.0%
The effect of the change in inflation on the net liabilities assumes a corresponding change in salary increases and inflation-related pension increases. b) Other post-employment benefit liabilities The Group operates unfunded schemes within certain of its non-UK businesses including Gratuity schemes, Key Employee Supplemental Option Plans (KESOP) and post-retirement medical benefit schemes. Members of the Gratuity schemes are entitled to receive a cash gratuity on leaving the business which is dependent on their length of employment and final salary. Valuation of the gratuity obligation is carried out in line with the principles of IAS 19, Employee benefits.

The Group operates a KESOP providing some key officers and employees in its North American business (the business) with post-retirement benefits, known as the Supplemental Income Program (SIP). The SIP is an unfunded plan that provides participants with retirement income for a specified period of between 5 and 15 years upon retirement, death or disability. The plan fixes a minimum level for retirement benefits to be paid to participants based on the participant’s position in the business, their age and length of service at retirement. Additionally, certain executive agreements have been amended to provide post-retirement medical benefits to those employees and their spouses, at a level substantially similar to those medical and hospitalisation benefits paid and provided to senior executives currently employed by the business. The insurance benefits will be provided without any further or additional services from the employee to the business and they will be paid for and provided for as long as the employee and their spouse shall live.
Six months Six months Year to
to 30 Sept to 30 Sept 31 March
2016 2015 2016
£m £m £m
Other post-employment obligations at beginning of period 20.5 18.2 18.2 Current service cost and other comprehensive income 2.0 1.5 4.2 Interest cost 0.5 0.4 0.9 Benefit payments (2.8) (1.7) (3.7) Difference on exchange 2.3 (0.7) 0.9
Other post-employment obligations at end of period 22.5 17.7 20.5
The main assumptions used for the IAS 19 valuation of other post-employment benefits are listed in the table below.
Six months Six months Year to
to 30 Sept to 30 Sept 31 March
2016 2015 2016
Gratuity scheme Discount rate 5.00% 5.00% 5.00% Salary inflation 3.00% 3.00% 3.00% Average remaining service period 2 years 2 years 2 years KESOP scheme Discount rate 1.55% 1.10% 1.55% Medical plan Discount rate 3.80% 3.55% 3.80% Healthcare cost trend rate for next year 8.00% 7.50% 8.00% Rate of decline of cost trend rate 5.00% 5.00% 5.00% Year that rate reaches ultimate trend rate 2026 2023 2026
19. Ordinary shares
30 Sept 30 Sept 31 March
2016 2015 2016
£m £m £m
Issued, allotted and fully paid ordinary shares of 0.5p each At beginning of period 0.5 0.5 0.5
At end of period 0.5 0.5 0.5
The number of issued, allotted and fully paid up shares at 30 September 2016 is 104,451,799 (30 September 2015: 104,451,799; 31 March 2016: 104,451,799). At 30 September 2016 a total of 4,341,000 ordinary shares of 0.5p each were held as treasury shares (30 September 2015: 4,341,000; 31 March 2016: 4,341,000). These shares, which represent approximately 4.2% of the called up share capital of the Company (30 September 2015: 4.2%; 31 March 2016: 4.2%) have not been cancelled and represent a deduction from shareholders’ equity. No further shares have been purchased between 30 September 2016 and the date of this condensed consolidated interim financial information.
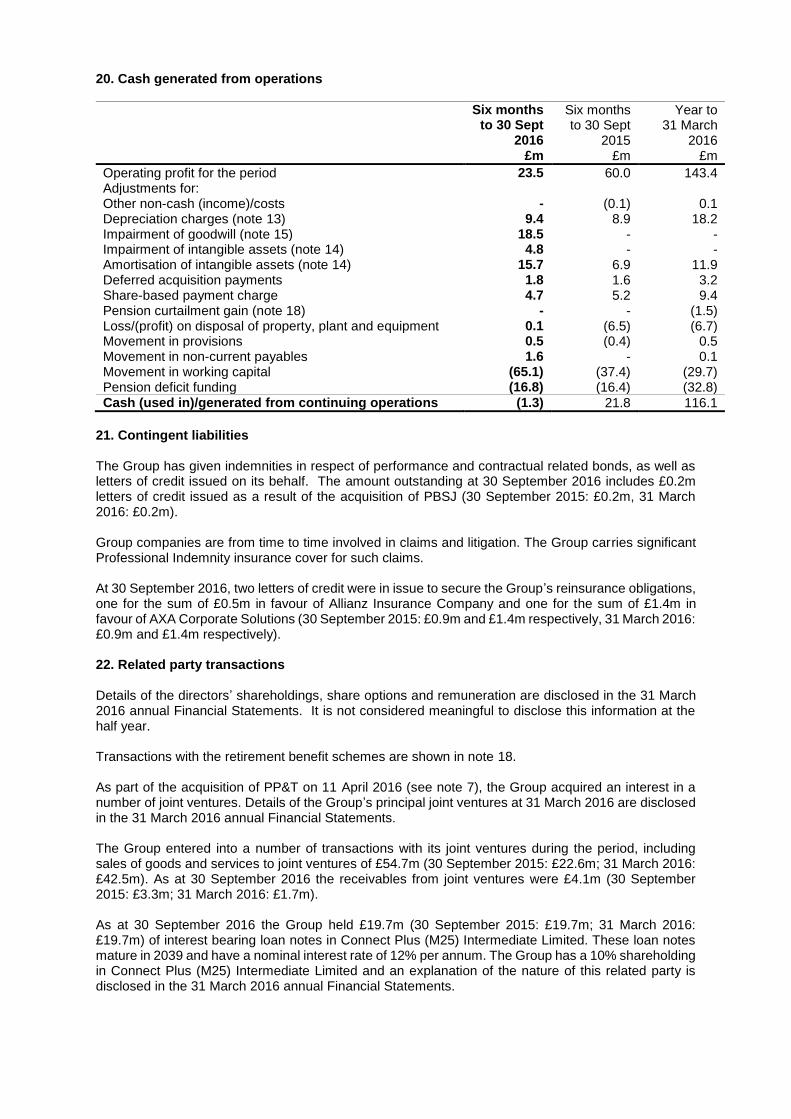
20. Cash generated from operations
Six months Six months Year to to 30 Sept to 30 Sept 31 March 2016 2015 2016
£m £m £m
Operating profit for the period 23.5 60.0 143.4 Adjustments for: Other non-cash (income)/costs - (0.1) 0.1 Depreciation charges (note 13) 9.4 8.9 18.2 Impairment of goodwill (note 15) 18.5 - - Impairment of intangible assets (note 14) 4.8 - - Amortisation of intangible assets (note 14) 15.7 6.9 11.9 Deferred acquisition payments 1.8 1.6 3.2 Share-based payment charge 4.7 5.2 9.4 Pension curtailment gain (note 18) - - (1.5) Loss/(profit) on disposal of property, plant and equipment 0.1 (6.5) (6.7) Movement in provisions 0.5 (0.4) 0.5 Movement in non-current payables 1.6 - 0.1 Movement in working capital (65.1) (37.4) (29.7) Pension deficit funding (16.8) (16.4) (32.8) Cash (used in)/generated from continuing operations (1.3) 21.8 116.1
21. Contingent liabilities The Group has given indemnities in respect of performance and contractual related bonds, as well as letters of credit issued on its behalf. The amount outstanding at 30 September 2016 includes £0.2m letters of credit issued as a result of the acquisition of PBSJ (30 September 2015: £0.2m, 31 March 2016: £0.2m). Group companies are from time to time involved in claims and litigation. The Group carries significant Professional Indemnity insurance cover for such claims. At 30 September 2016, two letters of credit were in issue to secure the Group’s reinsurance obligations, one for the sum of £0.5m in favour of Allianz Insurance Company and one for the sum of £1.4m in favour of AXA Corporate Solutions (30 September 2015: £0.9m and £1.4m respectively, 31 March 2016: £0.9m and £1.4m respectively). 22. Related party transactions Details of the directors’ shareholdings, share options and remuneration are disclosed in the 31 March 2016 annual Financial Statements. It is not considered meaningful to disclose this information at the half year. Transactions with the retirement benefit schemes are shown in note 18. As part of the acquisition of PP&T on 11 April 2016 (see note 7), the Group acquired an interest in a number of joint ventures. Details of the Group’s principal joint ventures at 31 March 2016 are disclosed in the 31 March 2016 annual Financial Statements. The Group entered into a number of transactions with its joint ventures during the period, including sales of goods and services to joint ventures of £54.7m (30 September 2015: £22.6m; 31 March 2016: £42.5m). As at 30 September 2016 the receivables from joint ventures were £4.1m (30 September 2015: £3.3m; 31 March 2016: £1.7m). As at 30 September 2016 the Group held £19.7m (30 September 2015: £19.7m; 31 March 2016: £19.7m) of interest bearing loan notes in Connect Plus (M25) Intermediate Limited. These loan notes mature in 2039 and have a nominal interest rate of 12% per annum. The Group has a 10% shareholding in Connect Plus (M25) Intermediate Limited and an explanation of the nature of this related party is disclosed in the 31 March 2016 annual Financial Statements.

23. Events occurring after the reporting period Dividends Details of the interim dividend proposed are given in note 11. Howard Humphreys (East Africa) Limited acquisition (Howard Humphreys) After the balance sheet date, on 3 October 2016, the Group acquired Howard Humphreys, for a cash consideration of 1,364m Kenyan Shillings, subject to working capital adjustments. Howard Humphreys is a multidisciplinary consultancy based in Kenya and Tanzania, which employs around 200 people. 24. Seasonality The Group’s activities are not subject to significant seasonal variation.

Independent review report to WS Atkins plc Report on the half year financial report Our conclusion We have reviewed WS Atkins plc’s half year financial report (the interim financial statements) in the half year financial report of WS Atkins plc for the six month period ended 30 September 2016. Based on our review, nothing has come to our attention that causes us to believe that the interim financial statements are not prepared, in all material respects, in accordance with International Accounting Standard 34, ‘Interim Financial Reporting’, as adopted by the European Union and the Disclosure Guidance and Transparency Rules Sourcebook of the United Kingdom’s Financial Conduct Authority. What we have reviewed The interim financial statements comprise: - the Consolidated Balance Sheet as at 30 September 2016; - the Consolidated Income Statement and Consolidated Statement of Comprehensive Income for the
period then ended; - the Consolidated Statement of Cash Flows for the period then ended; - the Consolidated Statement of Changes in Equity for the period then ended; and - the explanatory notes to the interim financial statements. The interim financial statements included in the half year financial report have been prepared in accordance with International Accounting Standard 34, ‘Interim Financial Reporting’, as adopted by the European Union and the Disclosure Guidance and Transparency Rules Sourcebook of the United Kingdom’s Financial Conduct Authority. As disclosed in note 2 to the interim financial statements, the financial reporting framework that has been applied in the preparation of the full annual financial statements of the Group is applicable law and International Financial Reporting Standards (IFRSs) as adopted by the European Union. Responsibilities for the interim financial statements and the review Our responsibilities and those of the directors The half year financial report, including the interim financial statements, is the responsibility of, and has been approved by, the directors. The directors are responsible for preparing the half year financial report in accordance with the Disclosure Guidance and Transparency Rules Sourcebook of the United Kingdom’s Financial Conduct Authority. Our responsibility is to express a conclusion on the interim financial statements in the half year financial report based on our review. This report, including the conclusion, has been prepared for and only for the company for the purpose of complying with the Disclosure Guidance and Transparency Rules Sourcebook of the United Kingdom’s Financial Conduct Authority and for no other purpose. We do not, in giving this conclusion, accept or assume responsibility for any other purpose or to any other person to whom this report is shown or into whose hands it may come save where expressly agreed by our prior consent in writing. What a review of interim financial statements involves We conducted our review in accordance with International Standard on Review Engagements (UK and Ireland) 2410, ‘Review of Interim Financial Information Performed by the Independent Auditor of the Entity’ issued by the Auditing Practices Board for use in the United Kingdom. A review of interim financial information consists of making enquiries, primarily of persons responsible for financial and accounting matters, and applying analytical and other review procedures. A review is substantially less in scope than an audit conducted in accordance with International Standards on Auditing (UK and Ireland) and, consequently, does not enable us to obtain assurance that we would become aware of all significant matters that might be identified in an audit. Accordingly, we do not express an audit opinion.

We have read the other information contained in the half year financial report and considered whether it contains any apparent misstatements or material inconsistencies with the information in the interim financial statements. PricewaterhouseCoopers LLP Chartered Accountants London 17 November 2016 a) The maintenance and integrity of the WS Atkins plc website is the responsibility of the directors; the
work carried out by the auditors does not involve consideration of these matters and, accordingly, the auditors accept no responsibility for any changes that may have occurred to the interim financial statements since they were initially presented on the website.
b) Legislation in the United Kingdom governing the preparation and dissemination of financial statements may differ from legislation in other jurisdictions.