Half year report - Japara€¦ · 1. Developments ramping up comprise Robina Rise, Kingston...
38
FY2020 Half year results presentation JAPARA HEALTHCARE 28 February 2020
Transcript of Half year report - Japara€¦ · 1. Developments ramping up comprise Robina Rise, Kingston...
FY2020Half year results presentation
JAPARA HEALTHCARE
28 February 2020
Contents
01 Overview 3
02 Strategic initiatives 12
03 Industry and business observations 22
04 Summary and outlook 28
05 Appendices 30

Overview01
3

1H FY2020 highlights
Growth in aged care places, combined with portfolio management of real estate assets, mitigated the earnings impact of weaker than expected occupancy
1. Average occupancy adjusts for places ramping up at new developments and places offline for refurbishment
2. Profit attributable to members of the Group
3. As at 27 February 2020
Total revenue
$212.6mUp 9.9% on 1H FY2019 due to additional places from developments, portfolio management and funding increases
Occupancy
92.6%1H FY2020 average underlying occupancy1 weaker than anticipated
Currently 93.0%3
NPAT2
$5.4mDown 28% on 1H FY2019 due to higher depreciation and interest costs
Care
100%100% accreditation record maintained with 20 Aged Care Quality and Safety Commission visits over 1H FY2020
EBITDA
$24.3mUp 10% on 1H FY2019
Recurring EBITDA of $21.1m down 11% on 1H FY2019
Dividends
2.0cps2.0cps interim dividend (franked to 50%)
Net RAD and ILU inflows
$33.4m$26.4m RAD uplift from developments
Developments
200+209 net new places added including one greenfield and three brownfield developments
$51.7m net expenditure on land and construction
Net debt
$185.3m31 December 2019 core net debt of $31.5m and development debt of $153.8m
4

Care at Japara
Our vision at Japara is to enrich every life we touch
Resident-centred care delivery
• Japara rosters Registered Nurses in every home 24 hours a day, 7
days a week
• We spend over 100% of care revenue received from the
Government and residents on costs associated with the provision
of care and operating the business
• Over 4,000 residents are cared for in our 50 homes
• We provide tailored leisure and lifestyle programs across all homes
and focus on the reablement of our residents
• Food quality and choice is a focus in the dining experience for our
residents with fresh food preparation underpinning our approach
• 100% of our homes are accredited
• We support the introduction of the new Aged Care Quality
Standards which commenced on 1 July 2019
Specialist dementia care
• 52% of aged care residents in Australia are living with dementia
and we aim to be a leader in caring for people living with dementia
• Our enhanced home-like environments enable us to provide
improved care
• This ‘small home’ model compliments resident autonomy and
quality of life
• Our on-staff Dementia, Lifestyle and Behaviour Consultant
supports ‘Dementia Champions’ in every home
5

1H FY2020 strategic initiatives
Greenfield developments
• Completion and opening of our
latest greenfield development,
Robina Rise (106 places), in July
2019 which currently has 87
residents
• Three greenfield developments
currently under construction at Mt
Waverley (105 places), Newport
(120 places) and Belrose (102
places)
• 723 new places recently completed
or soon to complete (requiring
~$27m in further capital
expenditure) expected to deliver
further net RAD inflows of $135-
$145m
Brownfield developments
• Three brownfield extensions
completed at Brighton-Le-Sands
(25 places), Kingston Gardens (60
places) and Mirboo North (18
places)
• Five significant refurbishment
projects currently underway
• 33 homes currently qualifying for
the maximum accommodation
supplement
Senior living
• Five homes currently have co-
located senior living
accommodation
• A further three sites are currently in
advanced planning for
development of senior living
accommodation
• Recent appointment of Head of
Senior Living to grow this business
Our people
• Our workforce of 5,800+ dedicated
staff provide our 4,000+ residents
with personalised care 24 hours a
day, 7 days a week
• We are focused on hiring, retaining
and training the best people with
comprehensive programs of
development for Clinicians and
Managers and leadership
development programs for Home
Managers
• Significant recent investment in
digital learning platform and
human capital management
systems
Delivering on our aged care development program, senior living growth strategy and workforce initiatives has been a key focus in 1H FY2020
Japara The Regent (render) Japara Mirboo North Japara George Vowell Staff member, Kirralee
6

22.1 23.8
21.1
24.3
1.7
2.8
1.2 1.3
3.6
1.80.5
2.1 3.2
1H FY2019EBITDA
Net non-recurring
items
1H FY2019recurringEBITDA
Sig refurbs /developments
COPE increase Leaseaccounting
impact
Staff costs Non wagescosts
Pre-reform run-off
Occupancy 1H FY2020recurringEBITDA
Net non-recurring
items
1H FY2020EBITDA
1H FY2020 earnings
EBITDA growth of 10% over 1H FY2019 supported by additional residents in our new and extended homes and from portfolio management of real estate assets
Highlights
• Wage rate increases (of ~2.5%) exceeded Government funding growth via ACFI indexation (of 1.4% for FY2020)
• New developments and homes significantly refurbished contributing as expected underpinned by strong greenfield and brownfield developments’ occupancy
• Non-wage cost increases driven by higher utility and insurance costs
• Average 1H FY2020 occupancy of 92.6%2 lower than expected on our mature portfolio and below 1H FY2019 average occupancy of 93.6%2
‒ Occupied beds increased by 126 in the six months to 31 December 2019
• Aged Care Royal Commission costs higher than expected at $1.1m
• Lease accounting standard implementation contributed $1.3m to 1H FY2020 EBITDA (with a $1.6m offsetting impact to depreciation and finance costs)
1. Refer to Appendices for a reconciliation of net non-recurring items
2. Average occupancy adjusts for places ramping up at new developments and places offline for refurbishment
3. Commonwealth Own Purpose Expense
1H FY2020 EBITDA bridge ($m)
7
11
3

44.5
172.0154.1
120.7 120.7 135.3172.4 176.4
134.5
14.6 37.1
4.09.0
Net bank debt as at30 June 2019
Cash fromoperating activities
Net pre-payments Net RAD/ILUinflows
Net land / assetpurchases
Construction IT & maintenancecapex
Dividends Net bank debt as at31 December 2019
1H FY2020 NPAT1 and financial position
NPAT impacted by reduced earnings from new homes ramping up whilst still recognising full depreciation and interest costs
Highlights
• 1H FY2020 NPAT1 of $5.4m (1H FY2019 of $7.6m)
• NPAT impacted by development activities which result in full depreciation and interest costs whilst EBITDA is still growing during initial occupation of new and redeveloped homes
• Lease accounting implementation also increased amortisation and net interest expense
• $51.7m net expenditure on development pipeline comprising land acquisitions and construction costs
• Near term developments expected to provide ~$135m-145m in RAD inflows for debt reduction and growth funding
• Five year, $345m syndicated loan facility established in December 2018
— Core net debt of $31.5m (0.6x FY2019 EBITDA)
— Available liquidity of $160m
Development net debt largely attributable to
Robina, Mt Waverley, Newport, Kingston
Gardens and land holdings
Development debt Core net debt
185.3179.0
1H FY2020 net bank debt movement ($m)
7.0
33.4153.8
31.5
1. Profit attributable to members of the Group
2. Cash from operating activities includes $1.3m of rent payments classified as financing cash flows in the cash flow statement
8
2
18.0

Dec 18 Netdevelopments
Sig refurb Jun19 Netdevelopments
Sig refurb Dec 19
Key operational metrics
Portfolio occupancy remains challenging although new and extended homes are filling quickly and bed contract prices and revenues are proving resilient
1. Occupancy adjusts for places ramping up at new developments and places offline for refurbishment
2. Metrics shown exclude the impact of all non recurring items in all periods and the Government temporary subsidy increase in 2H 2019
3. Calculated as the number of concessional residents / operational places
4. As at 27 February 2020
Operational metrics 1H FY2020 2H FY2019 1H FY2019 2H FY2018
Number of homes 50 49 49 48
Operational places (end of period) 4,385 4,235 4,125 4,069
Average occupancy1 92.6% 92.2% 93.6% 94.0%
Average revenue per occupied bed day ($)2 284.4 279.6 276.6 276.7
Average Government revenue per occupied bed day ($)2 206.3 201.1 201.1 199.8
Staff costs to revenue2 72.4% 72.6% 69.7% 69.5%
Non-wage costs to revenue2 17.4% 17.6% 17.3% 16.6%
Average concessional residents3 38.4% 38.5% 39.3% 38.7%
Average incoming bed contract price ($’000) 382.7 378.1 355.7 323.9
Net RAD/Bond & ILU loan inflow ($m) 33.4 15.8 28.9 15.7
Operational place movement
4,125 4,235 4,385
+114
-4 +146
4
Highlights
• Average 1H FY2020 occupancy of 92.6%1 below 1H FY2019
‒ Occupancy at 31 December 2019 was 92.5%1
• Since 31 December 2019 occupancy has increased beyond operational
place increases from new developments and is currently 93.0%4
• Government revenue growth underpinned by COPE and increased
accommodation supplement income
• Strong net RAD cash inflows supported by increased place numbers
9

58.8% 57.6% 56.0% 56.5% 55.4% 54.6% 55.8% 52.3%
18.8% 18.2% 17.3% 17.3% 17.6% 18.9% 17.7%18.4%
22.4% 24.2% 26.7% 26.2% 27.0% 26.5% 26.5% 29.3%
0%
20%
40%
60%
80%
100%
Jun-16 Dec-16 Jun-17 Dec-17 Jun-18 Dec-18 Jun-19 Dec-19
RAD Combination DAP
Resident trends
Resident numbers increasing progressively supported by the initial occupation of new and extended homes
1. Developments ramping up comprise Robina Rise, Kingston Gardens, Rye Sands and Brighton-Le-Sands
Non-concessional portfolio mix (by number of residents)Highlights
• 4,055 residents as at 31 December 2019 with further growth to 4,127 residents as at 27 February 2020
‒ Increase in resident numbers of 126 from 30 June 2019 to 31 December 2019
• Average incoming place contract values stable over 1H FY2020
• Slight change in overall resident preference towards DAPs over 1H FY2020
‒ Non-concessional portfolio mix on mature portfolio (excluding developments ramping up1 post development) comprises RAD: 53.3%, Combination RAD/DAP: 18.4% and DAP 28.3%
275
325
375
425
Dec-14 Dec-15 Dec-16 Dec-17 Dec-18 Dec-19
Average incoming place contract price ($’000)
10
3,750
3,800
3,850
3,900
3,950
4,000
4,050
4,100
4,150
Jul-18 Oct-18 Jan-19 Apr-19 Jul-19 Oct-19 Jan-20
Total Residents

530.6
87.3
79.8
26.4 564.5
0
100
200
300
400
500
600
700
RADs/Bonds at startof period
Incoming RADs - mature homes RADs/Bonds Refunds andDeductions - mature homes
Net RADs Greenfield/BrownfieldHomes
RADs/Bonds at end of period
1H FY2020 RAD liability movement
Net RAD cash flow in line with expectations and supported by new developments with further uplift expected during 2H FY2020
Highlights
• Net RAD liability movement of $33.9m in 1H FY2020 (excludes $0.5m of net ILU outflows)
‒ $9.3m from mature homes
‒ $26.4m from completed greenfield and brownfield developments
‒ $1.8m fees deducted from RADs
‒ Increase in probate liability of $7.3m
• Further RAD uplift expected for remainder of FY2020 as new homes and extensions ramp up
‒ Robina Rise opened in July 2019 and The Regent is expected to open in April 2020
‒ Brownfield extensions at Mirboo North, Brighton-Le-Sands and Kingston Gardens also opened recently and are ramping up
‒ An immediate focus on the opening of a new home is building occupied beds quickly, sometimes with non-RAD paying residents, and therefore RAD
inflow can be more gradual
RAD cash flow ($m)
58.0m 65.3m
Probate liability
11

Strategic initiatives02
12

Japara portfolio overview
Japara’s portfolio comprises over 5,000 existing or soon to be constructed aged care places with several co-located senior living communities
Portfolio summary
• Japara’s aged care portfolio currently comprises 50 homes across
five states
‒ Three further developments are under construction (Mt
Waverley and Newport in Victoria and Belrose in NSW)
‒ 47 homes are owned freehold with the remaining three leased
• Japara has a further greenfield development portfolio comprising:
‒ Four owned sites expected to complete over the next 3 years;
and
‒ Two further regions where licenses are held and sites are
being sourced
• Japara also has a number of brownfield development
opportunities
• Japara’s senior living portfolio comprises a total of 180
independent living units and apartments co-located with five of our
aged care homes
‒ A further three sites are in advanced planning for additional
senior living developments
South West Rocks
5
3
6320
Gympie
Noosa
AlburyAdelaide
Victorian Goldfields
Greater Geelong
Gippsland
Launceston
Melbourne
Coffs Harbour
Sydney
Wyong
4
2
Robina
13

Operational initiatives and governance 14
Japara has focused on enhancing its dementia care and technology capabilities within a robust governance overlay
Dementia care model
• 52% of aged care residents in Australia are living with dementia
and will experience complex behaviours associated with their
dementia
• Japara is implementing ‘small home’ environments for residents
living with dementia
• This model is based on global best practice and compliments
resident autonomy and quality of life while reducing complex
behaviours and the use of psychotropic medications
• Increased staff training and capacity to respond to complex
behaviours associated with dementia, and including ‘Dementia
Champions’ in our homes, provides better outcomes for residents
Information Technology
• Significant investment in server and network technology to reduce
risk around power outages, climate and physical security
• Wi-Fi installed in all rooms in Japara homes to provide residents
with high speed wireless access ‘24/7’
• Implementing an enhanced electronic and clinical medication
management system that improves resident data management and
frees up staff time, enabling this to be spent caring for residents
• Implementation of a workforce management system to improve
roster efficiency and continued compliance with EBAs
• Implemented a new core financial platform, Procura, to improve
financial reporting, general ledger and resident billing
• Redevelopment and rollout of our ‘Japara Cares’ app to rapidly
train all staff in the new Aged Care Quality Standards
• New infrastructure allows staff to spend more time caring for
residents
Governance
• Japara’s Zero Harm Board Sub-committee provides monitoring,
challenge and guidance for management in relation to areas of
clinical governance, workplace health and safety and environment
• Zero Harm committee Chaired by Clinical Professor and Board
member Leanne Rowe, AMJapara Lakes Entrance resident and staff member

Development pipeline
1. Refer Appendix for development pipeline details
105
120
28
38
106
102
90
90
105
30 30
Dece
mbe
r 20
19
Mt
Wa
ve
rle
y
Jun
e 2
02
0
New
port
Alb
ury
Mitch
elto
n
Be
lro
se
Jun
e 2
02
1
Lyste
rfie
ld
Bri
gh
ton
Rese
rvoir
Hop
e I
sla
nd
Low
er
Ple
nty
Ke
lasto
n
Jun
e 2
02
2
FY20
314
places
FY21
356 places
FY22
383 places
Greenfield (718 new places) Brownfield (126 net new places)
Developments ramping up (115) Offline due to refurbishment (22 places)
Operational places (4,385)
Japara’s near-term development pipeline comprises 844 net new places4,3
85
4,6
27
4,9
83
5,3
66
22
115
15
Near-term development pipeline1 (net new places)

Senior living portfolio 16
Japara has an existing portfolio of 180 senior living units and apartments
Existing portfolio summary
• Balmoral Mews, Geelong
‒ 33 units constructed in 2008 and 2014
• Barongarook Gardens, Colac
‒ 30 units constructed in 2000
• Cosgrove Cottages, Launceston
‒ 68 generally older units with potential for selective redevelopment
• The Homestead Serviced Apartments, Adelaide
‒ 41 serviced apartments constructed in 2006
• Sydney Williams Apartments, Doncaster
‒ 8 apartments constructed in 2000
Japara Balmoral Grove / Mews
Japara Millward / Sydney Williams Apartments
Japara Barongarook Gardens

Senior living development opportunities 17
Japara owns several sites where senior living developments are planned, providing opportunities for development profits and the creation of future income streams
Development portfolio summary
• Elanora, Brighton
‒ Recent acquisition of ~2,500 sq.m of adjacent land provides
opportunity for redevelopment of existing aged care home releasing
~8,000sq.m of surplus land for senior living development of ~80
apartments
• George Vowell, Mt Eliza
‒ ~6 ha. site adjacent to existing aged care home in advanced planning
for seniors manufactured housing development of 100 units
• Cosgrove Cottages, Launceston
‒ Planning approval currently being amended for further seniors
manufactured housing development of 50 units
Japara George Vowell
Japara Elanora
Cosgrove Cottages

The Regent greenfield development case study
The Regent in Mt Waverley is Japara’s latest greenfield development and is due to open in April 2020 offering 105 new premium rooms to the community
18
The Regent, Mt Waverley (VIC)
• Located in the eastern Melbourne suburb of Mount Waverley, with a
median house price of ~$1.3m, The Regent is a 105 bed home which
includes a specialised dementia small home environment
• Two former residential properties with a total site area of 5,450 sq.m.
were purchased in 2015 and 2016 for a total of $8.2m
• Construction commenced in late 2018 completing in February 2020
• Development costs (excluding land) totalled $33m
• The light filled home backs onto Valley Reserve with a variety of
accommodation types complemented by an in-house café & bar,
external terraces, balconies, cinema, beauty and wellbeing hub and
gymnasium
• The home will open to residents in April 2020
The Regent Aerial (February 2020)
Regent Street Façade (render)
Platinum Resident Suite (render)

Recent brownfield developments
Brighton-Le-Sands (NSW)
• Located in Brighton-Le-Sands in metropolitan Sydney
• Brownfield development opened in January 2020 adding 25 places to
the existing 60 place home (which was opened in September 2018)
• The project comprised a two storey development connecting into the
existing building
• Key objectives of the project were adding premium rooms, lounge and
dining spaces to a high quality recently built home
• Occupancy ramping up as expected with 65 residents1
• RAD inflows are projected to exceed the total project cost
Japara completed two major brownfield developments during 1H FY2020 at our homes at Brighton-Le-Sands in NSW and Springvale South in Victoria
Japara Brighton-Le-Sands
1. As at 27 February 2020
Japara Kingston Gardens
Kingston Gardens (VIC)
• Located in Springvale South in metropolitan Melbourne
• Brownfield development opened in November 2019 returning 60
refurbished places to the recently developed 68 place extension
(which was opened in September 2018)
• Total project comprised a new foyer, café, cinema, staff room, activity
spaces, lounge and dining rooms and additional premium rooms
• Key objectives of the overall project was the refurbishment of the
existing home and adding additional premium rooms to the offering
• Occupancy ramping up as expected with 90 residents1
• RAD inflows are expected to cover the construction cost
19

Development activity summary 20
Ramping up homes continue to perform well with strong occupancy. Newport and Belrose greenfield developments are well into construction
Recent development activity update
• Robina Rise, (opened July 2019)
— New 106 single room home located on Gold Coast
— Currently has 87 residents1
• Rye Sands (opened late 2018)
— New 99 single room home located on the Mornington Peninsula
— Currently has 93 residents1
• Mirboo North, Gippsland
— 18 place extension and significant refurbishment completed and
opened October 2019
• Newport, Melbourne
— New 120 single room home originally proposed as a replacement for
existing 60 place Yarra West home and expected to open late 2020
— Yarra West lease extended by 5 years resulting in net new places
from Newport increasing from 60 to 120
• Belrose, Sydney
— Construction commenced in December 2019 on a 102 bed home
• Highton, Geelong
— Decision made to discontinue with proposed development
— Site currently being offered for sale
• Hope Island
— Purchase of a 9,212 square metre development site at Hope Island
on the Gold Coast for a future 105 place home
• A further five significant refurbishment projects underway and expected to complete over the next six months
1. As at 27 February 2020
Japara Brighton-Le-Sands
Japara Kingston Gardens

Land holdings Net new
places
Book value
($m)
Mitchelton (QLD) 106 7.2
Belrose (NSW) 102 8.9
Lysterfield (VIC) 90 5.4
Reservoir (VIC) 90 7.7
Hope Island (QLD) 105 4.6
Highton (VIC) - 4.4
Kingston Way Estate (VIC) - 6.4
Brighton (VIC) - 9.5
Oaklands (SA) - 1.0
Bundaberg (QLD) - 0.7
Glenning Valley (NSW) - 1.4
Total 493 57.2
Development capital
Strong near term RAD inflows expected from completing and ramping up developments providing funds for significant debt reduction and growth funding
Development funding summary
• Japara continues to invest in greenfield and brownfield developments as they provide an attractive risk adjusted return, underpin future earnings growth and attract strong occupancy
• We are currently ramping up and/or completing 723 net new places with ~$27m in further capital expenditure required to complete the delivery of these places
• Together these 723 places are projected to generate a further ~$135m-$145m in RAD inflows (see table for detail)
• Expected RAD inflows from the above 723 total places assume a ‘look through’ ~65% RAD preference for non-supported residents and a weighted average RAD to local house price ratio of under 60%
• In addition, Japara has a number of land holdings and licences/approvals supporting medium-term growth
Developments
ramping up / completing
Net new
places
Expected future
RADs ($m)
Capex
remaining ($m)
Riverside Views (TAS) 88 -
Rye Sands (VIC) 99 -
The Highbury (VIC) 60 -
Brighton-Le-Sands (NSW) 85 -
Kingston Gardens (VIC) 60 -
Robina Rise (QLD) 106 -
The Regent (VIC) 105 2.6
Newport (VIC) 120 24.6
Total 723 135-145 27.2
21

Industry and business observations
03
22

Recent sector developments
Royal Commission into Aged Care Quality and Safety
• The Commission’s Interim Report was delivered on 31 October 2019 withthe Commissioners identifying three areas for immediate action:
— The provision of more Home Care Packages to reduce waiting lists;
— Responding to over-reliance on chemical restraint in aged care; and
— Reducing the number of younger people with a disability in aged care
• Japara has provided data requested on the following subjects:
— January 2019 – Clinical care and incident data
— January 2020 – Staffing hours per home data
• The Royal Commission has recommenced for 2020, starting withroundtable workshops and hearings in Adelaide
• Additional consultation papers are expected, including on the funding andfinancing of the aged care system and the regulation of quality and safety
• The Royal Commission will be holding hearings throughout March to May
• Commissioners Pagone and Briggs continue to indicate they believe theirrecommendations will be well prosecuted throughout the hearing processand they do not anticipate the final report will contain any surprises
• The Commissioners are required to provide a Final Report by 12November 2020
• Japara incurred direct costs relating to the Royal Commission of $1.1mfor 1H FY2020 in addition to direct costs of $1.8m in FY2019
The aged care industry appears to be on the cusp of significant change
Natural disasters
• Japara has recently had several homes impact by both bushfires andfloods
• Whilst some staff in particular have been personally impacted, allresidents and staff have been safe throughout the events and noevacuations have been required
• The efforts of our staff and the broader emergency services teams are tobe commended and we express our sincere thanks to all those involved
2020 Aged Care Allocation Round
• The Federal Government has announced an Aged Care Allocation Roundof 10,000 new places opening in March 2020
• Japara is considering applying for places in the 2020 ACAR in line with itsbrownfield and greenfield development strategy
Coronavirus (COVID-19)
• We note the respiratory illness outbreak caused by the novel coronavirus(COVID-19)
• Japara has an Outbreak Preparedness and Response Committee andplanning is underway for a situation where our residents or business areimpacted by coronavirus
• We are monitoring communications from the Australian GovernmentDepartment of Health and current Coronavirus Health Alerts
23

Aged Care Funding Instrument (ACFI)
Industry expectations based on Government funding projections have not been realised as scoring changes impact ACFI determinations
Source: ACFI Monitoring Reports, Australian Government, Department of Health
1. Excludes impact of March 2019 9.5% temporary subsidy increase
$150
$155
$160
$165
$170
$175
$180
Jun-14 Dec-14 Jun-15 Dec-15 Jun-16 Dec-16 Jun-17 Dec-17 Jun-18 Dec-18 Jun-19
Projected national ACFI rate per resident per day Actual national ACFI rate per resident per day
2016 federal budget
includes savings of
~$1.2bn over four
years
COPE
Indexation
COPE
Indexation
2015/16 MYEFO
includes ~$472m
of aged care
funding cuts
No COPE
Indexation
COPE
Indexation
Short term 9.5%
ACFI increase
(normalised out)
Government projected and actual monthly average ACFI rate1 per resident per day
COPE
Indexation
24

90%
91%
92%
93%
94%
95%
Dec 14 Dec 15 Dec 16 Dec 17 Dec 18 Dec 19
Mirus Australia residential aged care sector survey occupancy vs Japara occupancy
90%
91%
92%
93%
94%
95%
Jan Feb Mar Apr May Jun Jul Aug Sep Oct Nov Dec
Mirus Australia residential aged care sector survey annual occupancy ‘seasonality’ trend
2015 2016 2017 2018 2019
Occupancy 25
Industry data reflects continuing declines in occupancy, and some seasonality over the last five years, with Japara continuing to track above industry averages
Source: Mirus Australia
Japara 6 monthly occupancyMirus Australia monthly occupancy

5,400
2,930
4,520
2,5502,270
1,710
3,010 3,090
3,460
4,860
6,4506,255
2008 2009 2010 2011 2012 2013 2014 2015 2016 2017 2018 2019 2020 2021
0
1,000
2,000
3,000
4,000
5,000
6,000
7,000
8,000
9,000
$0
$500
$1,000
$1,500
$2,000
$2,500
$3,000
ABS Rolling Annual Aged Care Construction Work Done - advanced 9 months (LHS)
ABS Rolling Annual Aged Care Building Approvals - advanced 18 months (LHS)
Supply
Aged care building approvals and completed construction work suggest continued strong net place additions (assuming constant closure rates) to meet demand from . . .
ACFA/AIHW Annual Net New Places (RHS)
Rolling annual aged care building approvals and construction work done vs net place additions
Source: Aged Care Financing Authority & AIHW Residential Place data
Australian Bureau of Statistics, 8731.0 - Building Approvals, Australia, Dec 2019 - Aged Care Building Approvals
Australian Bureau of Statistics, 8755.0 - Construction Work Done, Australia - Aged Care Construction
Appro
vals
and c
om
ple
ted w
ork
$’0
00,0
00
26

180,000
190,000
200,000
210,000
220,000
230,000
240,000
250,000
260,000
2019 2020 2021 2022 2023 2024 2025 2026 2027 2028 2029
Forecast number of individuals aged 90+
700,000
750,000
800,000
850,000
900,000
950,000
1,000,000
1,050,000
1,100,000
2019 2020 2021 2022 2023 2024 2025 2026 2027 2028 2029
Forecast number of individuals aged 75-79
300,000
320,000
340,000
360,000
380,000
400,000
420,000
440,000
460,000
2019 2020 2021 2022 2023 2024 2025 2026 2027 2028 2029
Forecast number of individuals aged 85-89
Demand
. . . the ~86% of aged care residents aged 75+ whose population cohorts are projected to show strong growth rates and underpin demand
Source: Australian Bureau of Statistics, 3222.0 - Population Projections, Australia, 2017 (base) – 2066
1. Utilisation calculated as permanent and respite aged care residents within each age cohort divided by Australian Bureau of Statistics Estimate Resident
Population within that age cohort, both as at 30 June 2019
500,000
550,000
600,000
650,000
700,000
750,000
800,000
850,000
2019 2020 2021 2022 2023 2024 2025 2026 2027 2028 2029
Forecast number of individuals aged 80-84
14.9% utilisation1 with
3.5% p.a. CAGR forecast
2.7% utilisation1 with
3.7% p.a. CAGR forecast
6.5% utilisation1 with
4.8% p.a. CAGR forecast
27
32.4% utilisation1 with
2.4% p.a. CAGR forecast

Summary and outlook04
28

1H FY2020 summary and FY2020 outlook
Growth in aged care places, combined with portfolio management of real estate assets, mitigated the earnings impact of weaker than expected occupancy
1H FY2020 Summary
• Continued strong earnings contribution from recently completed greenfield and brownfield developments and refurbishments
• EBITDA of $24.3m up by 10% on 1H FY2019 largely due to portfolio management of real estate assets, with recurring EBITDA impacted by lower occupancy and cost inflation greater than revenue escalation
• Balance sheet strength maintained with net bank debt of $185.3m at 31 December 2019 and available liquidity of $160m
FY2020 Outlook
• Japara expects FY2020 EBITDA to be 10% lower than FY2019
— Subject to no material changes in market or regulatory
conditions
• The funding environment continues to present challenges and occupancy remains below historic levels
• Recently completed developments are expected to help mitigate industry headwinds as they increasingly contribute to EBITDA
— Interest and depreciation costs also expected to increase
slightly in 2H FY2020 due to recently completed developments
• Japara continues to focus on the delivery of its developments with over 300 net new places expected to be opened in FY2020
Japara Coffs Harbour Resident
Japara Gympie Resident
29

Appendices05
30

Appendix 1: Detailed Profit and Loss
1. Profit attributable to members of the Group
1H FY2020 1H FY2019 Change
$'000 $'000 % $'000
Revenue
Government care and accommodation funding 150,096 140,652 6.7% 9,444
Resident fees 56,940 52,679 8.1% 4,261
Other income 5,564 153 3,536.6% 5,411
Total revenue & other income 212,600 193,484 9.9% 19,116
Expenses
Employee benefits expense (150,792) (136,160) 10.7% (14,632)
Resident costs (18,584) (17,099) 8.7% (1,485)
Other costs (18,901) (18,120) 4.3% (781)
Total expenses (188,277) (171,379) 9.9% (16,898)
EBITDA 24,323 22,105 10.0% 2,218
Depreciation and amortisation (12,711) (9,080) 40.0% (3,631)
EBIT 11,612 13,025 (10.8%) (1,413)
Net finance costs (3,780) (2,353) 60.6% (1,427)
Income tax expense (2,408) (3,121) (22.8%) 713
NPAT1 5,424 7,551 (28.2%) (2,127)
31

Appendix 2: Detailed Statutory Cash Flow Statement
1H FY2020 1H FY2019
$'000 $'000
Cash flows from operating activities:
Receipts from customers 230,575 215,528
Payments to suppliers and employees (196,363) (178,465)
Income taxes paid (4,113) (3,508)
Interest received 166 225
Finance costs paid (3,962) (3,327)
Proceeds from RADs/accommodation bonds & ILU resident loans 120,895 96,510
Repayment of RADs/accommodation bonds & ILU resident loans (87,491) (67,565)
Net cash provided by operating activities 59,707 59,398
Cash flows from investing activities:
Purchase of land & buildings (16,611) (7,865)
Proceeds from sale of land & buildings 2,007 578
Purchase of plant and equipment (4,008) (5,738)
Capital works in progress (37,034) (53,492)
Net cash used in investing activities (55,646) (66,517)
Cash flows from financing activities:
Proceeds from issue of share capital under DRP - 1,578
Dividends paid (8,952) (9,972)
Net proceeds from bank borrowings 25,250 32,000
Repayment of lease liabilities (1,339) -
Net cash provided by financing activities 14,959 23,606
Net increase in cash and cash equivalents held 19,020 16,487
Cash and cash equivalents at beginning of the half year 31,472 29,158
Cash and cash equivalents at end of the half year 50,492 45,645
32
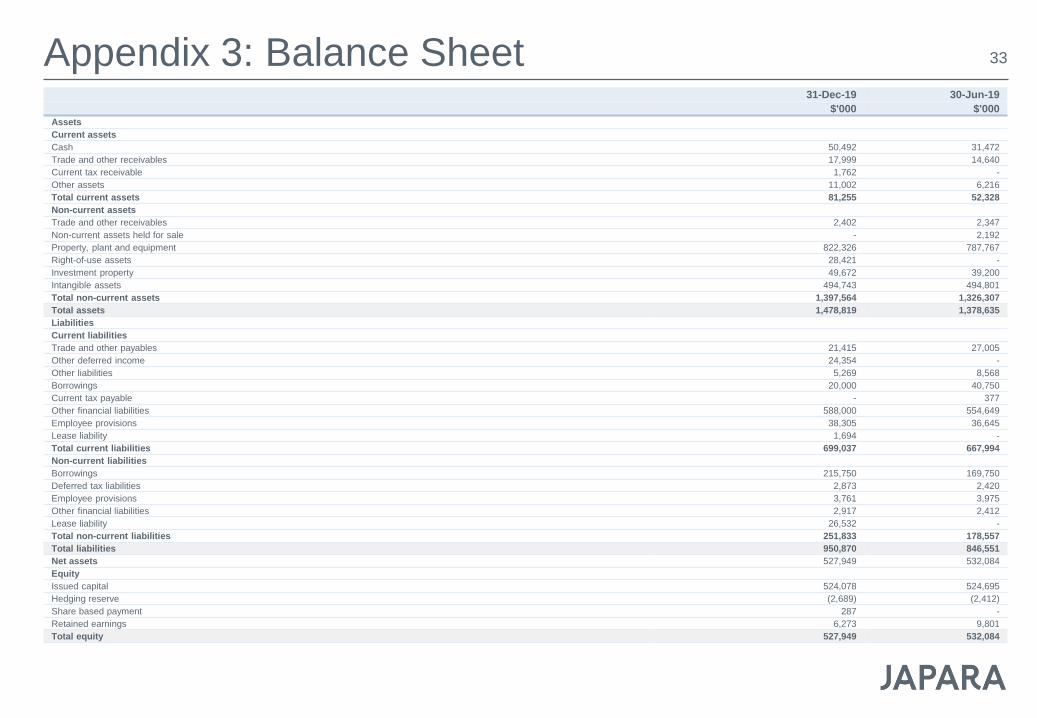
Appendix 3: Balance Sheet 33
31-Dec-19 30-Jun-19
$'000 $'000
Assets
Current assets
Cash 50,492 31,472
Trade and other receivables 17,999 14,640
Current tax receivable 1,762 -
Other assets 11,002 6,216
Total current assets 81,255 52,328
Non-current assets
Trade and other receivables 2,402 2,347
Non-current assets held for sale - 2,192
Property, plant and equipment 822,326 787,767
Right-of-use assets 28,421 -
Investment property 49,672 39,200
Intangible assets 494,743 494,801
Total non-current assets 1,397,564 1,326,307
Total assets 1,478,819 1,378,635
Liabilities
Current liabilities
Trade and other payables 21,415 27,005
Other deferred income 24,354 -
Other liabilities 5,269 8,568
Borrowings 20,000 40,750
Current tax payable - 377
Other financial liabilities 588,000 554,649
Employee provisions 38,305 36,645
Lease liability 1,694 -
Total current liabilities 699,037 667,994
Non-current liabilities
Borrowings 215,750 169,750
Deferred tax liabilities 2,873 2,420
Employee provisions 3,761 3,975
Other financial liabilities 2,917 2,412
Lease liability 26,532 -
Total non-current liabilities 251,833 178,557
Total liabilities 950,870 846,551
Net assets 527,949 532,084
Equity
Issued capital 524,078 524,695
Hedging reserve (2,689) (2,412)
Share based payment 287 -
Retained earnings 6,273 9,801
Total equity 527,949 532,084

Appendix 4: Non-recurring earnings reconciliation
1H FY2020 1H FY2019
$m $m
Non recurring items
Profit on sale of surplus bed licences 4.6 -
Profit on sale of land 0.7 -
Royal Commission direct costs (1.1) -
Greenfield start-up losses (1.0) (1.0)
Redundancies / restructuring - (0.7)
Total 3.2 (1.7)
34
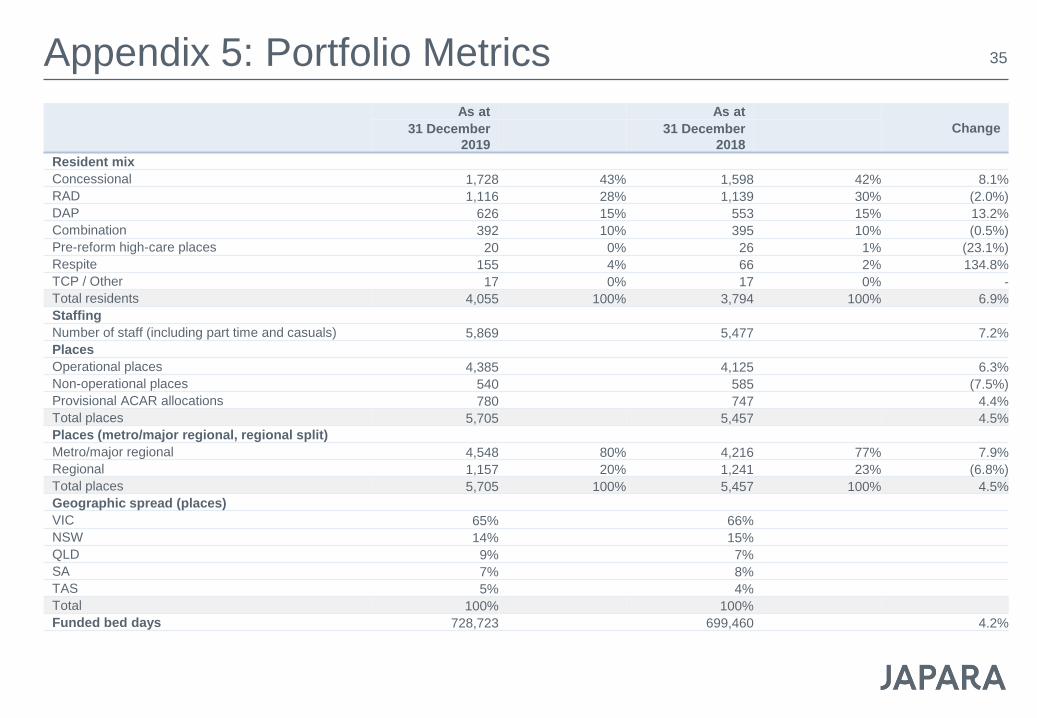
Appendix 5: Portfolio Metrics
As at As at
Change31 December
2019
31 December
2018
Resident mix
Concessional 1,728 43% 1,598 42% 8.1%
RAD 1,116 28% 1,139 30% (2.0%)
DAP 626 15% 553 15% 13.2%
Combination 392 10% 395 10% (0.5%)
Pre-reform high-care places 20 0% 26 1% (23.1%)
Respite 155 4% 66 2% 134.8%
TCP / Other 17 0% 17 0% -
Total residents 4,055 100% 3,794 100% 6.9%
Staffing
Number of staff (including part time and casuals) 5,869 5,477 7.2%
Places
Operational places 4,385 4,125 6.3%
Non-operational places 540 585 (7.5%)
Provisional ACAR allocations 780 747 4.4%
Total places 5,705 5,457 4.5%
Places (metro/major regional, regional split)
Metro/major regional 4,548 80% 4,216 77% 7.9%
Regional 1,157 20% 1,241 23% (6.8%)
Total places 5,705 100% 5,457 100% 4.5%
Geographic spread (places)
VIC 65% 66%
NSW 14% 15%
QLD 9% 7%
SA 7% 8%
TAS 5% 4%
Total 100% 100%
Funded bed days 728,723 699,460 4.2%
35

Appendix 6: Developments update
Significant greenfield developments program comprising 718 new places
Greenfield developments Program status Total new places Net new placesEstimated resident
admission
Mt Waverley (Melbourne) Construction 105 105 2H FY2020
Newport (Melbourne) Construction 120 120 1H FY2021
Mitchelton (Brisbane) Tender 106 106 2H FY2021
Belrose (Sydney) Construction 102 102 2H FY2021
Lysterfield (Melbourne) Detailed design 90 90 1H FY2022
Reservoir (Melbourne) Town planning 90 90 1H FY2022
Hope Island (Gold Coast) Concept design 105 105 2H FY2022
Total 718 718
36
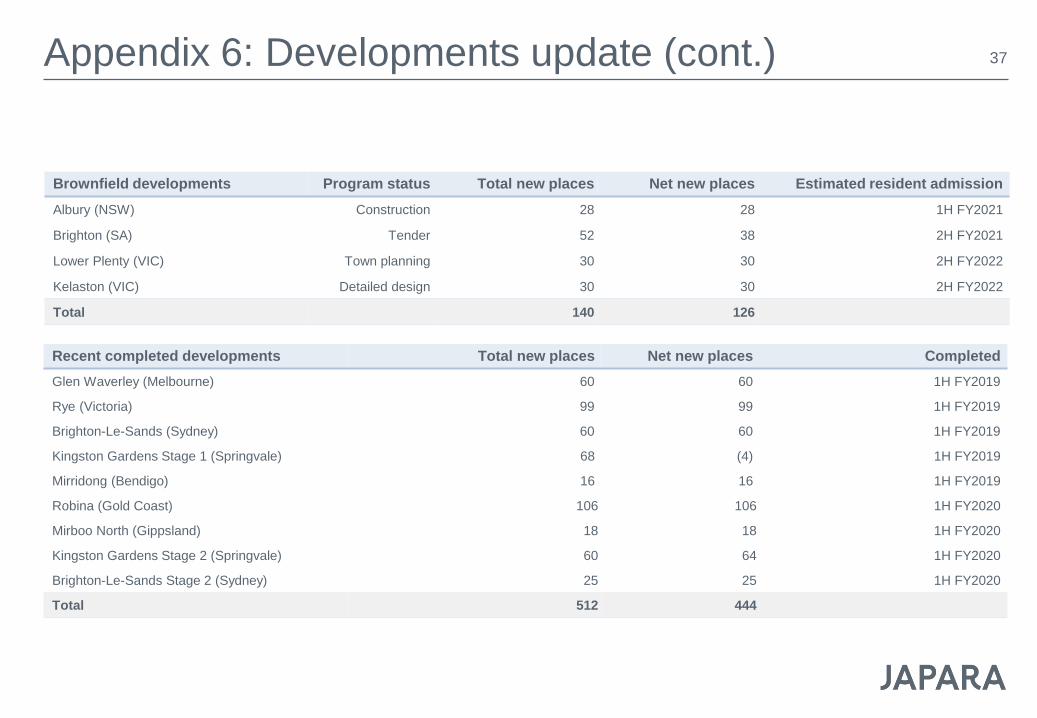
Appendix 6: Developments update (cont.)
Recent completed developments Total new places Net new places Completed
Glen Waverley (Melbourne) 60 60 1H FY2019
Rye (Victoria) 99 99 1H FY2019
Brighton-Le-Sands (Sydney) 60 60 1H FY2019
Kingston Gardens Stage 1 (Springvale) 68 (4) 1H FY2019
Mirridong (Bendigo) 16 16 1H FY2019
Robina (Gold Coast) 106 106 1H FY2020
Mirboo North (Gippsland) 18 18 1H FY2020
Kingston Gardens Stage 2 (Springvale) 60 64 1H FY2020
Brighton-Le-Sands Stage 2 (Sydney) 25 25 1H FY2020
Total 512 444
Brownfield developments Program status Total new places Net new places Estimated resident admission
Albury (NSW) Construction 28 28 1H FY2021
Brighton (SA) Tender 52 38 2H FY2021
Lower Plenty (VIC) Town planning 30 30 2H FY2022
Kelaston (VIC) Detailed design 30 30 2H FY2022
Total 140 126
37

Disclaimer
This presentation was prepared by Japara Healthcare Limited (ABN 54 168 631 052) (“the Company”) and was authorised for release by the Board of the Company.
Information contained in this presentation is current as at 28 February 2020. This presentation is provided for information purposes only and has been preparedwithout taking account of any particular reader’s financial situation, objectives or needs. Nothing contained in this presentation constitutes investment, legal, tax orother advice. Accordingly, readers should, before acting on any information in this presentation, consider its appropriateness, having regard to their objectives,financial situation and needs, and seek the assistance of their financial or other licensed professional adviser before making any investment decision. Thispresentation does not constitute an offer, invitation, solicitation or recommendation with respect to the subscription for, purchase or sale of any security, nor does itform the basis of any contract or commitment.
Except as required by law, no representation or warranty, express or implied, is made as to the fairness, accuracy or completeness of the information, opinions andconclusions, or as to the reasonableness of any assumption, contained in this presentation. By reading this presentation and to the extent permitted by law, thereader releases the Company and its affiliates, and any of their respective directors, officers, employees, representatives or advisers from any liability (including,without limitation, in respect of direct, indirect or consequential loss or damage or loss or damage arising by negligence) arising in relation to any reader relying onanything contained in or omitted from this presentation.
The forward looking statements included in this presentation involve subjective judgment and analysis and are subject to significant uncertainties, risks andcontingencies, many of which are outside the control of, and are unknown to, the Company. In particular, they speak only as of the date of these materials, theyassume the success of Japara Healthcare Limited’s business strategies, and they are subject to significant regulatory, business, competitive and economicuncertainties and risks. Actual future events may vary materially from forward looking statements and the assumptions on which those statements are based. Giventhese uncertainties, readers are cautioned not to place reliance on such forward looking statements. Past performance is not a reliable indicator of futureperformance.
.
38