Half Year 2017 Results - SES | Beyond frontiers · Half Year 2017 Results ... Excluding one-off...
27
H1 2017 Results | 28 July 2017 Half Year 2017 Results Six months ended 30 June 2017 Betzdorf, Luxembourg
Transcript of Half Year 2017 Results - SES | Beyond frontiers · Half Year 2017 Results ... Excluding one-off...

H1 2017 Results |
28 July 2017
Half Year 2017 Results
Six months ended 30 June 2017
Betzdorf, Luxembourg

H1 2017 Results |
H1 2017 Highlights
2
Reported revenue +9.6% (-1.5% like-for-like) and +21.2% growth in net profit
Improving trend in SES Video and strong growth in SES Networks delivers stable verticals development
Building future mainstream revenues in the fastest growing and most differentiated market segments
Credit: SpaceX
SES-15: FIRST
HYBRID SATELLITE
Credit: ESA - CNES - ARIANESPACE

H1 2017 Results |
H1 2017
EUR million
Change
Reported Like-for-like(1)
SES Video
(67%) 699.7 +5.4% -3.1%
▲ Improving trend with Q2 ‘17 at -1.9%
▲ Enhancing viewing experience with HD/UHD
▲ Nearly doubling integrated solutions revenues
SES Networks
(33%) 343.4 +24.9% +7.5%
▲ Expanding global GEO-MEO solutions
▲ Double-digit growth in both aero and maritime
▲ Growing globally; U.S. Government stabilising
SES Verticals 1,043.1 +11.1% +0.2%
Other(2) 5.6 n/m n/m
Group Total 1,048.7 +9.6% -1.5%
Growing Reported Revenue
3
1) At constant FX and assuming RR Media and O3b had been consolidated on 1 January 2016
2) Other includes revenue not directly applicable to a particular vertical
Improving trend in SES Video and strong growth in SES Networks delivers stable verticals development

H1 2017 Results | 4
663.7
722.1 699.7
H1 '16as reported
H1 '16like-for-like
H1 '17
Improving trend: Q2 ‘17 at -1.9% (Q1 ‘17: -4.2%)
• Impact of Q1 ‘16 periodic revenue progressively
normalising
• Q2 ‘17 benefit from new agreements across existing
fleet and recently launched capacity
Enhancing viewing experiences
• 6% (YOY) growth in HDTV to 2,587 channels
• 25% (YOY) growth in commercial UHD channels
• 63.5% of channels in MPEG-4 (H1 ‘16: 58.9%)
Increasing revenues from integrated solutions(2)
• Multi-year distribution agreement with VUBIQUITY
• Long-term contract with Beta Ltd.
• Supporting linear broadcasting requirements for a
major global video on demand platform
Improving Trend in Video
Revenue +5.4% as reported
EUR million
(1)
1) At constant FX and assuming RR Media and O3b had been consolidated on 1 January 2016
2) Solutions combining capacity and ancillary services

H1 2017 Results | 5
100
182
H1 '16 H1 '17
Integrated media services (DTH and OTT)
Delivering the best experience anytime,
anywhere and on any device
Increasing Revenues from Integrated Media Services
Integrated services revenue evolution
Indexed with H1 ‘16 = 100 (as reported at constant FX)
Experience
Provider
Infrastructure
Provider
Backend
Provider
Media asset
management
Encoding/
Transcoding
Digital Rights
Management
Online Video
Platform
IP devices
Encryption Uplink Direct-
to-Home
Playout
Encoding/
Transcoding
H1 2017 Results | 6
117.4
140.2 139.6
H1 '16as reported
H1 '16like-for-like
H1 '17
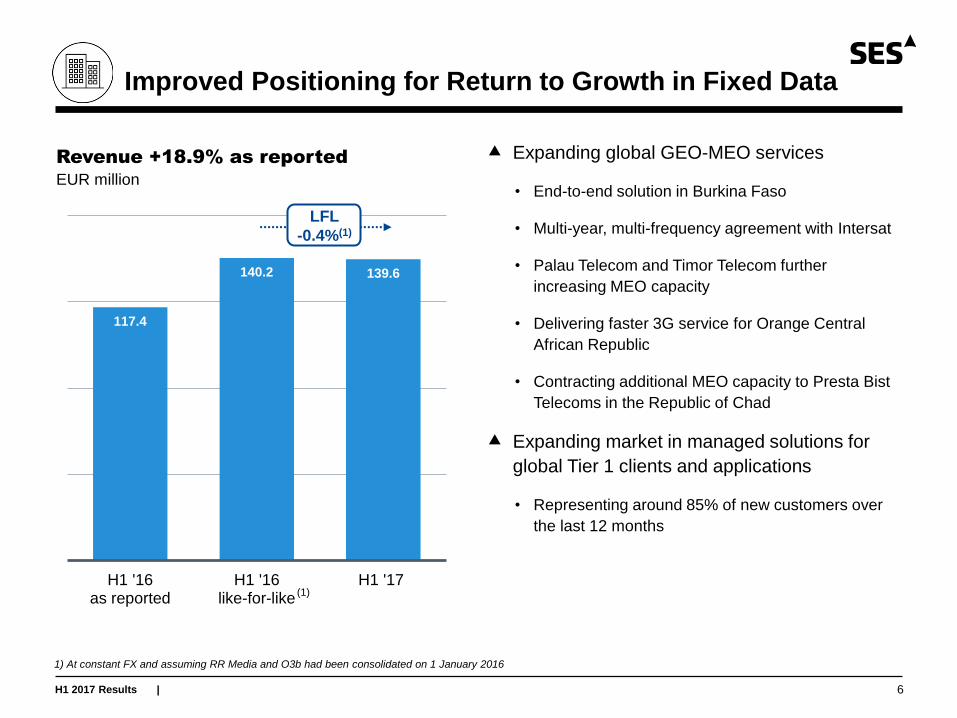
Improved Positioning for Return to Growth in Fixed Data
Revenue +18.9% as reported
EUR million
LFL
-0.4%(1)
(1)
1) At constant FX and assuming RR Media and O3b had been consolidated on 1 January 2016
Expanding global GEO-MEO services
• End-to-end solution in Burkina Faso
• Multi-year, multi-frequency agreement with Intersat
• Palau Telecom and Timor Telecom further
increasing MEO capacity
• Delivering faster 3G service for Orange Central
African Republic
• Contracting additional MEO capacity to Presta Bist
Telecoms in the Republic of Chad
Expanding market in managed solutions for
global Tier 1 clients and applications
• Representing around 85% of new customers over
the last 12 months
H1 2017 Results | 7
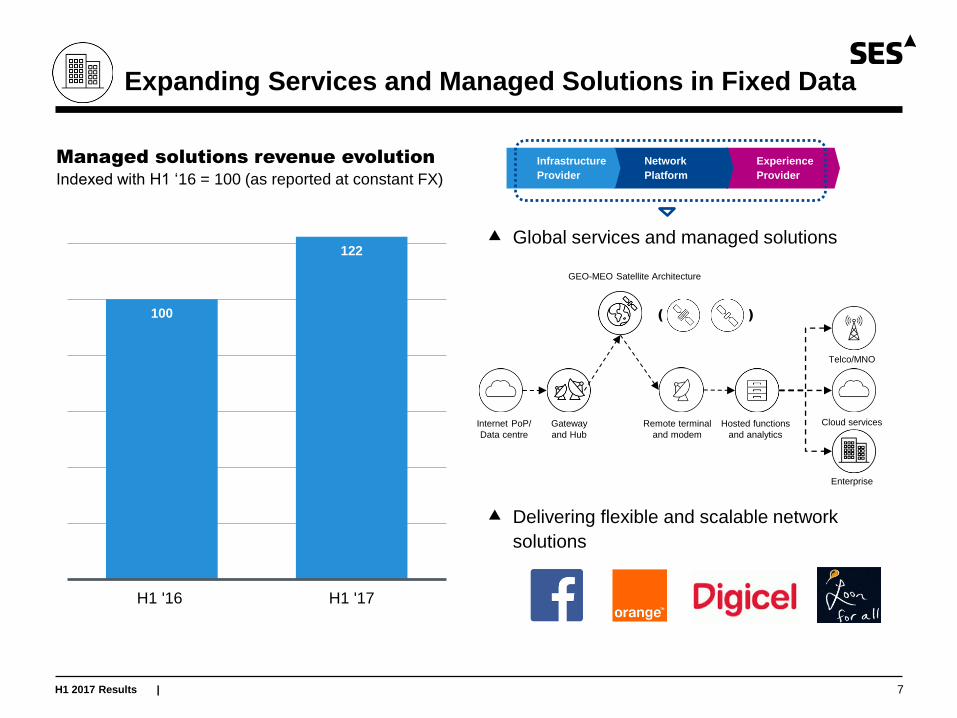
100
122
H1 '16 H1 '17
Global services and managed solutions
Delivering flexible and scalable network
solutions
Expanding Services and Managed Solutions in Fixed Data
Managed solutions revenue evolution
Indexed with H1 ‘16 = 100 (as reported at constant FX)
Experience
Provider
Network
Platform
Infrastructure
Provider
Internet PoP/
Data centre
Gateway
and Hub
Remote terminal
and modem
Hosted functions
and analytics
( )
GEO-MEO Satellite Architecture
Telco/MNO
Cloud services
Enterprise

H1 2017 Results | 8
44.6
61.1
83.8
H1 '16as reported
H1 '16like-for-like
H1 '17
Double-digit growth in Aero
• Global Eagle Entertainment acquired payload on
AMC-3 to boost capacity for customers
• Two important additional contracts with Gogo
covering existing fleet capacity
• Successful launch of SES-15 to drive future growth
with strong anchor customers
Double-digit growth in Maritime
• Contracting with major regional players in South
East Asia (e.g. Patrakom and Primacom on SES-9)
• Leveraging “Maritime+” solutions for shipping and
cruise industry (e.g. GTMaritime and Silversea
Cruise)
Generating Strong Growth in Aero and Maritime Mobility
Revenue +88.1% as reported
EUR million
LFL
+37.1%(1)
(1)
1) At constant FX and assuming RR Media and O3b had been consolidated on 1 January 2016

H1 2017 Results | 9
56
98
44
85
H1 '16 H1 '17
Aero Maritime
Double-Digit Growth in Mobility
Aero and Maritime revenue evolution
Indexed with H1 ‘16 = 100 (as reported at constant FX)
Experience
Provider
Network
Platform
Infrastructure
Provider
Tailored solutions for mobility providers
100
183
1) Includes second tranche of GEE deal EUR 17 million in Q1 ’17 (first tranche in H2 ’16)
(1)
(1)
( )
GEO-MEO Satellite Architecture
Energy
Aero
Maritime
Providing ‘home-equivalent’ passenger
experiences and other services
Internet PoP/
Data centre
Gateway
and Hub
Remote terminal
and modem
Hosted functions
and analytics
Hosted functions
and analytics
H1 2017 Results | 10
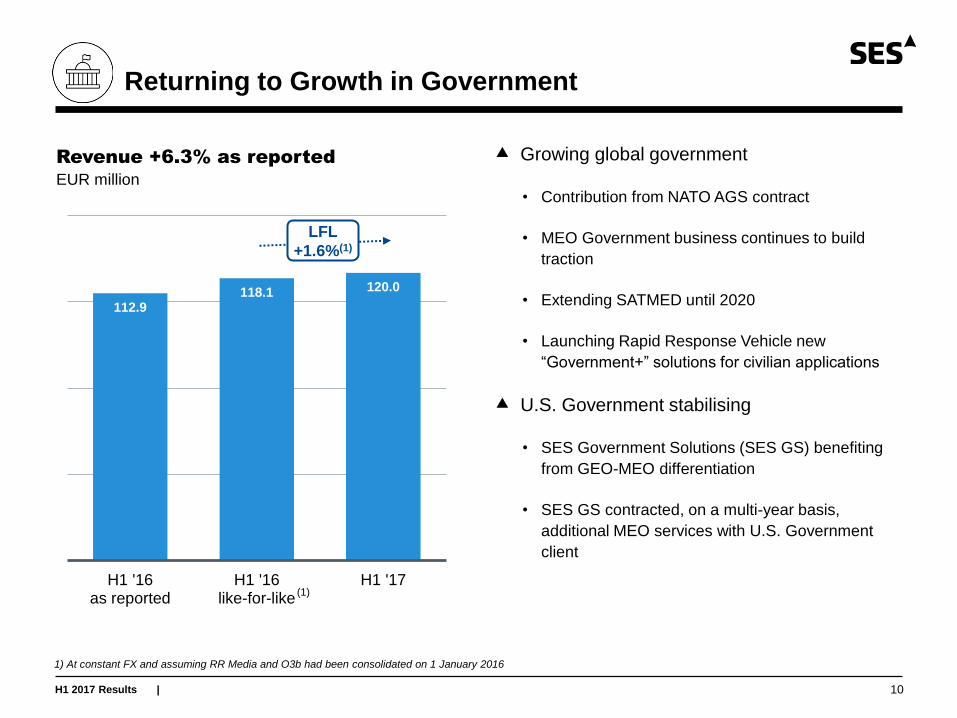
112.9 118.1 120.0
H1 '16as reported
H1 '16like-for-like
H1 '17
Growing global government
• Contribution from NATO AGS contract
• MEO Government business continues to build
traction
• Extending SATMED until 2020
• Launching Rapid Response Vehicle new
“Government+” solutions for civilian applications
U.S. Government stabilising
• SES Government Solutions (SES GS) benefiting
from GEO-MEO differentiation
• SES GS contracted, on a multi-year basis,
additional MEO services with U.S. Government
client
Returning to Growth in Government
Revenue +6.3% as reported
EUR million
LFL
+1.6%(1)
(1)
1) At constant FX and assuming RR Media and O3b had been consolidated on 1 January 2016
H1 2017 Results |
TROJAN
Network
11
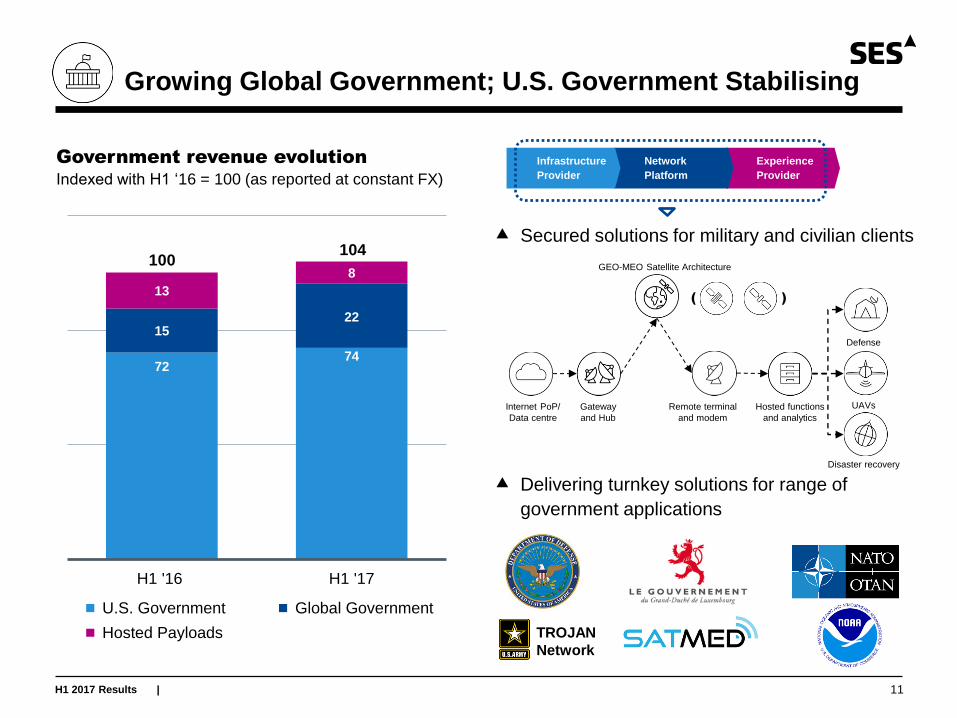
72 74
15 22
13
8
H1 '16 H1 '17
U.S. Government Global Government
Hosted Payloads
Growing Global Government; U.S. Government Stabilising
Government revenue evolution
Indexed with H1 ‘16 = 100 (as reported at constant FX)
Experience
Provider
Network
Platform
Infrastructure
Provider
100 104
Secured solutions for military and civilian clients
( )
GEO-MEO Satellite Architecture
Defense
UAVs
Disaster recovery
Delivering turnkey solutions for range of
government applications
Internet PoP/
Data centre
Gateway
and Hub
Remote terminal
and modem
Hosted functions
and analytics
Hosted functions
and analytics

H1 2017 Results |
Returning to sustained
and profitable growth in
medium term
9.6% growth in reported revenue (down 1.5% like-for-like)(1)
Improving trend in Video; strong growth in Networks
Net profit increase of 21.2%
Delivering Profitable Growth and Returns
12
Deploying differentiated
capabilities in each
market vertical
Nearly doubling reported revenue from integrated media solutions
Expanding fixed data, mobility and government networks
Development agreement with Boeing to deliver technology innovation
Applying a consistent
financial framework
Investing in future growth projects, underpinned with anchor clients
Net debt to EBITDA 3.24 times
Reducing recurring depreciation by 11.4% (like-for-like)(1,2)
1) At constant FX and assuming RR Media and O3b had been consolidated on 1 January 2016
2) Excluding one-off impairment charge of EUR 38.4 million against AMC-9 in H1 2017
FINANCIAL REVIEW
Padraig McCarthy, CFO

H1 2017 Results |
Financial Highlights
H1 2017
EUR million
H1 2016
EUR million
Change
Reported Like-for-like(1)
Revenue 1,048.7 956.8 +9.6% -1.5%
EBITDA 687.1 699.8 -1.8% -2.8%
EBITDA margin (like-for-like)(1) 65.5% 66.4%
Operating profit 306.0 417.6 -26.7% -8.1%
“Normalised” operating profit margin(1) 32.8%(2) 31.3%
Profit attributable to SES shareholders 275.5 227.3 +21.2% n/a
Net cash generated by operating activities 635.1 566.8 +12.1% n/a
Free cash flow before financing activities 375.2 280.0 +34.0% n/a
Net debt to EBITDA ratio(3) 3.24 times 2.03 times
Contract backlog EUR 7.5 billion EUR 7.3 billion
1) At constant FX and assuming RR Media and O3b had been consolidated from 1 January 2016
2) Excluding one-off impairment charge of EUR 38.4 million against AMC-9 in H1 2017. H1 2017 reported operating profit margin was 29.2%
3) Based on rating agency methodology (hybrid bonds as 50% debt/50% equity). IFRS (hybrid bonds as 100% equity) net debt to EBITDA ratio was 2.79 times at 30 June 2017
14
H1 2017 Results |
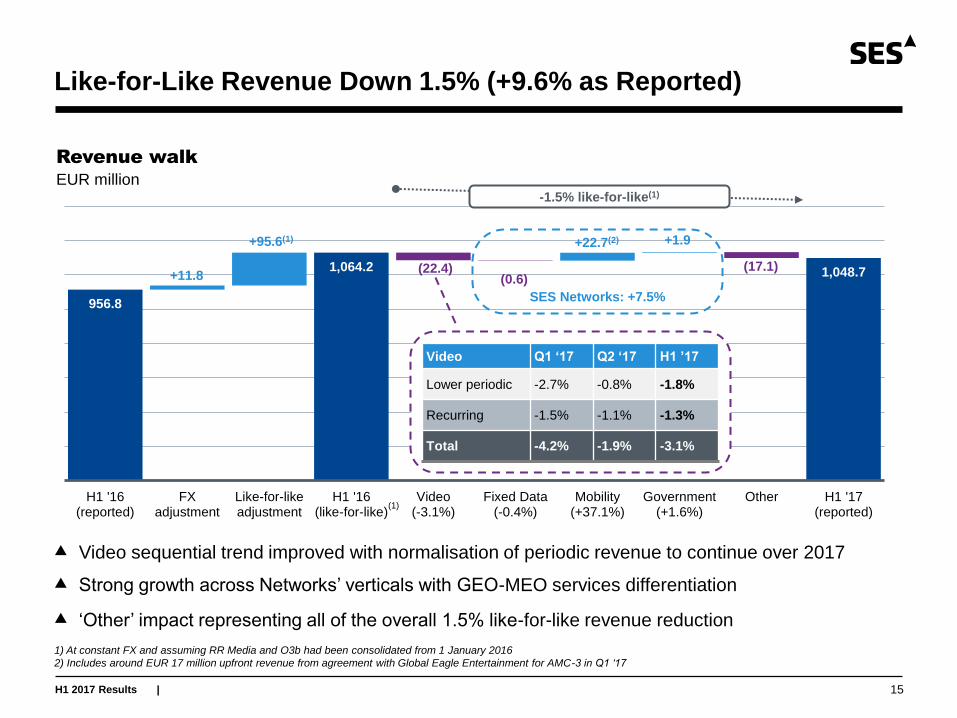
956.8
1,064.2 1,048.7
H1 '16(reported)
FXadjustment
Like-for-likeadjustment
H1 '16(like-for-like)
Video(-3.1%)
Fixed Data(-0.4%)
Mobility(+37.1%)
Government(+1.6%)
Other H1 '17(reported)
Like-for-Like Revenue Down 1.5% (+9.6% as Reported)
15
Revenue walk
EUR million
Video sequential trend improved with normalisation of periodic revenue to continue over 2017
Strong growth across Networks’ verticals with GEO-MEO services differentiation
‘Other’ impact representing all of the overall 1.5% like-for-like revenue reduction
1) At constant FX and assuming RR Media and O3b had been consolidated from 1 January 2016
2) Includes around EUR 17 million upfront revenue from agreement with Global Eagle Entertainment for AMC-3 in Q1 ‘17
+95.6(1)
+11.8 (22.4)
(1)
SES Networks: +7.5%
+22.7(2)
(17.1)
-1.5% like-for-like(1)
(0.6)
+1.9
Video Q1 ‘17 Q2 ‘17 H1 ’17
Lower periodic -2.7% -0.8% -1.8%
Recurring -1.5% -1.1% -1.3%
Total -4.2% -1.9% -3.1%

H1 2017 Results |
Like-for-Like EBITDA 2.8% Lower (-1.8% as Reported)
16
699.8 706.9
687.1
H1 '16(reported)
FX adjustment Like-for-likeadjustment
H1 '16(like-for-like)
Change inrevenue
Change inOpEx
H1 '17(reported)
EBITDA walk
EUR million
OpEx increase due to higher variable cost of sales, associated with O3b and HD+ revenue growth
1) At constant FX and assuming RR Media and O3b had been consolidated from 1 January 2016
(1.0)(1)
+8.1
(15.5) (4.3)
EBITDA
margin
73.1%
EBITDA
margin
66.4%
EBITDA
margin
65.5%
(1)

H1 2017 Results |
Like-for-like Depreciation 0.2% Lower (+36.2% as Reported)
17
251.0
342.8
303.6
342.0
H1 '16(reported)
FX adjustment Like-for-likeadjustment
H1 '16(like-for-like)
GEO depreciablefleet
MEO depreciablefleet
Recurringdepreciation
AMC-9 Impairmentcharge
H1 '17(reported)
Depreciation walk
EUR million
Reducing recurring depreciation by 11.4% (like-for-like)(1,2)
Amortisation expense of EUR 39.1 million (H1 2016: EUR 31.2 million)
Operating profit margin at 32.8%, excluding AMC-9 impairment charge(2) (H1 2016 like-for-like: 31.3%)
Reported operating profit of EUR 306.0 million (H1 2016: 417.6 million)
+87.6(1)
(34.0) +4.2
-0.2% like-for-like(1)
(5.2)
+38.4
(1)
1) At constant FX and assuming RR Media and O3b had been consolidated on 1 January 2016
2) Excluding one-off impairment charge of EUR 38.4 million against AMC-9 in H1 2017. H1 2017 reported operating profit margin was 29.2%
-11.4% recurring
depreciation

H1 2017 Results |
Net Profit up 21.2% to EUR 275.5 million
18
Finance costs included EUR 5.7 million net FX gain (H1 2016: EUR 1.8 million)
• Additional costs from RR Media and O3b offset by lower same scope net interest and higher capitalised interest
Positive contribution from income tax due to release of certain provisions and recognition of withholding tax asset
• Effective tax rate of 13.1% excluding one-offs (H1 2016: 17.4%)
Share of associates’ result nil in H1 2017 following O3b consolidation in H2 2016
Net profit attributable to SES’s shareholders walk
EUR million
227.3
275.5 275.5
H1 '16 Operating profit(reported)
Net financing costs Income tax Share of associates(net of tax)
Non-controllinginterests
H1 '17
+7.0
+99.7
+54.1
(1.0)
(111.6)

H1 2017 Results |
375 364
536
354
280
375 375
40% 37%
54%
35%
29% 34% 36%
H1 '14 H2 '14 H1 '15 H2 '15 H1 '16 H2 '16 H1 '17
Free Cash Flow (FCF) before financing activities FCF as a % of group revenue
Strong Free Cash Flow Before Financing and Acquisitions
Net operating cash flow +12.1% (YOY) increasing free cash flow versus prior year
FCF before financing and acquisitions/revenue ratio in line with recent average
Free cash flow (FCF) before financing activities and acquisitions
EUR million
1) Excludes net investment cost of EUR 762.2 million (net of acquired cash)
(1)
19

H1 2017 Results |
Balance Sheet and Contract Backlog Remain Strong
20
2.54 2.03
3.09
3.05 3.24
FY '15 H1 '16 FY '16 Q1 '17 H1 '17
Net debt to EBITDA ratio
Times(1)
Net debt to EBITDA in line with financial framework
Substantial contract backlog underpins future growth acceleration
7.4
7.3 8.1
7.8 7.5
FY '15 H1 '16 FY '16 Q1 '17 H1 '17
Fully protected contract backlog
EUR billion (as reported)
1) Based on rating agency methodology (hybrid bonds as 50% debt/50% equity) and includes last 12 months EBITDA from O3b and RR Media

H1 2017 Results |
Financial Outlook
21
FY 2017
Like-for-like(1)
Before impact of satellite health and
launch changes
After impact of satellite health and
launch changes
Video Stable Slight decline
Fixed Data Returning to growth Returning to growth
Mobility Strong growth Strong growth
Government Stable to slight growth Stable to slight growth
Other EUR 5 - 10 million EUR 5 - 10 million
EBITDA margin Broadly stable Broadly stable
Operating profit margin(2) Improving Improving
1) At constant FX and assuming RR Media and O3b had been consolidated on 1 January 2016
2) Excluding one-off impairment charge against AMC-9 in H1 2017
Outlook unchanged, before satellite health and launch changes
Impact of satellite health changes and updated launch schedule of EUR 37 - 47 million (FY 2017)

H1 2017 Results |
524 570
320
190 150 100
64 60
60
60 60
60
60
150
280 320
620
FY '16 FY '17 FY '18 FY '19 FY '20 FY '21 Committed Non-satellite Estimated uncommitted
Important Near-term Reduction in CapEx Expected
22
GEO-MEO Capital Expenditure (growth and replacement capacity)(1)
EUR million
Expanding global network, with long-term anchor customers secured before procurement
EUR 650-750 million of incremental revenue expected from GEO-MEO growth investments at ‘steady-state’(2)
Sustained revenue growth plus operational cost and CapEx efficiencies improving Return on Invested Capital to
over 10% in the medium-term
1) Including payload, launch, capitalised interest and excluding financial or intangible investments (based on FX rate of EUR 1: USD 1.10)
2) Annualised revenue from recently added and forthcoming GEO-MEO investments which are expected to be launched by end-2019
690
530 530 530
780
Previous 810 560 550 550 610
(Reduction)/increase (120) (30) (20) (20) 170
APPENDIX
H1 2017 Results |
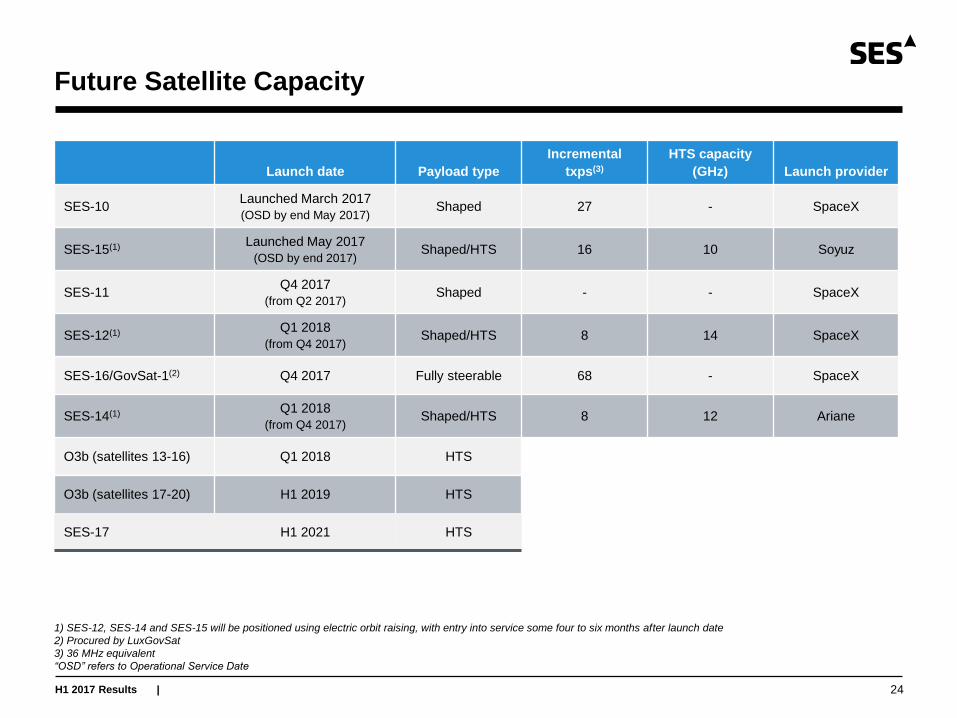
Future Satellite Capacity
24
Launch date Payload type
Incremental
txps(3)
HTS capacity
(GHz) Launch provider
SES-10 Launched March 2017
(OSD by end May 2017) Shaped 27 - SpaceX
SES-15(1) Launched May 2017
(OSD by end 2017) Shaped/HTS 16 10 Soyuz
SES-11 Q4 2017
(from Q2 2017) Shaped - - SpaceX
SES-12(1) Q1 2018
(from Q4 2017) Shaped/HTS 8 14 SpaceX
SES-16/GovSat-1(2) Q4 2017 Fully steerable 68 - SpaceX
SES-14(1) Q1 2018
(from Q4 2017) Shaped/HTS 8 12 Ariane
O3b (satellites 13-16) Q1 2018 HTS
O3b (satellites 17-20) H1 2019 HTS
SES-17 H1 2021 HTS
1) SES-12, SES-14 and SES-15 will be positioned using electric orbit raising, with entry into service some four to six months after launch date
2) Procured by LuxGovSat
3) 36 MHz equivalent
“OSD” refers to Operational Service Date
H1 2017 Results |
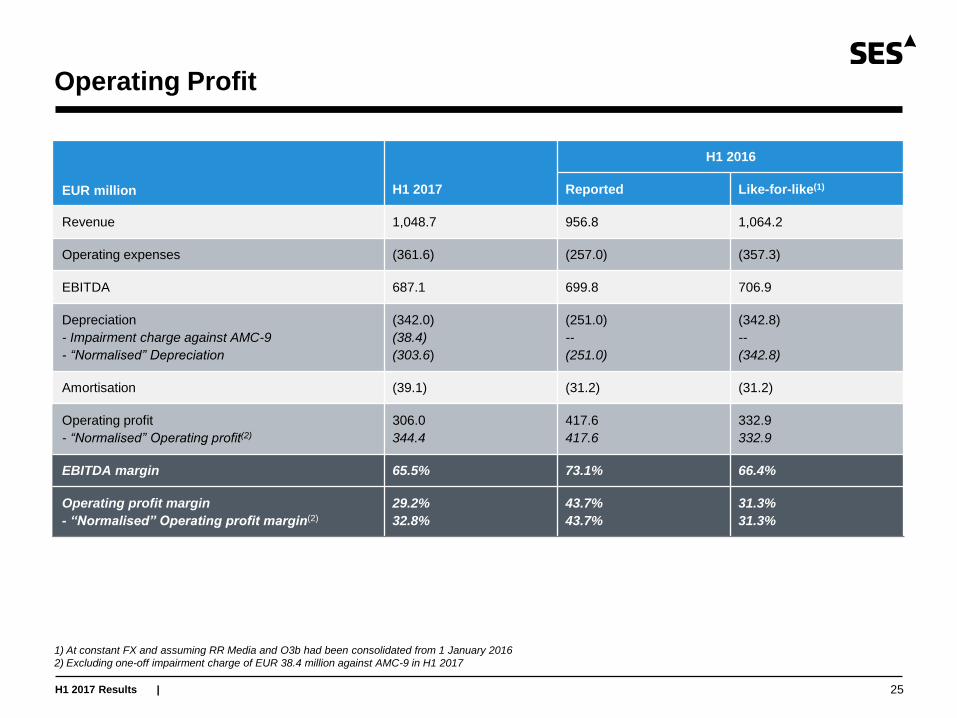
Operating Profit
25
EUR million H1 2017
H1 2016
Reported Like-for-like(1)
Revenue 1,048.7 956.8 1,064.2
Operating expenses (361.6) (257.0) (357.3)
EBITDA 687.1 699.8 706.9
Depreciation
- Impairment charge against AMC-9
- “Normalised” Depreciation
(342.0)
(38.4)
(303.6)
(251.0)
--
(251.0)
(342.8)
--
(342.8)
Amortisation (39.1) (31.2) (31.2)
Operating profit
- “Normalised” Operating profit(2)
306.0
344.4
417.6
417.6
332.9
332.9
EBITDA margin 65.5% 73.1% 66.4%
Operating profit margin
- “Normalised” Operating profit margin(2)
29.2%
32.8%
43.7%
43.7%
31.3%
31.3%
1) At constant FX and assuming RR Media and O3b had been consolidated from 1 January 2016
2) Excluding one-off impairment charge of EUR 38.4 million against AMC-9 in H1 2017

H1 2017 Results |
Disclaimer
This presentation does not, in any jurisdiction, including without limitation in the U.S., constitute or form part of, and should not be construed as,
any offer for sale of, or solicitation of any offer to buy, or any investment advice in connection with, any securities of SES, nor should it or any
part of it form the basis of, or be relied on in connection with, any contract or commitment whatsoever.
No representation or warranty, express or implied, is or will be made by SES, its directors, officers or advisors, or any other person, as to the
accuracy, completeness or fairness of the information or opinions contained in this presentation, and any reliance you place on them will be at
your sole risk. Without prejudice to the foregoing, none of SES, or its directors, officers or advisors accept any liability whatsoever for any loss
however arising, directly or indirectly, from use of this presentation or its contents or otherwise arising in connection therewith.
This presentation includes “forward-looking statements”. All statements other than statements of historical fact included in this presentation,
including without limitation those regarding SES’s financial position, business strategy, plans and objectives of management for future
operations (including development plans and objectives relating to SES products and services), are forward-looking statements. Such forward-
looking statements involve known and unknown risks, uncertainties and other important factors that could cause the actual results, performance
or achievements of SES to be materially different from future results, performance or achievements expressed or implied by such forward-
looking statements. Such forward-looking statements are based on numerous assumptions regarding SES and its subsidiaries and affiliates,
present and future business strategies, and the environment in which SES will operate in the future, and such assumptions may or may not
prove to be correct. These forward-looking statements speak only as at the date of this presentation. Forward-looking statements contained in
this presentation regarding past trends or activities should not be taken as a representation that such trends or activities will continue in the
future. SES, and its directors, officers and advisors do not undertake any obligation to update or revise any forward-looking statements, whether
as a result of new information, future events or otherwise.
26

Richard Whiteing
Investor Relations
Tel +352 710 725 261
Connect with us
![Untitled-1 [] · 2017. 1. 31. · SOLARIJ 1 minuta Paket 20 eur + eur gratis Paket 40 eur + 20 eur gratis 03 62 09 804 ali mail: 15 minutah) *oblikovanie osebnega programa na podlagi](https://static.fdocuments.in/doc/165x107/60c06f1631a5cf1eb119fd47/untitled-1-2017-1-31-solarij-1-minuta-paket-20-eur-eur-gratis-paket-40.jpg)