Half Year 2016 Results Presentation WIP mostly relates to work in progress on B737 passenger to...
24
Airwork Holdings Limited February 2016 Half Year 2016 Results Presentation
-
Upload
truongnguyet -
Category
Documents
-
view
212 -
download
0
Transcript of Half Year 2016 Results Presentation WIP mostly relates to work in progress on B737 passenger to...

Airwork Holdings Limited
February 2016
Half Year 2016 Results Presentation

IMPORTANT NOTICE
This presentation contains not only a review of operations, but also some forward looking statements
about Airwork Holdings Limited (Airwork) and the environment in which the company operates. These
forward looking statements are based on current expectations, and involve assumptions, risks and
uncertainties. Airwork’s actual results could be affected by a number of factors and accordingly could
differ materially. There can be no assurance that any result contemplated in any forward looking
statement will be realised and Airwork gives no warranty or representation as to future performance.
Media releases, management commentary, Airwork’s 2013 investment statement and other information
is available in respect of the company and these contain additional information about matters which
could cause Airwork’s performance to differ from any forward looking statements in this presentation.
Please read this presentation in the wider context of material previously published by Airwork.
The information in this presentation is in a summary form, and accordingly is not necessarily complete.
No representation or warranty is made as to the accuracy or completeness of the information contained.
A number of non-GAAP financial measures are used in this presentation due to the fact they are widely
accepted financial indicators used by investors and analysts to analyse and compare companies. You
should not consider any of these in isolation from, or as a substitute for, the information provided in the
consolidated financial statements.
All amounts are in New Zealand dollars unless otherwise stated.
2

3
CONTENTS
• Executive Summary
• Interim HY 2016 Result
o Highlights
o Financial Summary
• Interim HY 2016 Divisional Review
o Helicopter Review
o Fixed Wing Review
o Operating Cash Flows
o Capex
o Net Debt
• Strategy and Outlook
• Conclusion
Appendices

EXECUTIVE SUMMARY
4
• Airwork has delivered an improved first half result for the 2016 financial year
o Significant EBIT growth of 76% in the Fixed Wing division driven by the successful
commencement of B737-400 dry leasing contracts announced in FY15
o Helicopter division EBIT growth of 22% despite challenging market conditions in some sectors,
notably Oil & Gas
• The result highlights the benefits of Airwork’s diversified businesses, global footprint and revenue
streams
• The Directors have approved a fully imputed Interim Dividend of 9.0 cents per share
• FY16 NPAT guidance in excess of $21m
• Outlook: continue expansion of global footprint to identify and secure further growth opportunities
• The Directors would like to acknowledge the significant efforts and dedication of the Airwork team
located around the world who have delivered this result, whilst managing a significant amount of
change

INTERIM HY 2016 RESULT – FINANCIAL SUMMARY
5
1. Return on Capital Employed: EBIT / Average funds employed (shareholders’ funds plus net debt)
2. Return on Shareholders’ Funds: NPAT / Average shareholders’ funds
HY16
$’000s
FY15
$’000s
HY15
$’000sChange
Total Revenue 83,365 70,260 18.7%
EBITDA 33,897 22,439 51.1%
EBIT 18,436 11,832 55.8%
NPAT 11,607 7,885 47.2%
Return on Capital Employed 1 14.6% 14.0% 15.2% (0.6 ppt)
Return on Capital Employed (excl. Capital WIP) 17.7% 16.5% 15.9% 1.8 ppt
Return on Shareholders' Funds 2 22.3% 16.5% 17.0% 5.3 ppt
Earnings per share - basic (cps) 23.1 15.7 47.2%
Dividends (cps) 9.0 8.0 1.0

OPERATING REVENUE
6
Revenue growth reflects aircraft leasing additions across both Fixed Wing and
Helicopter businesses

7
EBIT: UNDERLYING PERFORMANCE
Underlying EBIT shows continued growth
Note: Underlying EBIT is a non GAAP measure. It is determined based on reported operating profit after depreciation, amortisation and
impairment expenses adjusted for: IPO costs in HY14.

EBIT: DIVISIONAL REVIEW
8
• Increase in Fixed Wing earnings from expansion of B737-400 dry leases in Europe
• Profitable Helicopter growth due to high yielding short term contracts offsetting reduced
flying in Oil & Gas sector; fleet redeployed to target specific opportunities
Note: Underlying EBIT is a non GAAP measure. It is determined based on reported operating profit after
depreciation, amortisation and impairment expenses adjusted for: IPO costs in HY14 (Corporate)

HELICOPTER REVIEW
9
HY16
$’000s
FY15
$’000s
HY15
$’000s
HY14
$’000s
Revenue - Engineering 24,486 26,536 21,010
Revenue - Leasing 19,556 15,656 10,292
Revenue - Total 44,042 42,192 31,302
EBITDA 16,081 13,854 9,568
EBIT 12,122 9,902 6,641
EBITDA Margin 36.5% 33.8% 32.8% 30.6%
Return on invested capital 1 23.7% 22.8% 23.3% 17.5%
Return on invested capital (excluding THL) n/a 24.9% 25.6% 19.5%
Percentage of revenue generated from new customers
• Engineering 23% 3% 2% 20%
• Leasing 2% 4% 4% 3%
Total helicopter fleet (owned and operated) 42 41 37 28
• 22% growth in Helicopter division EBIT despite a difficult market, particularly in Oil & Gas with significant
reduction in PNG flying hours compared to prior period
• Leasing revenue increased by 25% included significant short-term non-recurring leases utilising existing
assets
• Decline in Engineering external revenue reflects change of mix with increased internal support to enable
Leasing growth and slowdown from existing customers (particularly helicopter sales to the Oil & Gas
industry) netted off with significant new customer wins and workshop revenue growth
1. Return on Invested Capital: EBIT / Average Capital Employed

• Further investment in emerging Oil & Gas projects in South America
• Two helicopters redeployed during the period from PNG following slow-down in projects –
one further helicopter removed to date in H2
• Redeployment of 5 tourism aircraft to new NZ based tourism and charter operators
HELICOPTER REVIEW
10
Continued Leasing Fleet Growth and redeployment of assets

HELICOPTER REVIEW
11
• New customers signed off the back of ongoing certification expansion:
o FY14 – Europe, Africa, Canada, Asia
o FY15 – South America, South Africa
o FY16 – USA certification expected in March
• New Zealand market share expansion across leasing and maintenance activities
• Reduced revenue from European Support Contract as expected, in line with customer fleet
reduction schedule
• No decision received regarding outcome of The Helicopter Line legal action
• Capacity expansion of Ardmore Engineering facility to meet demand
o Stage 1 – new hangar; completed June 2015
o Stage 2 – overhaul capacity increase; completion delayed to April 2016
o FAA approval – expected March 2016
Continued expansion

HELICOPTER REVIEW
12
Leasing revenue by industry Engineering revenue by industry
• 11% reduction in Oil and Gas revenue share
reflects softer market conditions in that industry
• Challenges faced by Oil and Gas industry affected
the business, but were made up by increases in
other industry sectors
HY16
HY15
HY16
HY15
• 31% reduction in Oil and Gas revenue share
reflects fewer helicopter sales into industry
• Emergency and government services (including
defence) increase
• Excludes throughput increase supporting Leasing
fleet

FIXED WING REVIEW
13
• Expansion of dry leasing fleet in Europe, plus impact of leases commenced in the prior year; all
dry lease aircraft delivered
• Increased activity in New Zealand and Australia with delivery of two B737-400 freighters; four
further aircraft to be delivered in H2
• Increased Fixed Wing MRO activity with expansion of customer base
• Disposal of two surplus non-Boeing aircraft and customer disposal of one operated aircraft
HY16
$’000s
FY15
$’000s
HY15
$’000s
HY14
$’000s
Total revenue 39,279 28,007 34,475
EBITDA 21,097 12,144 14,531
EBIT 9,760 5,548 6,922
EBITDA Margin 53.7% 43.4% 42.1%
Return on invested capital 1 12.8% 11.3% 14.1% 15.7%
Return on invested capital (excl Capital WIP) 2 17.9% 15.6% 15.5% 17.3%
Fleet: number of aircraft at end of period (owned and operated)
• Boeing 737 - 400/300 18 17 9 9
• Other 7 10 10 11
• Total 25 27 19 20
Percentage change of flying hours from prior period 3 7% (5%) 4% 12%
1. Return on Invested Capital: EBIT / Average Capital Employed
2. Capital WIP mostly relates to work in progress on B737 passenger to cargo conversions
3. The change in flying hours are shown for owned and leased aircraft, excluding fixed rate leases where flying hours do not impact revenue
FIXED WING REVIEW
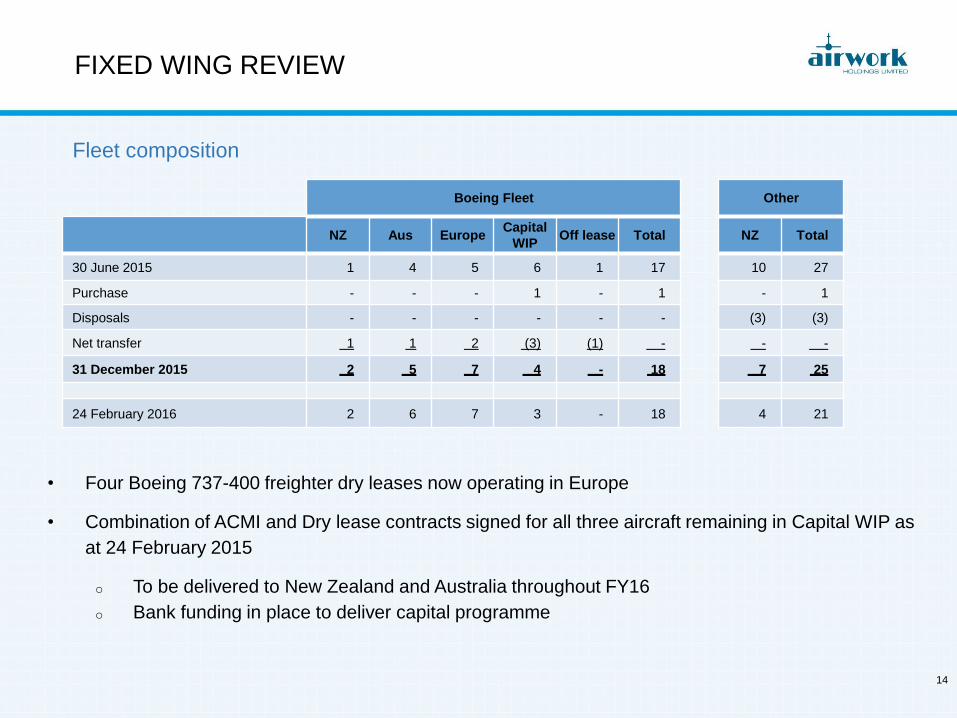
14
NZ Aus EuropeCapital
WIPOff lease Total
30 June 2015 1 4 5 6 1 17
Purchase - - - 1 - 1
Disposals - - - - - -
Net transfer 1 1 2 (3) (1) -
31 December 2015 2 5 7 4 - 18
24 February 2016 2 6 7 3 - 18
• Four Boeing 737-400 freighter dry leases now operating in Europe
• Combination of ACMI and Dry lease contracts signed for all three aircraft remaining in Capital WIP as
at 24 February 2015
o To be delivered to New Zealand and Australia throughout FY16
o Bank funding in place to deliver capital programme
Fleet composition
NZ Total
10 27
- 1
(3) (3)
- -
7 25
4 21
Boeing Fleet Other

FIXED WING REVIEW
15
• Continued exceptional operational performance: 97% On Time Performance
• Continued margin improvement through Dry Leasing and expansion of MRO activity in New Zealand
• Performance aided by:
o one B737-400 passenger aircraft positioned with European customer for short-term green time
lease, pending freighter conversion;
o addition of 5th aircraft on short-term charter work in Australia
• First B737-400 delivered for the Freightways Joint Venture and in service with Freightways and NZ Post
from December 2015; two more deliveries scheduled in H2
• Two Boeing 737-300 freighters to be redeployed once ACMI fleet makeup is confirmed
• Ceased operating NZ Post Metroliner fleet in January 2016 (3 aircraft) as part of transition to new NZ
airfreight network

OPERATING CASH FLOW ANALYSIS
HY16
$’000s
HY15
$’000s
HY14
$’000s
Reported operating cash flows 19,077 14,604 14,641
Adjust for:
• IPO costs - - 1,254
• Maintenance capex (4,884) (5,555) (6,198)
Underlying operating cash flows 14,193 9,049 9,697
• Scheduled debt amortisation (4,195) (2,188) (2,678)
Free cash flow 9,998 6,861 7,019
Strong underlying Cash Flows
• Cash flows remain strong but are affected by working capital increase of $8.7 million from 30 June
2015, including:
o Trade debtor increase of $3.7 million, reflecting revenue growth, advance billings, and
customer credit extension
o Inventory and WIP increase of $5.6 million, due to increased Helicopter Leasing and
Engineering activity and phasing of purchases for upcoming sales
o Net increase in payables and other liabilities of $0.7 million, relating to customer deposits and
prepayments for new B737-400 dry leases and supplier deferred payment arrangements16

CAPEX
17
• Total capex during HY16 ($57.0m), funded through operating cash flows and debt
• Maintenance capex HY16: Fixed Wing ($2.4m) and Helicopters ($2.4m)
• Growth capex:
o Helicopter ($3.4m): fleet growth; Ardmore facility expansion; certification development
o Fixed Wing ($48.5m): B737-400 freighter conversion programme; MRO system
implementation
o Group ($0.2m): Finance and IT systems upgrades
HY16
$’000s
HY15
$’000s
HY14
$’000s
Property, plant & equipment capex 56,687 30,383 19,247
Intangible asset capex 286 307 600
Group capital expenditure 56,973 30,690 19,847
Comprising:
Maintenance capex 4,884 5,555 6,198
Growth capex 1 52,089 25,135 13,649
Group capital expenditure 56,973 30,690 19,847
1. The Group defines growth capex as investments in new assets or product development to increase the
Group’s earning capacity, all other capex is defined as maintenance capex.

• Net debt as at 31 December 2015 was $159.7m, an increase of $41.6m since 30 June 2015 ($118.1m):
o Includes $0.5m reduction due to FX with corresponding reduction in B737 aircraft values
o Balance due to continued high Growth Capex, especially with respect to the expansion of the
Fixed Wing dry leasing fleet
• Future earnings from fleet expansion will reduce initial increase in gearing required to fund aircraft
investment
• Forecast Net Debt at 30 June 2016, following completion of B737-400 freighter conversion programme
and other capex initiatives, including Ardmore facility expansion: approx. $175m
31 Dec 15 30 Jun 15 31 Dec 14
Equity ratio 1 33.7% 37.1% 43.6%
Debt ratio 2 66.3% 62.9% 56.4%
1. Equity ratio is: Net Assets / (Total Assets less Cash)
2. Debt ratio is: (Total liabilities less Cash) / (Total Assets less Cash)
18
NET DEBT

STRATEGY AND OUTLOOK
19
H1 result ahead of expectation, which sets platform for solid full year result
Forecast FY16 NPAT in excess of $21m
Fixed Wing: completion of B737-400 freighter conversion programme
• Deliver remaining B737-400 aircraft to wet lease customers
• Assess further fleet expansion opportunities
• Redeployment of B737-300 freighter aircraft
• Continue to deliver World Class on-time performance and focus on core customer requirements
• Target continued growth opportunities in MRO business
Helicopters: continued focus on organic growth of helicopter business in a challenging market
• Engineering / maintenance capacity expansion through facility development
• Further extend certifications (FAA certification expected in year)
• Continue to partner with OEMs
• Continue to focus on markets outside of Oil and Gas (e.g. firefighting, utility, Government services)
• Progressive fleet expansion in NZ and offshore, including new and emerging markets
• Challenges faced by Oil and Gas industry may lead to a decline in growth rate in helicopter
division, however there remains potential for greater leasing opportunities through providing cost
effective solutions
Pursue new opportunities that complement existing businesses

Appendix 1: PERFORMANCE BY DIVISION
20
HY16
$’000s
HY15
$’000s
HY16
Growth
HY14
$’000s
HY15
Growth
Revenue:
Helicopters 44,042 42,192 4% 31,302 35%
Fixed Wing 39,279 28,007 40% 34,459 (19%)
Corporate 44 61 - 5 -
Total Revenue 83,365 70,260 19% 65,766 7%
EBITDA:
Helicopters 16,081 13,854 16% 9,568 45%
Fixed Wing 21,097 12,144 74% 14,531 (16%)
Corporate & Other 1 (3,281) (3,559) (8%) (3,680) (3%)
Total EBITDA 33,897 22,439 51% 20,419 10%
EBIT:
Helicopters 12,122 9,902 22% 6,641 49%
Fixed Wing 9,760 5,548 76% 6,922 (20%)
Corporate & Other 1 (3,446) (3,618) (5%) (3,707) (2%)
Total EBIT 18,436 11,832 56% 9,856 20%
1. Corporate and Other includes head office costs, group shared costs and the elimination of the results
of inter-segment trading.

Appendix 2: HELICOPTER FLEET
21
HY16 HY15 HY14
Leasing fleet
Number of helicopters at end of period:
• Owned 37 32 24
• Leased 2 3 2
Total leasing fleet 39 35 26
• Operated (not owned or leased) 3 2 2
Total helicopter fleet 42 37 28
Average number of helicopters during the period 42.2 35.7 30.2
Average revenue per helicopter equivalent ($'000s) 464 439 341
Fleet flying hours - Percentage increase / (decrease) over prior year
• Fleet Total 16% 25% (26%)
• Excluding Allway and THL 16% 40% (5%)
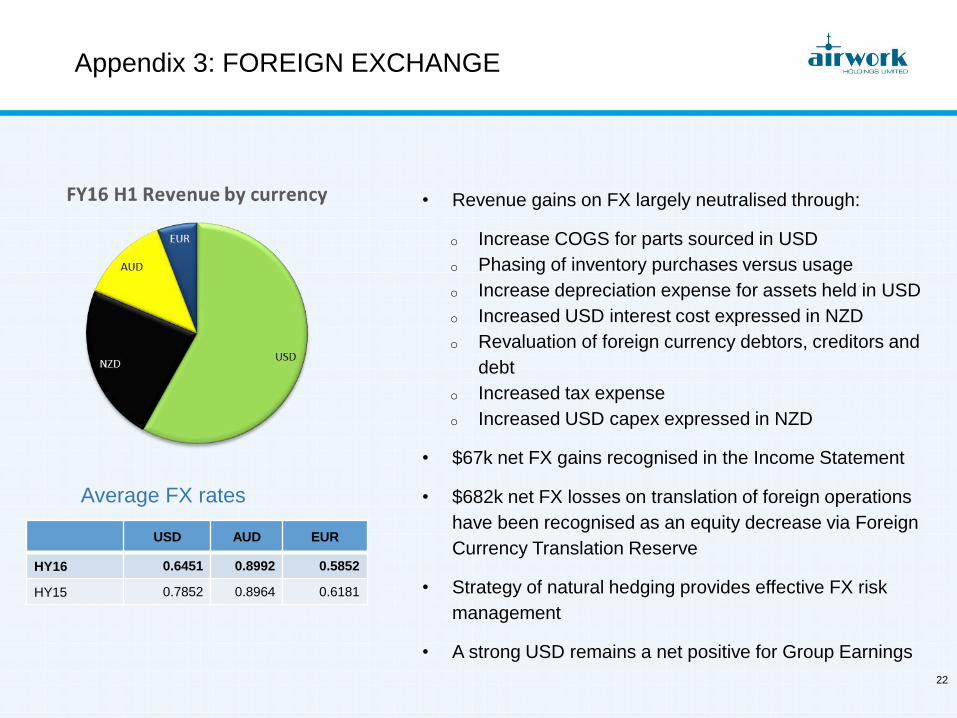
Appendix 3: FOREIGN EXCHANGE
22
USD AUD EUR
HY16 0.6451 0.8992 0.5852
HY15 0.7852 0.8964 0.6181
Average FX rates
• Revenue gains on FX largely neutralised through:
o Increase COGS for parts sourced in USD
o Phasing of inventory purchases versus usage
o Increase depreciation expense for assets held in USD
o Increased USD interest cost expressed in NZD
o Revaluation of foreign currency debtors, creditors and
debt
o Increased tax expense
o Increased USD capex expressed in NZD
• $67k net FX gains recognised in the Income Statement
• $682k net FX losses on translation of foreign operations
have been recognised as an equity decrease via Foreign
Currency Translation Reserve
• Strategy of natural hedging provides effective FX risk
management
• A strong USD remains a net positive for Group Earnings

23
Integrated Business with Highly Regulated Environment
Established Business – Long Term Contracts
Helicopter Engineering – Niche Market with High Barriers to Entry
Growth Track Record and Significant Opportunities
Experienced Board and Management
Highly Diversified – Operations, Industries and Geographies
Strong Cash Flow Business
Appendix 4: KEY ATTRIBUTES OF THE BUSINESS

Canadian Overhaul
Approval
BK117 Engine
Upgrade Program
Approval in NZ
BK117 Engine
Upgrade Program
European approval
European
maintenance approval
Capability now covers:
Europe, Canada,
South America, rest of
Asia and middle-East
BK117 Engine
Upgrade Program
USA approval
Canadian (Top 3)
Major BK117
Modifications
Acquisition of
helicopter operation
in Africa extends
engineering and
operating capability
American maintenance
Approval (FAA Part 145)
est. March 2016
European Aircraft Design
Approval (Modifications)
est. March 2016
FAA and EASA (Top 3)
Major BK117 Modifications
BK117 Glass Cockpit and
Evolution Certification
(CAANZ)
NZCAA Approval
Limited approvals
covering NZ, Australia
and parts of AsiaPac
2010 2011 2012 2013 2014 Future
Available BK117 market size
55 61 61 170 170 305
Certification and IP expansion delivers new customers
2015
BK117 Engine
Upgrade Program
Indonesian approval
South African
Maintenance
Approval
Papua New Guinea
Maintenance and
Design Approval
Cayman Islands
Maintenance
Approval (Super
Yacht aircraft in NZ)
I-Plus Structural
Repair Certification
(Airbus Helicopters)
190
Appendix 5: HELICOPTER MAINTENANCE CERTIFICATION
25