hal.archives- Web viewCitrus is the world’s most economically ... Energy dissipation and...
55
Physiological and biochemical response to photooxidative stress of the fundamental citrus species Jérémie Santini a,b , Jean Giannettini b, *, Stéphane Herbette c,d , Olivier Pailly a , Patrick Ollitrault e , François Luro a , Liliane Berti b a INRA, UR Génétique et Ecophysiologie de la Qualité des Agrumes, F-20230 San Giuliano, France b CNRS, UMR 6134 SPE, Laboratoire Biochimie & Biologie Moléculaire du Végétal, F-20250 Corte, France c INRA, UMR 547 PIAF, F-63100 Clermont-Ferrand, France d Clermont Université, Université Blaise-Pascal, UMR 547 PIAF, BP 10448, F-63000 Clermont-Ferrand, France e CIRAD, UPR 75, Avenue Agropolis, TA A-75/02, F-34398 Montpellier cedex 5, France *Corresponding author: Jean Giannettini Université de Corse Pasquale-Paoli UMR 6134 Sciences pour l’Environnement (SPE) Laboratoire de Biochimie et Biologie moléculaire Quartier Grossetti, B.P 52 F-20250 Corte, France. Tel: +33495450674; fax: +33495450154. E-mail address: [email protected] 1 1 2 3 4 5 6 8 9 10 11 12 13 14 15 16 17 18 19 20 21 22 23 24 25 26 27 28 29 30 31 32 1 2
-
Upload
truongphuc -
Category
Documents
-
view
222 -
download
4
Transcript of hal.archives- Web viewCitrus is the world’s most economically ... Energy dissipation and...

Physiological and biochemical response to photooxidative stress of the fundamental
citrus species
Jérémie Santinia,b, Jean Giannettinib,*, Stéphane Herbettec,d, Olivier Paillya, Patrick Ollitraulte,
François Luroa, Liliane Bertib
a INRA, UR Génétique et Ecophysiologie de la Qualité des Agrumes, F-20230 San Giuliano,
Franceb CNRS, UMR 6134 SPE, Laboratoire Biochimie & Biologie Moléculaire du Végétal, F-
20250 Corte, Francec INRA, UMR 547 PIAF, F-63100 Clermont-Ferrand, Franced Clermont Université, Université Blaise-Pascal, UMR 547 PIAF, BP 10448, F-63000
Clermont-Ferrand, Francee CIRAD, UPR 75, Avenue Agropolis, TA A-75/02, F-34398 Montpellier cedex 5, France
*Corresponding author: Jean GiannettiniUniversité de Corse Pasquale-PaoliUMR 6134 Sciences pour l’Environnement (SPE)Laboratoire de Biochimie et Biologie moléculaireQuartier Grossetti, B.P 52F-20250 Corte, France.Tel: +33495450674; fax: +33495450154. E-mail address: [email protected]
ABSTRACT
1
1
2
3
4
5
7
8
9
10
11
12
13
14
15
16
1718192021222324
25
26
27
28
29
30
31
32
33
34
35
36
37
12

Despite the economic importance of citrus, insights on the genetic response to stress are
scarce. The aim of the present study was to compare fundamental citrus species for their
response to photooxidative stress. The experiment was conducted under orchard conditions on
three fundamental citrus species C. medica L., C. reticulata Blanco and C. maxima (Burm.)
Merr., and on Fortunella japonica (Thunb.) Swing.. We examined their respective net
photosynthesis (Pnet), stomatal conductance (Gs) and chlorophyll fluorescence (Fv/Fm) on
sun-acclimated leaves and shade–acclimated leaves returned under natural sunlight irradiance.
To compare the respective response mechanism, we analyzed changes in oxidative status
(hydrogen peroxide (H2O2) and malondialdehyde (MDA)), reactive oxygen species (ROS)-
scavenging enzymes (superoxide dismutase (SOD), catalase, ascorbate peroxidase), recycling
enzymes (monodehydroascorbate reductase, dehydroascorbate reductase and glutathione
reductase) and antioxidant metabolites (ascorbate and glutathione). Kumquat and pummelo
exposed lower down-regulation and full recovery of photosynthetic parameters, lower
accumulation of oxidized compounds associated with greater production of reduced
glutathione (Gsh) and enhanced activity of the three ROS scavenging enzymes, especially
SOD. Citron and mandarin showed a marked decrease and incomplete recovery in
photosynthetic performance, mainly in Pnet and Fv/Fm, larger accumulation of oxidative
parameters, slighter induction of antioxidant enzymes and down-regulation of reduced
ascorbate (Asa) and Gsh synthesis. These results suggest that kumquat and pummelo have a
greater tolerance to photooxidative stress than citron and mandarin.
Keywords: Antioxidant system, Fortunella japonica, Citrus maxima, Citrus medica, Citrus
reticulata, light stress
1. Introduction
2
38
39
40
41
42
43
44
45
46
47
48
49
50
51
52
53
54
55
56
57
58
59
60
61
62
34

Citrus is the world’s most economically important fruit crop. Strictly, true citrus plants
comprise six genera: Clymenia, Eremocitrus, Microcitrus, Poncirus, Fortunella and Citrus .
Scora (1975) and Barrett and Rhodes (1976) considered Citrus medica L. (citron), C. maxima
(Burm.) Merr. (pummelo) and C. reticulata Blanco (mandarin) to be the three fundamental
species of Citrus, the other species resulting from hybridization of these true species. This
view has recently gained support from various biochemical and molecular studies (Federici et
al., 1998; Barkley et al., 2006; Fanciullino et al., 2006). Allopatric evolution has resulted in
strong genetic and also phenotypic differentiation between these Citrus taxa (Garcia-Lor et
al., 2012).
Citrus trees are continuously exposed to changes in light and temperature in their natural
environment. Global climatic warming may cause these changes to become increasingly
pronounced in both frequency and magnitude, particularly in the north Mediterranean area. In
this region, the summer season is characterized by high temperatures and dryness, whereas in
winter, day temperature is generally moderate and night temperatures often dip below 5 °C.
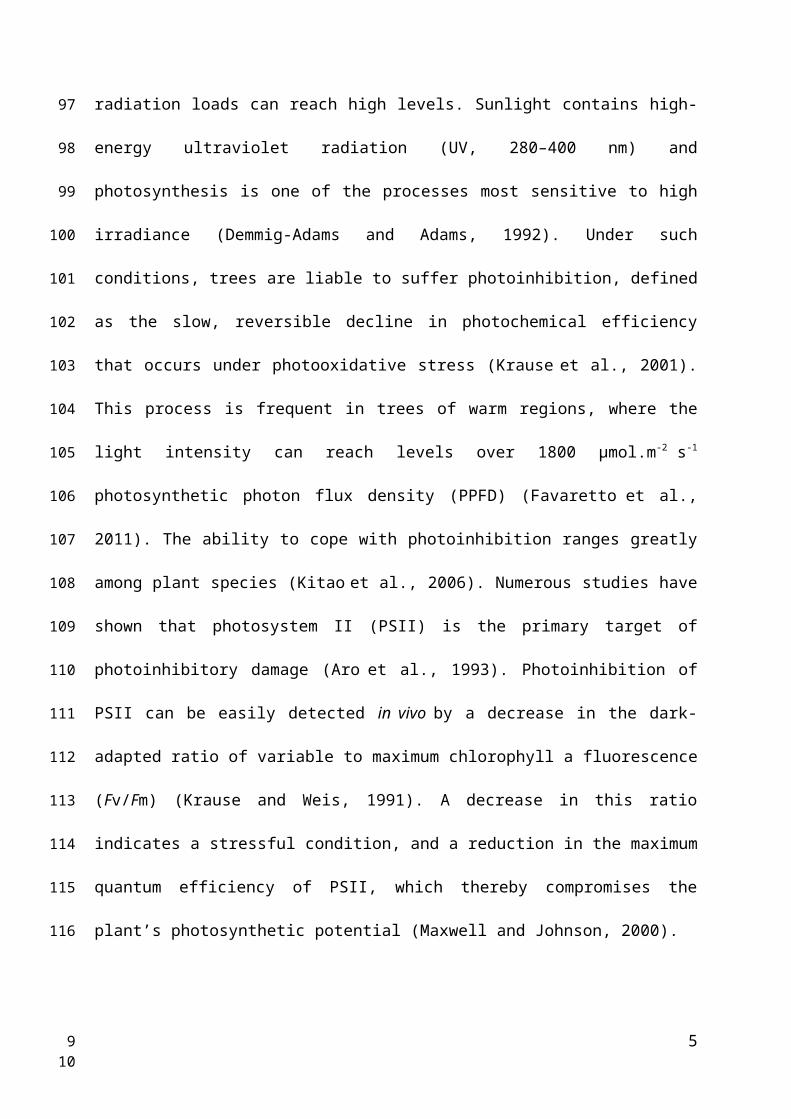
At these two periods, the radiation loads can reach high levels. Sunlight contains high-energy
ultraviolet radiation (UV, 280–400 nm) and photosynthesis is one of the processes most
sensitive to high irradiance (Demmig-Adams and Adams, 1992). Under such conditions, trees
are liable to suffer photoinhibition, defined as the slow, reversible decline in photochemical
efficiency that occurs under photooxidative stress (Krause et al., 2001). This process is
frequent in trees of warm regions, where the light intensity can reach levels over 1800
µmol.m-2 s-1 photosynthetic photon flux density (PPFD) (Favaretto et al., 2011). The ability to
cope with photoinhibition ranges greatly among plant species (Kitao et al., 2006). Numerous
studies have shown that photosystem II (PSII) is the primary target of photoinhibitory damage
(Aro et al., 1993). Photoinhibition of PSII can be easily detected in vivo by a decrease in the
3
63
64
65
66
67
68
69
70
71
72
73
74
75
76
77
78
79
80
81
82
83
84
85
86
87
56

dark-adapted ratio of variable to maximum chlorophyll a fluorescence (Fv/Fm) (Krause and
Weis, 1991). A decrease in this ratio indicates a stressful condition, and a reduction in the
maximum quantum efficiency of PSII, which thereby compromises the plant’s photosynthetic
potential (Maxwell and Johnson, 2000).
A common effect of most environmental factors is an increased production of reactive
oxygen species (ROS) in green plant cells, a situation called photooxidative stress, driven by
the light energy absorbed in excess of assimilatory requirements (Foyer et al., 1994). These
harmful ROS such as singlet oxygen (1O2), superoxide anion (O2•−), hydrogen peroxide
(H2O2), and hydroxyl radical (OH•) are involved in the mechanism of photoinhibition (Asada,
1999). The production of ROS in plant cells is enhanced by conditions that limit CO2 fixation,
such as drought, salt, heat and cold stresses, and by the combination of these conditions with
strong light (Foyer and Noctor, 2003). Because aerobic organisms, such as plants, live in a
highly oxidative environment, they have evolved efficient antioxidant systems protecting
them from the damaging effects of ROS (Asada, 1999) such as decreased protein synthesis,
damage to DNA and membrane lipids (Frohnmeyer and Staiger, 2003; Mackerness et al.,
2001). These antioxidant mechanisms employ (i) ROS-scavenging enzymes, such as
superoxide dismutase (SOD, EC 1.15.1.1), catalase (CAT, EC 1.11.1.6), and ascorbate
peroxidase (APX, 1.11.1.11), (ii) recycling enzymes of the ascorbate-glutathione cycle, such
as monodehydroascorbate reductase (MDHAR, EC 1.6.5.4), dehydroascorbate reductase
(DHAR, EC 1.8.5.1) and glutathione reductase (GR, EC 1.6.4.2), and (iii) low molecular
weight antioxidants, such as reduced ascorbic acid (Asa) and reduced glutathione (Gsh).
Some authors have reported that antioxidative systems play a major role in protecting plants
from the harmful effects of excess light energy (Foyer et al., 1994; Favaretto et al., 2011).
Thus, antioxidative systems have been found to be of paramount importance in the response
and tolerance of trees to environmental stress (Polle and Rennenberg, 1993).
4
88
89
90
91
92
93
94
95
96
97
98
99
100
101
102
103
104
105
106
107
108
109
110
111
112
78
Some authors have shown that citrus physiology is adversely affected by abiotic stresses,
such as drought (Avila et al., 2012), waterlogging (Hossain et al., 2009) and salinity (Balal et
al., 2012; Brumos et al., 2009). Currently, experiments have been mainly performed on the
most common rootstocks under the superimposition of a specific stress with strong light. For
instance, it was found that the Cleopatra mandarin was very sensitive to flooding stress and
tolerant to salt stress, whereas Carrizo citrange showed the opposite behavior (Arbona et al.,
2008; Brumos et al., 2009). Thus, a heterogeneous response to oxidative stress between
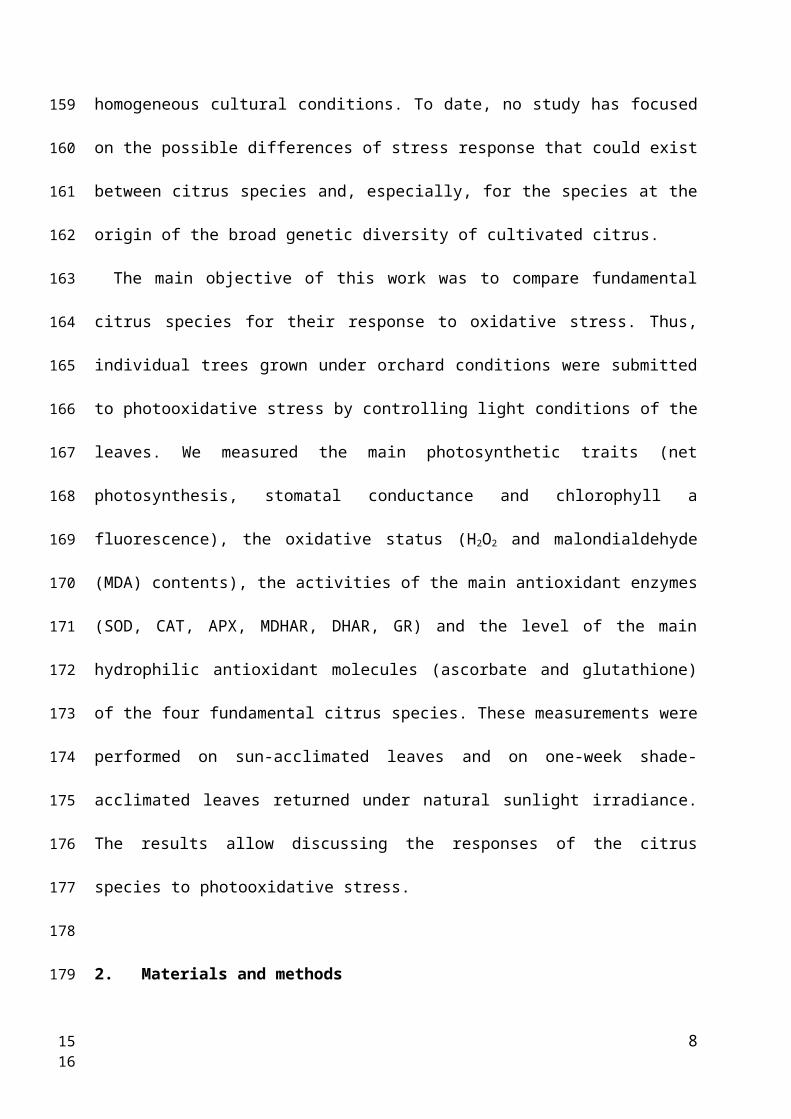
rootstocks exists under homogeneous cultural conditions. To date, no study has focused on the
possible differences of stress response that could exist between citrus species and, especially,
for the species at the origin of the broad genetic diversity of cultivated citrus.
The main objective of this work was to compare fundamental citrus species for their
response to oxidative stress. Thus, individual trees grown under orchard conditions were
submitted to photooxidative stress by controlling light conditions of the leaves. We measured
the main photosynthetic traits (net photosynthesis, stomatal conductance and chlorophyll a
fluorescence), the oxidative status (H2O2 and malondialdehyde (MDA) contents), the activities
of the main antioxidant enzymes (SOD, CAT, APX, MDHAR, DHAR, GR) and the level of
the main hydrophilic antioxidant molecules (ascorbate and glutathione) of the four
fundamental citrus species. These measurements were performed on sun-acclimated leaves
and on one-week shade-acclimated leaves returned under natural sunlight irradiance. The
results allow discussing the responses of the citrus species to photooxidative stress.
2. Materials and methods
2.1. Plant material and growth conditions
5
113
114
115
116
117
118
119
120
121
122
123
124
125
126
127
128
129
130
131
132
133
134
135
136
137
910

Experiments were carried out on leaves from 8-year-old trees with genotypes belonging to
the Citrus and Fortunella genera (Table 1) growing in the experimental orchards of the
Station de Recherches Agronomiques INRA-CIRAD of San Giuliano, Corsica, France
(42° 18′ 55′′ N, 9° 29′ 29′′ E; 51m a.s.l., under a Mediterranean climate and on soil derived
from alluvial deposits and classified as fersiallitic, pH range 6.0–6.6). The trees were
about 2.0 m high, spaced 6 × 4 m, and subjected to homogeneous growing conditions to
reduce environmental effects. Water was supplied every day on the basis of 100%
replacement of actual evapotranspiration estimated from the equation of Monteith (1965).
Fertilizers were supplied, and insects and diseases were controlled according to the
recommendations of the local Department of Agriculture.
The experiment was conducted from September 23, 2010 to October 10, 2010 on clear
days. For each of the basic true species of the Citrus genus and of the Fortunella genus (Table
1), three trees were analyzed. We isolated two independent sections on each of the three trees.
The first section did not undergo any special treatment, and served as control. On this section,
the leaves were kept uncovered throughout the experimental period to receive 100% sunlight
irradiance. The leaves of the second section were shaded using a 90% shade cloth. This shade
cloth allowed the actual transmission of 9.2% sunlight irradiance (90% shade cloth). We
checked that spectra were not modified by shading, using a Li-Cor Li-1800 spectrometer.
After one week of adaptation, the photooxidative stress was applied. The leaves were
completely uncovered and received full light. Each treatment was allocated among the three
selected trees of each genotype of the trial at three different periods (Fig. 1). At each period,
one tree of each genotype was studied. In this way, the variability associated with different
days of measurement was included in the intraspecific variability. On each section,
physiological measurements and samplings were performed 0, 3, 6, 24 and 48 hours after the
end of the shading period. The same leaves were used for physiological parameter
6
138
139
140
141
142
143
144
145
146
147
148
149
150
151
152
153
154
155
156
157
158
159
160
161
162
1112

measurements. On each tree, three fully expanded leaves from spring of the current year’s
growth were selected. Thus nine measurements per genotype were made for each genotype
and for each time. For biochemical assays, on each tree, two samples of 15 fully expanded
leaves from the current year’s growth were collected and immediately frozen in liquid
nitrogen and stored at −80 °C. Thus six samples of 15 leaves were separately analyzed for
each genotype and for each time point of the kinetics. Before analysis, each leaf sample was
ground to a fine powder in liquid nitrogen using a pre-chilled pestle and mortar.
Temperatures and daily total radiation were recorded throughout the experiment (Fig. 1).
2.2. Gas exchange measurements
Measurements of net photosynthetic rate (Pnet) and stomatal conductance (Gs) were made
with a portable open gas exchange system (GFS 3000, WALZ, Effeltrich, Germany). Air flow
rate was 750 µmol.s-1. In a gas exchange chamber, photosynthetic photon flux density (PPFD)
was controlled using a LED radiation source, and was fixed at a PPFD of 1400 µmol.m-2.s-1.
The use of this LED source ensured a constant, uniform light across all measurements.
Carbon dioxide concentration was set at 380 µmol.mol-1.
2.3. Chlorophyll a fluorescence measurements
In vivo chlorophyll fluorescence was measured using a portable chlorophyll fluorometer
(Hansatech, Norfolk, England) on sunny days on the same leaves as previously used for gas
exchange measurements,. Intact leaves were dark-adapted with leaf clips for 20 min to allow
relaxation of fluorescence quenching associated with thylakoid membrane energization
(Krause et al., 1983). Minimal fluorescence (Fo) and maximal fluorescence (Fm) were
7
163
164
165
166
167
168
169
170
171
172
173
174
175
176
177
178
179
180
181
182
183
184
185
186
187
1314
obtained by imposing a 1 s saturating flash to reduce all the PSII reaction centers. The
maximum potential photochemical efficiency of PSII was expressed as the ratio Fv/Fm (=
(Fm − Fo)/Fm). The degree of photoinhibition was evaluated by the reduction in the value of
Fv/Fm.
2.4. Measurement of H2O2 and MDA levels
H2O2 levels were measured following the protocol described by Zhou et al. (2006). For
extraction, 200 mg of frozen leaf powder was homogenized in 3 mL of trichloroacetic acid
(TCA) 5% (w:v) containing 60 mg of activated charcoal. The mixture was then centrifuged at
5000 g for 20 min at 4 °C.
The MDA concentration of leaves was determined using a thiobarbituric acid (TBA)
reaction described by Hodges et al. (1999). For extraction, 100 mg of frozen leaf powder was
homogenized with inert sand in 2.5 mL of 80% ethanol (v/v), followed by centrifugation at
3000 g for 10 min at 4 °C.
All the measurements were performed using a V-630 spectrophotometer (Jasco Inc.,
Tokyo, Japan).
2.5. Assay of antioxidant metabolites
Total ascorbate (tAsa) and reduced ascorbate (Asa) contents were measured according to
the method of Gillespie and Ainsworth (2007). For extraction, 40 mg of frozen leaf powder
was homogenized in 2.0 mL of a 6% (w/v) TCA solution and centrifuged at 13,000 g for
5 min at 4 °C. Oxidized ascorbate (DHA) was calculated by subtracting Asa concentration
from the tAsa concentration.
8
188
189
190
191
192
193
194
195
196
197
198
199
200
201
202
203
204
205
206
207
208
209
210
211
212
1516

Total glutathione (tGsh) and oxidized glutathione (GssG) contents were measured
according to the DTNB-GR recycling procedure of Rahman et al. (2006). For extraction,
50 mg of frozen leaf powder was homogenized in 2.0 mL of mixed buffer (100 mM
potassium phosphate, pH 7.5, 5 mM EDTA, 0.1% (v:v) Triton X-100 and 23 mM
sulfosalicylic acid) and centrifuged at 8000 g for 10 min at 4 °C. Gsh concentration was
calculated by subtracting GssG concentration from the tGsh concentration.
All measurements were performed using a V-630 spectrophotometer (Jasco Inc., Tokyo,
Japan).
2.6. Assay of antioxidant enzyme activities
For all enzymatic assays, frozen leaf powder was homogenized in extraction medium
(100 mM potassium phosphate buffer, pH 7.5, containing 0.1% (v/v) TritonX-100
and 1% (w/v) polyvinylpyrolidone (PVP)) using 27 mg FW per mL of buffer. The
homogenate was then centrifuged at 13,000 g for 30 min at 4 °C. The supernatant was used
for the protein and enzyme analysis (except for SOD, where the extract was diluted 20-fold).
Protein concentration was determined by the method of Bradford (1976). All kinetic
measurements were made using a V-630 spectrophotometer (Jasco Inc., Tokyo, Japan).
Superoxide dismutase (SOD, EC 1.15.1.1) activity was measured using the method of
Oberley and Spitz (1984), modified: 100 μL of diluted extract was added to a solution
containing 1 mM DETAPAC buffer (pH 7.8), 1.25 units of catalase, 0.07 mM NBT, 0.2 mM
xanthine and 0.010 units of xanthine oxidase in a total volume of 1.0 mL. One unit of SOD
was defined as the amount of enzyme causing 50% inhibition in the rate of NBT reduction at
560 nm, at 25 °C.
9
213
214
215
216
217
218
219
220
221
222
223
224
225
226
227
228
229
230
231
232
233
234
235
236
1718

Catalase (CAT, EC 1.11.1.6) activity was measured according to the method of Aebi
(1984). The reaction mixture (1.1 mL) contained 100 μL of crude enzyme extract, 37.8 mM
sodium phosphate buffer (pH 7.0) and 4.4 mM H2O2. The decrease in absorbance was
measured at 240 nm (ε = 39.4 mM-1.cm-1). One unit of CAT was expressed as 1 μmol H2O2
degraded per min at 25 °C.
Ascorbate peroxidase (APX, EC 1.11.1.11) activity was determined according to a
modified method described by Asada (1984). The standard reaction mixture (1.0 mL)
contained 0.17 mM ascorbate, and 33 μL of crude enzyme extract in a 60.3 mM potassium
phosphate buffer (pH 7.0). The reaction was triggered when 4.95 mM H2O2 was added. The
rate of ascorbate oxidation was evaluated at 290 nm for 3 min (ε = 2.8 mM-1.cm-1). One unit of
APX was expressed as the oxidation of 1 μmol ascorbate per min at 25 °C.
Monodehydroascorbate reductase (MDHAR, EC 1.6.5.4) activity was established by
monitoring the MDHA-dependent oxidation of NADH according to the slightly modified
method of Drew et al. (2007). 100 μL of crude enzyme extract was added to a solution
containing 9.7 mM potassium phosphate, 0.125% Triton X100 (pH 8), 2.5 mM ascorbate,
0.128 units of ascorbate oxidase in a total volume of 1.0 mL. The reaction was started by
adding 0.2 mM NADH. The decrease in absorbance was measured at 340 nm (ε = 6.3 mM-
1.cm-1). One MDHAR unit was defined as the amount of enzyme required to oxidize 1 μmol
NADH per min at 340 nm at 25 °C.
Dehydroascorbate reductase (DHAR, EC 1.8.5.1) activity was assayed by measuring the
rate of appearance of ascorbate measured at 265 nm (ε = 14.5 mM-1.cm-1) (Asada, 1984). The
standard reaction mixture (1.0 mL) contained 41 mM potassium phosphate buffer (pH 6.5),
5 mM Gsh, 0.11 mM EDTA, and 75 μL of crude enzyme extract, with 0.5 mM DHA added to
initiate the reaction. One DHAR unit was defined as the amount of enzyme that allowed the
formation of 1 μmol ascorbate per min at 25 °C.
10
237
238
239
240
241
242
243
244
245
246
247
248
249
250
251
252
253
254
255
256
257
258
259
260
261
1920

Glutathione reductase (GR, EC 1.6.4.2) activity was measured according to the modified
method of Smith et al. (1988). The standard reaction mixture (1.0 mL) contained 50 mM
potassium phosphate buffer (pH 7.0), 1 mM GssG, 0.75 mM DTNB and 100 μL of crude
enzyme extract. 0.1 mM NADPH was added to initiate the reaction. The increase in
absorbance due to the formation of TNB was measured at 412 nm (ε = 14.15 mM-1.cm-1). One
GR unit was defined as the amount of enzyme that allowed the formation of 1 μmol TNB per
min at 25 °C.
2.7. Statistical analyses
The experimental designs were split-plot, with genotype as the main plot and time after
exposure of the shaded leaves to light as the subplot. Data were analyzed using two-way
ANOVA, and comparisons between means were made with the least significant difference
(LSD) test at P < 0.05 using R statistical software (http://www.R-project.org). Data were
compared between genotypes for each parameter, at each point of the time course. In addition,
for each genotype, the data obtained along the time course were compared. The mean values
and standard errors of the mean values are shown in the figures.
3. Results
In order to minimize the effects of changes in environmental conditions during the
experiment, the results were expressed as relative data. Thus, only the effect of the light
treatment was taken into account.
11
262
263
264
265
266
267
268
269
270
271
272
273
274
275
276
277
278
279
280
281
282
283
284
285
2122

3.1. Effect of light stress on net photosynthesis (Pnet), stomatal conductance (Gs) and
maximum photochemical efficiency of PSII (Fv/Fm)
In all the genotypes, Pnet and Gs values were lower under the shade treatment (ratio values
below 1 at 0 h) (Figs. 2a, b). Leaves acclimated to shade conditions showed a reduction in
Pnet of ~30%, ~50%, ~50% and ~60% in MK, WLM, CC and PP, respectively, compared to
control leaves acclimated to full light conditions.
Likewise, the decrease in Gs (Fig. 2b) was very marked in CC (~−52%), moderate in
WLM and PP (~−40%) and much lower in MK (~−30%). At the end of the time course, Pnet
was totally recovered in PP and MK (ratio values close to 1), whereas in CC and WLM, this
recovery was incomplete (for Pnet: ~80% of the control value). Gs was completely recovered
in all genotypes after 48 h.
Under shade conditions, all the genotypes displayed Fv/Fm values equivalent to the
control (ratio values close to 1) (Fig. 2c). For CC and WLM, the Fv/Fm value had dropped
sharply at 3 h (~69% and ~80% of the initial value, respectively), whereas it remained
unchanged for PP and MK. After 48 h of exposure to full light, the Fv/Fm recovery was
complete for PP and MK (ratio values close to 1) compared with CC and WLM (only ~85%
of the control value).
3.2. Effect of light stress on the oxidative status
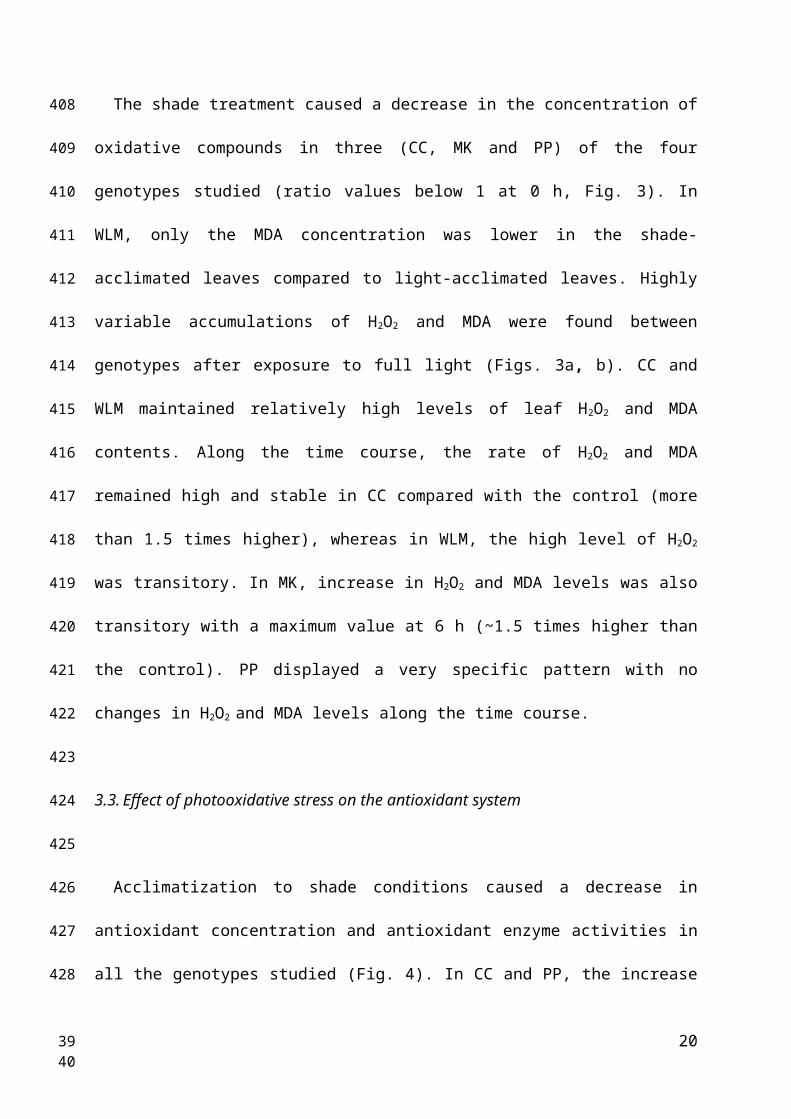
The shade treatment caused a decrease in the concentration of oxidative compounds in
three (CC, MK and PP) of the four genotypes studied (ratio values below 1 at 0 h, Fig. 3). In
WLM, only the MDA concentration was lower in the shade-acclimated leaves compared to
light-acclimated leaves. Highly variable accumulations of H2O2 and MDA were found
12
286
287
288
289
290
291
292
293
294
295
296
297
298
299
300
301
302
303
304
305
306
307
308
309
310
2324

between genotypes after exposure to full light (Figs. 3a, b). CC and WLM maintained
relatively high levels of leaf H2O2 and MDA contents. Along the time course, the rate of H2O2
and MDA remained high and stable in CC compared with the control (more than 1.5 times
higher), whereas in WLM, the high level of H2O2 was transitory. In MK, increase in H2O2 and
MDA levels was also transitory with a maximum value at 6 h (~1.5 times higher than the
control). PP displayed a very specific pattern with no changes in H2O2 and MDA levels along
the time course.
3.3. Effect of photooxidative stress on the antioxidant system
Acclimatization to shade conditions caused a decrease in antioxidant concentration and
antioxidant enzyme activities in all the genotypes studied (Fig. 4). In CC and PP, the increase
in the total ascorbate (tAsa) concentration was due more to a rise in the concentration of the
oxidized form (DHA) than in that of the reduced form (Asa). Conversely, in MK, the reduced
form appeared more markedly improved than WLM, in which the variations were equivalent
between the different forms. MK and WLM were the only genotypes to increase leaf redox
Asa/DHA ratio during the time course compared with control (~1.3 times higher at 24 h).
These increases occurred earlier in MK (from 3 h) and later in WLM (from 24 h). By contrast,
for CC and PP, these values remained unchanged along the time course, and were
approximately equal to control.
For the glutathione concentration, GssG was the most significantly increased in CC (~3.5
times higher at 48 h compared with control) and WLM (~2.5 times higher at 6 h compared
with control), whereas in MK and PP little difference was observed (Fig. 5). Conversely, MK
and PP showed significantly higher increases in tGsh from 6 h (~2 times higher for PP and
~1.5 times higher for MK compared with control), caused essentially by a higher incremental
13
311
312
313
314
315
316
317
318
319
320
321
322
323
324
325
326
327
328
329
330
331
332
333
334
335
2526

Gsh concentration (~2 times higher from 6 h compared with control) than in GssG
concentration, which remained very low. Throughout the experiment, a significant increase in
Gsh/GssG compared with the control was observed in response to photooxidative stress in
MK (~2.1-fold increase at 6 h) and PP (~2-fold increase at 24 h). By contrast, CC and WLM
displayed a very marked decrease in the ratio values compared with the control (~−84% and
~−77% at 3 h, respectively), and these values continued to decrease in CC to 48 h, but
remained essentially unchanged along the time course in WLM.
We analyzed the activities of various enzymes acting as ROS scavengers, i.e. SOD, CAT
and APX, or ensuring the supply/regeneration of primary antioxidants, i.e. MDHAR, DHAR
and GR (Fig. 6). For all the genotypes, SOD activity increased rapidly after 3 h of exposure to
photooxidative stress and more intensively in CC, MK and PP. A decline was observed in CC
and WLM at 24 h to reach values equivalent to the control (ratio values close to 1). By
contrast, in MK and PP, SOD remained very active at 48 h (~1.5 times and ~1.3 times higher
than the control, respectively). CC was the only genotype studied with a specific CAT pattern.
From 3 h, CAT activity increased significantly compared with 0 h, but remained depressed
relative to control in the light section (ratio values below 1). In MK and PP, a peak of activity
was observed at 24 h (~1.6 and ~2.2 times higher than control, respectively), whereas this
peak was present at 3 h in WLM, and was followed by a significant loss of activity. Overall,
APX activity was rapidly increased, with a peak at 3 h in all the genotypes. At the end of the
kinetics, the activity became equivalent to control (ratio values close to 1) in MK and PP
whereas in CC and WLM its activity was blocked (ratio values below 1). MDHAR was the
antioxidant enzyme whose activity was the most strongly increased. We observed an early
peak of activity from 3 h in all the genotypes (~3 times higher than control), followed by a
slow decrease up to 48 h except for WLM, where the decrease was very marked from 6 h.
Considering DHAR activity, the increase was very rapid and equivalent in all the genotypes
14
336
337
338
339
340
341
342
343
344
345
346
347
348
349
350
351
352
353
354
355
356
357
358
359
360
2728

(more than 2-fold increase at 3 h compared with control) and was followed by a decline.
However, MK was the only genotype that maintained a very high activity after 3 h (~2.4
times higher than the control at 24 h) compared with other genotypes, in which the decrease
was very marked. Like the two previous regenerating enzymes, rapid activation of GR was
observed at 3 h, with a peak of activity similar in all the genotypes (~1.6 times higher than
control), except for WLM, where it took place later, at 24 h. MK maintained its activity more
effectively than the other genotypes at the beginning of the time course.
4. Discussion
Currently, most of the citrus species cultivated for the fresh fruit consumption or juice
processing are secondary species. These species are the result of hybridization between
fundamental species. The first step in understanding and improving their response to
environmental challenges requires better characterization of the physiological and
biochemical mechanisms that govern stress tolerance of basic species. Thus, this study
compares four fundamental citrus species for their response to photooxidative stress. In the
past, similar experiments were used to induce photooxidative stress in many plants including
trees (Gonzalez-Rodriguez et al., 2001; Jiao and Li, 2001). Our results clearly show that the
photosynthetic response to photooxidative stress differ depending on the species and that it
could be related to dissimilarities in the oxidative status.
4.1. Differences in the sensitivity to photooxidative stress between fundamental citrus species
To date no relationship between taxonomic affiliations and ability to tolerate
photooxidative stress has ever been evidenced. The biochemical and physiological parameters
15
361
362
363
364
365
366
367
368
369
370
371
372
373
374
375
376
377
378
379
380
381
382
383
384
385
2930

studied enabled us to highlight the contrasting strategies implemented by ancestral genotypes
of citrus to cope with photooxidative stress. When plants are exposed to high irradiation, the
stomata normally close to prevent water loss, resulting in a decrease in the intercellular CO2
concentration and a depression of photosynthesis (Favaretto et al., 2011). Although Pnet
followed the same pattern as Gs in all the genotypes up to 24 h, light stress-induced changes
in photosynthesis were primarily caused by non-stomatal factors, as they were accompanied
by similar CO2 intercellular concentrations (data not shown), as previously shown in ‘Xuegan’
orange (Citrus sinensis) or in ‘Sour’ pummelo (Citrus grandis) during boron or magnesium
deficiency (Han et al., 2009; Yang et al., 2012). Our results also show that whereas Gs
recovered 48 hours after exposure to full light in all the genotypes, Pnet did not, in either CC
or WLM. This suggests that factors additional to stomatal closure must limit photosynthetic
activity in the latter. Arbona et al. (2009) demonstrated that Carrizo citrange, a flooding-
tolerant rootstock, had a better Pnet and Gs recovery after subsequent drainage, unlike
Cleopatra mandarin, a flooding-sensitive rootstock, in which Gs recovered, but Pnet did not.
We measured photoinhibition and oxidative damage to investigate potential mechanisms
for tolerance to photooxidative stress. PSII maximum quantum efficiency (Fv/Fm) was the
best indicator for photoinhibition (Maxwell and Johnson, 2000). Photoinhibition can be
considered as a photoprotective process only when decreases in Fv/Fm are slight (Adams et
al., 2006). We found that Fv/Fm decreased in all the genotypes during the first hours of
photooxidative stress, indicating compromised PSII efficiency in utilizing incident light (Jung
et al., 1998). In MK and PP, the less marked decrease in the Fv/Fm value suggested better
protection of PSII, whereas the greatest and fastest down-regulation of photochemical
activities from 3 h observed in CC and WLM could reflect photodamage to PSII (Genty et al.,
1989). In addition, the incomplete recovery after 48 h of treatment in CC and WLM could be
attributable to an increased proportion of closed, reversibly inactivated or destroyed PSII
16
386
387
388
389
390
391
392
393
394
395
396
397
398
399
400
401
402
403
404
405
406
407
408
409
410
3132

reaction centers, probably caused by enhanced ROS accumulation (Foyer and Noctor, 2000).
These results were confirmed by the greatest increase of Fo in CC and WLM compared to
MK and PP (data not shown). An increase in Fo is considered to be the characteristic of
inhibition of the acceptor side of PSII (Setlik et al., 1990) and is interpretable in terms of
photodamages (Wingler et al., 2004). Previous studies showed that PSII, but not PSI, was a
target during high temperature stress in Satsuma mandarin (Citrus unshiu) and Navel orange
(Citrus sinensis) (Guo et al., 2006). Genotype differences in stress sensitivity was further
demonstrated by parameters that estimate oxidative stress. Oxidative damage is caused by
increased production of ROS. Among the most abundant ROS, H2O2 produced in peroxisomes
and chloroplasts might diffuse to the cytosol, where it reacts with transition metal ions (Fe2+)
during the Fenton reaction, yielding hydroxyl radical (OH•), considered as the main cell-
damaging product responsible for lipid peroxidation (Foyer et al., 1994). Considering MDA
as an important indicator of lipid peroxidation, the concomitant and significant accumulation
of H2O2 and MDA in CC and WLM indicated that these two genotypes suffered a higher
oxidative pressure than MK and PP. These results were consistent with their probably greater
sensitivity and vulnerability to the light stress discussed above. The occurrence of an H2O2
and MDA burst had previously been observed in flooding-sensitive Cleopatra mandarin, or in
a chilling-sensitive rice genotype IR50, whereas smaller amounts of these two compounds had
been highlighted in flooding-tolerant Carrizo citrange, or chilling-tolerant rice genotype
L2825CA (Arbona et al., 2008; Bonnecarrere et al., 2011). In response to photooxidative
stress, CC also exhibited high amounts of DHA and GssG, the oxidized forms of ascorbate
and glutathione, implying that the cells had undergone greater oxidative pressure. Whereas PP
and WLM displayed different patterns with a large amount of DHA in the former and GssG in
the latter, MK did not accumulate these two compounds, suggesting less susceptibility to
oxidative pressure than CC. This agrees with previous reports on waterlogging stress (Arbona
17
411
412
413
414
415
416
417
418
419
420
421
422
423
424
425
426
427
428
429
430
431
432
433
434
435
3334

et al., 2008), in which the most sensitive genotype, Cleopatra mandarin, showed higher DHA
and GssG increments than the most tolerant one, Carrizo citrange. It also confirmed results
obtained on magnesium-deficient leaves of ‘Xuegan’ orange (Citrus sinensis), in which the
concentration of DHA and GssG were strongly increased (Yang et al., 2012) compared with
control.
Based on the whole results, we propose the following classification of the fundamental citrus
species according to their degree of tolerance to photooxidative : Citrus medica L. (CC) <
Citrus deliciosa Ten. (WLM) < Fortunella japonica (Thunb.) Swingle (MK) < Citrus maxima
(Burm.) Merr. (PP). MK and PP proved to be more tolerant (i.e. smaller decline and complete
recovery of photosynthetic parameters, and lower accumulation of indicators of the cell
oxidation state) in comparison to CC and WLM (i.e. greater decrease and incomplete recovery
of photosynthetic parameters and higher accumulation of oxidative compounds).
4.2. Could Antioxidant system explain the differences of response to photooxidative stress
between citrus species ?
The antioxidant system is fundamentally important in protecting the photosynthetic
apparatus, and it was assumed that higher antioxidant protection would be needed to
compensate for higher light-mediated oxidative stress (Hansen et al., 2002). Various studies
have highlighted the importance of antioxidant in tolerance to stress. Here, the complexity of
the antioxidant system regulation is highlighted by the number of antioxidant components and
genotypes analysed. Such a complexity has already been observed (Mai et al., 2010).
However, general trends and specific behaviors were observed between tolerant and sensitive
genotypes.
18
436
437
438
439
440
441
442
443
444
445
446
447
448
449
450
451
452
453
454
455
456
457
458
459
460
3536

The more tolerant genotypes, PP and MK, limited the oxidative stress by a fast and great
increase in the activities of the three main ROS-scavenging enzymes and the antioxidant
molecules concentration. SOD directly dismutates O2•− into H2O2. H2O2 produced during the
SOD reaction can then be metabolized to oxygen and water by CAT in peroxisomes or
exclusively by APX in the chloroplasts (Foyer et al., 1994; Foyer and Noctor, 2000). Yabuta
et al. (2002) found transgenic plants over-expressing SOD and APX to be more tolerant than
wild-type to a combination of temperature and strong light. Consequently, the higher
induction of SOD and CAT, and the maintained activity of APX at 48 h, might account for the
lower accumulation of H2O2 and MDA previously observed. Arbona et al. (2008) have
already observed a marked increase in the activity of these three enzymes in the flooding-
tolerant genotype Carrizo citrange, supporting a synergistic action in tolerant genotypes. In
our results, the high production of Gsh and the improvement of the Gsh/GssG ratios
confirmed that glutathione played a crucial role in the protection of tolerant genotype from
photooxidative stress as indicated by Arbona et al. (2008). Generally, precise metabolic
tuning of GR allows the cell to maintain the favorable Gsh/GssG ratio for cellular redox
regulation. The Gsh/GssG ratio can also be improved by an increased synthesis of Gsh
(Queval et al., 2007). Equivalent results were found in citrumelo CPB4475 (Citrus paradisi L.
Macf. × Poncirus trifoliata L. Raf.) during waterlogging stress (Hossain et al., 2009).
Interestingly, despite the marked increase in MDHAR activity, diminution of DHAR activity
along the time course was accompanied by no change in the Asa/DHA ratio in PP.
Conversely, the significant rise in MDHAR and DHAR activities along the time course were
coupled with a consequent increase in the ratio Asa/DHA in MK. This suggests that a
collaborative action between these two enzymes was needed to regulate the redox state of
ascorbate. These results agree with previous studies showing that DHAR is especially
19
461
462
463
464
465
466
467
468
469
470
471
472
473
474
475
476
477
478
479
480
481
482
483
484
3738
important during stress response and adaptation to regulate ascorbate levels (Chen et al.,
2003; Mai et al., 2010).
The two sensitive genotypes CC and WLM showed sharply contrasting behaviors
compared with the tolerant ones. The slight increases in SOD and APX activity could
probably explain the very high accumulation of H2O2 and MDA. These results are consistent
with their previously observed greater sensitivity. Some authors had already observed a slight
increase in these two enzymes in Hevea chilling-sensitive clones (Mai et al., 2010) or even a
depression in the flooding-sensitive rootstock, Cleopatra Mandarin (Arbona et al., 2008). CC
presented the peculiarity of significantly inactivating CAT compared with WLM. Favaretto et
al. (2011) and Yang et al. (2012) also respectively reported a decline in CAT activity in
pioneer tree species and in magnesium-deficient leaves of ‘Sour’ pummelo (Citrus grandis),
probably because this enzyme is light-sensitive and suffers from photoinactivation caused by
oxidative damage initiated via direct absorption of light by the heme moieties of the enzyme
itself (Shang and Feierabend, 1999). It was also postulated that inactivation of CAT could
also be mediated by photo-oxidative events initiated through light absorption by chlorophyll
(Feierabend and Engel, 1986). Earlier induction of CAT and APX in WLM could explain why
this genotype tended to decrease the accumulation of H2O2 from 6 h compared with CC, in
which these two enzymes were completely inactivated from 6 h. The significant decrease in
Gsh/GssG and Asa/DHA ratios suggested that the increased activity of the recycling enzyme
was insufficient to produce enough glutathione/ascorbate to regulate the redox status, and that
no new synthesis was occurring as previously reported by Yang et al. (2012) in citrus
magnesium-deficient leaves or by Arbona et al. (2008) in the flooding-sensitive rootstock
Cleopatra mandarin.
5. Conclusions
20
485
486
487
488
489
490
491
492
493
494
495
496
497
498
499
500
501
502
503
504
505
506
507
508
509
3940

Each ancestral species of citrus had a physiological and biochemical response to
photooxidative stress that was specific. Based on the whole results, several conclusions may
be drawn: (i) There are different levels of sensitivity to photooxidative stress between
ancestral citrus species, (ii) Fv/Fm appears as a good parameter to screen citrus species for
their sensitivity to photooxidative stress, (iii) a coordinated action between the three main
ROS-scavenging enzymes seems necessary to limit the harmful effects of photooxidative
stress in tolerant genotypes, (iv) glutathione appears as a key compound in stress tolerance.
The present work performed on fundamental citrus species may serve as a reference to
investigate the genetic response of citrus species to environmental stresses, especially in
screening programs aimed to maintain fruit quality and productivity under adverse conditions
like chilling stress.
Acknowledgments
We thank the Collectivité Territoriale de Corse (CTC) for the financial support of this
study. We are grateful to Anne-Laure Fanciullino and Isabelle Poggi for their assistance in
leaf harvesting, and to Jérôme Barbaggio and Isabelle Tur for technical assistance in the
grinding of leaves.
References
Aebi, H., 1984. Catalase in vitro. Methods Enzymol. 105, 121-126.Adams, W.W., Zarter, C.R., Mueh, K.E., Amiard, V.E., Demmig-Adams, B., 2006. Energy
dissipation and photoinhibition: a continuum of photoprotection, In: Demmig-Adams, B., Adams, W.W., Mattoo, A.K. (Eds.), Photoprotection, photoinhibition, gene regulation and environment. Springer Netherlands, pp. 49-64.
Arbona, V., Hossain, Z., Lopez-Climent, M.F., Perez-Clemente, R.M., Gomez-Cadenas, A., 2008. Antioxidant enzymatic activity is linked to waterlogging stress tolerance in citrus. Physiol. Plant. 132, 452-466.
21
510
511
512
513
514
515
516
517
518
519
520
521
522
523
524
525
526
527
528
529
530531532533534535536537538
4142

Arbona, V., Lopez-Climent, M.F., Perez-Clemente, R.M., Gomez-Cadenas, A., 2009. Maintenance of a high photosynthetic performance is linked to flooding tolerance in citrus. Environ. Exp. Bot. 66, 135-142.
Aro, E.M., Virgin, I., Andersson, B., 1993. Photoinhibition of photosystem II. Inactivation, protein damage and turnover. Biochim. Biophys. Acta. 1143, 113-134.
Asada, K., 1984. Chloroplasts - Formation of active oxygen species. Methods Enzymol. 105, 422-429.
Asada, K., 1999. The water-water cycle in chloroplasts: Scavenging of active oxygens and dissipation of excess photons. Annu. Rev. Plant Physiol. Plant Mol. Biol. 50, 601-639.
Avila, C., Guardiola, J.L., Nebauer, S.G., 2012. Response of the photosynthetic apparatus to a flowering-inductive period by water stress in Citrus. Trees 26, 833-840.
Balal, R.M., Khan, M.M., Shahid, M.A., Mattson, N.S., Abbas, T., Ashfaq, M., Garcia-Sanchez, F., Ghazanfer, U., Gimeno, V., Iqbal, Z., 2012. Comparative Studies on the Physiobiochemical, Enzymatic, and Ionic Modifications in Salt-tolerant and Salt-sensitive Citrus Rootstocks under NaCl Stress. J. Am. Soc. Hortic. Sci. 137, 86-95.
Barkley, N.A., Roose, M.L., Krueger, R.R., Federici, C.T., 2006. Assessing genetic diversity and population structure in a citrus germplasm collection utilizing simple sequence repeat markers (SSRs). Theor. Appl. Genet. 112, 1519-1531.
Barrett, H.C., Rhodes, A.M., 1976. A numerical taxonomic study of affinity relationships in cultivated Citrus and its close relatives. Syst. Bot. 1, 105-136.
Bonnecarrere, V., Borsani, O., Diaz, P., Capdevielle, F., Blanco, P., Monza, J., 2011. Response to photoxidative stress induced by cold in japonica rice is genotype dependent. Plant Sci. 180, 726-732.
Bradford, M.M., 1976. Rapid and sensitive method for quantitation of microgram quantities of protein utilizing principle of protein-dye binding. Anal. Biochem. 72, 248-254.
Brumos, J., Colmenero-Flores, J.M., Conesa, A., Izquierdo, P., Sanchez, G., Iglesias, D.J., Lopez-Climent, M.F., Gomez-Cadenas, A., Talon, M., 2009. Membrane transporters and carbon metabolism implicated in chloride homeostasis differentiate salt stress responses in tolerant and sensitive Citrus rootstocks. Funct. Integr. Genomics 9, 293-309.
Chen, Z., Young, T.E., Ling, J., Chang, S.C., Gallie, D.R., 2003. Increasing vitamin C content of plants through enhanced ascorbate recycling. Proc. Natl. Acad. Sci. USA 100, 3525-3530.
Demmig-Adams, B., Adams, W.W., 1992. Photoprotection and other responses of plants to high light stress. Annu. Rev. Plant. Physiol. Plant Mol. Biol. 43, 599-626.
Drew, D.P., Lunde, C., Lahnstein, J., Fincher, G.B., 2007. Heterologous expression of cDNAs encoding monodehydroascorbate reductases from the moss, Physcomitrella patens and characterization of the expressed enzymes. Planta 225, 945-954.
Fanciullino, A.L., Dhuique-Mayer, C., Luro, F., Casanova, J., Morillon, R., Ollitrault, P., 2006. Carotenoid diversity in cultivated citrus is highly influenced by genetic factors. J. Agric. Food Chem. 54, 4397-4406.
Favaretto, V.F., Martinez, C.A., Soriani, H.H., Furriel, R.P.M., 2011. Differential responses of antioxidant enzymes in pioneer and late-successional tropical tree species grown under sun and shade conditions. Environ. Exp. Bot. 70, 20-28.
Federici, C.T., Fang, D.Q., Scora, R.W., Roose, M.L., 1998. Phylogenetic relationships within the genus Citrus (Rutaceae) and related genera as revealed by RFLP and RAPD analysis. Theor. Appl. Genet. 96, 812-822.
Feierabend, J., Engel, S., 1986. Photoinactivation of catalase in vitro and in leaves. Arch. Biochem. Biophys. 251, 567-576.
22
539540541542543544545546547548549550551552553554555556557558559560561562563564565566567568569570571572573574575576577578579580581582583584585586587
4344

Foyer, C.H., Lelandais, M., Kunert, K.J., 1994. Photooxidative stress in plants. Physiol. Plant. 92, 696-717.
Foyer, C.H., Noctor, G., 2000. Oxygen processing in photosynthesis: regulation and signalling. New Phytol. 146, 359-388.
Foyer, C.H., Noctor, G., 2003. Redox sensing and signalling associated with reactive oxygen in chloroplasts, peroxisomes and mitochondria. Physiol. Plant. 119, 355-364.
Frohnmeyer, H., Staiger, D., 2003. Ultraviolet-B radiation-mediated responses in plants. Balancing damage and protection. Plant Physiol. 133, 1420-1428.
Garcia-Lor, A., Luro, F., Navarro, L., Ollitrault, P., 2012. Comparative use of InDel and SSR markers in deciphering the interspecific structure of cultivated citrus genetic diversity: a perspective for genetic association studies. Mol. Genet. Genomics 287, 77-94.
Genty, B., Briantais, J.M., Baker, N.R., 1989. The relationship between the quantum yield of photosynthetic electron-transport and quenching of chlorophyll fluorescence. Biochim. Biophys. Acta 990, 87-92.
Gillespie, K.M., Ainsworth, E.A., 2007. Measurement of reduced, oxidized and total ascorbate content in plants. Nat. Prot. 2, 871-874.
Gonzalez-Rodriguez, A.M., Tausz, M., Wonisch, A., Jimenez, M.S., Grill, D., Morales, D., 2001. The significance of xanthophylls and tocopherols in photo-oxidative stress and photoprotection of three Canarian laurel forest tree species on a high radiation day. J. Plant Physiol. 158, 1547-1554.
Guo, Y.P., Zhou, H.F., Zhang, L.C., 2006. Photosynthetic characteristics and protective mechanisms against photooxidation during high temperature stress in two citrus species. Sci. Hort. 108, 260-267.
Han, S., Tang, N., Jiang, H.X., Yang, L.T., Li, Y., Chen, L.S., 2009. CO(2) assimilation, photosystem II photochemistry, carbohydrate metabolism and antioxidant system of citrus leaves in response to boron stress. Plant Sci. 176, 143-153.
Hansen, U., Fiedler, B., Rank, B., 2002. Variation of pigment composition and antioxidative systems along the canopy light gradient in a mixed beech/oak forest: a comparative study on deciduous tree species differing in shade tolerance. Trees 16, 354-364.
Hodges, D.M., DeLong, J.M., Forney, C.F., Prange, R.K., 1999. Improving the thiobarbituric acid-reactive-substances assay for estimating lipid peroxidation in plant tissues containing anthocyanin and other interfering compounds. Planta 207, 604-611.
Hossain, Z., Lopez-Climent, M.F., Arbona, V., Perez-Clemente, R.M., Gomez-Cadenas, A., 2009. Modulation of the antioxidant system in citrus under waterlogging and subsequent drainage. J. Plant Physiol. 166, 1391-1404.
Jiao, D.M., Li, X., 2001. Cultivar differences in photosynthetic tolerance to photooxidation and shading in rice (Oryza sativa L.). Photosynthetica 39, 167-175.
Jung, S., Steffen, K.L., Lee, H.J., 1998. Comparative photoinhibition of a high and a low altitude ecotype of tomato (Lycopersicon hirsutum) to chilling stress under high and low light conditions. Plant Sci. 134, 69-77.
Kitao, M., Yoneda, R., Tobita, H., Matsumoto, Y., Maruyama, Y., Arifin, A., Azani, A.M., Muhamad, M.N., 2006. Susceptibility to photoinhibition in seedlings of six tropical fruit tree species native to Malaysia following transplantation to a degraded land. Trees 20, 601-610.
Krause, G.H., Briantais, J.M., Vernotte, C., 1983. Characterization of chlorophyll fluorescence quenching in chloroplasts by fluorescence spectroscopy at 77-K.1. delta-pH-dependent quenching. Biochim. Biophys. Acta 723, 169-175.
Krause, G.H., Koroleva, O.Y., Dalling, J.W., Winter, K., 2001. Acclimation of tropical tree seedlings to excessive light in simulated tree-fall gaps. Plant Cell Environ. 24, 1345-1352.
23
588589590591592593594595596597598599600601602603604605606607608609610611612613614615616617618619620621622623624625626627628629630631632633634635636637
4546

Krause, G.H., Weis, E., 1991. Chlorophyll fluorescence and photosynthesis: the basics. Annu. Rev. Plant Physiol. Plant Mol. Biol. 42, 313-349.
Mackerness, S.A.H., John, C.F., Jordan, B., Thomas, B., 2001. Early signaling components in ultraviolet-B responses: distinct roles for different reactive oxygen species and nitric oxide. FEBS Lett. 489, 237-242.
Mai, J., Herbette, S., Vandame, M., Cavaloc, E., Julien, J.L., Ameglio, T., Roeckel-Drevet, P., 2010. Contrasting strategies to cope with chilling stress among clones of a tropical tree, Hevea brasiliensis. Tree Physiol. 30, 1391-1402.
Maxwell, K., Johnson, G.N., 2000. Chlorophyll fluorescence: a practical guide. J. Exp. Bot. 51, 659-668.
Monteith, J.L., 1965. Evaporation and environment. Symp. Soc. Exp. Biol. 19, 205-234.Oberley, L.W., Spitz, D.R., 1984. Assay of superoxide dismutase activity in tumor-tissue.
Methods Enzymol. 105, 457-464.Polle, A., Rennenberg, H., 1993. Significance of antioxidants in plant adaptation to
environmental stress, In: Folden, L., Mansfield, F., Stoddard, J. (Eds.), Plant adaptation to environmental stress. Chapman and Hall, London, pp. 263-273.
Queval, G., Issakidis-Bourguet, E., Hoeberichts, F.A., Vandorpe, M., Gakiere, B., Vanacker, H., Miginiac-Maslow, M., Van Breusegem, F., Noctor, G., 2007. Conditional oxidative stress responses in the Arabidopsis photorespiratory mutant cat2 demonstrate that redox state is a key modulator of daylength-dependent gene expression, and define photoperiod as a crucial factor in the regulation of H2O2-induced cell death. Plant J. 52, 640-657.
Rahman, I., Kode, A., Biswas, S.K., 2006. Assay for quantitative determination of glutathione and glutathione disulfide levels using enzymatic recycling method. Nat. Prot. 1, 3159-3165.
Scora, R.W., 1975. Symposium on biochemical systematics, genetics and origin of cultivated plants .9. history and origin of citrus. Bull. Torrey Bot. Club 102, 369-375.
Setlik, I., Allakhverdiev, S.I., Nedbal, L., Setlikova, E., Klimov, V.V., 1990. Three types of photosystem II photoinactivation.1. Damaging processes on the acceptor side. Photosynth. Res. 23, 39-48.
Shang, W., Feierabend, J., 1999. Dependence of catalase photoinactivation in rye leaves on light intensity and quality and characterization of a chloroplast-mediated inactivation in red light. Photosynth. Res. 59, 201-213.
Smith, I.K., Vierheller, T.L., Thorne, C.A., 1988. Assay of glutathione-reductase in crude tissue-homogenates using 5,5'-dithiobis(2-nitrobenzoic acid). Anal. Biochem. 175, 408-413.
Wingler, A., Mares, M., Pourtau, N., 2004. Spatial patterns and metabolic regulation of photosynthetic parameters during leaf senescence. New Phytol. 161, 781-789.
Yabuta, Y., Motoki, T., Yoshimura, K., Takeda, T., Ishikawa, T., Shigeoka, S., 2002. Thylakoid membrane-bound ascorbate peroxidase is a limiting factor of antioxidative systems under photo-oxidative stress. Plant J. 32, 915-925.
Yang, G.H., Yang, L.T., Jiang, H.X., Li, Y., Wang, P., Chen, L.S., 2012. Physiological impacts of magnesium-deficiency in Citrus seedlings: photosynthesis, antioxidant system and carbohydrates. Trees doi:10.1007/s00468-012-0699-2.
Zhou, B., Wang, J., Guo, Z., Tan, H., Zhu, X., 2006. A simple colorimetric method for determination of hydrogen peroxide in plant tissues. Plant Growth Regul. 49, 113-118.
24
638639640641642643644645646647648649650651652653654655656657658659660661662663664665666667668669670671672673674675676677678679680681682683
684
685
4748

25
686687
4950

Table 1
Genotypes used for physiological and biochemical analysis and their corresponding rootstocks
Genotype Corresponding rootstock
Abbreviation Common name Tanaka system ICVNa No. Common name Tanaka system ICVNa No.
CC
WLM
MK
PP
Corsican citron
Willowleaf
mandarin
Marumi
kumquat
Pink pummelo
Citrus medica L.
Citrus deliciosa Ten.
Fortunella japonica (Thunb.)
Swingle
Citrus maxima (Burm.) Merr.
0100613
0100133
0100482
0100322
Volkamer lemon
Volkamer lemon
Volkamer lemon
Trifoliate orange
Citrus limonia Osbeck
Citrus limonia Osbeck
Citrus limonia Osbeck
Poncirus trifoliata (L.)
Raf.
0100729
0100729
0100729
0110480
aInternational citrus variety numbering.
26
688
689
690
691692693694695696697698699700
5152

Figure captions
Fig. 1. Meteorological data, from September 23 to October 10, 2010 at San Giuliano (Corsica,
France). Closed symbols represent the minimum daily temperature (Tmin), the maximum daily
temperature (Tmax) and mean daily temperature (Tmean). Open symbols correspond to the daily
total radiation (DTR). On the bottom of the figure, the black bars stand for the shade-
acclimatization phase and the white bars represent the light treatment. For each of the three
periods, physiological measurements and samplings were performed just before the end of the
shading phase (0 h) and 3, 6, 24 and 48 h after the beginning of the light treatment.
Fig. 2. Changes in (a) net photosynthesis (Pnet), (b) stomatal conductance (Gs) and (c)
maximum quantum yield of photosystem II (Fv/Fm) in four citrus genotypes during time
course of photooxidative stress. Leaves acclimated under shade conditions for one week were
suddenly exposed to full light conditions. Photosynthesis parameters were measured just
before exposure to full light (0h), and 3, 6, 24 and 48 h after full light exposure. The results
are expressed as ratios relative to the values obtained on control leaves acclimated to full light
conditions. All data are presented as mean values (±S.E.) of nine independent measurements
(n = 9). Data were analyzed using ANOVA and Fisher LSD tests (P < 0.05). Different upper
case letters indicate significant differences between genotypes at a point of the time course
and different lower case letters indicate significant differences along the time course for one
genotype. Bold roman corresponds to CC, bold italics to MK, regular italics to WLM and
regular roman to PP. See the Table 1 for abbreviations information
Fig. 3. Time course of changes in (a) hydrogen peroxide (H2O2) and (b) malondialdehyde
(MDA) concentration in leaves of four citrus genotypes during photooxidative stress. Leaves
acclimated under shade conditions for one week were suddenly exposed to full light
27
701
702
703
704
705
706
707
708
709
710
711
712
713
714
715
716
717
718
719
720
721
722
723
724
5354

conditions. Compounds were assayed just before exposure to full light (0h), and 3, 6, 24 and
48 h after full light exposure. The results are expressed as ratios relative to the values obtained
on control leaves acclimated to full light conditions. All data are presented as mean values
(±S.E.) of six independent measurements (n = 6). Data were analyzed using ANOVA and
Fisher LSD tests (P < 0.05). Different upper case letters indicate significant differences
between genotypes at a point of the time course and different lower case letters indicate
significant differences along the time course for one genotype. See the Table 1 for
abbreviations information
Fig. 4. Time course of changes in reduced ascorbate concentration (Asa), oxidized ascorbate
concentration (DHA), total ascorbate concentration (tAsa) and redox status (Asa/DHA) in
leaves of four citrus genotypes during photooxidative stress. Leaves acclimated under shade
conditions for one week were suddenly exposed to full light conditions. Compounds were
assayed just before exposure to full light (0h), and 3, 6, 24 and 48 h after full light exposure.
The results are expressed as ratios relative to the values obtained on control leaves acclimated
to full light conditions. All data are presented as mean values (±S.E.) of six independent
measurements (n = 6). Data were analyzed using ANOVA and Fisher LSD tests (P < 0.05).
Different upper case letters indicate significant differences between genotypes at a point of
the time course and different lower case letters indicate significant differences along the time
course for one genotype. See the Table 1 for abbreviations information.
Fig. 5. Time course of changes in reduced glutathione concentration (Gsh), oxidized
glutathione concentration (GssG), total glutathione concentration (tGsh) and redox status
(Gsh/GssG) in leaves of four citrus genotypes during photooxidative stress. Leaves
acclimated under shade conditions for one week were suddenly exposed to full light
conditions. Compounds were assayed just before exposure to full light (0h), and 3, 6, 24 and
48 h after full light exposure. The results are expressed as ratios relative to the values obtained
28
725
726
727
728
729
730
731
732
733
734
735
736
737
738
739
740
741
742
743
744
745
746
747
748
749
5556

on control leaves acclimated to full light conditions All data are presented as mean values
(±S.E.) of six independent measurements (n = 6). Data were analyzed using ANOVA and
Fisher LSD tests (P < 0.05). Different upper case letters indicate significant differences
between genotypes at a point of the time course and different lower case letters indicate
significant differences along the time course for one genotype. See the Table 1 for
abbreviations information.
Fig. 6. Time course of changes in antioxidant enzyme specific activities (SOD, CAT, APX,
MDHAR, DHAR, GR) in leaves of four citrus genotypes during photooxidative stress. The
results are expressed as ratios relative to control values. Leaves acclimated under shade
conditions for one week were suddenly exposed to full light conditions. Activities were
assayed just before exposure to full light (0h), and 3, 6, 24 and 48 h after full light exposure.
The results are expressed as ratios relative to the values obtained on control leaves acclimated
to full light conditions. All data are presented as mean values (±S.E.) of six independent
measurements (n = 6). Data were analyzed using ANOVA and Fisher LSD tests (P < 0.05).
Different upper case letters indicate significant differences between genotypes at a point of
the time course and different lower case letters indicate significant differences along the time
course for one genotype. See the Table 1 for abbreviations information.
29
750
751
752
753
754
755
756
757
758
759
760
761
762
763
764
765
766
767
768
769
770
771
772
773
774
775
5758

30
776
777
778
779
780
781
782
783
784
785
786
787
788
789
790
791
792
793
794
795
796
797
798
799
800
801
802
803
804
5960
Figure 1
0
500
1000
1500
2000
0
5
10
15
20
25
309/
23/2
010
9/24
/201
0
9/25
/201
0
9/26
/201
0
9/27
/201
0
9/28
/201
0
9/29
/201
0
9/30
/201
0
10/1
/201
0
10/2
/201
0
10/3
/201
0
10/4
/201
0
10/5
/201
0
10/6
/201
0
10/7
/201
0
10/8
/201
0
10/9
/201
0
10/1
0/20
10
Tmin Tmax Tmean DTR
31
Tem
pera
ture
(°C
)
Daily total radiation (J.cm-2)
Date
805
806
807
808
809
810
811
812
813
814
815
816
817
818
819
820
821
6162

Figure 2
0,6
0,7
0,8
0,9
1
1,1
0 3 6 24 48
Aa
Aab AabAab
Ab
Aa
Bc
AbAb
BbAa
ABbAab
Aab
Bab
Aa
Aab Ab
Aab Aac
0
0,2
0,4
0,6
0,8
1
1,2
0 3 24 48
CC MK WLM PP
Ba
Bb
BcBc
ABa
BbAb
AbBa
BabABbc
AaAa
Ab
Cc
Bc
a
0
0,2
0,4
0,6
0,8
1
1,2
0 3 24 48
Aa
Bb
CcCc
Aa
ABbAbAb
Aab
Bb
Bb
AaAab
ABbBc
b
Bb
32
Gs (
rela
tive
ratio
)Fv
/Fm
(re
lativ
e ra
tio)
Exposure time (h)
P net (r
elat
ive
ratio
)
822
823
824
825
826
827
6364

Ba Ba AaAa
Bb
BaCb
BbBc Cc
0.5
1
1.5
2
2.5
3a
0.5
1
1.5
2
2.5
3
0.5
1
1.5
2
2.5
3
Ab
AcAc
Ad
0.5
1
1.5
2
2.5
3
0 3 6 24 48
Ba Ca Ca Aa Ba
PP
WLM
MK
CC
Aa
0.5
1
1.5
2
2.5
3
Bc
b
0.5
1
1.5
2
2.5
3
BaABab
BabAb Bb
0.5
1
1.5
2
2.5
3
Aa AaBabBbcAc
0 3 6 24 480.5
1
1.5
2
2.5
3
CaBa Ca Ba Ca
AaAab
Aab Ab
Figure 3
33
MDA content (relative ratio)
H2O
2 con
tent
(rel
ativ
e ra
tio)
Exposure time (h)
828
829
830
831
832
833
834
835
836
837
838
839
840
841
842
843
844
845
846
847
848
849
850
851
852
853
6566

0.5
0.8
1.1
1.4
1.7
2
Ac Bb Aa Bb Bb
0.5
0.8
1.1
1.4
1.7
2
AbAa Aa Aa Aa
0.5
0.8
1.1
1.4
1.7
2
AcAa
Bb Bab Bb
0.5
0.8
1.1
1.4
1.7
2
0 3 6 24 48
AaAa ABab
BbcAc
Bc
AabABb
BabAa
ABa Aa BaCa Ba
ABbABbc BbcCc
Aa
0 3 6 24 48
AaAabAab
Aab
Ab
Ac Cb ABa BabAab
Ba Aa AabBbAc
Bd
AaBb Cc Bc
0 3 6 24 48
Aa
BdAb
AabAc
AaBa Ba Ba Ba
AaAa
AaAaAb
Ac Bc Bbc
AaAab
0 3 6 24 48
AaABa Ba Ba Ba
PP
WLM
MK
CC
Asa DHA tAsa Asa/DHA
Figure 4
34
Asc
orba
te c
onte
nt (r
elat
ive
ratio
)
Exposure time (h)
854
855
856
857
858
859
860
861
862
863
864
865
866
867
868
869
870
871
872
873
874
875
876
877
878
879
6768

0
1
2
3
4CC
Bb Cc Ba Dc Dc
0
1
2
3
4
Ba Ca CaCb Cb
WLM
0
1
2
3
4
0 3 6 24 48
Aa Aa
BbBc
Cd
PP
AaAaAa
Ab
Cc
BaCaCbCbAb
BaBa
BbBbBc
0 3 6 24 48
Ba Cb CcCdCe
CaDb CbBcBd
AaBaBa
AbAc
CaCab CbBcCd
0 3 6 24 48
Aa AaBbAb
Dc
AaCbCbc Cc Cc
Aab AaAab
BbBCc
Cab Cb BaCbCa
0 3 6 24 48
AaBb Ab
Bc Bc
Gsh GssG tGsh Gsh/GssG
0
1
2
3
4MK
AaAaBabAb
Ac
Figure 5
35
Glu
tath
ione
con
tent
(rel
ativ
e ra
tio)
Exposure time (h)
880
881
882
883
884
885
886
887
888
889
890
891
892
893
894
895
896
897
898
899
900
901
902
903
904
905
6970

Figure 6
CC
MK
WLM
PP
SOD CAT APX MDHAR DHAR GR
0.5
1
1.5
2
2.5
3
3.5
AaCb
BcBcAd
0.5
1
1.5
2
2.5
3
3.5
BaDb BcBcBd
0.5
1
1.5
2
2.5
3
3.5
AaAb Ab Ac
ABd
0.5
1
1.5
2
2.5
3
3.5
0 3 6 24 48
ABb AaBb Ab
ABc
Ca Ca CaBb Ba
BaAbABbBb
Bc
Aa
AbBCb
BbcBc
0 3 6 24 48
Aa
AbAb
BbAc
BCaBcBb BbABc
Aa
ABbABbAbBc
CaAa Aa
ABb Bb
0 3 6 24 48
ABaAbABbcAbcAc
Ac
Ba Ba
BbBb
AaAa
Ab
Ac
Ad
Aa
BbCbcCcAd
0 3 6 24 48
AaBb
AbAc
Ad
AaAb
BCcAc Bc
Ab
AaAa
Aa
ABb
Aa
BbBbc
Ac Bc
0 3 6 24 48
Aa
ABbBbCbcAc
Aa ABabBb BbABc
Aa Aa
BbcABcBc
Aa
Ab Bbc BcdAd
0 3 6 24 48
AaAb
BbcBcAd
36
Enz
ymes
spec
ific
activ
ities
(rel
ativ
e ra
tio)
Exposure time (h)
906
907
908
7172


![Laser induced fluorescence - Willem's Homepagewillem.engen.nl/uni/pract/proef10.pdf · 2013-06-06 · When a plant is lit excessively, photoinhibition [3] (also called photoprotection](https://static.fdocuments.in/doc/165x107/5e9e143538cd8518c168d7a0/laser-induced-fluorescence-willems-2013-06-06-when-a-plant-is-lit-excessively.jpg)