Hal Pawson (UNSW) Cameron Parsell (University of Queensland)
27
Australian Homelessness Monitor 2020 Hal Pawson (UNSW) Cameron Parsell (University of Queensland) Presentation to: Sector briefing, 19 October 2020
Transcript of Hal Pawson (UNSW) Cameron Parsell (University of Queensland)

Australian Homelessness Monitor 2020
Hal Pawson (UNSW) Cameron Parsell (University of Queensland)
Presentation to: Sector briefing, 19 October 2020
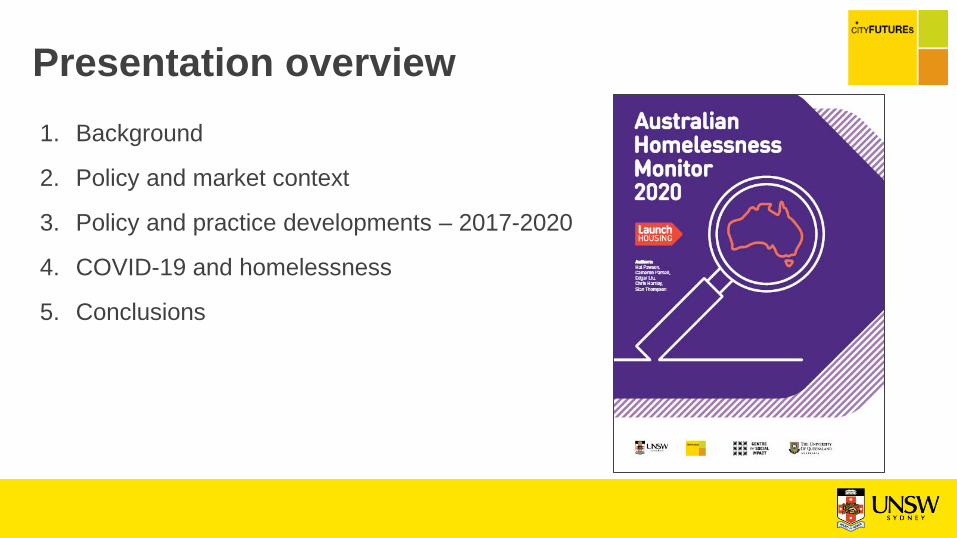
Presentation overview1. Background
2. Policy and market context
3. Policy and practice developments – 2017-2020
4. COVID-19 and homelessness
5. Conclusions

1. Background

Project origins• Launch Housing sponsorship
inspired by UKHM series – lead author: Prof Suzanne Fitzpatrick
• Funded by Crisis UK since 2011• Assessment of recent
developments in:− Analysis of changing scale and nature of
homelessness− Assessment of contributory policy and
economic change − Investigation of policy and practice
responses
• Provided model for AHM 2020

AHM 2020: research focus and methods• Twin focus:
− Street homelessness− COVID-19 responses
• AHM research methods:− Secondary data analysis− Stakeholder interviews – govt and NGOs (20)− Service user interviews (12)
• Fieldwork (May-July 2020) primarily in five mainland states – esp. NSW

2. Policy and housing market context

Policy and market context (1)
• Homelessness services expenditure up 27% to $990 million in four years to 2018-19
• Already likely to top $1 billion even before COVID-19
• Social housing expenditure up 4%
• Longer-term perspective: social housing 130,000 lower than if tracking population growth post-1996
708090
100110120130
2014-15 2015-16 2016-17 2017-18 2018-19
Recurrent real homelessness expenditure
State/territory social housing expenditure
200
300
400
500
1996
1998
2000
2002
2004
2006
2008
2010
2012
2014
2016
2018
Soci
al h
ousi
ng s
tock
(0
00s)
Social housingstock - actual
Social housingstock ifexpanded in linewith populationpost-1996

Policy and market context (2)• Long-run decline in social housing supply
– annual lettings halved since early 1990s
• Down from 30 per 10,000 population to 14 per 10,000 population
• Growing shortfall in private tenancies affordable to low income renters
-138
-187
-212
-250
-200
-150
-100
-50
02006 2011 2016
Def
icit
in p
rivat
e te
nanc
ies
affo
rdab
le
to lo
wes
t qui
ntile
inco
me
rent
ers
(000
s)
Private rentals affordable to low-income tenants, 2006-2016
Original source: Kath Hulse et al; AHURI Final Report 323

Policy and market context (3)
• Substantial diversity in housing market trends in pandemic
• More substantial market impacts in Melbourne and Sydney – vacancies up, rents down
• Effects of sharply reduced overseas student and tourism demand v. spatially concentrated
• Emerging evidence of urban versus regional dichotomy
85
90
95
100
105
110
Mea
n re
nts
-ind
exed
(J
uly
2019
=100
)
Syd Melb Per Bris
COVID-19 pandemic
0
50
100
150
200
% v
acan
cy ra
te -
inde
xed
(Jul
y 20
19=1
00)
Syd Melb Per Bris
COVID-19 pandemic

3. Policy and practice developments 2017-2020

Policy/practice developments 2017-2020 (1)
• Stepped-up state govt concern on (street) homelessness− Rough sleeper reduction strategies
and (some) targets
• Policy/practice developments: typical components− Expanded assertive outreach
− Boosted private rental subsidy programs
− Additional head-leasing of private rental properties
− Enhanced priority for PH vacancies, efforts to secure greater CHP engagement

Policy/practice developments 2017-2020 (2)
• New emphasis on homelessness data enhancement and quantification – linked with aspirations for: − Measuring (street) homelessness reduction progress
− More effective rough sleeper case management
• Enthusiasm for new homelessness management ‘technologies’− By-name-list (BNL) service user databases
− VI-SPDAT (Vulnerability Index Service Prioritisation Decision Assistance Tool)
− Functional zero concept
• Symptomatic of service professionalisation
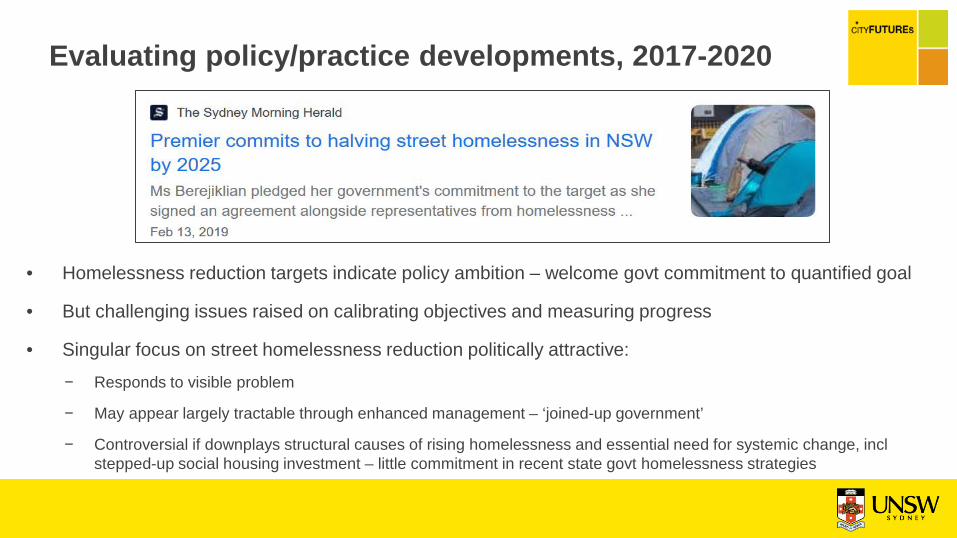
Evaluating policy/practice developments, 2017-2020
• Homelessness reduction targets indicate policy ambition – welcome govt commitment to quantified goal
• But challenging issues raised on calibrating objectives and measuring progress
• Singular focus on street homelessness reduction politically attractive:− Responds to visible problem
− May appear largely tractable through enhanced management – ‘joined-up government’
− Controversial if downplays structural causes of rising homelessness and essential need for systemic change, incl stepped-up social housing investment – little commitment in recent state govt homelessness strategies

Evaluating policy developments 2017-2020: changing provision vs. need – Victoria microcosm
• State Govt homelessness budget up 40% over 3 years to 2018-19 – incl. expanded assertive outreach, headleasing, private rental assistance
• But permanent social housing stock grew by only 0.5% in 4 years to 2019, while overall population expanded by 9%
• Calibrated by SHS service provision stats, homelessness increased by 10%
• Social housing growing at only one twentieth the rate of homelessness

4. COVID-19 and homelessness
A new vision?

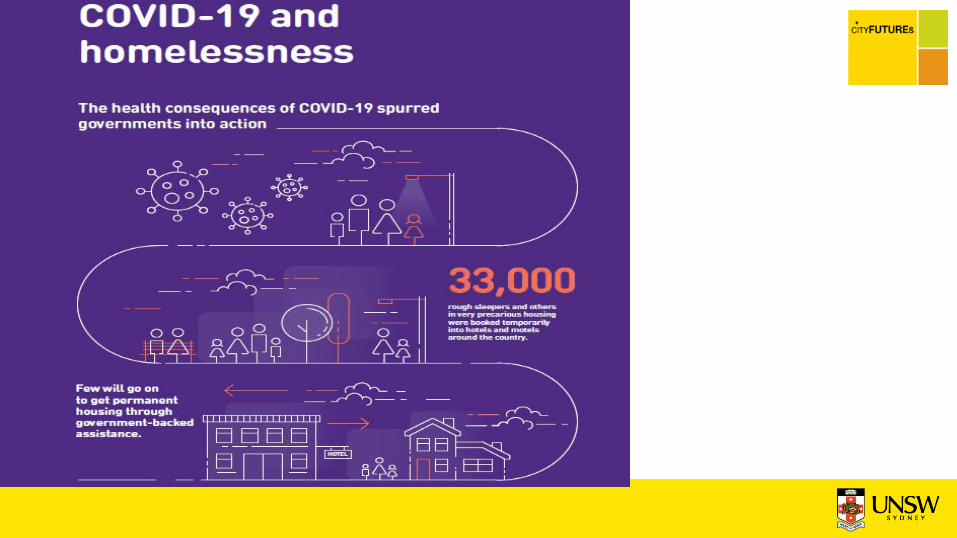
A new vision?• As COVID-19 hit Australia through Jan/Feb we soon
realised the risks of infection – and death – not distributed evenly
• People with underlying health issues, older people, and people living in congregate settings all at a heightened risk
• Society became concerned about the housing exclusion experienced by Australians who were homeless
• Unprecedented funding for emergency action in most states from Mar/Apr

A new vision?
• Hotel charges, initially, $15m Vic; $14m NSW
• SA reports $8.2m homelessness spend
• QLD reported $25m spend, incl. hotels, floating support, student accommodation
• Head-leasing, hotels, and support: $150m Vic, $54m in NSW
• Rapid refurbishment of social housing: $47m NSW, $90m Vic
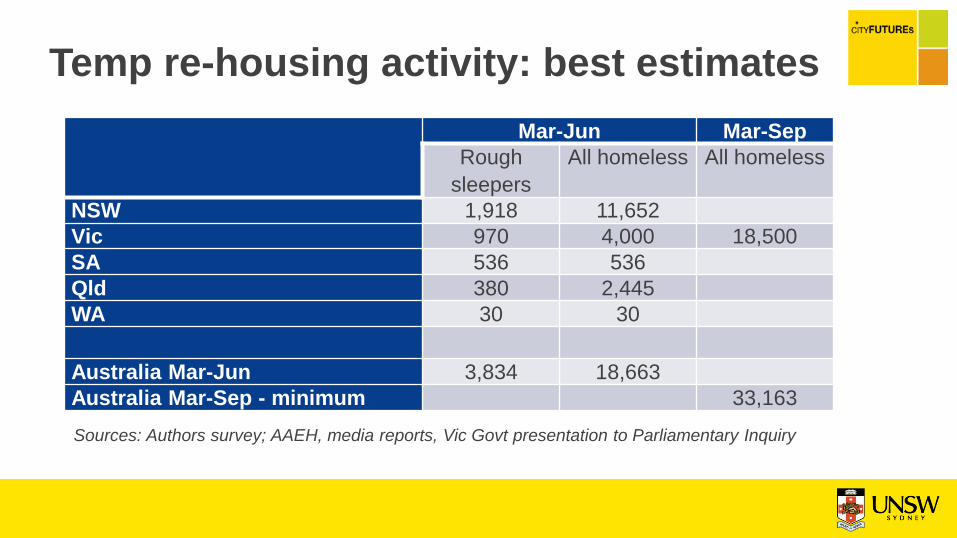
Temp re-housing activity: best estimatesMar-Jun Mar-Sep
Rough sleepers
All homeless All homeless
NSW 1,918 11,652Vic 970 4,000 18,500SA 536 536Qld 380 2,445WA 30 30
Australia Mar-Jun 3,834 18,663Australia Mar-Sep - minimum 33,163Sources: Authors survey; AAEH, media reports, Vic Govt presentation to Parliamentary Inquiry

A new vision?• Cross departmental collaboration, along with state and
NGO collaboration:
“Without this new level of cooperation and alignment, it wouldn’t matter how much money you threw at it, it still wouldn’t be the significant difference that it has been. So our support agencies coordinating in a way that is breathtaking.
Identifying quickly where there are issues, responding. And I’m not saying there used to be turf wars, but everybody overcoming their own systems and boundaries and really rising to the occasion to deal with the solutions”
(Govt representative)

A new vision?• Phenomenal sector work
So getting people into hotels. The government had announced the $24.7 million, so we put 240 people in a hotel over Easter… Well, the government had sent letters saying, “Whatever you need to do to respond to COVID, you do it.” So I took them literally, and we did
(NGO stakeholder)
We’ve met demand… Not just the demands that we can afford to meet… So we just went, “Okay, time to get everyone off the streets into accommodation”
(NGO stakeholder)

A new vision?• Accepting (what they’ve always wanted) decent accommodation
Rough sleepers, many of whom have been on the streets for a long time, have very low levels of trust in government and agencies and institutions saying, “I’ll accept help. I want the accommodation when it’s offered and I’ll accept that help from you at this time, when I acknowledge that I haven’t been willing to accept it previously”
(Govt representative)
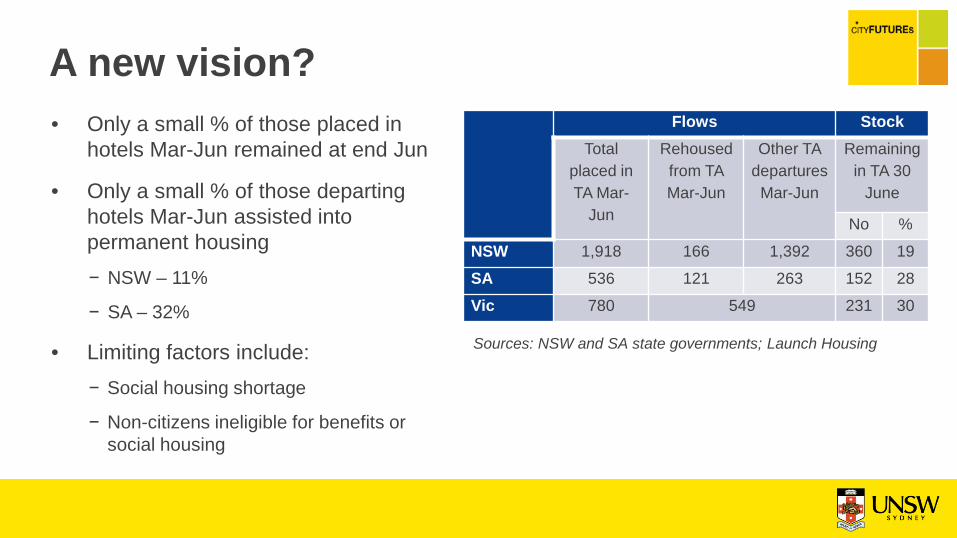
A new vision?• Only a small % of those placed in
hotels Mar-Jun remained at end Jun
• Only a small % of those departing hotels Mar-Jun assisted into permanent housing− NSW – 11%
− SA – 32%
• Limiting factors include:− Social housing shortage
− Non-citizens ineligible for benefits or social housing
Flows StockTotal
placed in TA Mar-
Jun
Rehoused from TA Mar-Jun
Other TA departures
Mar-Jun
Remaining in TA 30
June
No %NSW 1,918 166 1,392 360 19SA 536 121 263 152 28Vic 780 549 231 30
Sources: NSW and SA state governments; Launch Housing

A new vision?• A new problematisation
• The sector and evidence have long known homelessness is bad for health
• Moving forward: evidence, housing supply, ongoing support
• Cautious optimism?
5. Conclusions

Conclusions• Extraordinary COVID-19 homelessness response probably benefited
from ramped-up state govt action 2017-2020
• Federal Govt temp income protection programs plus state eviction moratoria staved off mid-2020 homelessness crisis
• Although COVID-19 temp accommodation response impressive, minimal evidence this is a pathway to permanent housing
• Despite its fundamental contribution to rising homelessness, Australian governments have continued to ignore or downplay the deep-seated failings of our housing system and the need for greater investment