HAITONG CHINA A-SHARE EQUITY INVESTMENT FUND (A Sub …
14
Unaudited Semi-Annual Report 2021 HAITONG INVESTMENT FUND SERIES (An umbrella unit trust established in Hong Kong) HAITONG CHINA A-SHARE EQUITY INVESTMENT FUND (A Sub-Fund of Haitong Investment Fund Series) For the period from 1 January 2021 to 30 June 2021
Transcript of HAITONG CHINA A-SHARE EQUITY INVESTMENT FUND (A Sub …

Unaudited Semi-Annual Report 2021 HAITONG INVESTMENT FUND SERIES (An umbrella unit trust established in Hong Kong)
HAITONG CHINA A-SHARE EQUITY INVESTMENT FUND
(A Sub-Fund of Haitong Investment Fund Series)
For the period from 1 January 2021 to 30 June 2021

HAITONG CHINA A-SHARE INVESTMENT FUND
(A SUB-FUND OF HAITONG INVESTMENT FUND SERIES)
CONTENTS
Pages
Management and Administration 1
Report of the Manager to the Unitholders 2
Statement of Financial Position (unaudited) 3 - 4
Statement of Comprehensive Income (unaudited) 5 - 6
Statement of Changes in Net Assets Attributable to Unitholders (unaudited) 7
Statement of Cash Flows (unaudited) 8
Investment Portfolio (unaudited) 9
Statement of Movements in Investment Portfolio (unaudited) 10
Performance Record (unaudited) 11 - 12

1
HAITONG CHINA A-SHARE INVESTMENT FUND
(A SUB-FUND OF HAITONG INVESTMENT FUND SERIES)
MANAGEMENT AND ADMINISTRATION
Manager
Haitong International Asset Management (HK) Limited
22/F., Li Po Chun Chambers
189 Des Voeux Road Central
Hong Kong
Trustee and Registrar
HSBC Institutional Trust Services (Asia) Limited
1 Queen’s Road Central
Hong Kong
Directors of the Manager
Yang Jianxin
Sun Tong
Poon Mo Yiu
Luk Wai Yin
Yan Suping (Appointed on 29 March 2021)
Auditors
PricewaterhouseCoopers
22/F Prince's Building
Central
Hong Kong
Solicitors
Deacons
5/F, Alexandra Houses
18 Chater Road
Central
Hong Kong

2
HAITONG CHINA A-SHARE INVESTMENT FUND
(A SUB-FUND OF HAITONG INVESTMENT FUND SERIES)
REPORT OF THE MANAGER TO THE UNITHOLDERS
As continuing market positive sentiment in the second half year of 2020 and under relatively abundant liquidity, China
A share market experienced an upward performance from the beginning of 2021 till the mid of February. CSI 300
index was up by 14.15% at the highest level, which was over 5,800 points. Market generally expected the momentum
in economic recovery to continue. After the pressure of regulatory policy changes on tech firms such as Internet
platforms, and k12 education sector, as well as the concerns over global rising inflation pressure, potential liquidity
tightening in the near future and sudden rise in US treasury yields, CSI 300 Index ended up with slightly positive return
of 0.24% (as measured in China RMB terms) at the end of June after volatile pullback.
For economic data, China GDP growth was up 18.3% yoy in the first quarter of 2021, due to a low base effect.
However, for the second quarter, GDP growth rate slowed to 7.9% yoy and was slightly below market expectation of
8%. Overall GDP growth for the first half of 2021 was 12.7% yoy and the two-year average growth was 5.3%.
Meanwhile, PPI rose significantly to 8.8% yoy and CPI slowed to 1.1% yoy in June, reflecting the gap between supply
and demand, and the recovery of China economy was uneven, since domestic demand such as consumption and service
sector might face pressure and high commodity prices pushed PPI at elevated level. Fixed asset investment increased
4.7% yoy in June and overall 12.6% yoy in the first half year, as manufacturing investment improved in June, driven
by strong exports. In terms of monetary policy, PBOC announced RRR cut and rollover MLF to release liquidity and
reduce comprehensive funding cost, especially for SMEs. This will save the cost for financial institutions by RMB 13
billion, showing the government would like to mitigate the impacts of high commodity prices. Overall PBOC stated
that it will continue to proceed policy normalization. Under the good control of the outbreak domestically, China still
took the lead in recovery from pandemic compared to global peers. As for exchange rate, CNY slightly appreciated
0.53% against USD during this period.
Looking forward, we are cautiously optimistic on China A-share stock market. From a top-down perspective, China is
now leading the economy recovery. The geopolitical tension between China and U.S. might improve to a certain
extent, providing further upside potential to the market. From a bottom-up perspective, the fundamentals of our
investment targets are healthy, as strong financials, solid earnings, competitive advantage and valuation are all
supportive.
Haitong International Asset Management (HK) Limited

3
HAITONG CHINA A-SHARE INVESTMENT FUND
(A SUB-FUND OF HAITONG INVESTMENT FUND SERIES)
STATEMENT OF FINANCIAL POSITION (unaudited)
As at 30 June 2021
(Unaudited) (Audited)
At 30 June
2021
At 31 December
2020
USD USD
Assets
Current assets
Financial assets at fair value through profit or loss 27,372,507 27,845,807
Interest receivable 13 17
Cash and cash equivalents 2,006,831 2,549,337
–––––––––––––– ––––––––––––––
Total assets 29,379,351 30,395,161
═════════ ═════════
Liabilities
Current liabilities
Other payables 85,809 706,821
–––––––––––––– ––––––––––––––
Liabilities (excluding net assets attributable to unitholders) 85,809 706,821
═════════ ═════════
Net assets attributable to unitholders (after adjustment for
different basis adopted by the Sub-Fund) 29,293,542 29,688,340
═════════ ═════════
Adjustment for different basis adopted by the Sub-Fund in arriving
at net assets attributable to unitholders 25,511 33,980
–––––––––––––– ––––––––––––––
Net assets attributable to unitholders (in accordance with the
Sub-Fund's Explanatory Memorandum) 29,319,053 29,722,320
═════════ ═════════
Number of units in issue
– Class A (USD) Accumulation units 15,000 15,000
═════════ ═════════
– Class A (HKD) Accumulation units 152,022 152,022
═════════ ═════════
– Class I (USD) Accumulation units 20,000 20,000
═════════ ═════════
– Class I (HKD) Accumulation units 300,000 300,000
═════════ ═════════
– Class S (USD) Accumulation units 99,370 99,370
═════════ ═════════

4
HAITONG CHINA A-SHARE INVESTMENT FUND
(A SUB-FUND OF HAITONG INVESTMENT FUND SERIES)
STATEMENT OF FINANCIAL POSITION (unaudited) (continued)
As at 30 June 2021
(Unaudited) (Audited)
At 30 June
2021
At 31 December
2020
USD USD
Net asset value per unit (in accordance with the Sub-Fund's
Explanatory Memorandum)
– Class A (USD) Accumulation units 146.72 148.85
═════════ ═════════
– Class A (HKD) Accumulation units 18.74 19.01
═════════ ═════════
– Class I (USD) Accumulation units 148.04 149.97
═════════ ═════════
– Class I (HKD) Accumulation units 18.89 19.13
═════════ ═════════
– Class S (USD) Accumulation units 157.40 159.58
═════════ ═════════
Note: Semi-annual reports have applied the same accounting policies and methods of computation as are applied in the
annual reports of the Sub-Fund.

5
HAITONG CHINA A-SHARE INVESTMENT FUND
(A SUB-FUND OF HAITONG INVESTMENT FUND SERIES)
STATEMENT OF COMPREHENSIVE INCOME (unaudited)
For the period from 1 January 2021 to 30 June 2021
(Unaudited)
For the period from
1 January 2021
to 30 June 2021
(Unaudited)
For the period from
1 January 2020
to 30 June 2020
USD USD
Income
Interest income on bank deposits 2,323 1,762
Dividend income 371,677 203,314
Realised gains on disposal of financial assets at fair value
through profit or loss - 775,260
Change in unrealised gains/losses in value of financial
assets at fair value through profit or loss (473,300) 1,907,327
Net foreign currency gains/(losses) 13,108 (42,248)
–––––––––––– ––––––––––––
Total net (loss)/income (86,192) 2,845,415
–––––––––––– ––––––––––––
Expenses
Management fee Note 2 189,929 127,689
Performance fee Note 2 - 172,876
Trustee fee Note 1 18,401 18,000
Safe custody and bank charges Note 1 4,261 2,873
Auditor’s remuneration 8,202 7,957
Accounting fee Note 1 4,105 5,633
Handling fee Note 1 - 1,786
Transaction fee - 41,455
Other operating expenses Note 1 45,217 42,858
–––––––––––– ––––––––––––
Total operating expenses 270,115 421,127
–––––––––––– ––––––––––––
Net (loss)/income before tax (356,307) 2,424,288
Withholding tax (38,490) (20,527)
–––––––––––– ––––––––––––
(Loss)/income after tax (394,797) 2,403,761
Adjustment for different basis adopted by the Sub-Fund in
arriving at net assets attributable to unitholders (8,470) (8,248)
–––––––––––– ––––––––––––
(Decrease)/increase in net assets attributable to
unitholders (403,267) 2,395,513
══════════ ══════════

6
HAITONG CHINA A-SHARE INVESTMENT FUND
(A SUB-FUND OF HAITONG INVESTMENT FUND SERIES)
STATEMENT OF COMPREHENSIVE INCOME (unaudited) (Continued)
For the period from 1 January 2021 to 30 June 2021
Note 1 During the period ended 30 June 2021 and 2020, other than Trustee fee, Safe custody and bank charges and
Handling fee were paid to the Trustee or its Connected Persons, other respective amounts paid to the Trustee or
its Connected Persons were as follows:
(Unaudited) For the period from
1 January 2021
to 30 June 2021
(Unaudited)
For the period from
1 January 2020 to 30 June 2020
USD USD
Accounting fee 2,976 2,983
Other operating expenses 44,861 42,501
Note 2 During the period ended 30 June 2021 and 2020, other than Management fee and performance fee that were paid
to the Manager, no other amounts were paid to the Manager or its Connected Persons.

7
HAITONG CHINA A-SHARE INVESTMENT FUND
(A SUB-FUND OF HAITONG INVESTMENT FUND SERIES)
STATEMENT OF CHANGES IN NET ASSETS ATTRIBUTABLE TO UNITHOLDERS (unaudited)
For the period from 1 January 2021 to 30 June 2021
(Unaudited)
For the period from
1 January 2021
to 30 June 2021
(Unaudited)
For the period from
1 January 2020
to 30 June 2020
USD USD
Net assets attributable to unitholders at 1 January 29,722,320 20,931,870
(Decrease)/increase in net assets attributable to unitholders (403,267) 2,395,513
–––––––––––––– ––––––––––––––
Net assets attributable to unitholders at 30 June (in accordance
with the Sub-Fund’s Explanatory Memorandum) 29,319,053 23,327,383
═════════ ═════════ Number of units in issue Units Units Class A (USD) Accumulation units Units in issue at the beginning of the period 15,000 15,000
––––––––––– ––––––––––– Units in issue at the end of the period 15,000 15,000
═════════ ═════════ Class A (HKD) Accumulation units Units in issue at the beginning of the period 152,022 101,061 ––––––––––– ––––––––––– Units in issue at the end of the period 152,022 101,061 ═════════ ═════════ Class I (USD) Accumulation units Units in issue at the beginning of the period 20,000 20,000 ––––––––––– ––––––––––– Units in issue at the end of the period 20,000 20,000 ═════════ ═════════ Class I (HKD) Accumulation units Units in issue at the beginning of the period 300,000 300,000 ––––––––––– ––––––––––– Units in issue at the end of the period 300,000 300,000 ═════════ ═════════ Class S (USD) Accumulation units Units in issue at the beginning of the period 99,370 99,370 ––––––––––– ––––––––––– Units in issue at the end of the period 99,370 99,370 ═════════ ═════════

8
HAITONG CHINA A-SHARE INVESTMENT FUND
(A SUB-FUND OF HAITONG INVESTMENT FUND SERIES)
STATEMENT OF CASH FLOWS (unaudited)
For the period from 1 January 2021 to 30 June 2021
(Unaudited)
For the period from
1 January 2021
to 30 June 2021
(Unaudited)
For the period from
1 January 2020
to 30 June 2020
USD USD
Cash flows from operating activities
(Decrease)/increase in net assets attributable to unitholders (403,267) 2,395,513
Adjustments for:
Different basis adopted by the Sub-Fund in arriving at net assets
attributable to unitholders 8,470 8,248
Interest income on bank deposits (2,323) (1,762)
Dividend income (371,677) (203,314)
Withholding tax 38,490 20,527
––––––––––– –––––––––––
(730,307) 2,219,212
Net change in financial assets at fair value through profit or loss 473,300 (2,225,401)
Net change in prepayments - (34)
Net change in other payables (621,012) 54
––––––––––– –––––––––––
Cash used in operations (878,019) (6,169)
Interest received 2,326 1,762
Dividend received, net of withholding tax 333,187 182,787
––––––––––– –––––––––––
Net cash (outflow)/inflow from operating activities (542,506) 178,380
––––––––––– –––––––––––
Net (decrease)/increase in cash and cash equivalents (542,506) 178,380
Cash and cash equivalents at the beginning of the period 2,549,337 1,152,704
––––––––––– –––––––––––
Cash and cash equivalents at the end of the period 2,006,831 1,331,084
═════════ ═════════
Analysis of balances of cash and cash equivalents:
Cash at bank 2,006,831 1,331,084
═════════ ═════════

HAITONG CHINA A-SHARE EQUITY INVESTMENT FUND
(A SUB-FUND OF HAITONG INVESTMENT FUND SERIES)
9
Investment Portfolio (unaudited) 30 June 2021
Fair value % of Net
Holdings USD Assets
Listed equities (93.36)%
China (93.36%)
Anhui Conch Cement Co Ltd 162,500 1,031,678 3.52
Baoshan Iron & Steel Co 961,000 1,135,519 3.87
C&S Paper Co Ltd 148,585 633,103 2.16
Chongqing Zhifei Biological Products Co Ltd 18,960 547,558 1.87
CITIC Pacific Special Steel Group Co Ltd 488,686 1,575,090 5.37
Gansu Shangfeng Cement Co Ltd 385,600 1,042,452 3.56
G-bits Network Technology Xiam Co Ltd 19,027 1,559,638 5.32
Hangzhou Tigermed Consultig Co Ltd 39,929 1,193,708 4.07
Happigo Home Shopping Co Ltd 37,910 402,213 1.37
Hengli Petrochemical Co Ltd 221,200 897,691 3.06
Hualan Biological Engineering Inc 77,300 438,517 1.5
Jafron Biomedical Co Ltd 37,600 502,202 1.71
Jiangsu Hengli Highpressure 118,291 1,571,896 5.36
Jiangsu Hengrui Medicine Co Ltd 120,441 1,266,104 4.32
Kweichow Moutai Co Ltd 5,500 1,749,490 5.97
Offcn Education Technology Co Ltd 112,100 362,178 1.24
Ovctek China Inc 84,366 1,351,124 4.61
Poly Developments And Holdings Group Co Ltd 552,300 1,028,441 3.51
Sanquan Food Co Ltd 53,240 135,615 0.46
Sany Heavy Industry Co Ltd 325,700 1,464,335 4.99
SG Micro Corp 13,050 510,088 1.74
Shandong Hualu Hengsheng Chemical 189,563 907,386 3.09
Shanghai M&G Stationery Inc 62,215 813,650 2.77
Shenzhen Kangtai Biological Products Co Ltd 14,964 344,835 1.18
Shenzhen Mindray Bio-Medical Electronics Co Ltd 10,900 809,265 2.76
Weichai Power Co Ltd 534,300 1,476,684 5.04
Wuhu Sanqi Interactive Entertainment Network Technology Group Co Ltd 39,400 146,368 0.5
Yantai Eddie Precision Machinery Co Ltd 237,244 1,572,992 5.36
Yealink Network Technology Corp Ltd 47,000 609,143 2.08
Zhongji Innolight Co Ltd 49,273 293,544 1.00
–––––––––––– ––––––
Total investments (Total cost of investments USDI8,306,024) 27,372,507 93.36
Other net assets 1,946,546 6.64
–––––––––––– ––––––
Total net assets as at 30 June 2021 29,319,053 100.00
════════ ═════

HAITONG CHINA A-SHARE EQUITY INVESTMENT FUND
(A SUB-FUND OF HAITONG INVESTMENT FUND SERIES)
10
Statement of Movements in Investment Portfolio (unaudited) For the period from 1 January 2021 to 30 June 2021
Percentage
holdings
of net assets
as at 30 June
2021
Percentage
holdings
of net assets
as at 31 December
2020
China (Listed equities - by industry)
Consumer Discretionary 5.38 6.31
Consumer Staples 8.59 7.94
Financials 3.51 4.52
Health Care 22.02 19.89
Industrials 21.75 24.52
Materials 17.10 17.20
Technology 15.01 13.31
–––––––– ––––––––
Total 93.36 93.69
═══════ ═══════

HAITONG CHINA A-SHARE EQUITY INVESTMENT FUND
(A SUB-FUND OF HAITONG INVESTMENT FUND SERIES)
11
Performance Record (unaudited) 30 June 2021
30 June 2021
USD
31 December 2020
USD
31 December 2019
USD
Net assets
– Class A (USD) Accumulation unit 2,200,831 2,232,899 1,669,499
– Class A (HKD) Accumulation unit 2,848,917 2,890,450 1,435,363
– Class I (USD) Accumulation unit 2,960,806 2,999,459 2,235,626
– Class I (HKD) Accumulation unit 5,667,224 5,741,262 4,277,217
– Class S (USD) Accumulation unit 15,641,275 15,858,250 11,314,165
Net asset value per unit
– Class A (USD) Accumulation unit 146.72 148.85 111.29
– Class A (HKD) Accumulation unit 18.74 19.01 14.20
– Class I (USD) Accumulation unit 148.04 149.97 111.78
– Class I (HKD) Accumulation unit 18.89 19.13 14.25
– Class S (USD) Accumulation unit 157.40 159.58 113.85
Highest issue
price
Lowest
redemption
price
Financial period
1 January 2021 to 30 June 2021
– Class A (USD) Accumulation unit USD174.42 USD138.33
– Class A (HKD) Accumulation unit HKD172.70 HKD137.27
– Class I (USD) Accumulation unit USD175.77 USD139.46
– Class I (HKD) Accumulation unit HKD173.88 HKD138.26
– Class S (USD) Accumulation unit USD191.73 USD148.28
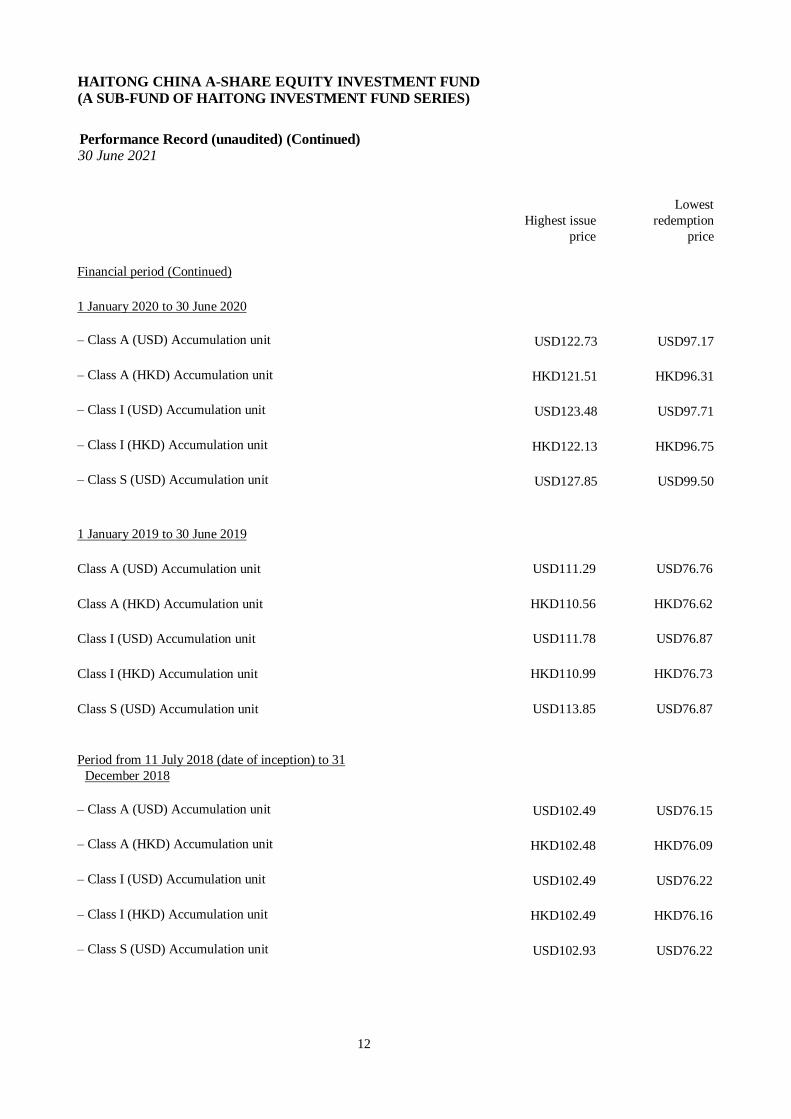
HAITONG CHINA A-SHARE EQUITY INVESTMENT FUND
(A SUB-FUND OF HAITONG INVESTMENT FUND SERIES)
12
Performance Record (unaudited) (Continued) 30 June 2021
Highest issue
price
Lowest
redemption
price
Financial period (Continued)
1 January 2020 to 30 June 2020
– Class A (USD) Accumulation unit USD122.73 USD97.17
– Class A (HKD) Accumulation unit HKD121.51 HKD96.31
– Class I (USD) Accumulation unit USD123.48 USD97.71
– Class I (HKD) Accumulation unit HKD122.13 HKD96.75
– Class S (USD) Accumulation unit USD127.85 USD99.50
1 January 2019 to 30 June 2019
Class A (USD) Accumulation unit USD111.29 USD76.76
Class A (HKD) Accumulation unit HKD110.56 HKD76.62
Class I (USD) Accumulation unit USD111.78 USD76.87
Class I (HKD) Accumulation unit HKD110.99 HKD76.73
Class S (USD) Accumulation unit USD113.85 USD76.87
Period from 11 July 2018 (date of inception) to 31
December 2018
– Class A (USD) Accumulation unit USD102.49 USD76.15
– Class A (HKD) Accumulation unit HKD102.48 HKD76.09
– Class I (USD) Accumulation unit USD102.49 USD76.22
– Class I (HKD) Accumulation unit HKD102.49 HKD76.16
– Class S (USD) Accumulation unit USD102.93 USD76.22