
Hailun Experiment for LAI Measurement (HELM 2016)The field campaign was supported by the National...
35
0 Hailun Experiment for LAI Measurement (HELM 2016) Field Report Version 1.0 Hongliang Fang, Yongchang Ye, Weiwei Liu, Shanshan Wei, Li Ma State Key Laboratory of Resources and Environmental Information System, Institute of Geographic Sciences and Natural Resources Research, Chinese Academy of Sciences September 12, 2017
Transcript of Hailun Experiment for LAI Measurement (HELM 2016)The field campaign was supported by the National...

0
Hailun Experiment for LAI
Measurement (HELM 2016)
Field Report
Version 1.0
Hongliang Fang, Yongchang Ye, Weiwei Liu, Shanshan Wei, Li Ma
State Key Laboratory of Resources and Environmental Information System,
Institute of Geographic Sciences and Natural Resources Research,
Chinese Academy of Sciences
September 12, 2017

1
Participants
Prof. Hongliang Fang
Principle Investigator
LREIS, Institute of Geographic Sciences and Natural Resources Research
Chinese Academy of Sciences
Beijing 100101, China
Email: [email protected]
Yongchang Ye, Weiwei Liu, Shanshan Wei, Li Ma
PhD. students
LREIS, Institute of Geographic Sciences and Natural Resources Research
Chinese Academy of Sciences
Beijing 100101, China
Acknowledgments
The field campaign was supported by the National Natural Science Foundation of
China (41471295). We would like to thank the farmers for allowing us to make use of
their fields for in situ measurements.
2
Revision History
Revision Date Changes Major
contributor
2017-09-01 Initial draft Yongchang Ye

3
Contents
Contents ................................................................................................................. 3
List of Figures ........................................................................................................ 4
List of Tables .......................................................................................................... 6
1. Overview ............................................................................................................ 7
2. Materials and methods ....................................................................................... 7
2.1. Study area and sampling design .............................................................. 7
2.2. LAI-2200 plant canopy analyzer .......................................................... 14
2.3. Digital hemispherical photography (DHP) ........................................... 15
2.4. AccuPAR ceptometer ............................................................................ 17
2.5. PocketLAI ............................................................................................. 18
2.6. LAISamrt .............................................................................................. 19
2.7. SmartLAI .............................................................................................. 22
2.8. LI-3100C leaf area meter ...................................................................... 23
2.9. PASTiS .................................................................................................. 24
2.10. LAIPhoto............................................................................................. 27
3. Quality assurance ............................................................................................. 28
3.1. LAI-2200............................................................................................... 29
3.2. DHP....................................................................................................... 29
3.3. AccuPAR ............................................................................................... 29
3.4. PocketLAI ............................................................................................. 30
3.5. LAISmart .............................................................................................. 30
3.6. SmartLAI .............................................................................................. 31
3.7. LI-3100C ............................................................................................... 31
3.8. PASTiS .................................................................................................. 31
3.9. LAIPhoto............................................................................................... 33
Reference ............................................................................................................. 34

4
List of Figures
Fig. 1 Location of the study area l in the western suburb of the Hailun city,
northeast China. The right picture shows the position of five plots in a false
color composite of a Landsat 8 image (path 118, row 027, Jun 2, 2016). Five
plots (A-E) are marked. The crop was maize at plot A and D, soybean at plot
B and C, sorghum at plot E. ........................................................................... 8
Fig. 2 An illustration of all instruments used in the field campaign. (a) LAI-2200;
(b) LI-3000C (c) DHP; (d) AccuPAR; (e) PocketLAI; (f) SmartLAI; (g)
LAISmart; (h) LAIPhoto; (i) PASTiS. ......................................................... 10
Fig. 3 Different crop growing stages in plots A to E (left to right) for seedling (top
row), flowering (middle row) and maturity (bottom row) stages in 2016. . 11
Fig. 4 Diagram of sampling strategies in each 20×20 m Elementary Sampling
Units (ESU). (a) AccuPAR and LAI-2200 were used at the four corners and
the center. (b) Regular sampling for DHP and PocketLAI, LAIsmart and
SmartLAI, totally 16 sample points. ............................................................ 13
Fig. 5 PASTiS systems deployed in plots A and B. Two PASTiS systems were
deployed similarly at plot A and B, respectively, with sensors toward north at
57.5º view zenith angle. ............................................................................... 13
Fig. 6 Plant height (a) and diameter (b-c) measurement. For soybean, only one
number was read (b). Both long (c) and short (d) axes were read for maize.
...................................................................................................................... 14
Fig. 7 The ladder used for LAI-2200, AccuPAR and SmartLAI measurement in the
maize plots. .................................................................................................. 15
Fig. 8 Sample DHP downward images (upper panels) and the classified results by
CAN_EYE (lower panel) at the seedling stage at each plot. Green and brown
colors are for the plant and the soil, respectively. ........................................ 16
Fig. 9 Sample DHP images (upper panel) and the classification results (lower
panles). Green and cyan colors show the plant and the sky, respectively. ... 17
Fig. 10 PocketLAI images for maize (a-c), soybean (d-f) and sorghum (g-i) at
different growing stages. .............................................................................. 19
Fig. 11 Sample LAISmart downward looking images by the rear camera at the
seedling stage for maize, sorghum and sorghumt. The smartphone was placed
regularly above the ridge, the left side of the ridge, the right side of the ridge,

5
the middle of two ridges and vertical to the ridge (from left to right). ........ 21
Fig. 12 LAISmart upward looking images by the front camera for maize, sorghum
and sorghum. The smartphone was placed regularly at the left side of the ridge,
the middle of two ridges and the right side of the ridge. ............................. 22
Fig. 13 Measuring LAI using SmartLAI at the maize plot. A ladder was used to
reach the top of the canopy. The angle between the smartphone camera and
the horizontal plane was 45° ........................................................................ 23
Fig. 14 Measurement of the space between rows (a) and plants (b). ................... 24
Fig. 15 The PASTiS system. The picture was extracted from PASTiS User Guide
V2.0. ............................................................................................................. 25
Fig. 16 The composition of PASTiS and the sensors layout. The data loggerwith
two LR20 1.5V batteries (a)and a mini-USB port (b). The angle between two
sensors and the data logger is about 30 degrees (c). The sensors fixed on the
ground were distributed in the left, the right, and the middle of a ridge or the
middle of two rows. ..................................................................................... 26
Fig. 17 PASTiS data collection with a personal laptop through the micro-USB
connection (a) and the main interface of the data collection software (b). .. 27
Fig. 18 The modified (a, b) and original (c-e) LAIPhoto. A solar panel connected
to the LAIPhoto provides the power. The camera was attached above the
crops (a). The data transmitting device and the battery were stored in a
waterproof box (b). ...................................................................................... 28
Fig. 19 Calibration of the PASTIS sensors. More than 500 samplings of each
sensor were taken for calibration. ................................................................ 32
Fig. 20 Fallen leaves covering the ground at the soybean field (plot B). The
PASTiS sensors may be covered by fallen leaves. The PASTiS data logger
was covered with a white waterproof plastic bag (c). .................................. 33

6
List of Tables
Table 1. Structural variables derived from different instruments .......................... 9
Table 2. The crop type, location and instruments in each plot. .............................. 9
Table 3 Notes about LAI-2200 field measurements. ........................................... 29
Table 4 Additional notes about DHP measurements in the field campaign ......... 29
Table 5 Additional notes about the AccuPAR measurements in the field campaign
...................................................................................................................... 30
Table 6 Additional notes about the LAISmart measurements in the field campaign
...................................................................................................................... 31
Table 7 PASTiS calibration coefficients .............................................................. 32

7
1. Overview
Quantitative retrieval of vegetation structural parameters based on remote sensing
has been widely conducted. However, the validation of these products based on ground
measurement is still insufficient. Accurate estimation of vegetation structural
parameters, such as leaf area index (LAI), is important for its proper use of the
ecological, hydrological, and biogeochemical models, and helps to understand and
quantify the model uncertainties.
Several field LAI collection campaigns have been carried out in the paddy rice
fields over an entire growing season (Fang et al. 2014b; Sun et al. 2017), which provide
an independent and valuable dataset for the producers of remote sensing products and
model researchers. We further emphasize the necessity to carry out similar work in other
farmland ecosystems.
A field campaign was conducted at the Hailun cropland in northeast China from
mid-June to late September 2016. The objective of the field experiment is to collect
consistent structural parameters of farmland ecosystem for the validation of remote
sensing products. Five plots (A-E) from maize, soybean, and sorghum fields ) were
selected. A variety of observing instruments were used.
2. Materials and methods
2.1. Study area and sampling design
The study area is located in the western suburb of Hailun city (46°58′-47°52′N,
126°14′-127°45′E), northeast China. The city is mainly surrounded by farmland (Wang
et al. 2016). Maize and soybean are the most widely planted crops. The crops are
harvested once a year. The area has a cold temperate continental climate dominated by
the East Asian monsoon. The annual mean temperature is 2°C, with extreme
temperature ranging from −39.5°C to 37°C (Liu et al. 2013). Precipitation concentrates
from May to September, with the annual total precipitation ranges from 500 to 600 mm.
The main soil types are Luvic Phaeozem and Haplic Phaeozem (FAO classification) (Li
et al. 2016). The water and soil in this area are completely frozen from late October to
mid-May.
Five plots were chosen for repeated measurements (Fig. 1). Nine different

8
instruments were used, including three conventional optical instruments (LAI-2200
plant canopy analyzer (PCA), digital hemispheric photography (DHP) and AccuPAR
ceptometer), three smartphone applications (APPs) (PocketLAI, LAISmart and
SmartLAI), one destructive instrument (LI-3100C leaf area meter), and two Automatic
observation instruments (Pai Autonomous System from Transmittance Sensors
(PASTiS) and LAIPhoto) ( Table 1). DHP: Digital Hemispheric Photography; PASTiS:
Pai Autonomous System from Transmittance Sensors
Table 2 shows the detailed information about crop type, location and instruments
used in each plot. Fig. 2 shows a diagram of instruments. Fig. 3 shows the pictures for
different growing stages.
Fig. 1 Location of the study area l in the western suburb of the Hailun city, northeast China. The right
picture shows the position of five plots in a false color composite of a Landsat 8 image (path 118, row
027, Jun 2, 2016). Five plots (A-E) are marked. The crop was maize at plot A and D, soybean at plot B
and C, sorghum at plot E.

9
Table 1. Structural variables derived from different instruments
Parameters LAI-2200 DHP AccuPAR PocketLAI LAISmart SmartLAI LI-3000C PASTiS LAIPhoto
Leaf area index (LAI) √
Effective plant area index (PAIeff) √ √ √ √ √ √ √ √
Angular gap fraction √ √
Integrated gap fraction √ √ √
Fraction of vegetation cover (fCover) √ √ √
Clumping index (CI) √ √
Apparent clumping factor (ACF) √
Average leaf angle (ALA) √ √
Fraction of absorbed photosynthetically
active radiation (fPAR)
√
DHP: Digital Hemispheric Photography; PASTiS: Pai Autonomous System from Transmittance Sensors
Table 2. The crop type, location and instruments in each plot.
Plot Crop Location LAI-2200 DHP AccuPAR PocketLAI LAISmart SmartLAI LI-3000C PASTiS LAIPhoto
A Maize 126.838°E, 47.410°N √ √ √ √ √ √ √ √ √
B Soybean 126.838°E, 47.405°N √ √ √ √ √ √ √ √ √
C Soybean 126.805°E, 47.401°N √ √ √ √ √ √
D Maize 126.798°E, 47.409°N √ √ √ √ √ √
E Sorghum 126.801°E, 47.429°N √ √ √ √ √ √

10
Fig. 2 An illustration of all instruments used in the field campaign. (a) LAI-2200; (b) LI-3000C (c) DHP; (d) AccuPAR; (e) PocketLAI; (f) SmartLAI; (g) LAISmart; (h)
LAIPhoto; (i) PASTiS.

11
Fig. 3 Different crop growing stages in plots A to E (left to right) for seedling (top row), flowering (middle row) and maturity (bottom row) stages in 2016. .

12
The plots are flat and homogeneous and more than 100 × 500 m2 in size. Three 20
× 20m Elementary Sampling Units (ESUs) were set within each plot. ESUs at the same
plot located in one row (plot A, B and C) or at the three vertices of a triangle (plot D
and E). ESUs were at least 5 m away from the field borders. ESU-level sampling was
performed uniform (DHP and smartphone APPs) or at the four corners and one at the
center (AccuPAR and LAI-2200) (Fig. 4). Two PASTiS systems apiece were deployed
in plots A and B within two ESUs separately (Fig. 5). The PASTiS sensors were oriented
toward the northat 57.5º view zenith angle.
Ground LAI measurements were continuously carried out from June 20 (day of
year (DOY) 172) to September 22 (DOY 266), 2016. Each plot was measured at
approximate 1-week interval. The interval was adjusted in rainy day. To diminish the
retrieval errors caused by direct light, the measurements were mainly carried out close
to sunset or sunrise or under overcast conditions (Fang et al. 2014a).
The traditional optical instruments and smartphone Apps were used at all five plots.
LI-3100C and two automatic observation instruments were used only at plots A and B.
Five plants were randomly selected in an ESU and cut off the ground for destructive
measurement each week. Three ESUs were chosen sequentially for destructive
measurement in order to reduce the impact of damage on other measurements. Plant
height and diameter at about 5 cm above the ground were recorded with a tape and
vernier caliper before harvesting (Fig. 6). Because the maize stem is close to a elliptic
cylinder, both the long and short axis diameters were measured. Two PASTiS systems
and one LAIPhoto were set at plot A and B respectively. The PASTiS systems were
located at two different ESUs. The LAIPhoto and one of the PASTiS were in the same
ESU.

13
Fig. 4 Diagram of sampling strategies in each 20×20 m Elementary Sampling Units (ESU). (a) AccuPAR
and LAI-2200 were used at the four corners and the center. (b) Regular sampling for DHP and PocketLAI,
LAIsmart and SmartLAI, totally 16 sample points.
Fig. 5 PASTiS systems deployed in plots A and B. Two PASTiS systems were deployed similarly at plot
A and B, respectively, with sensors toward north at 57.5º view zenith angle.

14
Fig. 6 Plant height (a) and diameter (b-c) measurement. For soybean, only one number was read (b).
Both long (c) and short (d) axes were read for maize.
2.2. LAI-2200 plant canopy analyzer
LAI-2200 estimates the canopy plant area index (PAI) because all parts of the plant
including green leaves, yellow leaves, stems and seeds contribute to the light

15
transmittance process in the canopy (Fang et al. 2014b). Ground measurements follow
the LAI-2200 instruction manual for row crops (LI-COR 2012). Two repeats were taken
for each sampling point with one above and four below canopy readings. Before the
seedling stage, significant gaps exist and a 90° view cap was used to minimize the
measurement errors. After July 1 (DOY 183), large gaps between rows had disappeared.
A 270° view cap was used to shield the sensor from the operator (Fang et al. 2014b).
When the maize canopy was high enough, a ladder was used for the above readings.
The ladder has 6 layers and the top layer is 1.7 m beyond the ground (Fig. 7). The
optical sensor was about 5 cm above ground for the below canopy readings.
Fig. 7 The ladder used for LAI-2200, AccuPAR and SmartLAI measurement in the maize plots.
2.3. Digital hemispherical photography (DHP)
The DHP images were taken by a Nikon D5100 camera with a 4.5 mm F2.8 EX
DC circular fisheye convertor. An ultraviolet cap was covered on the lens to prevent
dust and water. The total height of the camera and lens was about 16.5 cm. Two bubble

16
levels were attached to the camera to keep it horizontal for both downward and upward
viewing. The DHP camera was calibrated according to the CAN_EYE manual (version
6.313) (Weiss and Baret 2014).
Sixteen pictures were captured in each ESU. Before the seedling stage, photos
were taken downward (Fig. 8). The distance between crop canopy and the camera was
kept greater than 50 cm to ensure a large enough field of view. After July 1 (DOY 183),
all the photos were taken upward (错误!未找到引用源。). At that time, the soybean
and sorghum are higher than 30 cm, while the maize is higher than 70 cm. The camera
was close to the ground at the soybean and sorghum plots. At the maize plots, the
distance between the ground and camera was gradually increased as the maize grows
higher with the maximum distance no more than 30 cm. The camera was carefully
operated to minimize the operator impact.
The aperture size and shutter speed were manually adjusted according to the
illumination conditions. All the DHP photos were taken in a fixed azimuth angle to the
row directions, which allowed us to examine the impact of viewing angle on the
clumping index (CI) (Fang et al. 2014b; Weiss et al. 2004). The Photos were stored in
the JPEG format at a resolution of 3264 х 4928 pixels. All valid photos for each ESU
were processed by the CAN_EYE software (version 6.3.13) to obtain the structural
parameters of crops. The resolutions of zenith and azimuth angle were both set at 2.5°.
One operator performed all the classification procedures to minimize the subjective
errors.
Fig. 8 Sample DHP downward images (upper panels) and the classified results by CAN_EYE (lower
panel) at the seedling stage at each plot. Green and brown colors are for the plant and the soil, respectively.

17
Fig. 9 Sample DHP images (upper panel) and the classification results (lower panles). Green and cyan
colors show the plant and the sky, respectively.
2.4. AccuPAR ceptometer
AccuPAR (Decagon Devices, Inc., model LP-80 PAR/LAI ceptometer) measures
photosynthetically absorbed radiation (PAR). It uses 80 individual sensors on its probe
with a 180° field of view. It measures the radiation by locating the probe above and
beneath the canopy and then calculate the percentage of transmittance. Before
measurement, AccuPAR was calibrated according to the instruction manual (Decagon
Devices 2016).
At each sampling point, AccuPAR was designed to measure the canopy reflectance,
canopy transmittance, and soil reflectance continually. For the canopy transmittance
measurement, one above reading and four below readings were recorded with the probe
always towards the sky. For the four beneath readings, the probe was placed at about 5
cm above the ground in four different directions subsequently. The probe directions
were 45° to the row direction to minimize the row effects according to the manual
(Decagon Devices 2016). For the canopy reflectance measurement, the four beneath
readings were replaced with readings at canopy level but with probe against the sky,
that is towards the top of canopy. For the soil reflectance measurement, the four beneath
readings were recorded with the probe towards the soil.
Additionally, we repeated the AccuPAR measurements at plots A and B in direct
light condition. These measurements were carried out from 10 AM to 4 PM on clear
days. When the maize canopy was high enough, a ladder was used for the above
readings.

18
2.5. PocketLAI
PocketLAI is a smartphone APP developed for estimating LAI. Its algorithm is a
simplified light transmittance model based on the assumption of a random spatial
distribution of infinitely small leaves (Confalonieri et al. 2013). The gap fraction
0( , )vP can be estimated as:
0 ( , ) exp ( , )cos( )
v v
LAIP G
where is the zenith angle, v is the azimuth angle, and ( , )vG is the
projection function. The mean projection of a unit foliage area in the direction ( , )v
depends on the leaf angle distribution of the canopy. However, the G-function can be
considered as almost independent for leaf inclination (G ≌ 0.5) for a view angle of
57.5° (Weiss et al. 2004). So the LAI can be obtained from the gap fraction measured
at 57.5°.
0
cos(57.5 )log( (57.5 ))
0.5LAI P
The specific PocketLAI instructions have been well documented (Confalonieri et
al. 2013). In this field work, PocketLAI was installed on a Redmi Note 3, with a Hexa-
Core 1.8GHz processor and 3 GB RAM. The images taken by the smartphone were set
to standard quality with a resolution of 1920 х 1080 pixels. The output LAI value is an
average of a number of four shots.. Fig. 10 shows the images taken by PocketLAI for
maize, soybean and sorghum at different growing stages. The images are blurred during
the camera tilting process. We held the smartphone vertically with the bottom main axis
about 5 cm above the ground and the rear camera 10 cm to the plant, then rotated the
device along its main axis starting with the display orientated downward until the angle
between the vertical and the normal to the screen reaches 57.5°. The distance between
ground and the bottom main axis of the smartphone was gradually increased as the
crops grow higher. But the maximum distance was no more than 20 cm for soybean and
sorghum and 30 cm for maize.

19
Fig. 10 PocketLAI images for maize (a-c), soybean (d-f) and sorghum (g-i) at different growing stages.
2.6. LAISamrt
LAISmart is developed to estimate the LAI based on the Beer gap fraction model
under the hypothesis of random distribution of leaves (Qu et al. 2016). Canopy gap P(θ)
can be estimated by:
( ) /cos( ) G LAIP e
Then,
ln ( )cos / ( )LAI P G
where θ is the zenith angle, G(θ) is the projection of the unit foliage area on the
plane perpendicular to the view angle.
The distribution function of the leaf angle could be approximated by a spherical
distribution, and the G(θ) (≌ 0.5) is independent to the viewing angle of the sensor
in such situations. Taken this assumption, LAI can be calculated by:
2ln ( )cosLAI P
where θ can be read from the gyro attitude sensor. P(θ) is equal to the proportion
of background pixels in the image.
LAISmart was installed on the same smartphone as PocketLAI. The software is
developed by Beijing Normal University, China. The system language is only Chinese

20
currently. Similar to PocketLAI, LAISmart, saves the photos in the cellphone memory
and gives the estimated LAI values. At the seedling stage, photos were taken downward
through the rear camera with a resolution of 1920 х 1080 pixels. The image
segmentation feature was set to greenness index (GI) to segment the vegetation and soil.
The distance between crop canopy and the smartphone was kept greater than 50 cm to
ensure a large enough field of view. In order to reduce the sampling error, the cellphone
was placed regularly above the ridge, the left side of the ridge, the right side of the ridge,
the middle of two ridges and vertical to the ridge (Fig. 11).
After July 1 (DOY 183), photos were taken upward at the maize plots by the front
camera with a resolution of 960 х 540 pixels. The image segmentation feature was set
to the blue band to segment the vegetation and sky. After July 6 (DOY 188), the upward
looking model was used for all the five plots. The smartphone was about 5 cm above
the ground at the soybean and sorghum plots. At the maize plots, the distance between
ground and smartphone was gradually increased as the maize grows higher. But the
maximum distance was no more than 30 cm. To reduce the sampling error, the cellphone
was placed regularly at the left side of the ridge, the middle of two ridges and the right
side of the ridgen (Fig. 12). However, no significant difference was observed from the
photos.

21
Fig. 11 Sample LAISmart downward looking images by the rear camera at the seedling stage for maize,
sorghum and sorghumt. The smartphone was placed regularly above the ridge, the left side of the ridge,
the right side of the ridge, the middle of two ridges and vertical to the ridge (from left to right).

22
Fig. 12 LAISmart upward looking images by the front camera for maize, sorghum and sorghum. The
smartphone was placed regularly at the left side of the ridge, the middle of two ridges and the right side
of the ridge.
2.7. SmartLAI
SmartLAI is still in the development stage. The system language is only French
currently. SmartLAI was designed to estimate the wheat LAI. The pictures were taken
perpendicular to the row direction at a zenith angle of 45° (Fig. 13). The distance
between crop canopy and the smartphone was kept greater than 50 cm to ensure a large
enough field of view. The pictures were not stored in the smartphone but sent to a
remote developer server for LAI calculation. Four successive pictures were combined
to obtain one LAI value.

23
Fig. 13 Measuring LAI using SmartLAI at the maize plot. A ladder was used to reach the top of the
canopy. The angle between the smartphone camera and the horizontal plane was 45°
2.8. LI-3100C leaf area meter
Five plants were randomly harvested in a plot. All the five plants were cut from
one ESU. The three ESUs were taken turn in harvest. The plants were cut off, put in a
plastic bag and taken to laboratory. Branches and yellow leaves were not measured.
Only green leaves were scanned by LI-3100C leaf area meter (LI-COR: Lincoln,
Nebraska, U.S.). The scanning work was usually completed within three hours after the
harvest. If the yellow parts in a leaf were mixed with green parts and difficult to separate,
the proportion of the yellow portion to the single leaf area was estimated.
Plant height and stem diameter at about 5 cm above the ground were measured
before harvesting. The cross section of the maize stem is considered as an oval and both
the short and long axes were measured. The cross section of the soybean stem is treated
as a circle and the diameter was recorded. The maize and soybean were considered as
a cone and a cylinder respectively. The mean value of short and long axes was regarded
as the diameter of the bottom surface.
The stem area of maize was estimated as:
24
2
2
2 2
a b a bs h
S is the area of plant stem side area (cm2), a and b is the length of the long and
short axes (cm), and h is the plant height (cm).
The stem area of soybean wass estimated as:
s d h
S is the area of plant steam area (cm2), and h is the plant height (cm).
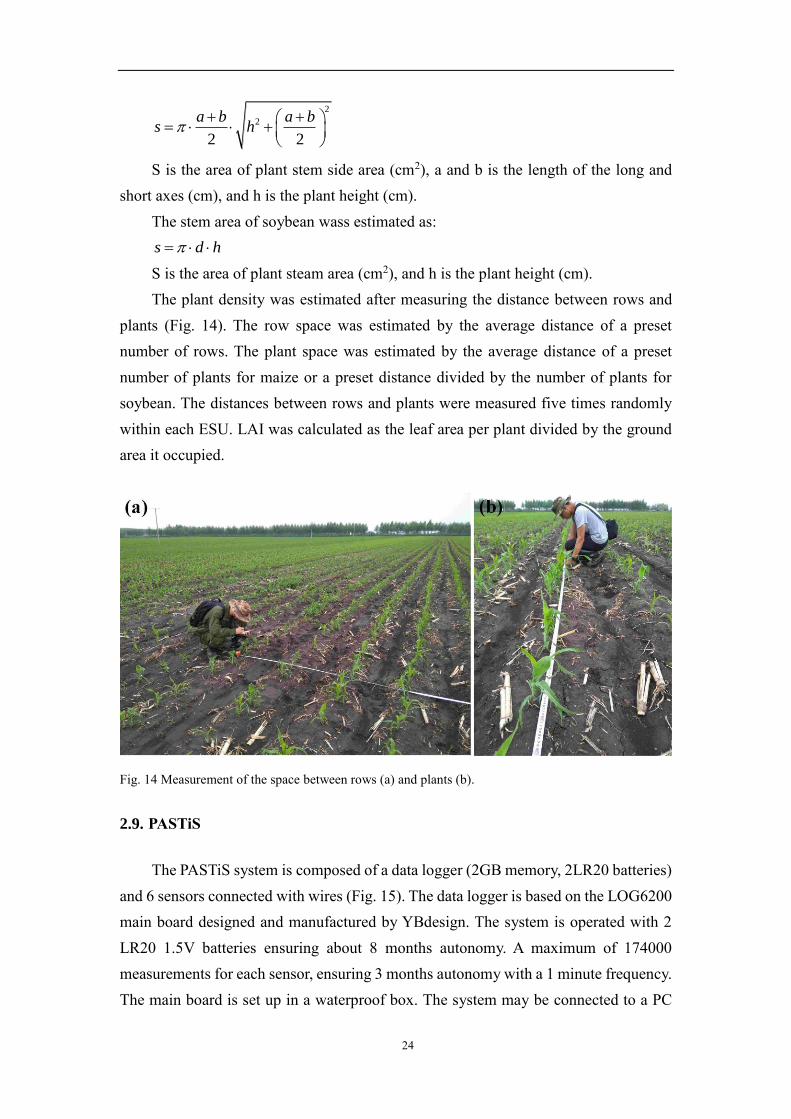
The plant density was estimated after measuring the distance between rows and
plants (Fig. 14). The row space was estimated by the average distance of a preset
number of rows. The plant space was estimated by the average distance of a preset
number of plants for maize or a preset distance divided by the number of plants for
soybean. The distances between rows and plants were measured five times randomly
within each ESU. LAI was calculated as the leaf area per plant divided by the ground
area it occupied.
Fig. 14 Measurement of the space between rows (a) and plants (b).
2.9. PASTiS
The PASTiS system is composed of a data logger (2GB memory, 2LR20 batteries)
and 6 sensors connected with wires (Fig. 15). The data logger is based on the LOG6200
main board designed and manufactured by YBdesign. The system is operated with 2
LR20 1.5V batteries ensuring about 8 months autonomy. A maximum of 174000
measurements for each sensor, ensuring 3 months autonomy with a 1 minute frequency.
The main board is set up in a waterproof box. The system may be connected to a PC

25
under windows with a USB port for programming the acquisition or downloading the
data. The clock is synchronized with that of the PC, with a programmable shift. The
frequency of acquisition is 1, 5 or 10 minutes.
Fig. 15 The PASTiS system. The picture was extracted from PASTiS User Guide V2.0.
The sensors are based on LEDs sensitive to the blue spectral domain, allowing to
minimize the effect of the illuminations conditions. As a matter of fact, the sky is
relatively bright in the blue domain because of the Rayleigh and aerosol scattering.
Conversely, vegetation elements show very low values of reflectance and transmittance
in this spectral domain where absorption by pigments and several molecules is very
high. The contrast between the sky and the vegetation elements will be therefore
maximal in this domain. The field of views of the LEDs are restricted to ±22° at HWHM
(Hal Width at Half Maximum) to avoid signals from below the horizon. The sensors are
oriented at 57.5° towards the north, which allows to minimize the effect of the
illumination conditions (the sun never enters the field of view of the sensor), as well as
the effect of leaf angle distribution and clumping. The sensors are equipped with a nail
allowing fixing it directly in the soil.
The PASTiS systems allow monitoring the canopy fraction of fPAR and PAI. Two
systems were deployed at plots A and B, respectively. Eleven sensors were fixed
directly in the soil, and the other one was set up at the top of an iron pipe attached with
a solar panel. The solar panel provided power to LAIPhoto. All the sensors were
towards north to avoid the direct sunlight. The sensors fixed on the ground were

26
distributed regularly between row. . The angle between two sensors and the host is about
30 degrees. Fig. 15 shows the layout of the PASTiS.
The frequency of measurements was set to 10 minutes. All the systems were set
up with the same PC, allowing for synchronous measurements (Fig. 17). However,
some slight shift of the clocks of the systems may be observed and should be corrected
for.
Fig. 16 The composition of PASTiS and the sensors layout. The data loggerwith two LR20 1.5V batteries
(a)and a mini-USB port (b). The angle between two sensors and the data logger is about 30 degrees (c).
The sensors fixed on the ground were distributed in the left, the right, and the middle of a ridge or the
middle of two rows.

27
Fig. 17 PASTiS data collection with a personal laptop through the micro-USB connection (a) and the
main interface of the data collection software (b).
2.10. LAIPhoto
LAIPhoto was still in the development stage. LAIPhoto is developed to monitor
the vegetation growth continuously by taking pictures every 30 minutes. LAIPhoto is
composed of an imaging system and a data transmission system. The imaging system
is like a waterproof RGB camera . The quality of the picture taken by the camera is 640
х 480 pixels. The data transmission system sends the data to the remote server over the
wireless network. The LAIPhoto is powered by 220 V alternating current. In order to
use the LAIPhoto in the field, it was connected to a solar panel (Fig. 18). The downward
looking camera was attached on the top of an iron pipe. The pipe was about 3.5 m and
2.5 high at the maize and soybean plots, respectively. Although some images were
transferred back to the laboratory, most of the data was lost and unusable due to
unknown reasons.

28
Fig. 18 The modified (a, b) and original (c-e) LAIPhoto. A solar panel connected to the LAIPhoto
provides the power. The camera was attached above the crops (a). The data transmitting device and the
battery were stored in a waterproof box (b).
3. Quality assurance
The plots are homogeneous and more than 100×500 m2 in size. Each plot is located
away from the road and ditches. Because the five pieces of farmland belong to different
owners, the crop varieties and field management may be different. Though the crop
types were both maize at plots A and D, the maize at plot A was half a meter higher than
that at plot D. No chemical fertilizers and pesticides were applied at the sorghum fields
(plot E).
The measurements were usually carried out once a week. Although efforts were
tried to ensure the completeness and reliability of the measurement, there were some
data gaps and uncontrollable errors. In general, the data qualities of LAI-2200, DHP,
AccuPAR, PocketLAI, LAISmart, LI-3100C, and PASTiS are more reliable than those
of the SmartLAI and LAIPhoto.

29
3.1. LAI-2200
A 90° view cap was generally used before July 1 and a 270° view cap was used
after that day. Five repeats were made in each ESU. Several data gaps occurred due to
cap missing or battery die out (Table 3).
Table 3 Notes about LAI-2200 field measurements.
Date Plot Crop Notes
Jul, 1 D Maize Only four repeats were made in ESU 2.
Jul, 30 D Maize The last two data in ESU 3 were deleted because of weak
illumination after sunset.
Aug, 15 A Maize Only ESU 1 were measured due to the data logger failure for other
ESUs.
Aug, 22 A Maize Four repeats were made in ESU 2 but no measurement in ESU 3 due
to cap missing.
Aug, 30 A Maize No cap used in the fifth record in ESU 3 due to cap missing.
Sep, 20 D Maize A 180° view cap was used due to the missing of the 270° view cap
3.2. DHP
Sixteen pictures were generally taken in each ESU. Photos were taken downward
before July 1 and upward after that. The blue color of sky light is similar with the green
color of leaves, which increases the classification difficulty. Other notes are shown in
Table 4.
Table 4 Additional notes about DHP measurements in the field campaign
Date Plot Crop Notes
Jun, 26 B Soybean Illumination was darker than normal.
Jun, 28 A Maize Some pictures were slightly blurry.
Jul, 4 A Maize Pictures were blurry because of suboptimalfocal length.
Jul, 18 A Maize Fifteen pictures were taken in ESU 1.
Jul, 30 D Maize The illumination of the pictures in ESU 3 were darker.
Aug, 5 D Maize Pictures had water shadows due to the rain.
Aug, 31 C Soybean Twelve pictures were taken in each ESU.
3.3. AccuPAR
Five repetitions were made in each ESU. At each sampling point, we measured the
canopy reflectance, canopy transmittance, and soil reflectance subsequently. Under

30
diffuse light condition, the illumination intensity maybe too weak for soil reflectance
measurement. TThe moving clouds also bring unstable light conditions, although we
tried to avoid the situation as far as possible.
All measurements were made with one above and four below readings, except for
some unusual conditions (Table 5).
Table 5 Additional notes about the AccuPAR measurements in the field campaign
Date Plot Crop Notes
Diffuse light condition
Jun, 21 D Maize One above and five bellow readings were recorded when the third
soil reflectance was measured in the ESU 1.
Jul, 1 D Maize After the first ESU measurement, the light was not stable.
Jul, 8 E Sorghum One above and three bellow readings were recorded when the first
soil reflectance was measured in the ESU 1.
The light is not stable.
Jul, 30 D Maize The reading is lower, especially in ESU 3, because the
measurement started too late.
Sep, 15 D Maize One above and two bellow readings were recorded when the first
canopy reflectance was measured in the ESU 3.
One above and three bellow readings were recorded when the fifth
canopy reflectance was measured in the ESU 3.
Sep, 20 D Maize One above and three bellow readings were recorded when the third
and fifth canopy reflectance was measured in the ESU 3.
Direct light condition
Jul, 21 A Maize Cloudy with unstable light condition.
Jul, 21 B Soybean Cloudy with unstable light condition.
Jul, 26 A Maize One above and five bellow readings were recorded when the first
soil reflectance was measured in the ESU 2.
3.4. PocketLAI
Sixteen repetitions were made in each ESU. The essential factors influencing the
LAI value are the crop density and distance between the camera and the crop plant. We
kept the rear camera 10 cm to the plant in measurements.
3.5. LAISmart
Sixteen repetitions were made in each ESU. Photos were taken downward before
July 1 and upward after that at the maize plots. After July 6, the upward model was
chosen at all plots. In the upward model, the camera position may influence the LAI

31
value. The smartphone was sequentially put in the 1/2 and 1/4 positions between two
rows or in the middle of the rows to minimize the error. In several times, the camera
failed, possibly due to software bug, and only gave a pure green picture.
Table 6 Additional notes about the LAISmart measurements in the field campaign
Date Plot Crop Notes
Aug, 25 E Sorghum One repeat measurement in ESU 2 failed.
Sep, 3 E Sorghum One repeat measurement in ESU 2 failed.
Sep, 9 D Maize One repeat measurement in ESU 3 failed.
3.6. SmartLAI
The SmartLAI requires a 45° angle between the smartphone display and the zenith,
which means only downward model can be used when taking pictures. As the crops
grow, the gaps between the rows become smaller. Taking pictures downwards increases
the classification difficulty. Additional, it is very difficult to measure tall vegetation. At
plot A, when the maize height was close to 3 m (after Jul, 25), the measurements were
made by standing on a 1.7 m ladder. In this case, the distance between crop top and the
smartphone may be less than the required 50 cm.
Unfortunately, the SmartLAI data must be sent to the developer server to calculate
LAI calculation. Four repeats were made in each ESU during the measurement.
However, many data were lost permanently due to the data uploading failure,.
3.7. LI-3100C
Green leaves were scanned by LI-3000C, without branch and yellow leaves. The
scanning work was done within three hours after the crops being cut off in order to
avoid the occurring of leaf area shrinking caused by tissue water loss.
3.8. PASTiS
The readings were calibrated using the sensor calibration parameters supplied by
the developer (Table 7). More than 500 samplings of each sensor were taken for the
calibration. The results of calibration are shown in Fig. 19 (R2 = 1, RMSE = 5.23).
Although the PASTiS has a waterproof box, water can still penetrates from the
wire outlet in heavy rains. The mini-USB connecions are located inside the box, not
convenient for computer connection. The inner clock of the PASTiS also had a little

32
shift.
At the soybean plot, fallen leaves occurred during the entire growing season,
especially from the flowering stage to the senescence stage. Dense leaves may occasionally cover
the sensors ( Fig. 20).
Table 7 PASTiS calibration coefficients
ID Sensor 1 Sensor 2 Sensor 3 Sensor 4 Sensor 5 Sensor 6
189 0.8293 0.8614 0.9146 1.1557 0.8740 0.4926
197 1.1478 1.3647 1.0346 1.0148 0.9946 0.4903
252 1.0441 0.9899 1.2885 1.3266 1.5548 0.5498
268 0.9323 0.8978 1.0026 1.0812 1.4170 0.7234
Fig. 19 Calibration of the PASTIS sensors. More than 500 samplings of each sensor were taken for
calibration.

33
Fig. 20 Fallen leaves covering the ground at the soybean field (plot B). The PASTiS sensors may be
covered by fallen leaves. The PASTiS data logger was covered with a white waterproof plastic bag (c).
3.9. LAIPhoto
The LAIPhoto was fixed on a pipe top and powered by a solar panel. The position
of the camera may shift under strong wind.
The picture was supposed to be sent back to the lab every 30 minutes. However,
most data were lost due to the instability of the network and the server failure.

34
Reference
Confalonieri, R. et al., 2013. Development of an app for estimating leaf area index using
a smartphone. Trueness and precision determination and comparison with other
indirect methods. Computers and Electronics in Agriculture, 96: 67-74.
Decagon Devices, I., 2016. AccuPAR PAR/LAI Ceptometer Model LP-80 Operator’s
Manual. Decagon Devices, Inc., NE Hopkins.
Fang, H., Li, W., Wei, S., Sun, T. and Jiang, C., 2014a. Paddy Rice Experiment in the
Sanjiang Plain (PRESP). Field Measurements Report.
Fang, H.L., Li, W.J., Wei, S.S. and Jiang, C.Y., 2014b. Seasonal variation of leaf area
index (LAI) over paddy rice fields in NE China: Intercomparison of destructive
sampling, LAI-2200, digital hemispherical photography (DHP), and AccuPAR
methods. Agr Forest Meteorol, 198: 126-141.
LI-COR, I., 2012. LAI-2200 Plant Canopy Analyzer Instruction Manual. LI-COR, Inc,
Lincoln, NE.
Li, L.J. et al., 2016. Change in soil organic carbon between 1981 and 2011 in croplands
of Heilongjiang Province, northeast China. J Sci Food Agr, 96(4): 1275-1283.
Liu, S. et al., 2013. Modelling crop yield, soil water content and soil temperature for a
soybean-maize rotation under conventional and conservation tillage systems in
Northeast China. Agr Water Manage, 123: 32-44.
Qu, Y., Meng, J., Wan, H. and Li, Y., 2016. Preliminary study on integrated wireless
smart terminals for leaf area index measurement. Computers and Electronics in
Agriculture, 129: 56-65.
Sun, T., Fang, H.L., Liu, W.W. and Ye, Y.C., 2017. Impact of water background on
canopy reflectance anisotropy of a paddy rice field from multi-angle
measurements. Agr Forest Meteorol, 233: 143-152.
Wang, J. et al., 2016. Size distributions and health risks of particulate trace elements in
rural areas in northeastern China. Atmos Res, 168: 191-204.
Weiss, M. and Baret, F., 2014. CAN-EYE V6.313 USER MANUAL.
Weiss, M., Baret, F., Smith, G.J., Jonckheere, I. and Coppin, P., 2004. Review of
methods for in situ leaf area index (LAI) determination Part II. Estimation of LAI,
errors and sampling. Agr Forest Meteorol, 121(1-2): 37-53.