Hail diagnosis from radar + NSE. The formation of large hail requires long hailstone residence times...
16
Hail diagnosis from radar + NSE
-
Upload
muriel-berry -
Category
Documents
-
view
229 -
download
0
Transcript of Hail diagnosis from radar + NSE. The formation of large hail requires long hailstone residence times...

Hail diagnosis from
radar + NSE

The formation of large hail requires longhailstone residence times in regions of largesupercooled liquid water content in the primary hail growth layer between -10°C to -30°Cfollowed by minimal melting of the fully grown hailstones on the way to the ground.
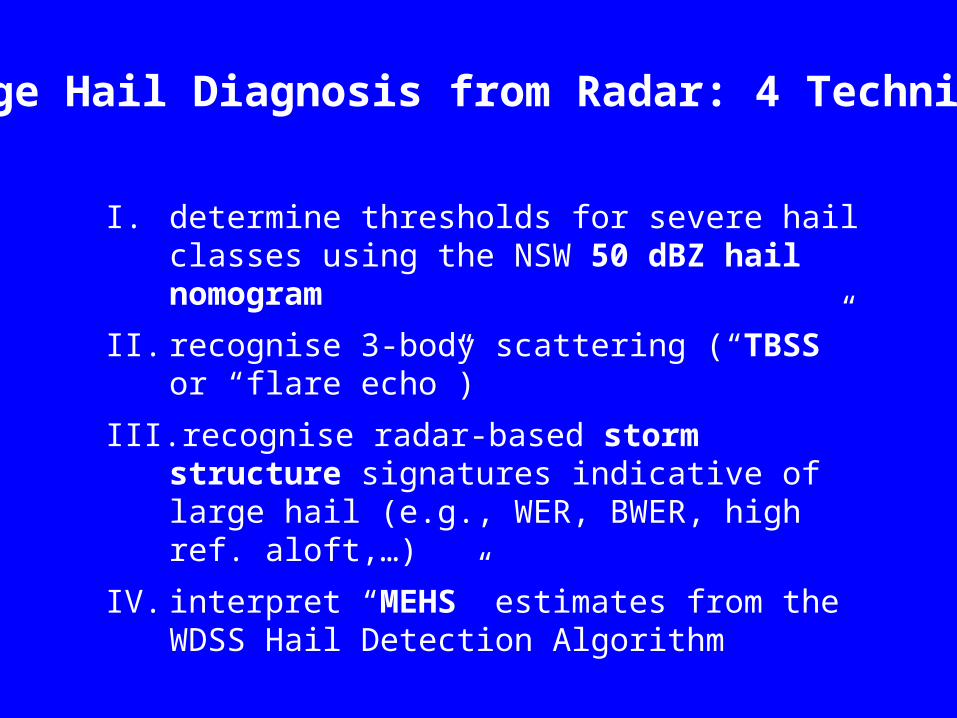
I. determine thresholds for severe hail classes using the NSW 50 dBZ hail nomogram
II. recognise 3-body scattering (“TBSS” or “flare echo”)
III. recognise radar-based storm structure signatures indicative of large hail (e.g., WER, BWER, high ref. aloft,…)
IV. interpret “MEHS” estimates from the WDSS Hail Detection Algorithm
Large Hail Diagnosis from Radar: 4 Techniques
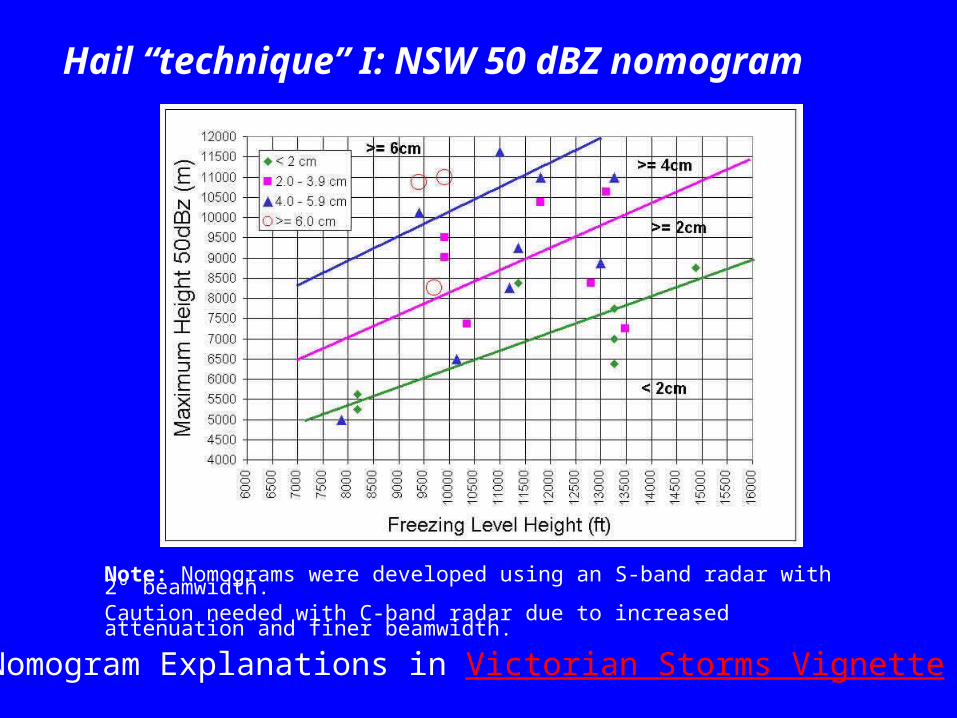
Hail “technique” I: NSW 50 dBZ nomogram
Note: Nomograms were developed using an S-band radar with 2° beamwidth.Caution needed with C-band radar due to increased attenuation and finer beamwidth.
Nomogram Explanations in Victorian Storms Vignette
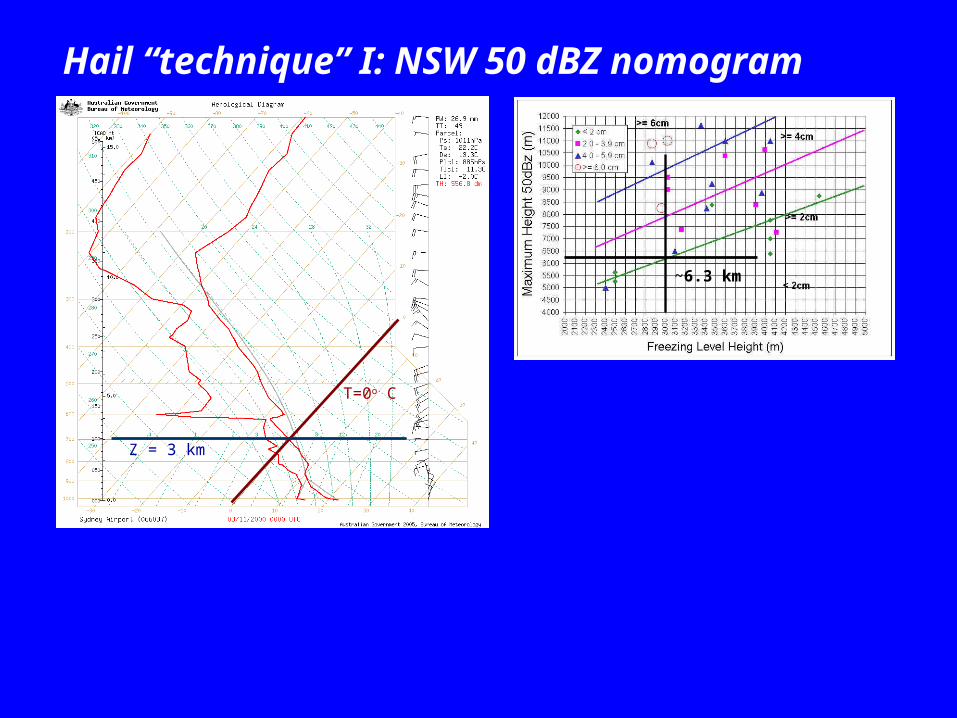
Hail “technique” I: NSW 50 dBZ nomogram
T=0o C
Z = 3 km
~6.3 km

TBSS Examples: Sydney S-band radar (WSR74S, 2°beam width)
28 Oct 1999, 0625 UTC
8cm hail reported
II. S-Band Three-Body Scatter Spike (TBSS)
• Also known as “Hail Flare” or “Flare echoes”
• a 10-30 km long low reflectivity (< 20 dBZ) mid-level echo “spike” aligned radially downrange from a high reflectivity (63 dBZ+) core
• On C-band radars TBSS can be related to large raindrops rather than hail
• TBSS is a sufficient (but NOT necessary) condition for large hail detection

TBSS Examples: Sydney S-band radar (WSR74S, 2°beam width)
Radarradial
14 Apr 1999, 0930 UTC
At least 9cm hail
II. S-Band Three-Body Scatter Spike (TBSS)
• surface hail of at least 2.5 cm diameter should be expected when a TBSS is observed (on S-band)
• TBSS provides warning lead time (for the largest surface hail) of 10-30 minutes
• References: Lemon (WAF 1998) ; Zrnic (Radio Sci. 1987); Wilson and Reum (J. Atmos. Ocean Tech. 1988)

• radar beam strikes the intense hail core and energy is forward-scattered towards the ground
• energy then scattered back from wet ground to the hail core where it is forward-scattered back to radar
II. Three-Body Scatter Spike (TBSS)
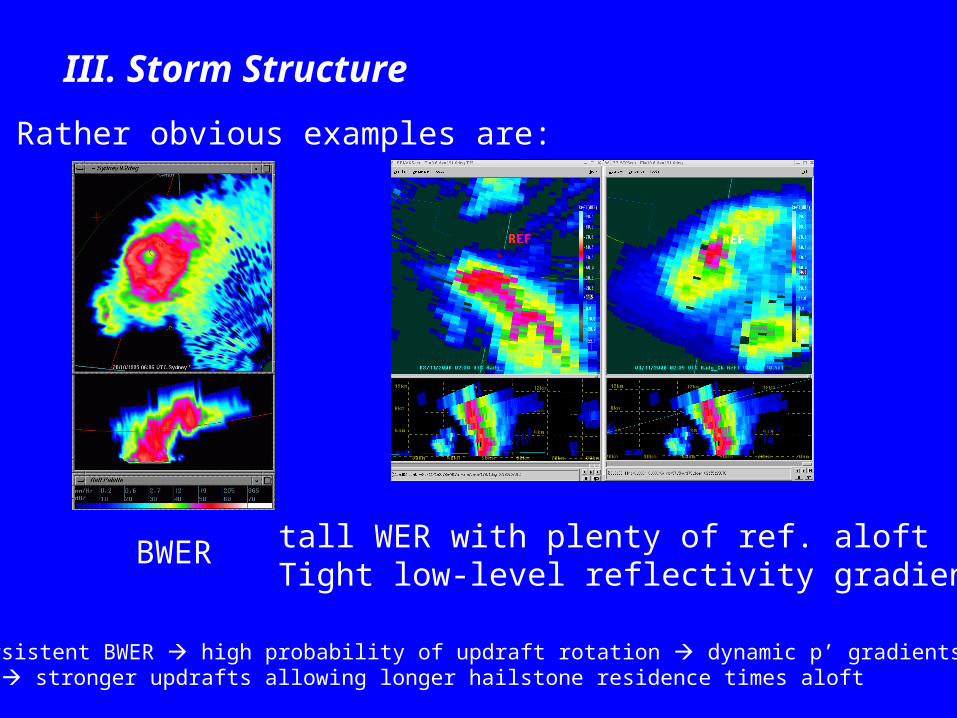
III. Storm Structure
Rather obvious examples are:
BWER tall WER with plenty of ref. aloftTight low-level reflectivity gradient
Note: persistent BWER high probability of updraft rotation dynamic p’ gradients augmentBuoyancy stronger updrafts allowing longer hailstone residence times aloft
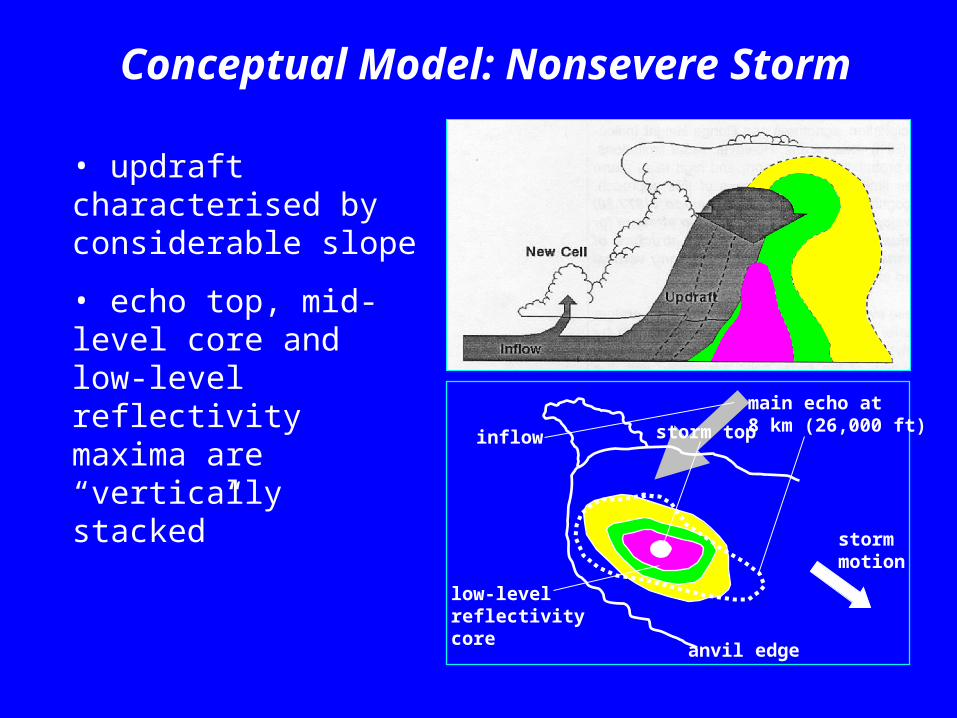
• updraft characterised by considerable slope
• echo top, mid-level core and low-level reflectivity maxima are “vertically stacked”
Conceptual Model: Nonsevere Storm
main echo at 8 km (26,000 ft)
low-levelreflectivitycore
storm top
anvil edge
stormmotion
inflow

• updrafts become more vertical as they strengthen
• Weak Echo Region (WER) on inflow side marks region of strongest updraft
• echo top aligned over low-level reflectivity gradient on inflow side (“echo top displacement” with echo top located on top of updraft/downdraft interface)
Conceptual Model: Severe Storm
main echo at 8 km (26,000 ft)
low-levelreflectivitycore
storm top
anvil edge
WER
stormmotion
inflow
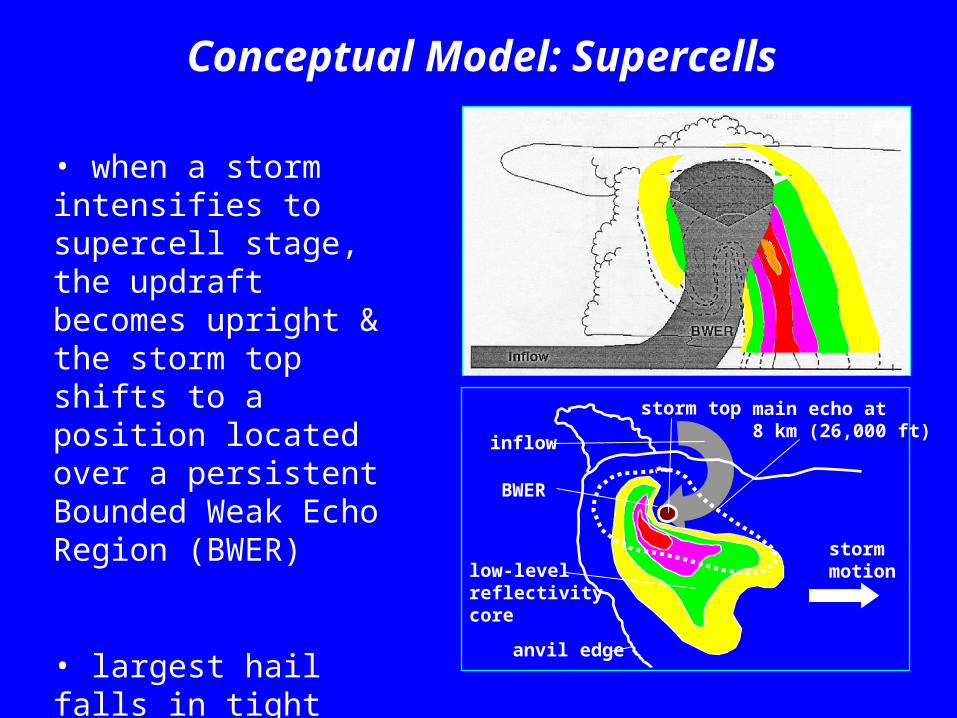
Conceptual Model: Supercells
main echo at 8 km (26,000 ft)
low-levelreflectivitycore
storm top
anvil edge
BWER
stormmotion
inflow
• when a storm intensifies to supercell stage, the updraft becomes upright & the storm top shifts to a position located over a persistent Bounded Weak Echo Region (BWER)
• largest hail falls in tight reflectivity gradient next to BWER
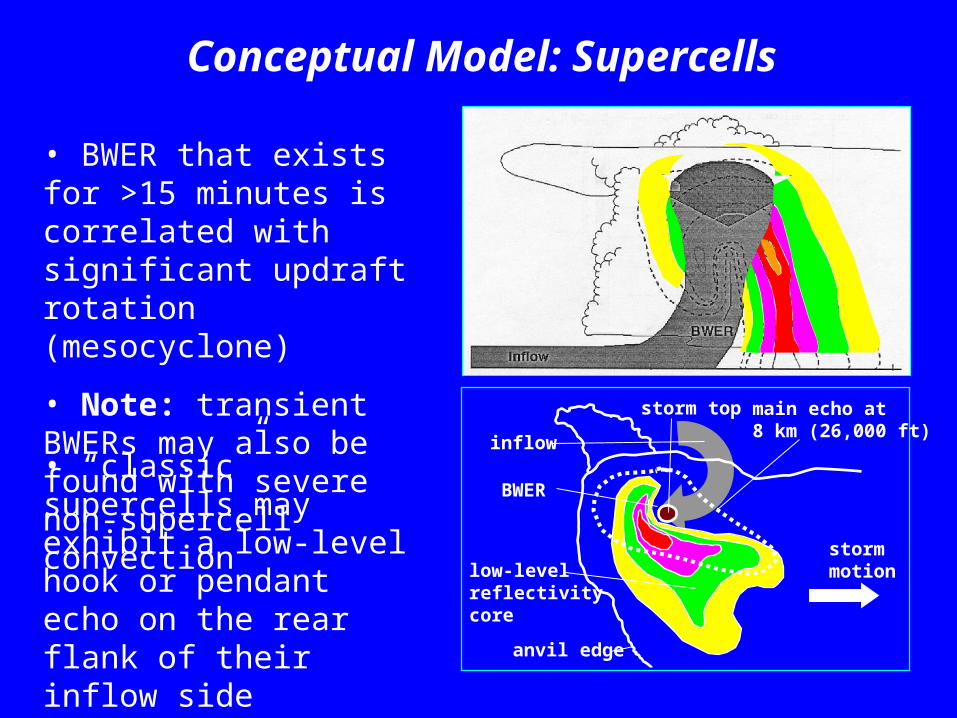
main echo at 8 km (26,000 ft)
low-levelreflectivitycore
storm top
anvil edge
BWER
stormmotion
inflow
• BWER that exists for >15 minutes is correlated with significant updraft rotation (mesocyclone)
• Note: transient BWERs may also be found with severe non-supercell convection
• “classic” supercells may exhibit a low-level hook or pendant echo on the rear flank of their inflow side
Conceptual Model: Supercells
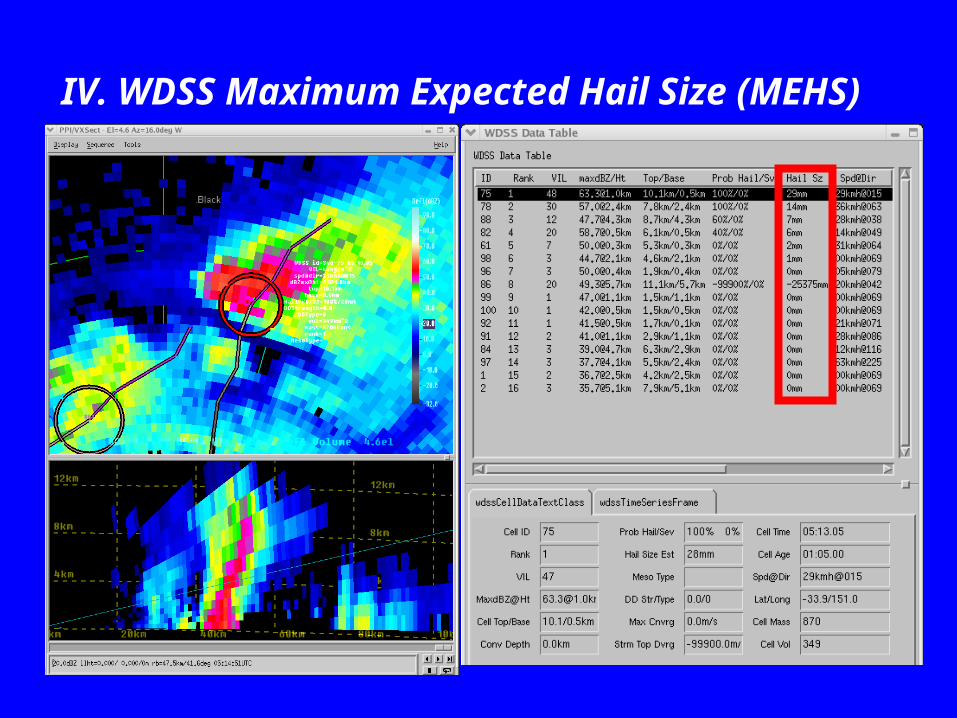
IV. WDSS Maximum Expected Hail Size (MEHS)

WT(H)WT(H)
E(Z)E(Z)
0oC and –20oC levels from 3-hourly Meso-LAPS or manual input
(editable by forecaster)
0oC and –20oC levels from 3-hourly Meso-LAPS or manual input
(editable by forecaster)
WT emphasises cold temperatures + E emphasises high reflectivities
elevated high dBZ cores result in “gorilla MESH”
WT emphasises cold temperatures + E emphasises high reflectivities
elevated high dBZ cores result in “gorilla MESH”

Review of Radar-Based Large Hail Estimates
I. 50 dBZ nomogram show some skill in estimating hail size thresholds
II. TBSS/“Flare echoes” on S-band radar indicator of giant hail
III. 3D storm reflectivity structure as indicator for large hail
IV. WDSS Hail Detection Algorithm Maximum Hail Size Estimate (MEHS) as a confirmation tool
V. Storm top divergence.