Haemovigilance Annual report 2014 - Swissmedic · Haemovigilance Annual report 2014 The annual...
32
Haemovigilance Annual report 2014 Summer 2015
Transcript of Haemovigilance Annual report 2014 - Swissmedic · Haemovigilance Annual report 2014 The annual...

Haemovigilance Annual report 2014
Summer 2015


1
HaemovigilanceAnnual report 2014
The annual report was written by:
Dr. Lorenz Amsler andDr. Markus Jutzi Clinical ReviewersHaemovigilance / Swissmedic
[email protected]@swissmedic.ch
Additional information is available on the Haemovigilance section of the Swissmedic website: www.swissmedic.ch/market surveillance -> Blood components

2
Table of contents
Abbreviations1. General information on haemovigilance
1.1 Introduction1.2 Origin, effects and clarification of
haemovigilance events1.3 Reporting of events and national
haemovigilance data1.4 Methodology: Reporting pathways and how
the national haemovigilance system functions
2. Reports received
2.1 Summary2.2 Distribution of the reports2.3 Transfusion reactions (TR)2.3.1 Transfusion reactions by category2.3.2 Imputability (relationship to the transfusion)2.3.3 Severity2.3.4 Transfusion reactions by blood components2.4 Number of transfused blood components and
risks in Switzerland 20142.4.1 Number of transfusions 2.4.2 Reporting rates2.4.3 Transfusion risks2.4.4 Risk of life-threatening and fatal transfusion
reactions2.5 Haemolytic transfusion reactions2.6 IBCT (incorrect transfusions / transfusion
errors) and near miss events2.6.1 IBCT 2.6.2 Near miss events2.7 Donor reactions
3. Preventive measures and conclusions
3.1 Pathogen inactivation of platelet concentrates (PC) using the Intercept® procedure
3.2 Specificities of detectable alloantibodies
4. Sample case reports4.1 Deaths4.2 Life-threatening transfusion reactions
5. Bibliography
Annex 1: Cumulative reports of donor complications
3 4
4 4
5 6 7
7 7 8 8 9 91111
11121214
1517
171920
21
21
22
252525
28
29

3
Abbreviations
°C degrees CelsiusAB antibodiesAML acute myeloid leukaemiaARDS acute respiratory distress syndromeASAT aspartate aminotransferaseBG blood groupBili Bilirubin (total)BP blood pressureBPr blood productC3d fragment of the complement systemCMV cytomegalus viruscPC conventional platelet concentrateCT computed tomographyDAT direct antiglobulin test, also known as
direct Coombs testDD differential diagnosise.g. for exampleECG electrocardiogramFGP fresh frozen plasmaFNHTR febrile non-haemolytic transfusion reac-
tionG/l giga (109) per litreg/l grams per litreGI gastrointestinalh hour(s)Hapto haptoglobinHb haemoglobinHIV human immunodeficiency virusHTR haemolytic transfusion reactionHV HaemovigilanceIBCT incorrect blood component transfusedID identificationIgM class M immunoglobulinsIH immunohaematologyiv intravenousK antigen/antibody of the Kell blood groupkg BW kilogram of body weightLDH lactate dehydrogenaseM. morbus = diseaseml millilitremm Hg millimetre mercury column, unit of measu-
rement for (blood) pressureNM near missNT-pro-BNP N-terminal brain natriuretic peptideO2 oxygenOp operating theatrePC platelet concentrate (PCa: apheresis-
derived;PCb: whole blood-derived)PE pulmonary embolismPI-PC pathogen-inactivated platelet concentratepos positive (e.g. BG Opos = blood group O,
rhesus factor positive)pRBC Packed red blood cells
PubMed database of the US National Institute of Health
Rh rhesus (factor)Rx x-raySRC Swiss Red CrossT&S type and screen (to define blood group
and detect irregular antibodies)TACO transfusion-associated circulatory
overloadTAD transfusion-associated dyspnoeaTR transfusion reactionTRALI transfusion-related acute lung injuryU/l unit(s) per litreμmol Micromol

4
1
Blood transfusion service
- Donor recruitment- Blood donation- Production of blood product (BP)- Storage- Issue of components
IH-Laboratory
- Product storage- Pretransfusion test- Issue of BP for individual patient
Doctor
- Evaluation of effect- Follow-up patient
Nursing
- Reception, handling of BP- Check product/patient ID- Transfusion of product- Observation of patient
Transfusion chain
- Decision to transfuse- Prescription
- Blood sampling for T&S
Figure 1: Transfusion chain
1. General information on haemovigilance
1.1 Introduction
In this Annual Haemovigilance Report we present the evaluation of the reports received in 2014 on transfu-sion reactions (TR), cases of incorrect blood compo-nents being transfused (IBCT) and near misses (NM).
1.2 Origin, effects and clarification of haemovigilance events
The diagram of the transfusion chain shows which oc-cupational groups play a role in carrying out a trans- fusion and are required to report events (Figure 1). Notifiable events include not only transfusion re-actions but also transfusion errors and near misses. Events that have been investigated and analysed are the cornerstone of a transparent, intelligent and therefore functioning haemovigilance and quality assurance system in hospitals. The investigation of events should establish the diagnosis of the affect-ed patient, contribute to harm reduction and, within the framework of the national haemovigilance sys-tem, enable information to be gained about current risks and potential for optimisation. This is why a con-sistently high level of willingness to report events re-mains so important.

5
Measures Issues Introduction/evaluation
Prevention of infectious diseases
- Classic blood-borne infections (HIV, hepatitis B, hepatitis C)
- Chagas screening in at-risk donors
- Hepatitis E screening
- Other emerging infections or blood-borne in-fections not previously observed in Switzerland
Measures are adapted and evaluated on an ongoing basis
Since 2013
Currently under discussion
Ongoing evaluation
Strategy of pre-dominantly male donors of plasma
- Reduction of TRALI* risk, emergence of other risks?
Evaluation completed in 2014
Changes to the manufacturing process
- Pathogen inactivation of blood platelets - Efficacy in preventing infection - Impact of reduced plasma content - Effects on platelets, increased consumption,
reduced efficacy? - Emergence of other risks, TRALI? - Storage time of 7 days, impact
- Pathogen inactivation of plasma for transfusion
Introduced in 2011, evaluation updated continuously on the basis of new data
Introduced in 2013 in 1 centre**
Quality assurance in the transfusion processes
- Blood bank and laboratory - Trends in alloimmunisation and near misses - Learning from the mistakes of others
- Users of blood products - Trends in transfusion errors and near misses - Learning from the mistakes of others
Continuous qualitative and quantitative increase in quality assurance measures introduced in laboratories and hospitals
Recommendations - Transfusion medicine lab testing of patient samples [2]
First edition 2008, updated regularly
Table 1: Measures adopted in Switzerland with their major effects and the issues involved
* Transfusion-related acute lung injury
** The case numbers are still too low for an evaluation using national haemovigilance data
1.3 Reporting of events and national haemovigilance data
A national haemovigilance system was introduced in Switzerland as early as 1996 [1] and expanded in subsequent years. Reporting of suspected transfu-sion reactions, transfusion errors and quality defects became mandatory with the enactment of the Ther-apeutic Products Act in 2002.
Apart from the early detection of new risks and qual-ity defects, the main tasks of a national haemovigi-lance system are to initiate and evaluate preventive measures. Table 1 shows the measures adopted in Switzerland in recent years on the basis of national haemovigilance data.

6
1.4 Methodology: Reporting pathways and mode of operation of the national haemovigilance system
The national haemovigilance system (HV system) covers the whole of Switzerland. Under the Thera-peutic Products Act, all institutions that transfuse blood products (‚users‘) and the manufacturers of blood products are obliged to report transfusion re-actions, transfusion errors and quality defects. It is also mandatory for both users and manufacturers to set up a quality assurance system and to appoint a responsible person for haemovigilance (haemovigi-lance offi cer). This person ensures that events are in-vestigated correctly and that the user and the blood bank or manufacturer work together effectively. This increases the quality of the individual reports. In ad-dition, prevention aspects are taken into account, particularly if a problem potentially effects several products.
The reports are either sent directly to Swissmedic by the users or fi rst go to the manufacturer, who adds information about the product history, the history of the donor and – where applicable – additional re-sults of investigations of the incident before passing the report on to Swissmedic. At Swissmedic the re-ports are entered into the haemovigilance database and evaluated by a clinical reviewer. The Swissmedic reviewers obtain additional information from the reporters where necessary and carry out the fi nal assessment. If this assessment deviates signifi cantly from the report sent by the professional, the local haemovigilance offi cer is consulted, as is the initial reporter if the local haemovigilance offi cer thinks this is necessary, to ensure that all the available in-formation is taken into account adequately when the report undergoes its fi nal evaluation. (Individual cases of particular interest are discussed with exter-nal experts in anonymised form.)
The Swiss haemovigilance system is based on sponta-neous reporting; in other words it is what is known as a passive monitoring system. Active monitoring by the national system, such as in cohort studies for example, does not take place. The individual profes-sional or haemovigilance offi cer determines whether a transfusion reaction is investigated and reported. It can therefore be assumed that, in spite of the statu-tory reporting requirement, under-reporting occurs to a degree that cannot be precisely quantifi ed.
The number of blood components supplied for trans-fusion is used to quantitatively evaluate transfusion risks (with exposure data as the denominator). Trans-fusion risks may be underestimated as a result of un-der-reporting, and for this reason the risks described in this report should be understood as minimum fi g-ures. Under-reporting depends on a number of fac-tors, some of which are not known and cannot be controlled. Under certain conditions, however, it can be assumed that the volume of under-reporting of a reaction is constant, and this permits reliable com-parisons to be made through the national HV system such as before-and-after comparisons following im-plementation of measures. In particular, declining reporting rates for individual categories of events (such as allergic transfusion reactions due to platelet transfusions since the Intercept pathogen inactiva-tion system was introduced) against a background of increasing reporting rates overall can be interpreted as a real reduction in the number of these transfusion reactions.

7
Type Number
Transfusion reactions 1077
Transfusion errors / incorrect blood component transfused (IBCT )
49
Near misses (NMs) 784
Donor reactions 13
Quality defects 12
Total number of reports evaluated 1935
TR = Transfusion reaction, IBCT = Incorrect blood component transfused, NM = Near miss
2.2 Distribution of the reports
Figure 2 shows all the reported events in recipients of blood components. The decrease in the total number of reports in 2014 parallels a decrease in the number of products transfused. The reporting rate, expressed as the number of reports per transfused product, rose again in 2014 (Figure 5, chapter 2.4.2).
2. Reports received
2.1 Summary
Swissmedic received a total of 1,937 haemovigilance reports in 2014. Correction for duplicate reports etc. leaves 1,935 reports, comprising 1,077 suspected transfusion reactions, 49 transfusion errors, 784 near misses, 13 donor reactions and 12 quality defects (Ta-ble 2).
2000
1500
1000
500
02008 2009 2010 2011 2012 2013 2014
NM
IBCT
RT
Number of events by type 2008 – 2014
Figure 2: Events reported in 2014 compared with previous years
Table 2: Number of haemovigilance reports in 2014

8
0 100 200 300 400 500
FNHTR
Allo-Immunisation
Allergic TR
TACO
Hypotensive TR
HTR
Infection
TRALI
TAD
Other
Number of reports by classification
FNHTR = Febrile non-haemolytic TRTACO = Transfusion-associated circulatory overloadTRALI = Transfusion-associated acute lung injuryTAD = Transfusion-associated dyspnoea
Alloimmunisations, febrile non-haemolytic TR (FNHTR) and allergic TR together continue to account for al-most 90% of the transfusion reactions reported. Com-pared with previous years, there is a trend towards more haemolytic reactions; this is described in more detail and discussed in chapter 2.5. There is also a trend towards more infections, which is interpreted as an artefact. Cases in which transfusion-related in-fection was a possible diagnosis – often with a differ-ential diagnosis of ‚FNHTR‘ or ‚infection due to the underlying disease‘ – were systematically categorised as ‚Infection‘ from 2014 onwards and the category was retained even if investigations showed that it was probably not a transfusion-related infection. The
2.3 Transfusion reactions (TR)
2.3.1 Transfusion reactions by category
In 2014 there were 1,077 reports of suspected trans-fusion reactions. The distribution of these reports among the different categories is shown in Figure 3.
absence of a causal relationship with the transfusion is taken into account by assigning a correspondingly low imputability. This procedure has the advantage that cases in the important ‚Infection‘ category are recorded as such in the database. A total of 18 cases were categorised as ‚Infection‘ in 2014, but 14 of them have a low imputability (Table 3).
Figure 3: TR reported in 2014 by category, N=1,077

9
Imputability all low ‚possible‘ high
Allergic TR 186 8 38 140 (75%)
FNHTR 451 74 284 93 (21%)
Alloantibodies 284 284 (100%)
H TR: acute 10 2 2 6
delayed 10 2 2 6
Hypotensive TR 26 5 14 7
Infection: bacterial 13 10 1 2
other 5 4 1
TACO 43 3 15 25 (58%)
TAD 6 2 3 1
TRALI 7 4 3
Other 36 21 14 1
Number of events
1077135
(13%)377
(35%)565
(52%)
Low imputability: causal relationship with the transfusion ‚excluded‘ or ‚unlikely‘High imputability: causal relationship with the transfusion ‚probable‘ or ‚certain‘
In 2014 high imputability was attributed to 565 re-actions (52% of reported TR), i.e. the likelihood of there being a causal relationship with the transfusion was considered to be probable or certain. In the fol-lowing, only cases with high imputability are present-ed in order to provide the most specific illustration possible of transfusion risks in Switzerland.
2.3.3 Severity
The degrees of severity are defined as follows:
Grade 1: non-severeGrade 2: severe, i.e. one of the following criteria is fulfilled:- Time in hospital prolonged as a result of the
reaction- Permanent damage (or permanent risk in the case
of alloantibodies)
Severity all Grade 1 Grade 2 Grade 3 Grade 4
Allergic TR 140 126 9 5
FNHTR 93 92 1
Allo-AB 284 284
HTR 12 5 2 4 1
acute 6 1 4 1
delayed 6 4 2
Hypotensive TR
7 6 1
Infection 2 1 1
TACO 25 17 6 2
TAD 1 1
Other 1 1
Total565
100%247 44%
303 54%
14 2.5%
1 0.2%
The proportion of life-threatening (Grade 3) or fatal (Grade 4) transfusion reactions was about the same as in previous years at 2.7%. The development of the absolute figures from 2008 to 2014 is shown in Figure 4. Of the 15 cases of life-threatening or fatal transfu-sion reactions in 2014, 11 occurred in connection with packed red blood cells (pRBC), 2 with platelet concen-trates (PC) and 2 with fresh frozen plasma (FFP).
Table 4: High-imputability reactions by category and severity
2.3.2 Imputability (relationship to the transfusion)
Table 3: Number of events in 2014 by category and imputability
- The reaction must be considered as medically im-portant for other reasons (e.g. if permanent dama-ge or a fatal outcome was avoided by timely inter-vention)
Grade 3: life-threateningGrade 4: death

10
One fatality with high imputability was reported in 2014. The haemolytic reaction with a fatal outcome is described in more detail in chapters 2.5 and 4.1. A further 10 deaths in temporal association with transfusions were shown to be unlikely related to the transfusion once they had been investigated and a final evaluation had been effectuated. The imputa-bility was rated as ‚possible‘ in one case. This case is described in chapter 4.1.
Figure 4: Life-threatening or fatal events with high imputability
Between 2008 and 2014, 6 transfusion-associated deaths occurred
in 2008 one TACO after FFP and one TRALI after PCin 2009 one acute HTR after pRBC and one bacteri-
al infection after PCin 2012 one TACO after pRBCin 2014 one acute HTR after pRBC.
Grade 3 & 4 TRs, high imputability
Other
Hyperkalaemia
Delayed HTR
TAD
Hypotensive TR
Bacterial Infection
TRALI
Acute HTR
TACO
Allergic TR
2008 2009 2010 2011 2012 2013 2014
35
30
25
20
15
10
5
0
11
2.3.4 Transfusion reactions by blood components
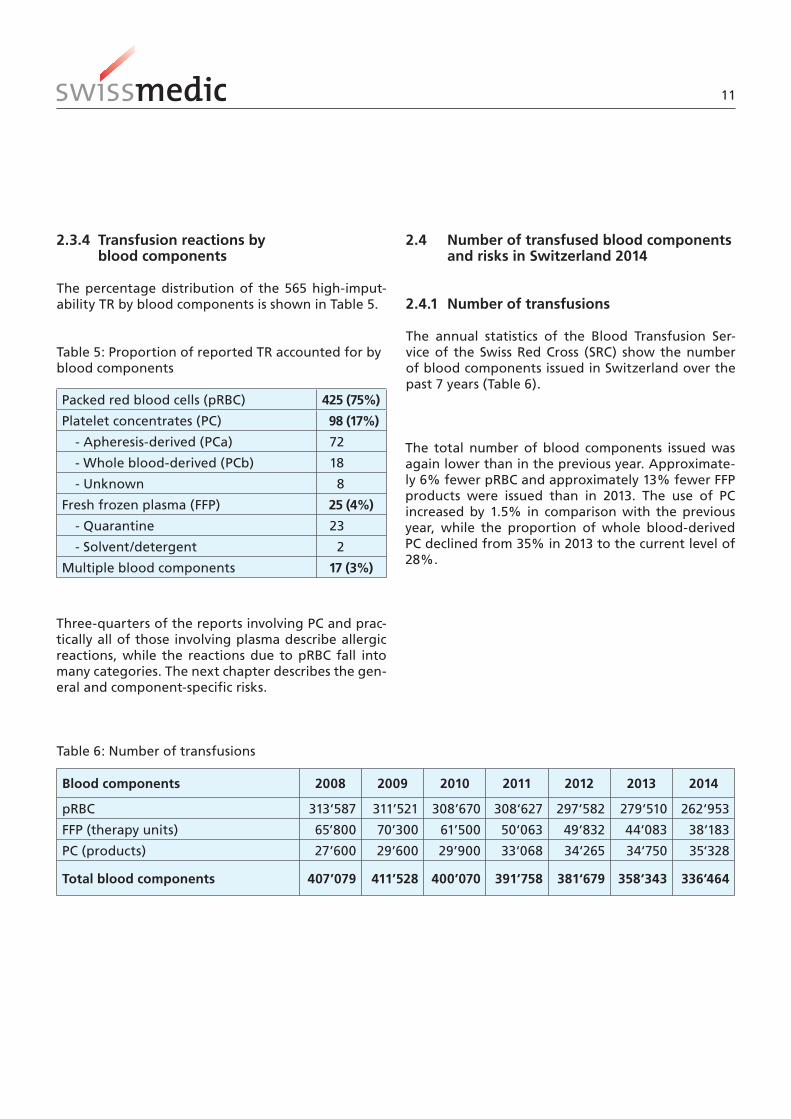
The percentage distribution of the 565 high-imput-ability TR by blood components is shown in Table 5.
Packed red blood cells (pRBC) 425 (75%)
Platelet concentrates (PC) 98 (17%)
- Apheresis-derived (PCa) 72
- Whole blood-derived (PCb) 18
- Unknown 8
Fresh frozen plasma (FFP) 25 (4%)
- Quarantine 23
- Solvent/detergent 2
Multiple blood components 17 (3%)
Three-quarters of the reports involving PC and prac-tically all of those involving plasma describe allergic reactions, while the reactions due to pRBC fall into many categories. The next chapter describes the gen-eral and component-specific risks.
Table 5: Proportion of reported TR accounted for by blood components
2.4 Number of transfused blood components and risks in Switzerland 2014
2.4.1 Number of transfusions
The annual statistics of the Blood Transfusion Ser-vice of the Swiss Red Cross (SRC) show the number of blood components issued in Switzerland over the past 7 years (Table 6).
Blood components 2008 2009 2010 2011 2012 2013 2014
pRBC 313‘587 311’521 308’670 308‘627 297‘582 279‘510 262‘953
FFP (therapy units) 65’800 70’300 61’500 50‘063 49‘832 44‘083 38‘183
PC (products) 27’600 29’600 29’900 33‘068 34‘265 34‘750 35‘328
Total blood components 407’079 411’528 400’070 391‘758 381‘679 358‘343 336‘464
Table 6: Number of transfusions
The total number of blood components issued was again lower than in the previous year. Approximate-ly 6% fewer pRBC and approximately 13% fewer FFP products were issued than in 2013. The use of PC increased by 1.5% in comparison with the previous year, while the proportion of whole blood-derived PC declined from 35% in 2013 to the current level of 28%.

12
(Figure 6). Only TR for which there were more than 10 reports are taken into account. Events occurring more rarely cannot be reliably expressed as risks on an annual basis because of the small absolute num-ber of cases.The reporting rates shown provide information on the type and extent of transfusion risks in Switzer-land at the present time. These risks must be viewed as minimum risks because of the possibility of un-der-reporting.While allergic reactions account for the lion‘s share of reports involving PC and plasma by far, they account for only a small proportion of reports involving pRBC. This means that an acute transfusion reaction is more
2.4.3 Transfusion risks
The presentation of transfusion risks provides the treating doctor with a basis for the risk-benefit anal-ysis when considering a transfusion and for duly in-forming the patient about possible adverse effects. For potentially avoidable transfusion reactions, the frequency of the events shows where risk minimisa-tion measures are indicated and documents the ef-fect of measures that have already been taken. The reporting rates for transfusion reactions in 2014 are shown for pRBC, PC and plasma based on the number of transfusion reactions with high imputabil-ity and on the number of blood components issued
2.4.2 Reporting rates
The overall reporting rate is calculated from the total number of reports per 1,000 transfusions. The calcu-lation includes all types of reports and all imputabil-ity classifications, i.e. all 1,935 reports in 2014. The reporting rate rose slightly again in 2014 and cur-rently stands at 5.8 reports per 1,000 transfusions (Figure 5).
0.8 1.1
1.5 1.6 2.0
2.4 2.7 2.7
3.3
3.9 4.4
5.6 5.8
0.0
1.0
2.0
3.0
4.0
5.0
6.0
7.0
2002 2003 2004 2005 2006 2007 2008 2009 2010 2011 2012 2013 2014
Rep
ort
s p
er 1
,000
tra
nsf
usi
on
s
Progression of the reporting rates
Figure 5: Progression of the reporting rate (reports per 1,000 transfusions), all reports

13
~ 1/1700
~ 1/1500
~ 1/13 000
~ 1/7000
~ 1/4000
~ 1/1000
~ 1/600
~ 1/2000
~ 1/500
~ 1/350
Allergic TR FFP
Total Rate FFP
TACO RBC
Allergic TR RBC
FNHTR RBC
Allo-immunisations RBC
Total Rate RBC
FNHTR PC
Allergic TR PC
Total Rate PC
Reporting rates by product 2014
likely to be of the allergic type with plasma (and PC), while it is more likely to be of the FNHTR type with pRBC.
Figure 6: Reporting rates by product and category, only high imputability

14
1 ~1/2,5 million
1 ~1/2,5 million
6 ~1/500 000
7 ~1/400 000
7 ~1/400 000
8 ~1/350 000
12 ~1/200 000
32 ~1/80 000
90 ~1/30 000
165 ~1/15 000
Delayed HTR
Hyperkalaemia
TAD
Bacterial infection
Hypotensive TR
TRALI
Acute HTR
TACO
Allergic TR
Total Risk all TR
Total 2008-2014
Grade 3 & 4 TR 2008 – 2014, all blood components
Figure 7: Risk of life-threatening and fatal transfusion reactions
As shown in Figure 7, allergic reactions account for most of the Grade 3 and 4 TR, making up more than half of all life-threatening or fatal events. They are followed by volume overload and, in third place for the first time, acute haemolytic reactions with a to-tal of 12 cases between 2008 and 2014, 5 of them in 2014. These will be described in more detail in the following chapter.
2.4.4 Risk of life-threatening and fatal transfusion reactions
Figure 7 shows the Grade 3 and 4 TR for all blood components by category and number for the past 7 years. Once again, only cases with high imputability are shown.

15
2.5 Haemolytic transfusion reactions
Figure 8 shows the number of haemolytic transfusion reactions (HTR) of all degrees of severity reported be-tween 2008 and 2014. Once again, only high-imputa-bility cases are shown.
High imputability haemolytic TRs, 2008 – 2014
Figure 8: Haemolytic transfusion reactions 2008–2014
Following a continuous decline in previous years, the number of reports increased in 2014, with 3 of the 6 acute HTR occurring as separate repeated reactions in one and the same patient.In spite of the low number, it is important to exam-ine the cases in 2014 for potential common causes in order to identify any possible trends promptly. Table 7 shows all cases with a severe, life-threaten-ing or fatal course (severity grades 2–4).

16
Table 7: Haemolytic transfusion reactions, Grade 2–4
Case Symptoms Hb (g/dl) Lab Grade Cause Comments
1, acuteLower back pain, Hypertension
8.0R 9.4R 8.4 LDHqqq, Bilirubinq
4Cold auto- aglutinins
Insufficient war-ming of blood components
2a, acuteFever 40°C, BP 96/60, Pulse 125, shivering, dark urine
6.7R 8.2R 6.1 3 ? Immunohaemato-
logical tests neg., also in the refe-rence laboratories in Berne and Paris (CNRGS)
2b, acuteFever 38.5°C, dark urine 6.1R 7.7R 5.0
Free Hbqq,Hapto- globinQ
3 ?
2c, acute Dark urine 5.0R 6.9R 5.4 LDHq 3 ?
3, acuteShivering, BD 77/51 O2-Sat. 80% 9.3R 10.5
LDHqq , Bilirubinq, ASTq
3RBC Apos
Q Patient Opos
IBCT
4, delayed PerformanceQ
5.7R 11.2R 9.2
LDHq , Hapto- globinQ, DAT (C3d)
2 Anti-SDD Auto- Antibodies
5, delayed
Nausea 6.9R 7.5R ~7LDHq , Hapto- globinQ
2Anti-E, -Fy(a), -P1, -H
The cause of the fatal haemolytic reaction in case 1 was insufficiently prewarmed pRBC, which in this fe-male patient with Waldenström‘s macroglobulinae-mia led the pre-existing cold antibodies to trigger haemolysis. This case is described in chapter 4.1 Case reports. It was not possible to identify unequivocally the pathophysiological mechanism behind the three haemolytic reactions 2a–2c experienced by a female patient. Possible explanations include anti-Jk(b) an-tibodies compatible with the results of blood group genotyping and/or hyperhaemolysis representing a bystander effect. In case 3, the cause is clear: a clas-sic incorrect transfusion of a pRBC with BG Apos to a male patient with BG Opos after two pRBCs had been inadvertently interchanged. In cases 4 and 5, alloanti-bodies were detected as the cause of the haemolysis.
To summarise, there is no indication of a common cause of the cases of haemolysis in 2014, and the most likely reason for the increase in the number of
reports is therefore a statistical fluctuation due to the low numbers. Other factors such as greater vigilance may also have played a role. It should also be not-ed that one patient accounting for 3 of the reactions made a substantial contribution to the higher num-ber of cases.
17
2.6.1 IBCT
The deviation leading to the transfusion of a blood component that was intended for another patient or was not optimally suited to the patient to whom it was administered occurred during preparation (pre-scription/ordering) in 1 case, in the laboratory in 15 cases and during administration in 33 cases. In some of the events, sub-optimal products were intention-ally administered, for example during massive trans-fusions when Rhesus-incompatible pRBC had to be given because Oneg products were not available.For further analysis we are only considering the 18 reported cases of transfusion errors in the stricter sense. We define this as the transfusion of a product for which compatibility in terms of ABO, Rh or other blood group antigens is not ensured or is either par-tial or fortuitous (this category excludes transfusions which are Rh or allo-Antibody-incompatible or which are not known to be compatible but which are per-formed in emergency situations). Table 8 shows the 18 transfusion errors in the strict sense. In most cases, the deviation occurs at the administration stage, the last stage in the transfusion chain. This contrasts with the near misses (see below), in which errors in the early stages of the transfusion chain (during prepara-tion or in the laboratory, for example) are discovered and corrected at a later stage.
2.6 IBCT (incorrect transfusions / transfusion errors) and near miss events
In 2014, 49 IBCT and transfusion errors were reported, representing a reporting rate of 0.15 per thousand transfusions. There were also 784 reports of so-called near misses, events in which an error or deviation oc-curred, but was discovered in sufficient time to pre-vent an IBCT. The reporting rate for 2014 was 2.3 near miss reports per thousand transfusions.
The number of IBCT reports is comparable to previ-ous years. For the first time since the Swiss Haemovig-ilance System came into being, there was no increase in the absolute number of near miss reports. How-ever, if the declining number of transfusions is tak-en into account, this produces a slight increase in the reporting rate for near miss events in the year under review.

18
Transfusion error
Number Description Localisation of deviations in the transfusion chain
ABO system incompatible
3 Apos pRBCR Opos patient (stopped after 10–30 ml, no symptoms)
Apos pRBCR Opos patient Acute HTR (see case 3 in chapter 2.5)
Plasma intended for another patient with BG O given to patient with BG Bneg during plasmapheresis
Administration
Administration
Administration
ABO system compatible by chance
5 Wrong product taken from refrigerator, fortuitously ABO identi-cal but not irradiated
The blood group had previously been determined incorrectly, and plasma from the wrong blood group was given (fortuitously com-patible, A plasma to O patient). Transfusion was started before BG was redetermined. (Emergency situation)
Opos pRBCR Apos patient
PC, fortuitously ABO identical, given to wrong patient
Plasma BG AR to patient with BG O
Administration
Preparation/ laboratory/ administration
Administration
Administration
Administration
Allo-Antibody compatibility not ensured
7 Transfusion to wrong patient after valid bedside test, Rh phenotype and K fortuitously compatible?
Anti-Cw alloantibodies known elsewhere not taken into account
Administration of Oneg ccddee Kellneg pRBC to patient (born 1982) with CCD.ee phenotype. (Communication problems about urgency)
Alloantibodies (anti-E and -c) known elsewhere not taken into account during transfusion of 13 pRBC in total.
pRBC with BG O ordered for patient X but not used was given to patient Y without performing a T&S. (Not by mistake, the BG BG-Oneg product was used intentionally)
Patient with known anti-S, anti-E and anti-Bg(a) antibodies was given 2 untested Oneg emergency pRBC (one of them antigen S-positive) even though other pRBC had already been tested and supplied. (No signs of haemolysis after the transfusion)
Incompatible Rh phenotype transfused to a patient with allo-Antibodies outside the Rh system (the known Antibody was taken into account)
Administration
Laboratory
Administration or failure to communicate phenotype
Laboratory
Administration
Laboratory
Laboratory
Administration of a sub-opti-mal product
3 pRBC from a CMV-positive (antibodies) donor administered to pregnant woman
Administration of 1 FFP O to an Opos infant less than 3 months of age (according to instructions, AB plasma should have been given)
8-day-old infant was given BG Apos instead of anstatt Opos. Mother is Opos
Administration (ordering)
Laboratory
Laboratory
Total 18
Table 8: Transfusion errors in the strict sense and localisation of deviation
The transfusion errors presented here show that ef-ficient, well-targeted processes still require consid-erable attention and that practical quality assurance
measures for avoiding and identifying errors contin-ue to be extremely important.

19
2.6.2 Near miss events
Definition: An error or deviation from standard op-erating procedures or directives that is discovered before initiating a transfusion and that could have resulted in a transfusion error or a transfusion reac-tion in the recipient if it had not been detected. Table 9 shows the reported near miss events, categorised by the stage in the transfusion chain at which they occurred and the location in which the error was dis-covered.
Category Discovery Most important examples
Stage at which the deviation occurred
Number of which process devia-tions
Labora-tory
Ward/theatre
Returns Not stated
Preparation 538 79 341 28 10 159 Wrong blood in sample tubeSamples and/or order labelled incompletely, discrepantly (e.g. different patient names) or not at all, Ordering error
Laboratory 55 0 22 17 1 15 Wrong information entered
Administration 8 0 0 4 3 1 Products not transfused after all
Other 163 2 9 27 62 65 Handling & storage
Could not be determined
20 0 16 2 2 0 Blood group discrepancy with previous finding
Total 784 81 388 78 78 240
In 2014, NM events were reported by 32 institutions (2013: 30; 2012: 14; in 2011 just 4). Although near misses are errors that actually occurred, near miss re-ports from a hospital are by no means indicative of quality assurance problems. On the contrary, we view near miss reports as a sign of an active quality as-surance system and a structured approach to dealing with errors. In addition, if an error is reported, other individuals and teams can learn from it.
«A clever man doesn‘t make all the mistakes himself. He gives others a chance too.» Winston Churchill
Of the 538 deviations at the preparation stage, 258 (48%) involved labelling/marking of the sample tu-bes. The analyses had to be repeated in 364 cases and the blood components that had been supplied had to be destroyed in 82.
Table 9: Classification of events by stage of the transfusion chain and location of discovery

20
2.7 Donor reactions
The blood transfusion services in Switzerland are required to submit to Swissmedic individual case re-ports of serious donor reactions and an annual ta-ble (tally list) of the cumulative figures. The data will therefore be presented in two different tables. The first table shows the absolute number and a brief de-scription of the serious adverse effects, while the sec-ond table (in Annex 1) gives the cumulative figures. The latter does not illustrate the situation for Swit-zerland as a whole since only three of the 13 blood transfusion services in operation at the time complet-
ed the table and submitted it. Based on the donor figures from these three blood transfusion services, however, the rates calculated permit to estimate the frequency and to draw comparisons, for example be-tween whole blood and apheresis donations.
In 2014, 13 individual case reports of donor reactions were received. Nine of them were vasovagal reac-tions (Table 10).
Category Number of which serious
Brief description of the serious cases
A2.4 Unspecific arm pain
2 0
B1 Immediate vasovagal reaction
3 1 After donating whole blood, unconscious for approx. 10 seconds, heavy perspiration, pallor, nausea and vomiting (5 times) in the following hour, after waiting for 3 hours the donor was admitted to the emergency department
B2 Immediate vasovagal reaction with injury
1 1 Collapse with suspected concussion, subsequently hospitalised
B3 Delayed vasovagal reaction
2 2 Approx. 90 minutes after donating whole blood, malaise, dizziness, nausea, then repeated vomiting. Following prolon-ged symptoms, admitted to nearest hospital where infusion was given, medical monitoring for approx. 2.5 hours. Then discharged home, patient symptom-free.
Following donation of whole blood, vagal nausea after leaving the donation unit. Taken to the emergency depart-ment by ambulance.
B4 Delayed vasovagal reaction with injury
3 1 Evening donation in mobile unit. Got up rapidly the next morning at 7.00, went upstairs, dizzy, lost consciousness, fell on head. Son heard the noise and found mother unconscious on the floor. Emergency admission to hospital, broken jaw, lost tooth, cornea damaged by glasses. Osteosynthesis with plate.
C1 Citrate reaction during apheresis
2 1 Intermittent loss of consciousness and somnolence in spite of oral calcium, persistent symptoms led to admission to emer-gency department, lab work-up and ECG there, infusion, oral calcium, discharge after approx. 3 h.
Total 13 6
Table 10: Individual case reports of donor reactions

21
The reaction rates can be calculated from the cumu-lative donor reactions reported by 3 regional blood transfusion services. The overall rate is 6.6 reactions per 1,000 donations (carried out by the three transfu-sion services). One striking feature is that at 18/1,000, the rate for apheresis is roughly three times higher than that for whole blood (6/1,000). This difference is due almost entirely to local reactions, mainly venous haematomas (Annex 1, Table cumulative reports of donor complications).
3. Preventive measures and conclusions
3.1 Pathogen inactivation of platelet concentrates (PC) using the Intercept® procedure
The ongoing evaluation of this measure was reported on in the 2013 Annual Report. In this Annual Report for 2014 we will therefore limit ourselves to providing a short update on the most important figures.
As in previous years, in 2014 there were again no re-ports of high-imputability transfusion reactions to bacterially contaminated PC. Since the pathogen in-activation (PI) process had been introduced for all PC
in Switzerland, no more cases of sepsis due to PC have been reported.
In addition to reliably preventing septic transfusion reactions, the introduction of the PI process has led to a reduction in the number and severity of non-in-fection-related TR after PC transfusion (Table 12). The most likely explanation for this is the generally lower plasma content of PI-PC, which reduces allergic and febrile TR to plasma constituent.
The question of whether pathogen-inactivated PC constitute a higher risk of TRALI than conventional platelet concentrates is still subject to controversy [3, 4]. No high-imputability TRALI case was reported in Switzerland in 2014. Of the TRALI cases with imputa-bility ‚possible‘, none occurred with a PC transfusion, but with other products. Continuous assessment of this potential risk, incorporating new findings and vigilance data, is extremely valuable. It is therefore important that everyone involved in the transfusion process continues to be aware of the possibility of se-vere transfusion reactions with respiratory symptoms and that they initiate investigations of suspected cas-es and send the reports to Swissmedic.
Possible effects of the PI process on platelet stabil-ity and functionality have long been the subject of research. There were no reports of lack of efficacy in 2014. Haemovigilance officers and doctors are also required to report cases in which blood products are suspected of not being effective if product-specific factors are thought to be the cause or if the lack of efficacy cannot be otherwise explained.
Transfusion reactions 2008−2011 cPC 2011−2014 PI-PC
Units transfused 93‘600 130‘800
Risk = 1 reaction per x PC Reports Risk Reports Risk
All high-imputability reports344 ~ 1 / 270 349 ~ 1 / 375
High-imputability reports, Grade 3 & 4 33 ~ 1 / 2800 15 ~ 1 / 8700
P<0.001
P<0.001
cPC = conventional platelet concentratesPI-PC = pathogen-inactivated platelet concentrates
Table 12: Reported transfusion reactions involving conventional and pathogen-inactivated PC

22
Sporadic: Anti-I 3Anti-HTLA(Ch/Rg) 3Anti-TEFA 2Anti-Do(a) 2Anti-HI 2Anti-Bg(b) 1
Anti-Yk(a) 1Anti-Kann/McC 1Anti-Vw 1Anti-f 1Anti-G 1Auto-AC 9Unclear 3
Number of allo-antibodies reported
Figure 9: Specification of reported alloantibodies 2008–2014 (all patients)
Girls and women under 50 years of age are particular-ly vulnerable to alloimmunisation because of the risk of foetal/neonatal haemolysis in a later pregnancy. The alloantibodies reported in this group are shown in Figure 10.
ceived. 2,363 specified antibodies were entered in the national HV database from these reports, as il-lustrated in Figure 9. The major alloantibodies C, c, E, e and K account for by far the largest proportion. Rh/K phenotype testing is used to test both blood products and recipients for these antigens to ensure that transfusions are compatible.
3.2 Specificities of detectable alloantibodies
Alloantibody-formation may be induced by transfu-sions or pregnancy and are directed against antigens that the affected person does not have. Most of these antibodies could lead to (usually) delayed haemolytic reactions in the recipient in the course of a subse-quent transfusion. If the recipient becomes pregnant, there is also the risk of some of these antibodies trig-gering haemolysis in the foetus or new-born child.
The reported alloantibodies were analysed not only for 2014 but also for the seven-year period 2008 – 2014 in order to produce a statistically robust eval-uation. During this period, a total of 2,047 reports of one or several detectable alloantibodies were re-

23
Numbers of allo-antibodies reported in women 50 years
Figure 10: Specification of reported alloantibodies 2008–2014, only female patients ≤ 50
Apart from the substantially lower number of re-ports, one striking feature of Figure 10 is the differ-ent distribution compared to Figure 9. The ‚Rh/K phe-notype‘ alloantibodies still account for the highest proportion in female patients ≤ 50, but the predomi-nance is not as great as in the total population shown in Figure 9. One possible explanation for this smaller proportion of ‚Rh/K phenotype‘ antibody reports is compliance with the relevant Swiss recommendations [2]. The recommended state of the art is to give fe-male patients ≤ 50 years of age transfusions of pRBC with a compatible Rh/K phenotype (the same is rec-ommended for other special patient groups as well). The high proportion of anti-M or Anti-Le(a) antibod-ies, both of which can be formed during pregnancy, may also have contributed to the slightly different distribution among female patients ≤ 50. Figure 11 shows the proportion of Rh/K phenotype antibodies in female patients ≤ 50 in comparison with other pa-tients (male patients and female patients over 50).

24
Illustrative example for Figure 11: The proportion of anti-E in female patients ≤ 50 is 13% of all reported antibodies for this group. The proportion of anti-E in the comparator group is 26%. This gives a relative proportion of 0.5, or in other words the proportion is only half the size of that in the comparator group (beware the logarithmic x axis).
Figure 11: Relative frequency of alloantibodies in female patients ≤ 50 in comparison with all other patients
0.1 1 10 100
Anti-Wr(a)
Anti-P1
Anti-Lu(a)
Anti-Le(b)
Anti-Le(a)
Anti-M
Anti-S
Anti-Fy(b)
Anti-Fy(a)
Anti-Jk(b)
Anti-Jk(a)
Anti-Kp(a)
Total C E c e K
Anti-K
Anti-C(w)
Anti-e
Anti-c
Anti-E
Anti-C
Anti-D
Anti-A1
Proportional Reporting Ratio (PRR) for antibodies reported, with 95% CI
Antib
odie
s
Total C E c e K
Less frequent in women 50 years «− ---- ----−» More frequent in women 50 years
Figure 11 shows that immunisation with the antibod-ies that could prove problematic if the patient be-comes pregnant at a later date is reported propor-tionally less often in female patients ≤ 50. This can be interpreted as a sign that the recommendations pro-duced jointly by the Swiss Transfusion Medicine As-
sociation and Swiss Transfusion SRC are indeed being implemented. Systematic compliance with these rec-ommendations should remain the goal in the future so that alloimmunisation of this type can continue to be avoided in this group of female patients.

25
4. Sample case reports
4.1 Deaths
Case 1 Acute haemolytic transfusion reaction, pRBC
A 68-year-old patient with stage B Waldenström‘s macroglobulinaemia with cold antibodies (anti-I), chronic haemolysis, severe acrocyanosis and pancyto-penia under chemotherapy was given 2 pRBC each containing approx. 270 ml. Since the prewarmer for the pRBC was not available at that precise moment, the first pRBC was transfused using an improvised system to warm it (a urine bag filled with warm wa-ter through which the transfusion line was passed). While this insufficiently warmed pRBC was being transfused, the patient experienced pain in the kid-ney region and her blood pressure rose from 100/50 to 160/90 mmHg. Her body temperature dropped from 37.6 to 34.7°C. The reaction was initially not recognised as a haemolytic transfusion reaction. The second pRBC was warmed and administered correct-ly. The next day the patient‘s clinical condition dete-riorated, with persistent pain in the kidney region, persistently elevated blood pressure and tachycardia. Dyspnoea subsequently occurred with hypoxaemia, headache and loss of haemodynamic stability with a drop in blood pressure, and oligo/anuria. That evening the patient was transferred to the ICU in a state of shock. She developed right-heart failure with no evidence of pulmonary embolism and disseminat-ed intravascular coagulation, and died the next day.
In the laboratory, an anti-I titre of > 1/1000 and an anti-i of 1/64 were recorded 3 days before the reac-tion, anti-I was 1/32 at 22°C, negative at 37°C; IgM was 5.53 g/l. After the reaction, laboratory testing showed signs of acute exacerbation of the chronic haemolysis (e.g. LDH up to 5600 U/l). Clinically and radiologically there were no signs of ARDS, volume overload or lung toxicity due to chemotherapy. The reaction was classified as an acute haemolytic trans-fusion reaction due to insufficiently warmed erythro-cytes in a patient with cold antibodies; the imputabil-ity was assessed as ‚probable‘. The hospital concerned has implemented various fundamental measures to prevent similar events from happening. Among other things, transfusions are no longer performed in the evenings and at night, except in an emergency. In addition, the laboratory/blood bank has purchased a prewarmer that can be issued with the pRBC if re-quired.
Case 2 Transfusion transmitted infection: Chagas disease, PC
Based on the Chagas screening for donors with re-spective exposure recently introduced in Switzerland, a donor was tested positive in 2013. A look-back has been performed for all products from his previous donations. Thereby, a patient was identified, who had received a PC from this donor in 2008, and who developed acute Chagas myocarditis two years later. The imputability was assessed as ‘possible’. It is fore-seen to publish the case report in a scientific journal soon. In order not to compromise this publication, we forego a detailed presentation here.
4.2 Life-threatening transfusion reactions
Case 3 Anaphylactic TR, PCb
A 24-year-old patient with dyskeratosis congenita and a myelodysplastic syndrome developed pruritis without urticaria approx. 15 minutes after the start of a transfusion of a pooled platelet concentrate. The transfusion was discontinued and symptomatic treatment with 2 mg clemastin was given. The pa-tient developed an increasing sensation of constric-tion in the throat and 80 mg methylprednisolone was administered additionally, but with no improvement. There was no indication of bronchospasm on auscul-tation, oxygen saturation was over 95%. Dyspnoea led to the suspicion of larynx/glottis oedema due to an allergic transfusion reaction. Administration of 0.5 mg adrenaline i.v. (diluted 1/20, in 2 ml portions) pro-duced only a slight improvement. In view of the mod-erate response to the measures taken, a resuscitation alarm was triggered and a further dose of adrenaline (1 mg) was given; this was followed by a substantial improvement in the symptoms and stress-induced hy-perventilation. This decreased following administra-tion of 5 mg midazolam i.v. During the reaction, the patient was tachycardic with normal to hypertensive blood pressure. After monitoring and transfusion of a

26
pRBC the patient was discharged home in an asymp-tomatic condition approx. 3 hours later.The increase in platelets from 2 to 41 G/l was thought to be adequate and the transfusion reaction was not investigated further in view of the unequivocal clini-cal picture and the response to systematic antiallergic therapy.
Comments: The reaction described here was as-sessed as a mild allergic transfusion reaction in view of the exclusively cutaneous initial manifestation. Additional symptoms developed despite antiallergic therapy with antihistamines and corticosteroids, and it was initially not possible to control their severity adequately even with adrenaline. This and the sub-sequent decision to trigger a resuscitation alarm il-lustrate the clinical reassessment of the reaction as a life-threatening event. The take-home message of this case is the importance of monitoring the course thoroughly after symptomatic therapy, even in aller-gic reactions that initially appear to be mild.
Case 4 Transfusion-associated dyspnoea, PCa
A 58-year-old patient with AML experienced dysp-noea and hypoxia with no relevant haemodynamic changes 3 minutes after the start of a platelet trans-fusion. The symptoms resolved spontaneously a few seconds after the transfusion had been interrupted. A few minutes after the transfusion had been re-started, dyspnoea occurred again, accompanied by a drop in oxygen saturation to 80% in ambient air. The patient responded well to supplemental oxygen. Auscultation showed left basal hypoventilation and right basal crackles, assessed as being unchanged from the findings on the morning before the trans-fusion. Blood gas analysis under 2 litres of O2 showed mild alkalosis, O2 and CO2 were both at the lower limit of the reference range, the chest x-ray showed the known left-sided pleural effusion. The ECG was unchanged from the previous findings. The patient had another episode of dyspnoea the following night. The chest x-ray showed no PE, an increase in the pleural effusion and thickened alveolar septa on both sides (more marked on the right).
Comments: We assessed this case as transfusion-as-sociated dyspnoea. An allergic reaction with solely respiratory symptoms would have been possible, al-though the auscultation findings (with no evidence
of broncho-obstructive involvement) and the rapid spontaneous resolution after the transfusion had been interrupted are not typical. Transfusion-associ-ated volume overload is unlikely because of the short 3-minute infusion time and the absence of haemody-namic changes. The nearly normal blood gas analysis, the absence of ground-glass opacities on the chest x-ray and the rapid improvement are in disfavour of TRALI. The reporter and the haemovigilance officer assessed the causal connection as certain on the ba-sis of the positive re-challenge (symptoms occurred again after the transfusion had been restarted). We also feel that the high imputability is definite. We agree with the assessment by the treating doctors that the event was life-threatening.
Case 5 Bacterial infection, pRBC
An 83-year-old patient with haemodynamically rel-evant upper GI bleeding while on oral anticoagula-tion resulting in anaemia developed a fever follow-ing transfusion of a pRBC. Immunohaematological testing revealed no evidence or hemolysis or immune haemoatlogical intolernce, Klebsiella pneumonia grew within 24 hours in residual material from the bag, no growth was observed in the initial blood cul-tures taken from the patient. Klebsiella pneumonia was also found in further blood cultures taken from the patient 3 days after the transfusion. Comparison of the results of sensitivity testing and molecular typ-ing both bacterial isolates showed no differences be-tween the two strains. Analysis of the sample from the serum bank and the plasma from the same do-nation produced no findings of interest, and a new, in-depth investigation of the donor‘s medical histo-ry produced no indication of a cause of bacteraemia through which the germ could have passed into the donation. Taking all the findings together, the blood transfusion service concerned and the haemovigi-lance officer classified the case as transfusion-associ-ated sepsis with (very) probable imputability.
Comments: We can add nothing to the thorough and comprehensive investigation that was carried out, nor to the assessment by those involved. Although transfusion-associated bacteraemia due to pRBC is rare, it is still important to investigate the possibility of bacterial infection in patients with febrile, trans-fusion-associated reactions following pRBC transfu-sions, as this case demonstrates.

27
Case 6 TACO, pRBC
This 72-year-old patient was in acute renal failure due to thrombotic microangiopathy in the context of carcinoma of the pancreatic head being treated with chemotherapy, and had a pulmonary embo-lism. At the end of the erythrocyte transfusion, given over 90 minutes, dyspnoea, angina pectoris, loss of consciousness, an increase in heart rate from 96 to 124 bmp and a rise in blood pressure from 150/96 to 228/128 mmHg occurred. Administration of diuretics produced a substantial improvement.The patient‘s temperature did not rise. A review of the documentation and immunohaematological in-vestigation did not produce any conspicuous find-ings, culture of the product and the patient‘s blood showed no growth. The positive signs of haemolysis – elevated free haemoglobin in plasma at 7.7 μmol/l (reference value up to 3.5), haptoglobin < 0.08 g/l (normal 0.62-1.67) and LDH 689 U/l, (no baseline val-ues available) – are viewed as being associated with the microangiopathy. The reaction, assessed as life-threatening, was re-ported as volume overload with probable imputabili-ty, and we concur with this evaluation.
Comments: The transfusion rate of approx. 3 ml/min (based on the 90-minute duration of the transfusion and the pRBC volume of 275 ±75 ml in the specifi-cation) is clearly higher than the 1 ml per hour per kg bodyweight recommended for both risk factors pre-existing renal failure and age over 60. The course, with the symptoms occurring at the end of the trans-fusion and a substantial response to diuretics, also mitigate clearly in favour of this diagnosis.
Case 7 TACO, pRBC
After surgery for a total knee replacement, an 82-year-old patient with haemoglobin at 9.8 g/l was given a transfusion of pRBC over 1 hour on the in-struction of the surgeon. He was then given 20 mg furosemide and a 2nd pRBC was transfused over 90 minutes. The patient experienced a sensation of ret-rosternal pressure with no subjective shortness of breath after an unspecified latency period. A clinical diagnosis of volume overload was made, subsequent-ly pulmonary oedema developed with bilateral pleu-ral effusion and an NT-pro-BNP of 4954 (the baseline value was not stated).
Comments: Transfusion of pRBC (275 ±75 ml) within one hour to a patient over 80 clearly exceeds the rec-ommended rate of 1 ml/kg BW/h for patients with risk factors for volume overload. The administration of a diuretic between the two transfusions is a suit-able means of preventing or treating volume over-load, but the second transfusion was also given more rapidly than is recommended. It is also questionable whether the transfusion was indicated in a patient with a postoperative haemoglobin level of 9.8 g/l. Transfusion of pRBC is generally not recommended in patients with no signs of anaemic hypoxia and hae-moglobin in excess of 8 g/l [7].

28
5. Bibliography:
1)Brand B, Hartmann K, Kuhn M. Hämovigilanz − eineneue Dienstleistung der SANZ im Auftrag des Blut-spendedienstes (BSD) SRK − Hemovigilance −un nouveau service du CSPV à la demande du Service de transfusion sanguine (STS) CRS. Schweizerische Ärztezeitung − Bulletin des médecins suisses − Bollettino dei medici svizzeri, 1996. 77 (1): p. 18-20.
2)TRANSFUSIONSMEDIZINISCHE LABORUNTERSU-CHUNGEN AN PATIENTENPROBEN EMPFEHLUNGEN der SVTM und der B-CH SRK für Fachpersonen, Laboratorien und medizinische Institutionen zu immunhämatologischen und molekularen Untersuchungen an Patientenblutproben. 2015.
3)Gehrie EA, Tormey CA. The Influence of Clinical and Biological Factors on Transfusion-Associated Non-ABO Antigen Alloimmunization: Responders, Hyper-Responders, and Non-Responders. Transfusion medicine and hemotherapy: offizielles Organ der Deutschen Gesellschaft fur Transfusionsmedizin und Immunhamatologie 2014; 41(6): p. 420-9.
4)Kormoczi GF, Mayr WR. Responder individuality in red blood cell alloimmunization. Transfusion medicine and hemotherapy: offizielles Organ der Deutschen Gesellschaft fur Transfusionsmedizin und Immunhamatologie 2014; 41(6): p. 446-51.
5)McCullough, J., et al., Therapeutic efficacy and safe-ty of platelets treated with a photochemical process for pathogen inactivation: the SPRINT Trial. Blood, 2004. 104(5): p. 1534-41.
6)Gelderman, M.P., et al., Ultraviolet B light-exposed human platelets mediate acute lung injury in a two-event mouse model of transfusion. Transfusion, 2011. 51(11): p. 2343-57.
7)Querschnitts-Leitlinien zur Therapie mit Blutkompo-nenten und Plasmaderivaten (Bundesärztekammer Deutschland) 4. überarbeitete und aktualisierte Auflage 2014. http://www.bundesaerztekammer.de/fileadmin/user_upload/downloads/QLL_Haemotherapie_2014.pdf, 2014.

A
C
ompl
icat
ions
with
loca
l sym
ptom
sA
1
D
amag
ed v
esse
ls (b
lood
out
side
the
vess
els)
A1.
1
Hae
mat
oma
(bru
ise)
112
91
122
1.12
497
5610
.18
178
161
161
178
1.55
A1.
2
Arte
rial p
unct
ure
42
60.
050
0.00
64
26
0.05
A1.
3
Del
ayed
ble
edin
g (h
aem
atom
a de
laye
d)2
46
0.05
00.
006
24
60.
05A
2
C
ompl
icat
ions
mai
nly
char
acte
rized
by
pain
A2.
1
Ner
ve ir
ritat
ion
42
60.
050
0.00
64
26
0.05
A2.
2
Ner
ve in
jury
43
70.
060
0.00
74
37
0.06
A2.
3
Ten
don
inju
ry0
0.00
00.
000
00.
00A
2.4
O
ther
Pai
nful
arm
301
310.
287
71.
2738
371
380.
33A
3
Lo
calis
ed in
fect
ion/
infla
mm
atio
nA
3.1
T
hrom
boph
lebi
tis3
30.
030
0.00
33
30.
03A
3.2
L
ocal
alle
rgic
reac
tion
11
0.01
00.
001
11
0.01
Tota
l loc
al a
dver
se e
vent
s15
622
418
21.
6756
763
11.4
524
521
229
424
52.
14B
Com
plic
atio
ns m
ainl
y w
ith g
ener
aliz
ed s
ympt
oms:
vas
ovag
al
reac
tions
(VVR
)B
1
VV
R im
med
iate
401
482
451
4.13
213
244.
3647
542
251
247
54.
14B
2
VV
R im
med
iate
with
inju
ry9
90.
080
0.00
99
90.
08B
3
VV
R d
elay
ed8
53
160.
151
10.
1817
95
317
0.15
B4
VVR
del
ayed
with
inju
ry2
20.
020
0.00
22
20.
02To
tal v
asov
agal
reac
tions
(VVR
)40
964
547
84.
3822
325
4.55
503
431
675
503
4.39
C
C
ompl
icat
ions
rela
ted
to a
pher
esis
C1
Citr
ate
reac
tion
00.
004
61
112.
0011
46
111
0.10
C2
Hae
mol
ysis
00.
000
0.00
00
0.00
C3
Gen
eral
ised
alle
rgic
reac
tion
00.
000
0.00
00
0.00
C4
Air
embo
lism
00.
000
0.00
00
0.00
Tota
l com
plic
atio
ns re
late
d to
aph
eres
is0
0.00
46
111
2.00
114
61
110.
10D
Oth
er c
ompl
icat
ions
D1
C
ardi
ovas
cula
r eve
nts
D1.
1 A
ngin
a pe
ctor
is0
0.00
00.
000
00.
00D
1.2
Myo
card
ial i
nfar
ctio
n0
0.00
00.
000
00.
00D
1.3
TIA
00.
000
0.00
00
0.00
D1.
4 C
ereb
rova
scul
ar a
ccid
ent
00.
000
0.00
00
0.00
Tota
l Car
diov
ascu
lar e
vent
s0
0.00
00.
000
00.
00D
2
Oth
er c
ompl
icat
ions
, eve
nts
rare
ly re
port
edD
2
Tac
hyca
rdia
/Fat
igue
22
0.02
00.
002
22
0.02
Tota
l oth
er c
ompl
icat
ions
22
0.02
00.
002
22
0.02
Tota
l all
even
ts56
786
966
26.
0682
161
9918
.064
910
210
761
6.63
Dea
th0
0.00
00.
000
00.
00
*Gra
de 1
= m
ild; G
rade
2 =
mod
erat
e; G
rade
3 =
sev
ere
(see
repo
rting
form
for d
etai
ls)
**R
ate
= N
umbe
r of e
vent
s pe
r 100
0 do
natio
ns o
f the
thre
e re
porti
ng re
gion
al b
lood
ser
vice
s
Rat
e: /
1000
do
natio
ns*
Num
ber o
f eve
nts
Tota
lR
ate:
/10
00
dona
tions
*To
tal
Gra
de 1
Gra
de 2
Gra
de 3
Tota
lG
rade
1G
rade
2G
rade
3Su
b-to
tal
Num
ber o
f eve
nts
rela
ted
to w
hole
blo
od d
onat
ions
Rat
e: /
1000
do
natio
ns**
Num
ber o
f eve
nts
rela
ted
to a
pher
esis
Cat
egor
yG
rade
1*
Gra
de 2
Gra
de 3
Sub-
tota
l
Annex 1: Table: Cumulative reports of donor complications from 3 regional blood transfusion services (the three tables have been combined)