Abraham Lincoln Written by: Delores Malone Illustrated by: Stephen Costanza.
Habitat complexity in coral reefs:
patterns of degradation and consequences
for biodiversity
Lorenzo Alvarez Filip
Thesis submitted for the degree of Doctor of Philosophy
University of East Anglia, UK
October 2010
© This copy of the thesis has been supplied on condition that anyone who consults it is
understood to recognise that its copyright rests with the author and that no quotation
from the thesis, nor any information derived there from, may be published without the
author’s prior, written consent.
A mi familia, esta tesis no es más que el resultado
del amor y apoyo que he recibido
de ustedes a lo largo de mi vida
A México, por sus colores, por su magia, por su gente
Nature is not fragile . . . what is fragile are the
ecosystems services on which humans depend
Levin, S.
i
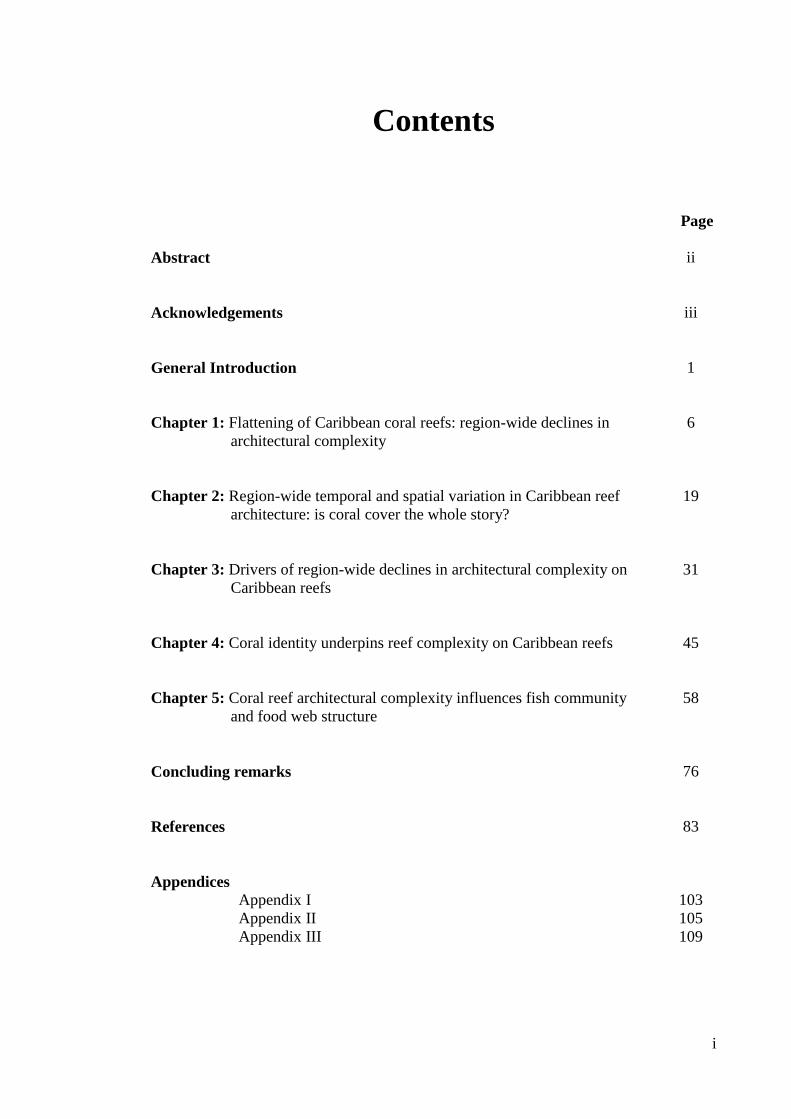
Contents
Page
Abstract
ii
Acknowledgements
iii
General Introduction
1
Chapter 1: Flattening of Caribbean coral reefs: region-wide declines in
architectural complexity
6
Chapter 2: Region-wide temporal and spatial variation in Caribbean reef
architecture: is coral cover the whole story?
19
Chapter 3: Drivers of region-wide declines in architectural complexity on
Caribbean reefs
31
Chapter 4: Coral identity underpins reef complexity on Caribbean reefs
45
Chapter 5: Coral reef architectural complexity influences fish community
and food web structure
58
Concluding remarks
76
References
83
Appendices
Appendix I
Appendix II
Appendix III
103
105
109
ii
Abstract
Habitat destruction and degradation are primary causes of loss of biodiversity and
ecosystem services. In the marine realm, there is the overwhelming concern about the
rates of decline of coral reefs, which sustain thousands of species and support millions
of livelihoods. Although declines in reef-building corals have been reported across
different regions of the world, the concomitant consequences for reef architectural
complexity have not been quantified to date. This in part is because the true nature of
the relationship between live coral cover and reef architecture has yet to be described in
detail. In this thesis, I describe the patterns of change in architectural complexity and
explore the relationships between reef complexity, coral cover and the identity of reef-
building corals in the Caribbean, a region in which coral reefs are highly threatened and
degraded.
Using an extensive database of studies reporting coral cover and reef rugosity
over the last 40 years, I provide region-wide analyses of changes in reef architectural
complexity. The results show that reef complexity has declined non-linearly with near
disappearance of the most complex reefs over the last 40 years. The loss of coral cover
is directly followed by reductions in complexity with little time-lag, and that there is
little correspondence between the overall rates of change in coral cover and reef
architecture, probably due to spatial variation in coral composition on reefs. Major
drivers of coral mortality, such as coral bleaching, do not immediately influence
architectural complexity, instead hurricane impacts and enhanced bioerosion inside
protected areas appear to be important drivers of the widespread loss of architecturally
complex reefs in the Caribbean.
Through detailed studies of coral reefs in Cozumel, Mexico, I then show that
although reef architectural complexity increases with coral cover, the rate of increase is
highly dependent on the identity of dominant corals, with important reef-building coral
such as Montastrea providing the most complex reefs. that the most complex remaining
reefs in Cozumel, particularly those dominated by robust Montastrea corals, support
fish assemblages with higher mean trophic levels and larger abundances of small-bodied
fishes. This highlights the importance of complex reefs for fish recruitment, and thus the
need to protect and enhance complex reef structures in order to maintain reef fisheries
and biodiversity in the Caribbean.
iii
Acknowledgements
Firstly and foremost, I would like to thank my supervisors for their guidance and
enthusiasm in the course of this project. Jenny Gill has been instrumental in the
planning of this project, but above all, I deeply appreciate the fact that she always had
time to listen my problems, and generally amazed me with her facility to find easy and
clever solutions. Nick Dulvy, introduced me to the world of „fancy‟ statistics, and his
enthusiasm, and passion inspired me to do my best and always look beyond the scope of
my results. Andrew Watkinson, committed many hours to discussing the specific details
of my work, and often helped to identify interesting and relevant angles for further
exploration. Isabelle Côté, although not my „official‟ supervisor, became increasingly
involved in my work over the course of my thesis. She always provided suggestions that
noticeable improved my research. - It was really an honour to work with such a great
group of scientist.
This thesis would not have been possible without the support of a great number of
people that have contributed to my professional development throughout the last
decade. I therefore also would like to thank many researchers and friends back in
Mexico, with whom I gave my first steps towards this thesis. Particularly I am very
grateful to my former supervisors, Enrique Lozano, Patricia Briones and Hector Reyes.
Some of the data used in this thesis were collected by other scientists, to whom I owe a
great debt of gratitude for all their work and help. Peter Edmunds (California State
University Northridge), Michelle Paddack (Santa Barbara City College), Philip Molloy
(University of British Columbia), Renata Goodridge and Hazel Oxenford (CARICOMP
Barbados), Francisco Geraldes (Universidad Autónoma de Santo Domingo and
CARICOMP) and Simon Pittman and the NOAA Biogeography Branch all generously
contributed unpublished data for the first three analytical chapters. The data used in
chapters four and five were collected by Roberto Hernandez Landa (Centro de
Investigación y de Estudios Avanzados, Merida), Marines Millet Encalada (Parque
Nacional Arrecifes de Cozumel) and myself.
iv
I am also very grateful to the Parque Nacional Arrecifes de Cozumel and the Comisión
Nacional de Áreas Naturales Protegidas of México, for providing permission and
support to carry out part of this research inside the marine reserve. I especially would
like to thank Marines Millet, Lalo Brito, Beto Landa, „El Toro‟ and „El Capy‟ for their
help and friendship during field surveys in my dear island.
I am very grateful to my friends of the „Interdisciplinary group for coral reef
research‟(UEA) and E2O group (SFU) who provide important and enriching discussion
about societal and ecological aspects of marine resources. Particularly I would like to
thank Maria Uyarra, Rady Talaat, Johanna Forster, and Allison Perry in Norwich; and
Maria Jose, Michelle Paddack, Phill Moloy, Jen Sunday, Emily Darling in Vancouver
for their always useful advices. Most recently, the “Stranglelers” group and friends
from the Cabbage office provide me a great intellectual environment.
Friends at UEA made working there a great experience. In particular, I would like to
thank Andres Bucio, Manolo Canto, Clemet Inkamba, Karla Alcantar, Jorge Vazquez,
Karel Castro, Frida Güiza, Chomphoo Kaewprasert, Sue Palminteri for their friendship,
encouragement and support. In Mexico and other cities in England Gaby Cruz, Iris
Segura, Gerardo Rios, Diana Vazquez, Javier Santillán, Francisco Nettel, Karina
Ramirez among many other friends always supported me despite the distance. Finally, I
would like to thank Alba for being there with me, for brighten with her smile all the
difficulties that I went through.
This research was entirely funded by Mexico throughout the Consejo Nacional de
Ciencia y Tecnología, CONACyT (scholarship 171864) and the Secretaria de
Educación Publica (programa de becas complementarias a estudiantes en el
extranjero).
1
General Introduction
Global ecosystems are changing at an unprecedented rate, largely as a consequence of
several human-induced drivers of change (Pimm et al. 1995; Vitousek et al. 1997; Sala
et al. 2000; Hoekstra et al. 2005). Although recent international efforts to halt rates of
loss (Balmford & Bond 2005), most indicators of the state of biodiversity indicate
ongoing declines, with no significant reductions in rate (Butchart et al. 2010). Habitat
degradation has been shown to be one of the primary causes of species endangerment
and ecosystem simplification (Pimm et al. 1995; Tilman et al. 2001), and habitat loss is
considered to be a significant cause of increased risk of extinction in many terrestrial
and marine species (Temple & Cary 1988; Owens & Bennett 2000; Dulvy et al. 2003;
Costello et al. 2010). The degradation of habitat also has a considerable effect on the
capacity of ecosystems to provide fundamental environmental services. For example,
the loss of forest cover can reduce water flow and yield to agricultural and urban areas
(Maass et al. 2005; Brauman et al. 2007), and degraded coastal ecosystems are
associated with reduced fisheries yields and increasing social and economic costs
following tropical storm impacts (Aburto-Oropeza et al. 2008; Costanza et al. 2008).
The understanding of the trends, drivers and consequences of habitat loss may therefore
help to prioritise the conservation efforts to restore the benefits that ecosystems provide
to biodiversity and humans.
Coral reefs are highly heterogeneous marine environments. They make up only
0.2% in area of marine environments, and yet they harbour around one third of all
described marine species (Reaka-Kudla 2001; Spalding et al. 2001). Unfortunately they
are also among the most rapidly changing ecosystems in the world (Bryant et al. 1998;
Halpern et al. 2007). Drivers of coral reefs degradation range from direct damage due to
destructive human practices (McManus 1997; Barker & Roberts 2004; Saphier &
Hoffmann 2005), to the loss of ecological resilience due to the harmful algal blooms
resulting from the loss of herbivory and coastal eutrophication (Fabricius et al. 2005;
Mumby 2006). More recently, climate change has emerged as an additional and serious
threat to coral reefs, which can be manifest in at least three ways. Current rates of
increases in sea temperatures have been associated with widespread bleaching events, in
which temperature-induced stress results in the loss of symbiotic algae that live within
2
coral tissue; (Hoegh-Guldberg 1999; Hoegh-Guldberg et al. 2007; Veron et al. 2009),
and disease outbreaks (Harvell et al. 2002; Bruno et al. 2007). In addition, increasing
CO2 concentrations poses the threat of ocean acidification, which may result in the
dissolution and/or reduced deposition of the calcium carbonate skeletons of reef
building corals (Kleypas et al. 1999; Hoegh-Guldberg et al. 2007; Kleypas & Yates
2009). Finally, rising sea levels, primarily as a consequence of thermal expansion
resulting from global warming, may potentially drown some reefs (Pittock 1999;
Barnett & Adger 2003; Veron et al. 2009).
Reef deterioration may occur as a direct response to an individual stressor such
as mass bleaching (Darling et al. 2010), but it more commonly occurs in response to
combinations of different stressors acting simultaneously, and occasionally
synergistically, to increase coral mortality or reduce coral growth and reproduction
(Green & Bruckner 2000; Hughes et al. 2003; Crain et al. 2008; Darling & Côté 2008).
After mass bleaching events, for example, coral growth may remain suppressed for
considerable periods of time in sites with high anthropogenic stressors (Carilli et al.
2009; 2010). As result of this wide range of drivers of change and their interactions, the
cover of reef-building corals has decreased rapidly on tropical reefs throughout the
world (Gardner et al. 2003; Bellwood et al. 2004; Bruno & Selig 2007), which has
resulted in the loss of a least 20% of the total cover of tropical reefs. Most of the
remaining coral reefs are seriously perturbed and threatened (Wilkinson 2008).
The ecological degradation of coral reefs is likely to affect the associated
ecosystem goods and services provided to humanity (Costanza et al. 1997; Adger et al.
2005; Balmford & Bond 2005). The world’s coral reefs support the livelihood of well
over 250 million people, especially in the developing world, providing protein in the
form of fisheries resources and supporting a global tourism industry (Moberg & Folke
1999; Cinner et al. 2009; Hughes 2009). In addition, reef systems protect essential
mangrove, seagrass and lagoon habitat that are support vulnerable life stages of a wide
range of commercially exploited species (Nagelkerken et al. 2002; Mumby et al. 2004),
and shield coastlines from wave erosion and tropical storms (Gourlay & Colleter 2005;
Sheppard et al. 2005; Koch et al. 2009). The consequences of coral reef destruction
would not be limited to the loss of the value of these goods and services, but the demise
of reefs would also represent the lost of a large proportion of the world’s marine
biodiversity (Veron et al. 2009). For example, within reef-building corals alone, one
3
third of species are currently facing increasing risks of extinction (Carpenter et al.
2008).
Because of the importance of hard coral cover in building and structuring the
reef matrix, most of the interest in understanding and protecting against reef degradation
has focused on exploring the trends, drivers and consequences of the loss of live coral
cover (e.g. Gardner et al. 2003; Côté et al. 2006; Gill et al. 2006; Bruno & Selig 2007;
Schutte et al. 2010). However, most of the ecological and socio-economic value of coral
reefs is provided not just by the cover of live coral, but also by the intricate three-
dimensional architecture that reef corals promote. Reef architectural complexity is
therefore more likely to have substantial ecological, economical and social relevance.
For instance, reef complexity is strongly related to the availability of shelter and refugia,
and consequently to fish and invertebrate richness, abundance and biomass (e.g. Risk
1972; Dulvy et al. 2002; Gratwicke & Speight 2005; Idjadi & Edmunds 2006; Wilson
et al. 2007). Reef architectural complexity also plays a key role in providing additional
important environmental services to humans such as coastal protection. Wave energy
transmitted over reefs is significantly dissipated by the friction exerted by bottom
roughness (Lugo-Fernandez et al. 1998; Sheppard et al. 2005). A decreased
architectural complexity would therefore be expected to offer less resistance to water
flow, thus increasing the risks of coastal erosion and flooding of low-lying areas, with
associated heightened economic and social costs for coastal communities. The
consequences of reef-framework degradation for shoreline protection were apparent in
Sri Lanka during the 2004 tsunami, when sections of coastline for which reef structure
had been impacted by poaching and mining were unable to provide an effective buffer
against the wave energy, and water inundation and wave heights were considerably
more severe than in those areas protected by healthy reefs (Kunkel et al. 2006;
Fernando et al. 2008).
Despite the importance of reef architectural complexity, little is known of how
current losses in the cover of reef-building corals and associated components of benthic
communities influence reef complexity. The Caribbean is unfortunately an
exceptionally good model system in which to explore these issues, given the dramatic
degradation that has been evident across the region in recent decades. Caribbean reefs
have been intensively studied since the 1970s, enabling a detailed description of
changes in biodiversity (live coral cover, macroalgae and fishes; Gardner et al. 2003;
4
Bruno et al. 2009; Paddack et al. 2009; Schutte et al. 2010), and the effects of the major
drivers of change including hurricanes, diseases outbreaks, overfishing and human-
induced climate change (Aronson & Precht 2001; Jackson et al. 2001; Gardner et al.
2005; McWilliams et al. 2005; Sheppard & Rioja-Nieto 2005; Aronson & Precht 2006).
Declines in coral cover started in the late 1970s, when the major reef-formers Acropora
palmata and A. cervicornis (Elkhorn and Staghorn corals) suffered dramatic population
reductions as result of widespread infection with white-band disease (Aronson & Precht
2001, 2006; Schutte et al. 2010). Thereafter, the die-off of the black sea urchin
(Diadema antillarum), a major consumer of macroalgae, combined with the long-term
depletion of herbivorous fishes through over-fishing, facilitated the gradual increase in
macroalgae on many reef sites (Carpenter 1988; Jackson et al. 2001; Bruno et al. 2009).
More recently, reef-building corals in the Caribbean and elsewhere face new threats
from the increase in atmospheric green house gases, as coral bleaching and mortality
become progressively worse as thermal anomalies intensify and lengthen, and ocean
acidification is compromising carbonate accretion and therefore the reef building
process (Hughes et al. 2003; McWilliams et al. 2005; Hoegh-Guldberg et al. 2007).
Thesis outline
In this thesis, I use a combination of regional and local-scale analyses to investigate
three major questions: (1) how has reef architectural complexity changed in the
Caribbean, (2) how do coral cover and different drivers of change on reefs influence
reef complexity, and (3) what are the consequences of the degradation of reef
complexity for reef-associated fishes? As local differences in reef structure and
composition can make it difficult to scale-up findings from small-scale studies (Levin
1992; Hughes & Connell 1999; Purvis & Hector 2000; Pandolfi et al. 2005) and thus
identify the effects of different drivers (Aronson & Precht 2006; Bruno & Selig 2007;
Halpern et al. 2007), in the first three chapters I use a large-scale approach to explore
patterns of change at the region-wide level. Following on from these studies, I then
carry out a detailed local-scale field study in order to identify the mechanisms that are
likely to influence the large-scale patterns, and to explore the possible consequences for
reef-associated biodiversity.
5
In Chapter 1, I provide a region-wide analysis describing the trend in change of
reef architectural complexity since the 1970s, and explore whether these trends vary
between different sub-regions and depth strata. Chapter 2 focuses on exploring the
temporal and spatial covariation between live coral cover and reef architectural
complexity, using a Caribbean-wide dataset of temporally-replicated measures of reef
structure spanning four decades. In Chapter 3, I use a meta-analysis to examine how
annual rates of change in architectural complexity across the Caribbean are influenced
by three key drivers of change on coral reefs: hurricanes, coral bleaching and fisheries.
Chapter 4 uses field data that I collected in Cozumel, Mexico to explore the
contribution of different types of coral to reef architectural complexity. Specifically I
explore the role of coral diversity, coral community composition and the taxonomic and
functional attributes of coral dominance. Chapter 5 examines the influence of the
architectural complexity of reef-building corals on reef- associated fishes. In particular,
I compare diversity, abundance, biomass and the trophic and size structure of reef fishes
along a gradient of coral cover, species dominance and architectural complexity.
Finally, in the Concluding remarks, I synthesize the key findings of this research and
discuss the implications for coral reef management, and future research
6
Chapter 1
Flattening of Caribbean coral reefs: region-wide declines
in architectural complexity
Abstract
Coral reefs are rich in biodiversity, in large part because their highly complex
architecture provides shelter and resources for a wide range of organisms. Recent rapid
declines in hard coral cover have occurred across the Caribbean region, but the
concomitant consequences for reef architecture have not been quantified on a large scale
to date. We provide the first region-wide analysis of changes in reef architectural
complexity, using nearly 500 surveys across 200 reefs, between 1969 and 2008. The
architectural complexity of Caribbean reefs has declined non-linearly with near
disappearance of the most complex reefs over the last 40 years. The flattening of
Caribbean reefs was apparent by the early 1980s, followed by a period of stasis between
1985 and 1998 and then a resumption of the decline in complexity to the present. Rates
of loss are similar on shallow (< 6 m), mid-water (6 - 20 m) and deep (> 20 m) reefs and
are consistent across all five subregions. The temporal pattern of declining architecture
coincides with key events in recent Caribbean ecological history: the loss of
structurally-complex Acropora corals, the mass mortality of the grazing urchin Diadema
antillarum, and the 1998 ENSO-induced world-wide coral bleaching event. The
consistently low estimates of current architectural complexity suggest regional-scale
degradation and homogenisation of reef structure. The widespread loss of architectural
complexity is likely to have serious consequences for reef biodiversity, ecosystem
functioning and associated environmental services.
Published:
Alvarez-Filip L., Dulvy N.K., Gill J.A., Côté I.M. & Watkinson A.R. (2009). Flattening
of Caribbean coral reefs: region-wide declines in architectural complexity. Proceedings
of the Royal Society B: Biological Sciences, 276, 3019-3025.
7
Introduction
The physical structure of a habitat profoundly influences its associated biodiversity and
ecosystem functioning (MacArthur & MacArthur 1961), with more complex habitats
facilitating species coexistence through niche partitioning and the provision of refuges
from predators and environmental stressors (Bruno & Bertness 2001; Willis et al.
2005). In tropical shallow waters, the calcium carbonate skeletons of stony corals
contribute to reef frameworks that sustain the most diverse ecosystem in our seas
(Spalding et al. 2001). However, coral reefs have been heavily impacted worldwide by a
combination of local and global stressors, including overfishing, climate change-
induced coral bleaching, eutrophication and diseases (Hughes et al. 2003). The marked
declines in live hard coral cover documented over recent decades throughout the
Caribbean and the Indo-Pacific regions (Gardner et al. 2003; Bruno & Selig 2007)
exceed those reported for many other foundation species in terrestrial or marine
ecosystems (Balmford et al. 2003). However, in contrast to other ecosystems where
degradation usually indicates reductions in habitat area (e.g., deforestation), decreases in
live coral cover on coral reefs do not immediately result in loss of available habitat
because the reef framework can persist long after the death of corals.
In the Caribbean, declines in live coral cover began in the late 1970s, when
substantial loss of the major reef-forming corals Acropora palmata and A. cervicornis
occurred as a result of with white-band disease (Aronson & Precht 2001). Coral
mortality, in combination with the mass mortality of the black sea urchin (Diadema
antillarum), which was a major remover of algae, and the long-term depletion of
herbivorous fishes through overfishing, facilitated phase-shifts to macroalgal dominance
on many reefs (Carpenter 1988; Precht & Aronson 2006). In the Caribbean and
elsewhere, reef-building corals now face new threats from climate change, particularly
in the form of thermally-induced coral bleaching and mortality, which are becoming
increasingly frequent and extensive as thermal anomalies intensify and lengthen
(Hughes et al. 2003; McWilliams et al. 2005).
A potential consequence of the widespread reduction in Caribbean coral cover is
a reversal of the historic net accretion of calcium carbonate, resulting in a decrease in
calcification and erosion of the reef framework. At local scales, hard coral mortality is
8
associated with the loss of architectural complexity and „reef flattening‟ after direct
impacts, such as hurricanes through the breakage of coral skeletons (e.g. Rogers et al.
1982). Reefs may also erode gradually owing to the natural activity of host organisms,
such as herbivorous fishes and sea urchins, and by physical abrasion or geochemical
shifts. However, widespread mortality of hard corals, for example after severe bleaching
events moves the balance toward net reef erosion (Sheppard et al. 2002). These impacts
could be exacerbated in the future by ocean acidification, which is expected to enhance
calcium carbonate dissolution with negative consequences, initially for coral growth and
eventually for the entire reef framework (Hoegh-Guldberg et al. 2007).
The ecological and socio-economic consequences of declining architectural
complexity are likely to be substantial (Pratchett et al. 2008). For many reef organisms,
risk of predation is influenced by access to refuges, and the densities of herbivores and
grazing rates typically increase with architectural complexity (Beukers & Jones 1997;
McClanahan 1999; Almany 2004; Lee 2006). Consequently the species richness,
abundance and biomass of coral reef fishes and invertebrates are all influenced by
architectural complexity (e.g. Gratwicke & Speight 2005; Idjadi & Edmunds 2006;
Wilson et al. 2007). The loss of architectural complexity may therefore drive declines in
diversity, particularly of habitat specialists, and compromise fisheries productivity
through elevated post-settlement mortality (Beukers & Jones 1997; Graham et al. 2007).
Reef architectural complexity also plays a key role in providing important
environmental services to humans, including enhancing coastal protection through the
dissipation of wave energy transmitted over reefs (Lugo-Fernandez et al. 1998).
While recent regional-scale analyses have revealed declines in hard coral cover
(Gardner et al. 2003; Bruno & Selig 2007), the consequences for reef habitat
complexity on a similar large scale have not been quantified. The capacity of reefs to
continue to perform key functions of refuge provision and coastal protection will
depend on whether reef architecture persists for a substantial period of time following
the loss of live coral. Here we collate published and unpublished estimates of reef
complexity spanning four decades from reefs across the Caribbean, a region with clear
evidence of recent declines in coral cover. We explore the rate and timing of changes in
reef architecture in relation to region-wide events, such as the demise of Acropora
corals and grazing urchins. As the drivers of reef degradation are apparent throughout
9
the Caribbean, we also examine whether the patterns are consistent throughout the
entire region.
Material and methods
Estimating architectural complexity
Habitat complexity on coral reefs has been measured using a variety of methods which
differ in the attributes measured, the scale of measurement and the degree of
subjectivity (with attendant variation in inter-observer comparability). To determine
which methods are commonly used by researchers to measure habitat complexity on
coral reefs, we conducted a preliminary literature search using the ISI web of
Knowledge in July 2007 for papers containing any of the following words in the title,
abstract or keywords: “rugosity”, “spatial heterogeneity”, “spatial index”, “habitat
structure”, “habitat complexity”, “structural complexity”, “substratum complexity”,
“reef relief”, “coral complexity”, and “complexity index”. Additionally, the same words
were searched in the entire text of the 1368 papers published in Volumes 1 (June 1982)
to 26 (September 2007) of the journal Coral Reefs. We retained all papers that reported
work carried out in the Caribbean and in which the methodology used to measure
architectural complexity was clearly explained. A total of 49 papers met these two
criteria. The description and frequency of use of the various methodologies used to
describe habitat complexity in Caribbean coral reefs are presented in table 1.
The rugosity index is by far the most widely used method for measuring reef
architectural complexity (table 1), and is generally highly correlated with other methods
(Wilson et al. 2007). Studies reporting the rugosity index were therefore chosen to
quantify spatial and temporal variation in the architectural complexity of reefs across
the Caribbean.
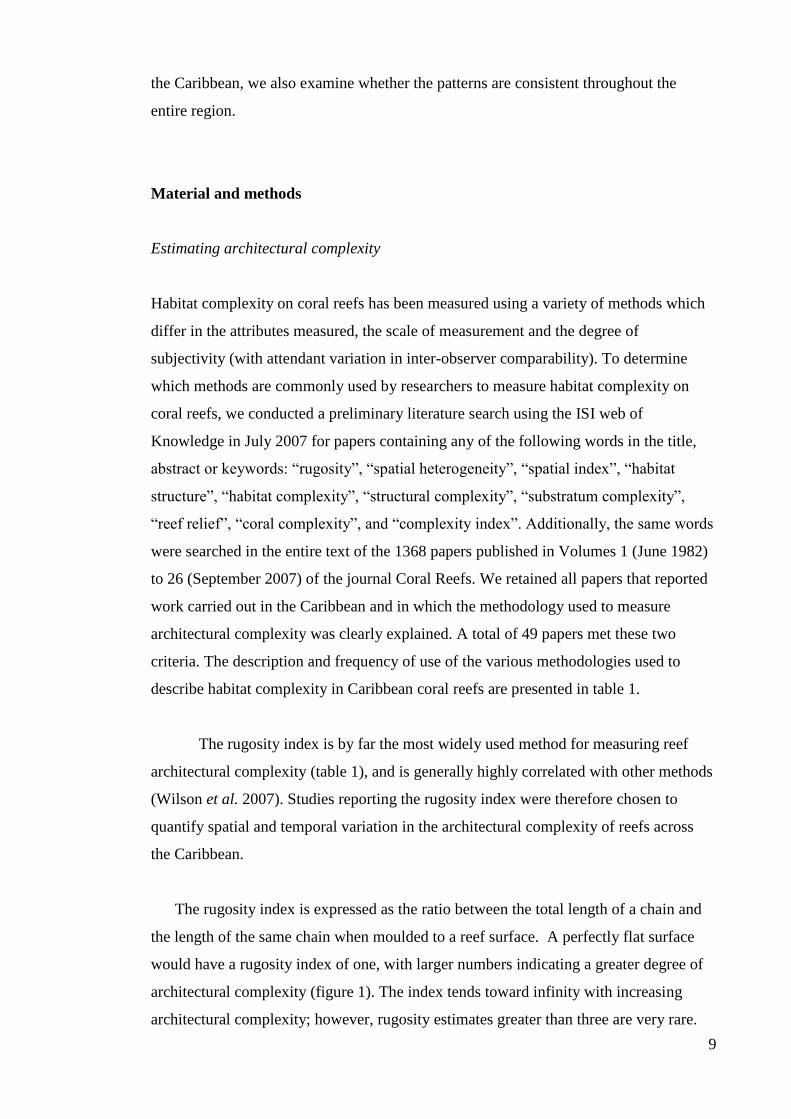
The rugosity index is expressed as the ratio between the total length of a chain and
the length of the same chain when moulded to a reef surface. A perfectly flat surface
would have a rugosity index of one, with larger numbers indicating a greater degree of
architectural complexity (figure 1). The index tends toward infinity with increasing
architectural complexity; however, rugosity estimates greater than three are very rare.
10
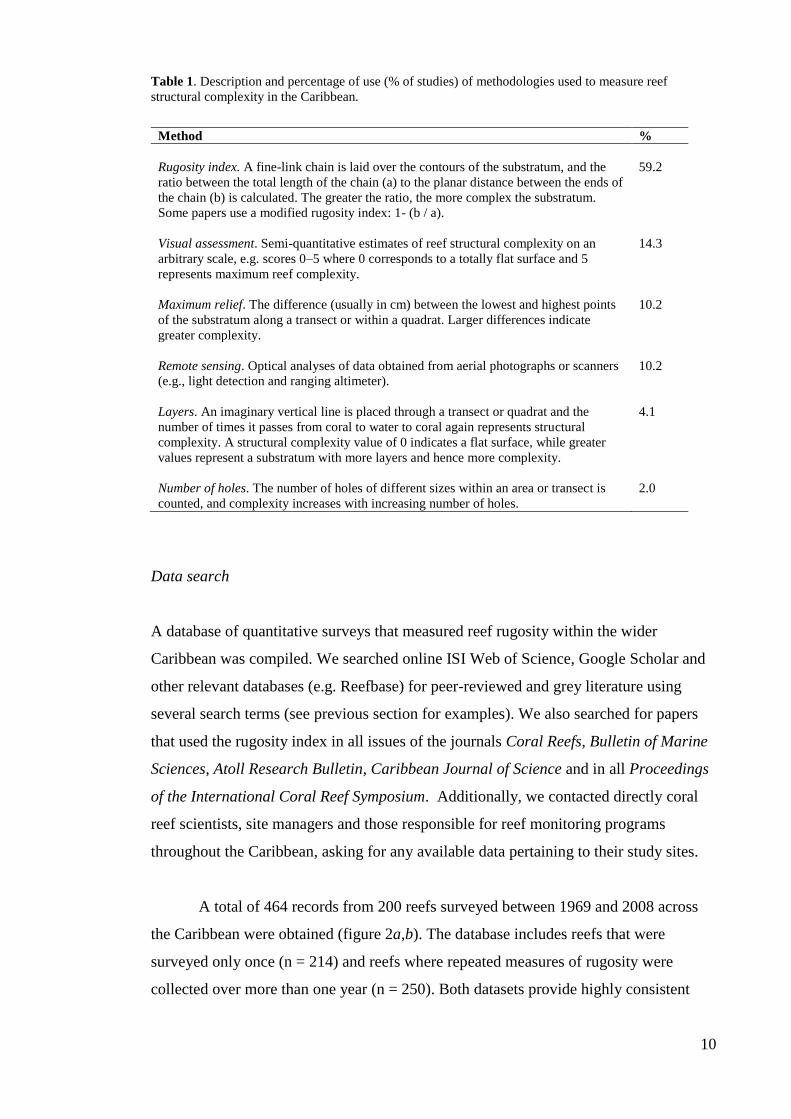
Table 1. Description and percentage of use (% of studies) of methodologies used to measure reef
structural complexity in the Caribbean.
Method %
Rugosity index. A fine-link chain is laid over the contours of the substratum, and the
ratio between the total length of the chain (a) to the planar distance between the ends of
the chain (b) is calculated. The greater the ratio, the more complex the substratum.
Some papers use a modified rugosity index: 1- (b / a).
59.2
Visual assessment. Semi-quantitative estimates of reef structural complexity on an
arbitrary scale, e.g. scores 0–5 where 0 corresponds to a totally flat surface and 5
represents maximum reef complexity.
14.3
Maximum relief. The difference (usually in cm) between the lowest and highest points
of the substratum along a transect or within a quadrat. Larger differences indicate
greater complexity.
10.2
Remote sensing. Optical analyses of data obtained from aerial photographs or scanners
(e.g., light detection and ranging altimeter).
10.2
Layers. An imaginary vertical line is placed through a transect or quadrat and the
number of times it passes from coral to water to coral again represents structural
complexity. A structural complexity value of 0 indicates a flat surface, while greater
values represent a substratum with more layers and hence more complexity.
4.1
Number of holes. The number of holes of different sizes within an area or transect is
counted, and complexity increases with increasing number of holes.
2.0
Data search
A database of quantitative surveys that measured reef rugosity within the wider
Caribbean was compiled. We searched online ISI Web of Science, Google Scholar and
other relevant databases (e.g. Reefbase) for peer-reviewed and grey literature using
several search terms (see previous section for examples). We also searched for papers
that used the rugosity index in all issues of the journals Coral Reefs, Bulletin of Marine
Sciences, Atoll Research Bulletin, Caribbean Journal of Science and in all Proceedings
of the International Coral Reef Symposium. Additionally, we contacted directly coral
reef scientists, site managers and those responsible for reef monitoring programs
throughout the Caribbean, asking for any available data pertaining to their study sites.
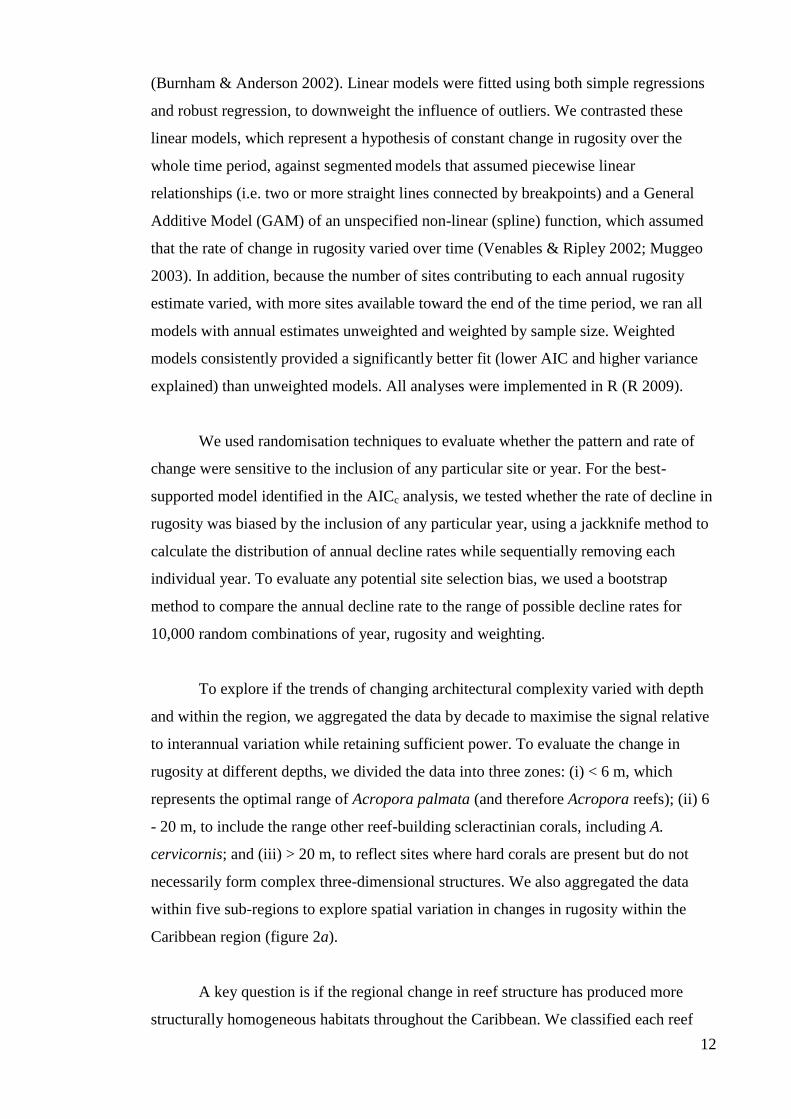
A total of 464 records from 200 reefs surveyed between 1969 and 2008 across
the Caribbean were obtained (figure 2a,b). The database includes reefs that were
surveyed only once (n = 214) and reefs where repeated measures of rugosity were
collected over more than one year (n = 250). Both datasets provide highly consistent
11
results (see table 2 and table A1.1 in Appendix 1). We therefore only present findings
from the whole dataset, because it offers a wider spatial and temporal representation.
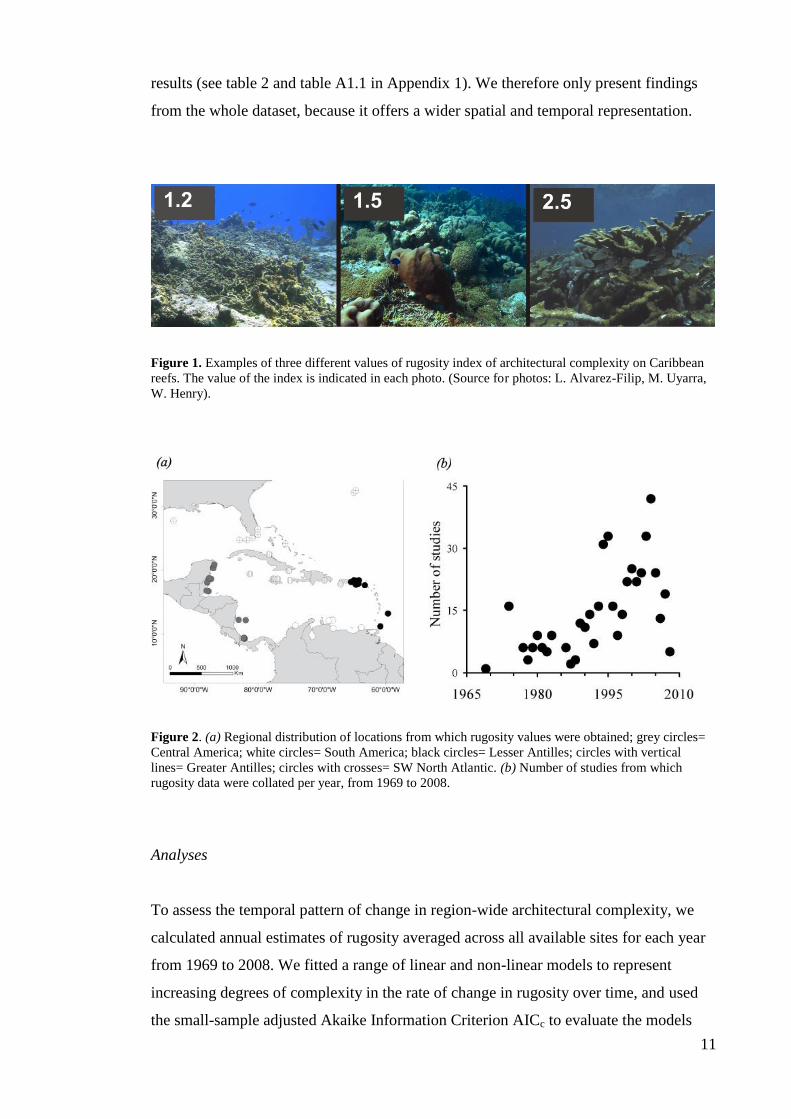
Figure 1. Examples of three different values of rugosity index of architectural complexity on Caribbean
reefs. The value of the index is indicated in each photo. (Source for photos: L. Alvarez-Filip, M. Uyarra,
W. Henry).
Figure 2. (a) Regional distribution of locations from which rugosity values were obtained; grey circles=
Central America; white circles= South America; black circles= Lesser Antilles; circles with vertical
lines= Greater Antilles; circles with crosses= SW North Atlantic. (b) Number of studies from which
rugosity data were collated per year, from 1969 to 2008.
Analyses
To assess the temporal pattern of change in region-wide architectural complexity, we
calculated annual estimates of rugosity averaged across all available sites for each year
from 1969 to 2008. We fitted a range of linear and non-linear models to represent
increasing degrees of complexity in the rate of change in rugosity over time, and used
the small-sample adjusted Akaike Information Criterion AICc to evaluate the models
12
(Burnham & Anderson 2002). Linear models were fitted using both simple regressions
and robust regression, to downweight the influence of outliers. We contrasted these
linear models, which represent a hypothesis of constant change in rugosity over the
whole time period, against segmented models that assumed piecewise linear
relationships (i.e. two or more straight lines connected by breakpoints) and a General
Additive Model (GAM) of an unspecified non-linear (spline) function, which assumed
that the rate of change in rugosity varied over time (Venables & Ripley 2002; Muggeo
2003). In addition, because the number of sites contributing to each annual rugosity
estimate varied, with more sites available toward the end of the time period, we ran all
models with annual estimates unweighted and weighted by sample size. Weighted
models consistently provided a significantly better fit (lower AIC and higher variance
explained) than unweighted models. All analyses were implemented in R (R 2009).
We used randomisation techniques to evaluate whether the pattern and rate of
change were sensitive to the inclusion of any particular site or year. For the best-
supported model identified in the AICc analysis, we tested whether the rate of decline in
rugosity was biased by the inclusion of any particular year, using a jackknife method to
calculate the distribution of annual decline rates while sequentially removing each
individual year. To evaluate any potential site selection bias, we used a bootstrap
method to compare the annual decline rate to the range of possible decline rates for
10,000 random combinations of year, rugosity and weighting.
To explore if the trends of changing architectural complexity varied with depth
and within the region, we aggregated the data by decade to maximise the signal relative
to interannual variation while retaining sufficient power. To evaluate the change in
rugosity at different depths, we divided the data into three zones: (i) < 6 m, which
represents the optimal range of Acropora palmata (and therefore Acropora reefs); (ii) 6
- 20 m, to include the range other reef-building scleractinian corals, including A.
cervicornis; and (iii) > 20 m, to reflect sites where hard corals are present but do not
necessarily form complex three-dimensional structures. We also aggregated the data
within five sub-regions to explore spatial variation in changes in rugosity within the
Caribbean region (figure 2a).
A key question is if the regional change in reef structure has produced more
structurally homogeneous habitats throughout the Caribbean. We classified each reef
13
into one of five rugosity index categories (1.0-1.49, 1.5-1.99, 2.0-2.49, 2.5-2.99, >3.0)
to explore the change in region-wide representation of complex (rugosity > 2.0) and
flatter (rugosity ≤ 1.5) reefs for the four different decades.
Results
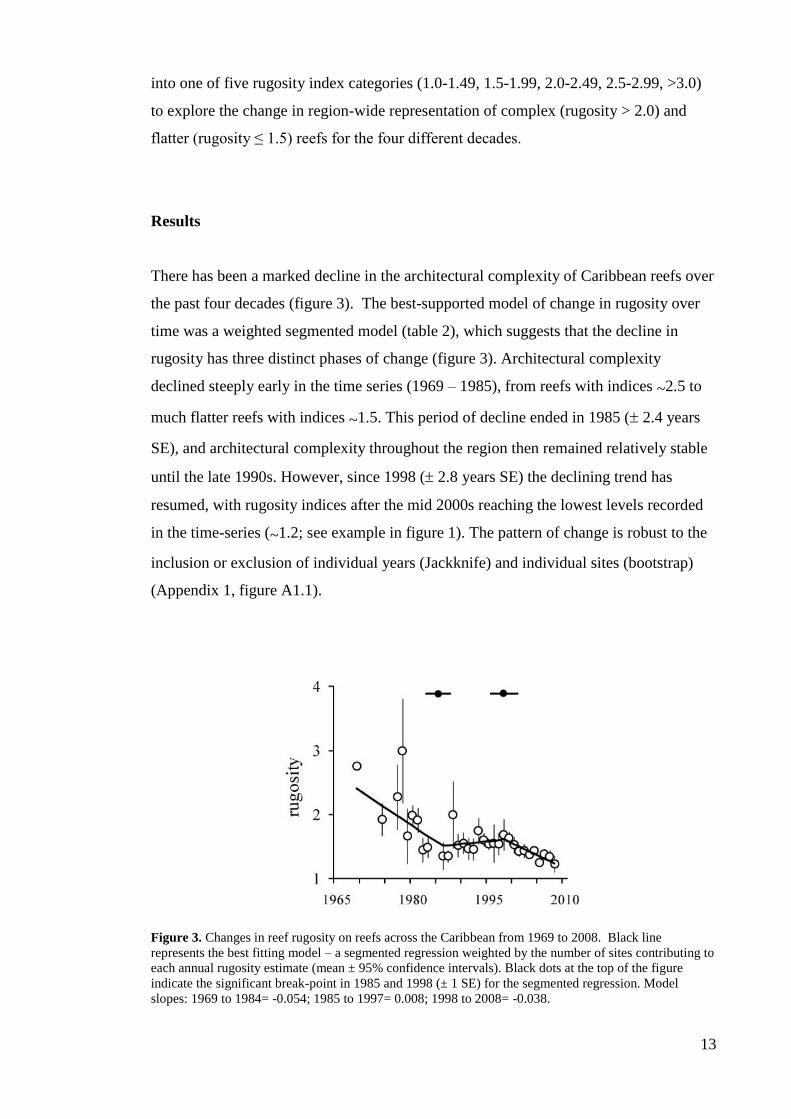
There has been a marked decline in the architectural complexity of Caribbean reefs over
the past four decades (figure 3). The best-supported model of change in rugosity over
time was a weighted segmented model (table 2), which suggests that the decline in
rugosity has three distinct phases of change (figure 3). Architectural complexity
declined steeply early in the time series (1969 – 1985), from reefs with indices ~2.5 to
much flatter reefs with indices ~1.5. This period of decline ended in 1985 ( 2.4 years
SE), and architectural complexity throughout the region then remained relatively stable
until the late 1990s. However, since 1998 ( 2.8 years SE) the declining trend has
resumed, with rugosity indices after the mid 2000s reaching the lowest levels recorded
in the time-series (~1.2; see example in figure 1). The pattern of change is robust to the
inclusion or exclusion of individual years (Jackknife) and individual sites (bootstrap)
(Appendix 1, figure A1.1).
Figure 3. Changes in reef rugosity on reefs across the Caribbean from 1969 to 2008. Black line
represents the best fitting model – a segmented regression weighted by the number of sites contributing to
each annual rugosity estimate (mean ± 95% confidence intervals). Black dots at the top of the figure
indicate the significant break-point in 1985 and 1998 (± 1 SE) for the segmented regression. Model
slopes: 1969 to 1984= -0.054; 1985 to 1997= 0.008; 1998 to 2008= -0.038.
14
Table 2. Model structure and the temporal pattern of change in Caribbean architectural complexity.
Summary of Akaike Information Criterion analysis of linear and non-linear models of change in yearly
mean rugosity (derived from all 464 estimates), ordered by decreasing weight. Models in which annual
rugosity estimates have been weighted by sample size are indicated (wt). df = degrees of freedom of the
model (for GAM we use the estimated degrees of freedom). AICc is the Akaike Information Criterion
corrected for small sample size. Δ is the difference in AICc between a given model and the best-supported
model (indicated in bold). W is the Akaike weight, which represents the probability that a given model is
the best of those models considered.
Model R2 Slope df AICc Δ AICc AICc W
Segmented model (wt) 0.64 -0.028* 26 -25.8 0 0.8695
Linear model (wt) 0.53 -0.019 30 -17.1 8.7 0.0112
Robust linear model (wt) - -0.018 30 -16.9 8.8 0.0107
Segmented model 0.65 -0.038* 26 -2.9 22.9 0.0000
Generalized additive model (wt) 0.99 -0.033* 3.6 0.1 25.8 0.0000
Linear model 0.49 -0.026 30 9.4 35.2 0.0000
Robust linear model - -0.021 30 11.2 37 0.0000
Generalized additive model 0.59 -0.044* 3.3 22.8 48.6 0.0000
*average slope of the different model segments
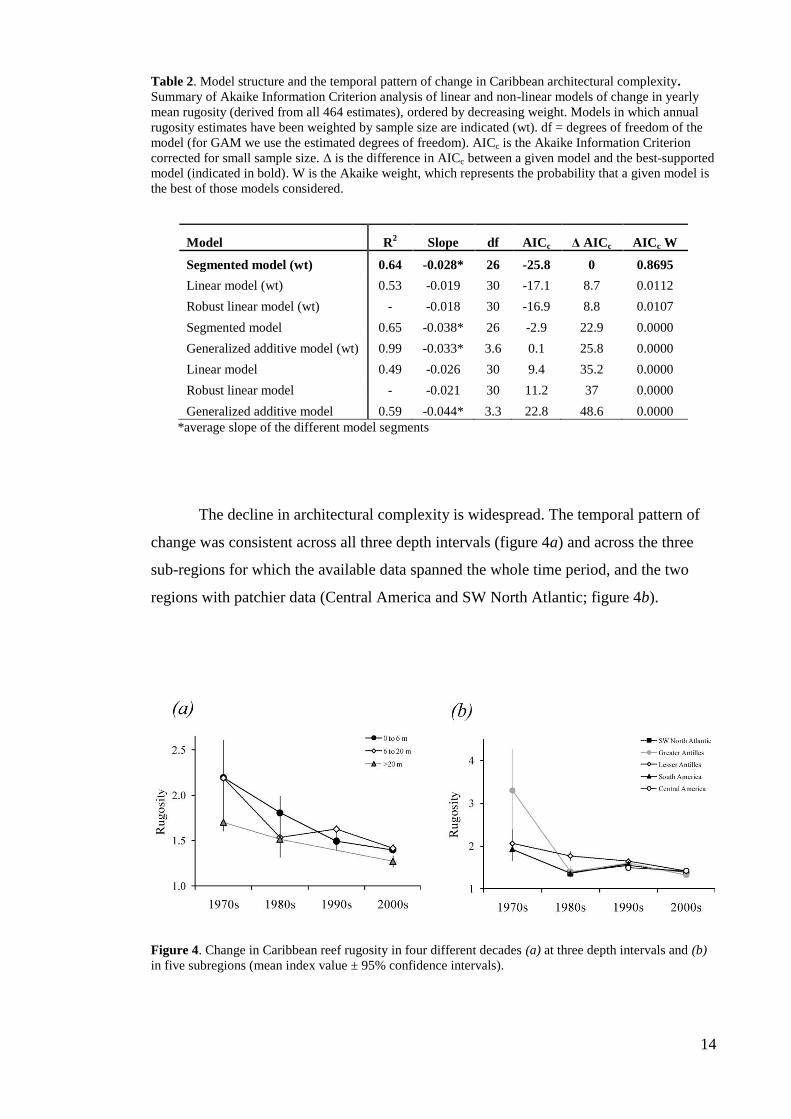
The decline in architectural complexity is widespread. The temporal pattern of
change was consistent across all three depth intervals (figure 4a) and across the three
sub-regions for which the available data spanned the whole time period, and the two
regions with patchier data (Central America and SW North Atlantic; figure 4b).
Figure 4. Change in Caribbean reef rugosity in four different decades (a) at three depth intervals and (b)
in five subregions (mean index value ± 95% confidence intervals).
15
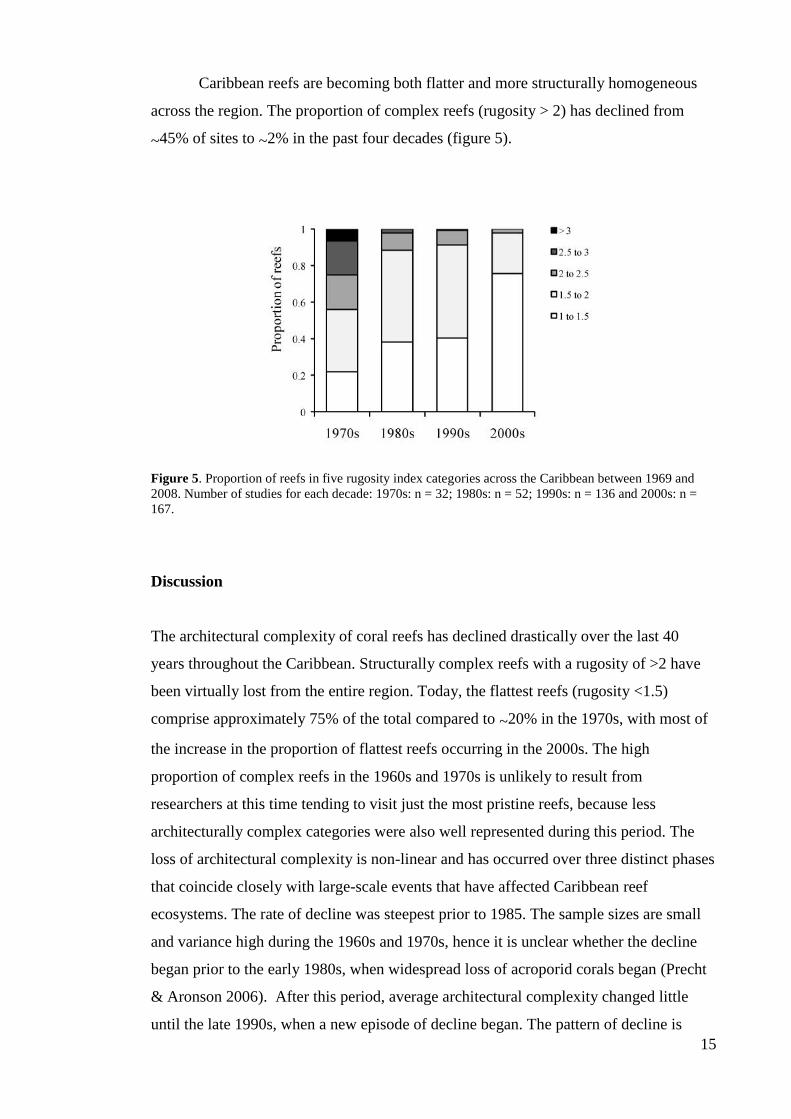
Caribbean reefs are becoming both flatter and more structurally homogeneous
across the region. The proportion of complex reefs (rugosity > 2) has declined from
~45% of sites to ~2% in the past four decades (figure 5).
Figure 5. Proportion of reefs in five rugosity index categories across the Caribbean between 1969 and
2008. Number of studies for each decade: 1970s: n = 32; 1980s: n = 52; 1990s: n = 136 and 2000s: n =
167.
Discussion
The architectural complexity of coral reefs has declined drastically over the last 40
years throughout the Caribbean. Structurally complex reefs with a rugosity of >2 have
been virtually lost from the entire region. Today, the flattest reefs (rugosity <1.5)
comprise approximately 75% of the total compared to ~20% in the 1970s, with most of
the increase in the proportion of flattest reefs occurring in the 2000s. The high
proportion of complex reefs in the 1960s and 1970s is unlikely to result from
researchers at this time tending to visit just the most pristine reefs, because less
architecturally complex categories were also well represented during this period. The
loss of architectural complexity is non-linear and has occurred over three distinct phases
that coincide closely with large-scale events that have affected Caribbean reef
ecosystems. The rate of decline was steepest prior to 1985. The sample sizes are small
and variance high during the 1960s and 1970s, hence it is unclear whether the decline
began prior to the early 1980s, when widespread loss of acroporid corals began (Precht
& Aronson 2006). After this period, average architectural complexity changed little
until the late 1990s, when a new episode of decline began. The pattern of decline is

16
consistent across depth zones and sub-regions. The widespread occurrence of flatter
reefs could have serious implications for reef-associated biodiversity and reef-based
environmental services.
The non-linearity in the loss of architectural complexity suggests that different
drivers operating at different times have influenced components of the reef community.
Disturbances on reefs range in scale and intensity, from local tropical storms that can
break and displace coral skeletons, to widespread events such as climate-induced
bleaching and diseases that kill coral tissue without immediately compromising the reef
structure (Pratchett et al. 2008). In the late 1970s, one key event is likely to have had a
major role in the early, steep decline in Caribbean reef architecture. White band disease
killed ~90% of the shallow-water, structurally dominant acroporid corals, exposing their
fragile branching skeletons to erosion and hurricanes that likely led to their collapse in
subsequent years (Aronson & Precht 2001). However, declines also occurred at depths
greater than those at which acroporids were dominant, suggesting that the systematic
loss of Caribbean reef corals was more widespread than previously thought during the
1970s and early 1980s.
After 1985, the main driver(s) of declining architectural complexity appear to
cease; by this time, acroporids had disappeared almost entirely from the Caribbean, and
the sea urchin D. antillarum had experienced a region-wide disease-induced mass
mortality in 1983/4 (Carpenter 1988). The loss of this important source of bioerosion
may have slowed the decline following the first phase of reef flattening. This
intermediate stable period of architectural complexity in the region persisted in the face
of several disturbance events including the first large-scale bleaching events and several
major hurricanes (Gardner et al. 2005; McWilliams et al. 2005).
Around 1998, Caribbean reefs were tipped into a new phase of structural
decline, following the most intense and widespread coral bleaching event to date
(McWilliams et al. 2005). The coral mortality and reductions in growth rates that
typically follow such bleaching events are likely to have precipitated the resumption of
loss of architectural complexity. The low levels of coral cover, and presumably reef
accretion, at this time (Gardner et al. 2003) may also have increased rates of erosion of
underlying geological structures that were no longer shielded by actively growing hard
17
corals. Since 1998, further mass bleaching events have occurred regularly (McWilliams
et al. 2005), likely contributing to the continued decline in reef complexity.
All of the major events that are likely to have impacted reef complexity have
occurred against a backdrop of changes not only in coral abundance but also in
community composition. Following the disappearance of acroporids, massive species
with slower growth rates, such as Montastrea spp, remained as the primary reef
framework builders, and weedy corals, such as Porites spp and Agaricia spp, that form
rapidly growing, small colonies that are short lived and quickly replaced, started to
increase in abundance (Green et al. 2008). The shift from major reef-building species to
weedy species that contribute less to maintenance of the reef framework, combined with
increases in macroalgae (Côté et al. 2006) which compete for space with coral recruits
(Mumby et al. 2007), likely reduced the rates of coral accretion on Caribbean reefs.
The loss of reef architecture is likely to have profound ecological, social and
economic impacts. A growing body of evidence indicates severe repercussions for
biodiversity of the loss of architectural complexity. On Indo-Pacific reefs, major
changes in fish community composition have resulted from the long-term loss of
structure following coral bleaching events (Pratchett et al. 2008 and references therein).
The effects of bleaching are first manifest in obligate coral-dwelling species, followed
by impacts on other small-bodied fishes (both small adults and juveniles of larger
species) when the physical matrix of the reef collapses(Pratchett et al. 2008). In the
Caribbean, the greatest impacts on biodiversity are expected to occur only with the
breakdown of the reef matrix because no fish species feed exclusively on live coral,
although many reef-associated species depend highly on rugose substrata to feed, recruit
and hide (Gratwicke & Speight 2005). In this context, declining reef complexity may
explain the onset of a decline in Caribbean reef fishes that has occurred since ~1996
(Paddack et al. 2009). Given that the loss of reef architecture began much earlier: our
analysis supports the notion of a degradation debt for Caribbean reef fishes. Reduced
recruitment resulting from a lack of settlement sites and refuges for species with
commercial importance, such as lobsters and large fishes (Graham et al. 2007; Wynne
& Côté 2007), may compromise the long-term sustainability of fisheries and fishing
communities. Collapsing reef structures may also lead to the loss of important
environmental services such as coastal protection. Simulation models predict that a
reduction in reef surface roughness of ~50% could produce a doubling of the wave
18
energy reaching the shores behind those reefs (Sheppard et al. 2005). The vulnerability
of coastal human communities in the Caribbean to projected increases in the intensity of
Atlantic Ocean hurricanes and sea levels (Hopkinson et al. 2008) will therefore likely be
compounded by the reduced wave dissipation function of architecturally simpler reefs.
Reversing declines in reef architecture will be a major challenge for scientists
and policy-makers concerned with maintaining reef ecosystems and the security and
well-being of Caribbean coastal communities. Although recent evidence suggests
increases in coral cover on some Caribbean reefs (e.g. Cho & Woodley 2000; Idjadi et
al. 2006), the effect of coral recovery on architectural complexity is unknown. If weedy
corals dominate this recovery in the long-term, future reef complexity is unlikely to
mirror any improvement in coral condition. To regain the levels of architectural
complexity that were prevalent prior to 1980, the recovery of large branching corals
(i.e., Acropora spp.) and the maintenance of healthy populations of massive robust
species (e.g., Montastrea spp.) are essential within the region. Not meeting these
challenges will most probably result in a continued flattening of reefs throughout the
region and seriously compromised biodiversity and environmental services.
19
Chapter 2
Region-wide temporal and spatial variation in Caribbean
reef architecture: is coral cover the whole story?
Abstract
The complexity of coral reefs is largely generated by reef-building corals, yet the effects
of current regional-scale declines in coral cover on habitat complexity are poorly
understood. Here we explore temporal and spatial covariation between coral cover and
reef architectural complexity using a Caribbean-wide dataset of temporally-replicated
estimates spanning four decades. Although coral skeletons can remain after coral
mortality, the loss of coral cover is directly followed by loss of complexity with little
time-lag, However, there is little correspondence between the overall rates of change in
coral cover and reef architecture, probably due to temporal and spatial variation in coral
community composition. Across the Caribbean, sites with greater coral cover tend to
also be more complex but the variance in architectural complexity also increases with
increasing coral cover. Reef architectural complexity is therefore not a direct function of
coral cover, but both are key attributes of coral reef health that need to be considered
separately in reef ecology and management.
Submitted:
Alvarez-Filip L., Côté I.M., Gill J.A., Watkinson A.R. & Dulvy N.K. Region-wide
temporal and spatial variation in Caribbean reef architecture: is coral cover the whole
story? Global Change Biology.
20
Introduction
In some ecosystems, complex structural or functional attributes can be provided by a
single taxon. Consequently, these foundation species can provide essential habitat for a
wide variety of other species and underpin fundamental ecosystem processes such as
productivity and nutrient cycling (Bruno & Bertness 2001; Ellison et al. 2005). In
tropical shallow waters, hard corals increase the architectural heterogeneity of the
seascape considerably, providing suitable habitat and microclimatic conditions for a
myriad of species and contributing substantially to ecosystem dynamics (Hatcher 1997).
Loss of hard corals on reefs is therefore likely to have severe repercussions for
associated biodiversity, ecosystem structure, function and stability.
Hard corals are increasingly threatened worldwide by direct and indirect effects
of human activities (Pandolfi et al. 2003; Carpenter et al. 2008; Mora 2008). As result,
live coral cover has decreased rapidly on tropical reefs throughout the world (Gardner et
al. 2003; Bruno & Selig 2007), but the effects of changing coral cover on habitat
complexity are not yet clear. At large scales, direct relationships between changing coral
cover and reef architecture have been suggested based on the aftermath of widespread
coral mortality following mass bleaching events on some Indo-Pacific reefs (Wilson et
al. 2006; Pratchett et al. 2008). Declines in architectural complexity appeared to lag
bleaching-induced coral mortality by more than five years in ‘before-and-after’
comparisons (Graham et al. 2007; 2008). In contrast, for the Caribbean, turning points
in the regional trajectory of declining architectural complexity coincide closely with the
loss of structurally complex Acropora corals and El Niño Southern Oscillation-induced
coral mortality, and there is little evidence of a region-wide lag in loss of habitat
complexity following declines in coral cover (Aronson & Precht 2006; Chapter 1)
Consequently, the exact nature of the relationship between coral cover and reef
architecture, including the generality of a 5-year lagged response, has yet to be
established.
Here we use a Caribbean-wide dataset of temporally replicated coral cover and
reef architecture estimates that spans four decades to explore the regional covariance in
coral cover and reef architectural complexity. First, we test whether the change in
architectural complexity lags behind the change in live coral cover. Second, we test for
21
a dose-response coral cover-architectural complexity relationship by quantifying
changes in both coral cover and architectural complexity on a year-by-year basis.
Finally, we test for a positive relationship between the spatial variance in live coral
cover and reef architecture across the region.
Material and methods
Data collation
We collated all available site-specific data on the percentage cover of live hard coral
and associated architectural complexity for reefs within the wider Caribbean Basin. We
focused on studies that used the rugosity index to describe reef architecture, as this is
the most commonly used method for measuring reef complexity in the region (Chapter
1). Reef rugosity is less frequently measured than coral cover, thus we first searched for
studies reporting rugosity of specific sites, and then from this dataset we selected all
studies that also reported information on coral cover.
The database was compiled by searching online ISI Web of Science, Google
Scholar and other relevant databases (e.g. Reefbase) for peer-reviewed and grey
literature. We searched for pertinent papers in all issues of the journals Coral Reefs,
Bulletin of Marine Sciences, Atoll Research Bulletin, Caribbean Journal of Science and
in all Proceedings of the International Coral Reef Symposium. Additionally, we
directly contacted scientists and site managers asking for any available data pertaining
to their study sites. The search resulted in a total of 81 studies that includes 312 records
from 139 reefs surveyed between 1977 and 2008 across the Caribbean. From this larger
database, we identified 24 studies with repeated measures (i.e. data collected over more
than one year; figure 1). This subset included 96 records reporting information for 37
reef sites between 1978 and 2004 (table A2.1 in appendix 2), and ranging in duration
from two to 12 years (mean = 5.01 ± 3.41 SD years).
22
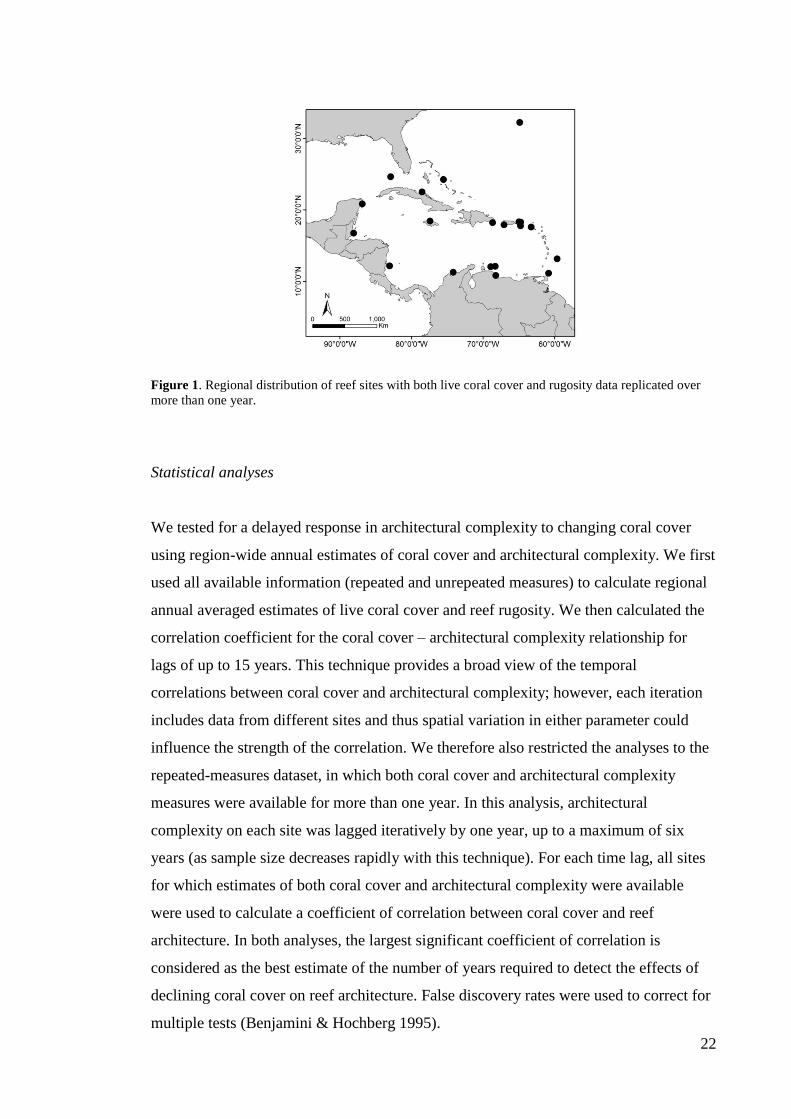
Figure 1. Regional distribution of reef sites with both live coral cover and rugosity data replicated over
more than one year.
Statistical analyses
We tested for a delayed response in architectural complexity to changing coral cover
using region-wide annual estimates of coral cover and architectural complexity. We first
used all available information (repeated and unrepeated measures) to calculate regional
annual averaged estimates of live coral cover and reef rugosity. We then calculated the
correlation coefficient for the coral cover – architectural complexity relationship for
lags of up to 15 years. This technique provides a broad view of the temporal
correlations between coral cover and architectural complexity; however, each iteration
includes data from different sites and thus spatial variation in either parameter could
influence the strength of the correlation. We therefore also restricted the analyses to the
repeated-measures dataset, in which both coral cover and architectural complexity
measures were available for more than one year. In this analysis, architectural
complexity on each site was lagged iteratively by one year, up to a maximum of six
years (as sample size decreases rapidly with this technique). For each time lag, all sites
for which estimates of both coral cover and architectural complexity were available
were used to calculate a coefficient of correlation between coral cover and reef
architecture. In both analyses, the largest significant coefficient of correlation is
considered as the best estimate of the number of years required to detect the effects of
declining coral cover on reef architecture. False discovery rates were used to correct for
multiple tests (Benjamini & Hochberg 1995).
23
To investigate temporal variation in rates of change on coral cover and reef
architecture, we examined how annual region-wide changes in coral cover were related
to the corresponding annual change in architectural complexity between 1974 and 2004.
We used a weighted meta-analytic approach to estimate annual rates of change in live
coral cover and reef architecture in the temporally replicated studies (Rosenberg et al.
2000). The standardised effect size was the annual rate of change in coral cover and reef
rugosity for each study, calculated as:
annual rate of change = (log End - log Start) / d
where End and Start represent the final and initial coral cover or reef rugosity of the
time series, respectively, and d is the number of years elapsed between the two
estimates. This metric has been previously used in studies of ecological change on coral
reefs (Côté et al. 2005; Paddack et al. 2009) and its properties as an effect size have
been thoroughly investigated (Côté et al. 2005). We weighted effect sizes using the
natural logarithm of the total transect length surveyed (see also Mosqueira et al. 2000;
Côté et al. 2001; Molloy et al. 2008). Statistically significant effect sizes were identified
by 95% bias-corrected bootstrapped confidence intervals (generated from 9999
iterations) that did not encompass zero. The QM statistic was used to test for differences
in rates of change in live coral cover and architectural complexity. A significant QM
implies that there are differences in mean effect sizes among groups, but a non-
significant QM does not preclude individual groups showing significant effect sizes (i.e.
individual CIs that do not overlap zero). The meta-analyses were conducted in MetaWin
Version 2.0 (Rosenberg et al. 2000). Annual rates of change and confidence intervals
are presented back-transformed to percentages to facilitate their interpretation.
Finally, we explored the spatial relationship between live coral cover and reef
architecture at the regional scale using (i) all available data (i.e. repeated and unrepeated
measures) and (ii) a smaller dataset of unrepeated measures (which avoids including
more than one estimate per site). As both datasets provide very similar results (see
figure 4 and figure A2.1 in appendix 2), we only present findings for all the available
data because of the wider spatial and temporal representation. Because preliminary
analysis demonstrated that the variance in reef rugosity was unequal along the gradient
of coral cover, we used quantile regression to obtain a detailed picture of the
relationship between coral cover and architectural complexity (Koenker & Bassett
1978). Quantile regression differs from ordinary least squares regression in that it
minimizes the sum of absolute values of residual errors around a specified quantile of
24
the dependent variable, rather than just changes in the mean (Cade & Noon 2003).
Exploring the full range of quantile responses provides a more complete view of the
relationship between variables than those captured by individual (median) quantile
regression functions (Knight & Ackerly 2002), hence we estimated the complete series
of quantile regression functions from the 1st to the 99
th quantile for the regional
relationship between coral cover and reef architecture. Analyses were carried out in R
and using the Quantreg package (R 2009).
Results
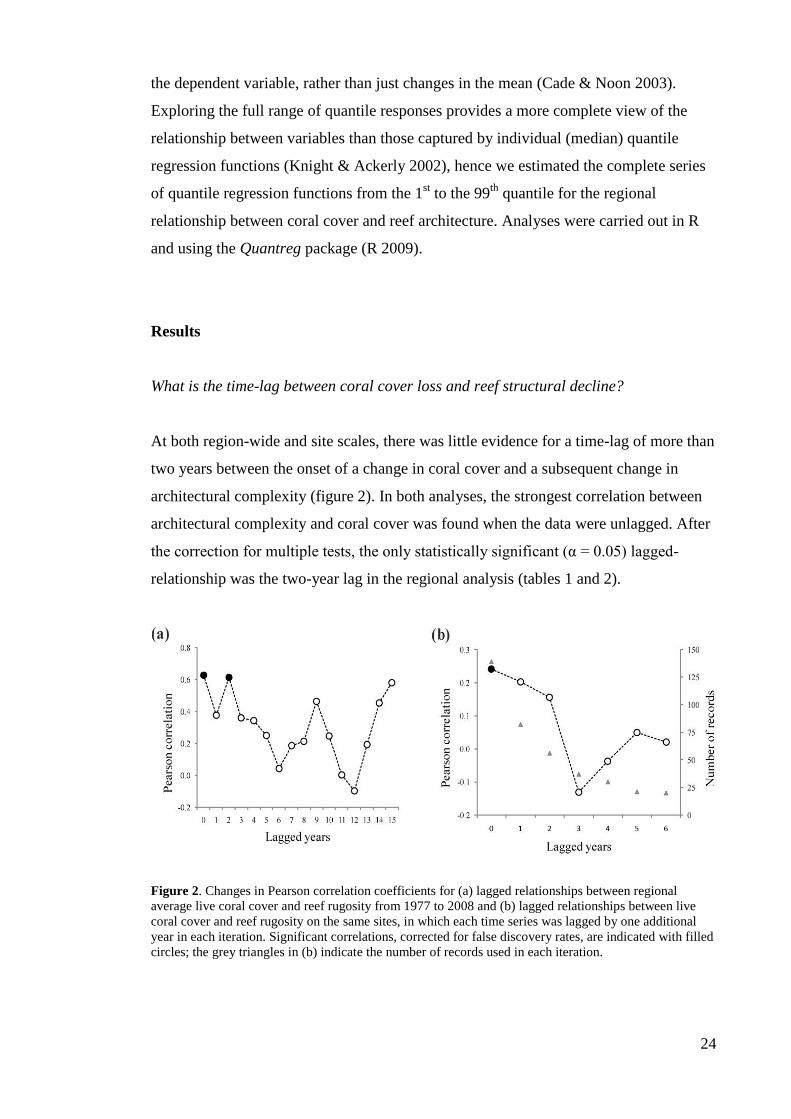
What is the time-lag between coral cover loss and reef structural decline?
At both region-wide and site scales, there was little evidence for a time-lag of more than
two years between the onset of a change in coral cover and a subsequent change in
architectural complexity (figure 2). In both analyses, the strongest correlation between
architectural complexity and coral cover was found when the data were unlagged. After
the correction for multiple tests, the only statistically significant (α = 0.05) lagged-
relationship was the two-year lag in the regional analysis (tables 1 and 2).
Figure 2. Changes in Pearson correlation coefficients for (a) lagged relationships between regional
average live coral cover and reef rugosity from 1977 to 2008 and (b) lagged relationships between live
coral cover and reef rugosity on the same sites, in which each time series was lagged by one additional
year in each iteration. Significant correlations, corrected for false discovery rates, are indicated with filled
circles; the grey triangles in (b) indicate the number of records used in each iteration.
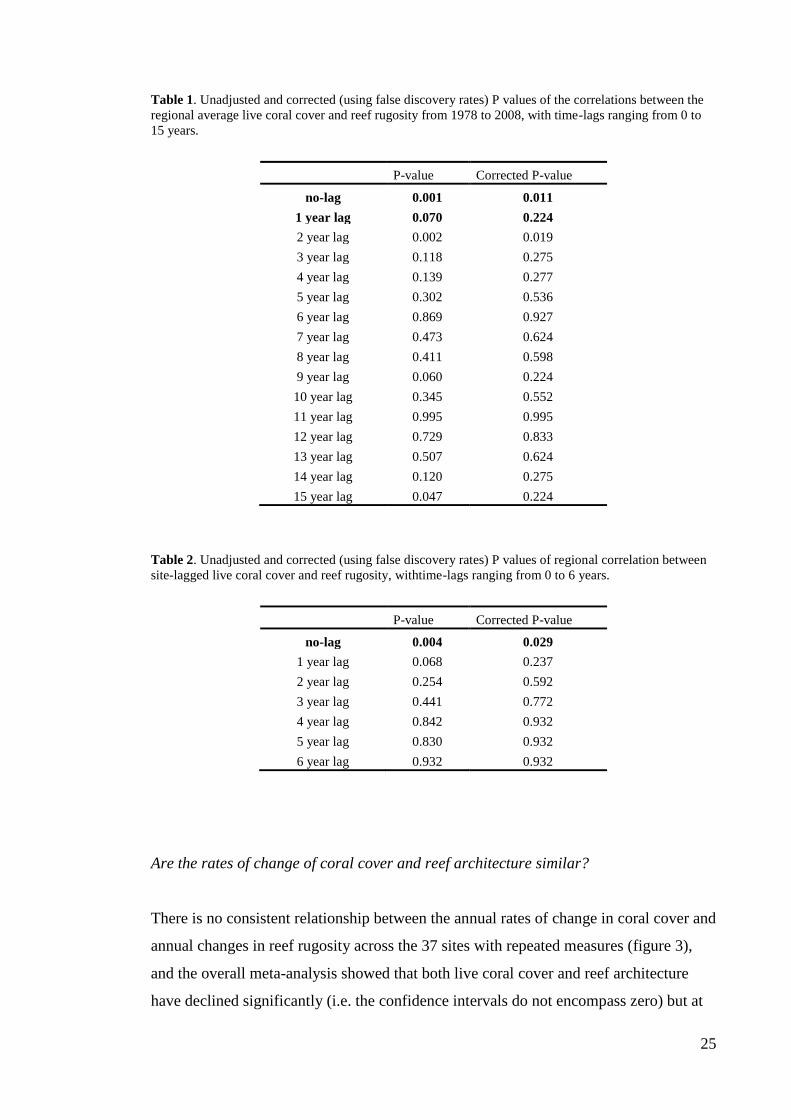
25
Table 1. Unadjusted and corrected (using false discovery rates) P values of the correlations between the
regional average live coral cover and reef rugosity from 1978 to 2008, with time-lags ranging from 0 to
15 years.
P-value Corrected P-value
no-lag 0.001 0.011
1 year lag 0.070 0.224
2 year lag 0.002 0.019
3 year lag 0.118 0.275
4 year lag 0.139 0.277
5 year lag 0.302 0.536
6 year lag 0.869 0.927
7 year lag 0.473 0.624
8 year lag 0.411 0.598
9 year lag 0.060 0.224
10 year lag 0.345 0.552
11 year lag 0.995 0.995
12 year lag 0.729 0.833
13 year lag 0.507 0.624
14 year lag 0.120 0.275
15 year lag 0.047 0.224
Table 2. Unadjusted and corrected (using false discovery rates) P values of regional correlation between
site-lagged live coral cover and reef rugosity, withtime-lags ranging from 0 to 6 years.
P-value Corrected P-value
no-lag 0.004 0.029
1 year lag 0.068 0.237
2 year lag 0.254 0.592
3 year lag 0.441 0.772
4 year lag 0.842 0.932
5 year lag 0.830 0.932
6 year lag 0.932 0.932
Are the rates of change of coral cover and reef architecture similar?
There is no consistent relationship between the annual rates of change in coral cover and
annual changes in reef rugosity across the 37 sites with repeated measures (figure 3),
and the overall meta-analysis showed that both live coral cover and reef architecture
have declined significantly (i.e. the confidence intervals do not encompass zero) but at
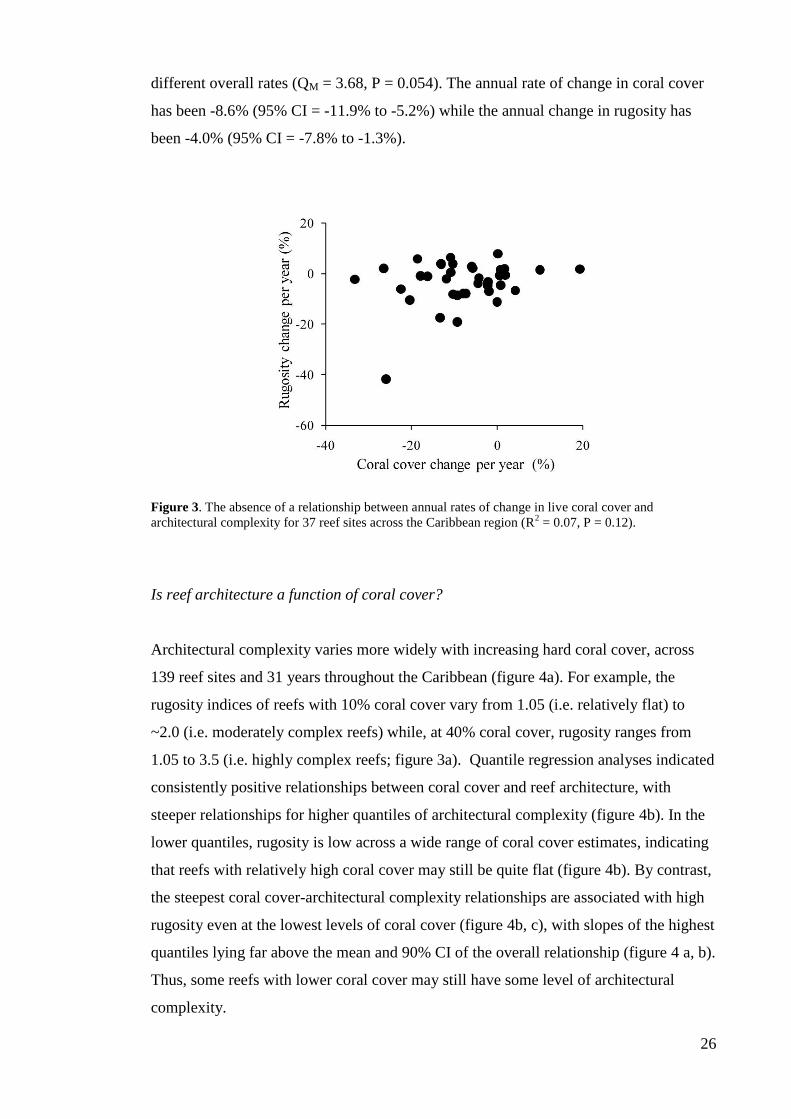
26
different overall rates (QM = 3.68, P = 0.054). The annual rate of change in coral cover
has been -8.6% (95% CI = -11.9% to -5.2%) while the annual change in rugosity has
been -4.0% (95% CI = -7.8% to -1.3%).
Figure 3. The absence of a relationship between annual rates of change in live coral cover and
architectural complexity for 37 reef sites across the Caribbean region (R2 = 0.07, P = 0.12).
Is reef architecture a function of coral cover?
Architectural complexity varies more widely with increasing hard coral cover, across
139 reef sites and 31 years throughout the Caribbean (figure 4a). For example, the
rugosity indices of reefs with 10% coral cover vary from 1.05 (i.e. relatively flat) to
~2.0 (i.e. moderately complex reefs) while, at 40% coral cover, rugosity ranges from
1.05 to 3.5 (i.e. highly complex reefs; figure 3a). Quantile regression analyses indicated
consistently positive relationships between coral cover and reef architecture, with
steeper relationships for higher quantiles of architectural complexity (figure 4b). In the
lower quantiles, rugosity is low across a wide range of coral cover estimates, indicating
that reefs with relatively high coral cover may still be quite flat (figure 4b). By contrast,
the steepest coral cover-architectural complexity relationships are associated with high
rugosity even at the lowest levels of coral cover (figure 4b, c), with slopes of the highest
quantiles lying far above the mean and 90% CI of the overall relationship (figure 4 a, b).
Thus, some reefs with lower coral cover may still have some level of architectural
complexity.
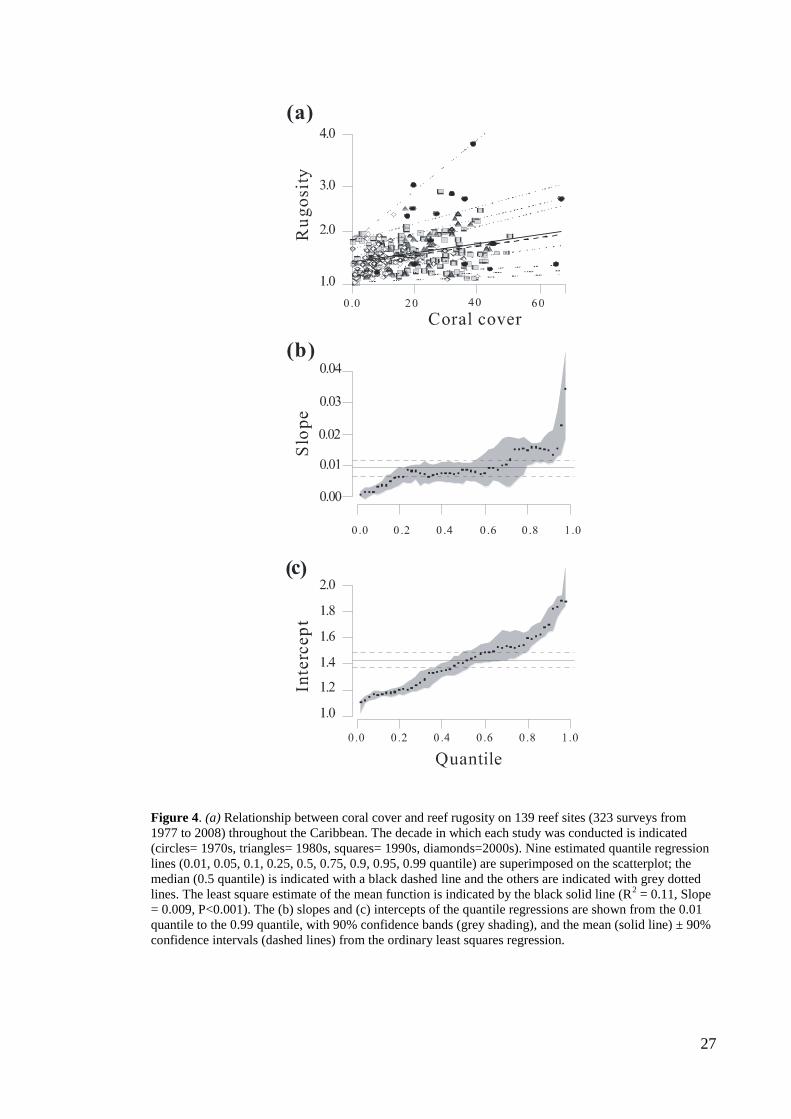
27
Figure 4. (a) Relationship between coral cover and reef rugosity on 139 reef sites (323 surveys from
1977 to 2008) throughout the Caribbean. The decade in which each study was conducted is indicated
(circles= 1970s, triangles= 1980s, squares= 1990s, diamonds=2000s). Nine estimated quantile regression
lines (0.01, 0.05, 0.1, 0.25, 0.5, 0.75, 0.9, 0.95, 0.99 quantile) are superimposed on the scatterplot; the
median (0.5 quantile) is indicated with a black dashed line and the others are indicated with grey dotted
lines. The least square estimate of the mean function is indicated by the black solid line (R2 = 0.11, Slope
= 0.009, P<0.001). The (b) slopes and (c) intercepts of the quantile regressions are shown from the 0.01
quantile to the 0.99 quantile, with 90% confidence bands (grey shading), and the mean (solid line) ± 90%
confidence intervals (dashed lines) from the ordinary least squares regression.
28
Discussion
The decline of coral cover represents both an absolute loss and a reduction in the quality
of reef habitat. Although coral skeletons can persist after coral mortality, our findings
show that the region-wide loss in Caribbean coral cover has been rapidly followed by
the loss of architectural complexity with little evidence of a lag greater than two years.
However, the inconsistent relationship between the annual rates of change in coral cover
and in architectural complexity suggests a temporally complex and non-linear
relationship between these components of reef function. In addition, the increase in
variance in local architectural complexity with increasing coral cover suggests that
architectural complexity is not a simple function of coral cover.
Time-lags may be expected when the drivers of coral mortality and those
affecting structural complexity are separate and occur more or less sequentially.
Examples of the former include disease and bleaching events, which can produce
widespread coral mortality without immediately modifying the reef framework (beyond
halting carbonate accretion; Glynn 1997; Aronson & Precht 2001; Sheppard et al.
2002); examples of the latter include persistent direct human impacts and recurrent
physical disturbances such as hurricanes which degrade underlying reef structures
(Hughes 1994; Hughes & Connell 1999; Gardner et al. 2005). In the Caribbean, drivers
of both coral mortality and erosion have operated as virtually chronic pressures
throughout the entire region in recent decades (Pandolfi et al. 2003; Gardner et al. 2005;
Aronson & Precht 2006; Mora 2008), which may be why no evidence of a time-lag is
apparent in our regional analysis.
The lack of a clear response of architectural complexity to changes in coral
cover may also be partly a consequence of the relative susceptibility of different corals
to erosion following mortality. In the Caribbean, the largest changes in coral cover
occurred as a result of the disease-induced die-off of acroporids in the late 1970s and
early 1980s (Aronson & Precht 2006; Schutte et al. 2010). The erect branching
structures of Acropora corals contributed disproportionately to reef complexity before
that time. Although the robust skeleton of A. palmata may have persisted longer than
the fragile framework of A. cervicornis in some locations, the regional trends of
declining coral cover and architectural complexity suggest that most dead Acropora
were relatively rapidly broken down and eroded following mortality (Aronson & Precht
29
2006; Chapter 1). In our study, similarly rapid annual rates of change of both coral
cover and architectural complexity were apparent during the Acropora die-off period
(1978-1985; coral cover = -23.19, bias-corrected 95% CI = -2.73 to -1.49; rugosity = -
27.03, bias-corrected 95% CI = -14.64 to -9.57), suggesting a rapid response of
architectural complexity to coral cover loss during this period. However, very few
studies are available for these years (n = 3), and therefore the lack of a delayed decline
in reef complexity reported here refers primarily to the years since the demise of
Acropora, in which Caribbean reefs have been dominated by a combination of massive
and weedy corals.
The absence of a dose-response in the coral cover – architectural complexity
relationship (figure 3) suggests temporal variation in the rates of change of each
attribute. Coral communities have continuously changed since the mass mortality of
acroporids. Important reef-building corals such as Montastrea have been declining
throughout the region and stress-resistant coral species that contribute relatively little to
the reef framework and architectural complexity have increasingly dominated
Caribbean reefs (Hughes 1994; Edmunds & Carpenter 2001; Aronson et al. 2002; Green
et al. 2008). Thus changes in coral composition leading to ‘flatter’ reef communities,
together with possible changes in carbonate budgets as a consequence of higher
amounts of bare substrata (Eakin 1996; Glynn 1997), can occur in the absence of
declines in coral cover. Previous studies do indeed suggest that rates of loss of
Caribbean reef architecture have remained high in recent years (Chapter 1), while coral
loss has almost ceased (Schutte et al. 2010).
The rapid increase in architectural complexity with increasing coral cover
(figure 4), despite the absence of a dose-response between these two variables (figure 3)
suggests extensive fine-scale spatial variation in coral community structure. Some
spatial variation may be attributable to the underlying reef framework and other
organisms, such as sponges and soft corals (e.g. Diaz & Rutzler 2001; Halford et al.
2004). However, it is likely that much of the variation in reef structural complexity at
any given time reflects variation in coral species assemblages (Chapter 3). For example,
reefs dominated by tall, branched species such as Acropora spp would have higher
levels of architectural complexity than reefs with similar coral cover but dominated by
smaller, flatter corals such as Agaricia spp. Coral identity may therefore be an
important mediator of reef complexity and, consequently, the impact of coral loss on

30
reef architecture will differ among sites, with sites dominated by architecturally-
complex reef-building corals bearing the greatest losses in rugosity following coral
mortality. Unfortunately, coral species composition was seldom reported in the studies
included here, hence we could not explore the effect of coral identity on patterns of
architectural complexity change.
The near-immediate loss of architectural complexity following declines in coral
cover in the Caribbean differs from the pattern reported in the Indo-Pacific region,
where a lagged response in the aftermath of widespread coral mortality following mass
bleaching events was apparent (Wilson et al. 2006; Graham et al. 2007; 2008; Pratchett
et al. 2008). However, these studies encompassed different temporal scales; our
Caribbean analyses explore year-by-year changes throughout a multidecadal period of
continual coral and reef architecture loss, whereas the Indo-Pacific studies spanned
either side of a discrete catastrophic coral mortality event. In addition, there are
important historical and ecological differences between these two regions that are likely
to influence these processes, with Caribbean reefs typically having fewer coral species,
less ecological redundancy and frequent hurricane impacts (Bellwood et al. 2004;
Briggs 2005). To determine whether our findings can be broadly generalised would
require longitudinal studies of Indo-Pacific reefs.
Architectural complexity is clearly not a simple function of coral cover.
Therefore, to restore the ecosystem services that Caribbean corals provide to other
species, including humans, these two critical reef attributes may require different types
of management and at different spatial scales. Much of coral reef conservation at
present focuses on ecological management and control of the cover of coral and algae
(Gardner et al. 2003; Côté et al. 2006; Bruno & Selig 2007; Mumby et al. 2007; Bruno
et al. 2009). However, restoring coral cover on reefs may not necessarily provide the
architectural complexity that underpins important coral reef ecosystem services relating
to nutrient recycling, dissipation of wave energy and fish production (Szmant 1997;
Lugo-Fernandez et al. 1998; Sheppard et al. 2005; Cinner et al. 2009). Consequently,
we also need to understand the biotic and abiotic drivers of architectural complexity at a
range of spatial scales.
31
Chapter 3
Drivers of region-wide declines in architectural
complexity on Caribbean reefs
Abstract
Severe declines in the cover of live hard coral on reefs have been reported worldwide
and, in the Caribbean region, the architectural complexity of coral reefs has also
declined markedly. While the drivers of coral cover loss are relatively well understood,
little is known about the drivers of regional-scale declines in architectural complexity.
We use a dataset of 49 time series reporting reef architectural complexity to explore the
effect of hurricanes, coral bleaching and fisheries on the Caribbean-wide annual rates of
change in reef complexity. Hurricane impacts greatly influence reef complexity, with
the most rapid rates of decline in complexity occurring at sites impacted during their
survey period, and with lower rates of loss occurring at unimpacted sites. Reef
architectural complexity did not change significantly following mass bleaching events
or thermal anomalies. Interestingly, the rates of change in architectural complexity were
similar in and out of marine protected areas (MPAs); however, significant declines in
complexity were observed inside but not outside of MPAs, possibly because reductions
in fishing can lead to increased bioerosion by herbivores within MPAs. Our findings
suggest that the major drivers of coral mortality, such as coral bleaching, do not
immediately influence reef complexity. Instead, direct physical impacts and reef
bioerosion appear to be important drivers of the widespread loss of architecturally
complex reefs in the Caribbean.
Submitted:
Alvarez-Filip L., Dulvy N.K., Gill J.A., Perry A.L., Watkinson A.R. & Côté I.M.
Drivers of region-wide declines in architectural complexity on Caribbean reefs Coral
Reefs.
32
Introduction
Natural systems are changing rapidly (Balmford et al. 2003), as a consequence of
human perturbations of the natural environment and global biochemical cycles
(Vitousek et al. 1997; Rockstrom et al. 2009). Coral reefs provide a clear example of
how anthropogenic activities have, at different scales, led to the degradation of natural
habitats. At local scales, a wide range of human stressors such as nutrient enrichment
and overfishing (Hughes 1994; Roberts 1995; Bryant et al. 1998; Szmant 2002) can
modify natural disturbance regimes of coral reefs by transforming pulse events into
persistent disturbance or even chronic stress (Nyström et al. 2000). At the global scale,
anthropogenic alteration of the climate causing rising sea temperatures has increased
bleaching-induced mortality of reef-building corals (Hoegh-Guldberg 1999). Under
these new, more stressful conditions, increases in the intensity of natural disturbances
such as hurricanes or diseases (Rosenberg & Loya 2004; Webster et al. 2005; Bruno et
al. 2007), previously natural but less-frequent parts of tropical reef dynamics (Connell
1978), may become an obstacle to reef recovery and development.
Caribbean reefs are among the most heavily impacted of marine ecosystems
(Halpern et al. 2008). Over the last four decades, the region has seen declines in coral
cover of ~80% (Gardner et al. 2003) and a severe reduction in the proportion of highly
complex reefs (Chapter 1). Architectural complexity is strongly related to the abundance
of reef-building corals (Chapter 3). However, the poor match between annual rates of
change in coral cover and architectural complexity (Chapter 2) suggests that the drivers
of loss of coral cover and architectural complexity may differ. A decoupling of rates of
change of coral cover and reef complexity is likely to have an impact on the response of
reef biodiversity and environmental services to habitat degradation. For instance, while
coral cover loss has almost ceased in recent years (Schutte et al. 2010), declines in fish
abundance began to be evident in the late 1990s (Paddack et al. 2009), likely following
ongoing declines in reef complexity (Chapter 1).
Given the extreme importance of coral reefs for biodiversity, human livelihoods
and key environmental services such as coastal protection, there is an urgent need to
discriminate among the effects of different drivers of coral degradation in order to
identify effective conservation strategies for restoring reef complexity (Pandolfi et al.
2005; Mora 2008; Chapter 2). The drivers of coral loss in the Caribbean are relatively
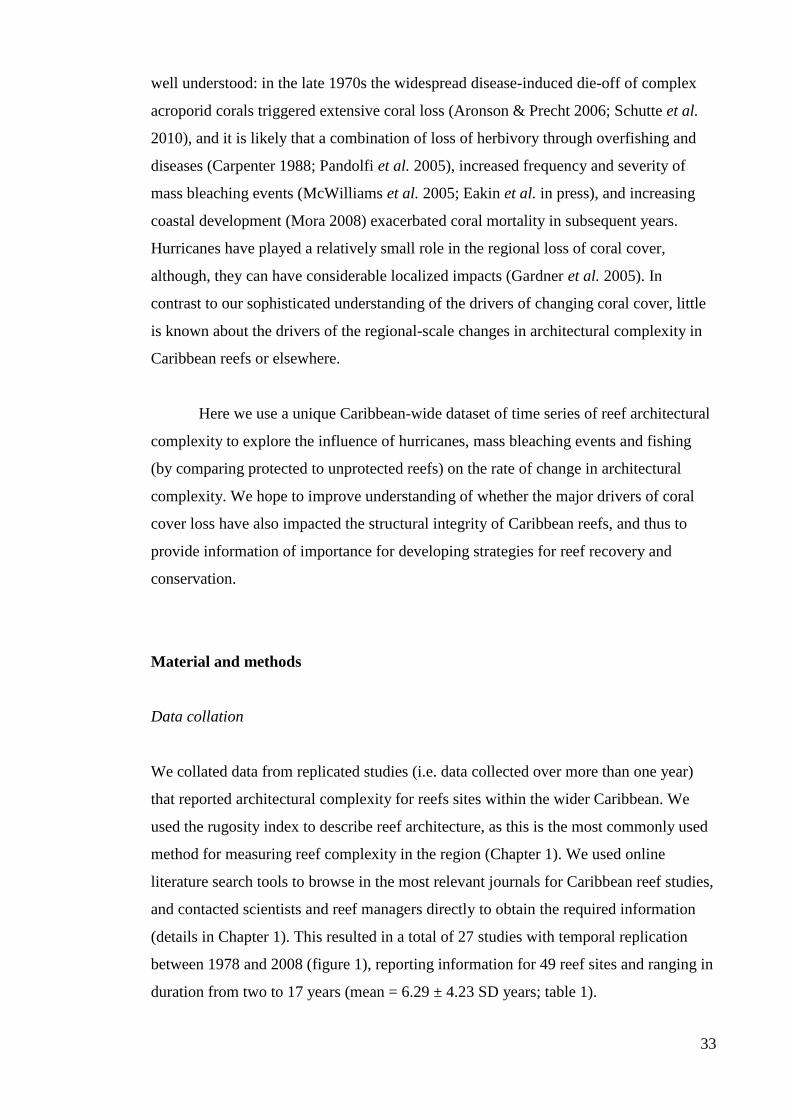
33
well understood: in the late 1970s the widespread disease-induced die-off of complex
acroporid corals triggered extensive coral loss (Aronson & Precht 2006; Schutte et al.
2010), and it is likely that a combination of loss of herbivory through overfishing and
diseases (Carpenter 1988; Pandolfi et al. 2005), increased frequency and severity of
mass bleaching events (McWilliams et al. 2005; Eakin et al. in press), and increasing
coastal development (Mora 2008) exacerbated coral mortality in subsequent years.
Hurricanes have played a relatively small role in the regional loss of coral cover,
although, they can have considerable localized impacts (Gardner et al. 2005). In
contrast to our sophisticated understanding of the drivers of changing coral cover, little
is known about the drivers of the regional-scale changes in architectural complexity in
Caribbean reefs or elsewhere.
Here we use a unique Caribbean-wide dataset of time series of reef architectural
complexity to explore the influence of hurricanes, mass bleaching events and fishing
(by comparing protected to unprotected reefs) on the rate of change in architectural
complexity. We hope to improve understanding of whether the major drivers of coral
cover loss have also impacted the structural integrity of Caribbean reefs, and thus to
provide information of importance for developing strategies for reef recovery and
conservation.
Material and methods
Data collation
We collated data from replicated studies (i.e. data collected over more than one year)
that reported architectural complexity for reefs sites within the wider Caribbean. We
used the rugosity index to describe reef architecture, as this is the most commonly used
method for measuring reef complexity in the region (Chapter 1). We used online
literature search tools to browse in the most relevant journals for Caribbean reef studies,
and contacted scientists and reef managers directly to obtain the required information
(details in Chapter 1). This resulted in a total of 27 studies with temporal replication
between 1978 and 2008 (figure 1), reporting information for 49 reef sites and ranging in
duration from two to 17 years (mean = 6.29 ± 4.23 SD years; table 1).
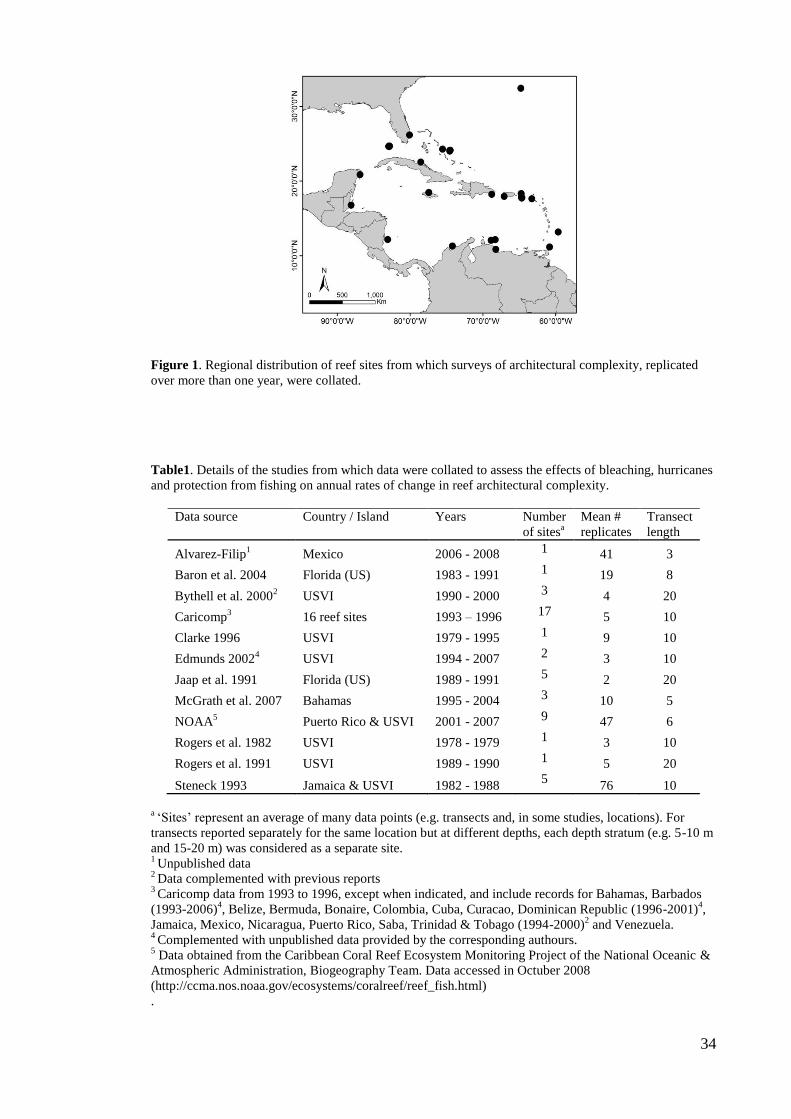
34
Figure 1. Regional distribution of reef sites from which surveys of architectural complexity, replicated
over more than one year, were collated.
Table1. Details of the studies from which data were collated to assess the effects of bleaching, hurricanes
and protection from fishing on annual rates of change in reef architectural complexity.
Data source Country / Island Years Number
of sitesa
Mean #
replicates
Transect
length
Alvarez-Filip1 Mexico 2006 - 2008 1 41 3
Baron et al. 2004 Florida (US) 1983 - 1991 1 19 8
Bythell et al. 20002 USVI 1990 - 2000 3 4 20
Caricomp3 16 reef sites 1993 – 1996 17 5 10
Clarke 1996 USVI 1979 - 1995 1 9 10
Edmunds 20024 USVI 1994 - 2007 2 3 10
Jaap et al. 1991 Florida (US) 1989 - 1991 5 2 20
McGrath et al. 2007 Bahamas 1995 - 2004 3 10 5
NOAA5 Puerto Rico & USVI 2001 - 2007 9 47 6
Rogers et al. 1982 USVI 1978 - 1979 1 3 10
Rogers et al. 1991 USVI 1989 - 1990 1 5 20
Steneck 1993 Jamaica & USVI 1982 - 1988 5
76 10
a ‘Sites’ represent an average of many data points (e.g. transects and, in some studies, locations). For
transects reported separately for the same location but at different depths, each depth stratum (e.g. 5-10 m
and 15-20 m) was considered as a separate site. 1 Unpublished data
2 Data complemented with previous reports
3 Caricomp data from 1993 to 1996, except when indicated, and include records for Bahamas, Barbados
(1993-2006)4, Belize, Bermuda, Bonaire, Colombia, Cuba, Curacao, Dominican Republic (1996-2001)
4,
Jamaica, Mexico, Nicaragua, Puerto Rico, Saba, Trinidad & Tobago (1994-2000)2 and Venezuela.
4 Complemented with unpublished data provided by the corresponding authours.
5 Data obtained from the Caribbean Coral Reef Ecosystem Monitoring Project of the National Oceanic &
Atmospheric Administration, Biogeography Team. Data accessed in Octuber 2008
(http://ccma.nos.noaa.gov/ecosystems/coralreef/reef_fish.html)
.
35
Drivers of change of reef architectural complexity
Coral bleaching
We tested for an effect of coral bleaching on regional reef architecture in two ways:
temporally by focusing on years of mass bleaching and spatially by exploring the effect
of local, small-scale temperature anomalies. We first assumed that in the seven years
between 1978 and 2008 in which bleaching was widespread (sometimes referred to as
‘‘mass bleaching events”: 1987, 1990, 1995, 1998, 1999, 2003 and 2005; McWilliams
et al. 2005; Perry 2008; Eakin et al. in press), bleaching affected all sites in this study.
For each mass bleaching event, we calculated the annual rate of change in rugosity from
the year prior to the mass bleaching event to the last year of the time series or the year
immediately before the next mass bleaching event, in order to account for the possible
erosion of architectural complexity after coral mortality. The mass bleaching events of
1998 and 1999 were classed together because they occurred in consecutive years and,
for time series that spanned more than one bleaching event, each event was included
separately in the analysis. In addition, to avoid confounding the effect of bleaching with
the effect of physical damage on reef architecture, only data from reefs that were not
impacted by a hurricane after a bleaching episode were included. Some of the time
series did not contain data spanning any of the years of mass bleaching events, and were
therefore not included in these analyses.
Secondly, although region-wide thermal anomalies have been linked to the
geographic extent and intensity of bleaching across the Caribbean (McWilliams et al.
2005; Perry 2008; Donner 2009), thermal stress does not usually occur homogeneously
through the entire seascape (e.g. Selig et al. 2010; Eakin et al. in press). Consequently,
we also explored the effect of variation in summer sea surface temperature (SST)
anomalies on the annual rates of change in architectural complexity within individual 1°
latitude by 1° longitude cells. We used historical SST data from the HadISST 1.1
dataset (Hadley Centre, UK Meteorological Office) to calculate the average summer
monthly (August, September and October) SST anomalies (relative to the means for
these months for the baseline period of 1961-1990) for each year between 1989 and
2006, for all cells within our dataset. These monthly anomalies were then averaged
within each year, giving annual summer mean SST anomalies for each cell that
contained information on reef rugosity in each specific year. The rates of change in reef
36
rugosity were then calculated for all consecutive years in each time series, then the
average of all sites that contained information for specific pair of years was calculated
and related to the average SST anomaly for all those sites in that pair of years.
Hurricanes
We classified whether sites were impacted by a hurricane using the method of Gardner
et al. (2005). A hurricane was considered to have impacted a reef if its track passed
within a given distance of the site, with its range of effect increasing with hurricane
strength. Thus, tropical storms or hurricanes of category 1 or 2 passing within 35 km of
a site, category 3 hurricanes passing within 60 km, or category 4 or 5 hurricanes passing
within 100 km of a given site were recorded as impacts. The hurricane history of each
site was obtained from the web-based tool of the NOAA Coastal Services Center
(http://csc.noaa.gov).
We compared annual rates of change in architectural complexity at sites
impacted and unimpacted by hurricanes. In addition, because the time elapsed between
hurricanes influences the magnitude of the loss of coral cover seen in response to
hurricane impacts (Connell 1997; Gardner et al. 2005), we also compared the rates of
complexity change between sites that had been impacted in the 10 years prior to the
focal hurricane impact and sites that were not impacted. We therefore measured the
effect of hurricanes at four categories of sites: (i) reef sites impacted 10 years before the
onset of their study and during their survey period (before-during); (ii) sites impacted
only during their survey period (during); (iii) sites impacted only within the 10 years
before their survey period (before); and (iv) sites not impacted by hurricanes from 10
years prior to the onset of their study to the end of their survey period (non-impacted).
Marine Protected Areas
We tested for effects of fishing on changes in reef architecture by determining whether
sites were protected (i.e. within the boundaries of a Marine Protected Area [MPA], and
hence not subject to fishing) or unprotected (i.e. subject to fishing) during their survey
period. Protection status was determined using the global database of Marine Protected
Areas (Wood 2007). Rates of change in rugosity were then compared between
protected and unprotected sites.
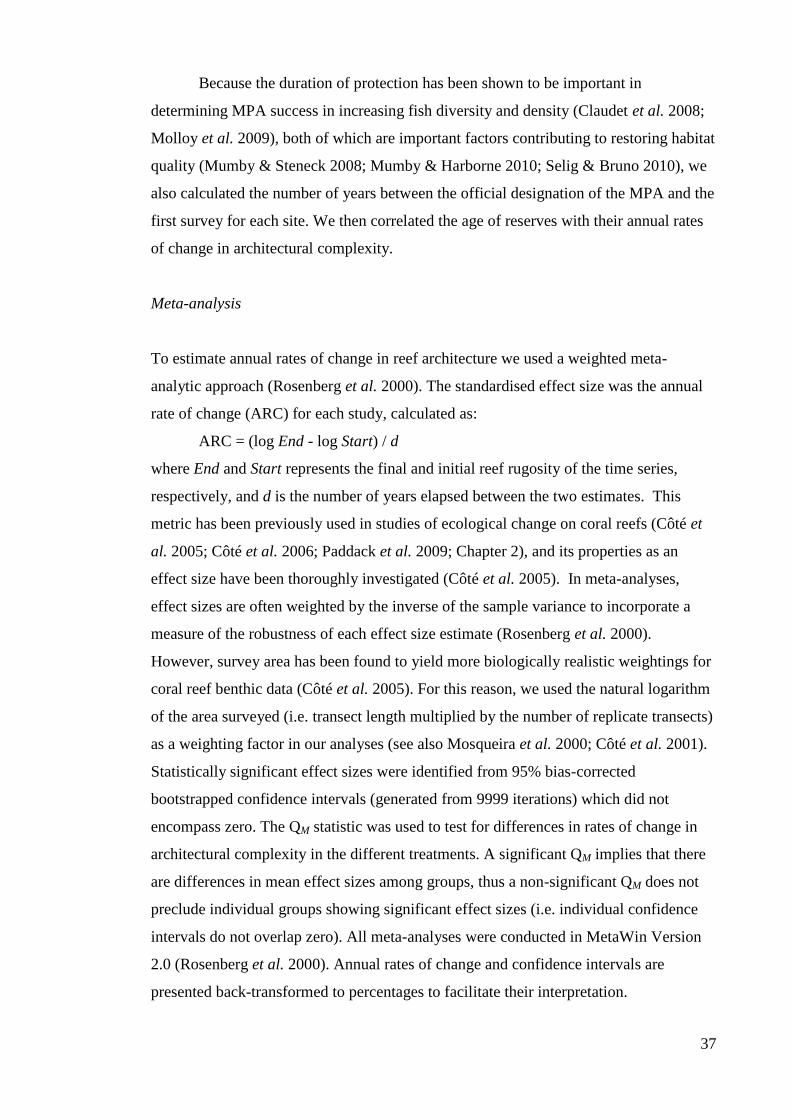
37
Because the duration of protection has been shown to be important in
determining MPA success in increasing fish diversity and density (Claudet et al. 2008;
Molloy et al. 2009), both of which are important factors contributing to restoring habitat
quality (Mumby & Steneck 2008; Mumby & Harborne 2010; Selig & Bruno 2010), we
also calculated the number of years between the official designation of the MPA and the
first survey for each site. We then correlated the age of reserves with their annual rates
of change in architectural complexity.
Meta-analysis
To estimate annual rates of change in reef architecture we used a weighted meta-
analytic approach (Rosenberg et al. 2000). The standardised effect size was the annual
rate of change (ARC) for each study, calculated as:
ARC = (log End - log Start) / d
where End and Start represents the final and initial reef rugosity of the time series,
respectively, and d is the number of years elapsed between the two estimates. This
metric has been previously used in studies of ecological change on coral reefs (Côté et
al. 2005; Côté et al. 2006; Paddack et al. 2009; Chapter 2), and its properties as an
effect size have been thoroughly investigated (Côté et al. 2005). In meta-analyses,
effect sizes are often weighted by the inverse of the sample variance to incorporate a
measure of the robustness of each effect size estimate (Rosenberg et al. 2000).
However, survey area has been found to yield more biologically realistic weightings for
coral reef benthic data (Côté et al. 2005). For this reason, we used the natural logarithm
of the area surveyed (i.e. transect length multiplied by the number of replicate transects)
as a weighting factor in our analyses (see also Mosqueira et al. 2000; Côté et al. 2001).
Statistically significant effect sizes were identified from 95% bias-corrected
bootstrapped confidence intervals (generated from 9999 iterations) which did not
encompass zero. The QM statistic was used to test for differences in rates of change in
architectural complexity in the different treatments. A significant QM implies that there
are differences in mean effect sizes among groups, thus a non-significant QM does not
preclude individual groups showing significant effect sizes (i.e. individual confidence
intervals do not overlap zero). All meta-analyses were conducted in MetaWin Version
2.0 (Rosenberg et al. 2000). Annual rates of change and confidence intervals are
presented back-transformed to percentages to facilitate their interpretation.
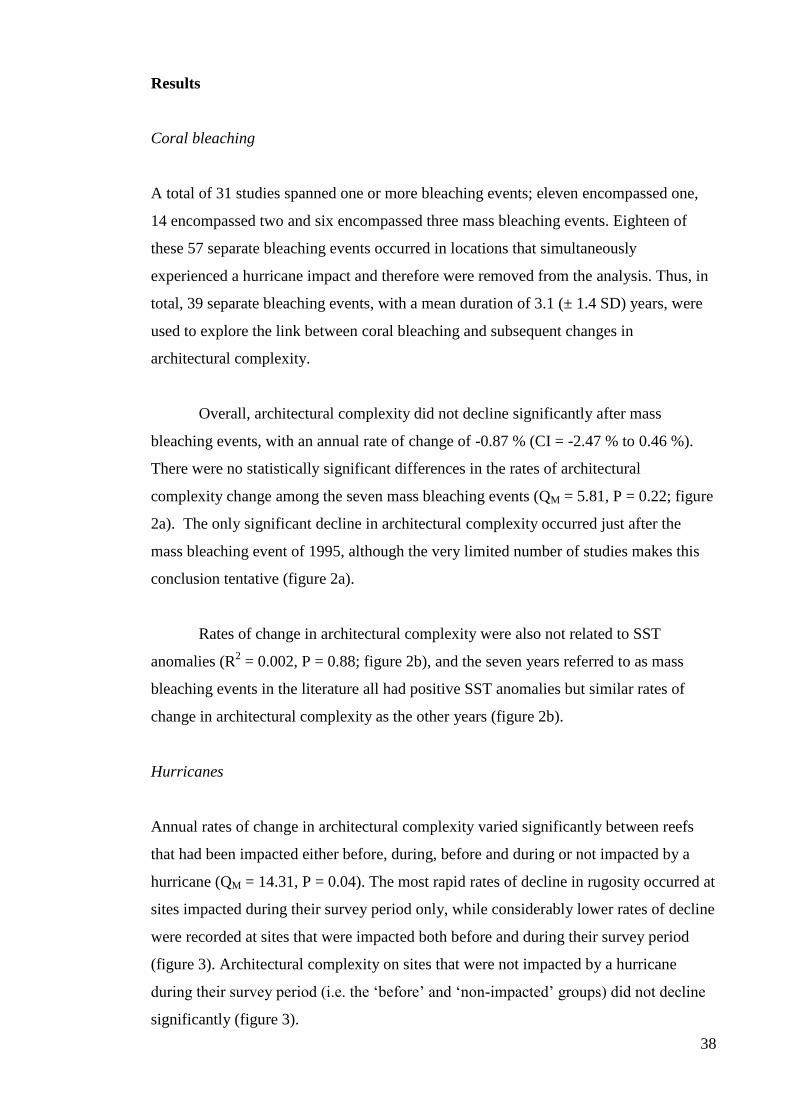
38
Results
Coral bleaching
A total of 31 studies spanned one or more bleaching events; eleven encompassed one,
14 encompassed two and six encompassed three mass bleaching events. Eighteen of
these 57 separate bleaching events occurred in locations that simultaneously
experienced a hurricane impact and therefore were removed from the analysis. Thus, in
total, 39 separate bleaching events, with a mean duration of 3.1 (± 1.4 SD) years, were
used to explore the link between coral bleaching and subsequent changes in
architectural complexity.
Overall, architectural complexity did not decline significantly after mass
bleaching events, with an annual rate of change of -0.87 % (CI = -2.47 % to 0.46 %).
There were no statistically significant differences in the rates of architectural
complexity change among the seven mass bleaching events (QM = 5.81, P = 0.22; figure
2a). The only significant decline in architectural complexity occurred just after the
mass bleaching event of 1995, although the very limited number of studies makes this
conclusion tentative (figure 2a).
Rates of change in architectural complexity were also not related to SST
anomalies (R2 = 0.002, P = 0.88; figure 2b), and the seven years referred to as mass
bleaching events in the literature all had positive SST anomalies but similar rates of
change in architectural complexity as the other years (figure 2b).
Hurricanes
Annual rates of change in architectural complexity varied significantly between reefs
that had been impacted either before, during, before and during or not impacted by a
hurricane (QM = 14.31, P = 0.04). The most rapid rates of decline in rugosity occurred at
sites impacted during their survey period only, while considerably lower rates of decline
were recorded at sites that were impacted both before and during their survey period
(figure 3). Architectural complexity on sites that were not impacted by a hurricane
during their survey period (i.e. the ‘before’ and ‘non-impacted’ groups) did not decline
significantly (figure 3).
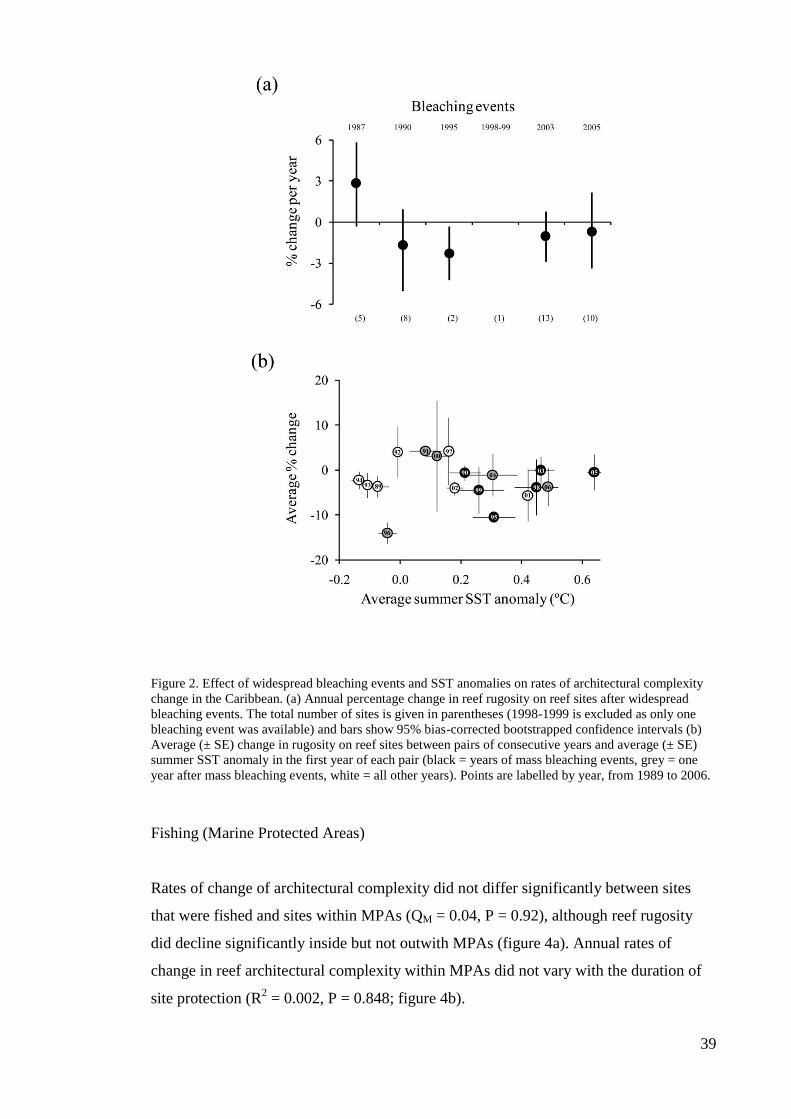
39
Figure 2. Effect of widespread bleaching events and SST anomalies on rates of architectural complexity
change in the Caribbean. (a) Annual percentage change in reef rugosity on reef sites after widespread
bleaching events. The total number of sites is given in parentheses (1998-1999 is excluded as only one
bleaching event was available) and bars show 95% bias-corrected bootstrapped confidence intervals (b)
Average (± SE) change in rugosity on reef sites between pairs of consecutive years and average (± SE)
summer SST anomaly in the first year of each pair (black = years of mass bleaching events, grey = one
year after mass bleaching events, white = all other years). Points are labelled by year, from 1989 to 2006.
Fishing (Marine Protected Areas)
Rates of change of architectural complexity did not differ significantly between sites
that were fished and sites within MPAs (QM = 0.04, P = 0.92), although reef rugosity
did decline significantly inside but not outwith MPAs (figure 4a). Annual rates of
change in reef architectural complexity within MPAs did not vary with the duration of
site protection (R2 = 0.002, P = 0.848; figure 4b).
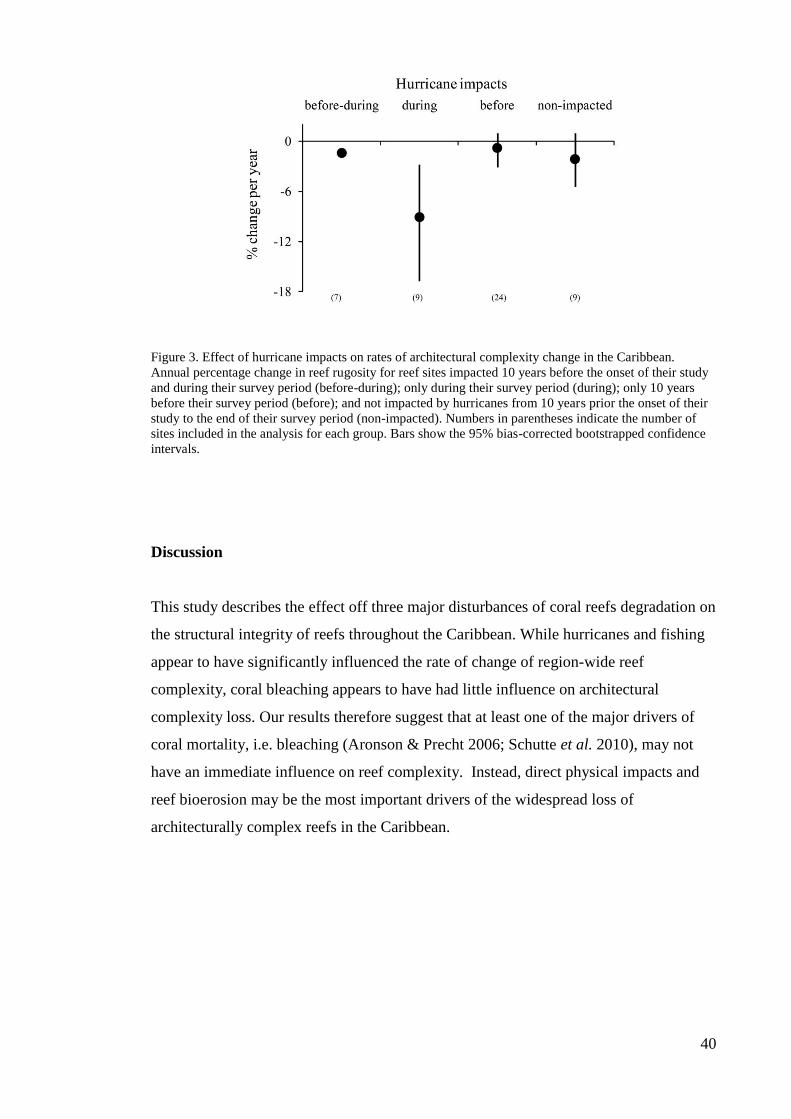
40
Figure 3. Effect of hurricane impacts on rates of architectural complexity change in the Caribbean.
Annual percentage change in reef rugosity for reef sites impacted 10 years before the onset of their study
and during their survey period (before-during); only during their survey period (during); only 10 years
before their survey period (before); and not impacted by hurricanes from 10 years prior the onset of their
study to the end of their survey period (non-impacted). Numbers in parentheses indicate the number of
sites included in the analysis for each group. Bars show the 95% bias-corrected bootstrapped confidence
intervals.
Discussion
This study describes the effect off three major disturbances of coral reefs degradation on
the structural integrity of reefs throughout the Caribbean. While hurricanes and fishing
appear to have significantly influenced the rate of change of region-wide reef
complexity, coral bleaching appears to have had little influence on architectural
complexity loss. Our results therefore suggest that at least one of the major drivers of
coral mortality, i.e. bleaching (Aronson & Precht 2006; Schutte et al. 2010), may not
have an immediate influence on reef complexity. Instead, direct physical impacts and
reef bioerosion may be the most important drivers of the widespread loss of
architecturally complex reefs in the Caribbean.
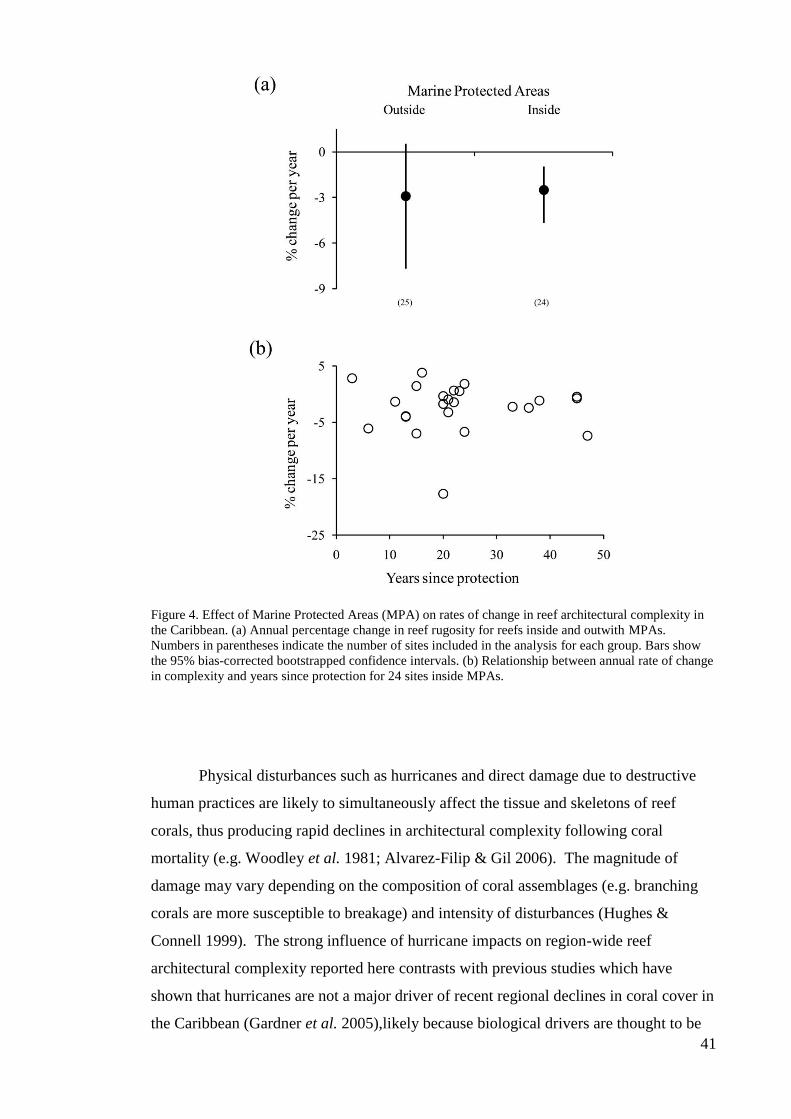
41
Figure 4. Effect of Marine Protected Areas (MPA) on rates of change in reef architectural complexity in
the Caribbean. (a) Annual percentage change in reef rugosity for reefs inside and outwith MPAs.
Numbers in parentheses indicate the number of sites included in the analysis for each group. Bars show
the 95% bias-corrected bootstrapped confidence intervals. (b) Relationship between annual rate of change
in complexity and years since protection for 24 sites inside MPAs.
Physical disturbances such as hurricanes and direct damage due to destructive
human practices are likely to simultaneously affect the tissue and skeletons of reef
corals, thus producing rapid declines in architectural complexity following coral
mortality (e.g. Woodley et al. 1981; Alvarez-Filip & Gil 2006). The magnitude of
damage may vary depending on the composition of coral assemblages (e.g. branching
corals are more susceptible to breakage) and intensity of disturbances (Hughes &
Connell 1999). The strong influence of hurricane impacts on region-wide reef
architectural complexity reported here contrasts with previous studies which have
shown that hurricanes are not a major driver of recent regional declines in coral cover in
the Caribbean (Gardner et al. 2005),likely because biological drivers are thought to be
42
more important than physical disturbances in impacting the live tissue of corals as they
can generally occur at larger spatial scales and/or can spread rapidly (Aronson & Precht
2006; Hoegh-Guldberg et al. 2007; Schutte et al. 2010). Interestingly, declines in
architectural complexity following hurricane impacts were less severe on reefs that had
been impacted by another hurricane during the previous 10 years. This may indicate
reductions in the abundance of coral colonies that are particularly susceptible to
physical disturbances (e.g., branching species). Indeed, branching species can dominate
reefs that have not experienced a hurricane for several years (Woodley et al. 1981;
Rogers 1993). Hurricane-impacted reefs on which these species are less abundant may
thus provide less scope for subsequent hurricanes to cause further damage to reef
architecture (Woodley et al. 1981; Alvarez-Filip et al. 2009). However, consecutive
hurricanes impacts are likely to maintain coral reefs in less structurally complex states,
an effect that is likely to be compounded by the increase in activity of Atlantic Ocean
hurricanes (Saunders & Lea 2008).
Biological disturbances such as diseases, predator outbreaks or climate-induced
coral bleaching usually kill coral tissue without initially compromising the integrity of
the coral skeleton. After tissue death, the exposed coral skeletons are subject to local
rates of physical, chemical and biological erosion (Hutchings 1986; Glynn 1997). Coral
skeletons of erect branching corals (e.g., Acropora) may then break down into coral
rubble (Sheppard et al. 2002; Graham et al. 2006), whereas massive coral skeletons
typically gradually erode in situ (Sheppard et al. 2002). One probable reason for the
absence of significant declines in architectural complexity following coral bleaching or
anomalously warm sea surface temperatures may be the lack of extensive coral
mortality following bleaching at the reef-sites included in our meta-analysis. Although
reef accretion can be halted after coral bleaching (Hoegh-Guldberg et al. 2007; Baker et
al. 2008), recovery of live coral tissue after bleaching events would reduce any impact
on reef complexity. In addition, most of the studies included in this analysis took place
during a period in which Caribbean reefs have been dominated by massive and weedy
corals (post-Acropora die-off; (Aronson & Precht 2006; Chapter 2). As the erosion of
massive coral skeletons is likely to be a slow process, the period of time after bleaching
events (average ≈ 3 years for data in figure 2a) may not have been sufficient to detect an
impact on reef structure. However, previous studies have shown that regional declines
in reef complexity in the Caribbean followed coral mortality with no evidence of a time-
lag (Chapter 2), which also suggests that biological disturbances (which typically
43
operate more slowly than physical disturbances) have not played a direct role in the
recent region-wide declines in Caribbean reef complexity.
The removal of fishing pressure, through the establishment of marine protected
areas, is widely recognized as an important tool for the protection of biological diversity
and fisheries management (Sale et al. 2005; Gaston et al. 2008). On coral reefs, there is
a broad range of positive effects within protected areas, such as increased biomass,
abundance, average size and diversity of fish and invertebrates (Halpern 2003; Claudet
et al. 2008; Molloy et al. 2009). However, regional- and local-scale studies have found
that large declines in coral cover can occur in spite of protection (Coelho & Manfrino
2007; Graham et al. 2008; Mora 2008), although recent evidence suggests that coral
cover is maintained to a greater extent inside marine reserves (Selig & Bruno 2010).
The latter is probably because protection from fishing can restore key ecological
processes such as herbivory, which can aid the recovery of coral colonies through the
removal of space competitors or other sources of stress (e.g. macroalgae; Mumby &
Harborne 2010). These positive effects of protection might only become apparent long
after reserve establishment, for instance coral cover inside some Caribbean marine
reserves experienced continuous declines for up to 14 years after implementation (Selig
& Bruno 2010). The significant decline in architectural complexity inside MPAs, but
not on unprotected reefs, could have resulted from MPA designation of reef sites that
were initially in better condition, and thus had 'more to lose' than unprotected reefs.
However, this seems unlikely in our case, as average rugosity at the start of the time
series was similar for protected and unprotected reefs (protected = 1.66 ± 0.9 SE;
unprotected = 1.73 ± 0.13 SE; T(47) = -0.61, P = 0.55). Alternatively, protection from
fishing may lead to enhanced rates of bioerosion by herbivorous fish inside MPAs
(Hutchings 1986; McClanahan 1994), which could increase rates of loss of reef
architecture on protected reefs. Because of over-exploitation and disease, Caribbean
reefs have had relatively low densities of macro-bioeroders since the early 1980s
(Carpenter 1988; Pandolfi et al. 2005), which likely slowed down rates of reef
architecture loss (Mallela & Perry 2007; Chapter 1). The implementation of MPAs can
greatly enhance the number and biomass of grazers such as parrotfishes (e.g. Mumby
2006; Mumby et al. 2006), which can in turn increase rates of erosion on reefs that are
already failing to accrete as a consequence of the loss of reef-building corals
(Bruggemann et al. 1996). This scenario does not imply that MPAs are not fulfilling
their function; indeed, they may be critically important for the recovery of key
44
components of coral reefs such as the associated fish communities. However, our results
highlight the necessity of understanding the full range of interactions between the
components of coral reefs to design management tools that will successfully secure the
long-term persistence of these ecosystems.
Over the last four decades, Caribbean reefs have undergone rapid and severe
rates of decline in coral cover and reef architecture (Gardner et al. 2003; Chapter 2),
generating a debate in the scientific community about the major disturbances (local vs
global) that have driven these declines (Aronson & Precht 2006; Knowlton & Jackson
2008). While a growing body of evidence indicates that the cover of reef-building corals
is influenced by large-scale drivers such as changing climate and the spread of human
development (Knowlton & Jackson 2008; Mora 2008; Schutte et al. 2010), here we
show that changes in reef architecture may be more sensitive to local reef conditions
(e.g. rates of erosion and hurricane impacts) and hence may be relatively independent of
changing coral cover. Thus, while reversing coral decline is likely to require
international regulations to reduce the impacts of human activities, our results suggest
that the protection and recovery of reef architecture will depend largely on the
protection and enhancement of conditions at the local reef scale.
45
Chapter 4
Coral identity underpins reef complexity on Caribbean
reefs
Abstract
The architectural complexity of ecosystems can greatly influence their capacity to
support biodiversity and deliver ecosystem services. Understanding the components
underlying this complexity can aid the development of effective strategies for
ecosystem conservation. Caribbean coral reefs support and protect millions of
livelihoods, but recently the anthropogenic change is shifting communities towards
reefs dominated by stress-resistant and less architecturally complex coral species. We
quantify the influence of coral composition, diversity and morpho-functional traits on
the architectural complexity of reefs across 91 sites at Cozumel, Mexico. Although reef
architectural complexity increases with coral cover and species richness, it is highest on
sites that are low in taxonomic evenness and dominated by morpho-functionally
important reef-building coral genera, particularly Montastrea. Sites with similar coral
community composition also tend to occur on reefs with very similar architectural
complexity, suggesting that reef structure tends to be determined by the same key
species across sites. Our findings suggest that a major emphasis on facilitating the
endurance of healthy populations of key morpho-functional groups may be required to
halt the rapid and severe declines in reef architectural complexity across the Caribbean.
Specifically, these results provide support for prioritising and protecting particular reef
types, particularly those dominated by Montastrea corals, in order to enhance reef
complexity.
Submitted:
Alvarez-Filip L., Dulvy N.K., Côté I.M., Watkinson A.R. & Gill J.A. Coral identity
underpins reef complexity on Caribbean reefs. Ecological Applications.
46
Introduction
The architectural complexity of ecosystems often underpins the biodiversity and
ecosystem services that they support. Architectural complexity is very often defined or
provided by foundation taxa (e.g. trees, oysters, stony corals) that have a
disproportionate influence on ecosystem structure, function and stability (MacArthur
1984; Bruno & Bertness 2001; Ellison et al. 2005). However, within these broad groups
of foundation taxa, different species can contribute disproportionately to architectural
complexity. Understanding the influence of different species and taxa on ecosystem
structure and function can therefore be key to the development of effective conservation
priorities and actions.
Coral reefs are among the most rapidly changing and valuable ecosystems in the
world. It is estimated that nearly 70 per cent of the world’s coral reefs are threatened by
anthropogenic activities (Wilkinson 2008) and are experiencing unprecedented rates of
degradation (Veron 2008). In the Caribbean, for instance, the architectural complexity
of reefs has declined substantially over the past forty years with the loss of ~80% of the
most complex reefs (Chapter 1). Because of the importance of reef-building corals as
foundation species within the diverse reef ecosystem, patterns of degradation and
ecological resilience on coral reefs are typically measured through changes in overall
coral cover (e.g. Gardner et al. 2003; Bruno & Selig 2007; Mumby et al. 2007).
However, changes in coral cover do not capture the changes in reef architectural
complexity (Chapter 2) that can underpin a suite of important ecosystem services such
as the dissipation of wave energy, nutrient recycling and the abundance, diversity and
trophic structure of coral reef fishes (Szmant 1997; Lugo-Fernandez et al. 1998;
Sheppard et al. 2005; Wilson et al. 2007; 2010).
There is considerable potential for taxon identity and the composition of reef-
building corals to influence the architectural complexity of reefs, as hard scleractinian
corals are a taxonomically and morphologically diverse group (Veron & Stafford-Smith
2002; Dullo 2005). While qualitative differences in the relative contribution of different
coral species to reef complexity are apparent for most of the reef scientist, the
contribution of coral identity and community composition to architectural complexity
has yet to be quantified at the larger reef scales. Quantifying the relative contribution of
different coral species to the architectural complexity of the reefscape is therefore
47
particularly important in order to understand the trajectory of coral reefs under changing
environmental conditions. A growing body of evidence suggests that loss of the main
reef-building coral taxa is accompanied by an increase in the relative abundance
(leading to eventual dominance) of stress-tolerant, early-colonizing corals that form
smaller and less-architecturally complex colonies such as Porites and Agaricia
(Aronson et al. 2002; Green et al. 2008; Lirman & Manzello 2009). This shift towards
weedy coral species may constrain reefs into a state of lower potential architectural
complexity (Steneck et al. 2009), even if overall coral cover remains stable.
Here we explore the contribution of coral community composition to reef
architectural complexity across a broad range of sites in Cozumel, Mexico. First, we
quantify whether sites with similar coral community composition also tend to be similar
in terms of architectural complexity. Second, we test whether greater coral species
diversity is related to greater architectural complexity. Finally, we explore how the
taxonomic and functional attributes of coral dominance influence the relationship
between coral cover and architectural complexity.
Materials and methods
Study area
This study was carried out with the permission and support of the Parque Nacional
Arrecifes de Cozumel. Cozumel is a continental island in the North-Western Caribbean
(figure 1). Cozumel is surrounded by coral reefs, the most developed of which are on
the western side of the island and primarily comprise shelf-edge reefs, which typically
have a complex reef framework formed by calcareous formations of several meters
depth, and barrier reefs which are less well-developed (Jordán-Dahlgren 1988). The
reefs along the south-west coast have been under official protection since 1980
(Alvarez-Filip et al. 2009; figure 1).
Field surveys
In total, 91 sites along the south-west coast of Cozumel, all separated by at least 200 m
(figure 1), were surveyed between October 2007 and February 2008. At each site, one
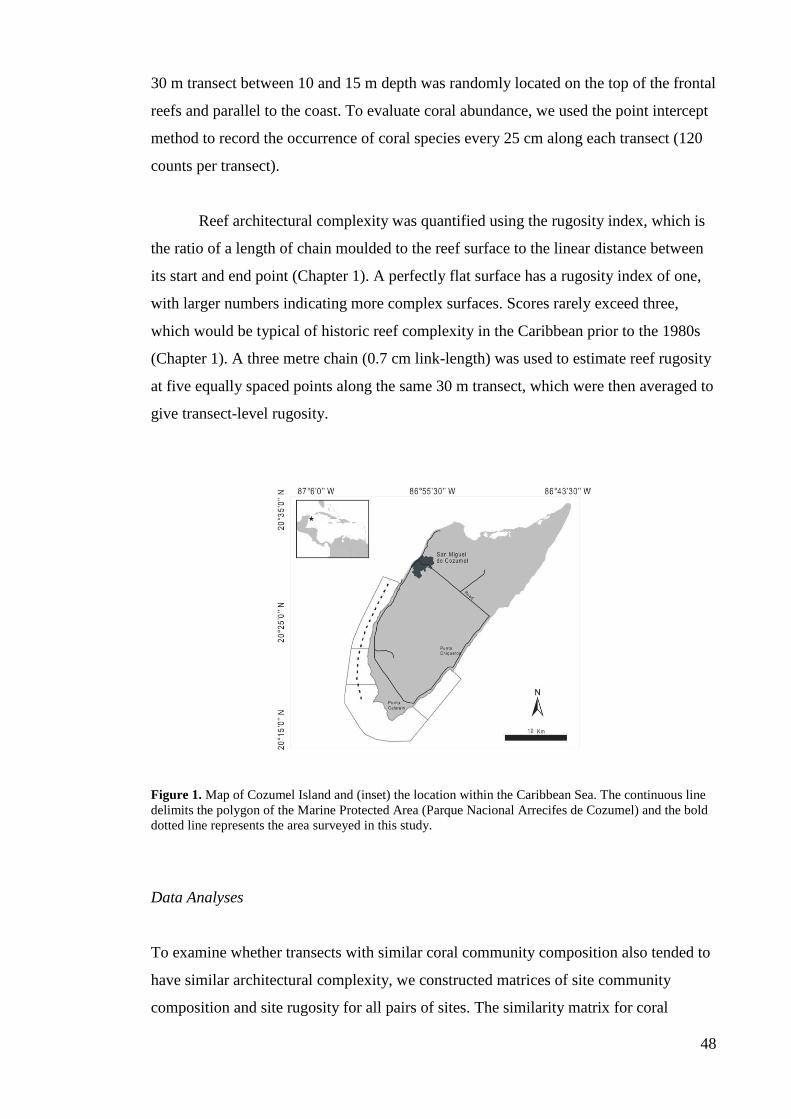
48
30 m transect between 10 and 15 m depth was randomly located on the top of the frontal
reefs and parallel to the coast. To evaluate coral abundance, we used the point intercept
method to record the occurrence of coral species every 25 cm along each transect (120
counts per transect).
Reef architectural complexity was quantified using the rugosity index, which is
the ratio of a length of chain moulded to the reef surface to the linear distance between
its start and end point (Chapter 1). A perfectly flat surface has a rugosity index of one,
with larger numbers indicating more complex surfaces. Scores rarely exceed three,
which would be typical of historic reef complexity in the Caribbean prior to the 1980s
(Chapter 1). A three metre chain (0.7 cm link-length) was used to estimate reef rugosity
at five equally spaced points along the same 30 m transect, which were then averaged to
give transect-level rugosity.
Figure 1. Map of Cozumel Island and (inset) the location within the Caribbean Sea. The continuous line
delimits the polygon of the Marine Protected Area (Parque Nacional Arrecifes de Cozumel) and the bold
dotted line represents the area surveyed in this study.
Data Analyses
To examine whether transects with similar coral community composition also tended to
have similar architectural complexity, we constructed matrices of site community
composition and site rugosity for all pairs of sites. The similarity matrix for coral
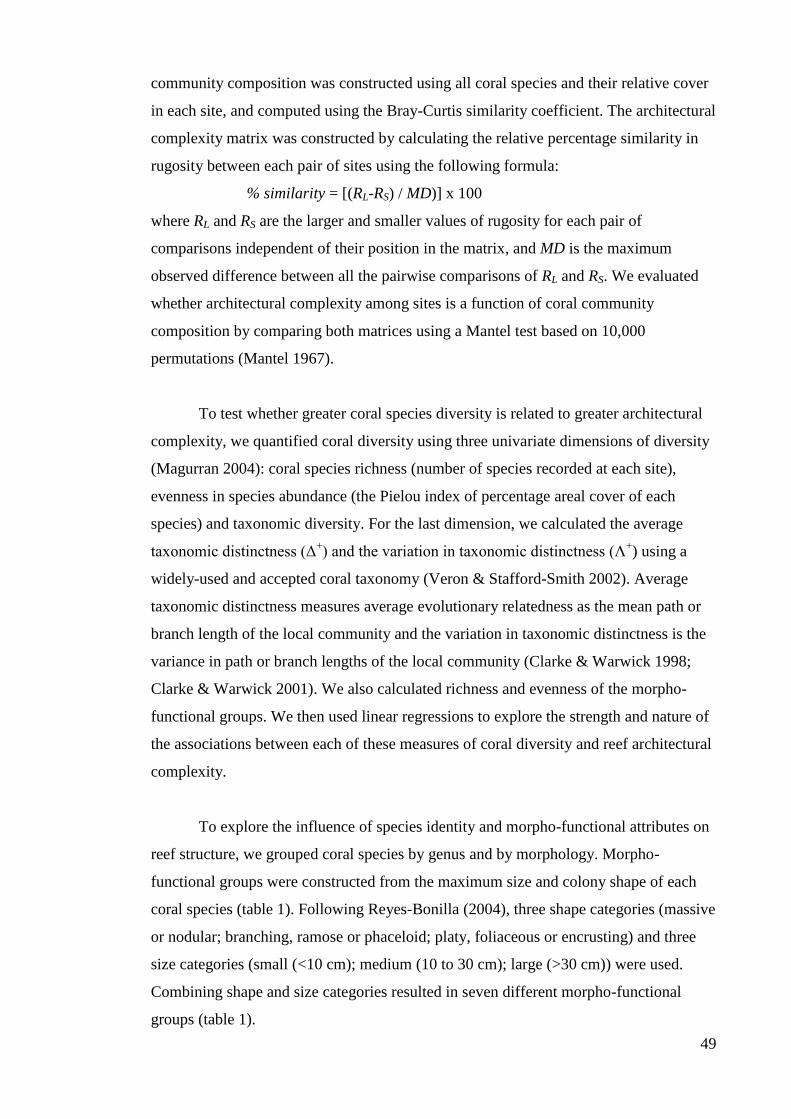
49
community composition was constructed using all coral species and their relative cover
in each site, and computed using the Bray-Curtis similarity coefficient. The architectural
complexity matrix was constructed by calculating the relative percentage similarity in
rugosity between each pair of sites using the following formula:
% similarity = [(RL-RS) / MD)] x 100
where RL and RS are the larger and smaller values of rugosity for each pair of
comparisons independent of their position in the matrix, and MD is the maximum
observed difference between all the pairwise comparisons of RL and RS. We evaluated
whether architectural complexity among sites is a function of coral community
composition by comparing both matrices using a Mantel test based on 10,000
permutations (Mantel 1967).
To test whether greater coral species diversity is related to greater architectural
complexity, we quantified coral diversity using three univariate dimensions of diversity
(Magurran 2004): coral species richness (number of species recorded at each site),
evenness in species abundance (the Pielou index of percentage areal cover of each
species) and taxonomic diversity. For the last dimension, we calculated the average
taxonomic distinctness (Δ+) and the variation in taxonomic distinctness (Λ
+) using a
widely-used and accepted coral taxonomy (Veron & Stafford-Smith 2002). Average
taxonomic distinctness measures average evolutionary relatedness as the mean path or
branch length of the local community and the variation in taxonomic distinctness is the
variance in path or branch lengths of the local community (Clarke & Warwick 1998;
Clarke & Warwick 2001). We also calculated richness and evenness of the morpho-
functional groups. We then used linear regressions to explore the strength and nature of
the associations between each of these measures of coral diversity and reef architectural
complexity.
To explore the influence of species identity and morpho-functional attributes on
reef structure, we grouped coral species by genus and by morphology. Morpho-
functional groups were constructed from the maximum size and colony shape of each
coral species (table 1). Following Reyes-Bonilla (2004), three shape categories (massive
or nodular; branching, ramose or phaceloid; platy, foliaceous or encrusting) and three
size categories (small (<10 cm); medium (10 to 30 cm); large (>30 cm)) were used.
Combining shape and size categories resulted in seven different morpho-functional
groups (table 1).
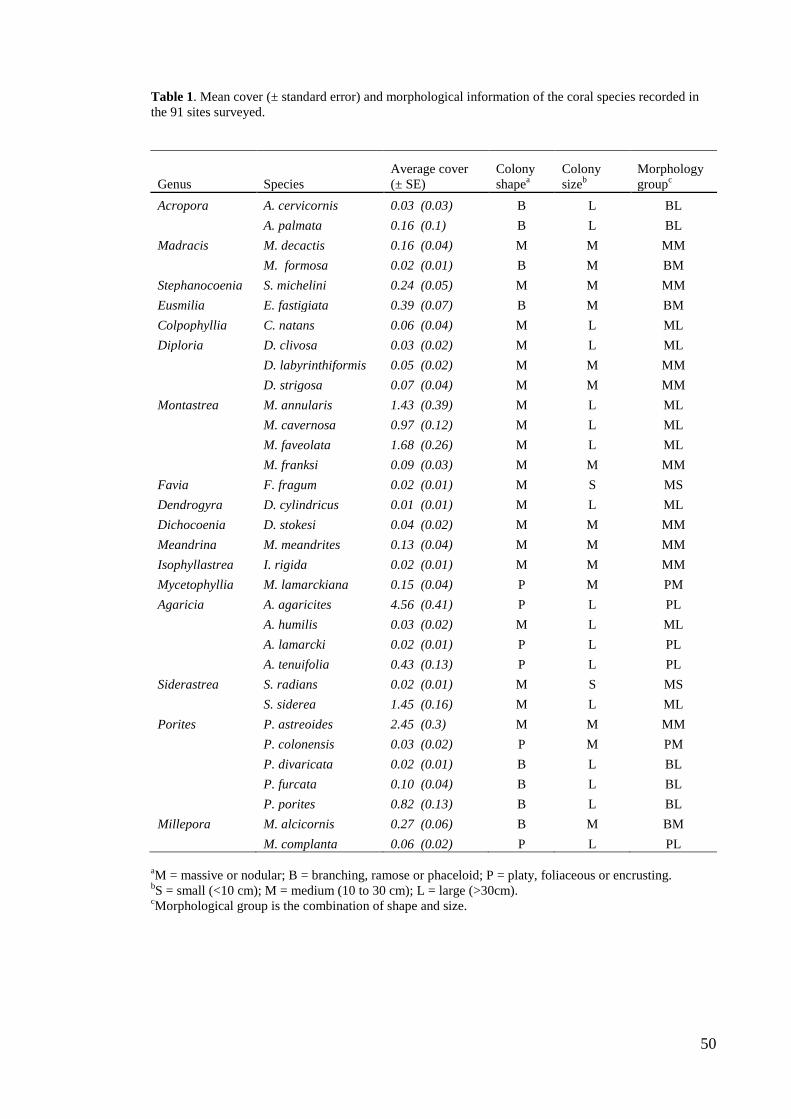
50
Table 1. Mean cover (± standard error) and morphological information of the coral species recorded in
the 91 sites surveyed.
Genus Species
Average cover
(± SE)
Colony
shapea
Colony
sizeb
Morphology
groupc
Acropora A. cervicornis 0.03 (0.03) B L BL
A. palmata 0.16 (0.1) B L BL
Madracis M. decactis 0.16 (0.04) M M MM
M. formosa 0.02 (0.01) B M BM
Stephanocoenia S. michelini 0.24 (0.05) M M MM
Eusmilia E. fastigiata 0.39 (0.07) B M BM
Colpophyllia C. natans 0.06 (0.04) M L ML
Diploria D. clivosa 0.03 (0.02) M L ML
D. labyrinthiformis 0.05 (0.02) M M MM
D. strigosa 0.07 (0.04) M M MM
Montastrea M. annularis 1.43 (0.39) M L ML
M. cavernosa 0.97 (0.12) M L ML
M. faveolata 1.68 (0.26) M L ML
M. franksi 0.09 (0.03) M M MM
Favia F. fragum 0.02 (0.01) M S MS
Dendrogyra D. cylindricus 0.01 (0.01) M L ML
Dichocoenia D. stokesi 0.04 (0.02) M M MM
Meandrina M. meandrites 0.13 (0.04) M M MM
Isophyllastrea I. rigida 0.02 (0.01) M M MM
Mycetophyllia M. lamarckiana 0.15 (0.04) P M PM
Agaricia A. agaricites 4.56 (0.41) P L PL
A. humilis 0.03 (0.02) M L ML
A. lamarcki 0.02 (0.01) P L PL
A. tenuifolia 0.43 (0.13) P L PL
Siderastrea S. radians 0.02 (0.01) M S MS
S. siderea 1.45 (0.16) M L ML
Porites P. astreoides 2.45 (0.3) M M MM
P. colonensis 0.03 (0.02) P M PM
P. divaricata 0.02 (0.01) B L BL
P. furcata 0.10 (0.04) B L BL
P. porites 0.82 (0.13) B L BL
Millepora M. alcicornis 0.27 (0.06) B M BM
M. complanta 0.06 (0.02) P L PL
aM = massive or nodular; B = branching, ramose or phaceloid; P = platy, foliaceous or encrusting.
bS = small (<10 cm); M = medium (10 to 30 cm); L = large (>30cm).
cMorphological group is the combination of shape and size.
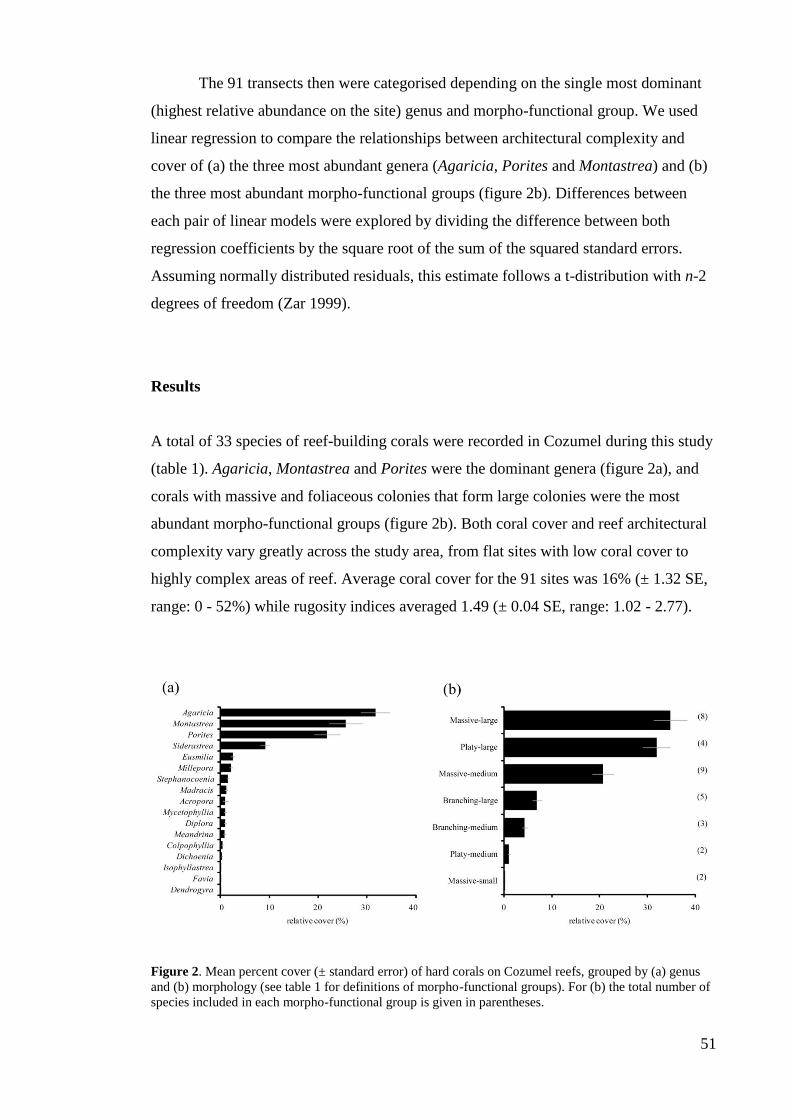
51
The 91 transects then were categorised depending on the single most dominant
(highest relative abundance on the site) genus and morpho-functional group. We used
linear regression to compare the relationships between architectural complexity and
cover of (a) the three most abundant genera (Agaricia, Porites and Montastrea) and (b)
the three most abundant morpho-functional groups (figure 2b). Differences between
each pair of linear models were explored by dividing the difference between both
regression coefficients by the square root of the sum of the squared standard errors.
Assuming normally distributed residuals, this estimate follows a t-distribution with n-2
degrees of freedom (Zar 1999).
Results
A total of 33 species of reef-building corals were recorded in Cozumel during this study
(table 1). Agaricia, Montastrea and Porites were the dominant genera (figure 2a), and
corals with massive and foliaceous colonies that form large colonies were the most
abundant morpho-functional groups (figure 2b). Both coral cover and reef architectural
complexity vary greatly across the study area, from flat sites with low coral cover to
highly complex areas of reef. Average coral cover for the 91 sites was 16% (± 1.32 SE,
range: 0 - 52%) while rugosity indices averaged 1.49 (± 0.04 SE, range: 1.02 - 2.77).
Figure 2. Mean percent cover (± standard error) of hard corals on Cozumel reefs, grouped by (a) genus
and (b) morphology (see table 1 for definitions of morpho-functional groups). For (b) the total number of
species included in each morpho-functional group is given in parentheses.
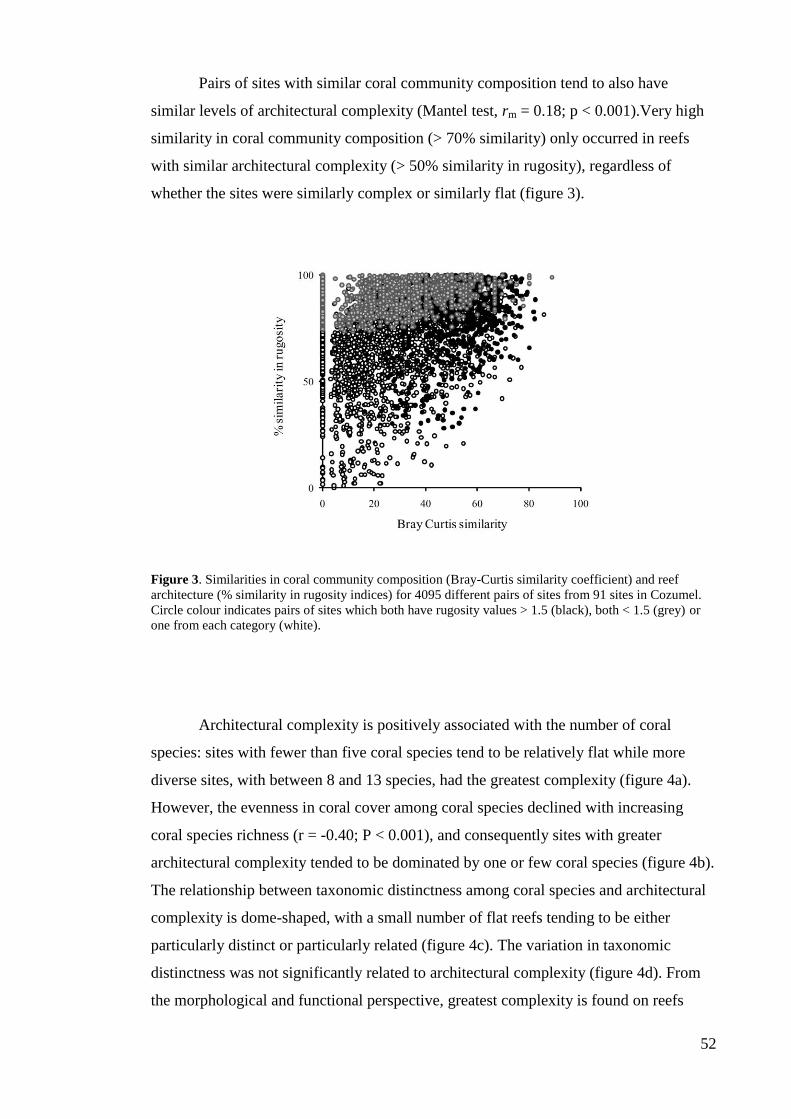
52
Pairs of sites with similar coral community composition tend to also have
similar levels of architectural complexity (Mantel test, rm = 0.18; p < 0.001).Very high
similarity in coral community composition (> 70% similarity) only occurred in reefs
with similar architectural complexity (> 50% similarity in rugosity), regardless of
whether the sites were similarly complex or similarly flat (figure 3).
Figure 3. Similarities in coral community composition (Bray-Curtis similarity coefficient) and reef
architecture (% similarity in rugosity indices) for 4095 different pairs of sites from 91 sites in Cozumel.
Circle colour indicates pairs of sites which both have rugosity values > 1.5 (black), both < 1.5 (grey) or
one from each category (white).
Architectural complexity is positively associated with the number of coral
species: sites with fewer than five coral species tend to be relatively flat while more
diverse sites, with between 8 and 13 species, had the greatest complexity (figure 4a).
However, the evenness in coral cover among coral species declined with increasing
coral species richness (r = -0.40; P < 0.001), and consequently sites with greater
architectural complexity tended to be dominated by one or few coral species (figure 4b).
The relationship between taxonomic distinctness among coral species and architectural
complexity is dome-shaped, with a small number of flat reefs tending to be either
particularly distinct or particularly related (figure 4c). The variation in taxonomic
distinctness was not significantly related to architectural complexity (figure 4d). From
the morphological and functional perspective, greatest complexity is found on reefs
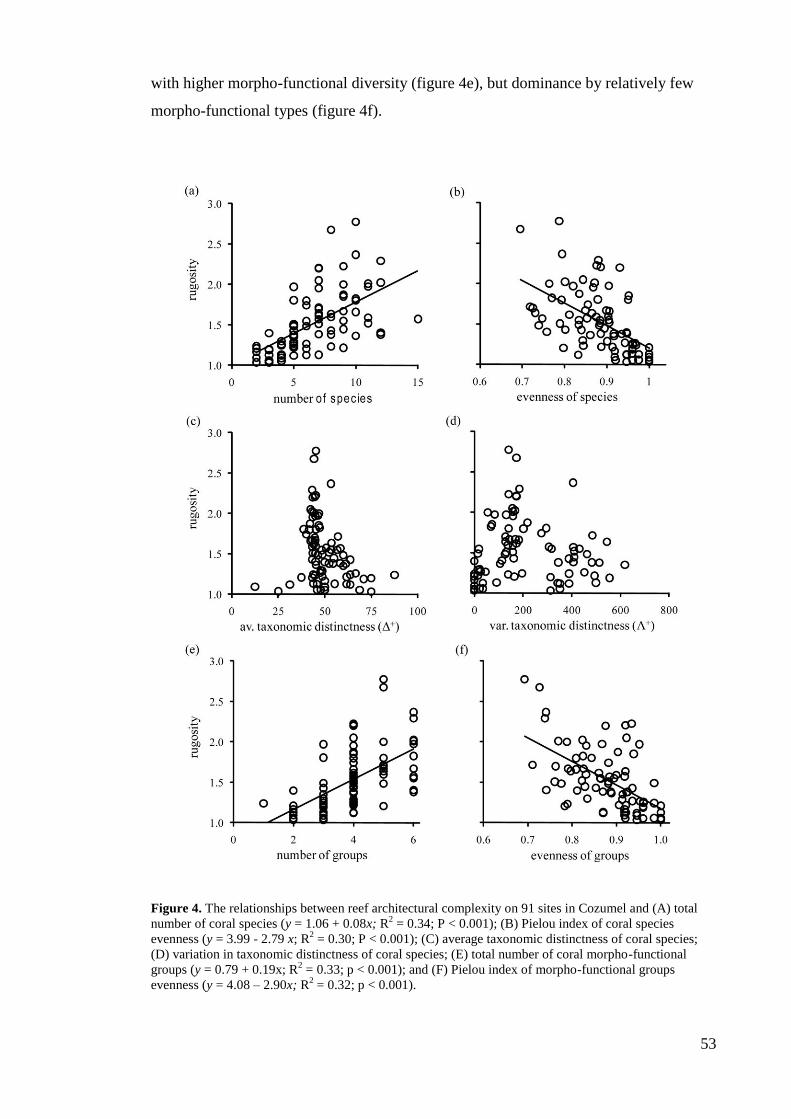
53
with higher morpho-functional diversity (figure 4e), but dominance by relatively few
morpho-functional types (figure 4f).
Figure 4. The relationships between reef architectural complexity on 91 sites in Cozumel and (A) total
number of coral species (y = 1.06 + 0.08x; R2 = 0.34; P < 0.001); (B) Pielou index of coral species
evenness (y = 3.99 - 2.79 x; R2 = 0.30; P < 0.001); (C) average taxonomic distinctness of coral species;
(D) variation in taxonomic distinctness of coral species; (E) total number of coral morpho-functional
groups (y = 0.79 + 0.19x; R2 = 0.33; p < 0.001); and (F) Pielou index of morpho-functional groups
evenness (y = 4.08 – 2.90x; R2 = 0.32; p < 0.001).
54
Reefs with greater coral cover tend to have greater architectural complexity but
the variance in architectural complexity also increases with coral cover (figure 5a).
Much of variance in architectural complexity at high levels of coral cover is the result of
dominance by a particular coral genus. Sites dominated by species from the genus
Montastrea have greater architectural complexity for a given coral cover, followed by
Agaricia then Porites (figure 5b). On Montastrea-dominated sites, architectural
complexity increased more rapidly with increasing coral cover than on Porites-
dominated sites (T24 = -2.23; P = 0.03). However, the slopes of relationships between
coral cover and architectural complexity for Agaricia and each of the other two genera
did not differ significantly (Agaricia vs Montastrea: T49 = 1.65, P= 0.10; Agaricia vs
Porites: T47 = -1.23, P = 0.22).
The differences in architectural complexity for given levels of coral cover are
also strongly related to the morpho-functional attributes of the dominant species. Sites
dominated by massive and large coral species have greater architectural complexity for
a given coral cover, followed by sites dominated by large platy, foliaceous or encrusting
(PL) and then medium size massive corals (figure 5c). Architectural complexity on sites
dominated by massive and large coral species also increased significantly more rapidly
with increasing coral cover than on reefs dominated by medium size massive corals (T34
= -2.72, P = 0.01). However, the slope of the architectural complexity -coral cover
relationship on large platy, foliaceous or encrusting -dominated reefs did not differ
significantly from the other two morphological groups (PL vs ML: T54 = 1.56, P = 0.13;
PL vs MM: T30 = -0.81; P = 0.43).
Discussion
Reef architectural complexity increases with increasing coral cover, but the rate of
increase in complexity depends on the coral community composition and, in particular,
the identity of the dominant species and their associated morphological and functional
traits. The most architecturally complex sites are dominated by few coral species (and
morpho-functional groups) and the identity of these corals largely explains the
differences in the architecture of these sites. These findings underscore the importance
of considering coral species composition and shifts in coral dominance on Caribbean
reefs in order to understand the implications of changes in these ecosystems on the
associated biodiversity and ecosystem services.
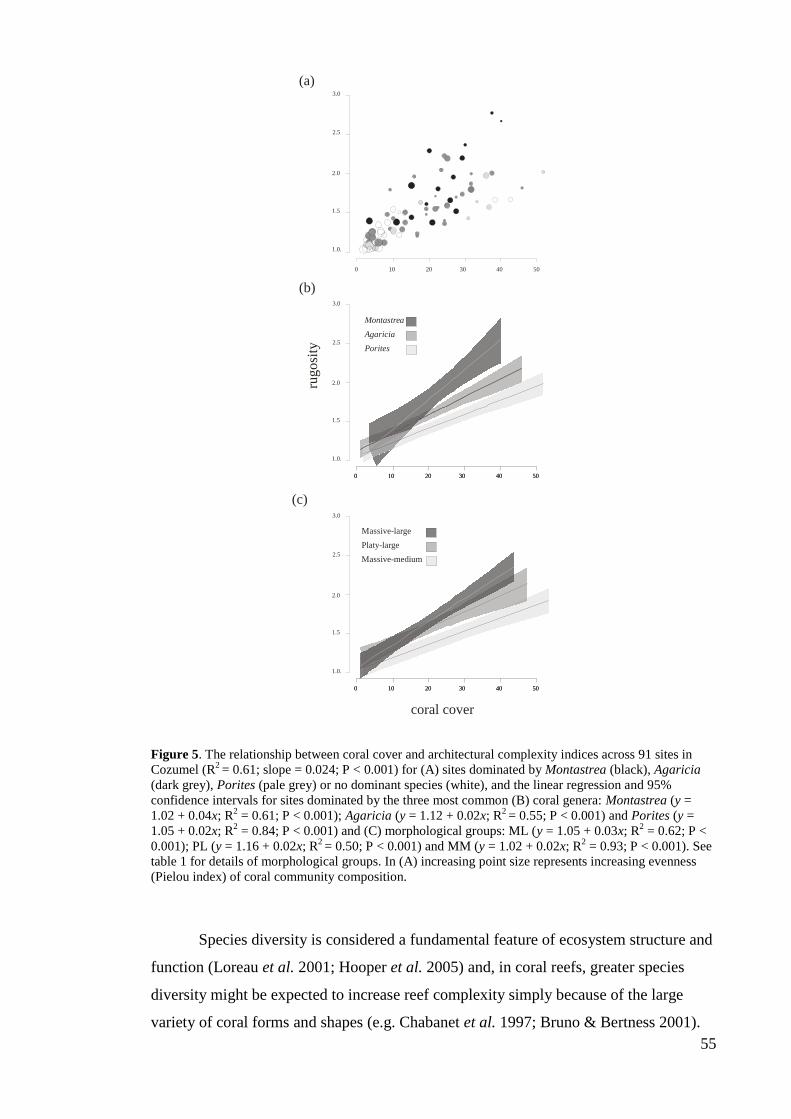
55
Figure 5. The relationship between coral cover and architectural complexity indices across 91 sites in
Cozumel (R2 = 0.61; slope = 0.024; P < 0.001) for (A) sites dominated by Montastrea (black), Agaricia
(dark grey), Porites (pale grey) or no dominant species (white), and the linear regression and 95%
confidence intervals for sites dominated by the three most common (B) coral genera: Montastrea (y =
1.02 + 0.04x; R2 = 0.61; P < 0.001); Agaricia (y = 1.12 + 0.02x; R
2 = 0.55; P < 0.001) and Porites (y =
1.05 + 0.02x; R2 = 0.84; P < 0.001) and (C) morphological groups: ML (y = 1.05 + 0.03x; R
2 = 0.62; P <
0.001); PL (y = 1.16 + 0.02x; R2 = 0.50; P < 0.001) and MM (y = 1.02 + 0.02x; R
2 = 0.93; P < 0.001). See
table 1 for details of morphological groups. In (A) increasing point size represents increasing evenness
(Pielou index) of coral community composition.
Species diversity is considered a fundamental feature of ecosystem structure and
function (Loreau et al. 2001; Hooper et al. 2005) and, in coral reefs, greater species
diversity might be expected to increase reef complexity simply because of the large
variety of coral forms and shapes (e.g. Chabanet et al. 1997; Bruno & Bertness 2001).
0 10 20 30 40 50
3.0
2.5
2.0
1.5
1.0.
(a)
(b)
rugosi
ty3.0
2.5
2.0
1.5
1.0.
0 10 20 30 40 500 10 20 30 40 50
3.0
2.5
2.0
1.5
1.0.
0 10 20 30 40 50
coral cover
0 10 20 30 40 50
C
Montastrea
Agaricia
Porites
Massive-large
Platy-large
Massive-medium
rugosi
ty3.0
2.5
2.0
1.5
1.0.
0 10 20 30 40 500 10 20 30 40 50
3.0
2.5
2.0
1.5
1.0.
0 10 20 30 40 50
coral cover
0 10 20 30 40 50
C
Montastrea
Agaricia
Porites
Massive-large
Platy-large
Massive-medium
rugosi
ty3.0
2.5
2.0
1.5
1.0.
0 10 20 30 40 500 10 20 30 40 50
3.0
2.5
2.0
1.5
1.0.
0 10 20 30 40 50
coral cover
0 10 20 30 40 50
C
Montastrea
Agaricia
Porites
Massive-large
Platy-large
Massive-medium
rugosi
ty3.0
2.5
2.0
1.5
1.0.
0 10 20 30 40 500 10 20 30 40 50
3.0
2.5
2.0
1.5
1.0.
0 10 20 30 40 50
coral cover
0 10 20 30 40 50
C
Montastrea
Agaricia
Porites
Massive-large
Platy-large
Massive-medium
rugosi
ty3.0
2.5
2.0
1.5
1.0.
0 10 20 30 40 500 10 20 30 40 50
3.0
2.5
2.0
1.5
1.0.
0 10 20 30 40 50
coral cover
0 10 20 30 40 50
C
Montastrea
Agaricia
Porites
Massive-large
Platy-large
Massive-medium
rugosi
ty3.0
2.5
2.0
1.5
1.0.
0 10 20 30 40 500 10 20 30 40 50
3.0
2.5
2.0
1.5
1.0.
0 10 20 30 40 50
coral cover
0 10 20 30 40 50
C
Montastrea
Agaricia
Porites
Massive-large
Platy-large
Massive-medium
rugosi
ty3.0
2.5
2.0
1.5
1.0.
0 10 20 30 40 500 10 20 30 40 50
3.0
2.5
2.0
1.5
1.0.
0 10 20 30 40 50
coral cover
0 10 20 30 40 50
C
Montastrea
Agaricia
Porites
Massive-large
Platy-large
Massive-medium
rugosi
ty3.0
2.5
2.0
1.5
1.0.
0 10 20 30 40 500 10 20 30 40 50
3.0
2.5
2.0
1.5
1.0.
0 10 20 30 40 50
coral cover
0 10 20 30 40 50
C
Montastrea
Agaricia
Porites
Massive-large
Platy-large
Massive-medium
0 10 20 30 40 500 10 20 30 40 50
3.0
2.5
2.0
1.5
1.0.
0 10 20 30 40 50
coral cover
0 10 20 30 40 50
C
Montastrea
Agaricia
Porites
Massive-large
Platy-large
Massive-medium
0 10 20 30 40 500 10 20 30 40 50
3.0
2.5
2.0
1.5
1.0.
0 10 20 30 40 50
coral cover
0 10 20 30 40 50
C
Montastrea
Agaricia
Porites
Massive-large
Platy-large
Massive-medium
0 10 20 30 40 500 10 20 30 40 50
3.0
2.5
2.0
1.5
1.0.
0 10 20 30 40 50
coral cover
0 10 20 30 40 50
C
Montastrea
Agaricia
Porites
Massive-large
Platy-large
Massive-medium
0 10 20 30 40 500 10 20 30 40 50
3.0
2.5
2.0
1.5
1.0.
0 10 20 30 40 50
coral cover
0 10 20 30 40 50
C
Montastrea
Agaricia
Porites
Massive-large
Platy-large
Massive-medium
0 10 20 30 40 500 10 20 30 40 50
3.0
2.5
2.0
1.5
1.0.
0 10 20 30 40 50
coral cover
0 10 20 30 40 50
C
Montastrea
Agaricia
Porites
Massive-large
Platy-large
Massive-medium
0 10 20 30 40 500 10 20 30 40 50
3.0
2.5
2.0
1.5
1.0.
0 10 20 30 40 50
coral cover
0 10 20 30 40 50
C
Montastrea
Agaricia
Porites
Massive-large
Platy-large
Massive-medium
0 10 20 30 40 500 10 20 30 40 50
3.0
2.5
2.0
1.5
1.0.
0 10 20 30 40 50
coral cover
0 10 20 30 40 50
C
Montastrea
Agaricia
Porites
Massive-large
Platy-large
Massive-medium
0 10 20 30 40 500 10 20 30 40 50
3.0
2.5
2.0
1.5
1.0.
0 10 20 30 40 50
coral cover
0 10 20 30 40 50
C
Montastrea
Agaricia
Porites
Massive-large
Platy-large
Massive-medium
3.0
2.5
2.0
1.5
1.0.
0 10 20 30 40 50
coral cover
0 10 20 30 40 50
C
Montastrea
Agaricia
Porites
Massive-large
Platy-large
Massive-medium
3.0
2.5
2.0
1.5
1.0.
0 10 20 30 40 50
coral cover
0 10 20 30 40 50
C
Montastrea
Agaricia
Porites
Massive-large
Platy-large
Massive-medium
3.0
2.5
2.0
1.5
1.0.
0 10 20 30 40 50
coral cover
0 10 20 30 40 50
C
Montastrea
Agaricia
Porites
Massive-large
Platy-large
Massive-medium
3.0
2.5
2.0
1.5
1.0.
0 10 20 30 40 50
coral cover
0 10 20 30 40 50
C
Montastrea
Agaricia
Porites
Massive-large
Platy-large
Massive-medium
3.0
2.5
2.0
1.5
1.0.
0 10 20 30 40 50
coral cover
0 10 20 30 40 50
C
Montastrea
Agaricia
Porites
Massive-large
Platy-large
Massive-medium
3.0
2.5
2.0
1.5
1.0.
0 10 20 30 40 50
coral cover
0 10 20 30 40 50
C
Montastrea
Agaricia
Porites
Massive-large
Platy-large
Massive-medium
3.0
2.5
2.0
1.5
1.0.
0 10 20 30 40 50
coral cover
0 10 20 30 40 50
(c)
Montastrea
Agaricia
Porites
Massive-large
Platy-large
Massive-medium
Massive-large
Platy-large
Massive-medium
Massive-large
Platy-large
Massive-medium
Massive-large
Platy-large
Massive-medium
56
However, positive relationships between the number of coral species and architectural
complexity may in fact be a consequence of the positive relationship between coral
cover and architectural complexity, as species diversity is also positively associated
with coral cover (this study: r = 0.83, P < 0.001; Bell & Galzin 1984). Moreover,
taxonomic relatedness indices show that most sites shared a very similar species
composition and that there is no clear effect of increasing taxonomic composition on
reef architectural complexity. By contrast, the distribution of species abundances clearly
shows that predominance by one or few species increases the complexity of the reef
structure. Historically, Caribbean reefs have comprised small numbers of abundant
species rather than a high diversity of coral species (Johnson et al. 2008), supporting the
importance of coral dominance in structuring Caribbean reefs. In addition, Caribbean
corals have relatively low diversity and redundancy in comparison with other regions of
the world. For example, there are 120 massive coral species in the Great Barrier Reef,
Australia while the Caribbean harbours fewer than 25 (Bellwood et al. 2004). This lack
of functional diversity might explain why Caribbean reef architectural complexity relies
more on the presence and identity of dominant species than on the combined structural
attributes of a wider range of species.
We found that the strength of the positive effect of foundation species in
providing structure to the habitat largely depends on the identity of the dominant taxa.
At the reefscape scale, architectural complexity increased faster in sites dominated by
large-massive species, such as Montastrea, than in sites dominated by short-lived and
stress-resistant species. Among Caribbean reef-building corals, Montastraea species
play critical roles in reef construction and community ecology (Harborne et al. 2008;
Harborne 2009). The relative abundance of such massive species is declining in the
Caribbean (Edmunds & Elahi 2007). For example, Cozumel reefs were largely
dominated by Montastrea species in the 1980s (Muckelbauer 1990) but more recently
they have been increasingly dominated by Agaricia and Porites (Alvarez-Filip et al.
2009; figure 2). Cozumel reefs may therefore no longer be providing the structural
benefits that they were in recent decades. Similar shifts from assemblages dominated by
physically large and long-lived coral species toward assemblages dominated by weedy
corals are being recorded throughout the Caribbean (Steneck et al. 2009), highlighting
the large-scale consequences that these changes in coral community composition may
have for the architectural complexity of Caribbean reefs.
57
On sites with relatively low coral cover (≤ 20 %), architectural complexity
varies little, even across sites dominated by different coral species and types (figures 5
b,c), probably because dominant species are not abundant enough (high evenness; figure
5a) to contribute significantly to the reef framework. Assuming that this also applies
elsewhere in the Caribbean, our findings may help to explain the rapid structural
homogenization towards relatively flat reefs reported in recent decades (Chapter 1).
Most Caribbean reefs have been near or below 20% coral cover since the early 2000s
(Gardner et al. 2003; Bruno et al. 2009; Schutte et al. 2010), which may suggest that the
abundance of previously dominant corals in most reefs is now too low to contribute
significantly to reef architectural complexity. It is likely that the high frequency of
disturbances or chronic mortality that Caribbean reefs are facing may prevent some
structurally-important species from dominating (Hughes & Connell 1999), and these
reefs are therefore likely to remain in the current low-complexity and high evenness
state.
More complex reefs tend to have greater numbers of individuals, biomass or
richness of reef-associated fishes and invertebrates (Luckhurst & Luckhurst 1978;
Dulvy et al. 2002; Idjadi & Edmunds 2006; Wilson et al. 2007). Consequently, our
findings suggest that assemblages with dominant reef-building species such as
Montastrea spp (or Acropora spp.) would be expected to facilitate more biodiverse and
functionally-important coral reefs in the Caribbean. However, important regional
differences in the species richness and functional composition of reef systems
(Bellwood et al. 2004) also highlight the need to explore the generality of these
findings. Assessing whether similar patterns occur in regions with considerably higher
diversity of coral forms and functional redundancy, such as in the Indo-West Pacific,
would enrich our understanding of the role of coral species composition in the provision
of ecological and ecosystem services. In the Caribbean, however, it is likely that halting
rates of architectural complexity loss will require a major emphasis on facilitating the
maintenance and endurance of healthy populations of these key coral species, rather
than focussing efforts on restoring the overall abundance of scleractinian corals. This
seems to be particularly important for those reefs that have relatively high coral cover
(> 20%), where the presence of healthy populations of these key coral species may
considerably increase the reef architectural complexity.
58
Chapter 5
Coral reef architectural complexity influences fish
community and food web structure
Abstract
Coral community shifts towards reefs dominated by stress-resistant corals have
contributed to the severe declines in the architectural complexity of reefs throughout the
Caribbean. Complex reef architecture provides important refuges and resources for
many reef fishes and thus widespread declines in reef complexity could have severe
consequences for the structure and function of fish assemblages. Here, we explore the
influence of reef architecture on fish assemblages by comparing the size and trophic
structure of reef fishes along a 15-reef gradient of coral cover, coral species dominance
and architectural complexity in Cozumel, Mexico. Our results show that reefs with high
architectural complexity, in particular those dominated by robust Montastrea corals,
supported fish assemblages with greater recruitment and longer food chains (higher
mean trophic levels). The association between coral complexity and fish communities
is highly size-structured and is greatest for smallest size classes and is less so for larger
size classes. The greater abundance of both small fish and the key early life stages of
larger fishes on more complex reefs suggests that architectural complexity may
influence entire reef fish assemblages, even though larger fish are less dependent on
reef complexity. Key reef-building corals such as Montastrea are thus likely to be
disproportionately important for maintaining reef fish communities, and shifts in
Caribbean coral communities may compromise fish recruitment and recovery and
truncate food chains.
Submitted:
Alvarez-Filip L., Gill J.A., Watkinson A.R. & Dulvy N.K. Coral reef architectural
complexity influences fish community and food web structure Marine Ecology
Progress Series.
59
Introduction
Habitat architecture is known to profoundly influence the abundance and diversity of
species through the provision of niches and diverse ways of exploiting environmental
resources (e.g. MacArthur & MacArthur 1961; Bazzaz 1975; Bell et al. 1991; Tews et
al. 2004). In many ecosystems, the architecture of the habitat is defined by the
abundance and morphological attributes of certain foundation species. Many of these
species, such as numerous overstorey trees, reef-building corals and kelp, have
experienced or are experiencing widespread declines (Steneck et al. 2002; Gardner et al.
2003; Ellison et al. 2005). These declines commonly result in dominance shifts towards
more stress-resistant species that often have rapid growth rates and are likely to provide
fewer structural benefits (Ellison et al. 2005; Steneck et al. 2009). Understanding the
influence of changes in the relative abundance of different foundation species on
associated biodiversity can therefore provide valuable insights into the potential
consequences of changing habitat structure resulting from environmental disturbances.
In tropical reefs systems, the architectural complexity of coral species is
important for providing a wide variety of refuge spaces, such as crevices, holes and
branches, which can influence the diversity and structure of reef-associated
communities (Bell & Galzin 1984; Jones & Syms 1998). For instance, at small spatial
scales (< 1 km) the recruitment of fish larvae depends in part on the availability of
suitable refuges, and the post-settlement movements of fish recruits are largely
influenced by the availability of microhabitat structures (Jones 1991; Tolimieri 1995;
Caley & John 1996; Caselle & Warner 1996; Schmitt & Holbrook 1999; Johnson 2007).
In juvenile and adult fishes, levels of competition and predation can also be influenced
by the complexity of reef habitats, as more complex habitats may reduce competition by
providing a greater spectrum of resources, and reduce predation by providing more prey
refuges and/or reducing encounter rates between predators and prey (Holbrook &
Schmitt 1988; Hixon & Beets 1993; Almany 2003; 2004).
Coral reefs are currently changing very rapidly, particularly in the Caribbean
where structurally complex reefs are becoming increasingly scarce, at least partly as a
consequence of the loss of key reef-building corals (Gardner et al. 2003; Chapters 1 &
2). Such rapid declines in reef complexity are likely to have severe consequences for
biodiversity and associated environmental services. The consequences for coral reef
60
fishes are of particular concern because reef fisheries are extremely valuable and are an
important source of protein and livelihood for many vulnerable coastal human
communities (Newton et al. 2007; Allison et al. 2009). Declines in reef architectural
complexity may therefore result in reductions in overall species richness, particularly of
reef specialists (Beukers & Jones 1997; Graham et al. 2006; 2007), with potential long-
term consequences for large-bodied species of importance for local fisheries (Graham et
al. 2007).
As different species of coral vary in their vulnerability to environmental
perturbations, the variety of natural and human disturbances can greatly impact the
relative abundance of key coral species, potentially resulting in a differential loss of
specific microhabitats. For example, in the Caribbean, rapid declines in live coral cover
have been accompanied by a shift in communities towards reefs dominated by stress-
resistant and less architecturally complex corals (Hughes 1994; Aronson et al. 2002;
Green et al. 2008; Lirman & Manzello 2009). In this region, mid-water reefs now
dominated by stress-resistant corals such as Porites and Agaricia provide consistently
less architectural-complex reefs in comparison to Montastrea-dominated sites (Chapter
4). As these shifts in coral community composition can potentially have severe
consequences for associated reef-fishes, there is thus a pressing need to understand the
response of fish communities to the changes in coral community composition and
associated loss of reef complexity.
Here we test whether more structurally-complex areas of coral reef support
greater abundances or diversity of fish along a 15-reef gradient of architectural
complexity in Cozumel, Mexico. As the architectural complexity of reef-building corals
may be especially important for small-bodied fishes, including recruits and juveniles
from larger species that rely directly on reef microhabitat features to settle and feed, we
explore these relationships using both size-based and trophic-guild perspectives.
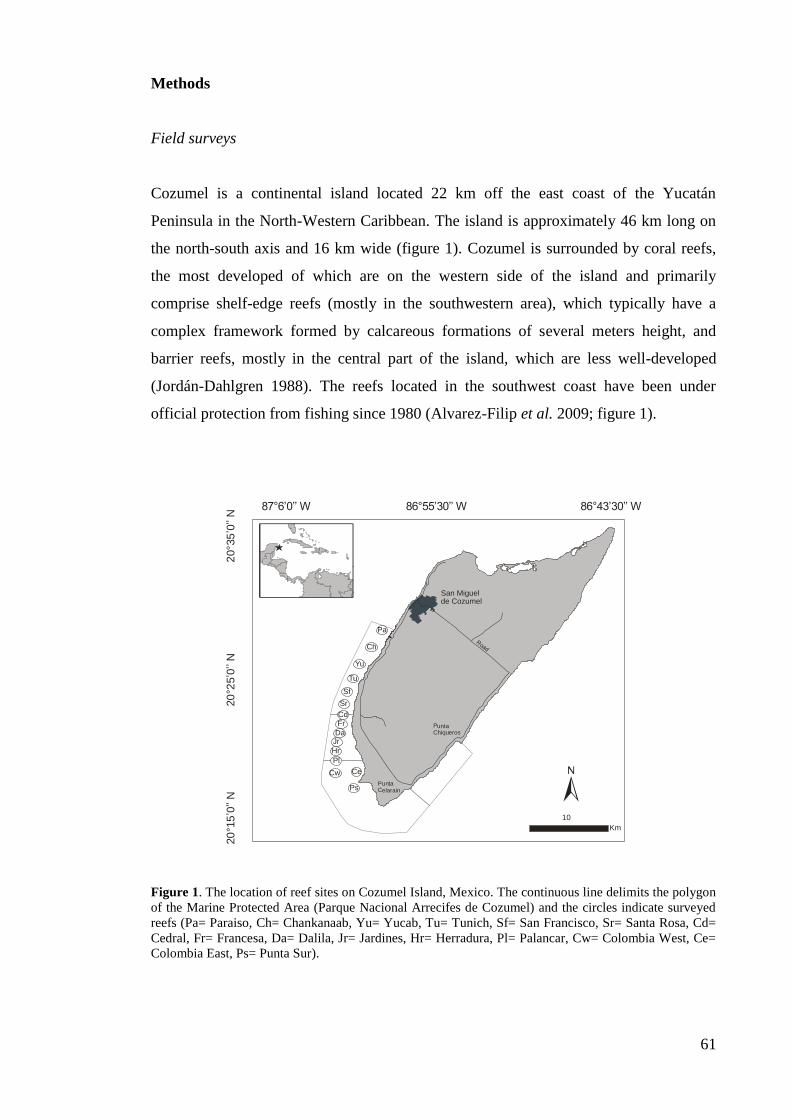
61
Methods
Field surveys
Cozumel is a continental island located 22 km off the east coast of the Yucatán
Peninsula in the North-Western Caribbean. The island is approximately 46 km long on
the north-south axis and 16 km wide (figure 1). Cozumel is surrounded by coral reefs,
the most developed of which are on the western side of the island and primarily
comprise shelf-edge reefs (mostly in the southwestern area), which typically have a
complex framework formed by calcareous formations of several meters height, and
barrier reefs, mostly in the central part of the island, which are less well-developed
(Jordán-Dahlgren 1988). The reefs located in the southwest coast have been under
official protection from fishing since 1980 (Alvarez-Filip et al. 2009; figure 1).
Figure 1. The location of reef sites on Cozumel Island, Mexico. The continuous line delimits the polygon
of the Marine Protected Area (Parque Nacional Arrecifes de Cozumel) and the circles indicate surveyed
reefs (Pa= Paraiso, Ch= Chankanaab, Yu= Yucab, Tu= Tunich, Sf= San Francisco, Sr= Santa Rosa, Cd=
Cedral, Fr= Francesa, Da= Dalila, Jr= Jardines, Hr= Herradura, Pl= Palancar, Cw= Colombia West, Ce=
Colombia East, Ps= Punta Sur).
San Miguel de Cozumel
Road
Punta Celarain
Punta Chiqueros
87°6’0’’ W 86°55’30’’ W 86°43’30’’ W
20°3
5’0
’’ N
20
°25’0
’’ N
20
°15
’0’’
N
10
Km
Pa
Ch
Yu
Tu
Sf
Sr
Cd
DaJr
Hr
Pl
Cw Ce
Ps
Fr
62
Description of reef structure and fish assemblages
Benthic composition, architectural complexity and reef fish assemblages were surveyed
in 15 mid-water depth (10-15 m) reefs within Cozumel‟s protected area between
October 2007 and February 2008 (figure 1). The surveyed area in each reef (i.e.
transects and the area between them) covered ca. 2000 m2, and the 15 reefs sites were
all at least 500 m apart. Between three and eight 30 x 5 m transects (150 m2; number of
transects per reef is given in figure 2) were surveyed on each reef. In each transect, a
plastic tape measure was unrolled as the diver was moving forward identifying all the
conspicuous fishes that crossed the transect line. Individuals were counted in an
instantaneous manner to avoid the possibility of double counting and inflated density
estimates (Ward-Paige et al. 2010). The fork length of each fish was estimated within
10 cm categories (≤ 10, 10 – 20, 20 – 30, 30 – 40, 40 – 50 cm), which is well within the
precision possible with minimal training (Dulvy et al. 2004). The surveyor was
previously trained in fish identification and size estimation, and has carried out similar
surveys in the study area for several years. Count time was not standardised because this
was dependent on fish abundance, diversity and subsequent habitat measures. All
transects were haphazardly located within the reefs and surveyed between 09:00 and
16:00 h by the same observer.
Benthic community structure was characterised using the point intercept method
(Loya 1972) in each 30 m transect once the fish census was complete. The percentage
cover of each benthic component (live coral species, soft coral, turf algae, macroalgae,
sponges, bare rock and sand) was identified every 25 cm, resulting in 120 estimates per
30 m transect.
Architectural complexity was measured with two complementary
methodologies: a chain measure of local reef-relief and a larger-scale visual categorical
estimate. For the small scale we used the rugosity index, which is the ratio of a length of
chain moulded to the reef surface to the linear distance between its start and end point
(Chapter 1). A perfectly flat surface would have a rugosity index of one, with larger
numbers indicating more complex surfaces. A three metre chain (0.7 cm link-length)
was used to estimate reef rugosity five times evenly distributed along each 30 m
transect, and the average was calculated as a measure of transect-level rugosity. The
reefscape-scale visual assessment of architectural complexity consists of assigning each
63
transect a score from 0 (flat surface) to 5 (exceptionally complex reef with numerous
caves and overhangs; Wilson et al. 2007).
Description of fish assemblages
Fish assemblages were characterized using three univariate metrics that describe the
overall fish community (total number of species, total number of individuals and total
biomass) and four metrics that describe food-web structure (mean trophic level, trophic
guilds and the slope and intercept of the size spectra). The three community metrics
were calculated at the transect level and then averaged across transects to produce reef-
level fish community metrics. Total fish biomass was calculated by converting the
estimates of fish length to weight using species-specific length-weight conversions
(Froese & Pauly 2009). Food chain length was estimated using mean trophic level
which was calculated for each reef by averaging the trophic level (obtained from
Fishbase; Froese & Pauly 2009) of each individual recorded on all transects within each
reef. In addition to the mean trophic level, fishes were also grouped into six major
trophic guilds (planktivores, herbivores, omnivores, invertivores, carnivores and
piscivores) following Paddack et al. (2009). In aquatic environments, organismal
function varies with the size of individuals, particularly for those that grow by several
orders of magnitude during their life (Jennings 2005). The size-frequency distribution
(size spectrum) of fish can therefore have profound ecological implications, because
most life history and ecological characteristics, such as growth schedules, age at
maturity, lifespan, reproductive output, density dependence in juvenile survival and
relative prey sizes are related to body size in marine fishes (Jennings et al. 1999; Froese
& Binohlan 2000; Denney et al. 2002; Goodwin et al. 2006; Barnes et al. 2010). The
size spectrum of the fish community on each reef was calculated by plotting the total
number of individuals in each of the five 10 cm length categories, up to 50 cm.
Individuals larger than 50 cm were very rare (n = 3) and therefore were excluded from
the analyses. The fish size spectrum was then described by the slope and intercept of a
linear regression of this size frequency distribution (Dulvy et al. 2004). Body length
data were log10(x + 1) transformed before analysis, and the midpoint of size classes was
rescaled to zero to remove the correlation between slope and intercept (Daan et al.
2005). The intercept of size spectra provides a description of overall productivity or
energy entering the community (Trenkel & Rochet 2003; Jennings 2005; Jennings et al.
2008; Wilson et al. 2010) and the slope describes the flow and depreciation of energy
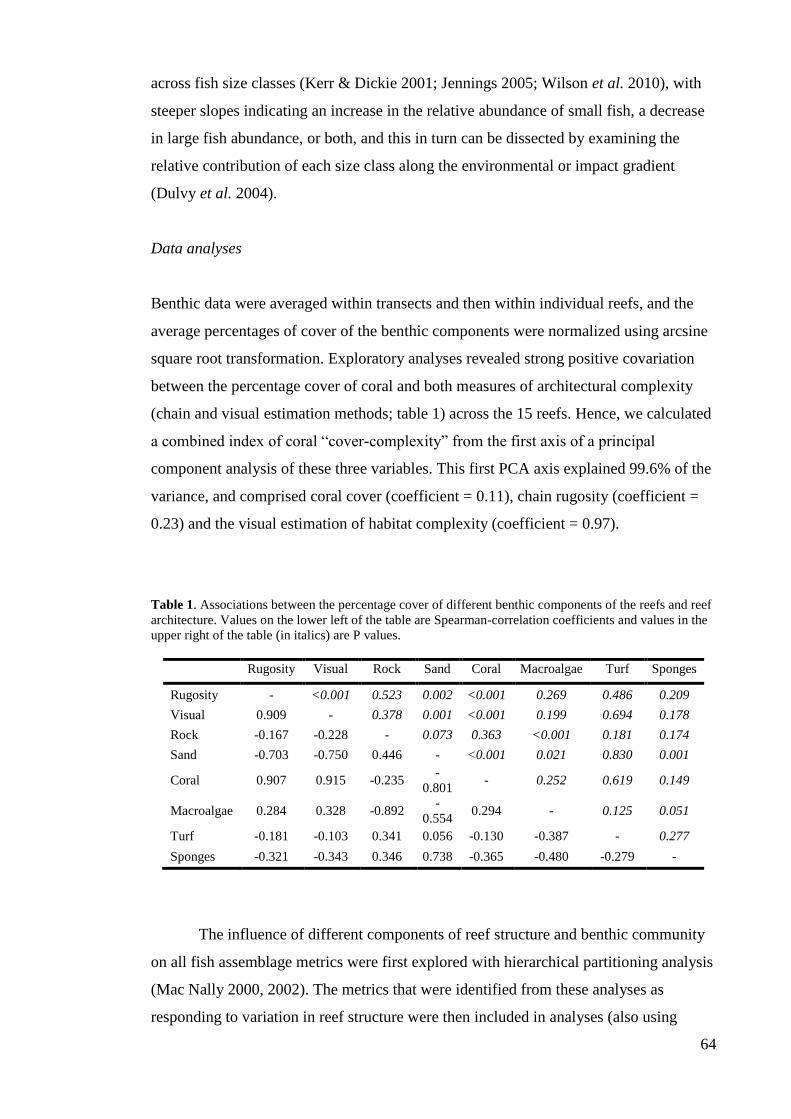
64
across fish size classes (Kerr & Dickie 2001; Jennings 2005; Wilson et al. 2010), with
steeper slopes indicating an increase in the relative abundance of small fish, a decrease
in large fish abundance, or both, and this in turn can be dissected by examining the
relative contribution of each size class along the environmental or impact gradient
(Dulvy et al. 2004).
Data analyses
Benthic data were averaged within transects and then within individual reefs, and the
average percentages of cover of the benthic components were normalized using arcsine
square root transformation. Exploratory analyses revealed strong positive covariation
between the percentage cover of coral and both measures of architectural complexity
(chain and visual estimation methods; table 1) across the 15 reefs. Hence, we calculated
a combined index of coral “cover-complexity” from the first axis of a principal
component analysis of these three variables. This first PCA axis explained 99.6% of the
variance, and comprised coral cover (coefficient = 0.11), chain rugosity (coefficient =
0.23) and the visual estimation of habitat complexity (coefficient = 0.97).
Table 1. Associations between the percentage cover of different benthic components of the reefs and reef
architecture. Values on the lower left of the table are Spearman-correlation coefficients and values in the
upper right of the table (in italics) are P values.
Rugosity Visual Rock Sand Coral Macroalgae Turf Sponges
Rugosity - <0.001 0.523 0.002 <0.001 0.269 0.486 0.209
Visual 0.909 - 0.378 0.001 <0.001 0.199 0.694 0.178
Rock -0.167 -0.228 - 0.073 0.363 <0.001 0.181 0.174
Sand -0.703 -0.750 0.446 - <0.001 0.021 0.830 0.001
Coral 0.907 0.915 -0.235 -
0.801 - 0.252 0.619 0.149
Macroalgae 0.284 0.328 -0.892 -
0.554 0.294 - 0.125 0.051
Turf -0.181 -0.103 0.341 0.056 -0.130 -0.387 - 0.277
Sponges -0.321 -0.343 0.346 0.738 -0.365 -0.480 -0.279 -
The influence of different components of reef structure and benthic community
on all fish assemblage metrics were first explored with hierarchical partitioning analysis
(Mac Nally 2000, 2002). The metrics that were identified from these analyses as
responding to variation in reef structure were then included in analyses (also using
65
hierarchical partitioning) of the influence of different dominant coral types on the
structure of fish assemblages. We restricted this second analysis to four categories: the
three most dominant coral genera in Cozumel, Montastrea, Agaricia and Porites, which
have been shown to have different colony and size structure and hence different
contributions to reef complexity (Chapter 4), and one category including all the other
remaining coral genera.
Hierarchical partitioning is a multiple-regression technique which calculates
goodness of fit measures for all possible combinations of independent variables in linear
models, in order to calculate the average contribution of each predictor (Chevan &
Sutherland 1991; Mac Nally 2000). Hierarchical partitioning provides both the
independent and the joint effects of each predictor, with independent values
representing the explanatory power associated with a single predictor and joint values
representing the explanatory power of the parameter of interest in combination with
other variables (Mac Nally 2002). In some situations, significant independent effects
can be suppressed by antagonistic joint effects, in which case hierarchical partitioning
technique converts antagonistic effects into negative joint contributions, effectively
unmasking the independent contributions (Chevan & Sutherland 1991). Independent
effects of the explanatory benthic variables on the fish assemblages were tested with
1000 permutations of the data matrix and significance was evaluated at the 5% level
(Mac Nally 2002). We used hierarchical partitioning rather than traditional multiple
regressions or other multivariate analysis, because this method deals well with
multicollinearity of predictor variables (Mac Nally 2000, 2002). We conducted
hierarchical partitioning within R using the hier.part package (R 2009). Hierarchical
partitioning does not calculate the direction of the effects of the explanatory variables,
so these were derived from Pearson correlations.
Results
Fish and habitat description
In Cozumel there is a pattern of increasing coral cover from the north to the south of the
island (figure 2), and the reefs are largely dominated by Agaricia, Montastrea and
Porites, although the surface cover of these species varies considerably between reef
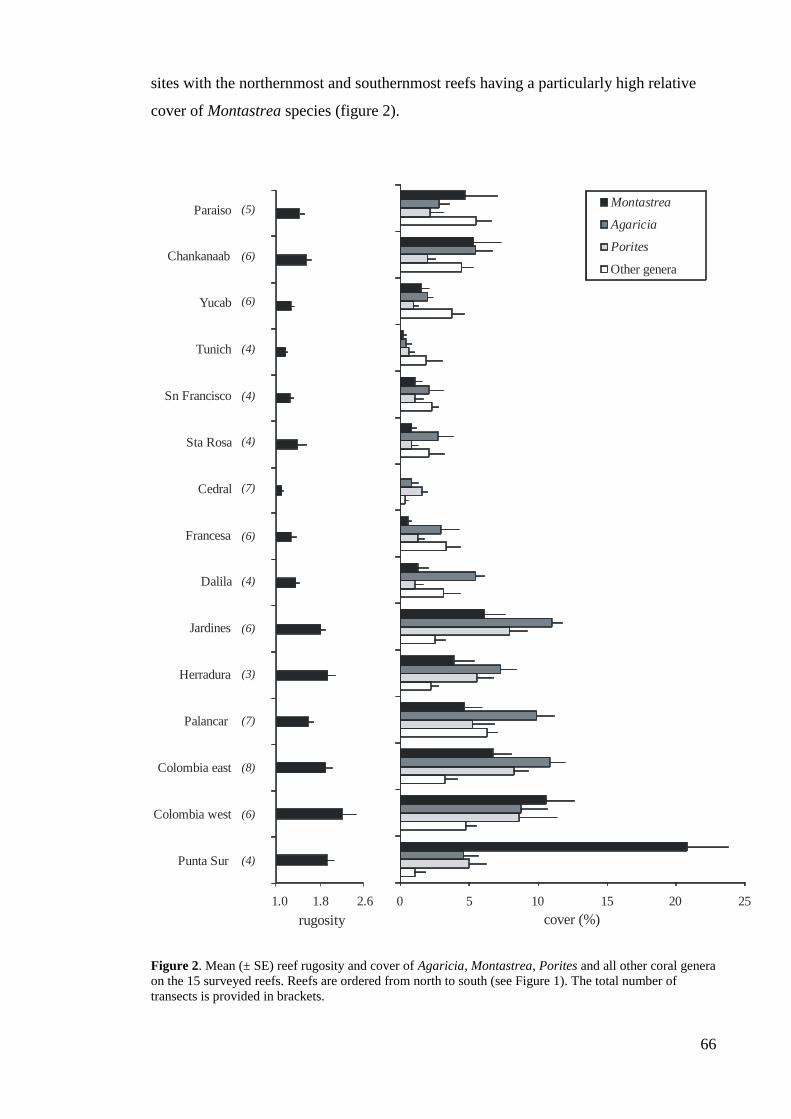
66
sites with the northernmost and southernmost reefs having a particularly high relative
cover of Montastrea species (figure 2).
Figure 2. Mean (± SE) reef rugosity and cover of Agaricia, Montastrea, Porites and all other coral genera
on the 15 surveyed reefs. Reefs are ordered from north to south (see Figure 1). The total number of
transects is provided in brackets.
0 5 10 15 20 25
cover (%)
Montastrea
Agaricia
Porites
Other genera
Punta Sur
Colombia west
Colombia east
Palancar
Herradura
Jardines
Dalila
Francesa
Cedral
Sta Rosa
Sn Francisco
Tunich
Yucab
Chankanaab
Paraiso
1.0 2.6
rugosity
(5)
(6)
(6)
(4)
(4)
(4)
(7)
(6)
(4)
(6)
(3)
(7)
(8)
(6)
(4)
1.8
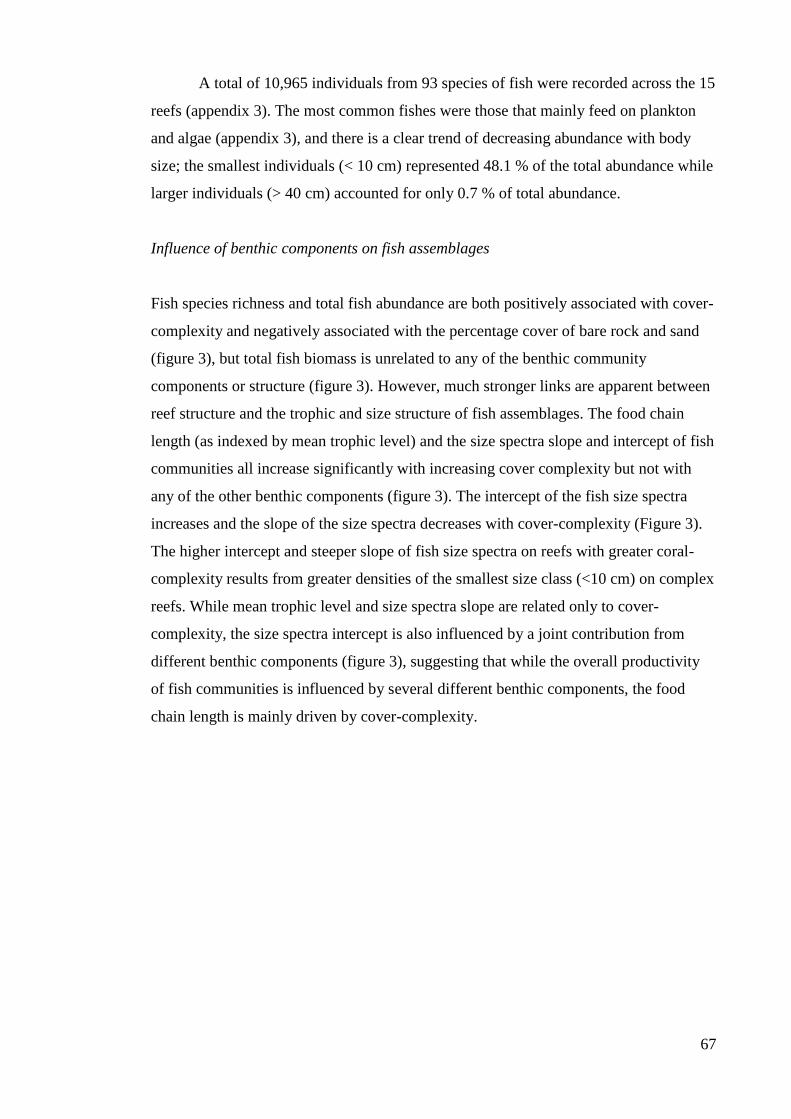
67
A total of 10,965 individuals from 93 species of fish were recorded across the 15
reefs (appendix 3). The most common fishes were those that mainly feed on plankton
and algae (appendix 3), and there is a clear trend of decreasing abundance with body
size; the smallest individuals (< 10 cm) represented 48.1 % of the total abundance while
larger individuals (> 40 cm) accounted for only 0.7 % of total abundance.
Influence of benthic components on fish assemblages
Fish species richness and total fish abundance are both positively associated with cover-
complexity and negatively associated with the percentage cover of bare rock and sand
(figure 3), but total fish biomass is unrelated to any of the benthic community
components or structure (figure 3). However, much stronger links are apparent between
reef structure and the trophic and size structure of fish assemblages. The food chain
length (as indexed by mean trophic level) and the size spectra slope and intercept of fish
communities all increase significantly with increasing cover complexity but not with
any of the other benthic components (figure 3). The intercept of the fish size spectra
increases and the slope of the size spectra decreases with cover-complexity (Figure 3).
The higher intercept and steeper slope of fish size spectra on reefs with greater coral-
complexity results from greater densities of the smallest size class (<10 cm) on complex
reefs. While mean trophic level and size spectra slope are related only to cover-
complexity, the size spectra intercept is also influenced by a joint contribution from
different benthic components (figure 3), suggesting that while the overall productivity
of fish communities is influenced by several different benthic components, the food
chain length is mainly driven by cover-complexity.
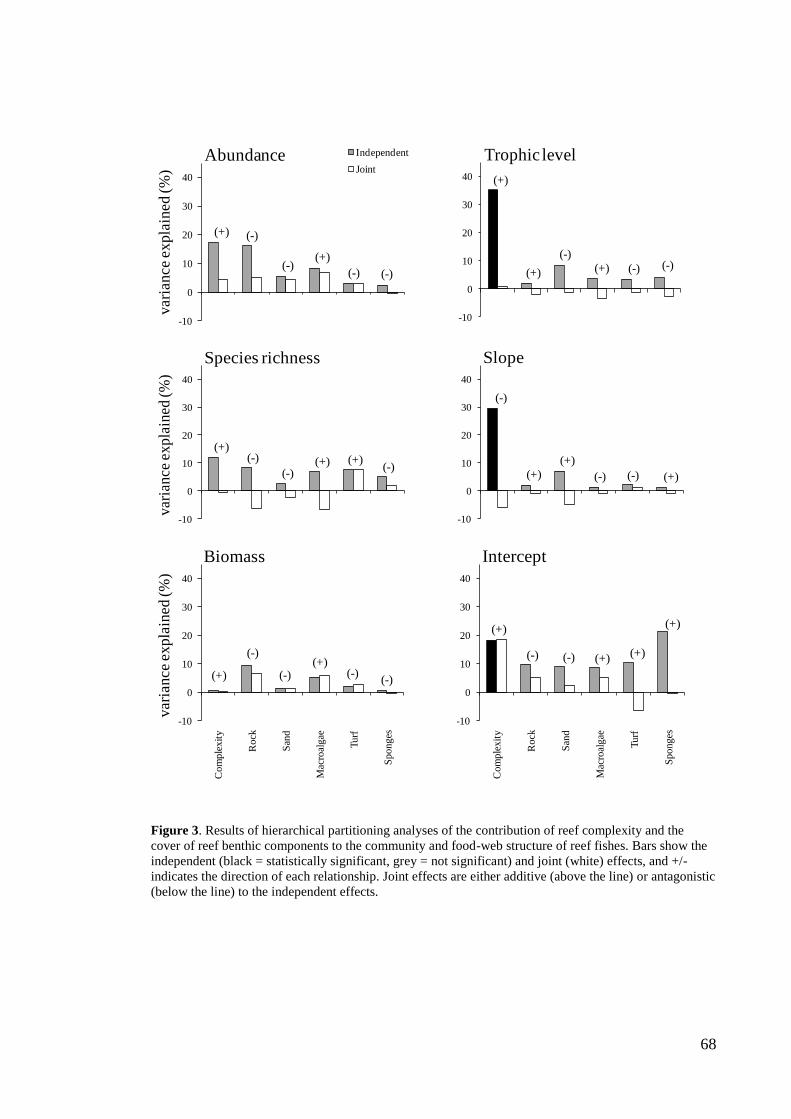
68
Figure 3. Results of hierarchical partitioning analyses of the contribution of reef complexity and the
cover of reef benthic components to the community and food-web structure of reef fishes. Bars show the
independent (black = statistically significant, grey = not significant) and joint (white) effects, and +/-
indicates the direction of each relationship. Joint effects are either additive (above the line) or antagonistic
(below the line) to the independent effects.
-10
0
10
20
30
40
Co
mp
lex
ity
Ro
ck
San
d
Mac
roal
gae
Tu
rf
Sp
on
ges
vari
ance e
xpla
ined (%
)Abundance Independent
Joint
(-)(-)
(+)(-)
(-)(+)
-10
0
10
20
30
40
Com
ple
xit
y
Rock
San
d
Mac
roal
gae
Turf
Sponges
vari
an
ce e
xp
lain
ed
(%
)
Trophic level
(+)(-)(-)(+)
(-)
(+)
-10
0
10
20
30
40
Com
ple
xit
y
Rock
San
d
Mac
roal
gae
Turf
Spon
ges
var
iance
expla
ined
(%
)
Species richness
(-)(+)(+)
(-)
(-)(+)
-10
0
10
20
30
40
Com
ple
xit
y
Rock
San
d
Mac
roal
gae
Turf
Sponges
var
iance
expla
ined
(%
)
Slope
(+) (-)(-)
(+)
(-)
(+)
-10
0
10
20
30
40
Co
mp
lex
ity
Ro
ck
San
d
Mac
roal
gae
Tu
rf
Sp
on
ges
vari
ance e
xpla
ined (
%)
Biomass
(+) (-)(-)
(+)(-)
(-)
-10
0
10
20
30
40
Co
mp
lex
ity
Ro
ck
San
d
Mac
roal
gae
Tu
rf
Sp
on
ges
var
iance
expla
ined
(%
)
Intercept
(+)
(-) (-) (+) (+)
(+)
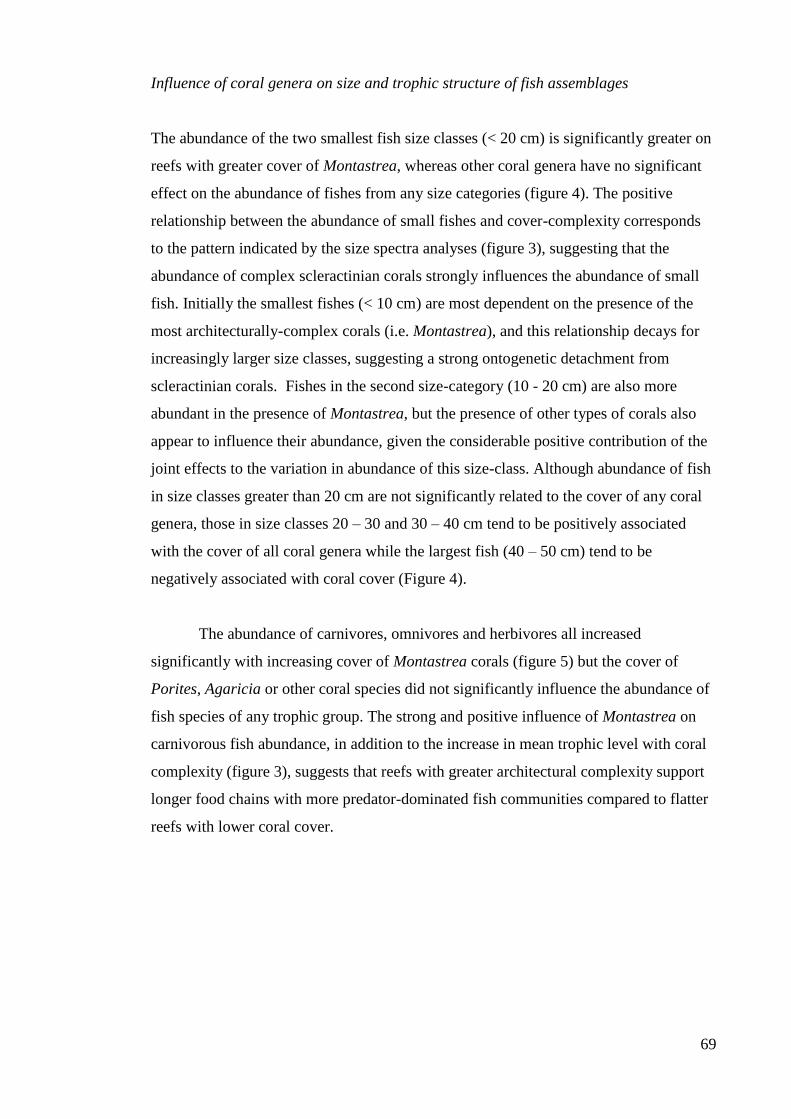
69
Influence of coral genera on size and trophic structure of fish assemblages
The abundance of the two smallest fish size classes (< 20 cm) is significantly greater on
reefs with greater cover of Montastrea, whereas other coral genera have no significant
effect on the abundance of fishes from any size categories (figure 4). The positive
relationship between the abundance of small fishes and cover-complexity corresponds
to the pattern indicated by the size spectra analyses (figure 3), suggesting that the
abundance of complex scleractinian corals strongly influences the abundance of small
fish. Initially the smallest fishes (< 10 cm) are most dependent on the presence of the
most architecturally-complex corals (i.e. Montastrea), and this relationship decays for
increasingly larger size classes, suggesting a strong ontogenetic detachment from
scleractinian corals. Fishes in the second size-category (10 - 20 cm) are also more
abundant in the presence of Montastrea, but the presence of other types of corals also
appear to influence their abundance, given the considerable positive contribution of the
joint effects to the variation in abundance of this size-class. Although abundance of fish
in size classes greater than 20 cm are not significantly related to the cover of any coral
genera, those in size classes 20 – 30 and 30 – 40 cm tend to be positively associated
with the cover of all coral genera while the largest fish (40 – 50 cm) tend to be
negatively associated with coral cover (Figure 4).
The abundance of carnivores, omnivores and herbivores all increased
significantly with increasing cover of Montastrea corals (figure 5) but the cover of
Porites, Agaricia or other coral species did not significantly influence the abundance of
fish species of any trophic group. The strong and positive influence of Montastrea on
carnivorous fish abundance, in addition to the increase in mean trophic level with coral
complexity (figure 3), suggests that reefs with greater architectural complexity support
longer food chains with more predator-dominated fish communities compared to flatter
reefs with lower coral cover.
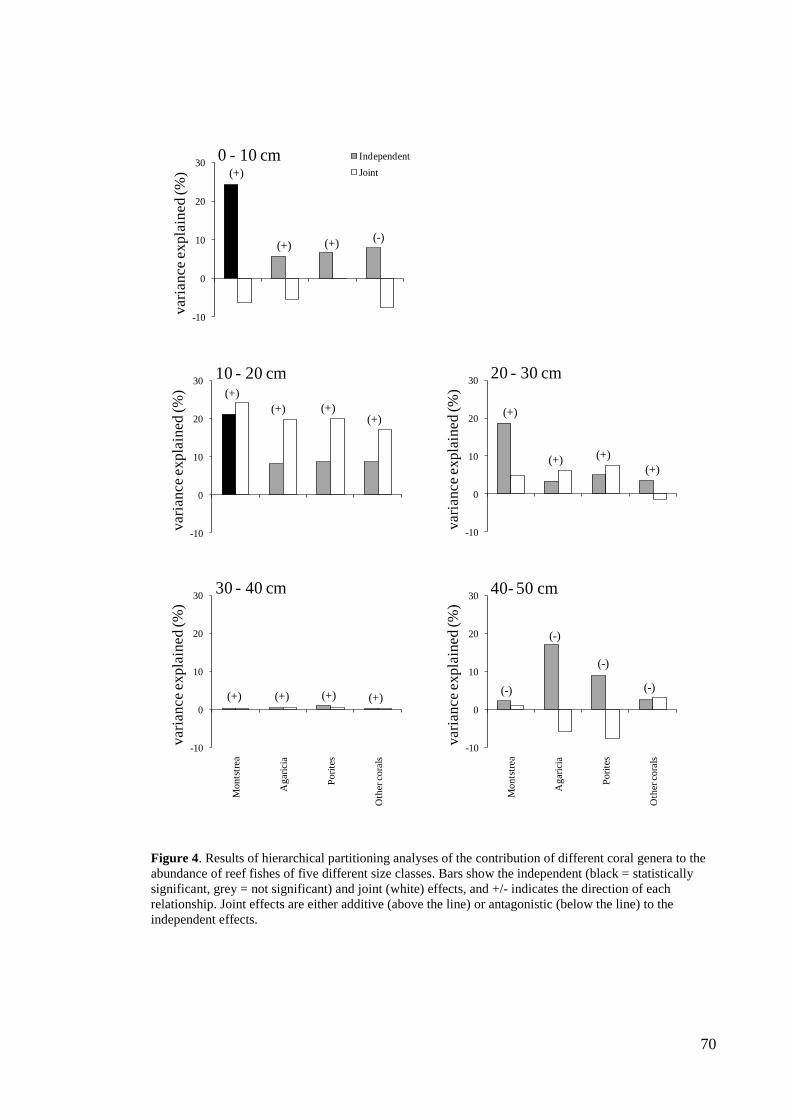
70
Figure 4. Results of hierarchical partitioning analyses of the contribution of different coral genera to the
abundance of reef fishes of five different size classes. Bars show the independent (black = statistically
significant, grey = not significant) and joint (white) effects, and +/- indicates the direction of each
relationship. Joint effects are either additive (above the line) or antagonistic (below the line) to the
independent effects.
-10
0
10
20
30
Monts
trea
Agar
icia
Pori
tes
Oth
er c
ora
ls
vari
an
ce e
xp
lain
ed
(%
)
0 - 10 cm Independent
Joint
(-)(+)(+)
(+)
-10
0
10
20
30
Monts
trea
Agar
icia
Pori
tes
Oth
er c
ora
ls
vari
an
ce e
xp
lain
ed
(%
)
10 - 20 cm
(+)(+)(+)
(+)
-10
0
10
20
30
Monts
trea
Agar
icia
Pori
tes
Oth
er c
ora
ls
vari
ance e
xpla
ined (
%)
20 - 30 cm
(+)
(+)(+)
(+)
-10
0
10
20
30
Mo
nts
trea
Ag
aric
ia
Po
rite
s
Oth
er c
ora
ls
vari
ance e
xpla
ined (
%)
30 - 40 cm
(+)(+)(+)(+)
-10
0
10
20
30
Mo
nts
trea
Ag
aric
ia
Po
rite
s
Oth
er c
ora
ls
vari
ance e
xpla
ined (%
)
40- 50 cm
(-)
(-)
(-)
(-)
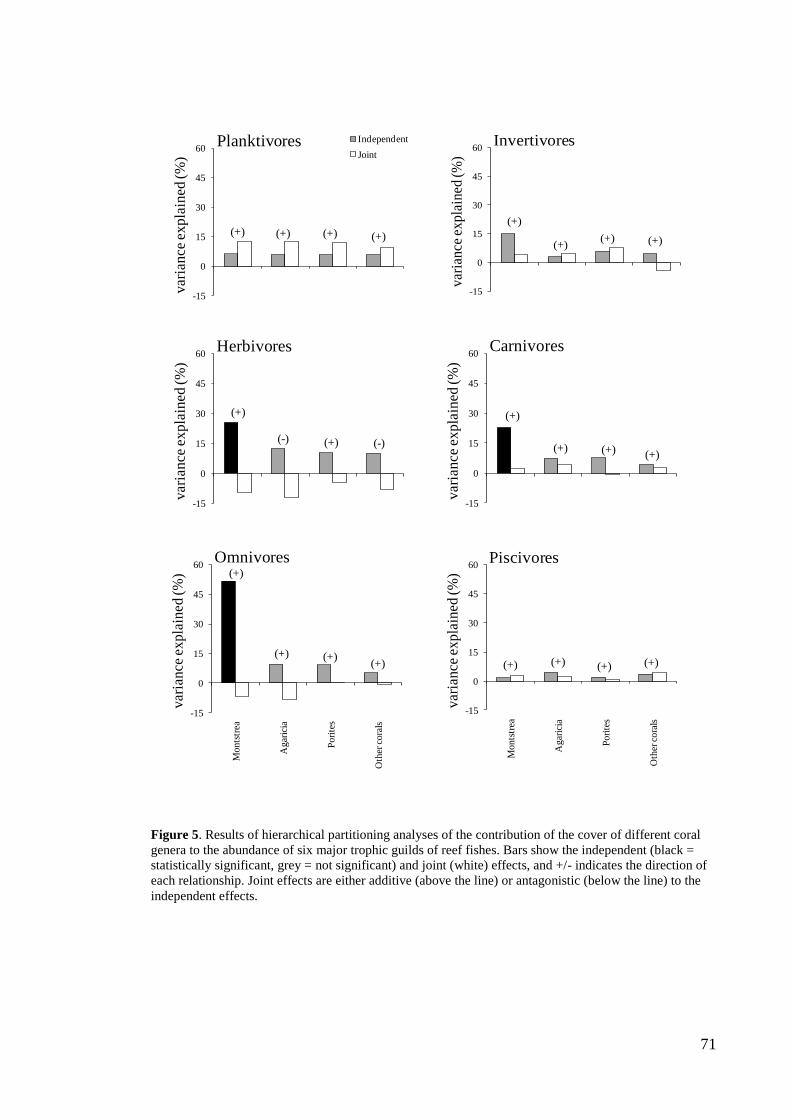
71
Figure 5. Results of hierarchical partitioning analyses of the contribution of the cover of different coral
genera to the abundance of six major trophic guilds of reef fishes. Bars show the independent (black =
statistically significant, grey = not significant) and joint (white) effects, and +/- indicates the direction of
each relationship. Joint effects are either additive (above the line) or antagonistic (below the line) to the
independent effects.
-15
0
15
30
45
60
Mo
nts
trea
Ag
aric
ia
Po
rite
s
Oth
er c
ora
ls
var
iance
expla
ined
(%
)
Planktivores Independent
Joint
(+)(+)(+)(+)
-15
0
15
30
45
60
Monts
trea
Agar
icia
Pori
tes
Oth
er c
ora
ls
var
ian
ce e
xp
lain
ed (%
)
Invertivores
(+)(+)(+)
(+)
-15
0
15
30
45
60
Mo
nts
trea
Ag
aric
ia
Po
rite
s
Oth
er c
ora
ls
vari
an
ce e
xp
lain
ed
(%
)
Herbivores
(-)(+)(-)
(+)
-15
0
15
30
45
60
Mo
nts
trea
Ag
aric
ia
Po
rite
s
Oth
er c
ora
ls
vari
an
ce e
xp
lain
ed
(%
)
Carnivores
(+)(+)(+)
(+)
-15
0
15
30
45
60
Monts
trea
Agar
icia
Pori
tes
Oth
er c
ora
ls
var
ian
ce e
xp
lain
ed (
%)
Omnivores
(+)(+)(+)
(+)
-15
0
15
30
45
60
Monts
trea
Agar
icia
Pori
tes
Oth
er c
ora
ls
var
iance
expla
ined
(%
)
Piscivores
(+)(+)(+)(+)
72
Discussion
The cover and complexity of coral reef has profound implications for fundamental
processes structuring coral reef fish communities. Here, we show that coral cover and
complexity have positive influences on the abundance and recruitment of small fishes
and the food chain length and presumably energy flow through the Caribbean fish
assemblages of Cozumel, Mexico. Across reefs varying greatly in coral cover,
complexity and composition, greater abundances of small-bodied reef-associated fishes
are supported on „healthier‟ more architecturally-complex reefs, in particular those
dominated by robust Montastrea corals. However, the dependence of fishes upon
complex reef structures declines for larger-bodied fish size classes. This suggests that
complex reef structures are most important for maintaining reef fish communities by
facilitating the presence of key early-life stage individuals and small-bodied fishes that
are preyed upon by larger fishes (Caley & John 1996; Beukers & Jones 1997). The
relatively weak contribution of cover-complexity and other benthic components to the
variation in species richness, abundance and biomass suggests that a size-based food
web view of coral reef ecology may provide more insights into coral reef community
structure, function and energy flow than the classical terrestrial species-based functional
perspective.
The positive influence of corals, particularly of the genus Montastrea on reef
fishes is most evident in small-bodied individuals and probably at small spatial scales.
This suggests that the complexity provided by reef-building corals is an important
mediator of the energy entering the reef system and the productivity of the reef-fish
community (see also Jennings & Dulvy 2005; Shin et al. 2005). These results are
consistent with experimental and observational analyses showing that, at small spatial
scales (< 1 km), the recruitment of fish larvae depends in part on the availability of
suitable refuges, and the post-settlement movements of fish recruits are largely related
to the availability of microhabitat structures (Jones 1991; Tolimieri 1995; Caselle &
Warner 1996; Schmitt & Holbrook 1999; Johnson 2007). The steepness of the size
spectra on more complex reefs has been attributed to the depleted abundances of apex
predators, for example fishing can change the size distribution of fish communities by
directly reducing the number of large-bodied fishes that in consequence will result in
prey release (Dulvy et al. 2004; Graham et al. 2005; Wilson et al. 2010). However,
Cozumel reefs have been under protection for 30 years, and have relatively high
73
abundances of apex predators (relative to other Caribbean reefs; Knowlton & Jackson
2008; Alvarez-Filip et al. 2009). Therefore the steepening of the slope in the size-
spectrum, in combination with the elevated intercept, is likely to result from a stronger
association of small-bodied fishes to the coral complexity rather than an effect of
fisheries exploitation of larger fish.
The dependence of reef fishes on complex reef structures declines gradually
with increasing body-length, which hints at an ontogenetic habitat shift. Small-bodied
fishes are strongly related to coral complexity, and particularly to cover of Montastrea,
probably because coral colonies from this genus develop many holes and crevices that
may function as shelter for small fish (Goreau 1959). For example, these corals are
known to attract high numbers of damselfishes of the genus Stegastes that commonly
recruit and „garden‟ in these corals (Precht et al. 2010). Indeed, the small-scale pre-and-
post settlement processes of reef-fishes are more likely to be explained by the presence
of Montastrea than by other corals such as those from the genus Porites, likely due to
the more suitable microhabitat characteristics provided by Montastrea (Tolimieri 1995).
Our results are also consistent with previous studies that have shown that, at patch
scales, Montastrea-dominated reefs are the most species-rich habitats on Caribbean
reefs and have the greatest intra-habitat variability (Harborne et al. 2008; Harborne
2009).
The abundance of fish of body lengths 10 - 30 cm seem to be influenced by the
overall cover of reef-building corals, not just Montastrea corals. This may be a
consequence of increases in the home range size with increasing body size, as larger
Caribbean reef fishes tend to also increase in mobility (Kramer & Chapman 1999), and
are therefore less likely to be associated with specific attributes of individual coral
colonies. More generally, home range size scales positively with body size and the
degree of exclusivity of habitat use declines with increasing size due to the metabolic
scaling of energy acquisition (Jetz et al. 2004). The reduction in dependence on reef
complexity of large-bodied fishes suggests that factors such as the availability of prey
(Hixon & Beets 1993) and/or reef conditions at larger scales (e.g. the effect of
protection at Marine Reserve scales; Kramer & Chapman 1999) may be stronger
influences on the abundance of these adult fishes.
74
The complexity or reef structures, and in particular the cover of Montastrea
corals, also appears to favour the presence of higher-trophic level (especially
carnivorous) fish. However, although increased abundance of fishes from higher trophic
levels might be expected to increase the overall biomass of the fish assemblage, we
found no significant increase in total fish biomass with increasing cover-complexity.
This might be explained by three, non-mutually exclusive reasons. First, the abundance
of higher trophic level fishes could be primarily represented by juvenile individuals that
may be using the corals for refuge or searching for small prey items (e.g. Rooker 1995;
McCormick 1998; Gratwicke et al. 2006). Although the dietary mode of carnivorous
fishes persists throughout their lives, prey size and composition often change as body
size increases (Wainwright & Bellwood 2002; Cole 2010), thus small-bodied
carnivorous fish may in fact represent lower trophic levels than the maximum category
used in these analyses. Second, overall fish biomass on these reefs may be dominated
by widely-distributed fishes pertaining to other trophic categories such as herbivores or
omnivores (e.g. scarids, surgeonfish or grunts; appendix 3) which may reduce the effect
of carnivorous fishes of relatively low abundance on total biomass. Finally, there are
some small-bodied fishes of high trophic level (e.g Hamlet fish; Froese & Pauly 2009),
which also may help to explain the lack of a clear relationship between mean trophic
level and overall biomass.
The cover of Monstastrea corals also appears to positively influence the
abundance of fishes of lower trophic guilds such as omnivores and herbivores. The
omnivorous fishes recorded in this study are commonly recognized as reef-dependent
species that feed on reef benthic flora and fauna (appendix 3; Froese & Pauly 2009),
hence the greater number of refuges for small invertebrates and benthic algae provided
by the massive structures of Montastrea may support a greater number of food items for
these fishes (e.g. Idjadi & Edmunds 2006). The relationship between herbivorous fishes
and Montastrea cover is more complex; the complex structures and ramets of
Montastrea may support greater algal diversity and biomass (Mumby et al. 2005;
Piñón-Gimate & Collado-Vides 2008), and thus be attractive to herbivorous fishes. In
addition, some herbivorous fish such as Scarus viridie and Stegastes planiforms are
common grazers of Montastrea colonies (Rotjan & Lewis 2008; Mumby 2009; Precht et
al. 2010; Rotjan & Dimond 2010) and may therefore be attracted by the live tissue of
these corals.
75
The ongoing decline in reef architectural complexity throughout the Caribbean
may therefore have profound effects on fish communities (Paddack et al. 2009;
Chapters 1 & 2). In particular, our findings suggest that recent declines in the overall
density of fish communities (Paddack et al. 2009) may be in part a consequence of
ongoing declines in the cover of Montastrea in reefs through the entire region (Hughes
& Tanner 2000; Bruckner & Bruckner 2006; Steneck et al. 2009). Our study suggests
that changes in the abundance of Montastrea populations could have significant and
direct detrimental effects on the abundance of small-bodied fish, with subsequent
impacts on the abundance of adult fishes through failures in recruitment and reductions
on the transfer of energy through the food web (Graham et al. 2005; Graham et al.
2007; Wilson et al. 2010). This may result in bottlenecks limiting the flow of energy
and production of fish assemblages and fisheries yields.
Montastrea historically ranked in importance with Acropora palmata and A.
cervicornis in overall contribution to Western Atlantic reef structure (Jackson 1992).
Acroporids have now almost vanished from Caribbean reefs and important functional
attributes have been lost with the demise of these highly complex coral structures. Both
acroporid species are now listed as Critically Endangered by the International Union for
the Conservation of Nature (Bruckner 2003; Aronson & Precht 2006). More recent
declines in the abundance of Montastrea populations and increases in the relative
abundance of stress-resistant coral species are compromising the capacity of reefs to
provide habitat for reef-associated biodiversity even further (Green et al. 2008; Steneck
et al. 2009; Chapters 2 & 4). Our findings indicate that these recent changes in coral
composition on Caribbean reefs may result in a very little ecological space for fish
species to inhabit. The extreme importance of these fish populations in sustaining
millions of livelihoods highlights the urgent need to identifying and implement means
of preserving and improving reef habitat quality throughout the Caribbean.
76
Concluding remarks
Caribbean reef ecosystems have undergone severe changes in the last few decades,
owing to a variety of anthropogenic and natural causes. Previous studies have described
in detail the rapid declines in the cover of reef-building corals, shifts in coral
community composition and increases of macroalgae on Caribbean reefs (Aronson et al.
2002; Gardner et al. 2003; Bruno et al. 2009; Schutte et al. 2010). This thesis has
shown that these ecological changes have resulted in rapid but non-linear declines in
reef architectural complexity during the last four decades (Chapter 1). The massive die-
off of Acropora palmata and A. cervicornis (Elkhorn and Staghorn corals) during the
1970s and 1980s triggered the decline in reef architectural complexity throughout the
region (Aronson & Precht 2006; Schutte et al. 2010; Chapters 1 & 2). Subsequently,
three major issues are likely to have fostered the ongoing degradation of reef
architecture. First, increasing levels of coral stress resulting from climate-induced
bleaching events, coastal development and the loss of ecological resilience (e.g.
herbivory) may have reduced rates of reef accretion (Williams et al. 2001; Pandolfi et
al. 2005; Aronson & Precht 2006; Mora 2008). Second, reductions in live coral cover
may prevent the recovery of reef structure following direct physical impacts and
erosion. In particular, this thesis provides evidence that hurricane impacts and enhanced
bioerosion in perturbed reefs may have played a significant role in the region-wide
declines in architectural complexity in recent decades (Chapter 3). Finally, changes in
the ecological composition of benthic communities towards reefs dominated by stress-
resistant corals that contribute little to reef complexity may have gradually decreased
architectural complexity on many reefs within the Caribbean (Green et al. 2008;
Wilkinson 2008; Steneck et al. 2009; Chapter 2 &4). In Chapters 2 and 4, for example, I
demonstrate that live coral cover does not necessarily reflect reef complexity at local
and regional scales, and that coral species composition and the morph-functional
attributes of dominant corals are important for defining the contribution of coral cover
to reef complexity. The capacity of reef systems to support biodiversity and provide
environmental services to humans is therefore likely to rely more on the presence of key
structure-forming corals than on overall coral cover (Chapter 5).
77
It is important to highlight some inherent problems and necessary caveats of this
thesis. (1) The regional-scale analyses reported in Chapters 1, 2 & 3 use data I collated
from a considerable number of published and unpublished studies reporting reef
architectural complexity and coral cover. Literature searching and data collation for
these analyses was as extensive as possible, but accessing grey literature is problematic,
even though much is available on the internet. A great deal of key information is
unpublished and, in some cases, valuable data are owned by specialists who were not
keen to collaborate in these studies (e.g. CARICOMP), thus not all relevant data could
be included in the analyses. Nonetheless, the relatively high sample size and good
spatial representation of sites suggests that the results are robust and likely to be
representative of the Caribbean region. (2) There is also important variation in the
methods used in the studies included in the analyses. For example, key aspects of
methodologies such as levels of replication and lengths of transects often differ
considerably among studies and among scientists within a study. However, this type of
variation can be considered with the statistical tools that I employed in the thesis (e.g.
meta-analysis; Arnqvist & Wooster 1995), and I therefore controlled for such variation
as much as possible throughout the thesis. (3) Many of the analyses in the thesis use the
rugosity index, which is a descriptor of small-scale reef relief. This is clearly an
important scale for many organisms such as fishes and invertebrates (Luckhurst &
Luckhurst 1978; Idjadi & Edmunds 2006; Chapter 5), but reefs also exhibit larger scales
of architectural complexity that were not considered in these analyses. For example,
geomorphologic differences (e.g. spur and grooves, forereefs) can be very important in
defining larger-scale patterns of diversity and abundance of reef-associated species
(Karlson et al. 2004; Connolly et al. 2005). Therefore the results presented in this thesis
should be considered with reference to the fine scale and could not necessarily be
extrapolated to larger structural scales. However, it is likely that larger scales of
‘complexity’ follow at some degree the patterns depicted at finer scales, as suggested by
the high correlation between fine (reef rugosity) and reefscape (visual estimations,
remote sensing) scales that local studies have reported (Kuffner et al. 2007; Wilson et
al. 2007; Chapter 5).
78
Implications for conservation
Reversing reef degradation is a major challenge for scientists and reef managers
concerned with maintaining reef ecosystems and the security and well-being of
Caribbean coastal communities. Among scientists and managers, it is commonly
accepted that the overall cover or abundance of reef-building corals directly relates to
the ‘state’ or ‘health’ of tropical reefs, and therefore that restoring coral cover is key to
restoring ecosystem functioning and services (Mumby et al. 2007; Selig & Bruno
2010). The presence of healthy coral populations is indeed likely to indicate reefs that
are more resilient to environmental change. For example, healthy coral populations can
indicate reefs that have not shifted to macroalgae-dominated alternate states (Hughes
1994; Nyström et al. 2000; Williams et al. 2001; Bruno et al. 2009). However, this
thesis has shown that changes in coral cover do not always capture changes in reef
architectural complexity (Chapter 2), which is a reef attribute more likely to have direct
ecological, economical and social relevance (Sheppard et al. 2005; Pratchett et al. 2008;
Cinner et al. 2009). To restore the ecosystem services that Caribbean corals provide to
other species, including humans, coral cover and reef architecture may therefore require
different types of management and at different spatial scales. The major threats to reef-
building corals are occurring at regional and global scales; hence international
regulations to reduce the impacts of human activities are probably the most appropriate
scales at which to protect reef corals. By contrast, reef architecture may be more
sensitive to local-scale reef conditions (e.g. rates of erosion and hurricane impacts) and
hence, for the purposes of management, may be relatively independent of changing
coral cover at this scale (Chapters 2 & 3). Halting and reversing rates of reef complexity
loss may therefore depend largely on the protection and enhancement of conditions at
the local reef scale.
Halting rates of architectural complexity loss in the Caribbean will also require a
major emphasis on facilitating the maintenance and endurance of healthy populations of
key structure-forming coral species (Chapters 2 & 4). At local scales, conservation goals
that consider the status of key reef-building coral such as Acropora and Montastrea in
addition to overall changes in benthic cover may therefore be necessary. At larger
temporal and spatial scales, more information on the changes in coral community
79
composition and the status of key coral species is needed. While the rapid loss of
acroporid corals in the 1980s is well described and has resulted in considerable amounts
of effort in designing conservation and restoration plans for populations of these species
(Bruckner 2003), the state of populations of Montastrea corals and other important
reef-building corals in the Caribbean is much less well known. For instance, the
temporal changes in areal cover and population demographics of Montastrea corals has
only been described for a few sites (Edmunds 2002; Bruckner & Bruckner 2006;
Edmunds & Elahi 2007). Future research in the Caribbean should therefore aim to
understand the region-wide trends of change and current status of Montastrea corals,
and to identify changes at the community level across different reefs.
Implications of reef complexity decline
The ecosystem services provided by coral reefs are critical to the biodiversity and social
and economic welfare of millions of people (Moberg & Folke 1999; Cinner et al. 2009),
and there is therefore an urgent need to understand the long-term effects of reef
degradation in the Caribbean and elsewhere. Although collapsing reef structures may
lead to subsequent declines in a wide range of reef-associated species and the loss of
important ecosystem services such as coastal protection (Sheppard et al. 2005; Wilson
et al. 2006), I have focussed mainly on the possible impacts of reef degradation on
associated fish communities. This focus is because (i) fishes contribute to critical
ecosystem functions and support local fisheries and tourism across the developing world
(Bellwood et al. 2003; Newton et al. 2007; Allison et al. 2009; Uyarra et al. 2009); and
(ii) large amounts of existing relevant information, including regional estimates of fish
abundance since the 1950s and international programs that report information for at
least two decades (Paddack et al. 2009; AGRRA and CARICOMP), allow a detailed
description of the consequences of reef flattening for those fish communities.
The only existing region-wide and long-term study of changes in fish
assemblages in the Caribbean indicates that overall fish abundance may have begun to
respond negatively to habitat degradation (Paddack et al. 2009). However, significant
declines in overall fish density are only apparent during the last few years, during a time
characterised by a reduction in rates of coral cover loss and a resumption of
architectural complexity decline in the Caribbean (Paddack et al. 2009; Schutte et al.
80
2010; Chapter 1). Interestingly, significant declines in fish abundance were not apparent
during the rapid declines in architectural complexity and coral cover in the 1970s and
1980s. This raises the question of whether the declines in fish abundance in the late
1990s is the result of a lagged response to the loss of acroporid corals in the late 1970s
and early 1980s (Paddack et al. 2009), or is a threshold effect in response to expanding
and high levels of habitat degradation that Caribbean reefs have experienced in recent
years. In the Caribbean, most fish species do not require specific reef features (as
suggested by their wide distribution throughout the region and across reef types;
Carpenter 2002; Sandin et al. 2008), and it is therefore possible that their populations
could have persisted due to the habitat provided by the remaining coral species, despite
the loss of acroporid corals. By the late1990s, it is possible that, some reefs were too
degraded to provide the minimum structural attributes required by many fish species
and thus only during this time period the effects of habitat degradation on fish
populations become evident. Chapter 5 of this thesis indeed suggests that the decrease
in relative cover of the primary remaining important reef-building corals, Montastrea,
might be one of the drivers of region-wide declines in fish density, as many small-
bodied fish (size classes and species) are strongly associated with the structural
complexity provided by Montastrea corals. In addition, reductions in energy transfer to
higher trophic levels on less structurally-complex reefs may in turn result in reduced
density (or biomass) of predators (Dulvy et al. 2004; Whiteman & Côté 2004; Graham
et al. 2007; Pratchett et al. 2008; Wilson et al. 2010).
There is, however, also the possibility that other ecological dimensions (not
captured by total fish density) of reef fish assemblages may have been affected by the
earlier rapid declines in Caribbean reef complexity. It is possible, for example, that fish
community composition may have changed as consequence of declines in the
abundance of particular fish species that depend on habitat features (e.g. coral branches)
that were lost with the decline in acroporids and increases in abundance of more
generalist species (Chesson 2000). Attaining a better understanding of the large-scale
impacts and consequences of reef degradation for reef-associated fishes would be
helped by integrating information on coral cover, rugosity, algae and fish abundance.
This would allow more direct exploration of the consequences and timing (e.g. lag
effects) of habitat degradation for a range of diversity and trophic dimensions of fish
assemblages, and would allow tests of well-established paradigms such as the role of
the loss of herbivory in increasing the dominance of macroalgae and subsequent phase
81
shifts (Hughes 1994; Nyström et al. 2000; Mumby et al. 2007; Bruno et al. 2009).
Integration of such information may even allow a test of the hypothesis proposed in
Chapter 3 of the role of herbivorous grazers in increasing rates of bioerosion in fisheries
closure areas.
The influence of reef structure and composition (reef architecture, coral cover
and coral identity) on reef-associated species is rarely explored across different spatial
scales and geographical locations (exceptions include Nunez-Lara et al. 2005; Newman
et al. 2006; Semmens et al. 2010). Consequently, the relationship between reef
biodiversity and the structure of coral reefs is poorly understood and the importance of
putative drivers of coral cover and architectural complexity loss in a hierarchy of
different spatial scales needs to be explored, from coral colony scales to whole reef
systems. Identifying the spatial scales at which different drivers of reef degradation
affect different species would improve understanding of the effect of losing different
levels of organization in reef systems, which may be important considerations in reef
management or restoration planning (Acosta & Robertson 2002; Connolly et al. 2005;
MacNeil et al. 2009). Large-scale spatial analyses of this sort would also allow
exploration of the role of the remaining ‘healthy’ reefs as a source of recruits in a matrix
of degraded reefs, and thus in supporting wider biodiversity and ecosystem functioning.
In addition, large-scale spatial analyses of reef structure would also allow exploration of
the possible effects of habitat degradation on taxa that have not been systematically
recorded, such as most reef-associated invertebrates, which are usually diverse groups
with strong relationships to the complexity of reef structure (Idjadi & Edmunds 2006;
Miloslavich et al. 2010)
Future change and the carbonate budget on reefs
The balance between the production (calcification) and loss (biological, physical, and
chemical erosion) of calcium carbonate on a coral reef determines whether or not reef
structures are maintained. Predictions based on experimental and field observations
indicate that the combined effects of rising temperatures and ocean acidification could
increase the frequency of bleaching events and reduce coral calcification drastically
(Hoegh-Guldberg et al. 2007; Kleypas & Yates 2009). If rates of CaCO3 production by
corals and other reef calcifiers cannot keep up with rates of erosion, the majority of
82
coral reefs could switch from net accreting to net eroding structures (Veron et al. 2009).
Increasing our knowledge of how processes such as bioerosion or dissolution of corals
operate in Caribbean reefs is therefore of the utmost importance. An important future
research area would be to model the effects of ocean acidification and increasing sea
temperatures on the carbon budget of Caribbean reefs, as both variables have been
reported to influence coral growth and calcification considerably in other regions of the
world (De'ath et al. 2009; Cantin et al. 2010). The role of bioerosion should also be
explored more thoroughly in future studies. For instance, this thesis suggests that
biological erosion (as result of enhanced abundance of herbivores fish inside MPAs)
might be an important process contributing to the loss of architectural complexity on
Caribbean reefs (Chapter 3). Models designed to explore methods of restoring
architectural complexity on coral reefs may therefore need to include both ‘positive’
(e.g. control of macroalgae abundance) and ‘negative’ (e.g. bioerosion) effects of
herbivores fishes and invertebrates, as well as information on coral cover and
composition on reefs, in order to identify appropriate strategies of intervention and
management.
83
References
Aburto-Oropeza O., Ezcurra E., Danemann G., Valdez V., Murray J. & Sala E. (2008).
Mangroves in the Gulf of California increase fishery yields. Proceedings of the
National Academy of Sciences, 105, 10456-10459. Acosta C.A. & Robertson D.N. (2002). Diversity in coral reef fish communities: the
effects of habitat patchiness revisited. Marine Ecology Progress Series, 227, 87-
96.
Adger W.N., Hughes T.P., Folke C., Carpenter S.R. & Rockstrom J. (2005). Social-
ecological resilience to coastal disasters. Science, 309, 1036-1039.
Allison E.H., Perry A.L., Badjeck M.C., Adger W.N., Brown K., et al. (2009).
Vulnerability of national economies to the impacts of climate change on
fisheries. Fish and Fisheries, 10, 173-196.
Almany G.R. (2003). Priority effects in coral reef fish communities. Ecology, 84, 1920-
1935.
Almany G.R. (2004). Differential effects of habitat complexity, predators and
competitors on abundance of juvenile and adult coral reef fishes. Oecologia,
141, 105-113.
Alvarez-Filip L. & Gil I. (2006). Effects of Hurricanes Emily and Wilma on coral reefs
in Cozumel, Mexico. Coral Reefs, 25, 583-583.
Alvarez-Filip L., Millet-Encalada M. & Reyes-Bonilla H. (2009). Impact of hurricanes
Emily and Wilma on the coral community of Cozumel island, Mexico. Bulletin
of Marine Science, 84, 295-306.
Arnqvist G. & Wooster D. (1995). Meta-analysis: synthesizing research findings in
ecology and evolution. Trends in Ecology & Evolution, 10, 236-240.
Aronson R.B. & Precht W.F. (2001). White-band disease and the changing face of
Caribbean coral reefs. Hydrobiologia, 460, 25-38.
Aronson R.B. & Precht W.F. (2006). Conservation, precaution, and Caribbean reefs.
Coral Reefs, 25, 441-450.
Aronson R.B., Macintyre I.G., Precht W.F., Murdoch T.J.T. & Wapnick C.M. (2002).
The expanding scale of species turnover events on coral reefs in Belize.
Ecological Monographs, 72, 233-249.
84
Baker A.C., Glynn P.W. & Riegl B. (2008). Climate change and coral reef bleaching:
An ecological assessment of long-term impacts, recovery trends and future
outlook. Estuarine, Coastal and Shelf Science, 80, 435-471.
Balmford A. & Bond W. (2005). Trends in the state of nature and their implications for
human well-being. Ecology Letters, 8, 1218-1234.
Balmford A., Green R.E. & Jenkins M. (2003). Measuring the changing state of nature.
Trends in Ecology & Evolution, 18, 326-330.
Barker N.H.L. & Roberts C.M. (2004). Scuba diver behaviour and the management of
diving impacts on coral reefs. Biological Conservation, 120, 481-489.
Barnes C., Maxwell D., Reuman D.C. & Jennings S. (2010). Global patterns in
predator–prey size relationships reveal size dependency of trophic transfer
efficiency. Ecology, 91, 222-232.
Barnett J. & Adger W. (2003). Climate dangers and atoll countries. Climatic Change,
61, 321-337.
Bazzaz F.A. (1975). Plant Species Diversity in Old-Field Successional Ecosystems in
Southern Illinois. Ecology, 56, 485-488.
Bell J.D. & Galzin R. (1984). Influence of live coral cover on a coral reef fish
communities. Marine Ecology Progress Series, 15, 265-274.
Bell S.S., McCoy E.D. & Mushinsky H.R. (1991). Habitat Structure the physical
arrangement of objects in space. Chapman & Hall, London.
Bellwood D.R., Hoey A. & Choat H. (2003). Limited functional redundancy in high
diversity systems: resilience and ecosystem function on coral reefs. Ecology
Letters, 6, 281-285.
Bellwood D.R., Hughes T.P., Folke C. & Nystrom M. (2004). Confronting the coral
reef crisis. Nature, 429, 827-833.
Benjamini Y. & Hochberg Y. (1995). Controlling the false discovery rate - a practical
and powerful approach to multiple testing. Journal of the Royal Statistical
Society Series B-Methodological, 57, 289-300.
Beukers J.S. & Jones G.P. (1997). Habitat complexity modifies the impact of piscivores
on a coral reef fish population. Oecologia, 114, 50-59.
Brauman K.A., Daily G.C., Duarte T.K. & Mooney H.A. (2007). The nature and value
of ecosystem services: An overview highlighting hydrologic services. Annual
Review of Environment and Resources, 32, 67-98.
Briggs J.C. (2005). Coral reefs: Conserving the evolutionary sources. Biological
Conservation, 126, 297-305.
85
Bruckner A.W. & Bruckner R.J. (2006). The recent decline of Montastraea annularis
(complex) coral populations in western Curaçao: a cause for concern? Revista de
Biologia Tropical, 54, 45-58.
Bruckner A.W. (2003). Proceedings of the Caribbean Acropora Workshop--Potential
Application of the US Endangered Species Act as a Conservation Strategy. US
Dept. of Commerce, National Oceanic and Atmospheric Administration,
National Marine Fisheries Service.
Bruggemann J.H., van Kessel A.M., van Rooij J.M. & Breeman A.M. (1996).
Bioerosion and sediment ingestion by the Caribbean parrotfish Scarusvetula and
Sparisomaviride: implications of fish size, feeding mode and habitat use. Marine
Ecology Progress Series, 134, 59-71.
Bruno J.F. & Bertness M.D. (2001). Habitat modification and facilitation in benthic
marine communities. In: Marine community ecology (eds. Bertness MD, Gaines
SD & Hay ME). Sinauer Sunderland MA, pp. 201-218.
Bruno J.F. & Selig E.Z. (2007). Regional decline of coral cover in the Indo-Pacific:
Timing, extent, and subregional comparisons. PLoS ONE, 2, e711.
Bruno J.F., Selig E.R., Casey K.S., Page C.A., Willis B.L., et al. (2007). Thermal Stress
and Coral Cover as Drivers of Coral Disease Outbreaks. PLoS Biology, 5, e124.
Bruno J.F., Sweatman H., Precht W.F., Selig E.R. & Schutte V.G.W. (2009). Assessing
evidence of phase shifts from coral to macroalgal dominance on coral reefs.
Ecology, 90, 1478-1484.
Bryant D., Burke L., McManus J. & Spaulding M. (1998). Reefs at Risk: A Map-Based
Indicator of Threats to the World's Coral Reefs. World Resources Institute,
Washington, D.C.
Burnham K.P. & Anderson D.R. (2002). Model selection and multimodel inference: a
practical information-theoretic approach. Springer-Verlag, New York.
Butchart S.H.M., Walpole M., Collen B., van Strien A., Scharlemann J.P.W., et al.
(2010). Global Biodiversity: Indicators of Recent Declines. Science, 328, 1164-
1168.
Cade B.S. & Noon B.R. (2003). A gentle introduction to quantile regression for
ecologists. Frontiers in Ecology and the Environment, 1, 412-420.
Caley M.J. & John J.S. (1996). Refuge Availability Structures Assemblages of Tropical
Reef Fishes. Journal of Animal Ecology, 65, 414-428.
86
Cantin N.E., Cohen A.L., Karnauskas K.B., Tarrant A.M. & McCorkle D.C. (2010).
Ocean Warming Slows Coral Growth in the Central Red Sea. Science, 329, 322-
325.
Carilli J.E., Norris R.D., Black B., Walsh S.M. & McField M. (2010). Century-scale
records of coral growth rates indicate that local stressors reduce coral thermal
tolerance threshold. Global Change Biology, 16, 1247-1257.
Carilli J.E., Norris R.D., Black B.A., Walsh S.M. & McField M. (2009). Local Stressors
Reduce Coral Resilience to Bleaching. PLoS ONE, 4, e6324.
Carpenter K.E. (2002). The living marine resources of the Western Central Atlantic.
FAO, Rome.
Carpenter K.E., Abrar M., Aeby G., Aronson R.B., Banks S., et al. (2008). One-Third
of Reef-Building Corals Face Elevated Extinction Risk from Climate Change
and Local Impacts. Science, 321, 560-563.
Carpenter R.C. (1988). Mass mortality of a Caribbean sea urchin: Immediate effects on
community metabolism and other herbivores. Proceedings of the National
Academy of Sciences of the United States of America, 85, 511-514.
Caselle J.E. & Warner R.R. (1996). Variability in recruitment of coral reef fishes: The
importance of habitat at two spatial scales. Ecology, 77, 2488-2504.
Chabanet P., Ralambondrainy H., Amanieu M., Faure G. & Galzin R. (1997).
Relationships between coral reef substrata and fish. Coral Reefs, 16, 93-102.
Chesson P. (2000). Mechanisms of maintenance of species diversity Annual Review of
Ecology and Systematics, 31, 343-366.
Chevan A. & Sutherland M. (1991). Hierarchical Partitioning. American Statistician,
45, 90-96.
Cho L.L. & Woodley J.D. (2000). Recovery of reefs at Discovery Bay, Jamaica and the
role of Diadema antillarum. In: 9th International Coral Reef Symposium (ed.
Moosa MK) Bali, Indonesia, pp. 331-338.
Cinner J.E., McClanahan T.R., Daw T.M., Graham N.A.J., Maina J., et al. (2009).
Linking Social and Ecological Systems to Sustain Coral Reef Fisheries. Current
Biology, 19, 206-212.
Clarke K.R. & Warwick R.M. (1998). A taxonomic distinctness index and its statical
properties. Journal of Applied Ecology, 35, 523-531.
Clarke K.R. & Warwick R.M. (2001). A further biodiversity index applicable to species
lists: variation in taxonomic distinctness. Marine Ecology-Progress Series, 216,
265-278.
87
Claudet J., Osenberg C.W., Benedetti L., Domenici P., Garcia-Charton J.A., et al.
(2008). Marine reserves: size and age do matter. Ecology Letters, 11, 481-489.
Coelho V.R. & Manfrino C. (2007). Coral community decline at a remote Caribhean
island: Marine no-take reserves are not enough. Aquatic Conservation-Marine
and Freshwater Ecosystems, 17, 666-685.
Cole A.J. (2010). Cleaning to corallivory: ontogenetic shifts in feeding ecology of
tubelip wrasse. Coral Reefs, 29, 125-129.
Connell J.H. (1978). Diversity in tropical rain forest and coral reefs. Science, 199, 1302-
1310.
Connell J.H. (1997). Disturbance and recovery of coral assemblages. Coral Reefs, 16,
S101-S113.
Connolly S.R., Hughes T.P., Bellwood D.R. & Karlson R.H. (2005). Community
Structure of Corals and Reef Fishes at Multiple Scales. Science, 309, 1363-1365.
Costanza R., d'Arge R., de Groot R., Farber S., Grasso M., et al. (1997). The value of
the world's ecosystem services and natural capital. Nature, 387, 253-260.
Costanza R., Perez-Maqueo O., Martinez M.L., Sutton P., Anderson S.J. & Mulder K.
(2008). The value of coastal wetlands for hurricane protection. Ambio, 37, 241-
248.
Costello M.J., Coll M., Danovaro R., Halpin P., Ojaveer H. & Miloslavich P. (2010). A
Census of Marine Biodiversity Knowledge, Resources, and Future Challenges.
PLoS ONE, 5, e12110.
Côté I.M., Gardner T.A., Gill J.A., Hutchinso D.J. & Watkinson A.R. (2006). New
approaches to estimating recent ecological changes on coral reefs. In: Coral Reef
Conservation (eds. Côté IM & Reynolds DJ). Cambridge University Press
Cambridge UK, pp. 293-313.
Côté I.M., Gill J.A., Gardner T.A. & Watkinson A.R. (2005). Measuring coral reef
decline meta-analyses. Philosophical Transactions of the Royal Society, 360,
385-395.
Côté I.M., Mosqueira I. & Reynolds J.D. (2001). Effects of marine reserve
characteristics on the protection of fish populations: a meta-analysis. Journal of
Fish Biology, 59, 178-189.
Crain C.M., Kroeker K. & Halpern B.S. (2008). Interactive and cumulative effects of
multiple human stressors in marine systems. Ecology Letters, 11, 1304-1315.
88
Daan N., Gislason H., G. Pope J. & C. Rice J. (2005). Changes in the North Sea fish
community: evidence of indirect effects of fishing? ICES Journal of Marine
Sciences, 62, 177-188.
Darling E.S. & Côté I.M. (2008). Quantifying the evidence for ecological synergies.
Ecology Letters, 11, 1278-1286.
Darling E.S., McClanahan T. & Côté I.M. (2010). Combined effects of two stressors on
Kenyan coral reefs are additive or antagonistic, not synergistic. Conservation
Letters, 3, 122-130.
De'ath G., Lough J.M. & Fabricius K.E. (2009). Declining Coral Calcification on the
Great Barrier Reef. Science, 323, 116-119.
Denney N.H., Jennings S. & Reynolds J.D. (2002). Life-history correlates of maximum
population growth rates in marine fishes. Proceedings of the Royal Society of
London Series B-Biological Sciences, 269, 2229-2237.
Diaz M.C. & Rutzler K. (2001). Sponge: an essential component of Caribbean coral
reefs. Bulletin of Marine Science, 69, 535-546.
Donner S.D. (2009). Coping with Commitment: Projected Thermal Stress on Coral
Reefs under Different Future Scenarios. PLoS ONE, 4, e5712.
Dullo W.C. (2005). Coral growth and reef growth: a brief review. Facies, 51, 37-52.
Dulvy N.K., Mitchell R.E., Watson D., Sweeting C.J. & Polunin N.V.C. (2002). Scale-
dependant control of motile epifaunal community structure along a coral reef
fishing gradient. Journal of Experimental Marine Biology and Ecology, 280,
137-139.
Dulvy N.K., Polunin N.V.C., Mill A.C. & Graham N.A.J. (2004). Size structural change
in lightly exploited coral reef fish communities: evidence for weak indirect
effects. Canadian Journal of Fisheries and Aquatic Sciences, 61, 466-475.
Dulvy N.K., Sadovy Y. & Reynolds J.D. (2003). Extinction vulnerability in marine
populations. Fish and Fisheries, 4, 25-64.
Eakin C.M. (1996). Where have all the carbonates gone? A model comparison of
calcium carbonate budgets before and after the 1982-1983 El Nino at Uva Island
in the eastern Pacific. Coral Reefs, 15, 109-119.
Eakin C.M., Morgan J.A., Heron S.F., Smith T.B., Alvarez-Filip L., et al. (in press).
Caribbean corals in crisis: record thermal stress, bleaching, and mortality in
2005. PLoS ONE.
Edmunds P.J. & Carpenter R.C. (2001). Recovery of Diadema antillarum reduces
macroalgal cover and increases abundance of juvenile corals on a Caribbean
89
reef. Proceedings of the National Academy of Sciences of the United States of
America, 98, 5067-5071.
Edmunds P.J. & Elahi R. (2007). The demographics of a 15-year decline in cover of the
Caribbean reef coral Montastraea annularis. Ecological Monographs, 77, 3-18.
Edmunds P.J. (2002). Long-term dynamics of coral reefs in St. John, US Virgin Islands.
Coral Reefs, 21, 357-367.
Ellison A.M., Bank M.S., Clinton B.D., Colburn E.A., Elliott K., et al. (2005). Loss of
foundation species: consequences for the structure and dynamics of forested
ecosystems. Frontiers in Ecology and the Environment, 3, 479-486.
Fabricius K., De'ath G., McCook L., Turak E. & Williams D. (2005). Changes in algal,
coral and fish assemblages along water quality gradients on the inshore Great
Barrier Reef. Marine Pollution Bulletin, 51, 384-398.
Fernando H.J.S., Samarawickrama S.P., Balasubramanian S., Hettiarachchi S.S.L. &
Voropayev S. (2008). Effects of porous barriers such as coral reefs on coastal
wave propagation. Journal of Hydro-environment Research, 1, 187-194.
Froese R. & Binohlan C. (2000). Empirical relationships to estimate asymptotic length,
length at first maturity and length at maximum yield per recruit in fishes, with a
simple method to evaluate length frequency data. Journal of Fish Biology, 56,
758-773.
Froese R. & Pauly D. (2009). FishBase. In. www.fishbase.org.
Gardner T.A., Côté I.M., Gill J.A., Grant A. & Watkinson A.R. (2003). Long-term
region-wide declines in caribbean corals. Science, 301, 958-960.
Gardner T.A., Côté I.M., Gill J.A., Grant A. & Watkinson A.R. (2005). Hurricanes and
Caribbean coral reefs: Impacts, recovery patterns, and role in long-term decline.
Ecology, 85, 174-184.
Gaston K.J., Jackson S.E., Cantu-Salazar L. & Cruz-Pinon G. (2008). The Ecological
Performance of Protected Areas. Annual Review of Ecology Evolution and
Systematics, 39, 93-113.
Gill J.A., Watkinson A.R., McWilliams J.P. & Côté I.M. (2006). Opposing forces of
aerosol cooling and El Nino drive coral bleaching on Caribbean reefs.
Proceedings of the National Academy of Sciences of the United States of
America, 103, 18870-18873.
Glynn P.W. (1997). Bioerosion and coral reef growth: a dynamic balance. In: Life and
death of coral reefs (ed. Birkeland CE). Chapman & Hall New York, pp. 68-95.

90
Goodwin N.B., Grant A., Perry A.L., Dulvy N.K. & Reynolds J.D. (2006). Life history
correlates of density-dependent recruitment in marine fishes. Canadian Journal
of Fisheries and Aquatic Sciences, 63, 494-509.
Goreau T.F. (1959). The ecology of Jamaican coral reefs .1. Species composition and
zonation. Ecology, 40, 67-90.
Gourlay M.R. & Colleter G. (2005). Wave-generated flow on coral reefs--an analysis
for two-dimensional horizontal reef-tops with steep faces. Coastal Engineering,
52, 353-387.
Graham N.A.J., Dulvy N.K., Jennings S. & Polunin N.V.C. (2005). Size-spectra as
indicators of the effects of fishing on coral reef fish assemblages. Coral Reefs,
24, 118-124.
Graham N.A.J., McClanahan T.R., MacNeil M.A., Wilson S.K., Polunin N.V.C., et al.
(2008). Climate Warming, Marine Protected Areas and the Ocean-Scale
Integrity of Coral Reef Ecosystems. PLoS ONE, 3, e3039.
Graham N.A.J., Wilson S.K., Jennings S., Polunin N.V.C., Bijoux J.P. & Robinson J.
(2006). Dynamic fragility of oceanic coral reef ecosystems. Proceedings of the
National Academy of Sciences of the United States of America, 103, 8425-8429.
Graham N.A.J., Wilson S.K., Jennings S., Polunin N.V.C., Robinson J., et al. (2007).
Lag effects in the impacts of mass coral bleaching on coral reef fish, fisheries,
and ecosystems. Conservation Biology, 21, 1291-1300.
Gratwicke B. & Speight M.R. (2005). Effects of habitat complexity on Caribbean
marine fish assemblages. Marine Ecology-Progress Series, 292, 301-310.
Gratwicke B., Petrovic C. & Speight M.R. (2006). Fish distribution and ontogenetic
habitat preferences in non-estuarine lagoons and adjacent reefs. Environmental
Biology of Fishes, 76, 191-210.
Green D.H., Edmunds P.J. & Carpenter R.C. (2008). Increasing relative abundance of
Porites astreoides on Caribbean reefs mediated by an overall decline in coral
cover. Marine Ecology Progress Series, 359, 1-10.
Green E.P. & Bruckner A.W. (2000). The significance of coral disease epizootiology
for coral reef conservation. Biological Conservation, 96, 347-361.
Halford A., Cheal A.J., Ryan D. & Williams D.M. (2004). Resilience to large-scale
disturbance in coral and fish assemblages on the Great Barrier Reef. Ecology,
85, 1892-1905.
Halpern B.S. (2003). The impact of marine reserves: Do reserves work and does reserve
size matter? Ecological Applications, 13, S117-S137.
91
Halpern B.S., Selkoe K.A., Micheli F. & Kappel C.V. (2007). Evaluating and ranking
the vulnerability of global marine ecosystems to anthropogenic threats.
Conservation Biology, 21, 1301-1315.
Halpern B.S., Walbridge S., Selkoe K.A., Kappel C.V., Micheli F., et al. (2008). A
global map of human impact on marine ecosystems. Science, 319, 948-952.
Harborne A.R. (2009). First among equals: why some habitats should be considered
more important than others during marine reserve planning. Environmental
Conservation, 36, 87-90.
Harborne A.R., Mumby P.J., Kappel C.V., Dahlgren C.P., Micheli F., et al. (2008).
Tropical coastal habitats as surrogates of fish community structure, grazing, and
fisheries value. Ecological Applications, 18, 1689-1701.
Harvell C.D., Mitchell C.E., Ward J.R., Altizer S., Dobson A.P., et al. (2002). Ecology -
Climate warming and disease risks for terrestrial and marine biota. Science, 296,
2158-2162.
Hatcher B.G. (1997). Coral reef ecosystems: how much greater is the whole than the
sum of the parts? Coral Reefs, 16, S77-S91.
Hixon M.A. & Beets J.P. (1993). Predation, prey refuges, and the structure of coral-reef
fish assemblages. Ecological Monographs, 63, 77-101.
Hoegh-Guldberg O. (1999). Climate change, coral bleaching and the future of the
world's coral reefs. Marine and Freshwater Research, 50, 839-866.
Hoegh-Guldberg O., Mumby P.J., Hooten A.J., Steneck R.S., Greenfield P., et al.
(2007). Coral Reefs Under Rapid Climate Change and Ocean Acidification.
Science, 318, 1737-1742.
Hoekstra J.M., Boucher T.M., Ricketts T.H. & Roberts C. (2005). Confronting a biome
crisis: global disparities of habitat loss and protection. Ecology Letters, 8, 23-29.
Holbrook S.J. & Schmitt R.J. (1988). Effects of predation risk on foraging behavior:
mechanisms altering patch choice. Journal of Experimental Marine Biology and
Ecology, 121, 151-163.
Hooper D.U., Chapin F.S., Ewel J.J., Hector A., Inchausti P., et al. (2005). Effects of
biodiversity on ecosystem functioning: A consensus of current knowledge.
Ecological Monographs, 75, 3-35.
Hopkinson C.S., Lugo A.E., Alber M., Covich A.P. & Van Bloem S.J. (2008).
Forecasting effects of sea-level rise and windstorms on coastal and inland
ecosystems. Frontiers in Ecology and the Environment, 6, 255-263.
92
Hughes T.E. (2009). Confronting the global decline of coral reefs. In: Global loss of
coastal habitats. Rates, causes and consequences (ed. Duarte CM). BBVA
Foundation Madrid, pp. 140-166.
Hughes T.P. & Connell J.H. (1999). Multiple stressors on coral reefs: A long-term
perspective. Limnology and Oceanography, 44, 932-940.
Hughes T.P. & Tanner J.E. (2000). Recruitment failure, life histories, and long-term
decline of Caribbean corals. Ecology, 81, 2250-2263.
Hughes T.P. (1994). Catastrophes, phase shifts, and large-scale degradation of a
Caribbean coral reef. Science, 256, 1547-1551.
Hughes T.P., Baird A.H., Bellwood D.R., Card M., Connolly S., et al. (2003). Climate
change, human impacts, and the resilience of coral reefs. Science, 301, 929-933.
Hutchings P.A. (1986). Biological destruction of coral reefs - a review. Coral Reefs, 4,
239-252.
Idjadi J. & Edmunds P. (2006). Scleractinian corals as facilitators for other invertebrates
on a Caribbean reef. Marine Ecology Progress Series, 319, 117-127.
Idjadi J.A., Lee S.C., Bruno J.F., Precht W.F., Allen-Requa L. & Edmunds P.J. (2006).
Rapid phase-shift reversal on a Jamaican coral reef. Coral Reefs, 25, 209-211.
Jackson J.B.C. (1992). Pleistocene perspectives on coral-reef community structure.
American Zoologist, 32, 719-731.
Jackson J.B.C., Kirby M.X., Berger W.H., Bjorndal K.A., Botsford L.W., et al. (2001).
Historical overfishing and the recent collapse of coastal ecosystems. Science,
293, 629-638.
Jennings S. & Dulvy N.K. (2005). Reference points and reference directions for size-
based indicators of community structure. ICES Journal of Marine Science, 62,
397-404.
Jennings S. (2005). Size-based analyses of aquatic food webs In: Aquatic food webs, an
ecosystem approach (eds. Belgrano A, Scharler UM, Dunne JA & Ulanowicz
RE). Oxford University Press Oxford, UK, pp. 86-98.
Jennings S., Melin F., Blanchard J.L., Forster R.M., Dulvy N.K. & Wilson R.W. (2008).
Global-scale predictions of community and ecosystem properties from simple
ecological theory. Proceedings of the Royal Society B-Biological Sciences, 275,
1375-1383.
Jennings S., Reynolds J.D. & Polunin N.V.C. (1999). Predicting the vulnerability of
tropical reef fishes to exploitation with phylogenies and life histories.
Conservation Biology, 13, 1466-1475.
93
Jetz W., Carbone C., Fulford J. & Brown J.H. (2004). The Scaling of Animal Space
Use. Science, 306, 266-268.
Johnson D.W. (2007). Habitat complexity modifies post-settlement mortality and
recruitment dynamics of a marine fish. Ecology, 88, 1716-1725.
Johnson K.G., Jackson J.B.C. & Budd A.F. (2008). Caribbean reef development was
independent of coral diversity over 28 Million Years. science, 319, 1521-1523.
Jones G.P. & Syms C. (1998). Disturbance, habitat structure and the ecology of fishes
on coral reefs. Austral Ecology, 23, 287-297.
Jones G.P. (1991). Postrecruitment processes in the ecology of coral reef fish
populations: a multifactorial perspective. In: The ecology of fishes on coral reefs
(ed. Sale P). Academic Press New York, pp. 294-328.
Jordán-Dahlgren E. (1988). Arrecifes profundos en la Isla de Cozumel, México. Anales
del Instituto de Ciencias del Mar y Limnología, UNAM., 15, 195-208.
Karlson R.H., Cornell H.V. & Hughes T.P. (2004). Coral communities are regionally
enriched along an oceanic biodiversity gradient. Nature, 867-870.
Kerr S.R. & Dickie L.M. (2001). The biomass spectrum: a predator–prey theory of
aquatic production. Columbia University Press, New York, USA.
Kleypas J.A. & Yates K.K. (2009). Coral Reefs and Ocean Acidification.
Oceanography, 22, 108-117.
Kleypas J.A., Buddemeier R.W., Archer D., Gattuso J., Langdon C. & Opdyke B.N.
(1999). Geochemical Consequences of Increased Atmospheric Carbon Dioxide
on Coral Reefs. Science, 284, 118-120.
Knight C.A. & Ackerly D.D. (2002). Variation in nuclear DNA content across
environmental gradients: a quantile regression analysis. Ecology Letters, 5, 66-
76.
Knowlton N. & Jackson J.B.C. (2008). Shifting Baselines, Local Impacts, and Global
Change on Coral Reefs. PLoS Biology, 6, e54.
Koch E.W., Barbier E.B., Silliman B.R., Reed D.J., Perillo G.M.E., et al. (2009). Non-
linearity in ecosystem services: temporal and spatial variability in coastal
protection. Frontiers in Ecology and the Environment, 7, 29-37.
Koenker R. & Bassett Jr G. (1978). Regression quantiles. Econometrica: Journal of the
Econometric Society, 46, 33-50.
Kramer D.L. & Chapman M.R. (1999). Implications of fish home range size and
relocation for marine reserve function. Environmental Biology of Fishes, 55, 65-
79.
94
Kuffner I.B., Brock J.C., Grober-Dunsmore R., Bonito V.E., Hickey T.D. & Wright
C.W. (2007). Relationships between reef fish communities and remotely sensed
rugosity measurements in Biscayne National Park, Florida, USA. Environmental
Biology of Fishes, 78, 71-82.
Kunkel C.M., Hallberg R.W. & Oppenheimer M. (2006). Coral reefs reduce tsunami
impact in model simulations. Geophysical Research Letters, 33.
Lee S.C. (2006). Habitat complexity and consumer-mediated positive feedbacks on a
Caribbean coral reef. Oikos, 112, 442-447.
Levin S.A. (1992). The Problem of Pattern and Scale in Ecology. Ecology, 73, 1943-
1967.
Lirman D. & Manzello D. (2009). Patterns of resistance and resilience of the stress-
tolerant coral Siderastrea radians (Pallas) to sub-optimal salinity and sediment
burial. Journal of Experimental Marine Biology and Ecology, 369, 72-77.
Loreau M., Naeem S., Inchausti P., Bengtsson J., Grime J.P., et al. (2001). Biodiversity
and ecosystem functioning: current knowledge and future challenges. Science,
294, 804-808.
Loya Y. (1972). Community structure and species diversity of hermatypic corals at
Eilat, Red Sea. Marine Biology, 13, 100-&.
Luckhurst B.E. & Luckhurst K. (1978). Analysis of the influence of substrate variables
on coral reef communities. Marine Biology, 49, 317-323.
Lugo-Fernandez A., Roberts H.H. & Suhayda J.N. (1998). Wave transformations across
a Caribbean fringing-barrier Coral Reef. Continental Shelf Research, 18, 1099-
1124.
Maass J.M., Balvanera P., Castillo A., Daily G.C., Mooney H.A., et al. (2005).
Ecosystem services of tropical dry forests: Insights from long-term ecological
and social research on the Pacific Coast of Mexico. Ecology and Society, 10, 23.
Mac Nally R. (2000). Regression and model-building in conservation biology,
biogeography and ecology: The distinction between and reconciliation of
'predictive' and 'explanatory' models. Biodiversity and Conservation, 9, 655-671.
Mac Nally R. (2002). Multiple regression and inference in ecology and conservation
biology: further comments on identifying important predictor variables.
Biodiversity and Conservation, 11, 1397-1401.
MacArthur R.H. & MacArthur J.W. (1961). On Bird Species Diversity. Ecology, 42,
594-598.
95
MacArthur R.H. (1984). Geographical Ecology, patterns in the distribution of species.
Princeton University Press, New Jersey.
MacNeil M.A., Graham N.A.J., Polunin N.V.C., Kulbicki M., Galzin R., et al. (2009).
Hierarchical drivers of reef-fish metacommunity structure. Ecology, 90, 252-
264.
Magurran A.E. (2004). Measuring biological diversity. Blackwell Publishing, Oxford.
Mallela J. & Perry C.T. (2007). Calcium carbonate budgets for two coral reefs affected
by different terrestrial runoff regimes, Rio Bueno, Jamaica. Coral Reefs, 26,
129-145.
Mantel N. (1967). The Detection of Disease Clustering and a Generalized Regression
Approach. Cancer Research, 27, 209-220.
McClanahan T.R. (1994). Kenyan coral-reef lagoon fish - effects of fishing, substrate
complexity, and sea-urchins. Coral Reefs, 13, 231-241.
McClanahan T.R. (1999). Predation and the control of the sea urchin Echinometra
viridis and fleshy algae in the patch reefs of Glovers Reef, Belize. Ecosystems, 2,
511-523.
McCormick M.I. (1998). Ontogeny of diet shifts by a microcarnivorous fish,
Cheilodactylus spectabilis: relationship between feeding mechanics,
microhabitat selection and growth. Marine Biology, 132, 9-20.
McManus J.W. (1997). Tropical marine fisheries and the future of coral reefs: a brief
review with emphasis on Southeast Asia. Coral Reefs, 16, S121-S127.
McWilliams J.P., Côté I.M., Gill J.A., Sutherland W.J. & Watkinson A.R. (2005).
Accelerating impacts of temperature-induced coral bleaching in the Caribbean.
Ecology, 86, 2055-2060.
Miloslavich P., Diaz J.M., Klein E., Alvarado J.J., Diaz C., et al. (2010). Marine
Biodiversity in the Caribbean: Regional Estimates and Distribution Patterns.
PLoS ONE, 5, e11916.
Moberg F. & Folke C. (1999). Ecological goods and services of coral reef ecosystems.
Ecological Economics, 29, 215-233.
Molloy P.P., McLean I.B. & Côté I.M. (2009). Effects of marine reserve age on fish
populations: a global meta-analysis. Journal of Applied Ecology, 743-751.
Molloy P.P., Reynolds J.D., Gage M.J.G., Mosqueirac L. & Côté I.M. (2008). Links
between sex change and fish densities in marine protected areas. Biological
Conservation, 141, 187-197.
96
Mora C. (2008). A clear human footprint in the coral reefs of the Caribbean.
Proceedings of the Royal Society B-Biological Sciences, 275, 767-773.
Mosqueira I., Côté I.M., Jennings S. & Reynolds J.D. (2000). Conservation benefits of
marine reserves for fish populations. Animal Conservation, 3, 321-332.
Muckelbauer G. (1990). The shelf of Cozumel, Mexico: Topography and organisms.
Facies, 23, 185-200.
Muggeo V., M. R. (2003). Estimating regression models with unknown break-points.
Statistics in Medicine, 22, 3055-3071.
Mumby P.J. & Harborne A.R. (2010). Marine Reserves Enhance the Recovery of Corals
on Caribbean Reefs. PLoS ONE, 5, e8657.
Mumby P.J. & Steneck R.S. (2008). Coral reef management and conservation in light of
rapidly evolving ecological paradigms. Trends in Ecology & Evolution, 23, 555-
563.
Mumby P.J. (2006). The impact of exploiting grazers (scaridae) on the dynamics of
Caribbean coral reefs. Ecological Applications, 16, 747-769.
Mumby P.J. (2009). Herbivory versus corallivory: are parrotfish good or bad for
Caribbean coral reefs? Coral Reefs, 28, 683-690.
Mumby P.J., Dahlgren C.P., Harborne A.R., Kappel C.V., Micheli F., et al. (2006).
Fishing, Trophic Cascades, and the Process of Grazing on Coral Reefs. Science,
311, 98-101.
Mumby P.J., Edwards A.J., Arias-González E., Lindeman K.C., Blackwell P.G., et al.
(2004). Mangrove enhance the biomass of coral reef fish communities in the
Caribbean. Nature, 427, 533-536.
Mumby P.J., Foster N.L. & Fahy E.A.G. (2005). Patch dynamics of coral reef
macroalgae under chronic and acute disturbance. Coral Reefs, 24, 681-692.
Mumby P.J., Harborne A.R., Williams J., Kappel C.V., Brumbaugh D.R., et al. (2007).
Trophic cascade facilitates coral recruitment in a marine reserve. Proceedings of
the National Academy of Sciences, 104, 8362-8367.
Mumby P.J., Hastings A. & Edwards H.J. (2007). Thresholds and the resilience of
Caribbean coral reefs. Nature, 450, 98-101.
Nagelkerken I., Roberts C.M., Velde G.v.d., Dorenbosch M., Riel M.C.v., et al. (2002).
How important are mangroves and seagrass beds for coral-reef fish? The nursery
hypothesis tested on an island scale. Marine Ecology Progress Series, 244, 299-
305.
97
Newman M.J.H., Paredes G.A., Sala E. & Jackson J.B.C. (2006). Structure of
Caribbean coral reef communities across a large gradient of fish biomass.
Ecology Letters, 9, 1216-1227.
Newton K., Côté I.M., Pilling G.M., Jennings S. & Dulvy N.K. (2007). Current and
Future Sustainability of Island Coral Reef Fisheries. Current Biology, 17, 655-
658.
Nunez-Lara E., Arias-Gonzalez J.E. & Legendre P. (2005). Spatial patterns of Yucatan
reef fish communities: Testing models using a multi-scale survey design.
Journal of Experimental Marine Biology and Ecology, 324, 157-169.
Nyström M., Folke C. & Moberg F. (2000). Coral reef disturbance and resilience in a
human-dominated environment. Trends in Ecology and Evolution, 15, 413-417.
Owens I.P.F. & Bennett P.M. (2000). Ecological basis of extinction risk in birds:
Habitat loss versus human persecution and introduced predators. Proceedings of
the National Academy of Sciences of the United States of America, 97, 12144-
12148.
Paddack M.J., Reynolds J.D., Aguilar C., Appeldoorn R.S., Beets J., et al. (2009).
Recent Region-wide Declines in Caribbean Reef Fish Abundance. Current
Biology, 19, 590-595.
Pandolfi J.M., Bradbury R.H., Sala E., Hughes T.P., Bjorndal K.A., et al. (2003).
Global Trajectories of the Long-Term Decline of Coral Reef Ecosystems.
Science, 301, 955-958.
Pandolfi J.M., Jackson J.B.C., Baron N., Bradbury R.H., Guzman H.M., et al. (2005).
Are U.S. coral reefs on the slippery slope to slime? Science, 307, 1725-1726.
Perry A.L. (2008). Regional-scale impacts of climate change on coral reefs and fishing-
dependent countries. In: School of Biological Sciences. University of East
Anglia Norwich, p. 156.
Pimm S.L., Russell G.J., Gittleman J.L. & Brooks T.M. (1995). The Future of
Biodiversity. Science, 269, 347-350.
Piñón-Gimate A. & Collado-Vides L. (2008). Macroalgal distribution in a Mexican
Caribbean Reef. In: Proceedings 11th International Coral Reef Symposium Ft.
Lauderdale, Florida, pp. 678-682.
Pittock A.B. (1999). Coral reefs and environmental change: Adaptation to what?
American Zoologist, 39, 10-29.
Pratchett M.S., Munday P.L., Wilson S.K., Graham N.A.J., Cinner J.E., et al. (2008).
Effects of climate-induced coral bleaching on coral-reef-fishes ecological and
98
economic consequences. Oceanography and Marine Biology: An annual
Review, 46, 251-296.
Precht W.F. & Aronson R.B. (2006). Death and resurrection of Caribbean coral reefs: a
paleoecological perspective. In: Coral Reef Conservation (eds. Côté IM &
Reynolds DJ). Cambridge University Press Cambridge UK, pp. 40-77.
Precht W.F., Aronson R.B., Moody R.M. & Kaufman L. (2010). Changing Patterns of
Microhabitat Utilization by the Threespot Damselfish, Stegastes planifrons, on
Caribbean Reefs. PLoS ONE, 5, e10835.
Purvis A. & Hector A. (2000). Getting the measure of biodiversity. Nature, 405, 212-
219.
R (2009). R: A language and environment for statistical computing. In: R Foundation
for Statistical Computing Vienna, Austria.
Reaka-Kudla M. (2001). Known and unknown biodiversity, risk of extinction and
conservation strategy in the sea. In: Waters in peril (eds. Bendell-Young L &
Gallaugher P). Kluwer Norwell, Massachusetts, pp. 19-33.
Reyes-Bonilla H. (2004). Biogeography and diversity of reef corals of the Eastern
Pacific and Western Atlantic. In. University of Miami Miami, p. 467.
Risk M.J. (1972). Fish diversity on a coral reef in the Virgin Islands. Atoll Research
Bulletin, 193, 1-6.
Roberts C.M. (1995). Effects of Fishing on the Ecosystem Structure of Coral Reefs.
Conservation Biology, 9, 988-995.
Rockstrom J., Steffen W., Noone K., Persson A., Chapin F.S., et al. (2009). A safe
operating space for humanity. Nature, 461, 472-475.
Rogers C.S. (1993). Hurricanes and coral reefs: The intermediate disturbance
hypothesis revisited. Coral Reefs, 12, 127-137.
Rogers C.S., Suchanek T.H. & Pecora F.A. (1982). Effects of Hurricanes David and
Frederic (1979) on Shallow Acropora palmata Reef Communities - St-Croix,
United-States Virgin-Islands. Bulletin of Marine Science, 32, 532-548.
Rooker J.R. (1995). Feeding ecology of the schoolmaster snapper, Lutjanus apodus
(Walbaum), from Southwestern Puerto Rico. Bulletin of Marine Science, 56,
881-894.
Rosenberg E. & Loya Y. (2004). Coral health and disease. Springer, Berlin.
Rosenberg M.S., Adams D.C. & Gurevitch J. (2000). MetaWin: Statistical software for
meta-analysis, Version 2.0. Sinauer Associates, Sunderland MA.
99
Rotjan R.D. & Dimond J.L. (2010). Discriminating causes from consequences of
persistent parrotfish corallivory. Journal of Experimental Marine Biology and
Ecology, In Press, Corrected Proof.
Rotjan R.D. & Lewis S.M. (2008). Impact of coral predators on tropical reefs. Marine
Ecology-Progress Series, 367, 73-91.
Sala O.E., Chapin III F.S., Armesto J.J., Berlow E., Bloomfield J., et al. (2000). Global
biodiversity scenarios for the year 2100. Science, 287, 1770-1774.
Sale P.F., Cowen R.K., Danilowicz B.S., Jones G.P., Kritzer J.P., et al. (2005). Critical
science gaps impede use of no-take fishery reserves. Trends in Ecology &
Evolution, 20, 74-80.
Sandin S.A., Vermeij M.J.A. & Hurlbert A.H. (2008). Island biogeography of
Caribbean coral reef fish. Global Ecology and Biogeography, 17, 770-777.
Saphier A.D. & Hoffmann T.C. (2005). Forecasting models to quantify three
anthropogenic stresses on coral reefs from marine recreation: Anchor damage,
diver contact and copper emission from antifouling paint. Marine Pollution
Bulletin, 51, 590-598.
Saunders M.A. & Lea A.S. (2008). Large contribution of sea surface warming to recent
increase in Atlantic hurricane activity. Nature, 451, 557-560.
Schmitt R.J. & Holbrook S.J. (1999). Settlement and recruitment of three damselfish
species: larval delivery and competition for shelter space. Oecologia, 118, 76-
86.
Schutte V.G.W., Selig E.R. & Bruno J.F. (2010). Regional spatio-temporal trends in
Caribbean coral reef benthic communities. Marine Ecology Progress Series,
402, 115-122.
Selig E.R. & Bruno J.F. (2010). A Global Analysis of the Effectiveness of Marine
Protected Areas in Preventing Coral Loss. PLoS ONE, 5, e9278.
Selig E.R., Casey K.S. & Bruno J.F. (2010). New insights into global patterns of ocean
temperature anomalies: implications for coral reef health and management.
Global Ecology and Biogeography, 19, 397-411.
Semmens B.X., Auster P.J. & Paddack M.J. (2010). Using Ecological Null Models to
Assess the Potential for Marine Protected Area Networks to Protect Biodiversity.
PLoS ONE, 5, e8895.
Sheppard C. & Rioja-Nieto R. (2005). Sea surface temperature 1871-2099 in 38 cells in
the Caribbean region. Marine Environmental Research, 60, 389-396.
100
Sheppard C., Dixon D.J., Gourlay M., Sheppard A. & Payet R. (2005). Coral mortality
increases wave energy reaching shores protected by reef flats: Examples from
the Seychelles. Estuarine Coastal and Shelf Science, 64, 223-234.
Sheppard C., Dixon D.J., Gourlay M., Sheppard A. & Payet R. (2005). Coral mortality
increases wave energy reaching shores protected by reef flats: Examples from
the Seychelles. Estuarine Coastal and Shelf Science, 64, 223-234.
Sheppard C.R.C., Spalding M., Bradshaw C. & Wilson S. (2002). Erosion vs. recovery
of coral reefs after 1998 El nino: Chagos reefs, Indian Ocean. Ambio, 31, 40-48.
Shin Y.J., Rochet M.J., Jennings S., Field J.G. & Gislason H. (2005). Using size-based
indicators to evaluate the ecosystem effects of fishing. Ices Journal of Marine
Science, 62, 384-396.
Spalding M., Ravilious C. & Green E.P. (2001). World Atlas of Coral Reefs. University
of California Press, Berkeley.
Steneck R.S., Graham M.H., Bourque B.J., Corbett D., Erlandson J.M., et al. (2002).
Kelp forest ecosystems: biodiversity, stability, resilience and future.
Environmental Conservation, 29, 436-459.
Steneck R.S., Paris C.B., Arnold S.N., Ablan-Lagman M.C., Alcala A.C., et al. (2009).
Thinking and managing outside the box: coalescing connectivity networks to
build region-wide resilience in coral reef ecosystems. Coral Reefs, 28, 367-378.
Szmant A. (2002). Nutrient enrichment on coral reefs: Is it a major cause of coral reef
decline? Estuaries and Coasts, 25, 743-766.
Szmant A.M. (1997). Nutrient effects on coral reefs: a hypothesis on the importance of
topographic and trophic complexity to reef nutrient dynamics. In: 8th
International Coral Reef Symposium, pp. 1527-1532.
Temple S.A. & Cary J.R. (1988). Modeling Dynamics of Habitat-Interior Bird
Populations in Fragmented Landscapes. Conservation Biology, 2, 340-347.
Tews J., Brose U., Grimm V., Tielborger K., Wichmann M.C., et al. (2004). Animal
species diversity driven by habitat heterogeneity/diversity: the importance of
keystone structures. Journal of Biogeography, 31, 79-92.
Tilman D., Fargione J., Wolff B., D'Antonio C., Dobson A., et al. (2001). Forecasting
Agriculturally Driven Global Environmental Change. Science, 292, 281-284.
Tolimieri N. (1995). Effects of microhabitat characteristics on the settlement and
recruitment of a coral-reef fish at two spatial scales. Oecologia, 102, 52-63.
101
Trenkel V.M. & Rochet M.J. (2003). Performance of indicators derived from abundance
estimates for detecting the impact of fishing on a fish community. Canadian
Journal of Fisheries and Aquatic Sciences, 60, 67-85.
Uyarra M., Watkinson A. & Côté I.M. (2009). Managing Dive Tourism for the
Sustainable Use of Coral Reefs: Validating Diver Perceptions of Attractive Site
Features. Environmental Management, 43, 1-16.
Venables W.N. & Ripley B.D. (2002). Modern and applied statistics. Springer-Verlag,
New York.
Veron J. & Stafford-Smith M. (2002). Coral ID An electronic key to the zooxanthellate
scleratinian corals of the world. In. Australian Institute of Marine Science and
CRR Qld Pty Ltd Townsville, Australia.
Veron J.E.N. (2008). Mass extinctions and ocean acidification: biological constraints on
geological dilemmas. Coral Reefs, 27, 459-472.
Veron J.E.N., Hoegh-Guldberg O., Lenton T.M., Lough J.M., Obura D.O., et al. (2009).
The coral reef crisis: The critical importance of < 350 ppm CO2. Marine
Pollution Bulletin, 58, 1428-1436.
Veron J.E.N., Hoegh-Guldberg O., Lenton T.M., Lough J.M., Obura D.O., et al. (2009).
The coral reef crisis: The critical importance of < 350 ppm CO2. Marine
Pollution Bulletin, 58, 1428-1436.
Vitousek P.M., Mooney H., Lubchenco J. & Melillo J.M. (1997). Human domination of
earth's ecosystems. Science, 277, 494-499.
Wainwright P.C. & Bellwood D.R. (2002). Ecomorphology of feeding in coral reef
fishes. In: Coral reef fishes: Dynamics and diversity in a complex ecosystem (ed.
Sale PF). Academic Press San Diego, pp. 33-55.
Ward-Paige C., Mills Flemming J. & Lotze H.K. (2010). Overestimating Fish Counts
by Non-Instantaneous Visual Censuses: Consequences for Population and
Community Descriptions. PLoS ONE, 5, e11722.
Webster P.J., Holland G.J., Curry J.A. & Chang H.R. (2005). Changes in tropical
cyclone number, duration, and intensity in a warming environment. Science,
309, 1844-1846.
Whiteman E.A. & Côté I.M. (2004). Individual differences in microhabitat use in a
Caribbean cleaning goby: a buffer effect in a marine species? Journal of Animal
Ecology, 73, 831-840.
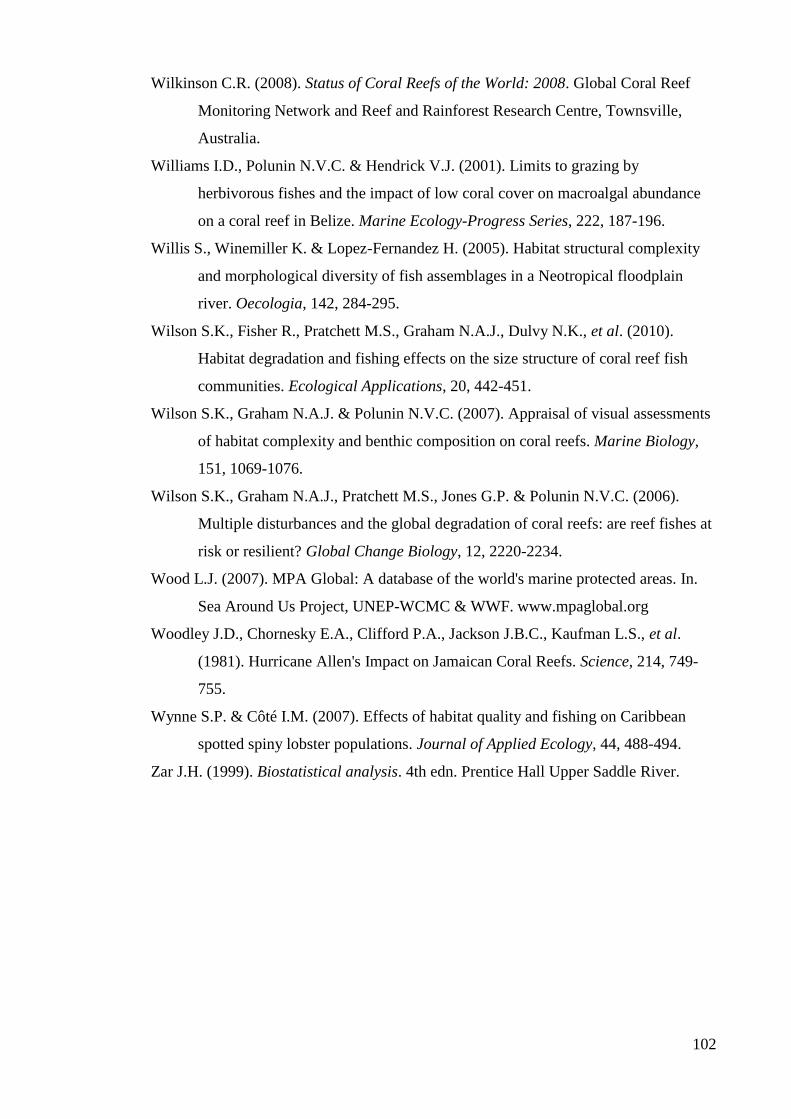
102
Wilkinson C.R. (2008). Status of Coral Reefs of the World: 2008. Global Coral Reef
Monitoring Network and Reef and Rainforest Research Centre, Townsville,
Australia.
Williams I.D., Polunin N.V.C. & Hendrick V.J. (2001). Limits to grazing by
herbivorous fishes and the impact of low coral cover on macroalgal abundance
on a coral reef in Belize. Marine Ecology-Progress Series, 222, 187-196.
Willis S., Winemiller K. & Lopez-Fernandez H. (2005). Habitat structural complexity
and morphological diversity of fish assemblages in a Neotropical floodplain
river. Oecologia, 142, 284-295.
Wilson S.K., Fisher R., Pratchett M.S., Graham N.A.J., Dulvy N.K., et al. (2010).
Habitat degradation and fishing effects on the size structure of coral reef fish
communities. Ecological Applications, 20, 442-451.
Wilson S.K., Graham N.A.J. & Polunin N.V.C. (2007). Appraisal of visual assessments
of habitat complexity and benthic composition on coral reefs. Marine Biology,
151, 1069-1076.
Wilson S.K., Graham N.A.J., Pratchett M.S., Jones G.P. & Polunin N.V.C. (2006).
Multiple disturbances and the global degradation of coral reefs: are reef fishes at
risk or resilient? Global Change Biology, 12, 2220-2234.
Wood L.J. (2007). MPA Global: A database of the world's marine protected areas. In.
Sea Around Us Project, UNEP-WCMC & WWF. www.mpaglobal.org
Woodley J.D., Chornesky E.A., Clifford P.A., Jackson J.B.C., Kaufman L.S., et al.
(1981). Hurricane Allen's Impact on Jamaican Coral Reefs. Science, 214, 749-
755.
Wynne S.P. & Côté I.M. (2007). Effects of habitat quality and fishing on Caribbean
spotted spiny lobster populations. Journal of Applied Ecology, 44, 488-494.
Zar J.H. (1999). Biostatistical analysis. 4th edn. Prentice Hall Upper Saddle River.
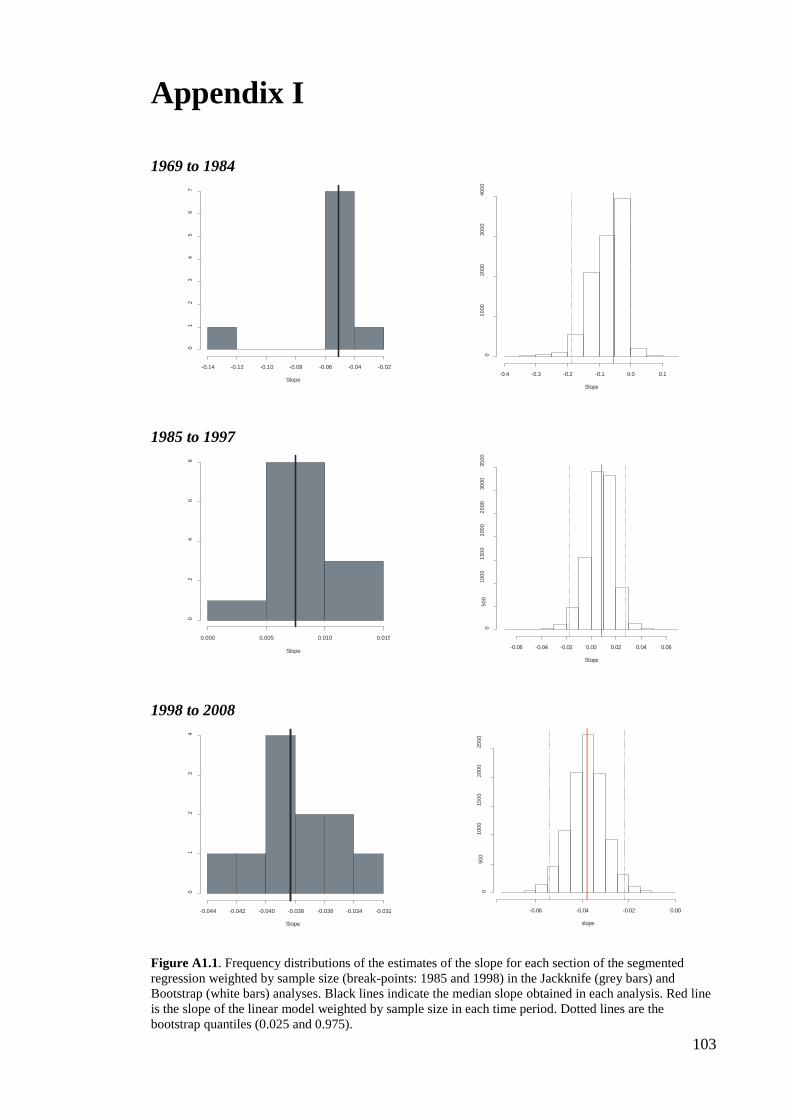
103
Appendix I
1969 to 1984
1985 to 1997
1998 to 2008
Figure A1.1. Frequency distributions of the estimates of the slope for each section of the segmented
regression weighted by sample size (break-points: 1985 and 1998) in the Jackknife (grey bars) and
Bootstrap (white bars) analyses. Black lines indicate the median slope obtained in each analysis. Red line
is the slope of the linear model weighted by sample size in each time period. Dotted lines are the
bootstrap quantiles (0.025 and 0.975).
Slope
-0.14 -0.12 -0.10 -0.08 -0.06 -0.04 -0.02
01
23
45
67
Slope
-0.4 -0.3 -0.2 -0.1 0.0 0.1
01
000
20
00
30
00
40
00
Slope
0.000 0.005 0.010 0.015
02
46
8
Slope
-0.06 -0.04 -0.02 0.00 0.02 0.04 0.06
05
00
10
00
150
02
00
02
500
30
00
35
00
Slope
-0.044 -0.042 -0.040 -0.038 -0.036 -0.034 -0.032
01
23
4
slope
-0.06 -0.04 -0.02 0.00
050
01
00
015
00
200
025
00
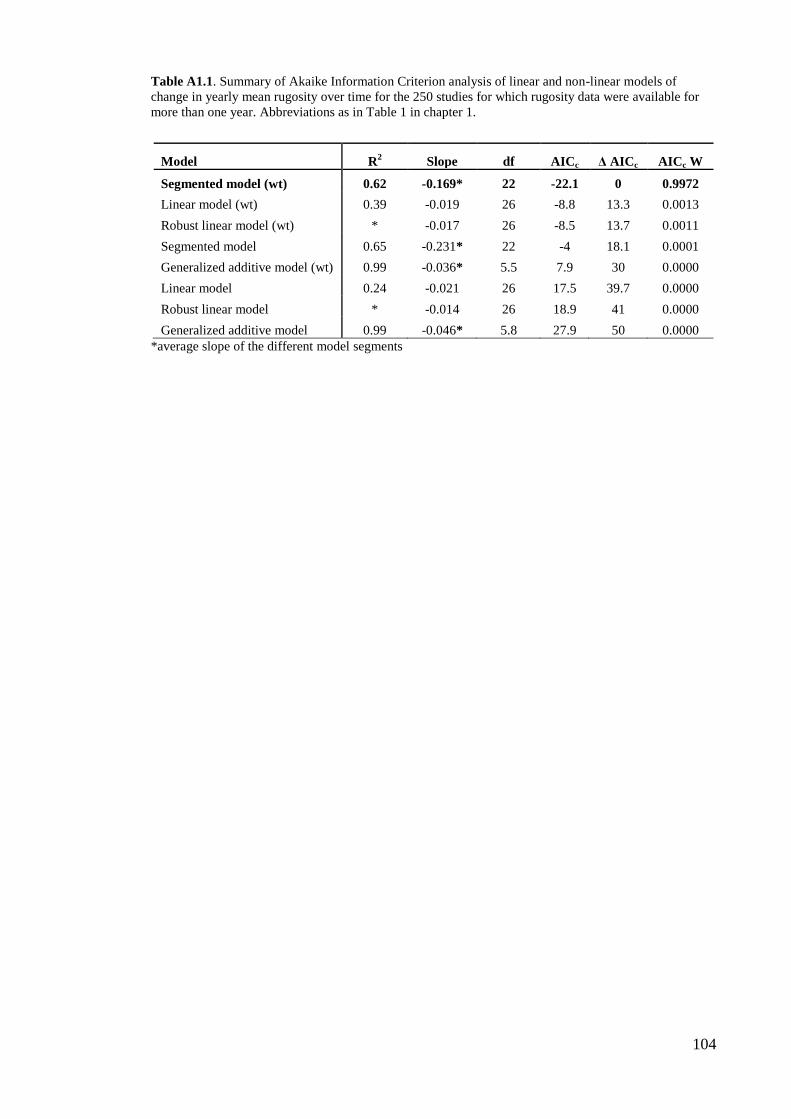
104
Table A1.1. Summary of Akaike Information Criterion analysis of linear and non-linear models of
change in yearly mean rugosity over time for the 250 studies for which rugosity data were available for
more than one year. Abbreviations as in Table 1 in chapter 1.
Model R2 Slope df AICc Δ AICc AICc W
Segmented model (wt) 0.62 -0.169* 22 -22.1 0 0.9972
Linear model (wt) 0.39 -0.019 26 -8.8 13.3 0.0013
Robust linear model (wt) * -0.017 26 -8.5 13.7 0.0011
Segmented model 0.65 -0.231* 22 -4 18.1 0.0001
Generalized additive model (wt) 0.99 -0.036* 5.5 7.9 30 0.0000
Linear model 0.24 -0.021 26 17.5 39.7 0.0000
Robust linear model * -0.014 26 18.9 41 0.0000
Generalized additive model 0.99 -0.046* 5.8 27.9 50 0.0000
*average slope of the different model segments
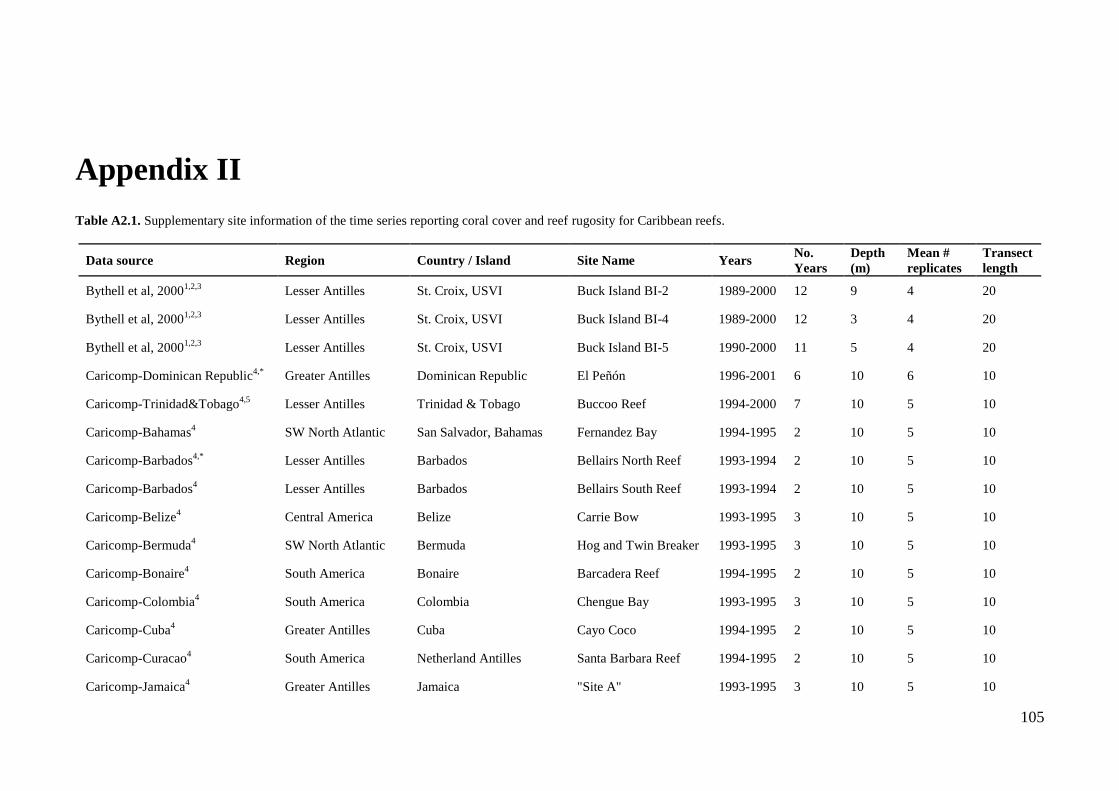
105
Appendix II
Table A2.1. Supplementary site information of the time series reporting coral cover and reef rugosity for Caribbean reefs.
Data source Region Country / Island Site Name Years No.
Years
Depth
(m)
Mean #
replicates
Transect
length
Bythell et al, 20001,2,3
Lesser Antilles St. Croix, USVI Buck Island BI-2 1989-2000 12 9 4 20
Bythell et al, 20001,2,3
Lesser Antilles St. Croix, USVI Buck Island BI-4 1989-2000 12 3 4 20
Bythell et al, 20001,2,3
Lesser Antilles St. Croix, USVI Buck Island BI-5 1990-2000 11 5 4 20
Caricomp-Dominican Republic4,*
Greater Antilles Dominican Republic El Peñón 1996-2001 6 10 6 10
Caricomp-Trinidad&Tobago4,5
Lesser Antilles Trinidad & Tobago Buccoo Reef 1994-2000 7 10 5 10
Caricomp-Bahamas4 SW North Atlantic San Salvador, Bahamas Fernandez Bay 1994-1995 2 10 5 10
Caricomp-Barbados4,*
Lesser Antilles Barbados Bellairs North Reef 1993-1994 2 10 5 10
Caricomp-Barbados4 Lesser Antilles Barbados Bellairs South Reef 1993-1994 2 10 5 10
Caricomp-Belize4 Central America Belize Carrie Bow 1993-1995 3 10 5 10
Caricomp-Bermuda4 SW North Atlantic Bermuda Hog and Twin Breaker 1993-1995 3 10 5 10
Caricomp-Bonaire4 South America Bonaire Barcadera Reef 1994-1995 2 10 5 10
Caricomp-Colombia4 South America Colombia Chengue Bay 1993-1995 3 10 5 10
Caricomp-Cuba4 Greater Antilles Cuba Cayo Coco 1994-1995 2 10 5 10
Caricomp-Curacao4 South America Netherland Antilles Santa Barbara Reef 1994-1995 2 10 5 10
Caricomp-Jamaica4 Greater Antilles Jamaica "Site A" 1993-1995 3 10 5 10
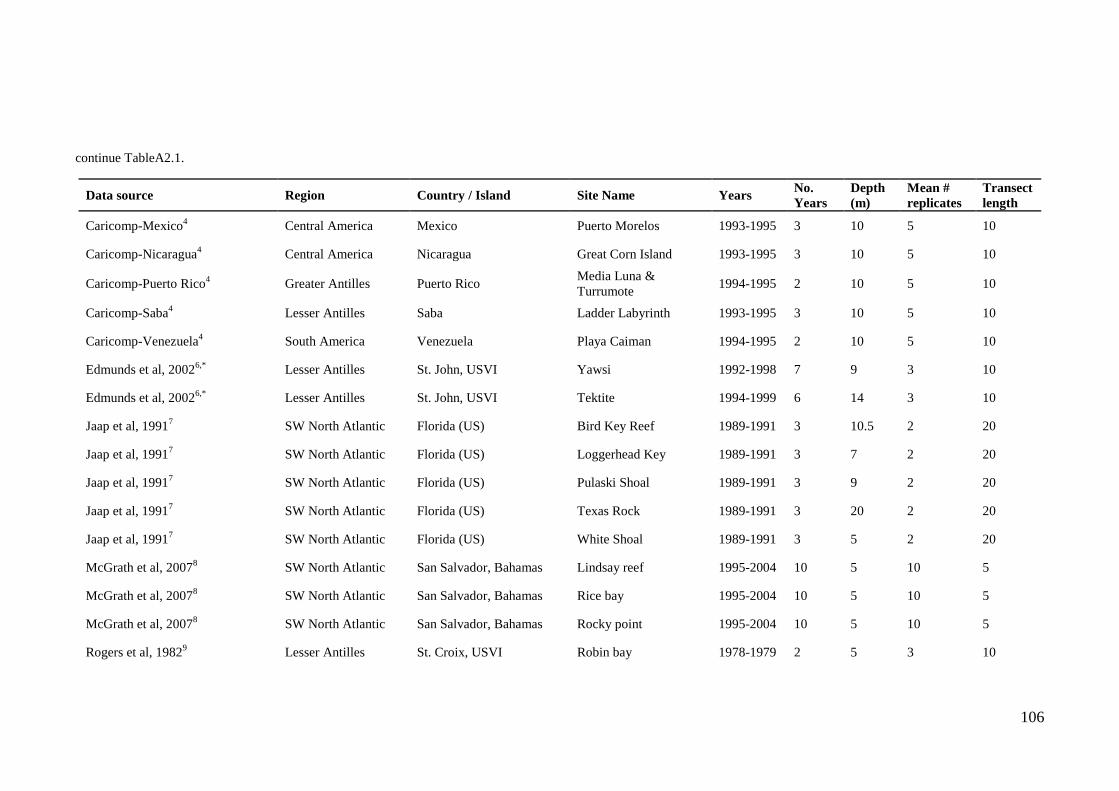
106
continue TableA2.1.
Data source Region Country / Island Site Name Years No.
Years
Depth
(m)
Mean #
replicates
Transect
length
Caricomp-Mexico4 Central America Mexico Puerto Morelos 1993-1995 3 10 5 10
Caricomp-Nicaragua4 Central America Nicaragua Great Corn Island 1993-1995 3 10 5 10
Caricomp-Puerto Rico4 Greater Antilles Puerto Rico
Media Luna &
Turrumote 1994-1995 2 10 5 10
Caricomp-Saba4 Lesser Antilles Saba Ladder Labyrinth 1993-1995 3 10 5 10
Caricomp-Venezuela4 South America Venezuela Playa Caiman 1994-1995 2 10 5 10
Edmunds et al, 20026,*
Lesser Antilles St. John, USVI Yawsi 1992-1998 7 9 3 10
Edmunds et al, 20026,*
Lesser Antilles St. John, USVI Tektite 1994-1999 6 14 3 10
Jaap et al, 19917 SW North Atlantic Florida (US) Bird Key Reef 1989-1991 3 10.5 2 20
Jaap et al, 19917 SW North Atlantic Florida (US) Loggerhead Key 1989-1991 3 7 2 20
Jaap et al, 19917 SW North Atlantic Florida (US) Pulaski Shoal 1989-1991 3 9 2 20
Jaap et al, 19917 SW North Atlantic Florida (US) Texas Rock 1989-1991 3 20 2 20
Jaap et al, 19917 SW North Atlantic Florida (US) White Shoal 1989-1991 3 5 2 20
McGrath et al, 20078 SW North Atlantic San Salvador, Bahamas Lindsay reef 1995-2004 10 5 10 5
McGrath et al, 20078 SW North Atlantic San Salvador, Bahamas Rice bay 1995-2004 10 5 10 5
McGrath et al, 20078 SW North Atlantic San Salvador, Bahamas Rocky point 1995-2004 10 5 10 5
Rogers et al, 19829 Lesser Antilles St. Croix, USVI Robin bay 1978-1979 2 5 3 10
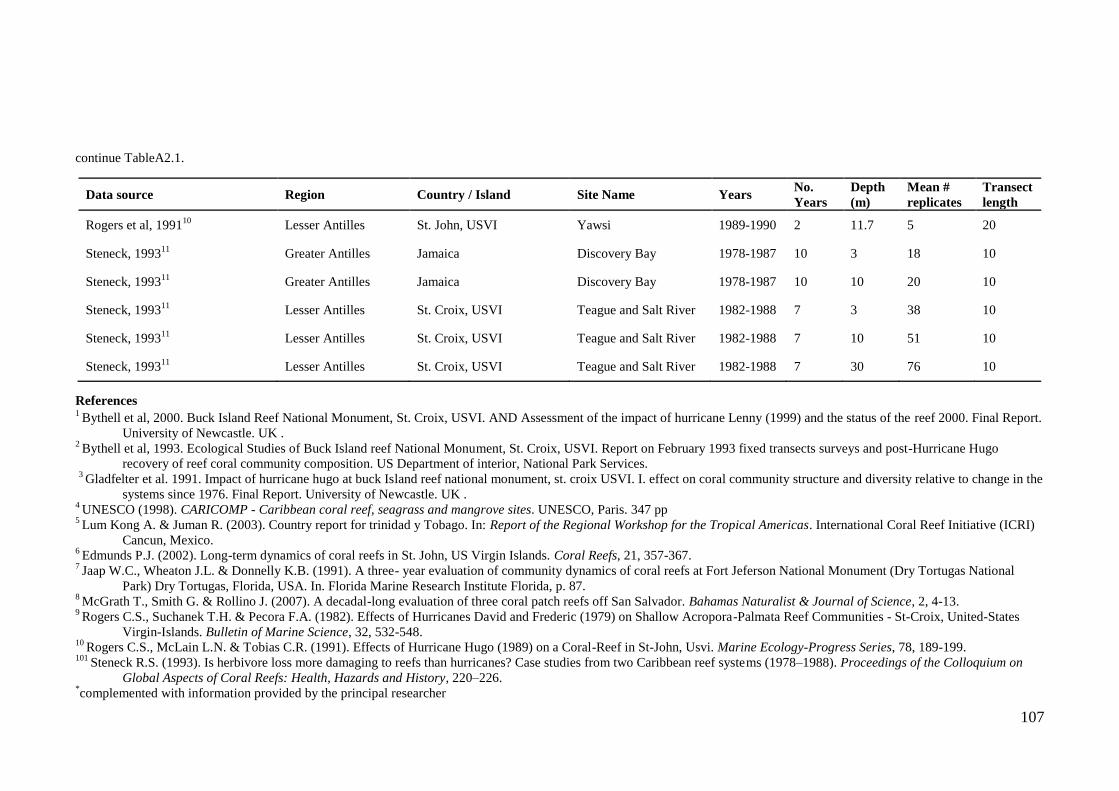
107
continue TableA2.1.
Data source Region Country / Island Site Name Years No.
Years
Depth
(m)
Mean #
replicates
Transect
length
Rogers et al, 199110
Lesser Antilles St. John, USVI Yawsi 1989-1990 2 11.7 5 20
Steneck, 199311
Greater Antilles Jamaica Discovery Bay 1978-1987 10 3 18 10
Steneck, 199311
Greater Antilles Jamaica Discovery Bay 1978-1987 10 10 20 10
Steneck, 199311
Lesser Antilles St. Croix, USVI Teague and Salt River 1982-1988 7 3 38 10
Steneck, 199311
Lesser Antilles St. Croix, USVI Teague and Salt River 1982-1988 7 10 51 10
Steneck, 199311
Lesser Antilles St. Croix, USVI Teague and Salt River 1982-1988 7 30 76 10
References 1 Bythell et al, 2000. Buck Island Reef National Monument, St. Croix, USVI. AND Assessment of the impact of hurricane Lenny (1999) and the status of the reef 2000. Final Report.
University of Newcastle. UK . 2 Bythell et al, 1993. Ecological Studies of Buck Island reef National Monument, St. Croix, USVI. Report on February 1993 fixed transects surveys and post-Hurricane Hugo
recovery of reef coral community composition. US Department of interior, National Park Services.
3 Gladfelter et al. 1991. Impact of hurricane hugo at buck Island reef national monument, st. croix USVI. I. effect on coral community structure and diversity relative to change in the
systems since 1976. Final Report. University of Newcastle. UK . 4 UNESCO (1998). CARICOMP - Caribbean coral reef, seagrass and mangrove sites. UNESCO, Paris. 347 pp
5 Lum Kong A. & Juman R. (2003). Country report for trinidad y Tobago. In: Report of the Regional Workshop for the Tropical Americas. International Coral Reef Initiative (ICRI)
Cancun, Mexico. 6 Edmunds P.J. (2002). Long-term dynamics of coral reefs in St. John, US Virgin Islands. Coral Reefs, 21, 357-367.
7 Jaap W.C., Wheaton J.L. & Donnelly K.B. (1991). A three- year evaluation of community dynamics of coral reefs at Fort Jeferson National Monument (Dry Tortugas National
Park) Dry Tortugas, Florida, USA. In. Florida Marine Research Institute Florida, p. 87. 8 McGrath T., Smith G. & Rollino J. (2007). A decadal-long evaluation of three coral patch reefs off San Salvador. Bahamas Naturalist & Journal of Science, 2, 4-13.
9 Rogers C.S., Suchanek T.H. & Pecora F.A. (1982). Effects of Hurricanes David and Frederic (1979) on Shallow Acropora-Palmata Reef Communities - St-Croix, United-States
Virgin-Islands. Bulletin of Marine Science, 32, 532-548. 10
Rogers C.S., McLain L.N. & Tobias C.R. (1991). Effects of Hurricane Hugo (1989) on a Coral-Reef in St-John, Usvi. Marine Ecology-Progress Series, 78, 189-199. 101
Steneck R.S. (1993). Is herbivore loss more damaging to reefs than hurricanes? Case studies from two Caribbean reef systems (1978–1988). Proceedings of the Colloquium on
Global Aspects of Coral Reefs: Health, Hazards and History, 220–226. *complemented with information provided by the principal researcher
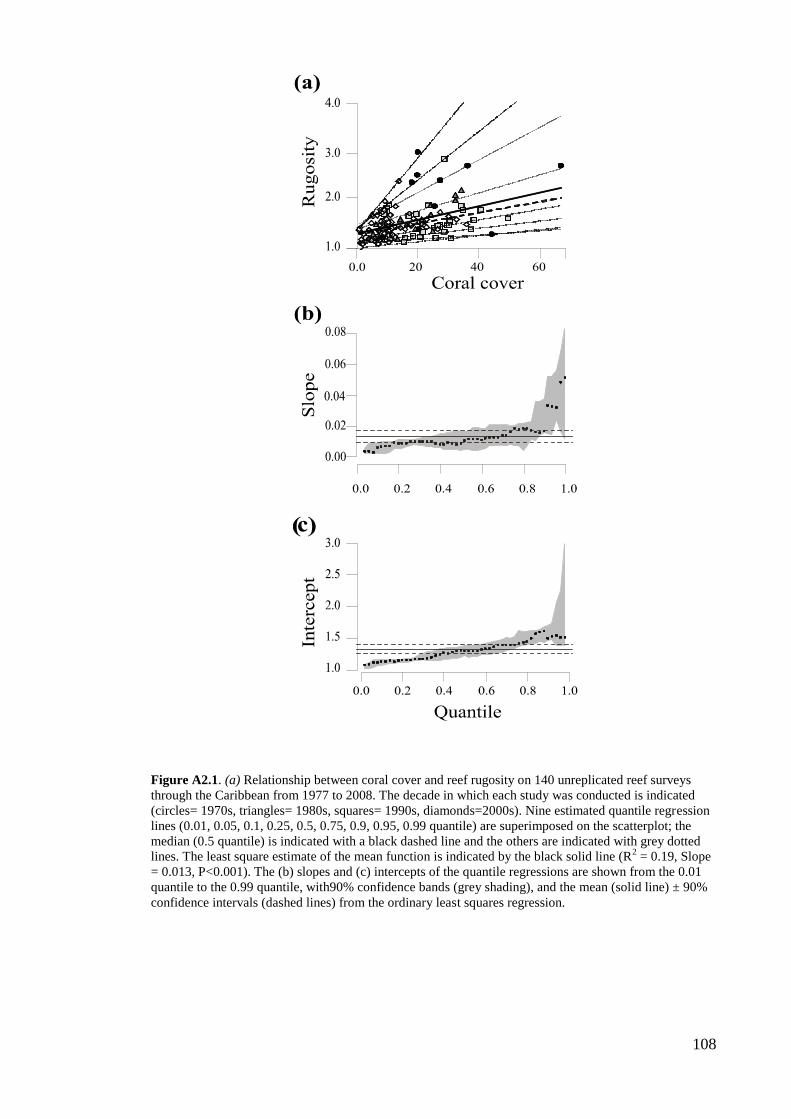
108
Figure A2.1. (a) Relationship between coral cover and reef rugosity on 140 unreplicated reef surveys
through the Caribbean from 1977 to 2008. The decade in which each study was conducted is indicated
(circles= 1970s, triangles= 1980s, squares= 1990s, diamonds=2000s). Nine estimated quantile regression
lines (0.01, 0.05, 0.1, 0.25, 0.5, 0.75, 0.9, 0.95, 0.99 quantile) are superimposed on the scatterplot; the
median (0.5 quantile) is indicated with a black dashed line and the others are indicated with grey dotted
lines. The least square estimate of the mean function is indicated by the black solid line (R2 = 0.19, Slope
= 0.013, P<0.001). The (b) slopes and (c) intercepts of the quantile regressions are shown from the 0.01
quantile to the 0.99 quantile, with90% confidence bands (grey shading), and the mean (solid line) ± 90%
confidence intervals (dashed lines) from the ordinary least squares regression.
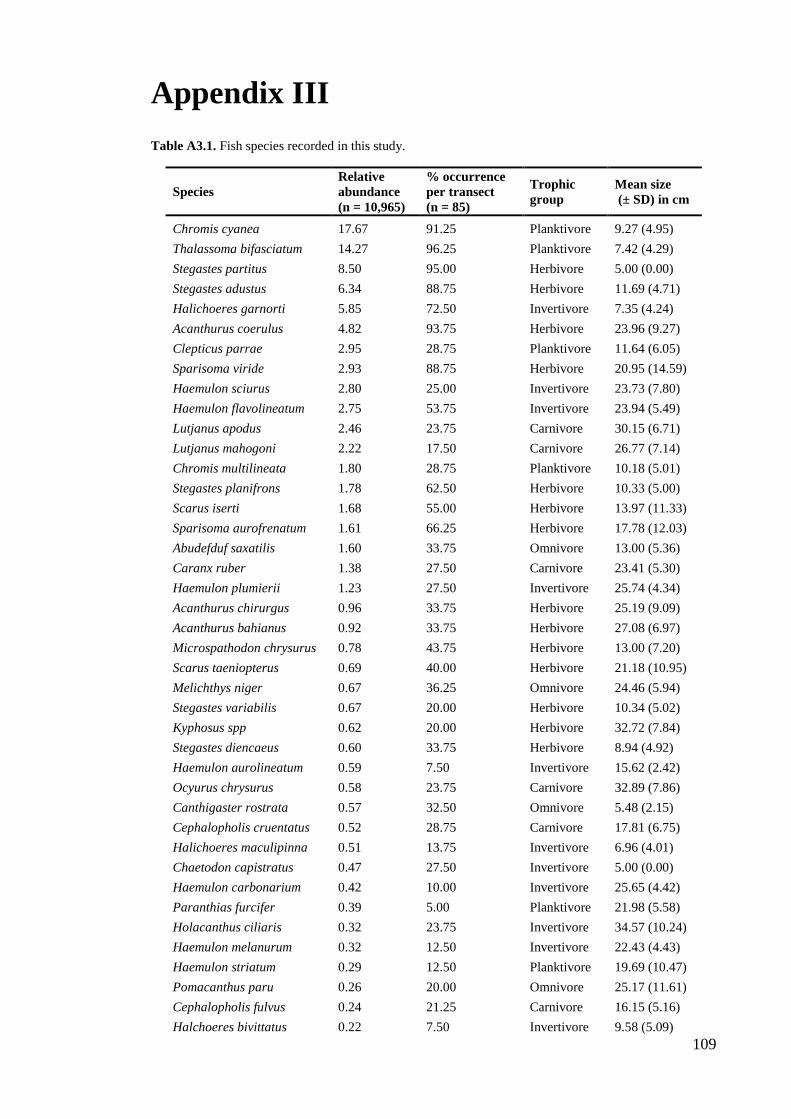
109
Appendix III Table A3.1. Fish species recorded in this study.
Species
Relative
abundance
(n = 10,965)
% occurrence
per transect
(n = 85)
Trophic
group
Mean size
(± SD) in cm
Chromis cyanea 17.67 91.25 Planktivore 9.27 (4.95)
Thalassoma bifasciatum 14.27 96.25 Planktivore 7.42 (4.29)
Stegastes partitus 8.50 95.00 Herbivore 5.00 (0.00)
Stegastes adustus 6.34 88.75 Herbivore 11.69 (4.71)
Halichoeres garnorti 5.85 72.50 Invertivore 7.35 (4.24)
Acanthurus coerulus 4.82 93.75 Herbivore 23.96 (9.27)
Clepticus parrae 2.95 28.75 Planktivore 11.64 (6.05)
Sparisoma viride 2.93 88.75 Herbivore 20.95 (14.59)
Haemulon sciurus 2.80 25.00 Invertivore 23.73 (7.80)
Haemulon flavolineatum 2.75 53.75 Invertivore 23.94 (5.49)
Lutjanus apodus 2.46 23.75 Carnivore 30.15 (6.71)
Lutjanus mahogoni 2.22 17.50 Carnivore 26.77 (7.14)
Chromis multilineata 1.80 28.75 Planktivore 10.18 (5.01)
Stegastes planifrons 1.78 62.50 Herbivore 10.33 (5.00)
Scarus iserti 1.68 55.00 Herbivore 13.97 (11.33)
Sparisoma aurofrenatum 1.61 66.25 Herbivore 17.78 (12.03)
Abudefduf saxatilis 1.60 33.75 Omnivore 13.00 (5.36)
Caranx ruber 1.38 27.50 Carnivore 23.41 (5.30)
Haemulon plumierii 1.23 27.50 Invertivore 25.74 (4.34)
Acanthurus chirurgus 0.96 33.75 Herbivore 25.19 (9.09)
Acanthurus bahianus 0.92 33.75 Herbivore 27.08 (6.97)
Microspathodon chrysurus 0.78 43.75 Herbivore 13.00 (7.20)
Scarus taeniopterus 0.69 40.00 Herbivore 21.18 (10.95)
Melichthys niger 0.67 36.25 Omnivore 24.46 (5.94)
Stegastes variabilis 0.67 20.00 Herbivore 10.34 (5.02)
Kyphosus spp 0.62 20.00 Herbivore 32.72 (7.84)
Stegastes diencaeus 0.60 33.75 Herbivore 8.94 (4.92)
Haemulon aurolineatum 0.59 7.50 Invertivore 15.62 (2.42)
Ocyurus chrysurus 0.58 23.75 Carnivore 32.89 (7.86)
Canthigaster rostrata 0.57 32.50 Omnivore 5.48 (2.15)
Cephalopholis cruentatus 0.52 28.75 Carnivore 17.81 (6.75)
Halichoeres maculipinna 0.51 13.75 Invertivore 6.96 (4.01)
Chaetodon capistratus 0.47 27.50 Invertivore 5.00 (0.00)
Haemulon carbonarium 0.42 10.00 Invertivore 25.65 (4.42)
Paranthias furcifer 0.39 5.00 Planktivore 21.98 (5.58)
Holacanthus ciliaris 0.32 23.75 Invertivore 34.57 (10.24)
Haemulon melanurum 0.32 12.50 Invertivore 22.43 (4.43)
Haemulon striatum 0.29 12.50 Planktivore 19.69 (10.47)
Pomacanthus paru 0.26 20.00 Omnivore 25.17 (11.61)
Cephalopholis fulvus 0.24 21.25 Carnivore 16.15 (5.16)
Halchoeres bivittatus 0.22 7.50 Invertivore 9.58 (5.09)
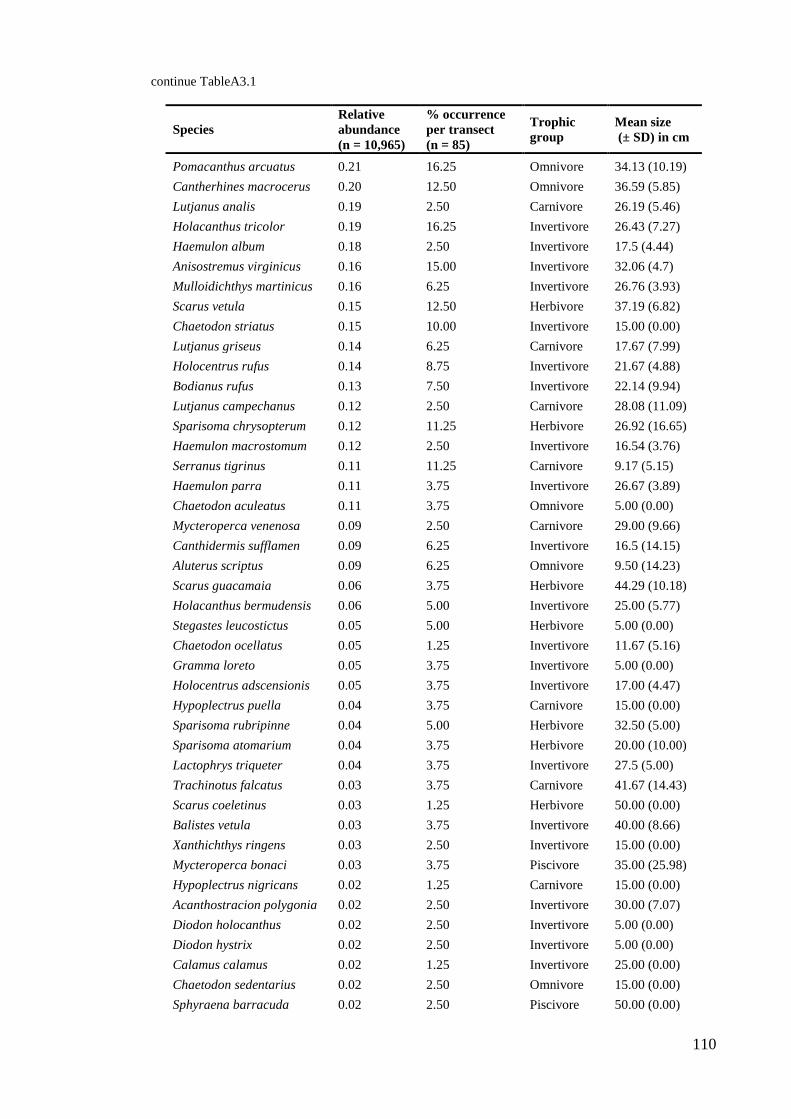
110
continue TableA3.1
Species
Relative
abundance
(n = 10,965)
% occurrence
per transect
(n = 85)
Trophic
group
Mean size
(± SD) in cm
Pomacanthus arcuatus 0.21 16.25 Omnivore 34.13 (10.19)
Cantherhines macrocerus 0.20 12.50 Omnivore 36.59 (5.85)
Lutjanus analis 0.19 2.50 Carnivore 26.19 (5.46)
Holacanthus tricolor 0.19 16.25 Invertivore 26.43 (7.27)
Haemulon album 0.18 2.50 Invertivore 17.5 (4.44)
Anisostremus virginicus 0.16 15.00 Invertivore 32.06 (4.7)
Mulloidichthys martinicus 0.16 6.25 Invertivore 26.76 (3.93)
Scarus vetula 0.15 12.50 Herbivore 37.19 (6.82)
Chaetodon striatus 0.15 10.00 Invertivore 15.00 (0.00)
Lutjanus griseus 0.14 6.25 Carnivore 17.67 (7.99)
Holocentrus rufus 0.14 8.75 Invertivore 21.67 (4.88)
Bodianus rufus 0.13 7.50 Invertivore 22.14 (9.94)
Lutjanus campechanus 0.12 2.50 Carnivore 28.08 (11.09)
Sparisoma chrysopterum 0.12 11.25 Herbivore 26.92 (16.65)
Haemulon macrostomum 0.12 2.50 Invertivore 16.54 (3.76)
Serranus tigrinus 0.11 11.25 Carnivore 9.17 (5.15)
Haemulon parra 0.11 3.75 Invertivore 26.67 (3.89)
Chaetodon aculeatus 0.11 3.75 Omnivore 5.00 (0.00)
Mycteroperca venenosa 0.09 2.50 Carnivore 29.00 (9.66)
Canthidermis sufflamen 0.09 6.25 Invertivore 16.5 (14.15)
Aluterus scriptus 0.09 6.25 Omnivore 9.50 (14.23)
Scarus guacamaia 0.06 3.75 Herbivore 44.29 (10.18)
Holacanthus bermudensis 0.06 5.00 Invertivore 25.00 (5.77)
Stegastes leucostictus 0.05 5.00 Herbivore 5.00 (0.00)
Chaetodon ocellatus 0.05 1.25 Invertivore 11.67 (5.16)
Gramma loreto 0.05 3.75 Invertivore 5.00 (0.00)
Holocentrus adscensionis 0.05 3.75 Invertivore 17.00 (4.47)
Hypoplectrus puella 0.04 3.75 Carnivore 15.00 (0.00)
Sparisoma rubripinne 0.04 5.00 Herbivore 32.50 (5.00)
Sparisoma atomarium 0.04 3.75 Herbivore 20.00 (10.00)
Lactophrys triqueter 0.04 3.75 Invertivore 27.5 (5.00)
Trachinotus falcatus 0.03 3.75 Carnivore 41.67 (14.43)
Scarus coeletinus 0.03 1.25 Herbivore 50.00 (0.00)
Balistes vetula 0.03 3.75 Invertivore 40.00 (8.66)
Xanthichthys ringens 0.03 2.50 Invertivore 15.00 (0.00)
Mycteroperca bonaci 0.03 3.75 Piscivore 35.00 (25.98)
Hypoplectrus nigricans 0.02 1.25 Carnivore 15.00 (0.00)
Acanthostracion polygonia 0.02 2.50 Invertivore 30.00 (7.07)
Diodon holocanthus 0.02 2.50 Invertivore 5.00 (0.00)
Diodon hystrix 0.02 2.50 Invertivore 5.00 (0.00)
Calamus calamus 0.02 1.25 Invertivore 25.00 (0.00)
Chaetodon sedentarius 0.02 2.50 Omnivore 15.00 (0.00)
Sphyraena barracuda 0.02 2.50 Piscivore 50.00 (0.00)
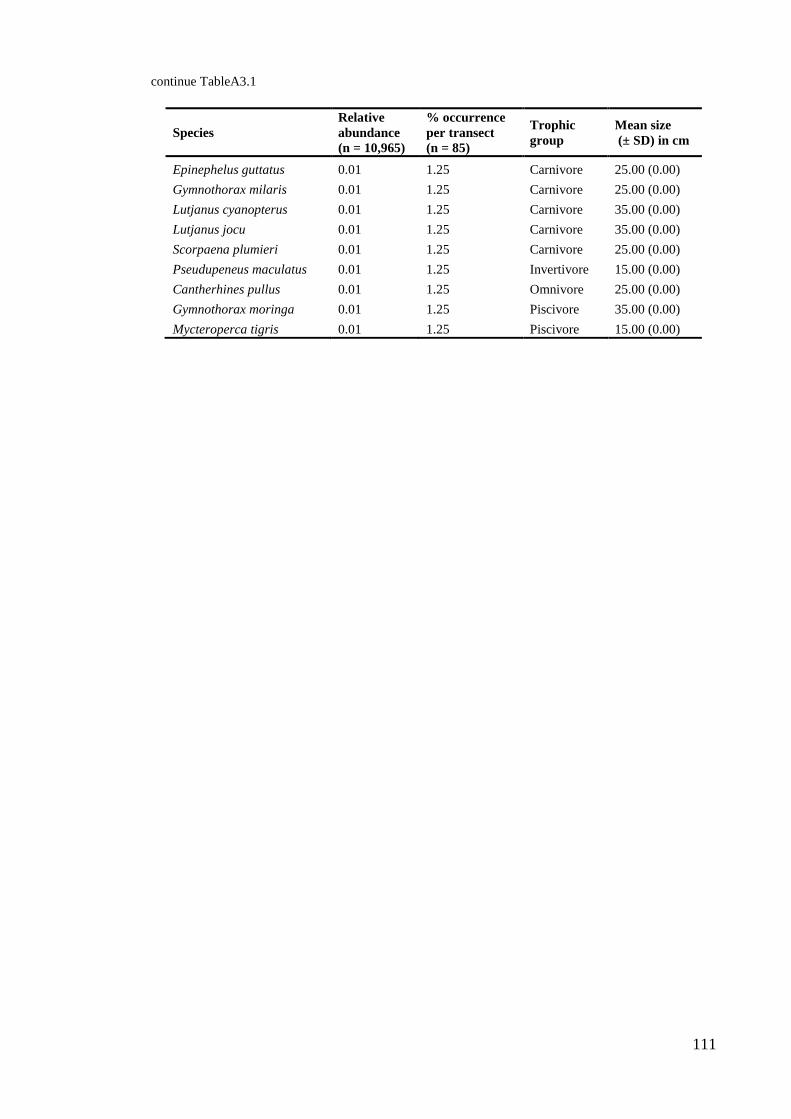
111
continue TableA3.1
Species
Relative
abundance
(n = 10,965)
% occurrence
per transect
(n = 85)
Trophic
group
Mean size
(± SD) in cm
Epinephelus guttatus 0.01 1.25 Carnivore 25.00 (0.00)
Gymnothorax milaris 0.01 1.25 Carnivore 25.00 (0.00)
Lutjanus cyanopterus 0.01 1.25 Carnivore 35.00 (0.00)
Lutjanus jocu 0.01 1.25 Carnivore 35.00 (0.00)
Scorpaena plumieri 0.01 1.25 Carnivore 25.00 (0.00)
Pseudupeneus maculatus 0.01 1.25 Invertivore 15.00 (0.00)
Cantherhines pullus 0.01 1.25 Omnivore 25.00 (0.00)
Gymnothorax moringa 0.01 1.25 Piscivore 35.00 (0.00)
Mycteroperca tigris 0.01 1.25 Piscivore 15.00 (0.00)