
HABILITATION THESIS - UPT · fiind una din direcţiile de cercetare iniţiate în Laboratorul de...
138
HABILITATION THESIS Processes and materials in electrochemical energy systems Assoc. Prof. Dr. Andrea Kellenberger Politehnica University Timisoara Faculty of Industrial Chemistry and Environmental Engineering 2017
Transcript of HABILITATION THESIS - UPT · fiind una din direcţiile de cercetare iniţiate în Laboratorul de...

HABILITATION THESIS
Processes and materials in electrochemical
energy systems
Assoc. Prof. Dr. Andrea Kellenberger
Politehnica University Timisoara
Faculty of Industrial Chemistry and Environmental Engineering
2017

Andrea Kellenberger Habilitation Thesis
Page | 2
Table of Contents
Abstract................................................................................................................ 3
Rezumat ............................................................................................................... 6
PART I. Main scientific, professional and academic achievements .......................... 9
Section I. Scientific achievements .......................................................................... 9
Section II. Professional and academic achievements ............................................ 11
1. Contributions on the electrocatalysis of hydrogen evolution reaction ........... 14 1.1. Background ........................................................................................................ 14 1.2. HER catalysis by proton carriers .......................................................................... 18
1.2.1. Catalytic enhancement of HER on copper electrode ......................................................... 19 1.2.2. Catalytic enhancement of HER on gold electrode ............................................................. 27 1.2.3. Catalytic enhancement of HER on platinum electrode...................................................... 35
1.3. Conclusions ........................................................................................................ 41
2. Contributions on the electrochemical synthesis of polyaniline nanofibers ..... 44 2.1. Background ........................................................................................................ 44 2.2. Influence of synthesis conditions on the structure, morphology and electrochemical properties of polyaniline films ................................................................................... 46
2.2.1. Effect of acid concentration and monomer/acid ratio ...................................................... 47 2.2.2. Effect of scan rate .............................................................................................................. 53 2.2.3. Effect of temperature ........................................................................................................ 60 2.2.4. Effect of substrate ............................................................................................................. 67
2.3. Applications of electrochemically synthesized polyaniline films ........................... 71 2.3.1. Electrochemical sensors .................................................................................................... 71 2.3.2. Adsorption of dyes ............................................................................................................. 76
2.4. Conclusions ........................................................................................................ 80
3. Contributions on the study of charge transport mechanism in conducting polymer films ...................................................................................................... 81
3.1. Background ........................................................................................................ 81 3.2. Charge transport mechanism in polyanilines ....................................................... 84
3.2.1. Charged states in electrochemically prepared polyanilines and copolymers ................... 86 3.2.2. Charged states in “linear” polyanilines .............................................................................. 91
3.3. Charge transport mechanism in polythiophenes .................................................. 96 3.3.1. Charged states in poly(3-alkylthiophenes) ........................................................................ 98 3.3.2. Charged states in functionalized poly(3-alkylthiophenes) ............................................... 101
3.4. Conclusions ...................................................................................................... 107
PART II. Carrier evolution and development plan ............................................... 108
References ........................................................................................................ 112
List of Figures ................................................................................................... 133
List of Tables ..................................................................................................... 138

Andrea Kellenberger Habilitation Thesis
Page | 3
Abstract
The present habilitation thesis entitled “Processes and materials in electrochemical
energy systems” is a synthesis of the research activities carried out by the candidate
after obtaining the scientific title of Doctor in Chemical engineering in 2004. The
main research directions are the electrocatalysis of hydrogen evolution reaction and
the electrochemical synthesis of conducting polymer films and the study of charge
transport mechanism within such films.
The thesis consists of two parts, the first part presenting the main scientific,
professional and academic achievements, and the second part contains the plans for
evolution and further development of the research and university career.
Part I of the thesis is divided into two sections, of which Section I presents the main
scientific achievements in the research fields approached, based on the original
results published in 14 selected ISI papers, and Section II presents the main
professional and academic achievements between 2004 and present. These include
the publication of 29 articles in ISI-indexed journals (h-index 11) and 2 books, 1
patent, 3 research projects as principal investigator, member in the research team of
10 research projects, from which 1 international project, and respectively member in
the target group of 3 POSDRU projects. Section II briefly outlines the main
professional and academic achievements after obtaining the title of Doctor. The
professional development involved the advancement from the position of assistant to
assistant professor in 2005, respectively associate professor in 2008. From this
position I have won two grants for equipping and modernizing the laboratories of
Electrochemistry and General Chemistry. I was also involved in 3 POSDRU projects:
Development and implementation of master programs in micro- and nanomaterials,
Increasing the attractiveness and performance of doctoral and post-doctoral training
programs for researchers in engineering sciences and Doctoral School in support of
research in European context, of which the last project was specifically devoted to
potential doctoral advisors and contributed to my training as a future doctoral
supervisor through active involvement in coordinating a doctoral student.
The main scientific achievements are presented, divided in 3 chapters corresponding
to the main research directions approached, namely Contributions on the
electrocatalysis of hydrogen evolution reaction, Contributions on the electrochemical
synthesis of nanostructured polyaniline, respectively Contributions on the charge
transport mechanism in conducting polymer films.

Andrea Kellenberger Habilitation Thesis
Page | 4
Chapter 1 presents a continuation of the research carried out during the PhD thesis,
being one of the research directions initiated in the Laboratory for Electrochemistry,
Corrosion and Electrochemical Engineering, which led to the elaboration of 2 PhD
theses and the publication of 4 articles in ISI ranked journals, to which the candidate
is a co-author. The investigations aimed at accelerating the hydrogen evolution
reaction by using electrocatalysts added in the solution. These catalysts, also called
proton carriers, have the ability to increase the proton concentration in the double
electric layer from the metal-solution interface by transporting the protons from the
bulk of the solution to the interface. The results obtained have shown that the
catalytic effect of the proton carriers is manifested for both electrode materials with
high hydrogen overpotential, such as copper, but, more important from a practical
point of view, even in the case of metals with low hydrogen overpotential, namely
gold and platinum. Various aromatic or aliphatic amines were investigated as proton
carriers, since the ability to carry protons is given by the lone pair of electrons of the
nitrogen atom. The results obtained showed that the catalytic effect of the amines on
the hydrogen evolution reaction can be explained based on their molecular parameters
obtained by modeling, the most important being the dipole moment and the surface
coverage degree. Thus, the most pronounced catalytic effect was obtained in the case
of amines with a low surface coverage, which is equivalent to a larger number of
molecules present at the interface, so an increased proton concentration, and
respectively for a large dipole moment, which indicates a favorable orientation of the
molecules at the interface, namely with the nitrogen atom and the attached proton
directed towards the metal, where the charge transfer is greatly facilitated.
Chapter 2 describes one of the research directions initiated by the candidate in
collaboration with the Institute of Chemistry of the Romanian Academy, which led to
the elaboration of one PhD thesis and 5 articles in ISI ranked journals where the
candidate is the principal author or co-author, part of the results being obtained within
the framework of a Partnership research project coordinated by the candidate as
partner responsible. The aim of the research was to investigate the influence of
working conditions on the electrochemical synthesis of nanostructured polyaniline,
namely the influence of acid concentration and the monomer / acid molar ratio, as
well as the influence of scan rate, temperature and substrate. The results obtained
have shown that polyaniline nanofibers can be obtained by electrochemical synthesis
on different electrode materials under specific conditions of each substrate. It has
been also found that capacitance values, which indicate the ability of polyaniline
films to store electrical charges, are much higher for nanostructured polyaniline films
as compared to those with granular structure. It has been also demonstrated the use of
conductive polymer films in various applications, such as the development of
dopamine biosensors and the adsorption of azo-dye pollutants.

Andrea Kellenberger Habilitation Thesis
Page | 5
Chapter 3 refers to the results obtained in collaboration with the Center of
Spectroelectrochemistry of the Leibniz Institute of Solid State and Materials Research
in Dresden, Germany, during 5 post-doctoral research stages and subject to 5 papers
published in ISI indexed journals to which the candidate is the main author or co-
author. The researches carried out have studied the charge transport mechanism in
conductive polymer films such as polyaniline and polythiophene. For this purpose,
spectroelectrochemical methods were used in situ, which allow the simultaneous
recording of spectra during a cyclic voltammogram, which is equivalent to the real-
time generation of spectra for various intermediates resulting from the
electrochemical oxidation of conductive polymers. The combined application of
several such techniques, such as infrared spectroscopy, electron spin resonance
spectroscopy, and ultraviolet and visible spectroscopy, allows the differentiation of
paramagnetic and diamagnetic species and the unambiguous assignment of adsorption
bands to various charge carriers, such as polarons, bipolarons or polaron pairs. The
results obtained have shown that in the case of polyaniline phenazine-like structures
play an important role in the formation and stabilization of the charge carriers. In the
case of substituted polythiophene derivatives, it has been shown that polarons and
polaron pairs are the main charge carriers at low doping levels, respectively,
bipolarons and polaron pairs at high doping levels.
Part II of the habilitation thesis includes plans for career evolution and development.
The main future research directions are presented as a continuation of the actual
research interest. Thus, based on the research and expertise in electrocatalysis of
hydrogen evolution reaction, our research group is partner in a HORIZON 2020
proposal submitted in 2017: Novel modular stack design for high pressure PEM
water electrolyzer technology with wide operation range and reduced cost –
PRETZEL. The trends in my future research work will be focused on
(i) development of new electrocatalysts for hydrogen evolution reaction; (ii)
development of new biosensors using carbon based materials such as conducting
polymers and carbon nanotubes and (iii) development of supercapacitors for
electrochemical energy storage using conducting polymers.

Andrea Kellenberger Habilitation Thesis
Page | 6
Rezumat
Teza de abilitare intitulată „Procese şi materiale în sisteme electrochimice de energie”
reprezintă sinteza activităţilor de cercetare desfăşurate de candidată după obţinerea
titlului ştiinţific de Doctor în Inginerie Chimică, în anul 2004. Principala tematică de
cercetare o reprezintă electrocataliza reacţiei de degajare a hidrogenului şi sinteza
electrochimică a polimerilor conductori şi studiul mecanismului de transport de
sarcină în filmele de polimeri conductori.
Teza este structurată pe două părţi, în prima parte fiind prezentate principalele
realizări ştiinţifice, profesionale şi academice, iar în partea a doua fiind prezentate
planurile de evoluţie şi dezvoltare ulterioară a carierei de cercetare şi universitare.
Partea I este împărţită în două secţiuni, dintre care Secţiunea I prezintă principalele
realizări ştiinţifice în domeniile de cercetare abordate, bazate pe rezultatele originale
publicate în cele 14 lucrări ISI selectate, iar Secţiunea II prezintă principalele realizări
profesionale şi academice în perioada 2004 – prezent. Acestea includ publicarea a 25
de articole în reviste indexate ISI (h-index 11) şi 2 cărţi, 1 brevet de invenţie, 3
proiecte de cercetare în calitate de director, participarea ca membru în echipa de
cercetare la 10 proiecte, dintre care unul internaţional, respectiv ca membru în grupul
ţintă în 3 proiecte POSDRU. Secţiunea II prezintă succint principalele realizări
profesionale şi academice după obţinerea titlului de doctor. Evoluţia profesională a
implicat avansarea din poziţia de asistent pe poziţia de şef de lucrări în anul 2005
respectiv conferenţiar în anul 2008. Din această poziţie am câştigat două granturi
pentru dotarea şi modernizarea laboratoarelor de Electrochimie şi Chimie generală.
De asemenea, am fost implicată în 3 proiecte POSDRU: Elaborarea şi implementarea
programelor de master în domeniul micro- şi nanomaterialelor (MASTERMAT),
Creşterea atractivităţii şi performanţei programelor de formare doctorală şi post-
doctorală pentru cercetători în ştiinţe inginereşti (ATRACTING) şi Şcoala doctorală
în sprijinul cercetării în context european, dintre care ultimul proiect a fost în mod
special dedicat cadrelor didactice şi cercetătorilor potenţiali conducători de doctorat şi
care a contribuit la formarea mea ca viitor conducător de doctorat prin implicarea
activă în coordonarea unui student doctorand.
Principalele realizări ştiinţifice sînt prezentate sub forma a 3 capitole corespunzătoare
direcţiilor de cercetare abordate, şi anume Contribuţii la electrocataliza reacţiei de
degajare a hidrogenului, Contribuţii la sinteza electrochimică a polianilinei
nanostructurate, respectiv Contribuţii la studiul mecanismului de transport de sarcină
în polimeri conductori.

Andrea Kellenberger Habilitation Thesis
Page | 7
Capitolul 1 prezintă o continuare a cercetărilor întreprinse în cadrul tezei de doctorat,
fiind una din direcţiile de cercetare iniţiate în Laboratorul de electrochimie,
Coroziune şi Industrii electrochimice, care a dus la elaborarea a două teze de doctorat
şi publicarea a 4 articole în reviste cotate ISI, la care candidata este co-autor.
Cercetările efectuate au avut drept scop accelerarea reacţiei de degajare a
hidrogenului prin utilizarea unor electrocatalizatori sub formă de adaosuri în soluţie.
Aceşti catalizatori, denumiţi şi vectori de protoni, au capacitatea de a creşte
concentraţia protonilor în dublul strat electric de la interfaţa metal-soluţie prin
transportul protonilor din masa soluţiei la interfaţă. Rezultatele obţinute au
demonstrat că efectul catalitic al vectorilor de protoni se manifestă atât în cazul
materialelor de electrod pe care suprapotenţialul de degajare al hidrogenului este
crescut, cum ar fi cupru, dar, cu mult mai important din punct de vedere practic, chiar
şi în cazul metalelor pe care suprapotenţialul de degajare a hidrogenului este scăzut,
şi anume aur şi platină. Drept vectori de protoni au fost alese diverse amine aromatice
sau alifatice, având în vedere că abilitatea de a transporta protoni este dată de
perechea de electroni neparticipanţi ai azotului. Rezultatele obţinute au arătat că
efectul catalitic al aminelor asupra reacţiei de degajare a hidrogenului poate fi
explicat pe baza parametrilor moleculari obţinuţi prin modelare, cei mai importanţi
fiind momentul dipol şi suprafaţa de acoperire. Astfel, efectul catalitic cel mai
pronunţat a fost obţinut în cazul aminelor cu o suprafaţă de acoperire cât mai redusă,
ceea ce echivalează cu un număr mai mare de molecule prezente la interfaţă, deci o
concentraţie crescută de protoni, respectiv pentru un moment dipol cât mai ridicat,
care indică o orientare favorabilă a moleculelor la interfată, şi anume cu atomul de
azot şi protonul ataşat orientate înspre metal, poziţie în care transferul de sarcină este
mult facilitat.
Capitolul 2 descrie una din direcţiile de cercetare iniţiate de candidată în colaborare
cu Institutul de Chimie Timişoara la Academiei Române, care a dus la elaborarea
unei teze de doctorat şi 5 articole în reviste cotate ISI la care candidata este autor
principal sau co-autor, o parte a rezultatelor fiind obţinute în cadul unui proiect de
cercetare de tip Parteneriate, coordonat de către candidată în calitate de responsabil
partener. Cercetările efectuate au urmărit influenţa condiţiilor de lucru asupra sintezei
electrochimice a nanofirelor de polianilină, şi anume influenţa concentraţiei de acid şi
a raportului molar monomer/acid, precum şi influenţa vitezei de scanare, a
temperaturii şi a substratului. Rezultatele obţinute au demonstrat că nanofirele de
polianilină pot fi obţinute prin metode electrochimice de sinteză, pe diferite materiale
de electrod, în condiţii de lucru specifice fiecărui substrat. S-a constatat de asemenea,
că valorile capacităţii, care indică abilitatea filmelor de polianilină de a stoca sarcini
electrice, sînt mult mai ridicate în cazul filmelor cu o structură nanofibrilară
comparativ cu cele cu structură granulară. De asemenea, s-a demonstrat posibilitatea
utilizării filmelor de polimeri conductori în diverse aplicaţii, cum ar fi dezvoltarea

Andrea Kellenberger Habilitation Thesis
Page | 8
unor biosenzori pentru dopamină, respectiv pentru adsorbţia unor poluanţi de tipul
coloranţilor azoici.
Capitolul 3 face referire la rezultatele obţinute în colaborare cu Centrul de
Spectroelectrochimie al Institutului de cercetare a stării solide şi materialelor din
Dresda, Germania, de-a lungul a 5 stagii de cercetare post-doctorală şi care fac
obiectul a 5 lucrări publicate în reviste indexate ISI la care candidata este autor
principal sau co-autor. Cercetările efectuate au urmărit studiul mecanismului de
transport de sarcină în polimeri conductori de tipul polianilinei şi politiofenului. În
acest scop au fost utilizate metode spectroelectrochimice in situ, care permit
înregistrarea simultană a spectrelor în timpul unei voltamograme ciclice, ceea ce
echivalează cu obţinerea în timp real a spectrelor pentru diverşi intermediari rezultaţi
în timpul oxidării electrochimice a polimerilor conductori. Aplicarea combinată a mai
multor astfel de tehnici, cum sînt spectroscopia în infraroşu, spectroscopia de
rezonanţă electronică de spin, respectiv spectroscopia în ultraviolet şi vizibil permite
diferenţierea speciilor paramagnetice şi diamagnetice şi atribuirea univocă a benzilor
de adsorbţie diverşilor purtători de sarcină ce pot fi polaroni, bipolaroni sau perechi
de polaroni. Rezultatele obţinute au demonstrat că în cazul polianilinei nucleele de tip
fenazină joacă un rol important în formarea şi stabilizarea purtătorilor de sarcină. În
cazul derivaţilor substituiţi ai politiofenului a fost pusă în evidenţă existenţa
simultană a polaronilor şi perechilor de polaroni, respectiv a bipolaronilor şi
perechilor de polaroni în funcţie de creşterea gradului de oxidare/dopare.
Partea a II-a a tezei de abilitare cuprinde planurile pentru evoluţia şi dezvoltarea
carierei. Sînt prezentate principalele direcţii viitoare de cercetare, ca o continuare a
direcţiilor actuale. Astfel, ca urmare a cercetărilor şi expertizei în electrocataliza
reacţiei de degajare a hidrogenului, grupul nostru de cercetare este partener într-o
propunere HORIZON 2020 depusă în 2017: Novel modular stack design for high
pressure PEM water electrolyzer technology with wide operation range and reduced
cost – PRETZEL. Tendinţele de viitor abordate în munca de cercetare vor fi
concentrate în principal pe: (i) dezvoltarea de noi materiale electrocatalitice pentru
reacţia de degajare a hidrogenului; (ii) dezvoltarea de noi biosenzori folosind
materiale pe bază de carbon cum ar fi polimerii conductori şi nanotuburile de carbon
şi (iii) dezvoltarea de supercapacitori pentru stocarea energiei electrochimice
utilizând polimeri conductori.

Andrea Kellenberger Habilitation Thesis
Page | 9
PART I. Main scientific, professional and academic achievements
Section I. Scientific achievements
This habilitation thesis summarizes my activity after defending the PhD thesis in July
2004 and receiving the scientific title of Doctor in the field of Chemical Engineering
on the basis of Order no. 4450 dated 02.08.2004 issued by the Ministry of Education
and Research.
The scientific and research activity begins in the Laboratory of Electrochemistry,
Corrosion and Electrochemical Engineering with the development, characterization
and practical applications of skeleton nickel electrocatalysts [1-4]. This kind of
electrode materials have been used for the hydrogen evolution reaction and as
cathodes in direct methanol-air and respectively hydrogen-oxygen fuel cells. These
results were obtained as part of the PhD thesis in collaboration with the University of
Applied Sciences Gelsenkirchen, Germany and within the framework of Romanian
excellence research projects (Grant A 40535/2003, 32940/2004 and 2005: Methanol-
air fuel cells with skeleton nickel electrodes and Grant A 226/2006 and 76/2007: H2-
O2 (air) fuel cells with anion exchange membrane and electrodes based on non-noble
metals).
In the present my research interest continues the topics started during the PhD thesis
and are oriented towards applied electrochemistry with special emphasis on the
electrocatalysis of hydrogen evolution reaction and the electrochemical synthesis and
characterization of conducting polymer films for the development of electroactive
coatings and electrochemical sensors.
The entire research activity is reflected in 29 papers published in ISI ranked journals
(h-index 11), 1 national patent, 3 research grants as project leader, member in 1
international and 9 national research projects, 2 books.
The scientific achievements presented in this habilitation thesis refer to 14 selected
papers that illustrate the two major research directions followed after defending the
PhD thesis, namely the electrocatalysis of hydrogen evolution reaction and the
electrochemical synthesis of conducting polymer films and the study of charge
transport mechanism within such films. The first research direction was initiated in
our Electrochemistry group and includes the development of electrocatalytic active
films [1-4] and/or electrocatalytic enhancement of the hydrogen evolution reaction
[5-8], one of the most intensively studied electrochemical reactions due to its
importance in practical applications such as water electrolysis, chlor-alkali

Andrea Kellenberger Habilitation Thesis
Page | 10
electrolysis and electrochemical reduction of organic compounds. The results
obtained within this direction are subject of 4 research papers and lead to the
elaboration of two PhD thesis and several diploma works and dissertation thesis, as
well as an international research project BS ERA-NET 7-046/2011: Hydrogen
production from black sea water by sulfide driven fuel cells.
The second research direction was initiated in collaboration with the Institute of
Chemistry Timisoara of the Romanian Academy and focuses on the electrochemical
synthesis and properties of conducting polymer films [9-13]. Some of the research
activities were carried out in the frame of a national project PN II Partnership 72-
171/2008 entitled “Microporous polyaniline sensors functionalized with pendant
groups, innovative material for use in identification and control of Parkinson's
disease” funded by the Romanian Ministry of Education, Research, Youth and Sports
between 2008-2011, for which I was partner responsible. Within this project
polyaniline films functionalized with boronic acid groups were used to develop
microporous biosensors for dopamine detection. The obtained results are subject of 5
research papers, 1 PhD thesis and several diploma works and dissertation thesis.
The research activities in the field of conducting polymers were continued by
initiating a new collaboration with the Center of Spectroelectrochemistry of the
Leibniz Institute for Solid State and Materials Research Dresden, Germany to study
the charge transport mechanism in conducting polymers by means of
spectroelectrochemical methods [14-18]. The results of this cooperation were a
number of 5 post-doctoral research stages at Leibniz Institute for Solid State and
Materials Research Dresden, Germany (2005, 2006, 2007, 2009 and 2011) and 5
research papers.
One of the newest research activities related to conducting polymers is their use in the
development of flexible electrodes for solar cells and it was part of a research project
PN II Ideas 77/2013 for which I was project manager, entitled “New fabrication
concept of silver nanowire/polyaniline transparent, conductive and flexible electrodes
for solar cells”. The project was funded by the Executive Agency for Higher
Education, Research, Development and Innovation, subordinated to the Ministry of
National Education between 2013-2016 and aimed to develop transparent, conductive
and flexible electrodes for solar cells based on silver nanowire/polyaniline hybrid
materials and to offer a new technical solution to decrease the sheet resistance of the
silver nanowires embedded in the polymer matrix [19-21]. The results obtained
within this project are subject of 1 national patent application, 3 research papers and
some diploma works and dissertation thesis.

Andrea Kellenberger Habilitation Thesis
Page | 11
Section II. Professional and academic achievements
The main professional and academic achievements of the candidate in the last 12
years, in the period 2004 -2016, after defending the PhD thesis and receiving the PhD
title, are represented by the promotion from the position of assistant in 2004 to
assistant professor in 2005 and associated professor in 2008. From this position I
have taught the disciplines of Electrochemistry and Corrosion Protection,
Electrochemical Processes, Chemistry and General Chemistry.
In my teaching activity with the students I was constantly preoccupied to improve the
content of my lectures and laboratory works to keep up with the newest trends in
electrochemistry. The lectures are appreciated by the students as clear, with an
accessible content and an appropriate scientific level. I have tried to apply modern
education methods, using multimedia techniques in the teaching. I was encouraging
and offering support to students in the use of specialized software to represent and
analyze experimental results obtained during the laboratory works. I participated
actively in upgrading and equipping laboratories with specific equipment intended for
teaching purposes. Thus, I won by competition two projects to equip undergraduate
laboratories financed by Politehnica University Timisoara, namely: Laboratory of
Electrochemistry, as a team member and General Chemistry Laboratory, as project
manager. I have conducted over 20 diploma works and dissertations, and been
actively involved in the supervision of 3 PhD students.
I was member of the Senate of Politehnica University Timisoara, member of the
Faculty Council and member of the Department Council.
Starting from 2010 I was involved as long term expert and / or member of the target
group in the following 3 POSDRU projects:
POSDRU/86/1.2/S/58146 University for future, DMI. Quality in Higher Education,
between 2010-2013, title: Development and implementation of Master program in the
field of micro-and nanomaterials – MASTERMAT. In the first stage of the project I
was involved in the analysis of master programs in the field of micro- and
nanomaterials from UE countries and I elaborated the content and Syllabus for the
courses of Solid State Electrochemistry and Nanomaterials with electrical, optical and
magnetic properties. This courses are compatible with similar or neighbouring
courses taught at University of Cambridge, Ecolle Polytechnique de Bruxelles, Ulm
University, Graz University of Technology and University of Copenhagen. As a
result we have published 1 book: Solid State Electrochemistry, A. Kellenberger, N.
Vaszilcsin, Ed. Politehnica, Timisoara, 2013, ISBN 978-606-554-563-2. After
starting the Micro- and nanomaterials Master program at the Politehnica University
Timisoara, I have taught the discipline of Solid State Electrochemistry (lecture and
laboratory works) and I have planned and conducted a dissertation thesis entitled

Andrea Kellenberger Habilitation Thesis
Page | 12
“Electrochemical synthesis of polyaniline nanofibers applied in hydrogen evolution
reaction”. As a result, we have published an ISI indexed paper [12].
POSDRU/21/1.5/G/13798 Better Doctoral Programs, DMI. Doctoral and
Postdoctoral programs in support of research, between 2010-2012, title: Doctoral
School in support of research in the European context, member of the target group.
This project was intended to support teachers and researchers having the PhD title
and aiming to become PhD advisors. I was involved in advising one PhD student
including: (i) advising the PhD student in writing his research reports; (ii) advising
the PhD student in completing his thesis; (iii) writing and publishing scientific papers
in collaboration with the PhD student. As a result we have published three ISI
indexed papers [5,6,47]. In the frame of this project I have participated to an
international conference: Journées d’Electrochimie 2011, Grenoble, France, 04-08
July 2011 with a poster and I have attended a 2 month research stage at Leibniz
Institute for Solid State and Materials Research Dresden between 18.04.2011 –
18.06.2011. As a result of the aforementioned research stage I have published one ISI
indexed paper [18].
POSDRU 159/1.5/S/137070 Support for doctoral candidates and postdoctoral
researchers, DMI. Doctoral and Postdoctoral programs in support of research,
between 2014-2015, title: Increasing the attractiveness and performance of doctoral
and postdoctoral training programs for researchers in engineering sciences –
ATRACTING. In the frame of this project I was responsible with the organization of a
thematic workshop for PhD students and postdoctoral researchers, entitled:
“Advanced electrochemical techniques for characterization of electrode materials
with applications in energy and environment” which was held over 4 days and it was
attended by 10 participants. My attribution included the elaboration of handout
documents for the workshop, as well as 2 lectures on Linear and cyclic voltammetry.
Application in the synthesis of nanomaterials used for supercapacitors and
Electrochemical impedance spectroscopy. Applications in the study of fuel cells and
also 2 hands-on trainings on Reversible / irreversible electrochemical reactions
studied by cyclic voltammetry and Study of electrode reactions and materials by
electrochemical impedance spectroscopy.
In addition to the aforementioned achievements, I was co-chairperson of two of the
sections of 1st Regional Symposium of Electrochemistry South-East Europe, Croatia
2008 and of 3rd Regional Symposium of Electrochemistry South-East Europe
Bucharest, 13 -17 May 2012 and secretary of the section of Physical Chemistry and
Electrochemistry of the International Conference of Chemistry and Chemical
Engineering, Timisoara, 27-28 May, 2010.

Andrea Kellenberger Habilitation Thesis
Page | 13
I am member of 2 professional associations: Chemical Society from Romania and
International Society of Electrochemistry.
I have participated as reviewer in peer-review process for ISI journals such as:
International Journal of Hydrogen Energy, Synthetic Metals, Chemical Papers,
Journal of Alloys and Compounds, Chemical Bulletin of the University Politehnica of
Timisoara, as evaluator for research projects, as member in the advisory committee of
14 PhD students and as a member in the PhD juries of the following thesis:
Anamaria DABICI, Oxide materials with photocatalytic activity used for
mineralization of dyes from wastewaters, Politehnica University Timisoara,
Faculty of Industrial Chemistry and Environmental Engineering, 2011.
Anamaria Simona BACIU, Electrochemical detection of certain specific
pollutants from water using nanostructured graphite-based composite
electrode materials, Politehnica University Timisoara, Faculty of Industrial
Chemistry and Environmental Engineering, 2012.
Ştefan Dănică NOVACONI, Contributions on the development of
photoelectrochemical cells based on nanostructured titanium dioxide and dye,
Politehnica University Timisoara, Faculty of Industrial Chemistry and
Environmental Engineering, 2013.

Andrea Kellenberger Habilitation Thesis
Page | 14
1. Contributions on the electrocatalysis of hydrogen evolution reaction
The results presented within this chapter have been obtained in the frame of an international
research project BS ERA-NET 7-046/2011: “Hydrogen production from black sea water by
sulfide driven fuel cells” and also as part of two POSDRU projects:
POSDRU/21/1.5/G/13798 Doctoral school in support of research in the European context
and POSDRU 159/1.5/S/137070 Increasing the attractiveness and performance of doctoral
and postdoctoral training programms for researchers in engineering sciences – ATRACTING
where I was involved in advising two PhD students.
The results have been published in 4 ISI indexed papers, as follows:
C.C. Vaduva, N. Vaszilcsin, A. Kellenberger, M. Medeleanu, Catalytic
enhancement of hydrogen evolution reaction on copper in the presence of
benzylamine, International Journal of Hydrogen Energy 36 (2011) 6994-7001.
C.C. Vaduva, N. Vaszilcsin, A. Kellenberger, Aromatic amines as proton carriers
for catalytic enhancement of hydrogen evolution reaction on copper in acid solutions,
International Journal of Hydrogen Energy 37 (2012) 12089-12096.
R. Cretu, A. Kellenberger, N. Vaszilcsin, Enhancement of hydrogen evolution
reaction on platinum cathode by proton carriers, International Journal of Hydrogen
Energy 38 (2013) 11685-11694.
R. Cretu, A. Kellenberger, M. Medeleanu, N. Vaszilcsin, Cathodic Hydrogen
Evolution Reaction on Gold Catalyzed by Proton-Carriers, International Journal of
Electrochemical Science 9 (2014) 4465-4477.
1.1. Background
The concept of ecologically clean hydrogen energy started to develop during the mid of 70’s,
as a response of the scientific community to the impending environmental disaster. Utilizing
hydrogen does not produce any harmful effluents, nor does it produce CO2. It is evident that
using hydrogen as an energy carrier automatically solves, in principle, the global problem of
the greenhouse effect. The concept of hydrogen economy has been completed by the mid of
the 80’s and it comprises [22]:
hydrogen production from water using non-renewable energy sources (coal, atomic
energy, thermonuclear energy) and renewable energy sources (sun, hydro, wind,
currents, tides, biomass).
hydrogen delivery, transportation and storage.
hydrogen utilization in industry, transport (land, water and air) and home.
problems of material reliability and system safety.

Andrea Kellenberger Habilitation Thesis
Page | 15
Concerning hydrogen production, one of the main energy sources is coal and hydrocarbons
from natural gas and oil. Hydrogen can be obtained with low costs by coal gasification, steam
reforming, partial oxidation and autothermal reforming, but besides hydrogen, huge amounts
of carbon dioxide are also produced. For example, if hydrogen is obtained by steam
reforming of methane, for each ton of H2 an amount of 5.5 tons of CO2 are released in the
atmosphere [23]. Moreover, in coal gasification technology, 11 tons of CO2 are emitted in
environment for 1 ton of H2 obtained [24]. The second energy source is water and hydrogen
can be obtained by electrolysis, thermolysis or photocatalytic water splitting. Although water
splitting by electrolysis is a green procedure, it is limited by important electric energy
consumption and it is applicable particularly in areas where clean, inexpensive electricity is
available. As a matter of fact, statistical data from 2007 reveal that 96% of hydrogen was
obtained from fossil fuels and only 4% by electrolysis. So it seems to be enough potential to
improve water electrolysis.
Water electrolysis was performed for the first time in 1800 by William Nicholson and
Anthony Carlisle, who used the battery invented by Volta. Water electrolysis implies oxygen
evolution reaction (OER) at the anode, with a standard potential of 1.23 V and hydrogen
evolution reaction (HER) at the cathode with a standard potential of 0V at pH = 0, according
to equations (1) and (2). The overall decomposition reaction of water proceeds according to
equation (3) and requires a cell voltage of 1.23 V. However, electrolysis will not generally
proceed at these voltages, as the electrical input must overcome the ohmic resistance and the
electrode overpotential, as seen in equation (4). In order to reduce energy consumption for
water electrolysis these two terms needs to be minimized.
A(+): 2 H2O → O2 + 4 H+ + 4e− Eo = 1.23 V (1)
C(−): 2 H+ + 2e− → H2 Eo = 0 V (2)
Global: 2 H2O → 2 H2 + O2 ΔEo = 1.23 V (3)
ΔEcell = ΔEo + IRcell + Ση (4)
The first term refers to the total ohmic series resistance of the cell including external circuit
resistances and connections at the anode and cathode, the electrolyte and membrane
resistance, and also resistances coming from partial coverage of the anode and cathode with
oxygen and respectively hydrogen bubbles. This term can be minimized by operating the
electrolysis at high temperatures and pressures, by using high conductivity electrolytes and
by decreasing wire length, increasing cross-section and using more conductive wire materials
and also by zero-gap geometry electrolysis cells. Pure water is a very poor electric conductor
and, for this reason, is difficult to electrolyze. Electrolysis may be conducted in acidic or
alkaline solution, but alkaline electrolysis has been developed commercially because the
electrode materials are cheaper and less susceptible to corrosion compared to those required
for acid electrolytes. Important progress has been achieved since the development of proton
exchange membrane (PEM) water electrolyzers consisting of a thin proton-conducting
membrane which acts as solid electrolyte. On each side of the membrane thin layers of
electrocatalysts are coated, acting as anode for oxygen evolution reaction and respectively
cathode for hydrogen evolution reaction. Electrolyzers based on this concept can operate at

Andrea Kellenberger Habilitation Thesis
Page | 16
higher pressures than conventional electrolyzers and also at much higher current densities
because they provide a compact system design (zero-gap geometry) and therefore minimize
the ohmic losses [25-27].
The second term refers to the sum of the overpotentials including the activation overpotential
at the two electrodes and the concentration overpotential due to the mass transport of the
gaseous products away from the anode and cathode surfaces. The ways to reduce the
overpotential can be deduced from electrode kinetics, described by the Butler-Volmer
equation, which gives the dependence of the current density on the potential, according to
equation (5).
ffii )1(o ee Butler-Volmer equation (5)
where f = zF/RT
This equation can be simplified, for example at very large cathodic overpotentials the first
term can be neglected and the relationship can be written as the Tafel equation which gives a
linear dependence between overpotential and the logarithm of current density.
iF
RTi
F
RTlog
)1(303.2log
)1(303.2 o
Tafel equation (6)
or iba log
Tafel equation shows that overpotential can be minimized by using electrocatalysts which
enhance the rate of the electrode reaction in two ways: (i) by providing higher values of the
exchange current density io, without changing the reaction mechanism or (ii) by decreasing
the slope of the equation, which means an increase of the charge transfer coefficient 1 – α, so
a change of the reaction mechanism. The two ways an electrocatalyst can decrease the
overpotential at high current densities are illustrated in Figure 1.
Figure 1. Electrocatalytic enhancement of electrode reactions without mechanism change (left) and by
changing the mechanism (right).
The electrocatalysts enhance the electron transfer between the electrode and the reactants and
they may act at the electrode surface or may be the electrode surface itself.

Andrea Kellenberger Habilitation Thesis
Page | 17
Catalytic enhancement of the HER is one of the best available ways to increase the efficiency
of the water electrolysis process, which can be achieved on one hand by using electroactive
materials and modified electrodes for HER, and on the other hand, by introducing additives
in the electrolyte solution as proton carriers.
The mechanism of hydrogen evolution reaction is a combination of three reaction steps. The
first step is always the electrochemical hydrogen adsorption or Volmer reaction. The second
step is hydrogen desorption and it can proceed either electrochemically according to the
Heyrovsky reaction or chemically according to the Tafel reaction. Based on the two
possibilities for hydrogen desorption, two mechanisms have been proposed: the Volmer-Tafel
mechanism and the Volmer-Heyrovsky mechanism. In acid media, the Volmer and
Heyrovsky reactions are given by equation (7) and (8).
OHMHe OH M 2ads-
31
1
k
k
Volmer reaction / acid media (7)
OHMHe OH MH 22-
3ads2
2
k
k
Heyrovsky reaction / acid media (8)
In alkaline media the Volmer and Heyrovsky reactions are given by equations (9) and (10).
OHMHe OH M ads-
21
1
k
k
Volmer reaction / alkaline media (9)
OHMHe OH MH 2-
2ads2
2
k
k
Heyrovsky reaction / alkaline media (10)
The Tafel reaction is pH independent and it is given by equation (11).
2adsads H2MMH MH3
3
k
k
Tafel reaction (11)
If the electrocatalyst is the electrode material itself, then the Trasatti’s volcano curve [28] can
be used to estimate its electrocatalytic activity. The volcano curve is a plot of the reaction
rate, expressed as logarithm of the exchange current density, versus the hydrogen adsorption
energy. It shows that if the hydrogen adsorption energy is too low, than the rate of adsorption
is slow and becomes the rate determining step. If it is too high, the overall reaction rate is
limited by the desorption step. The maximum rate is observed for platinum group metals,
with intermediate values of hydrogen adsorption energies.
Although platinum group metals present the highest activity for HER, the high costs
associated with the electrocatalyst development have promoted researches to reduce platinum
loadings or to replace platinum with other metals, less expensive but with comparable
electrocatalytic properties [29,30]. Electroactive cathodes based on platinum group metals
were realized by depositing a thin film [31,32] on common metals, so that the costs of
cathodes used for water electrolysis were substantially reduced. As replacement for platinum,
nickel has been extensively studied due to its good corrosion resistance in alkaline media.
Recent trends in research include the study of nickel nanoparticles supported on carbon
nanofibers and graphenes as effective electrocatalysts for hydrogen evolution reaction [33-
Andrea Kellenberger Habilitation Thesis
Page | 18
35]. However, in acid electrolytes only noble metals, and in particular platinum metals, are
resistant under unpolarized conditions and can be used as electrode materials for hydrogen
evolution [36]. Independently on the electrocatalyst which is used, a further decrease of the
overpotential of HER can be achieved by increasing the real surface area of the electrode
and/or by increasing the intrinsic activity of the electrode material, which can be achieved by
alloying and/or doping with transitional metals. Recent advances in the development of
efficient electrocatalyst for HER using low cost and earth abundant materials include the use
of transitional metal sulfides [37-40], phosphides [41-43] and carbides [44-46] and even
metal-free catalyst based on graphene composites [47].
1.2. HER catalysis by proton carriers
Another way to reduce the overpotential of HER is by using electrocatalysts in the solution.
The electrocatalysts in the solution are compounds that are able to increase the concentration
of protons in the electric double layer at the interface, by transporting protons from the bulk
to the interface, therefore they are called proton carriers. Example of such proton carriers are
amines, and their catalytic activity is caused by the lone electron pair of the nitrogen atom.
The catalytic enhancement of HER by proton carriers is scarcely reported in the literature.
Such a pseudo–homogeneous catalytic effect was reported for the first time on the dropping
mercury electrode, since the HER overpotential on mercury has very high values and a
catalytic effect is easier to observe [48]. Different catalysts have been studied, such as
peptides and proteins [49-51] and their action has been interpreted as a mediated proton
transfer from the solution to the mercury cathode [52]. Frumkin also observed a
depolarization of the polarographic waves of hydrogen evolution on mercury in the presence
of amines [53]. He proposed a two-step mechanism by which, in the first step the protonated
amine participates directly in the HER, by a reversible charge transfer process:
][ HCATeHCAT
The second step is irreversible and leads to the formation and release of hydrogen molecule
and regeneration of the amine molecule which is released in the bulk of solution and can be
again protonated:
CATHHCAT 2][2
In this mechanism, the protonated amine, the reaction intermediate and the amine are
temporarily adsorbed at the metal–electrolyte solution interface, so that the process takes
place through an adsorption – re-sorption mechanism [53].
Such catalyst molecules behave as a proton carrier because they transport protons from the
solution bulk into the electric double layer at the metal – electrolyte solution interface. A
molecule is able to act as a proton carrier if it has lone electron pairs in the valance layer,
where the protons can attach. This condition is fulfilled if nitrogen, oxygen, phosphorus
and/or sulfur atoms are present in the molecular structure of the catalyst [52]. Noteworthy in
this way, is the catalytic effect of famotidine, an organic compound which contains nitrogen,

Andrea Kellenberger Habilitation Thesis
Page | 19
sulfur and oxygen atoms in the molecule [54]. The catalytic effect of sulfur compounds
(thiourea and N–substituted thioureas) on the HER on mercury electrodes was also studied
[55]. However, it has been found that thiourea does not have a catalytic effect for HER on
silver electrode in acid media, but only in neutral solutions. This has been explained in terms
of hydrogen bonds formed between the nitrogen atom and the water molecules, thus
mediating the proton discharge [56].
1.2.1. Catalytic enhancement of HER on copper electrode
Copper is not commonly used as such as electrode material for hydrogen evolution reaction.
In fact, the catalytic enhancement of HER on copper has been observed in our research group
during studies on the cathodic copper deposition using several aromatic amines as leveling
agents [57]. It has been found that benzylamine acts as inhibitor for copper deposition and, in
the same time as accelerator for HER.
In our studies we have evidenced the catalytic effect of benzylamine for HER on a copper
electrode. Electrochemical measurements were carried out with a PAR 2273 potentiosta-
galvanostat, using a conventional three-electrode, one compartment glass cell, with the
working electrode made of Cu (99.99% Cu) with a surface of 0.5 cm2. Two graphite rods
were used as counter electrode and saturated calomel electrode (SCE) as reference electrode.
Steady-state polarization curves were recorded potentiostatically at low scan rate (2.5 mV s-1)
from 1 mol L-1 H2SO4 solution in the absence and respectively in the presence of different
concentrations of benzylamine (BA) and the corresponding Tafel plots were represented, as
seen in Figure 2.
-0.90 -0.85 -0.80 -0.75 -0.70 -0.65 -0.60
-0.07
-0.06
-0.05
-0.04
-0.03
-0.02
-0.01
0.00
without BA
10-2 M BA
5 10-2 M BA
10-1 M BA
i /
A c
m-2
E / V vs. SCE
-0.40
-0.45
-0.50
-0.55
-0.60
-3.5 -3.0 -2.5 -2.0 -1.5 -1.0
without BA
10-2 M BA
5 10-2 M BA
10-1 M BA
log i / A cm-2
/
V
Figure 2. Steady-state polarization curves (left) and Tafel plots (right) for hydrogen evolution reaction
on copper electrode in 1 mol L-1 H2SO4 solution in the absence and presence of various concentrations
of benzylamine.
The presence of BA in the electrolyte solution induces a decrease of the overpotential for
HER, proportional to the concentration of BA in the solution. The decrease of overpotential

Andrea Kellenberger Habilitation Thesis
Page | 20
at a current density of 200 A m–2 is about 45, 70 and respectively 100 mV for concentration
of BA of 10-2, 5 10-2 and respectively 10-1 mol L-1.
Based on the Tafel plots the kinetic parameters (Tafel slope b, charge transfer coefficient 1–
and exchange current density io) have been determined in dependence of the BA
concentration and are given in Table 1.
Table 1. Kinetic parameters for HER on copper electrode at various concentration of BA.
BA [mol L-1] b [mV dec–1] 1– io [A cm–2]
0 –106 0.56 4.4 10–8
10-2 –137 0.43 1.8 10–6
5 10-2 –137 0.43 2.9 10–6
10-1 –139 0.42 4.8 10–6
The value of the Tafel slope on copper without benzylamine is –106 mV decade–1. This value
is slightly lower than the theoretical value of –118 mV decade–1 predicted for the HER
mechanism in acidic media, if the Volmer reaction is the rate determining step [58]. When
BA is added to the electrolyte solution, the value of the Tafel slope increases to –137 mV
decade–1 and remains almost constant, independently on the concentration of BA. The
increase in the absolute value of the Tafel slope is a consequence of the decrease of the
cathodic charge transfer coefficient 1–. The second electrochemical parameter which gives
information about the electrocatalytic activity is the exchange current density io. Considering
the values of the exchange current density given in Table 1, it can be observed that for
copper, in the absence of BA, the value is very low and comparable to those reported in the
literature [58]. In the presence of BA, the values of the exchange current density show an
important increase, directly proportional to the concentration of BA. The highest value
obtained is two orders of magnitude higher than the exchange current density on copper
without BA. It can be therefore concluded, that the overall effect of BA is to accelerate the
HER without changing the reaction mechanism, but by increasing the exchange current
density, which compensates the decrease of the cathodic transfer coefficient.
The catalytic activity of BA on the HER on copper electrode was also investigated as a
function of temperature and the HER activation energy was calculated both in the absence
and presence of BA. Steady–state polarization curves and the corresponding Tafel plots at
different temperatures, from 1 M sulfuric acid solution with 5 10-2 mol L-1 BA are shown in
Figure 3.
According to the general theory for the HER mechanism, the temperature influences the HER
overpotential in two ways. On one hand, the temperature increase leads to a slight increase in
the value of the Tafel slope, meaning an enlargement of the HER overpotential. However,
this effect is less important and it is overcome by the pronounced increase of the exchange
current density. Therefore, the overall effect of temperature on the HER is to decrease the
overpotential. The experimental polarization curves from Fig. 3 indicate a decrease of the
HER overpotential of about 150 mV when increasing the temperature from 288 to 328 K.

Andrea Kellenberger Habilitation Thesis
Page | 21
The kinetic parameters for the HER as function of temperature determined from the Tafel
plots are given in Table 2.
Figure 3. Steady-state polarization curves (left) and Tafel plots (right) for hydrogen evolution reaction
on copper electrode in 1 mol L-1 H2SO4 solution with 5 10-2 mol L-1 benzylamine at different
temperatures.
The dependence of exchange current density on temperature was used to construct Arrhenius
plots and to calculate the activation energy for HER according to relation (12):
)(
)(log303.2
1
o
T
iREa (12)
Activation energies of 94.6 kJ mol–1 and 33.0 kJ mol–1 have been obtained for HER in 1 mol
L-1 H2SO4 solution without BA and with 5 10-2 mol L-1 BA. The threefold decrease of the
value of activation energy is a supplementary evidence of the catalytic effect of BA on HER.
Table 2. Kinetic parameters for HER on copper electrode at different temperatures in 1 mol L-1 H2SO4
solution without / with 5 10-2 mol L-1 BA.
T [K] without BA 5 10-2 mol L-1 BA
b [mV dec–1] 1–α io [A cm–2] b [mV dec–1] 1–α io [A cm–2]
298 –105 0.56 4.4 10–8 –137 0.43 2.9 10–6
308 –109 0.54 7.1 10–8 –135 0.44 3.8 10–6
318 –117 0.50 2.7 10–7 –137 0.43 6.3 10–6
328 –118 0.50 6.8 10–7 –130 0.46 7.8 10–6
The catalytic effect of BA was further investigated by electrochemical impedance
spectroscopy (EIS). Impedance measurements were performed in the frequency range from
0.1 Hz to 100 kHz with AC voltage amplitude of 10 mV. Complex plane (Nyquist) and phase
angle (Bode) plots obtained in 1 mol L-1 H2SO4 solution in the absence and respectively in
the presence of different concentrations of BA are given in Figure 4.

Andrea Kellenberger Habilitation Thesis
Page | 22
0 1 2 3 4 5 6 7 8
0
-1
-2
-3
-4
-5
-6
-7
without BA
10-2 M BA
5 10-2 M BA
10-1 M BA
ZIm
/
cm
2
ZRe
/ cm2
a)
1 10 100 1000 10000 100000
1
10
0
-10
-20
-30
-40
-50
|Z| /
cm
2
f / Hz
b) p
hase a
ngle
/ deg
Figure 4. Experimental Nyquist (a) and Bode (b) plots at E = –0.75 V, for HER on copper in 1 mol L-1
H2SO4 solution in the absence and presence of various concentrations of benzylamine.
The shape of the Nyquist and Bode plots is similar both in the absence and presence of BA,
characterized by a slightly depressed semicircle related to the charge transfer step and by the
presence of only one time constant, indicating that HER proceeds according to the same
mechanism in both cases. The addition of BA has the effect of decreasing the charge transfer
resistance, as evidenced by the decrease of the semicircle radius when the concentration of
BA increases.
An electrical equivalent circuit (EEC) with one time constant has been proposed to model the
impedance data. The EEC contains the solution resistance RS in series with a parallel
connection of the double layer capacitance Cdl and the charge transfer resistance Rct. The
impedance response of solid electrodes is usually described more accurately if the double
layer capacitance is replaced by a constant phase element CPE, characterized by two
parameters: T which is related to the double layer capacitance and n which is an exponent
between 0 and 1 describing the constant phase angle of the CPE.
Table 3. Experimental values and standard errors for the EEC parameters related to HER on copper in
1 mol L-1 H2SO4 in the presence of different concentrations of BA.
BA
[mol L-1]
RS
[Ω cm2]
Rct
[Ω cm2]
Cdl
[F cm–2] Chi2
0 0.9 (0.88%) 6.5 (0.86%) 4.30 10–5 3.2 10–3
10-2 0.9 (0.77%) 5.7 (0.71%) 2.91 10–5 2.5 10–3
5 10-2 0.8 (0.87%) 5.3 (0.77%) 2.72 10–5 3.0 10–3
10-1 0.9 (0.94%) 4.8 (0.89%) 3.33 10–5 4.2 10–3
The experimental EIS data were fitted by a complex non–linear least squares (CNLS)
Levenberg–Marquard procedure using ZView 3.0, a Scribner Associates Inc. Software. The
values of double layer capacitance and charge transfer resistance were determined by

Andrea Kellenberger Habilitation Thesis
Page | 23
modeling the experimental EIS data to the electrical equivalent circuit and they are given in
Table 3.
The values of the double layer capacitance decrease with increasing concentrations of BA,
showing that BA adsorbs on the copper–electrolyte solution interface. The values of the
charge transfer resistance decrease proportionally with the BA concentration, meaning that
HER takes place easier in the presence of BA.
We suppose that the mechanism of HER implies both hydrogen discharge from
benzylammonium ions according to equation (13) as well as hydrogen discharge from
hydronium ions, reaction (14).
2256ads3256 NHCHHCHeNHCHHC (13)
OHHeOH 2ads3 (14)
The EIS results demonstrate that BA directly participates in the HER mechanism, by
transporting protons from the bulk of the solution to the interface, although a clear distinction
between the two charge transfer steps was not possible, probably due to similar time
constants.
To establish the reasons for the increase of exchange current density in the presence of
benzylamine, molecular parameters such as dipole moment and molecular coverage area have
been computed. The orientation of the dipole moment of protonated benzylamine molecule is
shown in Figure 5 and the obtained value is 9.856 D. The surface coverage area is 52.26 Å.
The large value of the dipole moment determines a strong adsorption of benzylammonium
molecules at the interface and also a preferential orientation, with the ammonium group
towards the metal, which is the most favorable position for the charge transfer reaction to
take place. So, in the presence of BA the concentration of –NH3+ groups at the interface is
high, probably much higher than the concentration of H3O+ ions in the absence of BA and
this explains the enhancement of HER by increasing the exchange current density.
Figure 5. Molecular dipole moment (arrow) of protonated benzylamine molecule.
As a conclusion, the catalytic effect of BA on HER on copper has been evidenced by
different electrochemical techniques. Steady-state polarization curves showed that BA (10-1
mol L-1) depresses the overpotential of HER on copper by 100 mV at a current density of 200
A m–2. Also, the kinetic parameters for HER on copper are enhanced in the presence of BA.

Andrea Kellenberger Habilitation Thesis
Page | 24
The exchange current density increases by two orders of magnitude and the activation energy
decreases three times in the presence of BA (10-1 mol L-1). Impedance measurements indicate
that BA adsorbs on the copper–electrolyte solution interface as seen from the decrease of
double layer capacitance in the presence of BA. Also, the charge transfer resistance values
decrease proportionally with the BA concentration, confirming a direct participation of BA in
HER. Quantum calculation showed that the catalytic effect of BA can be explained in terms
of a strong adsorption of benzylammonium ions at the electrode–electrolyte interface and of a
favorable orientation of the cation with the –N+H3 group toward the electrode’s surface.
The promising results obtained with benzylamine have determined to extend the studies on
the catalytic effect of other aromatic amines. A series of aniline derivatives has been selected,
with the chemical structure given in Figure 6.
Figure 6. Chemical structure of aniline derivatives used as proton carriers for HER on copper.
Steady-state polarization curves for HER were recorded potentiostatically in 0.5 mol L-1
H2SO4 solution, in the absence and respectively in the presence of the selected aromatic
amines at different concentrations, 10-4, 5 10-4, 10-3 and 5 10-3 mol L-1. Measurements were
also made at different temperatures (298, 308, 318 and 328 K) to determine the temperature
dependence of the kinetic parameters and to calculate the activation energy of HER.
The steady-state polarization curves and the corresponding Tafel plots obtained in 0.5 mol L-1
H2SO4 solution in the presence of 10-4 mol L-1 of different aniline derivatives are given in
Figure 7 and 8.
Figure 7. Steady-state polarization curves for hydrogen evolution reaction on copper electrode in
0.5 mol L-1 H2SO4 solution with 10-4 mol L-1 of different aniline derivatives.
A MA EA DMA DEA oT mT pT

Andrea Kellenberger Habilitation Thesis
Page | 25
Figure 8. Tafel plots for hydrogen evolution reaction on copper electrode in 0.5 mol L-1 H2SO4
solution with 10-4 mol L-1 of different aniline derivatives.
It is obvious that all the aromatic amines induced a decrease of the overpotential for HER, the
strongest effects being observed for toluidines and DMA. The depolarization observed on the
linear polarization curves is considerably influenced by the nature of amines, suggesting a
strong dependence between amines structure and catalytic effect.
Based on the Tafel plots the kinetic parameters have been evaluated for all the amines at the
lowest concentration and are given in Table 4.
Table 4. Kinetic parameters for HER on copper electrode in 0.5 mol L-1 H2SO4 solution and 10-4 mol
L-1 of different aromatic amines.
Added amines - b [mV decade–1] 1- io [A m-2]
Blank 92 0.64 2.0 10-5
A 122 0.48 2.9 10-3
MA 125 0.47 6.5 10-4
EA 102 0.58 6.8 10-4
DMA 103 0.58 7.6 10-4
DEA 164 0.40 1.9 10-3
oT 119 0.50 2.7 10-3
mT 121 0.50 2.8 10-3
pT 114 0.51 1.5 10-3
It can be observed that the Tafel slope value is ranging between 100 – 125 mV decade-1 in the
presence of amines, indicating that they are catalysts which act on the HER without changing
the mechanism, only increasing the exchange current density. A higher value of the slope is
obtained in case DEA, with two voluminous ethyl substituents at the nitrogen atom.
The cathodic charge transfer coefficient decreases in the presence of amines, because the
distance along reaction coordinate between metal and activated states is greater for aryl-
ammonium ions than for hydronium ions, considering the different dimensions of the two
ions. The decrease of 1- is kinetically unfavorable but this effect is compensated by the

Andrea Kellenberger Habilitation Thesis
Page | 26
large increase of the exchange current density, resulting in an overall effect of HER
enhancement. It should be also noted that the increase of io is more pronounced than the
decrease of 1-.
The way amines act on HER kinetics is rather complex, since the catalytic activity depends
not only on concentration and molecular properties, but also on the surface coverage degree
and energetic aspects related to amines adsorption on the electrode-electrolyte interface. Low
molecular volume amines, such as aniline, can provide a higher concentration of aryl-
ammonium ions at the interface, at least at concentrations corresponding to a surface
coverage degree of 1. The experimental results confirm that the addition of aniline increases
the exchange current density by two orders of magnitude. The effect is less pronounced for
the N-substituted derivatives of aniline, excepting DEA, where the adsorption is influenced
by the steric effects of the ethyl groups. A similar influence to that of aniline is observed for
pT, explained by the fact that the amino group is not shielded by any substituent, however the
methyl- group, due to its inductive electronic effect, decrease the molecular dipole moment,
having as a consequence the diminution of exchange current density. Additionally, the
surface coverage of pT molecule (perpendicularly on the dipole moment) is the same as that
of aniline. A pronounced effect on the exchange current density is observed also for mT and
oT. This could be explained in terms of different adsorption energy values and also due to the
electron-releasing inductive effect of methyl groups which are now closer to the reaction
center.
The catalytic effect of the proton carrier amines has been also confirmed by electrochemical
impedance spectroscopy. EIS spectra, shown in Figure 9 were recorded at – 0.7 V vs.
Ag/AgCl and modeled by a simple electrical equivalent circuit, presented as inset in Figure 9.
Figure 9. Complex plane plots for HER on copper in 0.5 mol L-1 H2SO4 in the presence of 10-4 mol L-1
aromatic amines. Inset: electrical equivalent circuit used to model impedance data.
The Nyquist plots show the presence of a slightly depressed semicircle related to the charge
transfer step, with the diameter of the semicircle depending on the nature of the aromatic
amines. All the experimental data were fitted by a CNLS procedure to the electrical

Andrea Kellenberger Habilitation Thesis
Page | 27
equivalent circuit and the corresponding values of the circuit elements are given in Table 5,
together with the standard errors and the goodness of fit expressed by the Chi-squared value
and the double layer capacitance values.
Table 5. Charge transfer resistance for HER on copper in 0.5 mol L-1 H2SO4 in the presence of 10-4
mol L-1 amines.
Parameter blank A MA EA DMA DEA oT mT pT
Rct [Ω cm2] 47.2 23.6 33.7 28.4 31.1 28.2 27.4 24.8 30.2
Cdl × 105 [F cm-2] 2.14 4.26 3.37 3.26 2.94 3.23 4.12 4.13 3.77
The experimental values of the EEC elements obtained by modeling the impedance data point
out to the catalytic effect of aromatic amines. Although the amines are adsorbed in the inner
Helmholtz layer, only slight changes in the double layer capacitance can be noticed, probably
due to the low concentrations. The strongest effect is observed in regard with the charge
transfer resistance. Generally, the addition of aromatic amines leads to a decrease of the
charge transfer resistance, compared to that obtained in the blank solution, showing that HER
is enhanced in the presence of aromatic amines. Because the EIS plots show the presence of
only one time constant it is assumed that the HER mechanism does not change in the
presence of amines. The protonated amines act as “protons carriers” accelerating the HER.
The charge transfer resistance decreases in the order: blank > MA > DMA > pT > EA > DEA
> oT > A > mT, which is in very good agreement with the order of exchange current density
values.
As a conclusion, the catalytic effect of several aromatic amines on HER on copper has been
evidenced by different electrochemical techniques. Steady-state polarization curves showed
an important depolarization for the HER on copper for all the studied amines. Also, the
kinetic parameters for HER on copper are enhanced in the presence of aromatic amines. The
exchange current density increases by two orders of magnitude even at low concentrations of
added amines. Impedance measurements confirm that the investigated aromatic amines
directly participate in the HER mechanism and decrease the charge transfer resistance values.
1.2.2. Catalytic enhancement of HER on gold electrode
The catalytic effect of aromatic amines has been evidenced on metals with high overpotential
for HER, such as mercury and copper, but these metals can not be used as electrode materials
for hydrogen production by water electrolysis. As a consequence, the catalytic effect of
aromatic amines has been disregarded for a long time as a practical method to reduce HER
overpotential. The aim of our investigation was to prove that the catalytic effect of amines is
still observable for metals with low HER overpotential, such as gold and platinum.
Gold shows a moderate to low overpotential for HER and according to the volcano plot for
HER the strength of Au–H bond is lower than that of Pt–H bond, with a value close to that of
iron group metals [28] which suggest that gold should provide a similar catalytical effect on
the recombination of hydrogen atoms. The lower strength of Au–H bond makes gold an

Andrea Kellenberger Habilitation Thesis
Page | 28
interesting partner in the development of bifunctional catalysts with catalytic activity for both
charge transfer reaction and chemical/electrochemical hydrogen desorption.
In our studies, several aliphatic and aromatic amines have been tested as electrocatalysts in
the solution for HER on gold electrode: methylamine, DL-1-phenylethylamine, aniline, N-
methylaniline, 2-biphenylylamine, 3-chloroaniline, 4-chloroaniline and ammonium sulphate,
with the corresponding chemical structures shown in Figure 10.
Figure 10. Chemical structure of aliphatic/aromatic amines used as proton carriers for HER on gold.
Linear voltammograms were recorded from 0.5 mol L-1 H2SO4 solution and 10-3 mol L-1
added amine with a PAR 2273 potentiostat-galvanostat. The electrochemical measurements
were carried out in a standard three-electrode configuration, using a gold working electrode
( = 1.6 mm, A = 0.02 cm2), a platinum sieve as counterelectrode and Ag/AgCl (sat) as
reference electrode. Examples of linear voltammograms obtained on the gold electrode are
given in Figure 11.
Figure 11. Linear voltammograms on gold electrode in 0.5 mol L-1 H2SO4 solution at 25°C,
concentration of amines: 10-3 mol L-1, scan rate: 10 mV s-1.
It can be observed that all the tested amines show some catalytic effect, by decreasing the
potential needed for hydrogen evolution at a constant current density. The most significant
effect, of about 200 mV decrease of the overpotential, has been observed for aniline, 4-
chloroaniline and methylamine, therefore these three amines were selected for further studies
regarding the effect of concentration and temperature on the kinetic parameters of HER.
Linear voltammograms have been obtained at different concentrations of the amines, between
10-6 and 10-3 mol L-1 and different temperatures, between 298 and 328 K. A selection of such
curves is given in Figure 12.

Andrea Kellenberger Habilitation Thesis
Page | 29
Figure 12. Linear polarization curves for HER on gold in 0.5 mol L-1 H2SO4 at different temperatures
for a concentration of the selected amines of 10-6 mol L-1 (upper row) and 10-3 mol L-1 (lower row).
The highest depolarization is observed for methylamine, followed by 4-chloroaniline and
aniline, due to important structural differences between these three amines. This enables us to
correlate the catalytic properties with their molecular parameters.
The kinetic parameters for HER have been determined based on the Tafel plots shown in
Figure 13 and the values of exchange current density io and cathodic charge transfer
coefficient 1- are given in Table 6.
-0.5 0.0 0.5 1.0 1.5 2.0 2.5 3.0 3.5
-0.4
-0.3
-0.2
-0.1
0.0
T = 298 K
/
V
lg i / A m-2
blank
aniline
4-chloroaniline
methylamine
-0.5 0.0 0.5 1.0 1.5 2.0 2.5 3.0 3.5
-0.3
-0.2
-0.1
0.0
T = 308 K
/
V
lg i / A m-2
blank
aniline
4-chloroaniline
methylamine
0.0 0.5 1.0 1.5 2.0 2.5 3.0 3.5
-0.3
-0.2
-0.1
0.0
T = 318 K
blank
aniline
4-chloroaniline
methylamine
/
V
lg i / A m-2
0.0 0.5 1.0 1.5 2.0 2.5 3.0 3.5
-0.3
-0.2
-0.1
0.0
blank
aniline
4-chloroaniline
methylaniline
/
V
lg i / A m-2
T = 328 K
-0.5 0.0 0.5 1.0 1.5 2.0 2.5 3.0 3.5
-0.4
-0.3
-0.2
-0.1
0.0
T = 298 K
/
V
lg i / A m-2
blank
aniline
4-chloroaniline
methylamine
-0.5 0.0 0.5 1.0 1.5 2.0 2.5 3.0 3.5
-0.3
-0.2
-0.1
0.0
T = 308 K
/
V
lg i / A m-2
blank
aniline
4-chloroaniline
methylamine
0.0 0.5 1.0 1.5 2.0 2.5 3.0 3.5
-0.3
-0.2
-0.1
0.0
T = 318 K
/
V
lg i / A m-2
blank
aniline
4-chloroaniline
methylamine
0.0 0.5 1.0 1.5 2.0 2.5 3.0 3.5
-0.3
-0.2
-0.1
0.0
T = 328 K
/
V
lg i / A m-2
blank
aniline
4-chloroaniline
methylamine
Figure 13. Tafel plots for HER on gold electrode in 0.5 mol L-1 H2SO4 at different temperatures for a
concentration of the selected amines of 10-6 mol L-1 (upper row) and 10-3 mol L-1 (lower row).
As observed by other authors [59] the Tafel plots on gold in sulfuric acid present two distinct
slopes, of about 30 and respectively 120 mV, depending on the overpotential. The lower
slope, observed at low overpotentials corresponds to HER controlled by desorption of the
hydrogen atoms, while the larger slope is due to the mechanism in which the charge transfer
is the slow step of the overall cathodic process. The kinetic parameters that characterize the
charge transfer step have been determined in the region of high overpotentials.

Andrea Kellenberger Habilitation Thesis
Page | 30
Table 6. Kinetic parameters for HER on gold electrode in 0.5 mol L-1 H2SO4 solution in the presence
of amines at different concentrations and temperatures.
c T -b [mV dec-1] 1–α io [A m-2]
[mol L-1] [K] AH+ ClAH+ MAH+ AH+ ClAH+ MAH+ AH+ ClAH+ MAH+
10-6 298
308
318
328
123
130
154
162
135
150
161
172
141
151
164
183
0.48
0.47
0.41
0.40
0.44
0.41
0.39
0.38
0.42
0.40
0.38
0.36
1.71
4.67
26.50
33.79
5.3
10.6
43.7
58.6
10.8
13.3
71.5
91.2
10-5 298
308
318
328
123
134
154
180
139
144
169
185
153
163
187
201
0.48
0.46
0.41
0.36
0.43
0.42
0.37
0.35
0.39
0.39
0.34
0.32
3.48
6.54
32.89
50.12
11.4
29.0
76.8
95.0
17.9
54.4
133.1
146.1
10-4 298
308
318
328
133
142
161
183
145
167
184
193
159
171
199
211
0.44
0.43
0.39
0.36
0.41
0.37
0.34
0.34
0.37
0.36
0.32
0.31
8.00
11.25
51.30
60.04
20.5
66.4
116.7
131.0
33.3
94.4
160.9
193.0
10-3 298
308
318
328
148
155
171
186
165
173
196
210
181
185
205
216
0.40
0.39
0.37
0.35
0.36
0.35
0.32
0.31
0.33
0.33
0.31
0.30
17.78
27.74
75.74
94.41
44.1
98.2
155.3
207.1
64.1
141.3
214.2
296.7
The main effect of the amines is to decrease the charge transfer coefficient 1–α and to
increase the exchange current density io. This two effects are proportional to the increase of
concentration and temperature. The charge transfer coefficient decreases in the order MAH+
< ClAH+ < AH+ and the exchange current density increases in the same order.
According to the Butler-Volmer equation, a low charge transfer coefficient 1–α is
unfavorable for HER kinetics, because only a smaller fraction of the interfacial potential is
used in activating the reactants to the top of the free energy barrier. In terms of reaction
coordinates, a lower value of 1–α means that the reaction plane is farther away from the metal
surface. This happens if more voluminous ions than hydronium ions are involved in the
charge transfer reaction, like alkyl-ammonium or aryl-ammonium cations, which for steric
reasons cannot approach as close to the metal surface as hydronium ions.
The decrease of 1–α is compensated by the significant increase of the exchange current
density io due to the adsorption of protonated amines on the cathode surface, leading to a
higher concentration of proton carriers which can be discharged. As a result, the overall effect
of amines is to accelerate HER.
The catalytic effect of the amines was explained based on their molecular parameters which
have been determined by quantum calculations and are presented in Table 7. The orientation
of the dipole moment is also shown in Figure 14.

Andrea Kellenberger Habilitation Thesis
Page | 31
Table 7. Molecular parameters of protonated amines.
Compound
No of
atoms
Molecular
volume [Å3]
Dipole
moment [D]
Molecular
coverage area [Å2]
Phenylammonium, AH+ 15 95.3 7.12 30.9
4-Chlorphenylammonium, ClAH+ 15 108.6 12.31 30.9
Methyl-ammonium, MAH+ 8 36.1 2.22 21.5
Figure 14. Molecular dipole moment (arrow) of protonated aniline, 4-chloro-aniline and methylamine.
The kinetic parameters for HER are correlated to the dipole moment and molecular coverage
area of the protonated molecules. MAH+ with the lowest dipole moment is less attracted to
the cathode surface and it shows the lowest value of 1–α, but because it has the lowest
coverage area, a higher number of MAH+ molecules can be adsorbed on the cathode surface,
providing a higher concentration of hydronium ions at the interface, which consequently
leads to a higher exchange current density.
In case of phenylammonium and 4-chlor phenylammonium cations, the coverage areas are
the same, but the molecular dipole moments differ because the Cl atom has an electron-
withdrawing inductive effect and this produces a higher charge separation in ClAH+ than in
AH+. As a result, the orientation of ClAH+ dipoles on the electrode surface will be more
ordered and a higher number of ClAH+ molecules will be adsorbed on the electrode surface,
leading to a higher concentration of the electroactive species and a higher value of the
exchange current density.
It is well known that exchange current density io is directly proportional to the concentration
of electroactive ions at the interface, according to relation (15) [60].
RT
EkcFi a
cOxo exp (15)
where cOx is the concentration of the electroactive particles, kc – rate constant of the cathodic
process, Ea – activation energy.
In the absence of protonated amines, the exchange current density will be determined only by
the hydronium ions concentration, provided that the rate determining step is the charge
transfer:

Andrea Kellenberger Habilitation Thesis
Page | 32
RT
EkcFi
a(b)
c(b))b(OHo(b) exp3
(16)
where io(b) is the exchange current density, )b(OH3
c - hydronium concentration, kc(b) - rate
constant of cathodic reduction of hydronium ions, Ea(b) – activation energy (all referred to the
blank solution).
In the presence of protonated amines, the concentration of hydronium ions increases with
)a(OH3c due to the hydrolysis of ammonium ions. It must be taken into account that the
discharge of ammonium ions itself may also occur on the cathode. In this case, the global
exchange current density will be:
RT
EkcF
RT
EkccFi
)a(RH
RHRH
)Oa(H
)Oc(H)a(OH)b(OHo expexp 3
333
(17)
where RH+ represents the protonated forms of the studied amines AH+, ClAH+ and
respectively MAH+.
According to literature data, cathodic surface coverage with these species is high even at low
concentrations, reason for which the exchange current density increases significantly in the
presence of amines. Since it is difficult to separate the amines contribution to the increase of
the hydronium ion concentration, a global relationship can be used:
RT
EkcFi a
*
*
c
*
OHo exp3
(18)
where *
OH3c ,
*
ck and *
aE represent apparent values.
The effect of amines on HER has been confirmed by electrochemical impedance
spectroscopy. Impedance spectra were recorded at an overpotential of -200 mV, at different
temperatures and different concentrations of the amines.
Figure 15. Complex plane and Bode plots plots for HER on gold in 0.5 mol L-1 H2SO4 at η = -200 mV.

Andrea Kellenberger Habilitation Thesis
Page | 33
The shape of the Nyquist diagrams in the blank (Figure 15) at low temperatures corresponds
to a high frequency semicircle assigned to the charge transfer process, followed by a low
frequency inductive loop characteristic to adsorption / desorption processes. At higher
temperatures the inductive loop disappears and a single semicircle can be observed. This
behavior was also observed by linear voltammetry, where the Tafel plots showed two
different slopes. At low temperatures the overpotential of -200 mV is in the region of low
Tafel slopes, where HER kinetics is controlled by desorption of atomic hydrogen, hence the
inductive loop in the impedance plots. At higher temperatures, the overpotential of -200 mV
corresponds to the region where HER is controlled by the charge transfer step, so the shape of
the Nyquist plot changes to a single semicircle.
Figure 16. Complex plane plots for HER on gold in 0.5 mol L-1 H2SO4 at η = -200 mV in the presence
of AH+ and 4ClAH+ at concentrations of 10-6 mol L-1 (upper row) and 10-3 mol L-1 (lower row).
In the presence of amines all the Nyquist plots (Figure 16) show a single semicircle whose
diameter decreases with increasing concentration and temperature and its value corresponds
to the charge transfer resistance. In the presence of methylamine the catalytic effect on HER
is very intense, so at the overpotential of -200 mV vigorous hydrogen release takes place and
the impedance diagrams are quite distorted and more difficult to model.

Andrea Kellenberger Habilitation Thesis
Page | 34
Figure 17 shows the equivalent circuit which has been used to model the process in blank
solution, to account for charge transfer process at high frequencies and hydrogen desorption
at low frequencies, and the equivalent circuit which was proper in the presence of amines.
Rs CPEdl
Rct L
R
Element Freedom Value Error Error %
Rs Free(+) 0.1821 0.00455 2.4986
CPEdl-T Free(+) 4.2467E-5 1.0753E-6 2.5321
CPEdl-P Free(+) 0.85789 0.0024638 0.28719
Rct Free(+) 52.32 0.44468 0.84992
L Free(+) 0.06556 0.013494 20.583
R Free(+) 6.064 0.62868 10.367
Chi-Squared: 0.0029632
Weighted Sum of Squares: 0.26669
Data File: D:\Work\Raluca Cretu\EIS-Au_2013\EIS-Au-ZView\ZView\T1C0-eta.txt
Circuit Model File: D:\Work\Raluca Cretu\EIS-Au_2013\ZV_Inductanta_nou.mdl
Mode: Run Fitting / Selected Points (12 - 59)
Maximum Iterations: 100
Optimization Iterations: 0
Type of Fitting: Complex
Type of Weighting: Calc-Modulus
Rs CPEdl
Rct
Element Freedom Value Error Error %
Rs Free(+) 0.9183 0.0090137 0.98156
CPEdl-T Free(+) 3.1298E-5 2.2579E-6 7.2142
CPEdl-P Free(+) 0.8997 0.0069051 0.76749
Rct Free(+) 2.839 0.021102 0.74329
Chi-Squared: 0.001009
Weighted Sum of Squares: 0.046414
Data File: D:\Work\Raluca Cretu\EIS-Au_2013\EIS-Au-ZView\ZView\T3C4A-eta.txt
Circuit Model File: D:\Work\Raluca Cretu\EIS-Au_2013\ZV_Inductanta.mdl
Mode: Run Fitting / Selected Points (29 - 53)
Maximum Iterations: 100
Optimization Iterations: 0
Type of Fitting: Complex
Type of Weighting: Calc-Modulus
Figure 17. Electrical equivalent circuits used to model impedance data for HER on gold in the absence
of proton carriers (left) and in the presence of proton carriers (right).
The results obtained by electrochemical impedance spectroscopy are consistent with those
derived from the Tafel plots and from molecular modeling. The parameter which describes
the catalytic effect of investigated amines is the charge transfer resistance, whose values are
given in Table 8 for different temperatures and amine concentrations.
Table 8. Values of the charge transfer resistance for HER on gold in 0.5 mol L-1 H2SO4 at η = -200
mV in the presence of amines at different concentrations and temperatures.
Amine Conc. Rct [Ω cm2]
[mol L-1] T1 = 298 K T2 = 308 K T3 = 318 K T4 = 328 K
blank 0 52.3 (0.9 %) 28.4 (1.2 %) 7.8 (0.9 %) 2.9 (0.9 %)
AH+ 10-6 9.1 (0.5 %) 7.8 (0.3 %) 3.7 (0.4 %) 2.9 (0.9 %)
10-3 7.5 (0.4 %) 4.2 (0.3 %) 2.9 (0.8 %) 2.4 (1.3 %)
4ClAH+ 10-6 4.7 (0.4 %) 1.9 (0.8 %) 1.6 (2.3 %) 1.3 (3.2 %)
10-3 3.4 (0.8 %) 1.2 (1.9 %) 1.0 (1.9 %) 0.8 (4.6 %)
MAH+ 10-6 1.4 (1.4 %) 1.3 (1.3 %) 0.6 (3.4 %) 0.5 (5.9 %)
10-3 0.6 (3.0 %) 0.4 (8.5 %) 0.4 (5.8 %) –
As expected, the charge transfer resistance shows an important decrease at high temperatures,
both in the absence and presence of amines. The strongest catalytic effect is observed at room
temperature, as indicated by the 100 fold decrease of the charge transfer resistance upon
addition of methylamine. The catalytic effect increases in the order: AH+ < ClAH+ < MAH+,
according to Figure 18, similar to the order of exchange current densities and consistent with
the coverage degree and dipole moment obtained by molecular modeling.
In conclusion, the catalytic effect of some aromatic / aliphatic amines on HER on gold has
been evidenced by different electrochemical techniques. Steady-state polarization curves
showed that even low concentrations of amines (10-4 to 10-3 mol L-1) still produce a
significant depolarization of HER, of about 200 mV at 200 A m-2. Also, the kinetic
parameters for HER on gold are enhanced in the presence of amines. The exchange current
density increases by two orders of magnitude and the activation energy decreases three times
in the presence of amines (10-3 mol L-1). Impedance measurements confirm that the amines

Andrea Kellenberger Habilitation Thesis
Page | 35
directly participate in the HER mechanism on gold and decrease the charge transfer
resistance values. Quantum calculation showed that the catalytic effect of amines on HER on
gold can be explained in terms of molecular coverage area and adsorption of protonated
amines at the gold–electrolyte interface.
Figure 18. Catalytic effect of aniline, 4-chloro-aniline and methylamine on HER on gold electrode.
1.2.3. Catalytic enhancement of HER on platinum electrode
Platinum is the best electrocatalytic material for HER but due to its high price, methods have
been searched to reduce the costs associated with electrocatalyst development for water
electrolysis. State of the art in today’s proton exchange membrane electrolyzers is the use of
low and ultra-low (2 - 0.5 mg/cm2) platinum loadings, usually platinum nanoparticle catalysts
[61-63].
Our studies focused on the use of proton carriers, which are catalysts in the solution, to
further increase the rate of HER. Although the overpotential of HER on platinum is very low,
our results have shown that the catalytic effect of proton carriers can still be observed on
platinum. We have selected benzylamine (BA) and aniline (A).
Linear voltammograms were recorded from 0.5 mol L-1 H2SO4 solution with amine
concentrations between 10-5 and 10-2 mol L-1 using a PAR 2273 potentiostat-galvanostat. The
electrochemical measurements were carried out in a standard three-electrode configuration,
using a platinum working electrode ( = 1.6 mm, A = 0.02 cm2), a platinum sieve as
counterelectrode and Ag/AgCl (sat) as reference electrode. Examples of linear
voltammograms obtained on the platinum electrode are given in Figure 20.

Andrea Kellenberger Habilitation Thesis
Page | 36
-0.30 -0.28 -0.26 -0.24 -0.22 -0.20 -0.18 -0.16
-150
-100
-50
0
i /
A m
-2
E / V vs. Ag/AgCl
blank
10-5M BA
10-4M BA
10-3M BA
10-2M BA
Figure 19. Linear voltammograms for HER on platinum electrode in 0.5 mol L-1 at 25°C and different
concentrations of benzylamine (left) and aniline (right). Scan rate 5 mV s-1.
The catalytic effect depends on amine concentration. It can be observed that at highest
concentration, the presence of aromatic amines induces a decrease of the overpotential of
about 50 mV for benzylamine and about 70 mV for aniline. A measure of the catalytic effect
is the current density at a certain potential value. It is interesting to observe that at low
concentrations both amines have a similar catalytic effect but at high concentrations aniline
has a much stronger catalytic effect than benzylamine.
More conclusive information about the catalytic effect is given by the kinetic parameters
(Tafel slope, exchange current density and transfer coefficient) derived from the Tafel plots.
The values of kinetic parameters are given in Table 9 for the blank solution and in Table 10
in the presence of proton carriers.
Table 9. Kinetic parameters for HER on platinum electrode in 0.5 mol L-1 H2SO4 solution.
T [K] b [mV dec-1] 1-α io [A m-2]
298 87 0.68 2.95
308 101 0.58 7.58
318 122 0.48 25.1
328 130 0.45 28.8
In the presence of benzylamine and aniline, it can be observed that the kinetics is still
controlled by the charge transfer step and the temperature increase affects to a great extent
the exchange current density which is a measure of hydrogen evolution reaction rate.
At low concentration, the values of exchange current density are closed, indicating a similar
catalytic effect. This can be explained considering the dipole moment of protonated
molecules. In both cases a high dipole moment of 9.44 D for BAH+ and of 7.46 D for AH+
ensures a similar concentration of proton carriers at the interface in a favorable position for
charge transfer.
-0.30 -0.28 -0.26 -0.24 -0.22 -0.20 -0.18 -0.16-600
-500
-400
-300
-200
-100
0
i /
A m
-2
E / V vs. Ag/AgCl
blank
10-5M A
10-4M A
10-3M A
10-2M A

Andrea Kellenberger Habilitation Thesis
Page | 37
Table 10. Kinetic parameters for HER on platinum electrode in 0.5 mol L-1 H2SO4 solution in the
presence of benzylamine and aniline at different concentrations and temperatures.
T [K] Benzylamine 10-5 mol L-1 Benzylamine 10-2 mol L-1
b [mV dec-1] 1-α io [A m-2] b [mV dec-1] 1-α io [A m-2]
298 88 0.66 5.75 103 0.57 22.9
308 109 0.54 21.9 119 0.49 41.7
318 129 0.46 32.5 129 0.45 51.3
328 141 0.45 34.7 140 0.42 66.1
T [K] Aniline 10-5 mol L-1 Aniline 10-2 mol L-1
b [mV dec-1] 1-α io [A m-2] b [mV dec-1] 1-α io [A m-2]
298 94 0.63 6.9 110 0.54 67.6
308 100 0.59 11.0 126 0.47 128.8
318 121 0.45 28.2 147 0.40 169.8
328 136 0.43 40.7 168 0.35 239.9
At high concentrations, when the coverage degree of the electrode surface tends to be 1, the
concentration of the proton carriers at the interface becomes inversely proportional to their
molecular surface coverage, which is defined as the maximum cross section area of the
molecule, perpendicular to the dipole moment. Due to different orientation of the dipole
moment, the surface coverage of the adsorbed phenylammonium cation is about 28 Å and
that of benzylammonium is about 52 Å. For a low molecular surface coverage we have a
larger number of adsorbed molecules, therefore a higher concentration of protons at the
interface and hence a higher reaction rate.
Electrochemical impedance spectroscopy is a powerful method very often used to elucidate
the HER mechanism. It is well known that HER proceeds through three steps:
electrochemical adsorption – the Volmer reaction, and two possible desorption steps:
electrochemical desorption – the Heyrovsky reaction and chemical desorption – the Tafel
reaction. The equivalent electrical circuit (EEC) proposed by Armstrong and Henderson [64]
to model the impedance of HER, shown in fig. 9a, is a two-time constant model that predicts
the appearance of two depressed semicircles on the complex plane plots. The high frequency
semicircle (Cdl-Rct) is related to the charge transfer kinetics and the low frequency semicircle
(Cp-Rp) is associated with hydrogen adsorption. When hydrogen evolution is accompanied by
H absorption, which may take place either by a two-step (indirect) or by a direct absorption
mechanism, the equivalent electrical circuit is changed by the addition of a new branch, in
parallel with Cp consisting of (Rab – W), related to the absorption resistance and the H
diffusion effects, according to the model proposed by Lasia [65] and presented in fig. 9b. The
complex plane impedance plots reveal the presence of three semicircles, corresponding to
charge transfer resistance, Rct, absorption resistance, Rab, and adsorption resistance, Rp,
together with H diffusion effects (part of a straight line at 45°). A complete mathematical
description of these models is given by Lasia [65,66] and the faradaic impedance of HER for
the circuits in Figure 21(a) and 21(b) is given by equations (19) and (20):
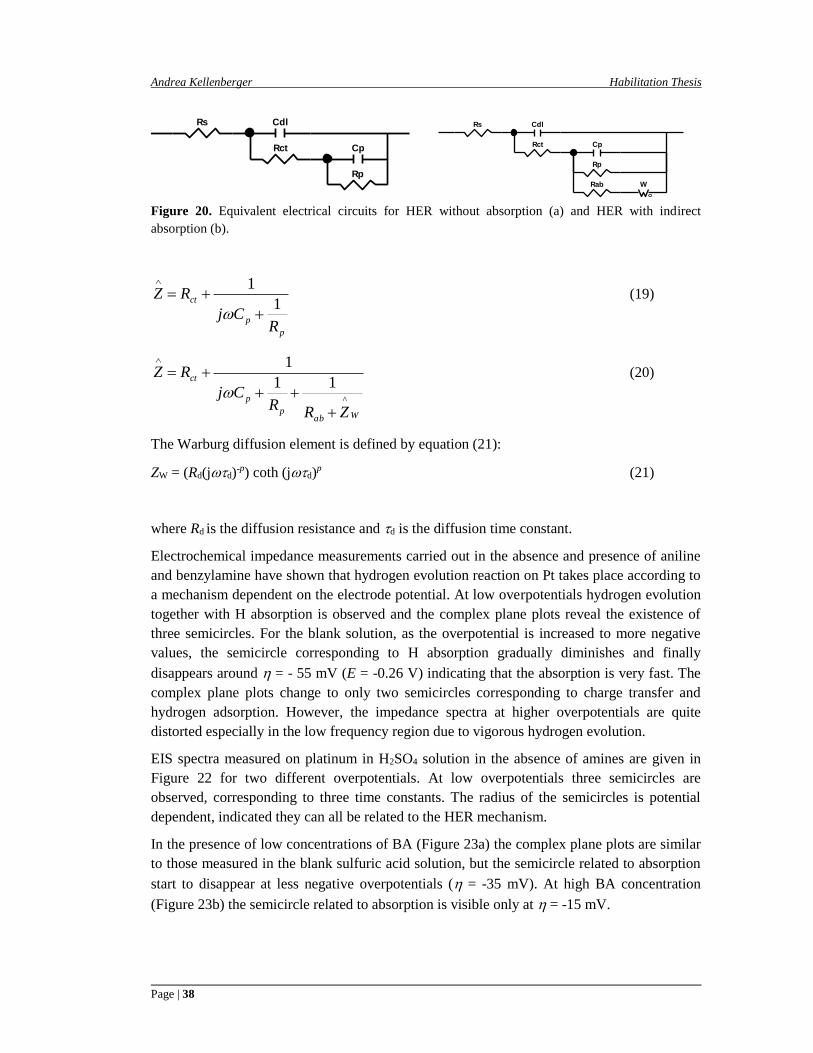
Andrea Kellenberger Habilitation Thesis
Page | 38
Rs Cdl
Rct Cp
Rp
Element Freedom Value Error Error %
Rs Free(+) 0.42766 0.046543 10.883
Cdl Free(+) 2.068E-5 2.4383E-5 117.91
Rct Free(+) 0.097346 0.031187 32.037
Cp Free(+) 0.00023457 0.0001557 66.377
Rp Free(+) 2.214 0.18389 8.3058
Chi-Squared: 0.029959
Weighted Sum of Squares: 2.6664
Data File: D:\Work\Raluca Cretu\IMP-Raluca_nov 2012\C5_T1_024.txt
Circuit Model File: D:\Work\Raluca Cretu\modell H UPD-nou.mdl
Mode: Run Fitting / Selected Points (4 - 52)
Maximum Iterations: 100
Optimization Iterations: 0
Type of Fitting: Complex
Type of Weighting: Calc-Modulus
Rs Cdl
Rct Cp
Rp
Rab W
Element Freedom Value Error Error %
Rs Free(+) 0.42766 0.046543 10.883
Cdl Free(+) 2.068E-5 2.4383E-5 117.91
Rct Free(+) 0.097346 0.031187 32.037
Cp Free(+) 0.00023457 0.0001557 66.377
Rp Free(+) 2.214 0.18389 8.3058
Rab Free(+) 0.078002 0.033339 42.741
W-R Free(+) 0.71983 0.22209 30.853
W-T Free(+) 0.2427 0.12443 51.269
W-P Free(+) 0.36423 0.034802 9.555
Chi-Squared: 0.029959
Weighted Sum of Squares: 2.6664
Data File: D:\Work\Raluca Cretu\IMP-Raluca_nov 2012\C5_T1_024.txt
Circuit Model File: D:\Work\Raluca Cretu\modell H UPD-nou.mdl
Mode: Run Fitting / Selected Points (4 - 52)
Maximum Iterations: 100
Optimization Iterations: 0
Type of Fitting: Complex
Type of Weighting: Calc-Modulus
Figure 20. Equivalent electrical circuits for HER without absorption (a) and HER with indirect
absorption (b).
p
p
ct
RCj
RZ1
1
(19)
Wabp
p
ct
ZRR
Cj
RZ
^
11
1
(20)
The Warburg diffusion element is defined by equation (21):
ZW = (Rd(jd)-p) coth (jd)p (21)
where Rd is the diffusion resistance and d is the diffusion time constant.
Electrochemical impedance measurements carried out in the absence and presence of aniline
and benzylamine have shown that hydrogen evolution reaction on Pt takes place according to
a mechanism dependent on the electrode potential. At low overpotentials hydrogen evolution
together with H absorption is observed and the complex plane plots reveal the existence of
three semicircles. For the blank solution, as the overpotential is increased to more negative
values, the semicircle corresponding to H absorption gradually diminishes and finally
disappears around = - 55 mV (E = -0.26 V) indicating that the absorption is very fast. The
complex plane plots change to only two semicircles corresponding to charge transfer and
hydrogen adsorption. However, the impedance spectra at higher overpotentials are quite
distorted especially in the low frequency region due to vigorous hydrogen evolution.
EIS spectra measured on platinum in H2SO4 solution in the absence of amines are given in
Figure 22 for two different overpotentials. At low overpotentials three semicircles are
observed, corresponding to three time constants. The radius of the semicircles is potential
dependent, indicated they can all be related to the HER mechanism.
In the presence of low concentrations of BA (Figure 23a) the complex plane plots are similar
to those measured in the blank sulfuric acid solution, but the semicircle related to absorption
start to disappear at less negative overpotentials ( = -35 mV). At high BA concentration
(Figure 23b) the semicircle related to absorption is visible only at = -15 mV.

Andrea Kellenberger Habilitation Thesis
Page | 39
0 2 4 6 8 10 12 140
-1
-2
-3
-4
-5
Z"
/
cm
2
Z' / cm2
0.0 0.5 1.0 1.5 2.0 2.5 3.00.0
-0.5
-1.0
Z"
/
cm
2
Z' / cm2
Figure 21. Complex plane plots for HER in blank 0.5 mol L-1 H2SO4 solution, η = -15 mV (a) and η =
-45 mV (b). Open symbols are experimental data and continuous line is simulated by CNLS fitting.
0 2 4 6 8 100
-1
-2
-3
Z"
/
cm
2
Z' / cm2
0 1 2 3 4 5 6 70
-1
-2
Z"
/
cm
2Z' / cm
2
Figure 22. Complex plane plots for HER in 0.5 mol L-1 H2SO4 solution with 10-5 mol L-1 BA (a) and
10-2 mol L-1 BA, η = -15 mV. Open symbols are experimental data and continuous line is simulated by
CNLS fitting.
The phase angle plots are more sensitive in the detection of time constants than complex
plane plots. Figures 24-26 show the phase angle plots for HER at various overpotentials in
blank sulfuric acid solution and at two different concentrations of benzylamine and
respectively aniline. The existence of three relaxation time constants can be also observed in
the phase angle plots, as indicated by the presence of three maxima. The high frequency time
constant is related to charging/discharging of electrical double layer, the intermediate
frequency time constant corresponds to absorption/desorption and the low frequency time
constant to adsorption/desorption of hydrogen at the interface.
10-1
100
101
102
103
104
105
0
-5
-10
-15
-20
-25
-30
-35
= 5 mV
= 15 mV
= 25 mV
= 35 mV
= 45 mV
pah
se a
ng
le /
deg
ree
f / Hz Figure 23. Phase angle plots for HER at increasing overpotentials in blank 0.5 mol L-1 H2SO4 solution.

Andrea Kellenberger Habilitation Thesis
Page | 40
10-2
10-1
100
101
102
103
104
105
0
-5
-10
-15
-20
-25
-30 = 15 mV
= 25 mV
= 35 mV
= 45 mVp
ha
se a
ng
le /
deg
ree
f / Hz
10-2
10-1
100
101
102
103
104
105
0
-5
-10
-15
-20
-25
-30
= -15 mV
= -25 mV
= -35 mV
phase a
ngle
/ d
egre
e
f / Hz Figure 24. Phase angle plots for HER at increasing overpotentials in 0.5 mol L-1 H2SO4 solution with
10-5 mol L-1 BA (a) and 10-2 mol L-1 BA (b).
10-2
10-1
100
101
102
103
104
105
0
-5
-10
-15
-20
-25
-30
-35 = -15 mV
= -25 mV
= -35 mV
= -45 mV
phase a
ngle
/ d
egre
e
f / Hz
10-2
10-1
100
101
102
103
104
105
0
-5
-10
-15
-20
-25
-30 = -15 mV
= -25 mV
= -35 mV
= -45 mVphase a
ngle
/ d
egre
e
f / Hz Figure 25. Phase angle plots for HER at increasing overpotentials in 0.5 mol L-1 H2SO4 solution with
10-5 mol L-1 A (a) and 10-2 mol L-1 A (b).
The frequency of the maximum related to the charge transfer process is around 5 104 Hz in
the blank solution, 4 104 Hz in the presence of BA and 2 104 Hz in the presence of A. The H
absorption is potential dependent, its frequency increases in the blank solution from 7 102 Hz
at low overpotentials to 2 103 Hz at higher overpotentials and completely disappears at more
negative overpotentials (over -55 mV), indicating that absorption becomes very fast. At low
concentrations of BA, H absorption is still visible at low overpotentials and disappears
around -35 mV. At high concentrations of BA and A, the phase angle plots are dominated by
adsorption. The frequency of the maximum corresponding to adsorption is virtually
independent on overpotential and amines concentration with a constant value around 0.2 Hz.
The electrochemical impedance spectra measured at low overpotentials have been modeled
using the EEC given in Figure 21b. The results of the CNLS fitting are listed in Table 11
together with the calculated values of the time constants related to charge transfer ct,
absorption abs and respectively adsorption ads.

Andrea Kellenberger Habilitation Thesis
Page | 41
Table 11. EEC parameter values for HER at = -25 V.
parameter blank 10-5 BA 10-2 BA 10-5 A 10-2 A
RS [Ω cm2] 0.22 0.32 0.30 0.44 0.35
Cdl [F cm-2] 1.32 10-5 1.39 10-5 1.84 10-5 2.80 10-5 1.49 10-5
Rct [Ω cm2] 0.41 0.36 0.10 0.28 0.17
Cp [F cm-2] 2.66 10-4 2.90 10-4 2.35 10-4 4.43 10-4 2.58 10-4
Rp [Ω cm2] 4.40 4.76 3.04 7.87 4.31
Rab [Ω cm2] 0.40 0.22 0.05 0.38 0.07
Rd [Ω cm2] 1.05 0.98 0.43 1.86 0.44
d [s] 0.129 0.253 0.121 0.296 0.065
p 0.32 0.32 0.31 0.33 0.29
2 7.65 10-4 2.08 10-3 7.26 10-3 8.60 10-4 2.14 10-3
ct [ms] 5.4 10-3 5.1 10-3 1.8 10-3 8.0 10-3 2.5 10-3
abs [ms] 0.106 0.063 0.011 0.168 0.018
ads [ms] 1.17 1.38 0.72 3.49 1.11
Analyzing the data from Table 11 it can be observed that the addition of benzylamine and
aniline to the blank solution leads to a decrease of the charge transfer resistance. This effect is
more pronounced as the concentration of amines increases, confirming that both BA and A
have a catalytic effect on HER. Beside charge transfer resistance, resistances related to
absorption and adsorption are also reduced in the presence of amines, due to a higher
concentration of protons available at the interface. The time constant associated with the
charge transfer process has values in the order of microseconds, indicating that charge
transfer reaction takes place very fast. The lower values of ct obtained for BA and A point to
an acceleration of HER in the presence of amines.
In conclusion, the catalytic effect of aniline and benzylamine on HER on platinum has been
evidenced using different electrochemical techniques. Linear polarization curves showed a
reduction of the overpotential for HER of about 50 and 70 mV for benzylamine and
respectively aniline at high concentrations (10-2 mol L-1). The exchange current density has
been found to increase in the presence of amines but a significant effect is observed only at
high concentrations. Detailed analysis of impedance data indicated very fast charge transfer
process in the presence of amine. The differences in the catalytic effect at high and low
concentrations are explained by molecular modeling in terms of surface coverage area and
adsorption of protonated amines at the platinum–electrolyte interface.
1.3. Conclusions
The catalytic enhancement of HER in the presence of catalysts added in the solution has been
demonstrated using different electrochemical techniques such as linear sweep voltammetry
and electrochemical impedance spectroscopy. These catalysts, also called proton carriers,
have the ability to increase the proton concentration in the double electric layer from the
metal-solution interface by transporting the protons from the bulk of the solution to the

Andrea Kellenberger Habilitation Thesis
Page | 42
interface. Aromatic and / or aliphatic amines can act as proton carriers and their catalytic
activity is caused by the lone electron pair of the nitrogen atom.
The originality of our work is related to the following aspects:
(i) we have demonstrated based on the kinetic parameters derived from the Tafel plots and
from electrochemical impedance data that the catalytic effect of the proton carriers is
manifested for both electrode materials with high hydrogen overpotential, such as copper,
but, more important from a practical point of view, even in the case of metals with low
hydrogen overpotential, namely gold and platinum;
(ii) we have explained the catalytic effect of aromatic / aliphatic amines on the hydrogen
evolution reaction based on their molecular parameters obtained by quantum calculation, the
most important being the dipole moment and the surface coverage degree. Thus, the most
pronounced catalytic effect was obtained in the case of amines with a low surface coverage,
which is equivalent to a larger number of molecules present at the interface, so an increased
proton concentration, and respectively for a large dipole moment, which indicates a favorable
orientation of the molecules at the interface, namely with the nitrogen atom and the attached
proton directed towards the metal, where the charge transfer is greatly facilitated.
(iii) we have proposed a more detailed mechanism of hydrogen evolution reaction in the
presence of proton carriers, derived from the mechanism proposed by Stackelberg et al. [67-
69] but taking into account also the direct discharge of hydronium ions.
According to the proposed mechanism, ammonium ions are formed as a result of amines
protonation in the bulk of solution:
H2N–R (aq) + H3O+(aq) → H3N+–R(aq) + H2O (22)
In the electric field between the electrodes, ammonium ions migrate towards cathode, where
they adsorb on the electrode surface, with the nitrogen atoms oriented to the metal surface,
according to the dipole moment, that is in a favorable position for charge transfer process:
H3N+–R(aq) → H3N+–R(ads) (23)
Thereby, at the electrode-electrolyte solution interface, a high concentration of ammonium
ions is reached. Taking into account that H–N bond energy in ammonium ions is lower than
H-O bond in hydronium ions, it can be appreciated that at low current densities, where HER
overpotential is not too large, the charge transfer occurs according to the reaction:
H3N+–R(ads) + e- → H(ads) + H2N–R(ads) (24)
The recombination step of HER could occur chemically (Tafel step):
2H(ads) → H2(ads) (25)
or electrochemically (Heyrovsky step):
H3N+–R(ads) + H(ads) + e- → H2(ads) + H2N–R(ads) (26)
At higher current densities (elevated overpotential), hydronium ions discharge becomes
possible:

Andrea Kellenberger Habilitation Thesis
Page | 43
H3O+(ads) + e- → H(ads) + H2O (27)
followed by Tafel (chemical) or Heyrovsky (electrochemical) desorption:
H(ads) + H3O+(ads) + e- → H2(ads) + H2O (28)
The hydronium ions discharge has as a consequence a local pH increase of the solution
adjacent to the cathode up to values that allow hydrolysis of ammonium ions:
H3N+–R(ads) + H2O → H2N–R(ads) + H3O+(ads) (29)
This reaction helps to keep the concentration of hydronium ions at high values. The neutral
amines diffuse into the bulk solution where the re-protonation reaction (22) occurs.
According to this mechanism and in contrary to Stackelberg’s mechanism, the protonation of
amines can not be the rate determining step of the cathodic process, even at high
overpotentials.
The proposed mechanism of catalytic enhancement of HER in the presence of protonated
aromatic amines is exemplified for the case of aniline as shown in Figure 19.
Figure 26. Mechanism of HER in the presence of proton carriers.
The presence of protonated aniline molecules at the interface increases the concentration of
hydronium ions in the electric double layer. As a result, HER may proceed by discharge of
anilinium cations at low current densities and low overpotentials and by direct discharge of
hydronium ions at high current densities and high overpotentials. Since a high concentration
of anilinium cations is available at the interface this will lead to the enhancement of HER. It
is obvious that an important role in the orientation and adsorption of the protonated amine
molecule at the electrode – electrolyte interface is played by its dipole moment, as it has been
shown by correlations between the catalytic effect and the structure and molecular parameters
of all the investigated amines.
Andrea Kellenberger Habilitation Thesis
Page | 44
2. Contributions on the electrochemical synthesis of polyaniline nanofibers
The results presented within this chapter were obtained in the frame of a research project PN
II Partnership 72-171/2008 entitled “Microporous polyaniline sensors functionalized with
pendant groups, innovative material for use in identification and control of Parkinson's
disease” funded by the Romanian Ministry of Education, Research, Youth and Sports
between 2008-2011, for which I was partner responsible and also a POSDRU/86/1.2/S/58146
project entitled: “Development and implementation of Master program in the field of micro-
and nanomaterials – MASTERMAT”.
The results have been published in 5 ISI indexed papers, as follows:
N. Plesu, A. Kellenberger, M. Mihali, N. Vaszilcsin, Effect of temperature on the
electrochemical synthesis and properties of polyaniline films, Journal of Non-
crystalline Solids 356 (2010) 1081-1088.
A. Kellenberger, N. Plesu, M. Tara Lunga Mihali, N. Vaszilcsin, Synthesis of
polyaniline nanostructures by electrochemical deposition on niobium, Polymer 54
(2013) 3166-3174.
A. Kellenberger, D. Ambros, N. Plesu, Scan rate dependent morphology of
polyaniline films electrochemically deposited on nickel, International Journal of
Electrochemical Science 9 (2014) 6821-6833.
N. Plesu, A. Kellenberger, I. Taranu, B.O. Taranu, I. Popa, Impedimetric detection
of dopamine on poly(3-aminophenyl boronic acid) modified skeleton nickel
electrodes, Reactive & Functional Polymers 73 (2013) 772-778.
M. Tara Lunga Mihali, N. Plesu, A. Kellenberger, G. Ilia, Adsorption of an Azo dye
on polyaniline/niobium substrate, International Journal of Electrochemical Science
10 (2015) 7643-7659.
2.1. Background
Among electronically conducting polymers, polyaniline [70,71] is one of the representatives
that has been intensively investigated due to its simple synthesis, stability at ambient
conditions, unique electrochemical properties and a wide range of promising applications in
the fabrication of electrochemical energy storage devices, electrochemical sensors and
biosensors, electrochromic displays and anticorrosive coatings [72].
In the last years, the researches were focused on nanostructured conducting polymers,
including nanostructured polyaniline, as a result of the increasing interest in nanoscience and
nanotechnologies. The interest for this type of materials is very clearly evidenced in the
mainstream publications. Thus, according to international databases Web of Science and
Scopus, the first references in the literature on the synthesis of conducting polymers in the
form of fibers and "microscopic" tubes occur in 1989. The study reports about the synthesis

Andrea Kellenberger Habilitation Thesis
Page | 45
of polypyrrole and poly-3-methylthiophene in a membrane with cylindrical pores having a
diameter of 1 m [73]. The same synthesis method was applied in 1993 to obtain micro- and
nanofibers of polyaniline [74,75] with electrical conductivity values much higher than those
of the amorphous polymer. In the forthcoming years there is a lack of publications on this
subject, but beginning from 2002 the number of publications grow exponentially up to about
900 publications in the present.
The motivation of research regarding the synthesis and properties of polyaniline nanofibers is
due to their potential applications in micro- and nanoelectronics and for the construction of
sensors, biosensors and biomedical devices [76,77]. It is expected that nanostructured
polyaniline will show net superior properties compared to amorphous polyaniline, or even
unique properties. Several studies have recently shown that going down to nano-level
dimensions, together with a marked increase of the specific surface area, can bring further
improvement of several other properties like conductivity, processability and sensing
properties.
Several methods have been proposed to synthesize polyaniline nanostructures, which can be
divided in template methods and template free methods.
Template synthesis methods imply chemical oxidative polymerization and relay on the use of
insoluble hard templates such as zeolites or polymer membranes with controlled pore size or
soluble soft templates such as various molecules that are able to orient and guide the growth
of nanofibers. Several macromolecules such as polymers, surfactants [78] and DNA
molecules have been used. Although the dimensions and structure of polyaniline nanofibers
can be easily controlled by the dimensions of the template, the disadvantage of this method is
the need for subsequent removal of the template, which can destroy the nanostructures or
may adversely affect essential properties, such as electrical conductivity. A particular case of
the template synthesis is the chemical polymerization in the presence of small amounts of
organic, inorganic or biologic nanofibers. In the presence of this nanoseeds, the polyaniline
morphology change drastically from the usual granular / powder structure to nanostructure.
Nanomaterials used for "seeding" are the most diverse, for example carbon nanotubes
[79,80], polyaniline [81] nanofibers of emeraldine salt or vanadium oxide nanofibers [79].
Template free synthesis methods include chemical or electrochemical oxidative
polymerization. Polyaniline has the ability to form spontaneously nanofibers during chemical
oxidation of aniline, but the structure of the resulting product is strongly influenced by
synthesis conditions, such as: monomer concentration, oxidant nature and concentration, acid
nature and concentration, monomer/oxidant molar ratio, monomer/acid molar ratio, stirring or
the way in which reactants are added. Experimental studies have shown that lower values of
the aniline/oxidant molar ration lead to a less branched structure and longer polyaniline
nanofibers with higher average diameter [82]. On the contrary, polyaniline nanofibers with
small diameter have been obtained for a low addition rate of the oxidant [83]. The use of
different oxidants may also induce improved properties of polyaniline nanofibers or decrease
their diameter. The oxidant commonly used for the chemical synthesis of polyaniline is
ammonium peroxydisulfate but it has been reported that in the presence of iron chloride as
oxidant [84] nanofibers with a diameter of 20 nm have been obtained. Using potassium

Andrea Kellenberger Habilitation Thesis
Page | 46
biiodate as oxidant [85] leads to polyaniline nanofibers with a diameter of 90 nm and
increased conductivity and using hydrogen peroxide as oxidant [86] results in polyaniline
nanofibers with a diameter of 60-80 nm. A particular case of template free synthesis is the
interfacial polymerization, when the reaction occurs at the interface between two immiscible
phases, i.e. an organic phase which contain the dissolved monomer and an aqueous phase
containing the dissolved oxidant [87-90]. Various organic solvents can be used, such as
hexane, toluene, benzene, xylene, diethyl ether, carbon tetrachloride, chloroform, without
affecting the diameter of the resulting polyaniline nanofibers. The diameter of the nanofibers
can be controlled by the nature of the dopant, for example in the presence of hydrochloric
acid the diameter of the nanofibers is 30 nm, whereas in the presence of perchloric acid the
diameter increases to 120 nm [87,88]. Another important aspect in the formation and growth
of nanofibers is the nucleation process [89]. Homogeneous nucleation leads to nanofibers,
while heterogeneous nucleation leads to the formation of granular particles.
Despite the net advantage of chemical method in producing large scale quantities of
polyaniline, the electrochemical methods play a significant role in the preparation and
characterization of polyaniline nanofibers since they offer a very convenient and easy way to
control the synthesis conditions, to tune a well-defined oxidation state and to study the
electrochemical properties of polyaniline nanofibers. Nanostructured conducting homo- or
copolymers of polyaniline have been obtained by template free electrochemical methods such
as cyclic voltammetry [91-93], galvanostatic [94,95] or potentiostatic [96] methods, pulse
galvanostatic or potentiostatic methods [97,98]. The results point out that the nanofibrilar
morphology might be an intrinsic property of electrochemically synthesized polyaniline [96],
however it is strongly affected by synthesis conditions. One of the factors reported to
influence the morphology [98], as well as the diameter and length of nanofibers [93] is the
scan rate in potentiodynamic methods. The mechanism of formation of polyaniline
nanofibers involves two concurrent steps: the formation of nucleation centers and the one-
directional growth of nanofibers [94]. The resulting polymer film has a layered structure,
consisting in one compact, two-dimensional layer which is formed by the horizontal growth
of the nucleation centers and a second loose layer composed of nanofibers formed by vertical
growth [95,96].
2.2. Influence of synthesis conditions on the structure,
morphology and electrochemical properties of polyaniline
films
The synthesis method and processing conditions play an important role in tailoring polymer
properties, i.e. morphology and as a consequence conductivity, which is one of the main
properties of conducting polymers, particularly of polyaniline [99,100].
Different morphologies have been reported for polyaniline obtained by chemical oxidative
synthesis depending on the molar ratio of oxidant to monomer [101]. Also, by changing the
molar ratio of acid to monomer, nanoflakes, nanorods or nanospheres have been obtained in
selenious acid [102] and respectively nanotubes, nanoflakes and nanofiber networks in

Andrea Kellenberger Habilitation Thesis
Page | 47
dichloroacetic acid [103]. Polyaniline nanofibers with diameters of 20-50 nm have been
reported in the presence of soft templates such as polyethylene glycol [104]. It has been
shown that acidity changes in the initial stages of polymerization also have an influence on
polyaniline morphology obtained by interfacial polymerization, allowing a controlled
synthesis of Pani micro/nanostructures [105]. Besides acidity, another factor that affects the
size of polyaniline nanofibers obtained by interfacial polymerization is the polarity of the
organic solvent [106].
The morphology obtained by means of electrochemical synthesis is less varied than with
chemical oxidation methods due to the ease of controlling synthesis parameters. The main
factors reported to affect the morphology in electrochemical synthesis are the nature of the
doping anion [94], the electrode material [11,95], pH [107], scan rate in potentiodynamic
deposition [93,108] and deposition time in potentiostatic deposition [109]. It has been found
that varying the potential scan rate of only the first cycle from 100 to 2 mV s-1 induces
changes from globular to fibrilar-like morphology [110], explained by different nucleation
mechanisms. Frequently reported morphologies for electrochemical deposited polyaniline are
nanofibers or nanofiber networks, as a consequence of the growth mechanism described as a
two stages mechanism [95,96]. In the first stage, after the nucleation sites are deposited on
the electrode surface, they tend to grow predominantly in the horizontal direction and form a
compact 2D polyaniline layer. In the second stage, the polymerization takes place
preferentially in the vertical direction and polyaniline nanofibers grow on the previously
deposited compact layer and not directly on the bare electrode surface.
2.2.1. Effect of acid concentration and monomer/acid ratio
To study the effect of acid concentration and monomer/acid molar ratio, we have synthesized
nanostructured polyaniline films on passivated niobium substrate by potentiodynamic method
in 0.5 and 1 mol L-1 H2SO4 solution and different aniline / acid molar ratios.
The electrochemical polymerization of aniline was performed by cyclic voltammetry using an
Autolab PGSTAT 302N. A standard three-electrode electrochemical cell was used,
containing a working electrode made of Nb disc (A = 1 cm2), two graphite rods as counter-
electrodes and a saturated calomel electrode (SCE) as reference electrode. The
electrochemical synthesis of polyaniline was carried out by cyclic voltammetry at a scan rate
of 50 mV s-1 in two steps corresponding to initiation (I) and growth (G). In a first step the
potential was cycled between 0.500 V and 1.200 V to initiate the polymerization process. In a
second step, the potential range was limited between –0.350 and 0.800 V to avoid the
overoxidation reactions of the polymer chain and to allow further growth of the polymer film.
Pani samples were prepared at two different concentrations of the sulfuric acid solution (0.5
and 1 mol L-1) and at aniline/acid ratio of 0.2, 0.4 and respectively 0.6. The number of
initiation cycles was reduced from 5 to 2 for the last two samples, but the number of growth
cycles remained constant for all the samples. An overview of the corresponding synthesis
conditions is given in Table 12.

Andrea Kellenberger Habilitation Thesis
Page | 48
Table 12. Synthesis conditions and characteristics of the first anodic peak of Pani/Nb films obtained at
different acid concentration and aniline/acid ratio.
Sample H2SO4
[mol L-1]
Aniline
[mol L-1]
molar
ratio
no. of
scans I/G
E*
[V]
i*
[mA cm-2]
Q*
[mC cm-2]
Pani/Nb/1 0.5 0.1 0.2 5/10 0.249 5.3 4.9
Pani/Nb/2 0.5 0.2 0.4 5/10 0.317 16.1 23.6
Pani/Nb/3 0.5 0.3 0.6 5/10 0.342 57.4 88.9
Pani/Nb/4 1 0.2 0.2 5/10 0.362 61.2 98.0
Pani/Nb/5 1 0.4 0.4 2/10 0.298 55.6 113.0
Pani/Nb/6 1 0.6 0.6 2/10 0.375 63.5 145.0
* values are given for the last cycle
It can be observed that increasing the aniline/acid molar ratio leads to an increase of the
current density and charge associated with the first oxidation peak which is an indicator of
the growth of the polymer film. This increase is more obvious at 0.5 mol L-1 acid
concentration and less pronounced at 1 mol L-1 acid concentration. A more important effect is
observed when the acid concentration changes from 0.5 to 1 mol L-1 and the aniline/acid
molar ratio is kept constant.
Figure 27 shows representative examples of cyclic voltammograms for samples Pani/Nb/2
and Pani/Nb/5, obtained during the growth step in the two sulfuric acid solutions of different
concentrations and the same aniline/acid molar ratio.
-0.4 -0.2 0.0 0.2 0.4 0.6 0.8
-5
0
5
10
15
i, m
A c
m-2
E, V vs SCE
a)Pani/Nb/2
-0.4 -0.2 0.0 0.2 0.4 0.6 0.8
-20
-10
0
10
20
30
40
50
60
i, m
A c
m-2
E, V vs. SCE
b)Pani/Nb/5
Figure 27. Potentiodynamic deposition of Pani/Nb samples from a solution of 0.2 mol L-1 aniline in
0.5 mol L-1 H2SO4 (a) and 0.4 mol L-1 aniline in 1 mol L-1 H2SO4 (b). Scan rate 50 mV s-1.
The acid concentration plays an important role in determining the structure of the
electrochemically obtained polyaniline films. This effect can be explained considering the
two step mechanism of polyaniline deposition. In 0.5 mol L-1 sulfuric acid solution, the
initiation step requires more time (a larger number of cycles) and the current densities are
low. At low current densities only a small number of nucleation sites will form on the
electrode surface. Since aniline concentration in the close vicinity of the electrode is
sufficiently high, it is expected that the heterogeneous nucleation of polyaniline will be

Andrea Kellenberger Habilitation Thesis
Page | 49
favored so newly formed polyaniline molecules will preferably grow on the previously
formed particles, leading to a branched structure with agglomerations of granular particles, as
it will be discussed latter based on the SEM analysis. In 1 mol L-1 sulfuric acid solution, the
number of cycles needed for the initiation step is reduced and also a marked increase in the
current is observed. This means that in the initial stages of polymerization, a larger number of
homogeneous nucleation sites are produced, which provide optimal conditions for the linear
growth of the polyaniline nanofibers.
The redox behavior of Pani/Nb samples was studied by cyclic voltammetry in monomer free
electrolyte solution. A classical behavior for conducting polyaniline is observed, as seen in
Figure 28. The first anodic peak is roughly centered at 0.25 V for Pani/Nb/1, 0.32 V for
Pani/Nb/2, 0.33 V for Pani/Nb/3, 0.37 V for Pani/Nb/4, 0.33 V for Pani/Nb/5 and 0.39 V for
Pani/Nb/6. Its position shifts to higher potentials as the thickness of the polymer film
increases.
-0.4 -0.2 0.0 0.2 0.4 0.6 0.8
-20
-10
0
10
20
30
40
50
60
i, m
A c
m-2
E, V/SCE
Pani/Nb/1
Pani/Nb/2
Pani/Nb/3
-0.4 -0.2 0.0 0.2 0.4 0.6 0.8
-40
-30
-20
-10
0
10
20
30
40
50
60 Pani/Nb/4
Pani/Nb/5
Pani/Nb/6i, m
A c
m-2
E, V/SCE
Figure 28. Cyclic voltammograms of Pani/Nb samples in monomer free 0.5 mol L-1 H2SO4 solution.
Scan rate 50 mV s-1.
The structure and morphology of the polyaniline films prepared on niobium were
characterized by scanning electron microscopy (SEM) using a FEI INSPECT S electron
microscope. Figure 29 gives the SEM images of the polyaniline films electrodeposited on
niobium for different acid concentrations and aniline / acid ratios.
The structure and morphology of the polyaniline samples depend on the working conditions.
In 0.5 mol L-1 H2SO4 solution the polyaniline films show a more granular structure and in 1
mol L-1 H2SO4 solution a fibrilar structure. Figure 29(a) and 29(b) show the morphology of
polyaniline films deposited from 0.5 mol L-1 acid solution and low aniline / acid ratios. A
very thin and smooth green polyaniline film was obtained under these conditions, but the
SEM images reveal an inhomogeneous structure containing both granular and fibrilar
features. The polyaniline deposit consists of two distinct layers: a compact 2D layer
composed of globular structures with diameters between 100 and 200 nm very adherent to the
electrode surface and a loosely bound layer. Figure 29(c) corresponds to a polyaniline sample
obtained at higher aniline / acid ratios, therefore the thickness of the polyaniline film is larger

Andrea Kellenberger Habilitation Thesis
Page | 50
and the lowermost layer is not visible any more. The top layer is composed of short and
highly branched nanofibers with diameters of about 100 nm combined with granular
particles.
Figure 29. SEM images of polyaniline nanofibers electrodeposited on Nb by cyclic voltammetry in 0.5
mol L-1 H2SO4: (a) Pani/Nb/1, (b) Pani/Nb/2, (c) Pani/Nb/3 and in 1 mol L-1 H2SO4: (d) Pani/Nb/4, (e)
Pani/Nb/5, (f) Pani/Nb/6.
Generally, the SEM micrographs for the polyaniline films obtained in 0.5 mol L-1 acid
solution point out to a heterogeneous nucleation, leading to a prevalence of the granular
particles and to a coral-like morphology. The concentration of aniline has little effect on the
polyaniline structure, only the film thickness increases with increasing aniline concentration.
In 1 mol L-1 sulfuric acid solution the structure of polyaniline changes and the nanofibers are
clearly distinguished. These results are consistent with those obtained for the chemical
polymerization route, where the most important factor affecting the formation of polyaniline
nanofibers is the acid concentration. It has been observed that lowering acid concentration the
fraction of granular particles starts to increase and finally prevails over the nanofibers
quantity in the final product [87]. Figure 29(d) shows an entangled network of nanofibers
having a mean diameter of 70 nm. As it can be seen in the top right corner of the SEM image,
most of the nanofibers have a large number of nodules which can act as nucleation sites for
future fibers. As the aniline concentration is increased the polyaniline nanofibers in Figure
29(e) become well separated, less branched, with a smooth surface and a length more than 10
times higher than the diameter.

Andrea Kellenberger Habilitation Thesis
Page | 51
Some of the properties of electrochemically synthesized polyaniline films on Nb have been
determined by electrochemical methods. Capacitance represents the ability of polyaniline to
store electric charge. The mass specific capacitance of the polymer films was calculated as:
m
CCS (30)
where C is the film capacitance determined by cyclic voltammetry and electrochemical
impedance spectroscopy and m is the mass of deposited polyaniline, which was estimated
assuming a current efficiency for the electropolymerization process of 100%, using Faraday’s
law of electrolysis:
F
QMMm am
5.02
5.0
(31)
where Mm and Ma are the molar mass of aniline monomer (93.13 g mol-1) and hydrogen
sulfate (97 g mol-1), Q is the deposition charge and F is the Faraday constant (F = 96485 C
mol-1).
A comparison of capacitance and mass specific capacitance values determined by cyclic
voltammetry and impedance spectroscopy is given in Table 13.
Table 13. Capacitance values of Pani/Nb films determined from CV and EIS data.
Sample Pani/Nb/1 Pani/Nb/2 Pani/Nb/3 Pani/Nb/4 Pani/Nb/5 Pani/Nb/6
CCV [F cm-2] – 0.0458 0.161 0.244 0.143 0.267
CEIS* [F cm-2] 0.0067 0.0423 0.162 0.259 0.141 0.356
CS, CV [F g-1] – 125 80 154 174 117
CS, EIS [F g-1] 113 115 80 164 172 156
δ [m] 0.13 0.84 3.56 4.40 1.76 5.70
* capacitance values at E = 0.5 V.
It can be observed that all Pani samples showed high capacitance values. The capacitance
values are correlated to the morphology of Pani films. Generally lower specific capacitances
are obtained for less concentrated H2SO4 solutions, where the morphology of the deposited
films is granular. For a higher concentration of the sulfuric acid solution, the morphology
changes to nanofibrilar and the specific capacitances are higher than for granular Pani films.
Electrochemical impedance measurements were carried out in the frequency range from 104
Hz to 0.1 Hz and AC voltage amplitude of 10 mV, at several electrode potentials, placed in
the region were the polyaniline films are in the conductive form. Typical examples of EIS
spectra taken for the Pani films at an electrode potential of 0.4 V are given in Figure 30.
The shape of the complex plane impedance plots for Pani films depends on both polymer film
thickness and morphology. As the thickness of the Pani films increases, the imaginary

Andrea Kellenberger Habilitation Thesis
Page | 52
impedance values decrease, indicating an increase of the low frequency capacitance, which
was already observed for Pani [111] and substituted Pani derivatives [112]. For Pani films
with a fibrilar morphology the Nyquist plots are characterized by the presence of a slightly
deviated vertical line at low frequencies preceded by a small part with a slope of nearly 45° at
intermediate frequencies.
0 50 100
0
-50
-100
-150
-200
-250
-300
0 10
0
-10
-20
-30
-40
1 2 3
0
-2
-4
-6
-8
-10
ZIm
,
cm
2
ZRe
, cm2
a) c)b)
0 1 2 3
0
-2
-4
-6
-8
0 1 2 3 4
0
-2
-4
-6
-8
-10
-12
0 1 2 3
0
-2
-4
-6
-8e) f)
ZIm
,
cm
2
ZRe
, cm2
d)
Figure 30. Complex plane plots of (a) Pani/Nb/1, (b) Pani/Nb/2, (c) Pani/Nb/3, (d) Pani/Nb/4, (e)
Pani/Nb/5 and (f) Pani/Nb/6 films measured in 0.5 mol L-1 H2SO4 solution at E = 0.4 V.
Several equivalent electrical circuits have been proposed to describe the impedance of Pani
films accounting for the processes that take place at the Pani/electrolyte interface and inside
the Pani film. For oxidized Pani films it has been found that fast charge transfer and

Andrea Kellenberger Habilitation Thesis
Page | 53
counterions diffusion at the Pani/electrolyte interface are responsible for the high-frequency
response and slow diffusion / migration of counterions inside the Pani layer is responsible for
the low frequency response of Pani films [111, 113-115].
It can be observed that the diffusion resistance is correlated to Pani layer thickness and
morphology. It has greater values for thin films Pani/Nb/1 and Pani/Nb/2, where a compact
layer is formed on the metal surface and the ions motion inside the film is slower. It has much
lower values for fibrilar Pani films where due to high porosity the electrolyte has an easier
access inside the film. Pani/Nb/3 shows an intermediate behaviour, more close to fibrilar Pani
since its structure is different from Pani/Nb/1 and Pani/Nb/2. The diffusional capacitances are
directly related to the layer thickness and film morphology, as it can be seen in Figure 31.
Figure 31. Dependence of the diffusional capacitance on film thickness for granular and fibrilar Pani
films obtained on Nb.
For both granular and fibrilar Pani films, the capacitance increases linearly with the film
thickness, but it is evident that fibrilar Pani films with similar thickness have a higher
capacitance.
2.2.2. Effect of scan rate
We have studied the effect of potential scan rate on the morphology and properties of
polyaniline films electrochemically deposited on nickel electrode. Polyaniline samples have
been obtained by cyclic voltammetry at different scan rates of 10, 25, 50 and 100 mV s-1 from
a solution of 0.1 mol L-1 aniline in 0.5 mol L-1 H2SO4. All measurements were performed in a
conventional one-compartment, three-electrode electrochemical cell equipped with a nickel
disc working electrode (A = 0.64 cm2), two graphite rods as counter electrode and
silver/silver chloride (Ag/AgCl) as reference electrode. The electrochemical deposition of
polyaniline took place in two steps. In the first step, cyclic voltammograms were recorded in

Andrea Kellenberger Habilitation Thesis
Page | 54
a large potential window from –0.15 V to 1.25 V, corresponding to the induction or initiation
of the polymerization reaction. In the next step, during the growth of the polymer film, the
upper potential limit was shifted to a lower value of 0.85 V, to avoid the oxidative
degradation reactions and consecutive cyclic voltammograms were taken in a narrower
potential window. The prepared samples are denoted as Pani/Ni/10, Pani/Ni/25, Pani/Ni/50
and respectively Pani/Ni/100, indicating the scan rate applied in the potentiodynamic scan
during the deposition of the polymer films. An overview of the corresponding synthesis
conditions is given in Table 14.
Table 14. Synthesis conditions and characteristics of the first peak of Pani/Ni films obtained at
different scan rates.
Sample scan rate
[mV s-1]
no. of
scans I/G
Ea*
[V]
Ec*
[V]
ia*
[mA cm-2]
Q*
[mC cm-2]
Pani/Ni/10 10 3/3 0.290 0.077 16.5 117.1
Pani/Ni/25 25 3/4 0.275 0.070 16.8 41.6
Pani/Ni/50 50 3/9 0.258 0.055 17.3 21.7
Pani/Ni/100 100 3/13 0.258 0.052 16.0 11.9
* values are given for the last cycle.
A comparison of the last cycle recorded during the electrochemical deposition of Pani/Ni
samples is given in Figure 32, together with the dependence of the charge corresponding to
the first anodic peak versus the number of scans.
-0.2 0.0 0.2 0.4 0.6 0.8
-0.01
0.00
0.01
0.02 Pani/Ni/10
Pani/Ni/25
Pani/Ni/50
Pani/Ni/100
i, A
cm
-2
E, V/Ag/AgCl Figure 32. Potentiodynamic deposition of Pani/Ni samples from a solution of 0.1 mol L-1 aniline in 0.5
mol L-1 H2SO4. Last scan of the cyclic voltammograms (a) and dependence of the charge on the
number of scans (b).
Typical CVs have been recorded during the growth of Pani films, characterized by the
presence of two pairs of redox peaks corresponding to redox transitions from
leucoemeraldine to emeraldine and from emeraldine to pernigraniline. Also, an intermediate
pair of redox peaks is assigned to secondary degradation reactions. The potential peak of the
first redox transition shifts slightly to more positive potentials as the scan rate decreases. It

Andrea Kellenberger Habilitation Thesis
Page | 55
can be also noticed that the intensity of the degradation peaks is more pronounced at lower
scan rates.
The redox behavior of Pani/Ni samples was studied by cyclic voltammetry in monomer free
electrolyte solution. A classical behavior for conducting polyaniline is observed, as seen in
Figure 33. The first anodic peak is roughly centered at 0.38 V for Pani/Ni/10, at 0.34 V for
Pani/Ni/25 and at 0.26 V for Pani/Ni/50 and Pani/Ni/100. Its position shifts to higher
potentials as the thickness of the polymer film increases.
-0.2 0.0 0.2 0.4 0.6 0.8
-0.03
-0.02
-0.01
0.00
0.01
0.02
0.03
0.04
0.05 Pani/Ni/10
Pani/Ni/25
Pani/Ni/50
Pani/Ni/100
i, A
cm
-2
E, V/Ag/AgCl
Figure 33. Cyclic voltammograms of Pani/Ni samples in monomer free 0.5 mol L-1 H2SO4 solution.
Scan rate 50 mV s-1.
The morphology and structure of the polyaniline films prepared on nickel were characterized
by field emission scanning electron microscopy (FE-SEM) using a QUANTA FEG 250
scanning electron microscope. Figure 34 gives the FE-SEM images of the polyaniline films
electrodeposited on nickel using different scan rates.
Polyaniline samples obtained at scan rates of 10, 25 and 50 mV s-1 show a porous, open,
highly branched nanofibrilar structure, whereas samples obtained at 100 mV s-1 are composed
of very short nanofibrils, almost completely merged with each other, resulting in a compact,
stratified structure. For Pani/Ni/10 there is a high amount of long and smooth nanofibers
while for Pani/Ni/50 some inclusions of granular polyaniline could be observed. The
nanofiber network tends to be more compact and with less free-volume as the scan rate is
increased. The average diameter and length of the nanofibers decrease with the
potentiodynamic scan rate applied for deposition in the following order: Pani/Ni/10 (140 nm
/ 1.35 μm) > Pani/Ni/25 (100 nm / 1.06 μm) > Pani/Ni/50 (90 nm / 0.72 μm). These results
are consistent with literature data [93] and can be explained based on the mechanism of
nucleation and growth of the polymer film. At low scan rates the number of nucleation sites
generated at the surface of the nickel electrode is small, but their dimensions are bigger since
the electrode is maintained for a longer time at the oxidation potential value. At higher scan
rates the number of nucleation sites is higher, but their size is reduced. As a result a larger

Andrea Kellenberger Habilitation Thesis
Page | 56
number of nanofibers with smaller diameters will be obtained. Also, some of the nanofibers
present nodules on their surface, which can act as nucleation sites for future fibers leading to
a highly branched structure.
Figure 34. FE-SEM images of polyaniline films: Pani/Ni/10 (a), Pani/Ni/25 (b), Pani/Ni/50 (c) and
Pani/Ni/100 (d).
The electrochemical properties of polyaniline nanofibers deposited on nickel were
investigated by cyclic voltammetry and electrochemical impedance spectroscopy in monomer
free H2SO4 solution. The mass specific capacitance was determined using equations (30) and
(31).
A comparison of capacitance and mass specific capacitance values determined by cyclic
voltammetry and impedance spectroscopy is given in Table 15.
Table 15. Capacitance values of Pani/Ni films determined from CV and EIS data.
Sample Pani/Ni/10 Pani/Ni/25 Pani/Ni/50 Pani/Ni/100
CCV [F cm-2] 0.233 0.085 0.036 0.018
CEIS* [F cm-2] 0.255 0.095 0.041 0.023
CS, CV [F g-1] 655 715 585 490
CS, EIS [F g-1] 717 799 666 626
δ [m] 2.55 0.85 0.44 0.22
(c)
(a) (b)
(d)

Andrea Kellenberger Habilitation Thesis
Page | 57
It can be observed that, as expected, the capacitance of Pani films increases proportionally to
film thickness and mass of deposited Pani. However, when mass specific capacitance values
are compared, the highest capacitance is obtained for Pani 25, and the lowest capacitance is
obtained for Pani 100 due to different morphologies. The nanofibers’ aspect ratio (L/D)
varies in the order: Pani/Ni/25 (10.6) > Pani/Ni/10 (9.6) > Pani/Ni/50 (8.0) which might
explain the highest capacitance and lowest resistance of Pani/Ni/25. It has been reported that
high conductivities are obtained for branched Pani nanofibers with high aspect ratio, where
charge carriers are free to move throughout the length of nanofibers and further extend to the
branch regions, leading to an increased delocalization of charge [116]. The ability to transport
charge carriers along the polymer backbone due to an extended conjugation length represents
the intrachain conductivity, whereas the ability of carriers to hop between polymer chains
represents the interchain conductivity.
Electrochemical impedance measurements were conducted to determine the effect of
deposition scan rate on the charge transfer resistance and specific capacitance of synthesized
polyaniline films. EIS measurements were carried out in the frequency range from 0.1 Hz to
100 kHz and AC voltage amplitude of 10 mV. For each spectrum 60 points were collected,
with a logarithmic distribution of 10 points per decade. Figures 35-38 show impedance
spectra of Pani/Ni samples at different electrode potentials in the range of 0.2 to 0.6 V.
0 2 4 6
0
-2
-4
-6
-8
-10
-12
-14
-16
ZIm
/
cm
2
ZRe
/ cm2
E = 0,2 V
0 2 4 6
0
-2
-4
-6
-8
-10
-12
-14
-16E = 0,3 V
0 2 4 6
0
-2
-4
-6
-8
-10
-12
-14
-16E = 0,4 V
0 2 4 6
0
-2
-4
-6
-8
-10
-12
-14
-16E = 0,5 V
0 2 4 6
0
-2
-4
-6
-8
-10
-12
-14
-16E = 0,6 V
Figure 35. Complex plane plots of Pani/Ni/10 measured in 0.5 mol L-1 H2SO4 solution at different
electrode potentials.
The impedance behavior in the potential window from 0.2 to 0.6 V is assumed to be a
characteristic of Pani/electrolyte interface and of Pani layer pseudocapacitance [117,118].
The changes in impedance parameters were used to interpret processes taking place inside
polyaniline and at the polyaniline/electrolyte interface as a consequence of morphology
changes.

Andrea Kellenberger Habilitation Thesis
Page | 58
0 2 4 6
0
-2
-4
-6
-8
-10
-12
-14
-16
-18E = 0,6 VE = 0,5 VE = 0,4 VE = 0,3 V
ZIm
/
cm
2
ZRe
/ cm2
E = 0,2 V
0 2 4 6
0
-2
-4
-6
-8
-10
-12
-14
-16
-18
0 2 4 6
0
-2
-4
-6
-8
-10
-12
-14
-16
-18
0 2 4 6
0
-2
-4
-6
-8
-10
-12
-14
-16
-18
0 2 4 6
0
-2
-4
-6
-8
-10
-12
-14
-16
-18
Figure 36. Complex plane plots of Pani/Ni/25 measured in 0.5 mol L-1 H2SO4 solution at different
electrode potentials.
0 50
0
-50
-100
-150
-200
ZIm
/
cm
2
ZRe
/ cm2
E = 0.2 V
0 5 10
0
-10
-20
-30
-40E = 0.6 VE = 0.5 VE = 0.4 VE = 0.3 V
0 5 10
0
-10
-20
-30
-40
0 5 10
0
-10
-20
-30
-40
0 5 10
0
-10
-20
-30
-40
Figure 37. Complex plane plots of Pani/Ni/50 measured in 0.5 mol L-1 H2SO4 solution at different
electrode potentials.
The shape of the complex plane plots depends on both polymer film thickness and
morphology. For Pani/Ni/10, Pani/Ni/25 and Pani/Ni/50, with similar morphologies, the
complex plane plots are characterized by the appearance of a high frequency semicircle
followed by a near vertical line at low frequencies, at all investigated electrode potentials.
The impedance response at high frequencies corresponds to the charge transfer at the
polyaniline/electrolyte interface and low frequency response is dominated by the polyaniline
film capacitance. As the film thickness decreases, the imaginary part of the impedance
increases, indicating a decrease of the low frequency capacitance. The diameter of the high
frequency semicircle is potential dependent decreasing up to potential of 0.4 – 0.5 V, in
agreement with the transition from leucoemeraldine to the conductive emeraldine form of

Andrea Kellenberger Habilitation Thesis
Page | 59
Pani. A completely different behavior is observed for Pani/Ni/100, where an incomplete arc
of a semicircle with larger diameter can be seen.
0 20 40
0
-20
-40
-60
-80
-100
ZIm
/
cm
2
ZRe
/ cm2
E = 0.2 V
0 20 40
0
-20
-40
-60
-80
-100E = 0.5 VE = 0.4 VE = 0.3 V
0 20 40
0
-20
-40
-60
-80
-100
0 20 40
0
-20
-40
-60
-80
-100
0 20 40
0
-20
-40
-60
-80
-100E = 0.6 V
Figure 38. Complex plane plots of Pani/Ni/100 measured in 0.5 mol L-1 H2SO4 solution at different
electrode potentials.
Table 16. Charge transfer and capacitance values of Pani/Ni films obtained by fitting EIS data.
Sample Rct [Ω cm2] T [F cm-2 s(n-1)]
0.2 V 0.3 V 0.4 V 0.5 V 0.6 V 0.2 V 0.3 V 0.4 V 0.5 V 0.6 V
Pani/Ni/10 3.47 1.44 1.14 1.03 1.37 0.268 0.255 0.261 0.318 0.288
Pani/Ni/25 3.13 1.15 0.82 0.74 1.05 0.100 0.095 0.095 0.123 0.110
Pani/Ni/50 11.2 3.50 2.97 3.11 4.67 0.046 0.042 0.041 0.052 0.047
Pani/Ni/100 231 237 301 387 392 0.026 0.023 0.023 0.030 0.027
The impedance data from Table 16 indicate that the charge transfer resistance of Pani/Ni
samples obtained at a potential scan rate of 10, 25 and 50 mV s-1 decreases up to an electrode
potential of 0.4 – 0.5 V, where polyaniline is in its conductive form, emeraldine, and
increases again at more positive potentials. The lowest values of charge transfer resistance
and highest values of capacitance are obtained for Pani/Ni/25 and Pani/Ni/10, with a highly
porous, nanofibrilar morphology, whereas for Pani/Ni/100 the charge transfer resistance
values are two orders of magnitude higher, corresponding to a much lower conductivity,
explained by its compact morphology.
The lower resistance and higher capacitance of Pani films obtained at low scan rates are a
result of different morphology. It has been shown that conductivity and apparent charge
carrier mobility are enhanced for nanofibrilar Pani as compared to granular Pani having the
same oxidation levels [119]. In fibrilar morphology the chains are extended, more ordered
and allow the existence of delocalized states along the chain length direction. In granular

Andrea Kellenberger Habilitation Thesis
Page | 60
morphology the chains are coiled up which tends to localize the electronic states [120], thus
explaining the higher conductivity of polyaniline nanofibers.
The morphology changes induce different properties of polyaniline films. Thus, films
deposited at lower scan rates show high values of surface related capacitances, due to the
increase of both thickness and electrochemically active surface area. However, comparing
mass related capacitances, the best results are obtained for Pani/Ni/25. The optimum scan rate
applied for deposition of Pani in this work, leading to best performances in terms of specific
capacitance and charge transfer resistance, was found to be 25 mV s-1 and it is supposed to
originate from an optimum combination of intrachain and interchain transport of charge
carries.
2.2.3. Effect of temperature
Temperature is one of the synthesis parameter that can be varied in both chemical and
electrochemical synthesis of polyaniline. It has been reported that polyaniline obtained at
sub-zero temperatures should exhibit a higher conductivity, therefore several studies have
been conducted at low temperatures [121-123]. Another study indicated that polyaniline with
high conductivity can be prepared if the chemical oxidative polymerization of aniline is
carried out at temperatures above room temperature with an optimum between 50 and 60°C
[124]. In case of electrochemical synthesis the effect of temperature is to increase the rate of
the electrochemical polymerization. In case of the electrochemical polymerization of
substituted anilines a 4.2% per degree increase of the polymer rate formation is obtained
[125] although ortho-coupling and degradation reactions are also favored by temperature.
Another aspect is related to the effect of thermal treatment on the conductivity of polyaniline.
It has been reported that the conductivity of electrochemically prepared polyaniline films
increases at moderately high temperatures up to 70°C [126] or even 100°C [127]. At elevated
temperatures a marked decrease of the conductivity is observed generally due to molecular
structure changes such as deprotonation, oxidation, chain scission and cross-linking reactions
[128-131]. Other studies on the thermal stability of polyaniline films have shown that 80°C
is the minimum temperature at which a noticeable decrease on the electrochemical activity
was observed [132].
The aim of our study was to investigate the effect of moderately high temperatures on the
electrochemical synthesis of polyaniline and to determine the electrochemical properties of
Pani films obtained at different temperatures. Cyclic voltammetry has been applied to study
the redox reactions of Pani/Pt films and to evaluate their pseudocapacitances in dependence
of the synthesis temperature. Electrochemical impedance spectroscopy was the method of
choice for studying electrical resistance, double layer capacitance and pseudocapacitance of
polyaniline films.
The electrochemical polymerization of aniline was carried out by cyclic voltammetry using
an Autolab PGSTAT 302N. All measurements were performed in a conventional one-
compartment, three-electrode electrochemical cell equipped with a Pt disc working electrode

Andrea Kellenberger Habilitation Thesis
Page | 61
(A = 0.1963 cm2), a Pt counter electrode (A = 1 cm2) and a saturated calomel electrode (SCE)
as reference electrode. Cyclic voltammograms were recorded at a scan rate of 50 mV s-1 from
0.1 mol L-1 aniline in 0.5 mol L-1 H2SO4 solutions. For the first three cycles the potential
range was from –0.200 V to 1.200 V to allow the initiation of the polymerization process,
afterwards the reversal potential was decreased to 0.800 V to avoid the overoxidation
reactions of the polymer chain and seven consecutive cycles were recorded. Polyaniline
films obtained at three different working temperatures (25, 40 and 60°C) are denoted as
Pani/Pt/25, Pani/Pt/40 and Pani/Pt/60, respectively.
Cyclic voltammograms obtained for the electro-oxidation of aniline on platinum electrode at
different temperatures are given in Figure 39. The first three scans correspond to the initiation
of polymerization and the consecutive seven scans to the growth of Pani film on the surface
of the platinum electrode.
-0.2 0.0 0.2 0.4 0.6 0.8 1.0 1.2
-0.005
0.000
0.005
0.010
i, A
cm
-2
E, V/SCE
1
2
3
ipa
A
-0.2 0.0 0.2 0.4 0.6 0.8 1.0 1.2
-0.015
-0.010
-0.005
0.000
0.005
0.010
0.015
0.020
0.025
i, A
cm
-2
E, V/SCE
ipa
1
2
3
B
Figure 39. Potentiodynamic deposition of Pani/Pt samples from a solution of 0.1 mol L-1 aniline in 0.5
mol L-1 H2SO4 at different temperatures: 25°C (a) and 40°C (b). Scan rate 50 mV s-1.
The appearance of an anodic peak in the first positive potential scan is assigned to the
oxidation of aniline with the formation of the anilinium radical-cation. The characteristics of
this peak are temperature dependent, i.e. the onset potential decreases (0.80 V at 25°C, 0.77
V at 40° and 0.72 V at 60°C) and the peak potential shifts to more negative values (1.07 V at
25°C to 0.98 V at 40°C and 0.96 V at 60°C) as the temperature increases. This behavior
indicates that the initiation step is favored by temperature.
In the following 4 to 10 scans, the cyclic voltammograms obtained at different temperatures
are rather similar in shape, with differences concerning the peaks position and their intensity.
The first anodic peak is related to the formation of radical-cations in the polymer chain, the
second peak is attributed to degradation processes in the polymer chain due to the oxidation
of intermediary compounds or secondary oxidation products. The third anodic peak may be
attributed to the oxidation of aniline on the platinum electrode covered with polyaniline, with
the exception of the first cycle where the oxidation takes place on a clean platinum surface.

Andrea Kellenberger Habilitation Thesis
Page | 62
A comparison of the last cycle recorded during the electrochemical deposition of Pani/Pt
samples is given in Figure 40, together with the dependence of the charge corresponding to
the first anodic peak versus the number of scans.
-0.2 0.0 0.2 0.4 0.6 0.8
-0.01
0.00
0.01
0.02
0.03 Pani/Pt/25
Pani/Pt/40
Pani/Pt/60
i, A
cm
-2
E, V/SCE
0 1 2 3 4 5 6 7 8 9
0.00
0.01
0.02
0.03
0.04
0.05
Q,
C c
m-2
Number of scans
Figure 40. Last scan of the cyclic voltammograms during electrochemical deposition of Pani/Pt
samples at different temperatures(a) and dependence of the charge on the number of scans (b).
An overview of the three anodic peak potentials and currents as a function of temperature is
given in Table 17.
Table 17. Characteristics of the anodic peaks of Pani/Pt films obtained at different temperatures.
Sample EaI
[V]
EaII
[V]
EaIII
[V]
iaI
[mA cm-2]
iaII
[mA cm-2]
iaIII
[mA cm-2]
QI
[mC cm2]
Pani/Pt/25 0.170 0.450 0.750 7.7 0.9 3.3 18.8
Pani/Pt/40 0.175 0.450 0.740 20.2 2.2 5.4 43.6
Pani/Pt/60 0.190 0.440 0.690 22.0 1.2 8.2 50.0
The obtained data indicate a shift of the first peak potential to slightly more positive values as
the temperature increases and a marked increase of peak current as the temperature increases
from 25 to 40°C. The second anodic peak corresponding to degradation processes in the
polymer film is less influenced by temperature concerning its position and height.
The charge corresponding to the first anodic peak increases linearly with the number of
cycles, as shown in Figure 40, indicating a continuous growth of the polymer film on the
electrode surface. Increasing the temperature from 25 to 40°C leads to a doubling of the
slope, pointing to a higher reaction rate, while further increasing the temperature up to 60°C
during the electropolymerization has only a slight effect on the charge involved in the
process.
The effect of temperature on the electrochemical polymerization of aniline has been
discussed before for temperatures between 0 and 40°C [121]. The authors reported that the
polymerization rate increased strongly from 0°C to 20°C but it was followed by a decrease at

Andrea Kellenberger Habilitation Thesis
Page | 63
temperatures higher that 25°C. They explained this behavior due to the formation of a
polymer film with lower conductivity and poorer electroactivity as the temperature of
synthesis increased. A similar behavior has been observed in case of polyaniline synthesized
by the pulse galvanostatic method [97]. In this case the increase of the synthesis temperature
leads to the increase of the anodic current peak for the first redox transition of PANI up to
20°C followed by a decrease at higher temperatures.
Our results doesn’t indicate a decrease of the polymerization rate, neither a higher rate of
decomposition at moderately high temperatures. This facts are supported by the increase of
the charge corresponding to the first anodic peak and by the ratio between the height of the
first and second anodic peaks. This ratio is an indicator of the rate of polymer film growth
versus its degradation. The highest value is obtained for Pani/Pt/60 pointing out to the
formation of a polymeric film with improved electroactive properties.
The redox behavior of Pani/Pt samples was studied by cyclic voltammetry in monomer free
electrolyte solution. A classical behavior for conducting polyaniline is observed, as seen in
Figure 41. The anodic peaks are roughly centered at 0.16 V and 0.75 V for Pani/Pt/25, at 0.19
and 0.73 V for Pani/Pt/40 and respectively 0.24 V and 0.66 V for Pani/Pt/60.
-0.2 0.0 0.2 0.4 0.6 0.8
-0.01
0.00
0.01
0.02
0.03
i, A
cm
-2
E, V/SCE
Pani/Pt/25
Pani/Pt/40
Pani/Pt/60
Figure 41. Cyclic voltammograms of Pani/Pt samples in monomer free 0.5 mol L-1 H2SO4 solution.
Scan rate 50 mV s-1.
The intensity of the first anodic peak corresponding to the reversible transition from
leucoemeraldine (LE) to emeraldine (EB) is dependent on the synthesis temperature and the
peak potential shifts to more positive values as the synthesis temperature increases. The peak
corresponding to the emeraldine / pernigraniline (PE) redox transition is also temperature
dependent, showing a shift to more negative values for higher synthesis temperatures. This
shift of the first and third anodic peaks points out to a narrower region of electroactivity for
polymers synthesized at higher temperatures, as it has been also observed from impedance
measurements. Also, two pairs of less defined redox peaks situated at about 0.45 and 0.5 V,
independently on the temperature of synthesis, correspond to the redox transitions of
degradation products formed during the electropolymerization of aniline. Usually these

Andrea Kellenberger Habilitation Thesis
Page | 64
intermediate products are identified as p-quinone/p-hydroquinone and p-quinoneimine/p-
aminophenol redox couples.
The electrochemical properties of Pani/Pt samples obtained at different synthesis
temperatures were investigated by cyclic voltammetry and electrochemical impedance
spectroscopy in monomer free H2SO4 solution. The mass specific capacitance was
determined using equations (30) and (31) and the corresponding values are given in Table 18.
Table 18. Capacitance values of Pani/Pt films determined from CV and EIS data.
Sample Pani/Pt/25 Pani/Pt/40 Pani/Pt/60
CCV [F cm-2] 0.0301
0.0342
636
723
0.34
0.072
0.066
611
560
0.84
0.096
0.110
697
799
0.98
CEIS [F cm-2]
CS, CV [F g-1]
CS, EIS [F g-1]
δ [m]
It can be observed that, as expected, the capacitance of Pani films increases proportionally
with the synthesis temperature, due to the increase of film thickness and mass of deposited
Pani.
Electrochemical impedance measurements were conducted to determine the effect of
temperature of synthesis on the charge transfer resistance and specific capacitance of Pani/Pt
samples. EIS measurements were carried out in the frequency range from 0.1 Hz to 100 kHz
and AC voltage amplitude of 10 mV. For each spectrum 60 points were collected, with a
logarithmic distribution of 10 points per decade. Figures 42-44 show impedance spectra of
Pani/Pt samples at different electrode potentials in the range of 0.2 to 0.6 V.
The complex plane plots of Pani/Pt/25 shown in Figure 42 point out to a typical behavior of
conducting polyaniline films, characterized by a pure resistive response at high frequencies
and a pure capacitive response at low frequencies.
The complex plane plots of Pani/Pt/40 and Pani/Pt/60 films at 0.1 V show the presence of a
depressed semi-circle in the high frequency part of the spectrum followed by a vertical line at
low frequencies. This is an indication that at 0.1 V the polyaniline films are not completely
conductive, showing an intermediate behavior, between conducting and insulating state.
These findings are in good agreement with the cyclic voltammograms of Pani/Pt/40 and
Pani/Pt/60 shown in Figure 41, where it can be seen that the onset potential and respectively
the peak potential corresponding to the oxidation of leucoemeraldine to emeraldine are
shifted to more positive potential as compared to Pani/Pt/25. Increasing the electrode
potential, the high frequency semicircle disappears for both Pani/Pt/40 and Pani/Pt/60, but
appears again starting from 0.6 V for Pani/Pt/60. This points out to a restriction of the
electroactivity range for polymers synthesized at higher temperatures.

Andrea Kellenberger Habilitation Thesis
Page | 65
0 10
0
-10
-20
-30
-40
-50
-60E = 0.4 VE = 0.3 VE = 0.2 V
ZIm
/ O
hm
cm
2
ZRe
/ Ohm cm2
E = 0.1 V
0 5 10
0
-10
-20
-30
-40
-50
-60
0 5 10
0
-10
-20
-30
-40
-50
-60
0 5 10
0
-10
-20
-30
-40
-50
-60
0 5 10
0
-10
-20
-30
-40
-50
-60E = 0.6 VE = 0.5 V
0 5 10
0
-10
-20
-30
-40
-50
-60
Figure 42. Complex plane plots of Pani/Pt/25 measured in 0.5 mol L-1 H2SO4 solution at different
electrode potentials.
0 5
0
-5
-10
-15
-20
-25
-30
ZIm
/ O
hm
cm
2
ZRe
/ Ohm cm2
0 5
0
-5
-10
-15
-20E = 0.6 VE = 0.2 V E = 0.3 VE = 0.1 V
0 5
0
-5
-10
-15
-20E = 0.4 V
0 5
0
-5
-10
-15
-20
0 5
0
-5
-10
-15
-20
Figure 43. Complex plane plots of Pani/Pt/40 measured in 0.5 mol L-1 H2SO4 solution at different
electrode potentials.

Andrea Kellenberger Habilitation Thesis
Page | 66
0 10 20 30
0
-10
-20
-30
-40
-50
-60
-70E = 0.1 V
ZIm
/ O
hm
cm
2
ZRe
/ Ohm cm2
0 5
0
-5
-10
-15E = 0.4 VE = 0.3 V E = 0.6 V
0 5
0
-5
-10
-15
0 5
0
-5
-10
-15
Figure 44. Complex plane plots of Pani/Pt/60 measured in 0.5 mol L-1 H2SO4 solution at different
electrode potentials.
The impedance data were fitted to an electrical equivalent circuit characteristic for the
intermediate form of Pani and some of the electrical parameters (charge transfer resistance
and capacitance of polymer films) obtained after fitting are given in Table 19.
Table 19. Charge transfer and capacitance values of Pani/Pt films obtained by fitting EIS data.
Sample Rct [Ω cm2] T [F cm-2 s(n-1)]
0.1 V 0.2 V 0.3 V 0.4 V 0.6 V 0.1 V 0.2 V 0.3 V 0.4 V 0.6 V
Pani/Pt/25 0.26 0.36 0.38 0.40 0.31 0.022 0.017 0.015 0.017 0.022
Pani/Pt/40 4.34 0.19 0.22 0.21 0.19 0.079 0.063 0.053 0.062 0.069
Pani/Pt/60 33.1 1.37 0.52 0.36 1.42 0.098 0.127 0.111 0.114 0.112
The electrochemical impedance measurements showed that the synthesis temperature has an
effect on the electrical properties of the films. Pani/Pt/25 is in the conductive state over the
entire studied potential range although the anodic charge passed until 0.1 V is low. This may
be explained by the property of Pani films to give a fully conducting response even if only a
small fraction of Pani is oxidized. For Pani/Pt/60 the conductive range is restricted to 0.3 to
0.5 V. The best results in term of film resistance, capacitance and conductivity range were
obtained for Pani/Pt/40.

Andrea Kellenberger Habilitation Thesis
Page | 67
2.2.4. Effect of substrate
It is generally accepted that the substrate plays a special role in the formation and growth of
polyaniline nanofibers, however there are only scarce studies regarding the effect of electrode
material on the formation and growth of electrochemically deposited polyaniline nanofibers.
Generally, the electrochemical synthesis of polyaniline nanofibers is carried out on
conventional substrates such as platinum, gold or stainless steel. The electrochemical
deposition of granular polyaniline is reported on a large variety of electrode materials
including nickel, graphite, glassy carbon, carbon fibers, and indium tin oxide.
In our studies we have tried to elucidate the mechanism of polyaniline nanofiber growth on
niobium. Niobium is a transitional metal with hydrogen overpotential much higher than
platinum, which is the usual substrate used for polyaniline deposition. This offers the
possibility to extend the cathodic potential limit to more negative values during the synthesis
and characterization of polyaniline films. This is not possible for polyaniline films deposited
on platinum, since at negative potentials the hydrogen evolution reaction interferes with
polymer deposition. Also, niobium shows the property to form vertically aligned nanofibers
of niobium oxide, when subjected to thermal treatment [133], which lead to the question if
niobium oxide formed during electrochemical oxidation of niobium can play a role in the
nucleation and growth of polyaniline nanofibers.
The electrochemical oxidation of niobium in sulfuric acid leads to the formation of a passive
layer of niobium oxide. Figure 45 shows cyclic voltammograms obtained on niobium,
revealing a typical shape for anodic passivation curves, with three distinct regions.
Figure 45. Cyclic voltammogram of Nb in 0.5 M H2SO4, scan rate 50 mV s-1.
The first region is the so-called active region, where the current density increases
exponentially with the applied potential and an oxidation peak is formed at 0.2 V,
corresponding to the dissolution of Nb. The second or passive region, where the anodic
current reaches a plateau and is independent of the applied potential, corresponds to the
electrochemical passivation of Nb according to the reaction [134]:

Andrea Kellenberger Habilitation Thesis
Page | 68
2Nb + 5H2O → Nb2O5 + 10H+ + 10e-
The third region (here not shown) corresponds to the oxygen evolution reaction which takes
place on the passivating oxide layer. In the following scans, the current has a constant value
closed to zero and neither additional oxidation nor reduction peaks can be seen since Nb is
covered by a passivating layer of niobium oxide.
Literature data indicate different chemical composition of the passive oxide film formed on
niobium, depending on the environment and treatment conditions. It seems that, for the
electrochemical passivation of Nb in acidic aqueous solution, the main component of the
passivating oxide film is Nb2O5 [134,135].
The three dimensional morphology of the electrochemically passivated niobium surface was
examined by atomic force microscopy using a Nano surf EasyScan 2 Advanced Research
AFM. A comparison has been made to the surface of niobium oxidized in air.
The surface roughness is calculated using the equation (32) for the mean square root
roughness:
1
0
1
0
2,
1 M
k
N
l
lkrms yxzMN
S
(32)
where N and M are the number of crystal axes x and y respectively;
z is the average height of crystallites;
xk and yl are maximum and minimum deviations from the average crystallite.
The AFM images of the niobium surface oxidized in air and of the niobium surface after
electrochemical passivation are given in Figures 46-48.
The value of the root mean square (RMS) surface roughness decreases from 70 nm for Nb
oxidized in air to 7 nm for passivated Nb. The average surface grain size of niobium oxide is
higher than 200 nm for Nb oxidized in air and lower than 100 nm for electrochemically
passivated Nb. This surface with smaller grain size could explain the growth of polyaniline
nanofibers on electrochemically passivated Nb. This conclusion is also supported by the SEM
analysis, which shows that the mean diameter of the polyaniline nanofibers is about 100 nm.
Polyaniline was electrochemically deposited on the passivated niobium substrate from
sulfuric acid solutions of 0.5 and respectively 1 mol L-1 concentrations and different
aniline/acid molar ratios, as described in section 2.2.1. The morphology of the obtained
polyaniline films was analyzed by scanning electron microscopy, as seen in Figure 29 and
reveals a granular structure of polyaniline films obtained in 0.5 mol L-1 sulfuric acid and a
fibrilar structure in 1 mol L-1 sulfuric acid solution.

Andrea Kellenberger Habilitation Thesis
Page | 69
Figure 46. AFM images of the Nb electrode oxidized in air. 2D (a) and 3D image (b).
Figure 47. AFM images of the electrochemically passivated Nb. 2D (a) and 3D image (b).
Figure 48. AFM images of Nb electrode oxidized in air (a) and electrochemically passivated (b).
Structural characterization of the polyaniline nanofibers grown on niobium substrate was
carried out by Fourier-transformed infrared (FTIR) spectroscopy using an IFS 66v
spectrometer (Bruker Optics, Germany) equipped with a DTGS detector working at room
temperature. For each spectrum 100 interferograms with a resolution of 4 cm-1 were sampled.
Figure 49 shows FTIR spectra of polyaniline electrochemically synthesized on passivated

Andrea Kellenberger Habilitation Thesis
Page | 70
niobium and platinum, in identical conditions regarding solution concentration, scan rate and
number of scans, together with FTIR spectra of a commercial emeraldine base (EB) with a
weight average molecular weight of 50.000. The main vibrations observed in the mid-
infrared region, along with their assignments are presented in Table 20.
Figure 49. FTIR spectra of electrochemically synthesized Pani/Nb and Pani/Pt and of commercial
emeraldine base.
FTIR studies conducted on Pani nanotubes [136,137], nanofibers [94,138,139], nanowires
and nanorods, revealed that the backbone structure of all nanostructured Pani samples is
similar to that of conventionally prepared granular Pani [140]. However, in case of
nanostructured Pani there are indications that phenazine units may initiate the growth of Pani
nanotubes [141] and hydrogen bonding between neighboring Pani chains may play an
important role in stabilizing the supramolecular nanotubular structure [136,137,141].
Table 20. Main FTIR bands of Pani/Nb and Pani/Pt and their assignments.
Pani/Nb Pani/Pt EB Assignment [136-141]
- 3426 s 3430 s free ν(N–H)
1570 s 1570 s 1588 s ν(C=C) in N=Q=N
1482 s 1490 s 1495 s ν(C=C) in N–B–N
1467 m - 1466 w, sh ν(C=N) in Phz
1448 m 1450 vw, sh 1447 w, sh ring stretching in Phz-type ring
1414 w, sh - 1413 w, sh
1372 m 1372 m 1375 m ν(C–N) in QBQ
1293 s 1295 s 1305 s ν(C–N) in QBQ, QBB, BBQ
12321 m 12391 m 12382 m 1 ν(C−N•+) in polaron lattice / 2 ν(C–N) in BBB
1128 s 1130 s 1160 s δ(C–H) in 1,4-subst B ring
1040 b 1040 b - ν(SO3-)
815 m 817 m 828 s γ(C–H) in 1,4-subst B ring
495 m 498 m 500 m out-of-plane ring def vib in 1,4-disubst ring
ν, stretching; δ, in-plane bending; γ, out-of-plane bending; B, benzene ring; Q, quinoid ring;
Phz, phenazine; s, strong; m, medium; w, weak; vw, very weak; sh, shoulder; b, broad.

Andrea Kellenberger Habilitation Thesis
Page | 71
Structural characterization of Pani/Nb samples carried out by FTIR spectroscopy revealed the
presence of similar vibrations to that of conventional polyaniline but also additional
vibrations at 1448, 1414 and 780 cm-1 related to phenazine-like units, which are known to
play an important role in the formation of polyaniline nanotubes.
The formation of Pani nanofibers on the surface of oxidized niobium may be explained based
on the theory of phenazine nucleates, considering also the hydrophobicity of niobium oxide.
For chemically prepared Pani, the model of phenazine nucleates [142] proposes that in the
first stages of polymerization oligomers are produced that may contain phenazine rings
formed by ortho-coupling followed by intramolecular cyclization reactions. Such oligomers
are called nucleates, they are hydrophobic and adsorb preferentially on hydrophobic surfaces.
The nucleates self-assemble to produce stacks stabilized by - interaction between
phenazine units and the growth of Pani nanostructures starts from this pre-organized
nucleates [142].
The hydrophobic surface of passivated niobium favors the aniline adsorption and
concentration on the niobium oxide grains. The formation of nucleates (oligomers), involves
neutral aniline molecules, and not the anilinium cations. In the initial stage of oxidation the
aniline molecules link in ortho or para-positions with the formation of dimers, trimers or
phenazine-containing oligomers, depending on acid concentration. The trimer can add a
molecule of aniline, with the formation of a tetramer containing the phenazine unit. At high
acid concentration it will be protonated and converts to an initiation center. This fragment
starts the growth of Pani chains. The propagation step involves anilinium cations that are
added to the growing chains exclusively in para-positions but only at sufficiently high acidity
(1 mol L-1). At low acid concentration the ortho-linkage of anilinium cations is present and
this leads to a heterogeneous growth resulting in a prevalence of granular particles.
Similar findings have been reported for electrochemically synthesized Pani on hydrophobic
nanodiamond ultradispersed particles [143] which also promotes the formation of -stacked
oligomer aggregates and induces the production of one-dimensional nanostructures.
Therefore, it is proposed that the niobium oxide particles formed during electrochemical
oxidation of niobium act as hydrophobic interfaces for the adsorption of phenazine nucleates
which play a key role in the growth of polyaniline nanofibers.
2.3. Applications of electrochemically synthesized
polyaniline films
2.3.1. Electrochemical sensors
Conducting polymers have a high application potential in chemical and biological sensors
[144]. In case of polyaniline, the only conducting form is the oxidized form, emeraldine salt,
which is obtained in acidic conditions. Deprotonation results in a decrease of charge carriers
along the polymer chains and leads to lower conductivities, this effect is very strong in case
of polyaniline [144]. This kind of pH sensitivity of electrical and optical properties is

Andrea Kellenberger Habilitation Thesis
Page | 72
unfavourable for application in biosensors, because most bioassays must be performed in
neutral or slightly acidic conditions. In order to overcome this disadvantage, functionalization
strategies were adopted. In some studies N-substituted anilines were used instead of aniline
and it was found that the alkyl chain, which is covalently bonded to the nitrogen atom,
prevents the formation of the emeraldine base (EB) form, and finally the obtained polymer is
not pH sensitive [145]. Other studies revealed that polymerization of aniline monomers
functionalized with a boron moiety lead to poly(aniline boronic acid) PABA [146], a polymer
which exhibits redox activity also in solutions with neutral pH [147]. Electrochemically
synthesized PABA was used in the detection of fluoride [148,149], iodide [150], saccharides
[151,152], butylamine [153] and dopamine [154,155] based on the analyte interactions with
the boronic acid functionality. Most of the papers investigate the electropolymerization of
aminophenylboronic acid (APBA) on noble electrodes (platinum or gold) and most of the
developed sensor are either amperometric or potentiometric sensor.
In our studies we have developed a method to prepare a sensitive electrode based on PABA,
which we have tested for the detection of dopamine. Our method consists in the
electrochemical deposition of two layers of conducting polymers, first a polyaniline layer
deposited on smooth or skeleton nickel electrodes and then a sensitive PABA layer. This
approach has been also used for the preparation of an amperometric protein sensor, obtained
by the application of two separate polymer layers, one of polypyrrole and one of poly-
aminophenylboronic acid on screen-printed platinum electrodes [156]. In our work, we have
used a skeleton nickel substrate for the deposition of polymer films, which ensures an active
area much larger than the geometric surface area. This kind of surface offers at the same time
high area and also highly active catalytic centres. Similar porous metallic matrices have been
used in our group before for the electrodeposition of Pani films [157]. The use of such
substrates is beneficial for dopamine sensor design, since a high surface area will lead to a
higher concentration of boronic groups and to a better sensitivity.
The skeleton nickel electrodes were prepared from a smooth nickel plate, immersed in a bath
of molten zinc (at 450°C) for 30, 60 and respectively 90 minutes. The skeleton structure was
obtained by dissolving the zinc from the Ni-Zn alloy formed during thermal diffusion using a
30% NaOH solution at 70-80°C until complete reaction.
The skeleton electrodes were used for the two-step deposition of Pani (10 initiation cycles
and 10 growth cycles) from 0.1 mol L-1 aniline in 0.5 mol L-1 H2SO4 solution at a scan rate of
100 mV s-1. Paba was then electrochemically generated on top of the Pani layer from 0.02
mol L-1 aminophenylboronic acid in 0.5 mol L-1 H2SO4 for 30 cycles. For comparison a
similar Pani-Paba layer was deposited on smooth nickel substrate.
The prepared electrodes with two layers of conducting polymers are further referred to as
Ni/0/Paba on smooth nickel and Ni/30/Paba, Ni/60/Paba and Ni/90/Paba on skeleton nickel.
Cyclic voltammograms recorded during the two-step synthesis of Pani-Paba electrodes are
given in Figure 50.

Andrea Kellenberger Habilitation Thesis
Page | 73
Figure 50. Two-step potentiodynamic deposition of Pani/60/Paba sample, consisting of Pani initiation
and growth (1a and 1b) followed by Paba growth (2).
The nature of substrate had a strong impact on the structure and electrochemical properties of
Paba films. Cyclic voltammetry and electrochemical impedance spectroscopy showed that for
Paba films deposited on the skeleton substrate about 2.5 times higher current densities and
lower charge transfer resistances have been obtained, indicating a higher surface area.
The morphology of Paba films was investigated by SEM using a FEI Inspect S microscope.
Typical SEM images of granular polymer are shown in Figure 51.
Figure 51. SEM images of Paba modified electrodes: Ni/0/Paba (a) and Ni/30/Paba (b).
The morphology of Paba film obtained on smooth Ni reveals a compact structure, consisting
of an inner barrier layer and an outer porous layer. The outer layer contains microscopic
pores with a closed cell structure, and the barrier layer is compact (Figure 51(a)) and it is
associated to a very large charge transfer resistance, as obtained from EIS data. Using
skeleton nickel as substrate affects the morphology of deposited Paba films. Thus, the outer

Andrea Kellenberger Habilitation Thesis
Page | 74
porous layer becomes predominant (Figure 51(b)) and so the boronic groups are exposed to
the interaction with dopamine, which is a prerequisite to enhance the sensitivity of sensor.
The modified skeleton Ni/Paba films have been tested for the detection of dopamine at
neutral pH. It is generally accepted that the detection mechanism of dopamine on Paba
modified electrodes does not rely on direct oxidation of dopamine on electrodes but on the
high affinity binding of dopamine to the boronic acid groups, due to the boronic acid – diol
complexation [158] that leads to the formation of an anionic ester, as shown in Figure 52.
* *
B
OH
n
OH
R'
OH
OH
* *
B
O
n
OR'
OH
HOH H++ + +
-
PABA DA Acid-diol complex
Figure 52. Selective binding of dopamine by Paba and formation of boronate ester.
It is expected that the involvement of boronic acid moiety in the complexation equilibrium
will decrease the electroactivity of the Paba film and this will affect the impedance values.
Also, the resulting boronate ester sterically hinders the conformational changes of the
polymer backbone during oxidation/reduction, leading to a decrease of the electrochemical
activity, which is in agreement with the results of Ali et al. [159]. Accordingly, Paba
modified electrodes can be used in the development of non-oxidative sensors for dopamine,
because binding the dopamine molecules changes the properties of the polyaniline backbone
(i.e. conductivity) thus providing signal transduction for molecular detection.
The impedance spectra were recorded for Ni/0/Paba and Ni/30/Paba in phosphate buffer at
pH = 7.4 in the presence of various concentrations of dopamine, between 10-4 and 10-10 mol
L-1 as shown in Figure 53.
Figure 53. Complex plane plots for Ni/0/Paba (a) and Ni/30/Paba (b) in phosphate buffer solution at
pH = 7.4 and different concentrations of dopamine.

Andrea Kellenberger Habilitation Thesis
Page | 75
A gradual increase of the impedance with dopamine concentration is observed, due to
immobilization of dopamine by the boronic acid units available at the interface. This leads to
an increase of the charge transfer resistance which can be determined form the impedance
data as a function of dopamine concentration. Calibration curves of Rct versus concentration
have been constructed, given in Figure 54.
Figure 54. Calibration curves of Rct versus dopamine concentration for Ni/0/Paba and Ni/30/Paba
modified electrodes.
A linear response has been obtained for DA concentrations between 10-5 and 10-10 mol L-1,
with a correlation coefficient of 0.994 for Ni/0/Paba and 0.980 for Ni/30/Paba and a detection
limit of 1 × 10⁻¹⁰ mol L-1. The sensitivity obtained from the slope of the calibration curves
was 12.3 kΩ mol-1 for Ni/0/Paba film and increased to 205.4 kΩ mol-1 for Ni/30/Paba film.
Amperometric detection tests of dopamine have been also carried out on the Ni/Paba
modified electrodes showing a linear response in the concentration range of 10-5 to 10-9 mol
L-1 DA for Ni/0/Paba and between 10-6 and 10-9 mol L-1 DA for Ni/30/Paba.
We have found that the redox current decreases with the DA concentration, suggesting that
DA is not oxidized but is bonded to the boronic acid groups forming the boronate ester,
which reduces the electrochemical activity of the polymer backbone. However, because the
differences in current are quite reduced using amperometric detection, the impedimetric
detection seems to be more favourable. Significantly large differences are usually obtained by
EIS technique, based on the inverse relation of the impedance with the current, i.e., ΔR(Z) =
ΔV/ΔI [160]. It has been demonstrated that EIS measurements can provide significantly more
sensitive responses than cyclic voltammograms for the detection of several biomolecules
[161,162]. Our results have shown that EIS technique allowed the extension of the
concentration ranges for detection of dopamine with one order of magnitude in both high and
low concentration ranges.
Both smooth and skeleton modified electrodes give a linear response for DA concentrations
between 10-5 and 10-10 mol L-1 in aqueous phosphate buffer solution at pH = 7.4. However,
the slope of the calibration curves is higher for the Paba-skeleton nickel electrodes, showing
that a larger specific surface area, where the density of boronic groups is higher, improves the
sensorial response.

Andrea Kellenberger Habilitation Thesis
Page | 76
2.3.2. Adsorption of dyes
Synthetic dyes generally present a complex aromatic molecular structure, are stable and hard
to biodegrade, so the presence of dye toxic wastes in aquatic environments remains nowadays
a real problem. As a consequence, an important subject of researches in this field is related to
the removal of these compounds from the environment. Various technologies have been
proposed for the treatment of dye-containing effluents, such as ion exchange, adsorption,
precipitation, biodegradation, membrane filtration, coagulation, flocculation, etc. Different
types of adsorbents have been used for the removal of dyes, among them are also conducting
polymers, such as polyaniline. Nanostructured conducting polymers present an increasing
interest, due to their enhanced properties, which might be completely different from the
properties of corresponding macroscopic form [76,77]. Nanomaterials based on conducting
polymers offer a large surface area and an improved electrical conductivity.
The removal of organic pollutants from wastewaters using conducting polymers is based on
chemical and physical interaction of dye molecules with conducting polymers. Several
reports have shown the possibility to use nanostructured polyaniline for the removal of both
anionic sulphonated dyes and cationic dyes [163-166] from aqueous solutions. Also,
nanocomposites of polyaniline with starch [167] chitosan [168] but also hybrid organic-
inorganic composites [169-171] have been successfully used for the removal of dyes from
synthetic effluents.
In our studies we have used nanostructured polyaniline films electrochemically deposited on
niobium, for the adsorption of an azo dye. The adsorption process was studied by
electrochemical impedance spectroscopy, which was used to evaluate the values of surface
coverage θ at different dye concentrations and to obtain the adsorption isotherms. Impedance
was chosen as measurement technique for this study because it is quantitative, non-
destructive and allows to determine the dielectric properties of an insulating layer present on
the surface of a working electrode.
The studied dye is a diazo dye derived from 4,4’-diaminobenzanilide and its chemical
structure is given in Figure 55.
Figure 55. Chemical structure of azo red dye.
The values of surface coverage θ, corresponding to different concentrations of dye were used
to get best linearity isotherms. The values of surface coverage θ were obtained from
impedance measurements according to equation (33):
oio CCC / (33)

Andrea Kellenberger Habilitation Thesis
Page | 77
where Co is the capacitance at time t = 0 and Ci is the capacitance at any moment.
The adsorption of azo red dye was studied under open circuit potential conditions and the
adsorption profile in time was investigated. The impedance plots for PANI electrode in
solutions containing different concentrations of azo dye red are shown in Figure 56.
0 2500 5000 7500 10000 12500 15000 17500
-10000
-8000
-6000
-4000
-2000
0
2000
4000
6000
8000
10000
0 min
5 min
10 min
15 min
20 min
25 min
30 min
35 min
40 min
50 min
60 min
70 min
Zim
, o
hm
Zre, ohm
0 5000 10000 15000 20000 25000
-2000
0
2000
4000
6000
8000
10000
12000
0 min
5 min
10 min
15 min
20 min
25 min
30 min
35 min
40 min
50 min
60 min
70 min
Zim
, o
hm
Zre, ohm
0 1000 2000 3000 4000 5000 6000 7000 8000
-1000
-500
0
500
1000
1500
2000
2500
3000
3500
4000
4500
5000
0 min
5 min
10 min
15 min
20 min
25 min
35 min
40 min
50 min
60 min
70 min
Zim
, o
hm
Zre, ohm
0 1000 2000 3000 4000 5000 6000 7000 8000
-1000
-500
0
500
1000
1500
2000
2500
3000
3500
4000
4500
0 min
5 min
10 min
15 min
20 min
25 min
30 min
35 min
40 min
50 min
60 min
70 min
Zim
, o
hm
Zre, ohm
Figure 56. Complex plane plots of Pani/Nb electrode as a function of time for different concentrations
of azo dye: (a) 1 × 10⁻⁵ mol L-1; (b) 2 × 10⁻⁵ mol L-1; (c) 3 × 10⁻⁵ mol L-1 and (d) 5 × 10⁻⁵ mol L-1.
The impedance spectra show the presence of a high frequency semicircle attributed to the
electrode-solution interface and a low frequency inductive loop usually attributed to physical
phenomena such as adsorption.
The impedance data were modeled by an electrical equivalent circuit and parameters such as
double layer capacitance have been determined. The evolution of double layer capacitance of
Pani/Nb electrode and of surface coverage degree during the adsorption of azo dye is
presented in Figure 57.

Andrea Kellenberger Habilitation Thesis
Page | 78
0 50 100 150 200 250 300 350
2.0x10⁻¹¹
4.0x10⁻¹¹
6.0x10⁻¹¹
8.0x10⁻¹¹
1.0x10⁻¹⁰
1.2x10⁻¹⁰
1.4x10⁻¹⁰
1.6x10⁻¹⁰
1.8x10⁻¹⁰
2.0x10⁻¹⁰
2.2x10⁻¹⁰
2.4x10⁻¹⁰
2.6x10⁻¹⁰
Cd
l, F
.cm
-2
Time, min.
1x10⁻⁵M
2x10⁻⁵M
3x10⁻⁵M
5x10⁻⁵M
0 50 100 150 200
0.0
0.1
0.2
0.3
0.4
0.5
0.6
0.7
Time, min.
1x10⁻⁵M
2x10⁻⁵M
3x10⁻⁵M
5x10⁻⁵M
Figure 57. Dependence of double layer capacitance (a) and surface coverage (b) as a function of
adsorption time for different dye concentrations.
The double layer capacitance decreases in time due to the adsorption of organic molecules on
the Pani/Nb surface, because adsorption causes a decrease of the local dielectric constant,
since water molecules are replaced by dye molecules. The decay of double layer capacitance
in time shows two distinct regions: a first region of adsorption up to 40 minutes where double
layer capacitance decreases exponentially in time, followed by a plateau region from 40 min
to 270 min. The variation of the surface coverage is reciprocal of capacitance decay and
complete saturation appears after 40 minutes.
Attempts have been made to fit the surface coverage values using several isotherms,
including Langmuir, Temkin, Frumkin, and Flory-Huggins isotherms, expressed by equations
(34) – (37) given below:
CK
C
ads
1
(34a) (Langmuir isotherm)
CKR
ads
L
1
1
(34b) (Langmuir isotherm)
KCa
lnln1
(35) (Temkin isotherm)
aK
C
ln
1ln
(36) (Frumkin isotherm)
1logloglog xxK
C (37) (Flory–Huggins isotherm)

Andrea Kellenberger Habilitation Thesis
Page | 79
where θ is the surface coverage, C = Cdye is the dye concentration, Kads is the adsorption
equilibrium constant and a is the molecular interaction constant expressing the interaction
between adsorbed and adsorbing molecules. In Flory–Huggins isotherm x represents the
number of adsorbed water molecules replaced by one molecule of dye and y is the number of
dye molecules occupying one active site. The linear plots obtained using the five adsorption
isotherms are given in Figure 58.
1.0x10⁻⁵
2.0x10⁻⁵
3.0x10⁻⁵
4.0x10⁻⁵
5.0x10⁻⁵
4.0x10⁻⁵
5.0x10⁻⁵
6.0x10⁻⁵
7.0x10⁻⁵
8.0x10⁻⁵
9.0x10⁻⁵
Cd
ye
/, m
ol.L
-1
Cdye, mol.L-1
Langmuir isotherm
-11.6 -11.4 -11.2 -11.0 -10.8 -10.6 -10.4 -10.2 -10.0 -9.8
0.2
0.3
0.4
0.5
0.6
0.7
lnC, mol.L-1
Temkin isotherm
0.25 0.30 0.35 0.40 0.45 0.50 0.55 0.60 0.65 0.70
10.41
10.42
10.43
10.44
10.45
10.46
10.47
10.48
10.49
ln(
/(C
(1-
))
Frumkin isotherm
-0.45 -0.40 -0.35 -0.30 -0.25 -0.20 -0.15 -0.10
4.10
4.15
4.20
4.25
4.30
4.35
4.40
4.45
log
/C
log(1-)
Flory- Huggins isotherm
Figure 58. Langmuir (a), Temkin (b), Frumkin (c) and Flory–Huggins (d) isotherms for adsorption of
azo red dye on Pani/Nb electrode.
The Langmuir adsorption isotherm (R2 = 0.998) was found to be suitable for our experimental
data and based on the value obtained for the adsorption equilibrium constant the Gibbs free
energy of adsorption (ΔGoads), was calculated using equation (38):
adsads KRTLnG 5.55 (38)
where R is the universal gas constant (8.314 J mol-1 K-1) and T is the absolute temperature in
Kelvin, Kads is the adsorption equilibrium constant, Goads is the standard free energy of
adsorption, 55.5 is the concentration of water in the solution expressed in mol dm-3.
The value of Goads gives indications about the nature of interactions between adsorbate and
adsorbent. Values lower than -20 kJ mol-1 usually indicate a physical adsorption based on

Andrea Kellenberger Habilitation Thesis
Page | 80
electrostatic interactions between charged molecules and a charged surface, whereas value
higher than -40 kJ mol-1 indicate chemisorption, which takes place due to charge sharing or
transfer from the molecules to the surface as a coordinate type of bond.
The values of Goads and Kads obtained from Langmuir isotherm (Go
ads ~ - 36.38 kJ mol-1 and
Kads ~33.7 kmol-1) indicate that adsorption of azo red dye on Pani/Nb is a spontaneous
process and takes place via a combination of physical and chemical adsorption but mainly
due to physical adsorption.
2.4. Conclusions
The electrochemical synthesis of polyaniline nanofibers has been studied in regard of
influence of synthesis conditions on the structure, morphology and electrochemical properties
of the resulting polyaniline films. The results obtained have shown that polyaniline
nanofibers can be obtained by electrochemical synthesis on different electrode materials
under specific conditions of each substrate.
The originality of our work is related to the following aspects:
(i) we have investigated the electrochemical polymerization of aniline on a novel transitional
metal substrate such as niobium and we have established the optimum conditions in terms of
acid concentration and monomer / acid ratio to obtain polyaniline nanofibers with a mean
diameter of 70 nm. Since niobium shows a hydrogen overpotential much higher than
platinum, which is the conventional substrate for polyaniline deposition, this gave us the
possibility to extend the cathodic potential limit to more negative values during the synthesis
and characterization of polyaniline films without interference of hydrogen evolution reaction.
(ii) we have explained the growth of polyaniline nanofibers on passivated niobium surface by
the theory of phenazine nucleates. Electrochemical passivation results in the formation of
hydrophobic niobium oxide particles with an average surface grain size bellow 100 nm as
determined by AFM measurement, which closely matches the diameter of polyaniline
nanofibers determined by SEM. We have proposed that hydrophobic niobium oxide induces
the preferential adsorption of phenazine nucleates and promotes the nucleation of polyaniline
nanofibers and we have found evidence about the presence of phenazine-like units in the
structure of polyaniline nanofibers as indicated by characteristic FTIR vibrations.
(iii) we have found that capacitance values, which indicate the ability of polyaniline films to
store electrical charges, are much higher for nanostructured polyaniline films as compared to
those with granular structure.
(iv) we have developed a method for the preparation of an impedimetric sensor for dopamine,
using a two-step electrochemical deposition, first a polyaniline layer and then a sensitive
poly(aminophenyl boronic acid) layer and demonstrated that the high porosity of the skeleton
nickel substrate leads to a higher concentration of available boronic acid groups and to a
better sensitivity.
Andrea Kellenberger Habilitation Thesis
Page | 81
3. Contributions on the study of charge transport mechanism in conducting polymer films
The results presented within this chapter have been obtained in the frame of an international
collaboration with the Center of Spectroelectrochemistry from the Leibniz Institute for Solid
State and Materials Research Dresden, Germany during a number of 5 post-doctoral research
stages.
The results have been published in 5 ISI indexed papers, as follows:
A. Kellenberger, E. Jăhne, H.J. Adler, T. Khandelwal, L. Dunsch, In situ FTIR
spectroelectrochemistry of poly[2-(3-thienyl)ethyl acetate] and its hydrolyzed
derivatives, Electrochimica Acta 53 (2008) 7054-7060.
L.F. Chazaro-Ruiz, A. Kellenberger, E. Jăhne, H.J. Adler, T. Khandelwal, L.
Dunsch, In situ ESR-UV-Vis-NIR spectroelectrochemical study of the p-doping of
poly[2-(3-thienyl)ethyl acetate] and its hydrolyzed derivatives, Physical Chemistry
Chemical Physics 11 (2009) 6505-6513.
L.F. Chazaro-Ruiz, A. Kellenberger, L. Dunsch, In situ ESR-UV-Vis-NIR and
ATR-FTIR spectroelectrochemical studies on the p-doping of copolymers of 3-
methy-lthiophene and 3-hexylthiophene, Journal of Physical Chemistry B 113 (2009)
2310-2316.
A. Kellenberger, E. Dmitrieva, L. Dunsch, The stabilization of charged states at
phenazine-like units in polyaniline under p-doping. An in situ ATR-FTIR
spectroelectrochemical study, Physical Chemistry Chemical Physics 13 (2011) 3411-
3420.
A. Kellenberger, E. Dmitrieva, L. Dunsch, Structure dependence of charged states in
"linear" polyaniline as studied by in situ ATR-FTIR spectroelectrochemistry, Journal
of Physical Chemistry B 116 (2012) 4377-4385.
3.1. Background
Conducting polymers are widely investigated due to their practical and potential applications
which include rechargeable battery electrodes, electrochromic devices, chemical and optical
sensors, light-emitting diodes, molecular based devices such as microelectrochemical
amplifiers, field-effect transistors and supercapacitors [172-176]. A considerable number of
theoretical and experimental works have been focused on the electronic properties and
conduction mechanism of conducting polymers.
One of the most important features of conducting polymers, which also presents increased
interest for practical applications, is the possibility to enhance their electrical conductivity by
doping [177]. The doping process consists in the chemical or electrochemical oxidation /
reduction of the polymer. Accordingly, p-doping corresponds to the injection of positive
charges and n-doping to the injection of negative charges in the polymer chain. The

Andrea Kellenberger Habilitation Thesis
Page | 82
advantage of electrochemical doping consists in the precise and reproducible tuning of the
doping level by controlling the electrochemical parameters such as electrode potential. An
essential characteristic of the doping process is its reversibility, i.e. conducting polymers can
be switched repeatedly between their conducting (doped) and insulator (undoped, pristine)
state. The doping process modifies in the electronic band structure of the polymer, by
generating new electronic states in the energy gap. Also, the doping process induces color
changes that enable conducting polymers to be used in advanced optical devices, such as
multichromic displays or “smart” electrochromic windows.
The chemical and electrochemical oxidation and reduction of such conjugated systems leads
to the formation of charge carriers denoted as positive/negative polarons (radical
cations/anions) delocalized along the polymer chain with very special electronic, vibrational
and charge transport properties. Vibrational spectroscopy has proved to be a powerful
technique to investigate the formation of charge carriers and the charge transport mechanism
[178-182] because the infrared spectra of conjugated polymers in their conducting (doped)
state are characterized by the appearance of very intense infrared active vibration (IRAV)
bands. These bands generally appear between 1600 and 700 cm-1 and are related to the strong
electron-phonon coupling. They provide not only structural but also electronic information.
Usually they are accompanied by broad IR absorption bands with maxima at higher energies
(around 1500 to 5000 cm-1) related to the formation of free charge carriers during charging of
the polymer film.
The idea to perform simultaneously different spectroscopic and electrochemical
measurements lead to the development of spectroelectrochemistry, which offers a new way to
investigate and unequivocally identify intermediates and products in electrochemical
reactions. By using different in situ spectroelectrochemical methods, formation and
stabilization of charged species, follow-up processes, and mechanism of the electron transfer
reaction can be investigated [183]. The basic principle of each spectroelectrochemical
technique is that a change in the electrode potential will determine a change of the structure
and this will lead to a change of the spectra. The advantage of spectroelectrochemistry
consists in its applicability in the study of electrochemical systems, as both the solid and
liquid phases are accessible to a detailed spectroscopic study. However, disadvantages are
related to the need to construct special spectroelectrochemical cells, the type and size of
which are adjusted to the requirements of the spectroscopic method, which might contradict
the requirements of the electrochemical method in terms of electrode geometry, electrolyte
composition, and volume [184].
One of these methods is in situ attenuated total reflection Fourier transform infrared (ATR-
FTIR) spectroelectrochemistry.
ATR-FTIR spectroscopy is a technique based on the internal reflection of the infrared beam
down the length of an internal reflection element, usually Ge or ZnSe. The most important
fact is that at each internal reflection point the evanescent wave will penetrate a short distance
outside from the crystal inside the sample which is in contact with the crystal. So, when a
sample is placed in optical contact with the reflection element it will absorbs infrared energy
and one can obtain the infrared spectra of the sample. This penetration depth is usually

Andrea Kellenberger Habilitation Thesis
Page | 83
between 0.5 and 2 µm and depends on several factors such as the angle of incidence,
wavenumber and the reflection indices of both ATR crystal and sample.
ATR-FTIR spectroelectrochemistry can be applied for in situ studies of polymer or
copolymer film growth on the electrode surface, for in situ evidence of counterions
incorporation into the polymer film and for in situ studies of the charge transfer mechanism
during doping and dedoping of polymer films.
A spectroelectrochemical cell is based on the cell construction described in [185]. The cell
consists of a Teflon body provided with openings for the platinum counter electrode and for
the Ag/AgCl pseudo-reference electrode. Details about the construction of the
spectroelectrochemical cell are given in Figure 59.
reference electrode
thin sample layer
IR beam
ATR crystal (ZnSe)
counter electrodeelectrolyte
gold layer
polymer
ATR crystal
reference electrode
thin sample layer
IR beam
ATR crystal (ZnSe)
counter electrodeelectrolyte
gold layer
polymer
ATR crystal
Figure 59. ATR-FTIR spectroelectrochemical cell. Schematic view of cell and of Au interdigitated
structure deposited on top of the ZnSe crystal (left) and disassembled cell (right).
Figure 60. Pictures of the experimental setup. Reflection unit with spectroelectrochemical cell
installed (left) and complete cell installed and connected to the potentiostat (right).

Andrea Kellenberger Habilitation Thesis
Page | 84
To assure a reasonable conductivity, but to maintain at the sample time optical transparency,
the zinc selenide internal reflection element was covered with a fine gold interdigitated
structure by photolithography. The gold layer had a thickness of 50 nm with an intermediate
chromium layer with a thickness of 5 nm applied to improve the adhesion of the gold layer.
To provide electrical connection to the potentiostat, a gold strip is pressed against the
Au/ZnSe working electrode.
The polymer film can be deposited on the crystal by electropolymerization or by drop coating
technique. The spectroelectrochemical cell is then assembled and mounted in the reflection
unit of the FTIR spectrometer and the three electrodes are connected to a potentiostat.
Pictures of the experimental setup are given in Figure 60.
3.2. Charge transport mechanism in polyanilines The chemical structure of polyaniline is often given as a linear model with three oxidation
states, shown in Figure 61. Leucoemeraldine base is the completely reduced form having
only benzenoid rings, emeraldine base is the half-oxidized form having both benzenoid and
quinoid ring and pernigraniline base is the completely oxidized form having only quinoidic
nitrogen.
Figure 61. Structure of linear Pani and its different oxidation states.
Switching between the three different oxidation states of polyaniline can be realized by
chemical or electrochemical doping/dedoping. The electrochemical doping has the advantage
of a precise and reproducible tuning of the doping level by adjusting the electrode potential.
In a typical cyclic voltammogram of polyaniline, two pairs of reversible redox peaks appear,
the first one is assigned to the transformation of leucoemeraldine to emeraldine and the
second one to further oxidation of emeraldine to pernigraniline.

Andrea Kellenberger Habilitation Thesis
Page | 85
Based on these structures, the well-accepted polaron-bipolaron model for polyaniline (Figure
62) is interpreted as follows: the polaron (radical cation) is the singly oxidized form of a
polymer segment with spin s = 1/2 and two optical transitions and the bipolaron (dication) is
a doubly oxidized form, which is diamagnetic and has one optical transition [186].
Figure 62. Structure of charged states in polyaniline.
It is generally accepted that polyaniline consists preferably by a linear arrangement of the
monomers [187]. However, since the early studies on chemically synthesized Pani [188, 189]
and the latter studies on electrochemically prepared Pani [190] it became obvious that
phenazine rings have to be considered as part of the polymer chain. Phenazine rings may
appear by intramolecular cyclization of branches that occur by aniline coupling reaction in
the ortho-position, as seen in Figure 63. Therefore, the linear structure of the Pani is an
idealized structure model and does not represent the real polymer structure.
Figure 63. Formation of phenazine rings in the structure of polyaniline. (Reprinted from Polymer 47
(2006) 8253-8262, J. Stejskal, I. Sapurina, M. Trchová, E. Konyushenko, P. Holler, The genesis of
polyaniline nanotubes, Copyright (2006), with permission from Elsevier)

Andrea Kellenberger Habilitation Thesis
Page | 86
.
The existence of phenazine structural units has been identified by the appearance of
characteristic FTIR bands at 1623, 1414, 1208, 1144, 1136, 1108 cm-1 and Raman bands at
1645–1630, 1420–1400, 1380–1365, ~575, and ~415 cm-1 [141,191,192]. It has been also
shown that phenazine-like units are involved in the formation of Pani nanotubes and
nanofibers [141,193-195] so it is obvious that phenazine units play an important role in
defining the structure, morphology and properties of Pani.
3.2.1. Charged states in electrochemically prepared polyanilines and copolymers
In our work we have investigated the role of phenazine-like units in the formation and
stabilization of charged states in polyaniline using in situ ATR-FTIR spectroelectrochemistry.
To obtain a high proportion of phenazine-like unit in the structure of polyaniline we have
electrochemically prepared copolymers of aniline with different ratios of phenosafranine
(Phsafr). The chemical structure of phenosafranine and the obtained copolymer are given in
Figure 64.
a)
b)
Figure 64. Chemical structure of Phsafr (a) and An-Phsafr copolymer (b).
Electrochemical measurements were carried out using a PG 284 potentiostat/galvanostat
(HEKA Electronic, Lambrecht, Germany). Electrochemical synthesis of polyaniline and
copolymers was carried out by cyclic voltammetry in a conventional three-electrode one-
compartment glass cell, using a Au band as working electrode, a Pt wire as counter electrode
and a silver-silver chloride pseudoreference electrode. Polyaniline was prepared from an
aqueous solution of 50 mM aniline in 0.1 M H2SO4 with 0.01 M sodium p-toluenesulfonate.
Three different copolymers (Pani-PPS1, Pani-PPS2 and Pani-PPS3) were prepared similarly,
keeping the concentration of aniline constant at 50 mM and varying the concentration of
phenosafranine from 1 mM to 5 mM and 20 mM. To initiate the polymerization the potential

Andrea Kellenberger Habilitation Thesis
Page | 87
was swept from 0 to 1.0 V in the first scan. Afterwards, to allow the homo- and copolymer
film growth, the anodic limit was lowered to 0.5 V and the potential was cycled between -0.5
and 0.5 V for the next 20 scans at a scan rate of 25 mV/s. Polyphenosafranine films (PPS)
were electrochemically prepared from a 5 mM phenosafranine solution in supporting
electrolyte by potential cycling between -0.5 and 1.2 V. All solutions were deaerated with
nitrogen 10 min prior to the electrochemical measurements. The polymer films obtained
potentiodynamically were thoroughly rinsed in monomer free electrolyte solution and
carefully dried. For ATR-FTIR studies the polymers were dissolved in dimethyl sulfoxide.
Cyclic voltammograms obtained during electrochemical polymerization of phenosafranine,
aniline and their copolymer are given in Figure 65.
Figure 65. Cyclic voltammograms on gold electrode during oxidation of 5 mM Phsafr (a) 50 mM An
(b) and 50 mM An + 5 mM Phsafr (c) in 0.1 M sulfuric acid and 0.01 M sodium p-toluenesulfonate,
scan rate 25 mV s-1.
It can be observed that the cyclic voltammogram recorded for electropolymerization of
aniline in the presence of phenosafranine has an additional reversible peak at ca. -0.15 V,
which is close to the potential of the reversible peak for phenosafranine and points to the
copolymerization of aniline with phenosafranine.
Ex situ ATR-FTIR spectra of commercial emeraldine base and of electrochemically
synthesized polyaniline and aniline-phenosafranine copolymer are given in Figure 66. The
major vibrations found in Pani and copolymers correspond to those from emeraldine base.
However, there are some weak intensity peaks or shoulders, that appear only and Pani and
copolymers and not in EB. A key vibration for the structure of Pani and copolymers, which
cannot be seen in EB is a shoulder at 1537 cm-1 in the spectrum of Pani which shifts to lower
wavenumbers in the copolymers. A similar band with medium intensity appears at 1534 cm-1
in the spectrum of PPS. This vibration has been also found in aromatic diamine polymers,
such as poly(o-phenylendiamine), obtained by electrochemical polymerization and it was
attributed to the C=N and C=C stretching vibrations in the phenazine ring [200,201]. In the
same time, the band at ca. 1530 cm-1 also appears in phenosafranine, pyridinium salts, 1-(4-
pyridyl) pyridinium chloride hydrochloride, phenazine methosulfate and safranine O, which
have a central charged nitrogen atom in their structures, but it is shifted in pyridine and
phenazine to ca. 1510 cm-1 [199,202] We propose that this peak can be attributed to the –
C=N+– stretching vibration in a phenosafranine unit in the Pani structure.

Andrea Kellenberger Habilitation Thesis
Page | 88
Another proof about the branched structure of the polymers relies in the C–H in-plane and
out-of-plane deformation vibrations of 1,2,4-trisubstituted benzene ring. A summary of the
vibrational bands corresponding to phenazine / phenosafranine units is given in Table 21,
however, since the C=N and C–N stretching vibrations of aromatic amines appear at closed
wavenumbers in both linear polyaniline and phenazine it is difficult to make a clear
distinction between them. These findings have been explained by the presence of phenazine /
phenosafranine units in the structure of electrochemically synthesized polymers.
1600 1400 1200 1000 800 600
0.0
0.2
0.4
0.6
0.8
1.0
1.2
1.4
*
**
* *
Abso
rba
nce / a
.u.
Wavenumber / cm-1
EB
Pani
Pani-PPS2
*
Figure 66. ATR-FTIR spectra of emeraldine base, polyaniline and aniline-phenosafranine copolymer.
The obtained results suggest that Pani and its copolymers with phenosafranine have a
crosslinked structure, consisting not only of closed phenazine rings, but a combination of
linear and phenazine-like units, according to the structure proposed in Figure 64(b).
Table 21. FTIR bands of EB, Pani, Pani-PPS1, Pani-PPS2, Pani-PPS3 and PPS. EB Pani Pani-PPS1 Pani-PPS2 Pani-PPS3 PPS Assignment [196-206]
a 1537sh 1535sh 1532sh 1532sh 1534s ν(C=N), ν(C=C) in Phsafr
1464sh1 1454sh1,2 1454sh1,2 1458sh1,2 1454sh1,2 1455s2 1 ν(C=C) and ν(C=N) or 2 ν(C=N) in Phz
1378w1 1378w1,2 1382w1,2 13781,2 1380w1,2 1375m2 1ν(C–N) in QBQ or 2ν(C=N) in Phz
1251w,b1 1245w,b1,2 1245w,b1,2 1243w,b1,2 1249w,b1,2 1240w2 1 ν(C–N) in BBB or 2 ν(C–N) in Phz
a 1179sh,vw 1170sh 1169s,sh 1182sh 1182m-s δ(C–H) in Phsafr
a - 1131m,sh - 1131m,sh 1132m-s δ(C–H) in Phsafr
950w1 957w1,2 957w1,2 955w1,2 951w1,2 952w1,2 1ring def or 2δ(C–H) in Phz
a 880w 880w 880w,sh 880w 880w γ(C–H) in 1,2,4-trisubst B ring (1H)
a - - - 869w,sh 871w,sh γ(C–H) in 1,2,4,5-tetrasubst ring (1H)
842m skeletal vibr of Phz
a 766w 769w 767w 767w a γ(C–H) in 1,2,4-trisubst ring (2H)
752w γ(C–H) in Phz
a 681m 681m 682m 681m 682w,sh γ(C–H) 1,2,4-trisubst ring (2H)
ν, stretching; δ, in-plane bending; γ, out-of-plane bending;
s, strong; m, medium, w, weak; sh, shoulder; b, broad;
a, absent; B, benzene ring; Q, quinoid ring; SQ; Phz, phenazine; Phsaf, phenosafranine.

Andrea Kellenberger Habilitation Thesis
Page | 89
The in situ ATR-FTIR measurements were performed with the attenuated total reflection
(ATR) technique, using a BRUKER IFS 66v spectrometer working with a DTGS detector at
room temperature. Polymer films were prepared on the ZnSe-Au working electrode by drop
casting from dimethyl sulfoxide solution, followed by solvent evaporation. The potentials
were controlled with a HEKA PG 284 potentiostat/galvanostat. The cyclic voltammograms
were recorded at low scan rate (1 mV s-1) in 0.1 M H2SO4 – 0.01 M sodium p-
toluenesulfonate solution, purged for 10 minutes with nitrogen prior to the determinations.
FTIR spectra with a resolution of 4 cm-1 and 100 accumulated interferograms were measured
in dependence of the applied potential and are given in Figure 67 for Pani and its copolymers.
1800 1600 1400 1200 1000 800
0.0
0.1
0.2
0.3
0.4
Ab
sorb
an
ce /
a.u
.
Wavenumber / cm-1
1572
1626
1476
1318
1250
1145
835
1061
-0.5 to -0.1 V0 V0.1 V0.2 V0.3 V0.4 V
0.5 V
A
1800 1600 1400 1200 1000 800
0.00
0.05
0.10
0.15
0.20
Absorb
ance /
a.u
.
Wavenumber / cm-1
1646
15751474
1310
1248
1145
1082 1005
850
900
946
1545
B
-0.5 to -0.1 V0 V0.1 V0.2 V
0.3 V
0.4 V
0.5 V
1800 1600 1400 1200 1000 800
0.00
0.05
0.10
0.15
0.20
Ab
sorb
an
ce /
a.u
.
Wavenumber / cm-1
C
1677
1635
1590
1478
1322
1225
1142
1050
895
8201540
-0.5 to -0.1 V0 V0.1 V0.2 V
0.3 V
0.4 V
0.5 V
1800 1600 1400 1200 1000 800
0.00
0.05
0.10
0.15
0.20
0.25
-0.5 to -0.1 V
0 V
0.1 V
0.2 V
0.3 V
0.4 V
Absorb
ance /
a.u
.
Wavenumber / cm-1
D
16371677
1580
1532
1455
1335
1256
1130
1057
820
0.5 V
Figure 67. In situ ATR-FTIR spectra during oxidation of Pani (a); Pani-PPS1 (b); Pani-PPS2 (c) and
Pani-PPS3 (d) between -0.5 and 0.5 V with reference state at -0.5 V.
The main changes in the in situ spectra induced by doping during electrochemical oxidation
are the decrease of the vibration bands from 1600, 1510, 1200 and 814 cm-1 together with the
increase of new vibrations at 1572, 1476, 1318, 1250 and 1145 cm-1 for both Pani and its
copolymers with phenosafranine.
The decrease and of the vibrations at 1510 cm-1 attributed to the C=C stretching vibration and
at 814 cm-1 corresponding to C–H vibration in 1,4-substituted benzene ring is equivalent to a
loss of the benzenoid ring structure which is transformed during oxidation into semiquinoid
or quinoid structure.

Andrea Kellenberger Habilitation Thesis
Page | 90
The appearance of new vibrations at 1572, 1476, 1318 and 1145 cm-1 in Pani and shifted to
slightly different wavenumbers in copolymers are usually related to the transition to a
semiquinoid structure [205-208]. The vibration band at 1250 cm-1 is often attributed to the
polaron lattice structure [128,129,206,209-211] based on the analogy with Raman
spectroscopic studies, which showed the presence of a Raman band around 1250 cm-1
attributed to the C–N•+ stretching mode in the semiquinone radical cations [204,212].
The in situ spectra of copolymers Pani-PPS1, Pani-PPS2 and Pani-PPS3 show additionally a
broadening of the vibration at 1575 cm-1 which is not obvious in the in situ spectra of Pani,
probably because it is hidden by the strong absorption at 1572 cm-1. This band has been also
observed at 1530 cm-1 in the in situ spectra of PPS as well as in the ex situ spectra of the
polymers around 1532-1537 cm-1 and could be related to the increase of the quinoidic
character of the phenosafranine units in the copolymers. As the ratio of phenosafranine units
in the copolymers ratio increases, the band at 1572 cm-1 splits in two distinct vibrations at
1580 and 1532 cm-1.
By comparing the potential dependency of IR bands and ESR signal it has been established
that IR bands reach their maxima at higher potentials than the ESR signal (Figure 68(a)),
therefore they cannot be attributed to the formation of polarons. This points to the formation
of diamagnetic species such as polaron pairs or π-dimers after polaron formation in the
polymer structures. On the other hands, the potential dependencies of IR band at 1535 cm-1
and of NIR band at 1300 nm are in close agreement (Figure 68(b)). As the band at 1535 cm-1
was associated with the phenazine units in the polymer / copolymer structures, we propose
that the π-dimers are stabilized on the linear segments of the polymer chains linked to the
phenazine-like units. The π-dimer is formed as a face-to-face complex of two polarons
interacting through their π-orbitals provided by planar structure of the phenazine segments of
two polymer chains.
Figure 68. Comparison of UV-Vis-NIR absorbance, selected IR absorbance and ESR signal intensity
during oxidation of: Pani (a) and Pani-PPS3 (b).
At higher oxidation levels two new peaks appear at 1628 and 1375 cm-1 which start to
increase from 0.3 V up to the reversal potential of 0.5 V, then decrease in the backward scan

Andrea Kellenberger Habilitation Thesis
Page | 91
and disappear at 0 V. The band at 1628 cm-1 is attributed to a fully quinoid structure [205-
208,213]. The band at 1375 cm-1 is attributed to the ring=N=ring mode in the quinoid form of
the polymer. As shown in a previous work [203], the UV-Vis-NIR spectra of the polyaniline
at high oxidation level present a peak at 620 nm, which corresponds to a π-π*-transition of
the diimine groups in the polymer [214] and can be associated to the bipolaron structures of
polyaniline. The potential dependence of the IR peaks at ca. 1630 and 1375 cm-1 in the
spectra of Pani coincides with the potential dependence of the absorption peak at 620 nm.
Therefore, these IR peaks are attributed to a bipolaron structure in Pani at high potentials.
3.2.2. Charged states in “linear” polyanilines
It has been shown by FTIR spectroscopy, that even in commercially available emeraldines
small amounts of phenazine units are present [215] and branching of the polymer chain
increases with the increasing of the weight average molecular weight of such emeraldines.
In our work we have investigated the formation of charge carriers during p-doping in so-
called “linear” emeraldines by in situ ATR-FTIR spectroelectrochemistry pointing to the role
of phenazine structure in the stabilization of charged states.
We have used commercially available emeraldine base with different average molecular
weights (average Mw ≈ 5,000; 50,000 and 300,000 Aldrich) and emeraldine salt (average
Mw > 15,000 Aldrich). The polymer powders were dissolved in dimethyl sulfoxide (puriss.,
Aldrich) and deposited on the ATR crystal by drop coating, followed by solvent evaporation
under nitrogen flow. The obtained polymer film are denoted as EB1, EB2, EB3, and ES,
respectively. The polymer films were initially equilibrated in the spectroelectrochemical cell
containing the supporting electrolyte solution (0.1 M sulfuric acid and 0.01 M sodium p-
toluenesulfonate) at the starting potential of -0.5 V and a spectrum was taken for reference.
Then, 22 IR spectra were collected during one cyclic voltammogram measured at a scan rate
of 4 mV/s, each spectrum covering a range of about 80 mV in the potential scan.
Examples of in situ spectra obtained for EB1 and EB3 are given in Figure 69. The changes in
the in situ spectra can be divided in two regions: the near infrared region, between 7000 and
1800 cm-1 where a broad band appears with maxima around 5000 cm-1 characteristic for the
intermediate oxidized metallic form of Pani and the mid infrared region, between 1700 and
700 cm-1 where four infrared active vibration (IRAV) modes are increasing at around 1570,
1490, 1300 and 1150 cm-1. These IRAV modes are a result of local symmetry breaking
caused by the introduction of charge carriers onto the backbone of a conjugated polymer and
their intensity is proportional to charge carrier density, or the doping level.
In the same time with the increase of the IRAV bands, four major peaks are decreasing
around 1600, 1500, 1200 and 814 cm-1 during the oxidation of polyaniline structures. A more
detailed overview of the potential dependence of these band is given in Figure 70 and their
assignment is presented Table 22.

Andrea Kellenberger Habilitation Thesis
Page | 92
Figure 69. In situ ATR-FTIR spectra of different PANI structures upon charging. Inset shows the
simultaneous CVs with triggers marked with points.
The decreasing peaks in the in situ FTIR spectra are the correspondent of the vibrations of
emeraldine bases observed in the ex situ FTIR spectra at 1600, 1500, 1300 and 820 cm-1. The
decrease of the vibration bands around 1500 cm-1 attributed to the stretching mode of carbon-
carbon covalent bond in benzene ring and of the vibration at 814 cm-1| corresponding to the
out-of-plane bending of carbon-hydrogen bond in 1,4-substituted benzene ring is consistent
with a loss of the benzenoid ring structure, which is transferred into semiquinoid or quinoid
ones. The decrease of the band around 1200 cm−1 corresponding to the C−N stretching in
aromatic amines is indicative for the transformation of amino groups into imino groups upon
oxidation of the polymer structures.
Figure 70. Mid infrared region of in situ ATR-FTIR spectra of different PANI structures upon
charging, EB2 (left) and EB3 (right).

Andrea Kellenberger Habilitation Thesis
Page | 93
Table 22. Mid-IR region vibrations of in situ FTIR spectra of different PANI structures.
EB1 EB2 EB3 ES Assignment [196, 204-212, 216-219]
1571 1573 1574 1571 ring stretching in SQ ( up to 0.3 V than )
1481 1494 1492 1490 ring stretching in SQ ( up to 0.3 V than )
1292 1302 1300 1297 ν (C-N) in SQ ring ( up to 0.3 V than )
1151 1156 1153 1145 δ (C-H) in SQ or ν (HSO4-) ( up to 0.3 V than )
882 882 882 878 γ (C-H) in 1,2,4-trisubstit B ring (2-substit
phenazine ring) ( up to 0.3 V than )
1598 1605 1604 1600 ν (C-C) in Q ring ( in the forward scan)
1502 1507 1506 1505 ν (C-C) in B ring ( in the forward scan)
1197 1197 1196 1193 ν (C-N) in aromatic amine ( in the forward scan)
814 818 816 810 γ (C-H) in 1,4 substit B ring ( in the forward scan)
. ν, stretching mode; δ, in-plane bending mode; γ, out-of-plane bending mode; B, benzene
ring; Q, quinoid ring; SQ, semiquinoid structure. increasing peak intensity; decreasing
peak intensity.
The potential dependence of the four IRAV bands in the mid infrared region is the same for
all Pani structures under study. Two other vibrations found at 5000 and 880 cm-1 show a
similar potential dependence. They all start to increase at potentials around −0.22 V and
reach a maximum at around 0.28 V in the forward scan. In the backward scan they increase
and again reach a maximum at around 0 V, according to Figure 71.
Figure 71. Potential dependence of semiquinoid bands and of the free charge carries band for the
PANI structures EB2 (b) and EB3 (c).
The potential dependence of these bands has been compared to the potential dependence of
the in situ electron spin resonance (ESR) signal which is attributed to polarons (Figure 72(a)).
Because the two dependences does not coincide, it has been concluded that the semiquinoid
bands at 1570, 1490, 1300 and 1150, usually attributed to the polaron lattice, correspond in

Andrea Kellenberger Habilitation Thesis
Page | 94
fact to the formation of spinless doubly charged species, such as π-dimers, which are face-to-
face complexes of two polarons.
Additionally, the in situ spectra show the presence of a weak intensity vibration around 880
cm-1, which was attributed in a previous IR study of polyaniline, phenazine polymer and
aniline-phenazine copolymer to a 2-substituted phenazine ring [215]. Because the potential
dependence of the band at 882 cm-1 which is associated with the branches in the polymer is
similar to the potential dependence of the bands attributed to the π-dimer, it has been
proposed that the π-dimers are stabilized at the phenazine-like units of the polymer chain.
Figure 72. Potential dependence of spectroscopic data of Pani-EB3 during doping / dedoping: single
integrated ESR signal together with one selected semiquinoid IR band (a) and with polaronic bands at
1266, 1033 and 1010 cm-1 (b).
Moreover, it has been found that IR vibrations at 1266, 1033 and 1010 cm-1 start to increase
at potentials above −0.22 V and have a similar potential dependence with the π-dimer bands
at low oxidation levels, but they show a completely different potential dependency at high
doping levels. The shape of the potential dependence of these bands matches that of the ESR
signal (Figure 72(b)), therefore these bands could be ascribed to polarons.
The band at 1266 cm-1 is attributed to C–N•+ stretching in semiquinone radical cations in
agreement with Raman spectroscopic studies, which showed a band at around 1250 cm-1
attributed to the polaron lattice structure [212,216]. The bands at 1010 and 1033 cm-1 could
be ascribed to the C–H in-plane deformation vibration of 1,4-disubstituted or 1,2,4-
trisubstituted benzene rings or 2-substituted phenazine ring. This demonstrates that polarons
are stabilized on the linear polymer segments close to the branches by phenazine-like units in
the polymer chains.
By going to higher oxidation levels, the polaron and π-dimer bands start to decrease because
the semiquinoid structure is further oxidized to a quinoid structure. As a result, new bands are
arising at 1630, 1375, 1338 and 1238 cm-1 in the in situ spectra. The band at 1630 cm-1 is
assigned to the C=N stretching in quinoid rings and the bands at 1375 and 1338 cm-1 to C-N
stretching in the neighbourhood of quinoid rings. These bands are observed to appear only
after the first redox peak of Pani, they increase in intensity during the second redox peak
(Figure 73) and correspond to the formation of bipolarons as protonated quinoid structures.

Andrea Kellenberger Habilitation Thesis
Page | 95
Additionally, a weak intensity IR vibration at 734 cm-1 attributed to in-plane-bending of C–H
in phenazine ring shows the same potential dependence to that of bipolaronic bands,
suggesting that bipolarons are also stabilized near the phenazine units.
Figure 73. In situ FTIR spectra of EB3 after the first and the second redox peak (black and red line)
and potential dependence of bipolaronic bands in EB3.
The potential dependence of bipolaronic bands is opposite to that of bands assigned to π-
dimers. The π-dimer bands start to decrease above potentials of 0.28 V where the bipolaronic
bands start to increase and reach again a maximum at 0 V in the backward scan, where the
bipolaronic bands completely disappear. This allowed us to propose the following
mechanism for the formation of charged states in polyaniline upon p-doping (Figure 74).
Figure 74. Scheme for formation of charged states upon electrochemical oxidation of polyaniline.
At the early stage of charge injection into the polymer a polaron pair is formed, which can
dissociate into two polarons at higher potentials. Polarons and π-dimers are formed at the
same potential. At that potential where the concentration of π-dimers is at its maximum no
ESR signal is observed. This behaviour points to the fact that the polarons are converted into

Andrea Kellenberger Habilitation Thesis
Page | 96
π-dimers at higher oxidation level. The further p-doping of the PANI leads to the transfer of
π-dimers into bipolarons.
In conclusion, the combined use of different in situ spectroelectrochemical methods allowed
us to establish the complete reaction mechanism of the formation of charged states in Pani
upon electrochemical doping.
3.3. Charge transport mechanism in polythiophenes
Polythiophene (PT) is a conjugated polymer intensively studied due to its environmental
stability, good conduction properties and wide range of potential applications. It shows
semiconducting properties in the neutral form and metallic conductivity in the p-doped form
[220]. Polythiophene, like many other linear polyaromatic compounds, is insoluble in organic
solvents due to its rigid backbone. A major challenge in the field of conducting polymers is to
obtain materials with improved solubility and processability without affecting the electrical
properties, i.e. conductivity.
For polymers like polythiophene one of the methods suggested for this purpose is the
introduction of a substituent in the 3- and/or 4-position of the thiophene ring. High
conductivities were obtained for electrochemically synthesized poly(3-methylthiophene) and
poly(3-ethylthiophene) [221]. However, appropriate solubility in common organic solvents
has been achieved only with an alkyl side chain of more than four carbon atoms [222]. In
addition to improved solubility and crystallinity, the introduction of side chains in the 3- or 4-
position also decreases the probability of defects during polymerization (2,4 linkages or β
coupling) since at least one of the β position is already occupied [223]. Beside alkyl
substituents, various other substituents were grafted in the 3-position of the thiophene ring, in
order to achieve tailored properties.
Poly(3-alkylthiophenes) (P3AT) have been further functionalized by different chemical
groups at the end of the alkyl chain in order to modify their solubility, their spatial
arrangement and electrical properties. Such examples are thiophenes functionalized with ω-
alkyl-phosphonic acid [224,225] and ω-alkyl-trichlorosilane groups [226] that have been
successfully prepared and used in the formation of self-assembled monolayer with potential
applications as protective coatings, sensors, electronic semiconductors or adhesive systems.
Poly(3-alkylthiophenes) functionalized with hydroxyl groups are valuable in obtaining
immobilized enzymes for sensor systems. However, thiophene monomers with functionalized
with hydroxyl groups can only be polymerized after the protection of the reactive –OH group
by etherification or esterification. After polymer formation, the protected –OH group can be
recovered by ether or ester cleavage via acidic or basic hydrolysis. This approach lead to the
electropolymerization of 3-(2-methoxyethyl)thiophene [227] but gave no result for the
homopolymerization of various esters of 2-(3-thienyl)ethanol [228], revealing the importance
of the alkyl side chain. Recently, the electrochemical polymerization of 2-(3-thienyl)ethyl
acetate has been reported at high monomer concentrations and relatively low electrode
potentials [229]. One of the attractive properties of the ester-functionalized

Andrea Kellenberger Habilitation Thesis
Page | 97
polyalkylthiophenes is their good solubility in common organic solvents resulting in the
casting of homogeneous, free-standing films [230].
Despite their interesting properties, the doping mechanism of ester-substituted
polyalkylthiophenes was not investigated.
The doping process of polythiophene and poly(3-methylthiophene) has been investigated in
detail. It has been shown that both chemical, electrochemical and photo-induced doping
generally induces the same changes in the FTIR spectra: the appearance of very intense
infrared active vibration (IRAV) bands, usually in the range between 1600 and 700 cm-1,
accompanied by broad IR absorption bands with maxima at higher energies (around 1500 to
5000 cm-1) related to the formation of free charge carriers [231-236]. This behaviour was
explained in terms of local breaking of the symmetry around the injected charge carrier, and
transition from the aromatic to a quinoid structure, so that the polymer chain becomes highly
polarized and some initially silent modes become infrared active. The IRAV bands are
therefore related to the charge transport along the polymer chain and do not depend on the
type of doping and on the nature of the dopant anion
In case of polythiophene four doping induced bands are observed at around 1330, 1200, 1120
and 1020 cm-1 [237-239]. Chemical and photo-induced doping of poly(3-methylthiophene)
leads also to four doping induced bands at around 1308, 1203, 1165 and 976 cm-1,
comparable to the those obtained by electrochemical doping (1300, 1160, 1100 and 975 cm-1)
[231-233]. The electrochemical oxidation of poly(3-methylthiophene) in different solvent-
electrolyte systems allowed to obtain evidence of the counterion diffusion into the polymer
film, as shown by vibrations at 1075 cm-1 and 1060 cm-1, originating from the incorporation
of perchlorate, and respectively tetraflouroborate anions. A comparison between chemical
and photo-induced doping of poly(3-methylthiophene) showed that in both cases the charge
carrier configuration is similar and charge is stored predominantly in form of bipolarons
which is equivalent to a quinoid like structure [231,232].
Poly(3,4-ethylenedioxithiophene) (PEDOT) was also subject to numerous studies regarding
the doping/dedoping process. Upon electrochemical p-doping in different electrolytes,
generally four new IRAV bands were found (1290, 1205-1189, 1090, 977 cm-1 in TBAPF6),
their position slightly depending on the electrolyte, due to small differences in the film
structure [178]. The incorporation of the counterion (hexafluorophosphate) from the
electrolyte is evident from the strong band at 839 cm-1. In situ FTIR analysis also showed that
the doping/dedoping process is reversible. If the film thickness exceeds 2 μm the process
becomes partly irreversible. Another study presents a comparison between IRAV modes
obtained during p- and n-doping of PEDOT films. IRAV bands intensities in n-doping are
lower than those of p-doped polymer, indicating that a lower degree of n-doping compared
with p-doping has been obtained. The p- and n-doping induced IRAV bands (1513, 1319,
1195, 1090, 1060 and 980 cm-1 for p-doping; 1285, 1245, 1195, 1090 and 1060 cm-1 for n-
doping) are not identical, meaning that different electronic structures are formed by positive
and negative charging [179].

Andrea Kellenberger Habilitation Thesis
Page | 98
3.3.1. Charged states in poly(3-alkylthiophenes)
3-methylthiophene (3MT) and 3-hexylthiophene (3HT) are intensively used starting
monomers to obtain poly(3-alkylthiophenes) by copolymerization reaction with thiophene or
thiophene derivatives. The copolymerization path is frequently used to combine desirable
properties of two polymers, such as desired electrochromic properties and high electrical
conductivities. It has been found that the copolymerization of 3-alkylthiophene derivatives
leads to a higher thermal stability of doped P3ATs [240] which is a tremendous problem for
their application [241]. The copolymer of 3MT and 3HT is a material which still has
excellent solubility together with high electrical conductivity, even higher than the
conductivity of p3HT [242], due to the presence of 3MT moieties which show an exceedingly
high conductivity among the polythiophenes [243].
In our work we have investigated the influence of the random distribution of the long side
alkyl chain of 3HT on the formation and stability of the charge carriers in a copolymer of
3MT and 3HT. The use of several in situ spectroelectrochemical techniques allowed us to
detect both the paramagnetic and diamagnetic species formed during electrochemical p-
doping of homo- and copolymers (p3MT, p3HT and p3MT-co-3HT).
Figure 75. Chemical structure of p3MT and p3HT.
Homo- and copolymers have been prepared by electrochemical pulse deposition. This
method implies that the electrode potential is increased from an initial value where no
faradaic current is observed, up to a positive value where the oxidation of monomers take
place and then lowered and maintained constant to allow growth of homo- and copolymer
films but avoid their overoxidation. Homo- and copolymer films have been synthesized on
ITO electrodes in acetonitrile solution with 0.1 M n-BuNPF6 as supporting electrolyte at
concentration of 20 mM 3MT and 40 mM 3HT. The electrochemical synthesis of the
copolymer was achieved using a molar ratio of 3MT:3HT of 1:2, taking into account that the
electrochemical oxidation of 3MT occurs at lower potential than that of 3 HT [242].
For ex situ FTIR measurements the polymer films obtained on ITO were carefully peeled off
and transferred to the ZnSe internal reflection element. For in situ FTIR studies, the polymers
were synthesized in the spectroelectrochemical cell on the ZnSe-Au working electrode and
their p-doping behavior was studied in 0.1 M tetrabutylammonium-hexaflourophosphate (n-
BuNPF6) acetonitrile solution. In situ FTIR spectra were taken at equidistant time intervals
during electropolymerization and also during the electrochemical p-doping.

Andrea Kellenberger Habilitation Thesis
Page | 99
An important characteristic of poly(3-alkylthiophenes) is regioregularity which denotes the
percentage of stereoregular head-to-tail (HT) attachments of the alkyl side chains to the 3-
position of the thiophene ring. It has been reported that FTIR studies can give information on
the degree of regioregularity of polymer chains in P3ATs [244-246]. Side chains of adjacent
rings in P3ATs can be in head to tail (HT) or in head to head (HH) conformation, resulting in
four triad regioisomers: HT-HT, HT-HH, TT-HT, and TT-HH triad. P3ATs with only HT-HT
triad (regioregular P3ATs) lead to a minimal steric hindrance and an extended -conjugation
length as a result of self-organization of P3AT main chains, whereas the HH or TT junctions
result in spatially disordered polymer chains with limited conjugated segments [247].
For the qualitative analysis of the FTIR spectra of substituted polyalkylthiophenes two
criteria have been proposed, namely the position of the aromatic C-H out-of-plane vibration
[244,246] and the intensity ratio of the symmetric and antisymmetric ring stretch modes
[245]. The main vibrations of electrochemically synthesized homo- and copolymer are given
in Table 23 together with their assignments.
Table 23. Characteristic IR bands of p3MT, p3HT and p3MT-co3HT and their structural assignments.
Polymer p3MT p3HT p3MT-co-3HT
aromatic C-H stretch 3059 3053 3053
aliphatic C-H stretch 2957, 2918, 2849 2951, 2918, 2850 2950, 2918, 2850
ring stretch 1503, 1468 1510, 1456 1510, 1456
CH3 def 1388 1372 1388
aromatic C-H out-of-plane 827 829 822
CH3 rock - 723 716
According to the first criterion the band position of the aromatic C-H out-of-plane vibration
is shifted to lower wavenumbers for regioregular P3ATs (820–822 cm-1) and to higher
wavenumbers for regiorandom P3ATs (827–829 cm-1). For p3MT and p3HT this band is
situated at 827 and 829 cm-1 respectively, which points to a random structure. For p3MT-co-
3HT the same band appears at 822 cm-1 indicating a more ordered polymer chain. A measure
of the conjugation length in the polymer backbone is given by the ration Isym/Iasym, lower
ratios being associated with longer conjugated segments. The calculated ratios are 4.8 for
p3HT and about half of this value for p3MT (2.6) and p3MT-co-3HT (2.2). These results are
consistent with a higher conjugation length of the copolymer in accordance with its
regioregular structure. In contrast, the FTIR data suggest that the parent homopolymers p3HT
and p3MT have a regiorandom structure.
In situ ATR-FTIR spectra taken during the copolymerization by the potential pulse method
are given in Figure 76. A spectrum taken before the start of the electrochemical
polymerization for the cell containing the monomers solution was used as a reference
spectrum. Thus, only changes induced by the copolymer film deposition on the surface of the
electrode and by its simultaneous doping can be seen.

Andrea Kellenberger Habilitation Thesis
Page | 100
Figure 76. In situ ATR-FTIR spectra during copolymerization of 20 mM 3MT with 40 mM 3HT in
0.1 M n-BuNPF6 acetonitrile solution.
The shape of in situ FTIR spectra is characterized by some broad absorption bands which
develop in three absorption peaks centered at 1302, 1144 and 990 cm-1 with bandwidth larger
than 100 cm-1. These are doping induced bands, similar to those observed for polythiophene
[237-239] and poly(3-methylthiophene) [231-233]. Additionally, a sharp peak is at 842 cm-1
is ascribed to the PF6- anions incorporated into the copolymer film to compensate the positive
charge created during the oxidative polymerization. Beside the doping induced bands, some
additional bands have been attributed to the formed copolymer film. Vibrations at 1506 and
1407 cm-1 originate from the thiophene ring stretching and vibrations at 1370, 990 cm-1 are
assigned to the side alkyl chain [231-233,235].
In situ ATR-FTIR measurements during p-doping of p3MT-co-3HT show a typical profile
for P3ATs, characterized by the development of two distinct vibrational patterns: the range
1600-700 cm-1 where some very intense infrared active vibration (IRAV) bands appear and
that above 1600 cm-1 where the electronic absorption of free charge carriers is found with a
maximum around 5000 cm-1. The FTIR spectra also give evidence about the inclusion of the
counterion PF6- indicated by a very intense peak at 842 cm-1. The results of FTIR
spectroelectrochemical study point to a high concentration of the positive charge carriers, but
gives no information about their nature, which is to be clarified by simultaneous ESR and
UV-Vis NIR spectroelectrochemistry.
Characteristic examples of ESR and UV-Vis-NIR in situ spectra of p3MT-co3HT are given
in Figure 77. The ESR signal starts to increase in the forward scan and reaches a maximum at
a potential close to the anodic peak from the cyclic voltammogram, corresponding to the
highest concentration of polarons. Then, both current and ESR signal start to decrease,
indicating that a fraction of polarons are transformed into diamagnetic species (polaron pairs
or bipolarons). In the same time with the ESR signal, the optical spectra show two absorption
bands at 850 and 1650 nm corresponding to polarons. As the ESR signal decreases, the UV-
Vis absorptions further increase and shift to higher energies. These two bands are more

Andrea Kellenberger Habilitation Thesis
Page | 101
intense than the polaronic bands and correspond to the formation of spinless polaron pairs
with a similar absorption pattern to that of polaron. Therefore only the simultaneous use of
both the ESR and the UV-Vis-NIR spectroscopy enables the differentiation of polarons
(paramagnetic) and polaron pairs (diamagnetic).
Figure 77. In situ ESR (left) and UV-Vis-NIR (right) spectra of p3MT-co3HT.
In addition, by going to higher potentials, a single broad absorption band is formed at 1310
nm, in the middle of the two polaronic transitions, which is attributed to the formation of
bipolarons. Thus in this potential range both the polaron pair and the bipolaron are coexistent
and being in equilibrium with the polaron. The development of the optical absorption signal
consisting of the three absorption peaks (polaron pair and bipolaron) together with a decrease
of the ESR signal indicates the transformation of polarons into polaron pairs and bipolarons,
as found in previous studies on the p-doping of 3MT [248,249]. At higher doping levels,
literature data indicate that the predominant charge carriers in polythiophene and p3MT films
are expected to be bipolarons [250-253] which is consistent with our results obtained for the
copolymer of 3MT and 3HT.
3.3.2. Charged states in functionalized poly(3-alkylthiophenes)
The aim of our studies was to investigate the effect of the functional group attached to the
alkyl chain (acetyl, hydroxyl and a combination of both functional groups) on the p-doping
behavior of these conjugated polymers, using a combination of in situ spectroelectrochemical
techniques, such as ATR-FTIR and ESR-UV-Vis-NIR spectroelectrochemistry.
Spectroelectrochemical measurements were carried out on three polymers with the structures
given in Figure 78. The first structure poly[2-(3-thienyl)ethyl acetate] (PTEtAc) was
chemically synthesized by polymerization of the corresponding monomer and contains an
acetyl functional group attached to the alkyl chain. The third structure, poly[2-(3-
thienyl)ethanol] (PTEtOH) has been obtained by complete hydrolysis of the parent polymer
and contains a hydroxyl group attached to the alkyl chain. The second structure, PTEtAcOH
was obtained by partial hydrolysis and contains both acetyl and hydroxyl functional groups

Andrea Kellenberger Habilitation Thesis
Page | 102
and may be regarded as a copolymer of PTEtAc and PTEtOH. This modification altered the
solubility and the spatial arrangement of the polymers in the resultant films.
S
O
O
n
S
O
O
x
S
OH
y
S
OH
n
PTEtAc PTEtAcOH PTEtOH
Figure 78. Chemical structure of the studied polyalkylthiophene derivatives.
Electrochemical and spectroelectrochemical measurements were carried out for PTEtAc and
PTEtAcOH films deposited on the working electrode surface by drop casting from a
dichloromethane solution. PTEtOH film was prepared by drop casting from a
dimethylsulfoxide solution and dried at 50°C. The electrolyte was a 0.1 M
tetrabutylammonium-hexaflourophosphate (TBAPF6) – acetonitrile solution, purged with
nitrogen.
The cyclic voltammograms of the three conducting polymer, shown in Figure 79, reveal a
stable and reversible redox behaviour for both PTEtAc and the copolymer PTEtAcOH,
characterized by a pair of oxidation/reduction peaks at 0.78 / 0.52 V and respectively 0.89 /
0.70 V which remain stable during consecutive cycling. The completely hydrolyzed polymer,
PTEtOH, shows a loss of the redox activity during consecutive scans, explained by the
presence of interchain hydrogen bonds which are responsible for a cross-linked structure,
which obstructs the counter-ions from leaving the polymer film during the reduction step. In
the following doping-dedoping cycles a lower number of sites are available for
oxidation/reduction and the redox activity of the polymer film decreases gradually.
All the three structures showed electrochromic behaviour, during p-doping they changed their
colour from orange to green at lower doping levels and to dark blue at higher doping levels.
The presence and nature of hydrogen bonds in the structure of both PTEtAcOH and PTEtOH
was confirmed by ATR-FTIR spectroscopy. Generally, hydrogen bonds affect the shape and
position of the hydroxyl stretching vibration, producing a significant band broadening and a
shift to lower wavenumbers. This effects can be observed in the spectra of PTEtOH, were the
OH stretching vibration appears as a broad band at 3300 cm-1, indicating strong
intermolecular interaction between neighbouring polymer chains, rather than intramolecular

Andrea Kellenberger Habilitation Thesis
Page | 103
bond within the same chain. The spectra of PTEtAcOH shows the presence of both functional
groups, acetyl and hydroxyl, as indicated by the carbonyl group absorption at 1738 cm-1 and
the OH stretching vibration at 3460 cm-1. The hydrogen bonds are weaker than for PTEtOH,
since the band position is shifted to higher wavenumbers. Also, there is no proof for
associations between the hydroxyl and carbonyl group, since the carbonyl band position is
the same for PTEtAcOH and PTEtAc
-0.5 0.0 0.5 1.0
43
21
PTEtAc
Cu
rre
nt
E / V vs. Fc/Fc+
0.25 mA
9 8 76
5
0.5 mA
PTEtOH
PTEtAcOH
0.5 mA
Figure 79. Cyclic voltammograms of PTEtAc, PTEtAcOH and PTEtOH films on a Pt working
electrode in a TBAPF6 (0.1 M) – acetonitrile solution at 100 mV s-1.
The IRAV bands start to appear around 0.12 V for PTEtAc and at 0.22 V for PTEtAcOH, as
seen in Figure 80, which corresponds to the potential values where the Faradaic current starts
to increase in the cyclic voltammograms. The changes observed in the in situ IR spectra
correspond to the fading of the bands corresponding to the neutral state, as seen by
decreasing IR vibrations at 1448, 1378, 1245, 1040 and 847 cm-1, accompanied by the
appearance of some new IR bands with intensities increasing in dependence of the applied
electrode potential.
The new absorption pattern observed during oxidation is characterized by four major IR
absorptions, with bandwidth larger than 100 cm-1, and relative position depending on the
polymer structure. The pattern is quite similar for PTEtAc and PTEtAcOH, which show

Andrea Kellenberger Habilitation Thesis
Page | 104
increasing IR bands at 1396, 1330, 1150 and 970 cm-1 and shifted for PTEtOH at 1394, 1340,
1130 and 990 cm-1. The band at 1150 cm-1 is accompanied by two shoulders at 1204 and
1090 cm-1, which are more pronounced at lower doping levels and tend to merge with the
main band as the doping level increases. These doping induced bands are very similar to
those observed for the doping of polythiophene [235-237] and poly(3-methylthiophene) [231-
233]. The doping induced changes are reversible, i.e. they disappear during de-doping, for
PTEtAc and PTEtAcOH but not for PTEtOH. During the reversal scan the intensity of the
IRAV bands in PTEtOH does not completely decrease with the potential and we propose that
this behaviour is due to the “trapping” of the charge inside the polymer chains cross-linked
by hydrogen bridges.
(a) (b)
(c)
Figure 80. In situ ATR-FTIR spectra during p-doping (solid lines) and de-doping (dashed lines) of
PTEtAc (a), PTEtAcOH (b) and PTEtOH (c). Numbers correspond to potential values from Fig. 79.
The lower intensity of the electronic absorption of free charge carriers (between 1500 and
500 cm-1) and that of the IRAV bands (between 700 and 1500 cm-1) in case of PTEtOH as
compared with PTEtAc and PTEtAcOH indicate a lower charge density and less

Andrea Kellenberger Habilitation Thesis
Page | 105
delocalization of the charged states created upon electrochemical doping and a smaller
effective conjugation length in the polymer backbone. Although the charges are generated
more easily in PTEtOH, the interchain hydrogen bonds may cause a deviation from
coplanarity, which affects the conjugation and cannot stabilize the charged states to a larger
extent. Another important finding is the irreversible change of the hydroxyl group starting
around 0.32 V, confirmed by the downward pointing absorption band at 3320 cm-1
corresponding to the stretching vibration of the –OH group in the polymer chain.
The appearance of doping induced modes similar to those for other substituted
polythiophenes indicate the presence of delocalized charge carriers but doesn’t offer
information about the nature of the charges generated by the electrochemical doping of these
polymers. To differentiate between the charged states, further in situ ESR and UV-Vis-NIR
spectroelectrochemical studies have been carried out.
In situ ESR and UV-Vis-NIR spectroelectrochemical measurements have shown that the
doping process is reversible only up to a potential of 0.45 V, at low doping levels. Beyond
this potential value, at high doping levels, irreversible changes take place in the polymer
structures.
For PTEtAc at low doping levels an ESR signal appears and increases in the forward scan,
pointing to the formation of polarons. The intensity of the ESR signal reaches a maximum
and starts to decrease before the reversal potential of the cyclic voltammogram, indicating
that the concentration of polarons start to decrease since they are transformed into spinless
species, such as polaron pairs. In the same time the UV-Vis-NIR spectra show two
absorptions at 750 nm and 1695 nm associated with the formation of polarons during the
doping of polythiophenes [249]. With increasing potential, the NIR transition at 1695 nm
reaches a maximum and shifts to lower wavelength. The blue shift of the NIR band from
1695 to 1560 nm indicates the formation of polaron pairs [249,254] which are diamagnetic
species, therefore ESR silent.
For PTEtAcOH and PTEtOH the potential dependence of the ESR signal shows a high
hysteresis between doping and de-doping caused by the presence of OH groups. Even with a
degree of hydrolysis of about 30% for PTEtAcOH, the formation of hydrogen bonds in this
(partially) hydrolyzed polymer reduces the diffusion of the counterions incorporated during
doping, and thus, controls the de-doping kinetically via the removal of the counterions. The
NIR transition of PTEtAcOH appears at 1670 nm with a maximum at 1590 nm and that of
PTEtOH at 1633 nm with a maximum shifted to 1525 nm. Here the degree of hydrolysis
might change the conformation of the polymer chain completely, because the side chains are
shortened from 5 (PTEtAc) to 3 (PTEOH) atoms and fixed by the formation of the hydrogen
bonds.
At high doping levels the ESR signal appears at 0.02 V (Figure 81), reaches a maximum at
0.51 V and then starts to decrease, indicating that a certain amount of polarons is transformed
into spinless species, which can be either polaron pairs or bipolarons. The UV-Vis-NIR
spectra collected simultaneously at different potentials allowed the differentiation between
the paramagnetic species (detected by ESR spectroscopy) and the diamagnetic species
generated during the electrochemical p-doping. It has been found that the decrease of the

Andrea Kellenberger Habilitation Thesis
Page | 106
ESR signal is correlated with the appearance of both the two new optical bands at 930 nm
and 1460 nm as well as that at 1290 nm. The last one appears between the two polaronic
bands and dominates the spectra at high doping levels. This is in accordance with the
formation of bipolarons, which have been discussed for conducting polythiophenes with
absorption maxima at this wavelength [248]. The key difference between bipolarons and
polaron pairs is their optical absorption: bipolarons give rise of a single absorption band from
dipole-allowed transition in the UV-Vis-NIR spectrum, while polaron pairs show two
absorption bands, according to theoretical and experimental studies of thiophene based
conducting polymers [254-258]. Therefore, the existence of both the bipolaron, absorbing at
1290 nm, and the polaron pair with absorptions at 930 and 1460 nm is demonstrated in our
case.
Figure 81. In situ ESR (left) and UV-Vis-NIR (right) spectra at high doping levels of PTEtAc.
This is the rare case in a polymer where both the bipolaron and the polaron pair are stable at
higher doping levels. Using the electron spin resonance in parallel to absorption
measurements it is possible to attribute the new double absorption peak at 930 and 1460 nm
to the ESR-silent polaron pair. Both dicationic species coexist with the polaron which is
demonstrated in the backscan where the polaron is reformed under symproportionation of
both the polaron pair and the bipolaron.
As a conclusion, only by the combined use of in situ ESR and UV-Vis-NIR
spectroelectrochemistry it has been demonstrated that at low doping levels polarons and
polaron pairs are formed, while at high doping levels the bipolarons and polaron pairs are the
dominating charged species. The presence of OH groups leads to the formation of hydrogen
bonds, which alter both the formation of charged species and the facility of the doping
process to return to the initial neutral state of the film.

Andrea Kellenberger Habilitation Thesis
Page | 107
3.4. Conclusions
The charge transport mechanism in several conducting polymers has been investigated by in
situ spectroelectrochemical methods. It has been shown that only the combined application of
several spectroelectrochemical techniques, such as in situ infrared spectroscopy, electron spin
resonance spectroscopy, and ultraviolet and visible spectroscopy, allows the differentiation of
paramagnetic and diamagnetic species and the unambiguous assignment of adsorption bands
to various charge carriers, such as polarons, bipolarons or polaron pairs.
Based on the obtained results we could conclude that in the case of polyaniline phenazine-
like structures play an important role in the formation and stabilization of the charge carriers.
In the case of substituted polythiophene derivatives, it has been shown that polarons and
polaron pairs are the main charge carriers at low doping levels, respectively, bipolarons and
polaron pairs at high doping levels.
The originality of our work is related to the following aspects:
(i) we have electrochemically prepared copolymers of aniline with different ratios of
phenosafranine to deliberately introduce a high proportion of phenazine units in the structure
of the resultant polymer film. The presence of phenazine units has been evidenced by
characteristic FTIR vibrations.
(ii) by comparing the potential dependence of IR vibrations and ESR signal we have
demonstrated that bands usually attributed to a semiquinoid polaron lattice correspond in fact
to diamagnetic species such as π-dimers which are face-to-face complexes formed by two
polarons.
(iii) we have found three different potential dependencies of the IR bands and ascribed them
to the formation of π-dimers, polarons and bipolarons. We have demonstrated that π-dimers
are stabilized at the link of the phenazine units to the linear Pani segments, as shown by the
same potential dependence of vibrations corresponding to substituted phenazine rings and
those of semiquinoid structure. We have identified bands corresponding exclusively to
polarons and found evidence that polarons are predominantly stabilized on the linear
segments at the branches in the polymer chain. We have shown that bipolarons are also
stabilized near the phenazine units.
(iv) in case on polythiophene derivatives we have shown that the side chain plays an
important role in the formation and stabilization of charge carriers. Thus, introduction of a
longer alkyl side chain such as hexyl stabilizes bipolarons and polaron pairs in contrast to
short alkyl chain such as methyl which stabilizes only bipolarons at high doping levels. At
low doping levels polaron formation in copolymer occurs at higher potentials than in p3MT
and at lower potentials than in p3HT, as an effect of the distribution of long and short side
alkyl chains. p3HT with a high density of long alkyl chains has a dense structure and does not
allow the dopants to enter and leave the film, thus electrochemical oxidation requires a higher
energy. In contrast, the presence of short methyl substituent in the copolymer contributes to a
reduction of the side-chain interactions by separating the long chains from each other, so
dopants may easily enter and leave the film during doping and dedoping.

Andrea Kellenberger Habilitation Thesis
Page | 108
PART II. Carrier evolution and development plan
The short term objective in my carrier is to become a PhD advisor. This step will allow to
expand the research team of Electrochemistry, Corrosion and Electrochemical Processes by
attracting future PhD students to carry out researches in the field of electrochemistry.
Working in a team will enable us to obtain valuable scientific results which will be published
in ISI indexed papers. This will contribute to the fulfilment of necessary criteria to become a
professor.
Conducting research activity also implies writing grant applications for funding. Considering
my previous experience as principal investigator and project manager in 3 national research
grants, I intend to submit funding applications also in the forthcoming calls for proposals.
Interdisciplinary collaboration is also a key aspect for a successful research activity. For
instance, our long term collaboration with the Westphalian University of Applied Sciences
has led to a proposal for HORIZON 2020, call FCH-02-1-2017, topic: Game changer Water
Electrolyzers, title: Novel modular stack design for high pressure PEM water electrolyzer
technology with wide operation range and reduced cost – PRETZEL.
For this project a consortium of 9 partners from 5 countries has been set up, which comprises
two technically oriented universities, two research institutes, one large industrial partner and
four small and medium enterprises. The aim of PRETZEL is to develop a 25 kW PEM water
electrolyzer system using a patented technology of hydraulic compression, capable to
generate 4.5 m3 H2 per hour at rated power, at an output pressure of 100 bar and feed water
temperature of maximum 90° C. The electrolyzer will dynamically operate between 4 and 6
A cm-2 with an efficiency of 70%, for more than 2000 h of operation. Moreover, the capital
cost of stack components will be largely reduced by the use of non-precious metal coatings
and advanced ceramic aerogel catalyst supports. The construction of the water electrolyzer
system requires the optimization of stack components such as the membrane electrode
assemblies (MEA), the porous current collector (CC) and the bipolar plates (BPP) which
need to be mass productive and low-cost designed for an effective use of expansive raw
materials. Due to the novel stack design based on hydraulic compression, modified
requirements are necessary for the inner cell components. New, planar and highly conductive
BPPs will be developed with anti-corrosive protection layer. The CCs are responsible for
distribution of feed water and removal of produced gas, therefore new CCs with internal
porosity gradient will be developed. The side in contact with the BPP will have a large pore
radii to achieve the function of water distribution, while the side in contact with the electrode
will have small pore radii of 6-15 µm to support the gas removal. MEAs will be also
optimized by reducing the catalyst loading by using highly porous electro ceramic support
materials, such as antimony doped tin oxide aerogel (ATO).
Within this project Politehnica University Timisoara represented by our research group will
be coordinator of the work package “Compliance testing and characterization” which has the
objective to characterize and to evaluate the developed materials and components and to
provide reliable feedback for possibly necessary adjustments. The main activities will
comprise: (i) Corrosion resistance evaluation of materials and components; (ii) Evaluation of

Andrea Kellenberger Habilitation Thesis
Page | 109
catalytic efficiency for oxygen evolution reaction (OER) and hydrogen evolution reaction
(HER); (iii) Morphology, structure and physical characterization and (iv) Evaluation of
MEAs and coated PCD in small area (25-100 cm2) PEM electrolyzer tests. UPT will also
participate in definition of specifications and requirements for the cell and stack components
and also in processing the data obtained for long term testing of the stack system.
The research direction I intend to develop are derived from the two directions pursued in my
activity after PhD and include:
Development of new electrocatalysts for hydrogen / oxygen evolution reaction
Development of new biosensors using carbon based materials such as conducting
polymers and carbon nanotubes
Development of supercapacitors for electrochemical energy storage using conducting
polymers
Regarding the development of new electrocatalysts for hydrogen / oxygen evolution reaction
one of the main goals is the reduction of the precious metal catalyst loading. This can be
achieved using two main strategies: (i) increasing the electrocatalytic activity by designing
bi-functional catalysts and (ii) by depositing noble metals on highly porous structures such as
carbon nanofibers and antimony doped tin oxide aerogel. In both strategies it is important to
deposit nanoparticles with a high degree of monodispersity and narrow particle size
distribution. This will be achieved by pulse current electrodeposition, a very efficient
electrochemical deposition method which is able to generate nanosized catalyst particles in
very short times of only a few seconds. This method has been already applied for the
preparation of nanostructured platinum catalysts used in PEM fuel cells [259-261] and for the
electrodeposition of nanocatalysts of Pt, Pt-Co, Pt-Ru [64,262-264] for different applications.
The electrodeposition parameters such as pulse time and current, off time and duty cycle will
be optimized to obtain desired dispersion, size and electrocatalytic efficiency of bi-functional
and noble metal catalysts. Part of research within this direction will be carried out in the
frame of the future PRETZEL project.
Regarding the development of new biosensors using carbon based materials such as
conducting polymers and carbon nanotubes the ambition is to obtain sensitive and selective
sensors for dopamine (DA). Dopamine is a key neurotransmitter molecule and its detection in
the ultra-low concentration range is still subject of research. The main interferents for
dopamine are ascorbic acid (AA) and uric acid (UA) which are usually found together in
physiological fluids at different concentration levels, therefore it is highly desired to design
detection methods which are able to differentiate and simultaneously detect these molecules.
One approach is to take advantage of the ability of boronic acid groups to selectively bind
dopamine by the boronic acid - diol complexation reaction [158] which leads to the formation
of an anionic ester. This can be achieved by using conducting polymers such as poly(aniline
boronic acid) (PABA) and its derivatives. PABA is known to selectively bind 1,2 and 1,3
diols and this property has been exploited for the construction of different electrochemical
biosensors [265-267]. In my research I intend to apply a newly developed electrochemical
procedure for deposition of poly(3,4-ethylendioxithiophene), which uses a sinusoidal voltage
superimposed on a d.c. potential. Compared to other electrochemical methods like cyclic

Andrea Kellenberger Habilitation Thesis
Page | 110
voltammetry, potentiostatic and galvanostatic deposition, this new method facilitates the
preparation of conducting polymer matrices characterized by higher porosity [268,269].
Poly(aniline boronic acid) modified electrodes will be obtained by electrochemical deposition
using the sinusoidal voltage method and their sensing properties for dopamine will be
determined and compared to those of electrodes obtained by cyclic voltammetry deposition.
The electrodeposition parameters such as frequency, amplitude of the sinusoidal voltage will
be optimized to obtain the highest porosity. Thus, a large number of the boronic groups will
be available for the interaction with dopamine, which is a prerequisite to enhance the
sensitivity. It is expected that the PABA sensor for dopamine developed using the sinusoidal
voltage deposition method will show improved performances.
A second approach aims to develop amperometric sensors based on electrode materials which
are capable to separate the oxidation potentials of DA, AA and UA, since they have very
close oxidation potentials. Different types of electrochemical biosensors have been designed,
usually based on carbon nanomaterials such as carbon nanofibers, nanotubes and fullerenes
decorated with metal nanoparticles [268-272]. It is well known that catalytic activity of noble
metals nanoparticles is drastically affected by particle size and its distribution. Therefore, in
my research in intend to apply the pulse current electrodeposition method to obtain highly
dispersed and with controllable size Pt or Au nanoparticles on multi-walled carbon nanotubes
(MWCNT) as a potential electrode material in the development of amperometric sensors for
dopamine.
-0.2 0.0 0.2 0.4 0.6 0.8
-20
0
20
40
60
80
I /
A
E / V/Ag/AgCl
[AA]
1660 M
(a)
-0.2 0.0 0.2 0.4 0.6 0.8
-40
-20
0
20
40
60
(b)
I /
A
E / V/Ag/AgCl
[DA]
100 M
-0.2 0.0 0.2 0.4 0.6 0.8
-40
-20
0
20
40
60
80
100
(c)
100 M
I / A
E / V/Ag/AgCl
[AA]
1660 M [DA]
1 M
Figure 82. CV curves in 0.1 M PBS solution (pH 7.4) of 1660 µM AA (a); 100 µM DA (b) and a
mixture of 1660 µM AA with different concentrations of DA (c) on GC-MWCNT electrode.
In fact, preliminary results given in Figure 82 show that the difference between the oxidation
potentials of DA and AA is about 225 mV on MWCNT electrodes. It is expected that the
electrodeposition of noble metal catalyst particles such as Pt or Au will further increase the
gap between the oxidation potentials and improve the sensibility and selectivity of the
developed biosensor. The optimization of pulse electrodeposition parameters such as pulse
time and current, off time and duty cycle can further contribute to resolve DA and AA
simultaneously.
Also, several electrochemical techniques such as square wave voltammetry and differential
pulse voltammetry will be also used to determine and compare the sensitivity, selectivity and
limit of detection of the developed electrochemical sensors.

Andrea Kellenberger Habilitation Thesis
Page | 111
Regarding the development of supercapacitors for electrochemical energy storage based on
conducting polymers the researches are justified by the exponential growth in demand for
portable electric systems and hybrid motors. Electrochemical supercapacitor act differently
from conventional dielectric capacitor as concerns the way energy is stored. Thus,
electrochemical capacitors can be classified according to the two different ways of storing
energy in: double-layer capacitors which store energy in the electric double layer and faradaic
capacitors which store energy in the form of a redox reaction. In the case of the double layer
capacitors, the electrical energy is stored as charge aggregates at the surface of the electrode
material therefore porous materials with a high specific surface area are highly effective for
this type of storage. In the case of redox reactions, electricity is usually generated by electron
transfer between the electrode and the electrolyte solution. The materials used for this type of
supercapacitors include metal oxides and conductive polymers. Asymmetric supercapacitors
combine the double layer storage with the cathode redox reaction to obtain the highest energy
density and power. Galvanostatic charge-discharge curves
As far as teaching is concerned, I will continue to constantly improve the content of my
lectures and laboratory works to make them clear, accessible and with an appropriate
scientific level for all the students. As previously, I will use interactive teaching methods, so
that the students have the opportunity to present their views, to argue and to ask questions. I
will also encourage team work to develop the students ability to exchange ideas and work
together to accomplish the assigned tasks. I will offer support to students during the
laboratory works in the use of specialized software for data acquisition and processing and I
will be constantly preoccupied in upgrading and equipping laboratories with specific
equipment intended for teaching purposes. Additionally, based on the experience gained in
research I intend to write a new lecture “Processes and materials in electrochemical energy
systems” which could be a new subject for Master students.

Andrea Kellenberger Habilitation Thesis
Page | 112
References
1. A. Kellenberger, N. Vaszilcsin, W. Brandl, N. Duteanu, Kinetics of hydrogen evolution
reaction o skeleton nickel and nickel-titanium electrodes obtained by thermal arc
spraying technique, International Journal of Hydrogen Energy 32 (2007) 3258-3265.
2. A. Kellenberger, N. Vaszilcsin, W. Brandl, Roughness factor evaluation of thermal arc
sprayed skeleton nickel electrode, Journal of Solid State Electrochemistry 11 (2007) 84-
89.
3. A. Kellenberger, N. Vaszilcsin, N. Duteanu, M.L. Dan, W. Brandl, Structure,
morphology and electrochemical properties of high surface area copper electrodes
obtained by thermal spraying techniques, Studia Universitatis Babes Bolyai, Chemia 53
(2008) 89-96.
4. A. Kellenberger, N. Vaszilcsin, Determinarea factorului de rugozitate al electrozilor pe
bază de nichel scheletat prin voltametrie ciclică, Revista de Chimie 56 (2005) 712-715.
5. C.C. Vaduva, N. Vaszilcsin, A. Kellenberger, M. Medeleanu, Catalytic enhancement of
hydrogen evolution reaction on copper in the presence of benzylamine, International
Journal of Hydrogen Energy 36 (2011) 6994-7001.
6. C.C. Vaduva, N. Vaszilcsin, A. Kellenberger, Aromatic amines as proton carriers for
catalytic enhancement of hydrogen evolution reaction on copper in acid solutions,
International Journal of Hydrogen Energy 37 (2012) 12089-12096.
7. R. Cretu, A. Kellenberger, N. Vaszilcsin, Enhancement of hydrogen evolution reaction
on platinum cathode by proton carriers, International Journal of Hydrogen Energy 38
(2013) 11685-11694.
8. R. Cretu, A. Kellenberger, M. Medeleanu, N. Vaszilcsin, Cathodic Hydrogen Evolution
Reaction on Gold Catalyzed by Proton-Carriers, International Journal of
Electrochemical Science 9 (2014) 4465-4477.
9. N. Plesu, A. Kellenberger, M. Mihali, N. Vaszilcsin, Effect of temperature on the
electrochemical synthesis and properties of polyaniline films, Journal of Non-crystalline
Solids 356 (2010) 1081-1088.
10. N. Plesu, A. Kellenberger, I. Taranu, B.O. Taranu, I. Popa, Impedimetric detection of
dopamine on poly(3-aminophenyl boronic acid) modified skeleton nickel electrodes,
Reactive & Functional Polymers 73 (2013) 772-778.
11. A. Kellenberger, N. Plesu, M. Tara Lunga Mihali, N. Vaszilcsin, Synthesis of
polyaniline nanostructures by electrochemical deposition on niobium, Polymer 54
(2013) 3166-3174.

Andrea Kellenberger Habilitation Thesis
Page | 113
12. A. Kellenberger, D. Ambros, N. Plesu, Scan rate dependent morphology of polyaniline
films electrochemically deposited on nickel, International Journal of Electrochemical
Science 9 (2014) 6821-6833.
13. M. Tara Lunga Mihali, N. Plesu, A. Kellenberger, G. Ilia, Adsorption of an Azo dye on
polyaniline/niobium substrate, International Journal of Electrochemical Science 10
(2015) 7643-7659.
14. A. Kellenberger, E. Jăhne, H.J. Adler, T. Khandelwal, L. Dunsch, In situ FTIR
spectroelectrochemistry of poly[2-(3-thienyl)ethyl acetate] and its hydrolyzed
derivatives, Electrochimica Acta 53 (2008) 7054-7060.
15. L.F. Chazaro-Ruiz, A. Kellenberger, L. Dunsch, In situ ESR-UV-Vis-NIR and ATR-
FTIR spectroelectrochemical studies on the p-doping of copolymers of 3-methy-
lthiophene and 3-hexylthiophene, Journal of Physical Chemistry B 113 (2009) 2310-
2316.
16. L.F. Chazaro-Ruiz, A. Kellenberger, E. Jăhne, H.J. Adler, T. Khandelwal, L. Dunsch,
In situ ESR-UV-Vis-NIR spectroelectrochemical study of the p-doping of poly[2-(3-
thienyl)ethyl acetate] and its hydrolyzed derivatives, Physical Chemistry Chemical
Physics 11 (2009) 6505-6513.
17. A. Kellenberger, E. Dmitrieva, L. Dunsch, The stabilization of charged states at
phenazine-like units in polyaniline under p-doping. An in situ ATR-FTIR
spectroelectrochemical study, Physical Chemistry Chemical Physics 13 (2011) 3411-
3420.
18. A. Kellenberger, E. Dmitrieva, L. Dunsch, Structure dependence of charged states in
"linear" polyaniline as studied by in situ ATR-FTIR spectroelectrochemistry, Journal of
Physical Chemistry B 116 (2012) 4377-4385.
19. R. Banica, D. Ursu, P. Svera, C. Sarvas, S.F. Rus, S. Novaconi, A. Kellenberger, A.V.
Racu, T. Nyari, N. Vaszilcsin, Electrical properties optimization of silver nanowires
supported on polyethylene terephthalate, Particulate Science & Technology, 34 (2016)
217-222
20. R. Banica, D. Ursu, T. Nyari, A. Kellenberger, Polyol synthesis of silver nanowires in
the presence of silver chloride, Journal of Optoelectronics and Advanced Materials, 19
(2017) 266-271.
21. R. Banica, D. Ursu, T. Nyari, A. Kellenberger, Two step polyol-solvothermal growth of
thick silver nanowires, Materials Letters, 194 (2017) 181-184.
22. V.A. Goltsov, T.|N. Veziroglu, L.F. Goltsova, Hydrogen civilization of the future – A
new conception of the IAHE, International Journal of Hydrogen Energy 31 (2006) 153-
159.
23. R.J. Press, K.S.V. Santhanam, J.M. Massoud, A.V. Bailey, G.A. Takacs, Introduction to
Hydrogen Technology, John Wiley, Hoboken, New Jersey, 2009, p. 196.

Andrea Kellenberger Habilitation Thesis
Page | 114
24. A. Züttel, A. Borgschulte, L. Schlapbach, Hydrogen as a Future Energy Carrier, Wiley-
VCH Verlag, Weinheim – Germany, 2008, p. 154.
25. P. Millet, Hydrogen production by polymer electrolyte membrane water electrolysis, in
V. Subramani, A. Basile and T.N. Veziroglu (Ed.) Compendium of Hydrogen Energy,
Vol. 1: Hydrogen production and Purification, Elsevier, Amsterdam, 2015, p.255-286.
26. M. Carmo, D.L. Fritz, J. Mergel, D. Stolten, A comprehensive review on PEM water
electrolysis, International Journal of Hydrogen Energy 38 (2013) 4901-4934.
27. P. Millet, N. Mbemba, S.A. Grigoriev, V.N. Fateev, A. Aukauloo, C. Etievant,
Electrochemical performances of PEM water electrolysis cells and perspectives,
International Journal of Hydrogen Energy 36 (2011) 4134-4142.
28. S. Trasatti, Work function, electronegativity, and electrochemical behaviour of metals:
III. Electrolytic hydrogen evolution in acid solutions, Journal of Electroanalytical
Chemistry and Interfacial Electrochemistry 39 (1972) 163-184.
29. A. Eftekahri, Electrocatalysts for hydrogen evolution reaction, International Journal of
Hydrogen Energy (2017) in press.
30. S.S. Tong, X.-J. Wang, Q.-C. Li, X.-J. Han, Progress on Electrocatalysts of Hydrogen
Evolution Reaction Based on Carbon Fiber Materials, Chinese Journal of Analytical
Chemistry 44 (2016) 1447-1457.
31. J.B. Yadav, J.-W. Park, Y.-J. Cho, O.-S. Joo, Intermediate hydroxide enforced
electrodeposited platinum film for hydrogen evolution reaction, International Journal of
Hydrogen Energy 35 (2010) 10067-10072.
32. A. Kiani, S. Hatami, Fabrication of platinum coated nanoporous gold film electrode: A
nanostructured ultralow-platinum loading electrocatalyst for hydrogen evolution
reaction, International Journal of Hydrogen Energy 35 (2010) 5202-5209.
33. Q. Ding, M. Liu, Y.-E. Miao, Y. Huang, T. Liu, Electrospun nickel-decorated carbon
nanofiber membranes as efficient electrocatalysts for hydrogen evolution reaction,
Electrochimica Acta 159 (2015) 1-7.
34. N.K. Mahale, S.T. Ingle, Electrocatalytic hydrogen evolution reaction on nano-nickel
decorated graphene electrode, Energy 119 (2017) 872-878.
35. L. Wang, Y. Li, M. Xi, Z. Li, Z. Chen, Z. Ma, X. Qin, G. Shao, Ni nanoparticles
supported on graphene layers: An excellent 3D electrode for hydrogen evolution
reaction in alkaline solution, Journal of Power Sources 347 (2017) 220-228.
36. P. Häussinger, R. Lohmüller, A.M. Watson, Hydrogen, 2. Production, in Ullmann's
Encyclopedia of Industrial Chemistry, Wiley-VCH Verlag GmbH & Co. KGaA, 2000.
37. M.S. Faber, R. Dziedzic, M.A. Lukowski, N.S. Kaiser, Q. Ding, S. Jin, High-
performance electrocatalysis using metallic cobalt pyrite (CoS2) micro- and
nanostructures, Journal of the American Chemical Society 136 (2014) 10053–10061.

Andrea Kellenberger Habilitation Thesis
Page | 115
38. L.-L. Feng, G. Yu, Y. Wu, G.-D. Li, H. Li, Y. Sun, T. Asefa, W. Chen, X. Zou,, High-
index faceted Ni3S2 nanosheet arrays as highly active and ultrastable electrocatalysts for
water splitting, Journal of the American Chemical Society 137 (2015) 14023–14026.
39. X R.V. Digraskar, B.B. Mulik, P.S. Walke, A.V. Ghule, B.R. Sathe, Enhanced
Hydrogen Evolution Reactions on Nanostructured Cu2ZnSnS4 (CZTS) Electrocatalyst,
Applied Surface Science 412 (2017) 475-481.
40. X. Dai, K. Du, Z. Li, H. Sun, Y. Yang, W. Zhang, X. Zhang, Enhanced hydrogen
evolution reaction on few–layer MoS2 nanosheets–coated functionalized carbon
nanotubes, International Journal of Hydrogen Energy 40 (2015) 8877–8888.
41. E.J. Popczun, J.R. McKone, C.G. Read, A.J. Biacchi, A.M. Wiltrout, N.S. Lewis, R.E.
Schaak, Nanostructured nickel phosphide as an electrocatalyst for the hydrogen
evolution reaction, Journal of the American Chemical Society 135 (2013) 9267–9270.
42. P. Xiao, M.A. Sk, L. Thia, X. Ge, R.J. Lim, J.-Y. Wang, K.H. Lim, X. Wang,
Molybdenum phosphide as an efficient electrocatalyst for the hydrogen evolution
reaction, Energy and Environmental Science 7 (2014) 2624–2629.
43. H. Du, S. Gu, R. Liu, C.M. Li, Highly active and inexpensive iron phosphide nanorods
electrocatalyst towards hydrogen evolution reaction, International Journal of Hydrogen
Energy 40 (2015) 14272–14278.
44. C. Tang, A. Sun, Y. Xu, Z. Wu, D. Wang, High specific surface area Mo2C
nanoparticles as an efficient electrocatalyst for hydrogen evolution, Journal of Power
Sources 296 (2015) 18–22.
45. C. Tang, W. Wang, A. Sun, C. Qi, D. Zhang, Z. Wu, D. Wang, Sulfur-decorated
molybdenum carbide catalysts for enhanced hydrogen evolution, ACS Catalysis 5 (2015)
6956–6963.
46. P. Wang, J. Qi, X. Chen, C. Li, T. Wang, C. Liang, New insights into high-valence state
Mo in molybdenum carbide nanobelts for hydrogen evolution reaction, International
Journal of Hydrogen Energy (2017) in press.
47. Y. Zheng, Y. Jiao, Y. Zhu, L.H. Li, Y. Han, Y. Chen, A. Du, M. Jaroniec, S.Z. Qiao,
Hydrogen evolution by a metal-free electrocatalyst, Nature Communications 5 (2014).
48. S.G. Mairanovskii, The theory of catalytic hydrogen waves in organic polarography,
Journal of Electroanalytical Chemistry 6 (1963) 77-118.
49. M. Heyrovsky, Catalytic Hydrogen Evolution at Mercury Electrodes from Solutions of
Peptides and Proteins. In: E. Paleček, F. Scheller, J. Wang (editors): Electrochemistry of
Nucleic Acids and Proteins, Vol 1, Elsevier, Amsterdam, 2005, p. 657-687.
50. M. Živanović, M. Aleksić, V. Ostatná, T. Doneux, E. Paleček, Polylysine-Catalyzed
Hydrogen Evolution at Mercury Electrodes, Electroanalysis 22 (2010) 2064-2070.
51. M. Heyrovsky, Early polarographic studies on proteins, Electroanalysis 16 (2004) 1067-
1073.

Andrea Kellenberger Habilitation Thesis
Page | 116
52. M. Heyrovsky, Research Topic – Catalysis of Hydrogen Evolution on mercury
electrodes, Croatica Chemica Acta 17 (2006) 1-4.
53. A.N. Frumkin, Hydrogen Overvoltage and Adsorption phenomena. In: P. Delahay, C.W.
Tobias (editors): Advances in Electrochemistry and Electrochemical Engineering, Vol.
3, Interscience Publishers Inc, New York, 1963, p.65-122.
54. V. Mirčeski, S. Skrzypek, W. Ciesielski, A. Sokołowski, Theoretical and experimental
study of the catalytic hydrogen evolution reaction in the presence of an adsorbed catalyst
by means of square-wave voltammetry, Journal of Electroanalytical Chemistry 585
(2005) 97-104.
55. E. Dayalan, R. Narayan, The acceleration of the hydrogen evolution reaction from acid
solutions by sulfur compounds: Part I. Mercury electrode, Journal of Electroanalytical
Chemistry 179 (1984) 167–-178.
56. J. Bukowska, K. Jackowska, Influence of thiourea on hydrogen evolution at a silver
electrode as studied by electrochemical and SERS methods, Journal of Electroanalytical
Chemistry 367 (1994) 41-48.
57. C.C. Vaduva, N. Vaszilcsin, A. Kellenberger, M. Medeleanu, Inhibition effect of some
aromatic amines on copper electrodeposition from acidic baths, Journal of Applied
Electrochemistry 42 (2012) 217-224.
58. N. Pentland, J.O.M. Bockris, E. Sheldon, Hydrogen evolution reaction on copper, gold,
molybdenum, palladium, rhodium and iron, Journal of the Electrochemical Society 104
(1957) 182-194.
59. A.K. Khanova, L.I. Krishtalik, Kinetics of the hydrogen evolution reaction on gold
electrode. A new case of the barrierless discharge, Journal of Electroanalytical
Chemistry 660 (2011) 224-229.
60. C.H. Hamann, A. Hammett, W. Vielstich, Electrochemistry, Wiley VCH Verlag,
Weinheim, 2007.
61. R. Muntean, U. Rost, G. Marginean, N. Vaszilcsin, Optimisation of the electrodeposition
parameters for platinum nanoparticles on carbon nanofibers support, Solid State
Phenomena 254 (2016) 153-158.
62. K.E. Ayers, J.N. Renner, N. Danilovic, J.X. Wang, Y. Zhang, R. Maric, H. Yu,
Pathways to ultra-low platinum group metal catalyst loading in proton exchange
membrane electrolyzers, Catalysis Today 262 (2016) 121-132.
63. B. Devadas, T. Imae, Hydrogen evolution reaction efficiency by low loading of platinum
nanoparticles protected by dendrimers on carbon materials, Electrochemistry
Communications 72 (2016) 135-139.
64. R.D. Armstrong, M. Henderson, Impedance plane display of a reaction with an adsorbed
intermediate, Journal of Electroanalytical Chemistry and Interfacial Electrochemistry
39 (1972) 81-90.

Andrea Kellenberger Habilitation Thesis
Page | 117
65. A. Lasia, Applications of the Electrochemical Impedance Spectroscopy to Hydrogen
Adsorption, Evolution and Absorption into Metals, In: Modern Aspects of
Electrochemistry, B.E. Conway and R.E. White (editors), Kluwer/Plenum, New York,
vol. 35, p. 1-49 (2002).
66. A. Lasia, On the mechanism of hydrogen absorption reaction, Journal of
Electroanalytical Chemistry 593 (2006) 159-166.
67. M. Stackelberg, H. Fassbender, Untersuchungen zur Katalyse der
Wasserstoffabscheidung an der Quecksilberkathode durch organische Stoffe I.
Allgemeine Untersuchungen über den Strom und die Strömungen an der Elektrode,
Zeitschrift für Elektrochemie, Berichte der Bunsengesellschaft für Physikalische Chemie
62 (1958) 834-839.
68. M. Stackelberg, W. Hans, W. Jensch, Untersuchungen zur Katalyse der
Wasserstoffabscheidung an der Quecksilberkathode durch organische Stoffe II. Die
konstitutionellen Voraussetzungen für die katalytische Wirksamkeit, Zeitschrift für
Elektrochemie, Berichte der Bunsengesellschaft für Physikalische Chemie 62 (1958)
839-850.
69. S.G. Mairanovskii, Theory of catalytic hydrogen waves in organic polarography,
Russian Chemical Reviews 33 (1964) 38-55.
70. A. G. MacDiarmid, A. J. Epstein, Polyanilines: A novel class of conducting polymers,
Faraday Discussions of the Chemical Society 88 (1989) 317-332.
71. W. S. Huang, B. H. Humphrey, A. G. MacDiarmid, Polyaniline, a novel conducting
polymer. Morphology and chemistry of its oxidation and reduction in aqueous
electrolytes, Journal of the Chemical Society Faraday Transactions 1 8 (1986) 2385.
72. G. Inzelt, Conducting Polymers. A New Era in Electrochemistry, Springer-Verlag
Berlin, Heidelberg, 2012.
73. Z. Cai, C.R. Martin, Electronically conductive polymer fibers with mesoscopic
diameters showed enhanced electronic conductivities, Journal of the American Chemical
Society 111 (1989) 4138-4139.
74. C.R. Martin, R. Parthasarathy, V. Menon, Template synthesis of electronically
conductive polymers – A new route for achieving higher electronic conductivities,
Synthetic Metals 55 (1993) 1165-1170.
75. C.R. Martin, R. Parthasarathy, V. Menon, Template synthesis of electronically
conductive polymers – preparation of thin films, Electrochimica Acta 39 (1994) 1309-
1313.
76. D. Li, J. Huang, R.B. Kaner, Polyaniline Nanofibers: A Unique Polymer nanostructure
for Versatile Applications, Accounts of Chemical Research 42 (2009) 135-145.
77. L. Xia, Z. Wei, M. Wan, Conducting polymer nanostructures and their application in
biosensors, Journal of Colloid and Interface Science 341 (2010) 1-11.

Andrea Kellenberger Habilitation Thesis
Page | 118
78. D.M. Sarno, S.K. Manohar, A.G. MacDiarmid, Controlled interconversion of
semiconducting and metallic form of polyaniline nanofibers, Synthetic Metals 148
(2005) 237-243.
79. X. Zhang, W.J. Goux, S.K. Manohar, Synthesis of Polyaniline Nanofibers by „Nanofiber
Seeding”, Journal of the American Chemical Society 126 (2004) 4502-4503.
80. R.Chan-Yu-King, F.Roussel, Morphological and electrical characteristics of polyaniline
nanofibers, Synthetic Metals 153 (2005) 337-340.
81. S. Xing, C. Zhao, S. Jing, Z. Wang, Morphology and conductivity of polyaniline
nanofibers prepared by „seeding| polymerization, Polymer 47 (2006) 2305-2313.
82. N.-R.Chiou, A.J.Epstein, A Simple Approach to Control the Growth of Polyaniline
Nanofibers, Synthetic Metals 153 (2005) 69-72.
83. J. Chen, Y. Xu, Y. Zheng, L. Dai, H. Wu, The design, synthesis and characterization of
polyaniline nanophase materials, Comptes Rendus Chimie 11 (2008) 84-89.
84. Z. Zhang, J. Deng, M. Wan, Highly crystalline and thin polyaniline nanofibers oxidized
by ferric chloride, Materials Chemistry and Physics 115 (2009) 275-279.
85. A. Rahy, D.J. Yang, Synthesis of highly conductive polyaniline nanofibers, Materials
Letters 62 (2008) 4311-4314.
86. S.P. Surwade, S.R. Agnihotra, V. Dua, N. Manohar, S. Jain, S. Ammu, S.K. Manohar,
Catalyst-free synthesis of Oligoanilines and Polyaniline Nanofibers Using H2O2, Journal
of the American Chemical Society 131 (2009) 12528-12529.
87. J. Huang, R.B. Kaner, A General Chemical route to Polyaniline Nanofibers, Journal of
the American Chemical Society 126 (2004) 851-855.
88. J. Huang, R.B. Kaner, The intrinsic nanofibrillar morphology of polyaniline, Chemistry
Communications (2006) 367-376.
89. D. Li, R.B. Kaner, Shape and Aggregation Control of Nanoparticles: Not Shaken, Not
Stirred, Journal of the American Chemical Society 128 (2006) 968-975.
90. X. Zhang, R. Chan-Yu-King, A. Jose, S.K. Manohar, Nanofibers of polyaniline
synthesized by interfacial polymerization, Synthetic Metals 145 (2004) 23-29.
91. S. Mu, Novel properties of polyaniline nanofibers coated with polycathecol, Synthetic
Metals 156 (2006) 202-208.
92. D. Wei, C. Kvarnström, T. Lindfors, A. Ivaska, Polyaniline nanotubules obtained in
room-temperature ionic liquids, Electrochemistry Communications 8 (2006) 1563-1566.
93. S. Mu, Y. Yang, Spectral Characteristics of Polyaniline Nanostructures Synthesized
Using Cyclic Voltammetry at Different Scan Rates, Journal of Physical Chemistry B
112 (2008) 11558-11563.
94. Y. Guo, Y. Zhou, Polyaniline nanofibers fabricated by electrochemical polymerization:
A mechanistic study, European Polymer Journal 43 (2007) 2292-2297.

Andrea Kellenberger Habilitation Thesis
Page | 119
95. N.T. Kemp, J.W. Cochrane, R. Newbury, Characteristics of the nucleation and growth of
template-free polyaniline nanowires and fibrils, Synthetic Metals 159 (2009) 435-444.
96. H. Zhang, J. Wang, Z. Wang, F. Zhang, S. Wang, Electrodeposition of polyaniline
nanostructures: A lamellar structure, Synthetic Metals 159 (2009) 277-281.
97. H.H. Zhou, S.Q. Jiao, J.H. Chen, W.Z. Wei, Y.F. Kuang, Relationship between
preparation conditions, morphology and electrochemical properties of polyaniline
prepared by pulse galvanostatic method (PGM), Thin Solid Films 450 (2004) 233-239.
98. H. Zhou, J. Wen, X. Ning, C. Fu, J. Chen, Y. Kuang, Electrosynthesis of polyaniline
films on titanium by pulse potenstiostatic method, Synthetic Metals 157 (2007) 98-103.
99. A.G. MacDiarmid, A.J. Epstein, The concept of secondary doping as applied to
polyaniline, Synthetic Metals 65 (1994) 103-116.
100. S.K. Jeong, J.S. Suh, E.J. Oh, Y.W. Park, C.Y. Kim, A.G. MacDiarmid, Preparation of
polyaniline free standing film by controlled processing and its transport property,
Synthetic Metals 69 (1995) 171-172.
101. C. Zhou, J. Han, R. Guo, Controllable Synthesis of Polyaniline Multidimensional
Architectures: Form Plate-like Structures to Flower-like Superstructures,
Macromolecules, 41 (2008) 6473-6479.
102. C.A. Amarnath, J. Kim, K. Kim, J. Choi, D. Sohn, Nanflakes to nanorods and
nanospheres transition of selenious acid doped polyaniline, Polymer 49 (2008) 432-437.
103. H. Wang, Y. Lu, Morphological control of self-assembly polyaniline micro/nano-
structures using dichloroacetic acid, Synthetic Metals 162 (2012) 1369-1374.
104. W. Zhao, L. Ma, K. Lu, Facile Synthesis of Polyaniline Nanofibers in the Presence of
Polyethylene Glycol, Journal of Polymer Research 14 (2007) 1-4.
105. Y. Li, Y. Wang, X. Jing, R. Zhu, Early stage pH-profile: the key factor controlling the
construction of polyaniline micro/nanostructures, Journal of Polymer Research 18
(2011) 2119-2131.
106. P. Singh, R.A. Singh, Preparation and characterization of polyaniline nanostructures via
a interfacial polymerization method, Synthetic Metals 162 (2012) 2193-2200.
107. X.-Y. Peng, F. Luan, X.-X. Liu, D. Diamond, K.-T. Lau, pH-controlled morphological
structure of polyaniline during electrochemical deposition, Electrochimica Acta 54
(2009) 6172-6177.
108. A. Cot, S. Lakard, J. Dejeu, P. Rougeot, C. Magnenet, B. Lakard, M. Gauthier,
Electrosynthesis and characterization of polymer films on silicon substrate for
applications in micromanipulation, Synthetic Metals 162 (2012) 2370-2378.
109. N. Li, YH. Xiao, CZ. Xu, HH. Li, XD. Yang, Facile Preparation of Polyaniline
Nanoparticles via Electrodeposition for Supercapacitors, International Journal of
Electrochemical Science 8 (2013) 1181-1188.

Andrea Kellenberger Habilitation Thesis
Page | 120
110. G.T. Andrade, M.J. Aguirre, S.R. Biaggio, Influence of the first potential scan on the
morphology and electrical properties of potentiodynamically grown polyaniline films,
Electrochimica Acta 44 (1998) 633-642.
111. M. Žic, The effect of PANI-free volume on impedance response, Journal of
Electroanalytical Chemistry 610 (2007) 57-66.
112. M.J. Rodriguez Presa, H.L. Bandey, R.I. Tucceri, M.I. Florit, D. Posadas, A.R. Hillman,
Film thickness and electrolyte concentration effects on the EIS response of Poly-(o-
toluidine) in the conducting state, Electrochimica Acta 44 (1999) 2073-2085.
113. V. Horvat-Radošević, K. Kvastek, M. Kraljić Roković, Impedance spectroscopy of
oxidized polyaniline and poly(o-ethoxyaniline) thin film modified Pt electrodes,
Electrochimica Acta 51 (2006) 3417–3428.
114. M. Žic, The influence of the PANI structure on the conductive mechanism and on the
electrical equivalent circuit analysis, Journal of Electroanalytical Chemistry 653 (2009)
29-38.
115. C.-C. Hu, C.-H. Chu, Electrochemical impedance characterization of polyaniline-coated
graphite electrodes for electrochemical capacitors – effects of film coverage/thickness
and anions, Journal of Electroanalytical Chemistry 503 (2001) 105-116.
116. D.H. Zhou, Y.H. Li, J.Y. Wang, P. Xu, X.J. Han, Synthesis of polyaniline nanofibers
with high electrical conductivity from CTAB-SDBS mixed surfactants, Materials
Letters 65 (2011) 3601-3604.
117. HL. Li, JX. Wang, QX. Chu, Z. Wang, FB. Zhang, SC. Wang, Theoretical and
experimental specific capacitance of polyaniline in sulfuric acid, Journal of Power
Sources 190 (2009) 578-586.
118. J.B. Zang, Y.H. Wang, X.Y. Zhao, G.X Xin, S.P. Sun, X.H. Qu, S.B. Ren,
Electrochemical synthesis of polyaniline on nanodiamond powder, International Journal
of Electrochemical Science 7 (2012) 1677-1687.
119. Y. Zhang, X. Jiang, R. Zhang, P. Sun, Y. Zhou, Influence of the nanostructure on charge
transport in polyaniline films, Electrochimica Acta 56 (2011) 3264-3269.
120. R. Kiebooms, R. Menon, K. Lee, Synthesis, Electrical and Optical Properties of
Conjugated Polymers, in: H.S. Nalwa (Ed.), Handbook of Advanced Electronic and
Photonic Materials and Devices, Vol. 8. Conducting Polymers, Academic Press, New
York, 2001, pp. 1-102.
121. M. Gholamian, A.Q. Contractor, Effect of the temperature of synthesis on the
conductivity and electrochemical behavior of polyaniline, Journal of Electroanalytical
Chemistry 252 (1988) 291-301.
122. P.M. Beadle, Y.F. Nicolau, E. Banka, P. Rannou, D. Djurado, Controlled polymerization
of aniline at sub-zero temperatures, Synthetic Metals 95 (1998) 29-45.

Andrea Kellenberger Habilitation Thesis
Page | 121
123. C.-C. Hu, J.-Y. Lin, Effects of the loading and polymerization temperature on the
capacitive performance of polyaniline in NaNO3, Electrochimica Acta 47 (2002) 4055-
4067.
124. G. Boara, M. Sparpaglione, Synthesis of polyanilines with high electrical conductivity,
Synthetic Metals 72 (1995) 135-140.
125. M.R. Nateghi, M. Zahedi, M.H. Mosslemin, S. Hashemian, S. Bezhad, A. Minnai,
Autoacceleration/degradation of electrochemical polymerization of substituted anilines,
Polymer 46 (2005) 11476-11483.
126. M. Probst, R. Holze, Time and temperature-dependent changes of the in situ
conductivity of polyaniline and polyindoline, Electrochimica Acta 40 (1995) 213-219.
127. R. Ansari, W.E. Price, G.G. Walace, Effect of thermal treatment on the electroactivity of
polyaniline, Polymer 37 (1996) 917-923.
128. M. Trchová, I. Šeděnková, E. Tobolková, J. Stejskal, FTIR spectroscopic and
conductivity study of the thermal degradation of polyaniline films, Polymer Degradation
and Stability 86 (2004) 179-185.
129. I. Šeděnková, M. Trchová, J. Stejskal, Thermal degradation of polyaniline films
prepared in solutions of strong and weak acids and in water – FTIR and Raman
spectroscopic studies, Polymer Degradation and Stability 93 (2008) 2147-2157.
130. S. Bhadra, D. Khastgir, Extrinsic and intrinsic structural change during heat treatment of
polyaniline, Polymer Degradation and Stability 93 (2008) 1094-1099.
131. K. Luo, N. Shi, C. Sun, Thermal transition of electrochemically synthesized polyaniline,
Polymer Degradation and Stability 91 (2006) 2660-2664.
132. S.K. Mondal, N. Munichandraiah, The effect of low temperature treatment on
electrochemical activity of polyaniline, Journal of Electroanalytical Chemistry 595
(2006) 78-86.
133. J.H. Lim, J. Choi, Formation of niobium oxide nanowires by thermal oxidation, Journal
of Industrial and Engineering Chemistry 15 (2009) 860–864.
134. I. Arsova, P. Abdurauf, T. Grčev, Lj. Arsov, Electrochemical characterization of the
passive films formed on niobium surfaces in H2SO4 solutions, Journal of the Serbian
Chemical Society 71 (2006) 177–187.
135. D.B. Camovska, M.Lj. Arsov, T.P. Grčev, Electrochemical and impedance
characterization of passive films on niobium in alkaline and acidic solutions,
Macedonian Journal of Chemistry and Chemical Engineering 26 (2007) 95–101.
136. L. Zhang, Y. Long, Z. Chen, M. Wan, The Effect of Hydrogen Bonding on Self-
Assembled Polyaniline Nanostructure, Advanced Functional Materials 14 (2004) 693-
698.
137. M. Trchová, E.N. Konyushenko, J. Stejskal, J. Kovářová, G. Ćirić-Marjanović, The
conversion of polyaniline nanotubes to nitrogen-containing carbon nanotubes and their

Andrea Kellenberger Habilitation Thesis
Page | 122
comparison with multi-walled carbon nanotubes, Polymer Degradation and Stability 94
(2009) 929-938.
138. H. Guan, L.Z. Fan, H. Zhang, X. Qu, Polyaniline nanofibers obtained by interfacial
polymerization for high-rate supercapacitors, Electrochimica Acta 56 (2010) 964-968.
139. D.S. Dhawale, R.R. Salunkhe, V.S. Jamadade, D.P. Dubal, S.M. Pawar, C.D. Lokhande,
Hydrophilic polyaniline nanofibrous architecture using electrosynthesis method for
supercapacitor application, Current Applied Physics 10 (2010) 904-909.
140. D. Zhang, Y. Wang, Synthesis and applications of one-dimensional nano-structured
polyaniline: An overview, Materials Science and Engineering B 134 (2006) 9-19.
141. J. Stejskal, I. Sapurina, M. Trchová, E. Konyushenko, P. Holler, The genesis of
polyaniline nanotubes, Polymer 47 (2006) 8253-8262.
142. J. Stejskal, I. Sapurina, M. Trchová, Polyaniline nanostructures and the role of aniline
oligomers and their formation, Progress in Polymer Science 35 (2010) 1420-1481.
143. E. Tamburri, S. Orlanducci, V. Guglielmotti, G. Reina, M. Rossi, M.L. Terranova,
Engineering detonation nanodiamond – Polyaniline composites by electrochemical
routes: Structural features and functional characterizations, Polymer 52 (2011) 5001-
5008.
144. U. Lange, N.V. Roznyatovskaya, V.M. Mirsky, Conducting polymers in chemical
sensors and arrays, Analytica Chimica Acta 614 (2008) 1-26.
145. T. Lindfors, A. Ivaska, Potentiometric and UV-Vis characterization of N-substituted
polyaniline, Journal of Electroanalytical Chemistry 535 (2002) 65-74.
146. M. Nicolas, B. Fabre, G. Marchand, J. Simonet, New boronic-acid- and boronate-
substituted aromatic compounds as precursors of fluoride responsive conjugated
polymer films, European Journal of Organic Chemistry (2000) 1703-1710.
147. M.S. Freund, B.A. Deore, Boronic Acid Substituted Self-Doped Polyaniline, in Self-
Doped Conducting Polymers, John Wiley & Sons, Ltd, Chichester, UK, (2007) 156-218.
148. H. Çiftçi, Y. Oztekin, U. Tamer, A. Ramanavicine, A. Ramanavicius, Development of
poly(3-aminophenylboronic acid) modified graphite electrode suitable for fluoride
determination, Talanta 126 (2014) 202-207.
149. S. Wu, T. Han, J. Guo, Y. Cheng, Poly(3-aminophenylboronic acid)-reduced graphene
oxide nanocomposite modified electrode for ultrasensitive electrochemical detection of
fluoride with a wide response range, Sensors and Actuators B 220 (2015) 1305-1310.
150. H. Çiftçi, U. Tamer, Electrochemical determination of iodide by poly(3-aminophenyl-
boronic acid) film electrode at moderately low pH ranges, Analytica Chimica Acta 687
(2011) 137-140.
151. E. Shoji, M.S. Freund, Potentiometric saccharide detection based on the pKa changes of
poly(aniline boronic acid), Journal of the American Chemical Society 124 (2002) 12486-
12493.

Andrea Kellenberger Habilitation Thesis
Page | 123
152. Y. Ma, X. Yang, One saccharide sensor based on the complex of the boronic acid and
the monosaccharide using electrochemical impedance spectroscopy, Journal of
Electroanalytical Chemistry 580 (2005) 348-352.
153. J.T. English, B.A. Deore, M.S. Freund, Biogenic amine vapour detection using
poly(anilineboronic acid) films, Sensors and Actuators B 115 (2006) 666-671.
154. B. Fabre, L. Taillebois, Poly(aniline boronic acid)-based conductimetric sensor of
dopamine, Chemical Communications (2003) 2982-2983.
155. J. Li, N. Zhang, Q. Sun, Z. Bai, J. Zheng, Electrochemical sensor for dopamine based on
imprinted silica matrix- poly(aniline boronic acid) hybrid as recognition element,
Talanta 159 (2016) 379-386.
156. J. Rick, T.-C. Chou, Amperometric protein sensor – fabricated as a polypyrrole, poly-
aminophenylboronic acid bilayer, Biosensors and Bioelectronics 22 (2006) 329-335.
157. N. Plesu, A. Kellenberger, N. Vaszilcsin, I. Manoviciu, Electrochemical polymerization
of aniline on skeleton nickel electrodes, Molecular Crystals and Liquid Crystals 416
(2004) 127-135.
158. E. L. Muetterties, The chemistry of boron and its compounds, Wiley, New York, 1967,
pp. 495-500.
159. S.R. Ali, R.R. Parajuli, Y. Balogun, Y. Ma, H. He, A nonoxidative electrochemical
sensor based on a self-doped polyaniline/carbon nanotube composite for sensitive and
selective detection of the neurotransmitter dopamine: A Review, Sensors 8 (2008) 8423-
8452.
160. J.Y. Park, S. M. Park, DNA hybridization sensors based on electrochemical impedance
spectroscopy as a detection tool, Sensors 9 (2009) 9513-9532.
161. Y. Park, B.Y. Chang, H. Nam, S.M. Park, Selective electrochemical sensing of glycated
hemoglobin (HbA1c) on thiophene-3-boronic acid self-assembled monolayer covered
gold electrodes, Analytical Chemistry 80 (2008) 8035-8044.
162. J.Y. Park, Y.S. Lee, B.H. Kim, S.M. Park, (R)-Lipo-diaza-18-crown-6self-assembled
monolayer as a selective serotonin receptor, Analytical Chemistry 80 (2009) 4986-4993.
163. V. Sharma, P. Rekha, P. Mohanty, Nanoporous hypercrosslinked polyaniline: An
efficient adsorbent for the adsorptive removal of cationic and anionic dyes, Journal of
Molecular Liquids 222 (2016) 1091-1100.
164. S.M. Ahmed, F.I. El-Dib, N.Sh. El-Gendy, W.M. Sayed, M. El-Khodary, A kinetic
study for the removal of anionic sulphonated dye from aqueous solution using nano-
polyaniline and Baker’s yeast, Arabian Journal of Chemistry 9 (2016) S1721-S1728.
165. M. Saad, H. Tahir, J. Khan, U. Hameed, A. Saud, Synthesis of polyaniline nanoparticles
and their application for the removal of Crystal Violet dye by ultrasonicated adsorption
process based on Response Surface Methodology, Ultrasonics Sonochemistry 34 (2017)
600-608.

Andrea Kellenberger Habilitation Thesis
Page | 124
166. M. Bhaumik, R.I. McCrindle, A. Maity, S. Agarwal, V.K. Gupta, Polyaniline nanofibers
as highly effective re-usable adsorbent for removal of reactive black 5 from aqueous
solutions, Journal of Colloid and Interface Science 466 (2016) 442-451.
167. V. Janaki, K. Vijayaraghavan, B.-T. Oh, K.-J. Lee, K. Muthuchelian, A.K. Ramasamy,
S. Kamala-Kannan, Starch/polyaniline nanocomposite for enhanced removal of reactive
dyes from synthetic effluent, Carbohydrate Polymers 90 (2012) 1437-1444.
168. V. Janaki, B.-T. Oh, K. Shanthi, K.-J. Lee, A.K. Ramasamy, S. Kamala-Kannan,
Polyaniline/chitosan composite: An eco-friendly polymer for enhanced removal of dyes
from aqueous solution, Synthetic Metals 162 (2012) 974-980.
169. S. Agarwal, I. Tyagi, V.K. Gupta, F. Golbaz, A.N. Golikand, O. Moradi, Synthesis and
characteristics of polyaniline/zirconium oxide conductive nanocomposite for dye
adsorption application, Journal of Molecular Liquids 218 (2016) 494-498.
170. S. Debnath, N. Ballav, H. Nyoni, A. Maity, K. Pillay, Optimization and mechanism
elucidation of the catalytic photo-degradation of the dyes Eosin Yellow (EY) and
Naphthol blue black (NBB) by a polyaniline-coated titanium dioxide nanocomposite,
Applied catalysis B: Environmental 163 (2015) 330-342.
171. V.K. Gupta, D. Pathania, N.C. Kothiyal, G. Sharma, Polyaniline zirconium (IV)
silicophosphate nanocomposite for remediation of methylene blue dye from waste water,
Journal of Molecular Liquids 190 (2014) 139-145.
172. M. Granström, M.G. Harrison, R.H. Friend, Electro-optical Polythiophene Devices, in
D. Fichou (Ed.) Handbook of Oligo- and Polythiophenes, Wiley VCH, Weinheim, 1999,
pp. 405-458.
173. H.E. Katz, A. Dodabalapur, Z. Bao, Oligo- and Polythiophene Field Effect Transistors,
in D. Fichou (Ed.) Handbook of Oligo- and Polythiophenes, Wiley VCH, Weinheim,
1999, pp. 459-490.
174. G. Kossmehl, G. Engelmann, Application of electrically Conductive Polythiophenes in
in D. Fichou (Ed.) Handbook of Oligo- and Polythiophenes, Wiley VCH, Weinheim,
1999, pp. 491-517.
175. C. Kvarnström, A. Ivaska, Characterization and Applications of Poly(p-phenylene) and
Poly(p-phenylenevinylene), in H.S. Nalwa (ed.) Handbook of Organic Conductive
Molecules and Polymers, Vol. 4, John Wiley & Sons, 1997, pp. 487.
176. Arbizzani, M. Mastragostino, B. Scrosati, Conducting Polymers for Batteries,
Supercapacitors and Optical Devices in H.S. Nalwa (ed.) Handbook of Organic
Conductive Molecules and Polymers, Vol. 4, John Wiley & Sons, 1997, pp. 595-619.
177. H. Shirakawa, E.J. Louis, A.G.Mac Diarmid, C.K. Chiang, A.J. Heeger, Synthesis of
electrically conducting organic polymers: halogen derivatives of polyacetylene, (CH)x,
Journal of the Chemical Society, Chemical Communications 16 (1977) 578-580.

Andrea Kellenberger Habilitation Thesis
Page | 125
178. C. Kvarnström, H. Neugebauer, S. Blomquist, H.J. Ahonen, J. Kankare, A. Ivaska, In
situ spectroelectrochemical characterization of poly(3,4-ethylenedioxythiophene),
Electrochimica Acta 44 (1999) 2739-2750.
179. C. Kvarnström, H. Neugebauer, A. Ivaska, N.S. Sariciftci, Vibrational signatures of
electrochemical p- and n-doping of poly(3,4-ethylenedioxythiophene) films: an in situ
attenuated total reflection Fourier transform infrared (ATR-FTIR) study, Journal of
Molecular Structure 521 (2000) 271-277.
180. H. Neugebauer, C. Kvarnström, A. Cravino, T. Yohannes, N.S. Sariciftci, Photoexcited
spectroscopy and in situ electrochemical spectroscopy in conjugated polymers: a
comparative study, Synthetic Metals 116 (2001) 115-121.
181. H. Neugebauer, A. Cravino, S. Luzzati, M. Catellani, A. Petr, L. Dunsch, N.S. Sariciftci,
Spectral signatures of positive and negative charged states in doped and photoexcited
low band-gap polydithienithiophenes, Synthetic Metals 139 (2003) 747-750.
182. H. Neugebauer, Infrared signatures of positive and negative charge carriers in
conjugated polymers with low band gaps, Journal of Electroanalytical Chemistry 563
(2004) 153-159.
183. https://www.ifw-dresden.de/de/institute/institut-fuer-festkoerperforschung/nanoscale-
chemistry/ - accessed on 06.03.2017.
184. P. Rapta, E. Dmitrieva, A.A. Popov, L. Dunsch, In situ spectroelectrochemistry of
Organic Compounds, in O. Hammerich and B. Speiser (Ed.), Organic Electrochemistry,
Fifth Edition, CRC Press, Taylor & Francis Group, Boca Raton, 2016, pp. 169-190.
185. R.-M. Latonen, C. Kvarnström, A. Ivaska, In situ UV–vis and FTIR attenuated total
reflectance studies on the electrochemically synthesized copolymer from biphenyl and 3-
octylthiophene, Journal of Electroanalytical Chemistry 512 (2001) 36–48.
186. S. Stafström, J.L. Brédas, A.J. Epstein, H.S. Woo, D.B. Tanner, W.S. Huang, A.G.
MacDiarmid, Polaron lattice in highly conducting polyaniline: Theoretical and optical
study, Physical Review Letters 59 (1987) 1464-1467.
187. W.R. Salaneck, I. Lundström, B. Rånby. Conjugated polymers and related materials.
The interconnection of chemical and electronic structure. Proceedings of the Eighty-first
Nobel Symposium. Oxford, New York: Oxford University Press, 1993.
188. R. Willstätter, C.W. Moore, Über Anilinschwarz. I., Berichte der Deutschen Chemischen
Gesselschaft 40 (1907) 2665-2689.
189. A.G. Green, S. Wolff, Anilinschwarz und seine Zwischenkörper. III., Berichte der
Deutschen Chemischen Gesselschaft 46 (1913) 33-49.
190. L. Dunsch, Dissertation, Bergakademie Freiberg, 1973.
191. G. Ćirić-Marjanović, M. Trchová and J. Stejskal, The chemical oxidative polymerization
of aniline in water: Raman spectroscopy, Journal of Raman Spectroscopy 39 (2008)
1375-1387.

Andrea Kellenberger Habilitation Thesis
Page | 126
192. M. Trchová, I. Šeděnková, E. N. Konyushenko, J. Stejskal, P. Holler and G. Ćirić-
Marjanović, Evolution of polyaniline nanotubes: the oxidation of aniline in water,
Journal of Physical Chemistry B 110 (2006) 9461-9468.
193. G.M. Do Nascimento, C.H.B. Silva, C.M.S. Izumi, M.L.A. Temperini, The role of cross-
linking structures to the formation of one-dimensional nano-organized polyaniline and
their Raman fingerprint, Spectrochimica Acta Part A 71 (2008) 869-875.
194. G.M. Do Nascimento, C.H.B. Silva, M.L.A. Temperini, Spectroscopic characterization
of the structural changes of polyaniline nanofibers after heating, Polymer Degradation
and Stability 93 (2008) 291-297.
195. G.M. Do Nascimento, M.LA. Temperini, Studies on the resonance Raman spectra of
polyaniline obtained with near-IR excitation, Journal of Raman Spectroscopy 39 (2008)
772-778.
196. G. Socrates. Infrared and Raman characteristic group frequencies. Table and charts, ed.
John Wiley and Sons, Ltd, Chichester, 3rd edn., 2001, 107-113, 123, 157-167, 176-177,
220-222.
197. G. Ćirić-Marjanović, N. Blinova, M. Trchová and J. Stejskal, Chemical Oxidative
Polymerization of Safranines, Journal of Physical Chemistry B 111 (2007) 2188-2199.
198. J. Tang, X. Jing, B. Wang, F. Wang, Infrared spectra of soluble polyaniline, Synthetic
Metals 24 (1988) 231-238.
199. C. Stammer, A. Taurins, Infrared spectra of phenazines, Spectrochimica Acta 19 (1963)
1625-1654.
200. X.-G. Li, M.-R. Huang, W. Duan, Y.-L. Yang, Novel Multifunctional Polymers from
Aromatic Diamines by Oxidative Polymerizations, Chemical Reviews 102 (2002) 2925-
3030.
201. K. Chiba, T. Ohsaka, Y. Ohnuki, N. Oyama, Electrochemical preparation of a ladder
polymer containing phenazine rings, Journal of Electroanalytical Chemistry 219 (1987)
117-124.
202. C.J. Pouchert, The Aldrich Library of FT-IR Spectra. Ed. 2, Aldrich Chemical
Company, USA, 1985.
203. E. Dmitrieva, Y. Harima, L. Dunsch, Influence of Phenazine Structure on Polaron
Formation in Polyaniline: In Situ Electron Spin Resonance−Ultraviolet/Visible−Near-
Infrared Spectroelectrochemical Study Journal of Physical Chemistry B 113 (2009)
16131-16141.
204. S. Quillard, G. Louarn, S. Lefrant, Vibrational analysis of polyaniline: A comparative
study of leucoemeraldine, emeraldine, and pernigraniline bases, Physical Review B 50
(1994) 12496-12508.
205. Z. Ping, G. E. Nauer, H. Neugebauer, J. Theiner, A. Neckel, Protonation and
electrochemical redox doping processes of polyaniline in aqueous solutions:

Andrea Kellenberger Habilitation Thesis
Page | 127
Investigations using in situ FTIR-ATR spectroscopy and a new doping system, Journal
of the Chemical Society, Faraday Transactions 93 (1997) 121-129.
206. N.S. Sariciftci, H. Kuzmany, H. Neugebauer, A. Neckel, Structural and electronic
transitions in polyaniline: A Fourier transform infrared spectroscopic study, Journal of
Chemical Physics 92 (1990) 4530.
207. Z. Ping, H. Neugebauer, A. Neckel, FTIR ATR spectroelectrochemical investigations of
polyaniline with perrhenate as a new doping system, Electrochimica Acta 41 (1996)
767-772.
208. Z. Ping, In situ FTIR–attenuated total reflection spectroscopic investigations on the
base–acid transitions of polyaniline. Base–acid transition in the emeraldine form of
polyaniline, Journal of the Chemical Society, Faraday Transactions 92 (1996) 3063-
3067.
209. M. Trchová, I. Šeděnková, J. Stejskal, In-situ polymerized polyaniline films 6. FTIR
spectroscopic study of aniline polymerization, Synthetic Metals 154 (2005) 1-4.
210. M. Trchová, J. Stejskal, J. Prokeš, Infrared spectroscopic study of solid-state protonation
and oxidation of polyaniline, Synthetic Metals 101 (1999) 840-841.
211. I. Šeděnková, M. Trchová, N. Blinova, J. Stejskal, In-situ polymerized polyaniline films.
Preparation in solutions of hydrochloric, sulfuric, or phosphoric acid, Thin Solid Films
515 (2006) 1640-1646.
212. Y. Furukawa, F. Ueda, Y. Hyodo, I. Harada, T. Nakajima, T. Kawagoe, Vibrational
spectra and structure of polyaniline, Macromolecules 21 (1988) 1297-1305.
213. Z. Ping, G. E. Nauer, H. Neugebauer, J. Theiner, In situ Fourier transform infrared
attenuated total reflection (FTIR-ATR) spectroscopic investigations on the base—acid
transitions of different forms of polyaniline. Base—acid transition in the
leucoemeraldine form, Journal of Electroanalytical Chemistry 420 (1997) 301-306.
214. M. Inoue, R.E. Navarro, M.B. Inoue, New soluble polyaniline: Synthesis, electrical
properties and solution electronic spectrum, Synthetic Metals 30 (1989) 199-207.
215. E. Dmitrieva, L. Dunsch, How Linear Is “Linear” Polyaniline?, Journal of Physical
Chemistry B 115 (2011) 6401-6411.
216. S. Quillard, G. Louarn, J. P. Buisson, M. Boyer, M. Lapkowski, A. Pron, S. Lefrant,
Vibrational spectroscopic studies of the isotope effects in polyaniline, Synthetic Metals
84 (1997) 805-806.
217. G. Louarn, M. Lapkowski, S. Quillard, A. Pron, J.P. Buisson, S. Lefrant, Vibrational
Properties of Polyaniline. Isotope Effects, Journal of Physical Chemistry 100 (1996)
6998-7006.
218. M.I. Boyer, S. Quillard, G. Louarn, G. Froyer, S. Lefrant, Vibrational Study of the
FeCl3-Doped Dimer of Polyaniline; A Good Model Compound of Emeraldine Salt,
Journal of Physical Chemistry B 104 (2000) 8952-8961.

Andrea Kellenberger Habilitation Thesis
Page | 128
219. A. Zimmermann, L. Dunsch, Investigation of the electropolymerization of aniline by the
in situ techniques of attenuated total reflection (ATR) and external reflection (IRRAS)
Journal of Molecular Structure 410-411 (1997) 165-171.
220. G. Tourillon, F. Garnier, New electrochemically generated organic conducting
polymers, Journal of Electroanalytical Chemistry 135 (1982) 173-178.
221. M. Sato, S. Tanaka, K. Kaeriyama, Electrochemical preparation of highly conducting
polythiophene films, Journal of the Chemical Society, Chemical Communications 11
(1985) 713-714.
222. R. Elsenbaumer, K.W. Jen, R. Oobodi, Processible and environmentally stable
conducting polymers, Synthetic Metals 15 (1986) 169-174.
223. R.J. Waltman, J. Bargon, A.F. Diaz, Electrochemical studies of some conducting
polythiophene films, Journal of Physical Chemistry 87 (1983) 1459-1463.
224. E. Jähne, D. Ferse, G. Busch, H.-J. P Adler, A. Singh, I. K. Varma, Synthesis of
adhesion promoters for grafting polythiophene onto metal oxides, Designed Monomers
and Polymers 5 (2002) 427-443.
225. B. Adolphi, E. Jähne, G. Bush, X. Cai, Characterization of the adsorption of ω-
(thiophene-3-yl alkyl) phosphonic acid on metal oxides with AR-XPS, Analytical and
Bioanalytical Chemistry 379 (2004) 646-652.
226. D. Appelhans, D. Ferse, H.-J.P. Adler, W. Plieth, A. Fikus, K. Grundke, F.-J. Schmitt, T.
Bayer, B. Adolphi, Self-assembled monolayers prepared from ω-thiophene-
functionalized n-alkyltrichlorosilane on silicon substrates, Colloids and Surfaces A 161
(2000) 203-212.
227. H.-P. Welzel, G. Kossmehl, J. Schnieder, W. Plieth, Reactive Groups on Polymer-
Covered Electrodes. 2. Functionalized Thiophene Polymers by Electrochemical
Polymerization and Their Application as Polymeric Reagents Macromolecules 28 (1995)
5575-5580.
228. H.-P. Welzel, G. Kossmehl, H. Boettcher, G. Engelmann, W.-D. Hunnius, Reactive
Groups on Polymer-Covered Electrodes. 5. Synthesis and Cyclovoltammetric Analysis
of 3-Substituted Thiophene Derivatives, Macromolecules 30 (1997) 7419-7426.
229. A. Das, S. Mulik, C. Sotiriou-Leventis, N. Leventis, Protection of 2-(3-thienyl)ethanol
with 3-thienylacetic acid and hard cross-linked conducting films by electro-
polymerization of the ester, Synthetic Metals 156 (2006) 966-972.
230. M. Lanzi, P.C. Bizzari, L. Paganin, G. Cesari, Highly processable ester-functionalized
polythiophenes as valuable multifunctional and post-functionalizable conjugated
polymers, European Polymer Journal 43 (2007) 72-83.
231. Y.H. Kim, S. Hotta, A.J. Heeger, Infrared photoexcitation and doping studies of poly(3-
methylthienylene), Physical Review B 36 (1987) 7486-7490.

Andrea Kellenberger Habilitation Thesis
Page | 129
232. V. Hernandez, F.J. Ramirez, T.F. Otero, J.T. Lopez Navarrete, An interpretation of the
vibrational spectra of insulating and electrically conducting poly(3‐methylthiophene)
aided by a theoretical dynamical model, The Journal of Chemical Physics 100 (1994)
114-129.
233. H. Neugebauer, G. Nauer, A. Neckel, G. Tourillon, F. Garnier, P. Lang, In situ
investigations of the 3-methylthiophene polymer with attenuated total reflection Fourier
transform infrared spectroscopy, Journal of Physical Chemistry 88 (1984) 652-654.
234. J. Guay, P. Kasai, A. Diaz, R. Wu, J.M. Tour, Le H. Dao, Chain-length dependence of
electrochemical and electronic properties of neutral and oxidized soluble α,α-coupled
thiophene oligomers, Chemistry of Materials 4 (1992) 1097-1105.
235. S. Hotta, M. Soga, N. Sonoda, Infrared dichroic studies of polythiophenes, Journal of
Physical Chemistry 93 (1989) 4994-4998.
236. A. Cravino, H. Neugebauer, S. Luzzati, M. Catellani, A. Petr, L. Dunsch, N.S. Sariciftci,
Positive and Negative Charge Carriers in Doped or Photoexcited Polydithieno-
thiophenes: A Comparative Study Using Raman, Infrared, and Electron Spin Resonance
Spectroscopy, Journal of Physical Chemistry B 106 (2002) 3583-3591.
237. H.E. Schaffer, A.J. Heeger, Infrared activity of photoexcitations in polythiophene, Solid
State Communications 59 (1986) 415-421.
238. A.J. Heeger, S. Kivelson, J.R. Schrieffer, W.-P. Su, Solitons in conducting polymers,
Reviews of Modern Physics 60 (1988) 781-850.
239. P.A. Christensen, A. Hamnett, D.C. Read, Morphology and charge conduction in
polythiophene, an in situ FTIR study, Electrochimica Acta 39 (1994) 187-196.
240. Q. Pei, O. Inganäs, G. Gustafsson, M. Granström, M. Andersson, T. Hjertberg, O.
Wennerström, J. E. Österholm, J. Laakso, H. Järvinen, The routes towards processible
and stable conducting poly(thiophene)s, Synthetic Metals 55 (1993) 1221-1226.
241. G. Gustafsson, O. Inganäs, J. O. Nilsson, B. Liedberg, Thermal undoping in poly(3-
alkylthiophenes), Synthetic Metals 26 (1988) 297-309.
242. S. Hotta, M. Soga, N. Sonoda, Novel organosynthetic routes to polythiophene and its
derivatives, Synthetic Metals 26 (1988) 267-279.
243. S. Hotta, Electrochemical synthesis and spectroscopic study of poly(3-alkylthienylenes),
Synthetic Metals 22 (1987) 103-113.
244. T. A. Chen. X. Wu, R. D. Rieke, Regiocontrolled Synthesis of Poly(3-alkylthiophenes)
Mediated by Rieke Zinc: Their Characterization and Solid-State Properties, Journal of
the American Chemical Society 117 (1995) 233-244.
245. A. Buzarovska, L.Arsov, N. Hebestreit, W. Plieth, Synthesis and characterization of
thiophene/3-alkylthiophene random cooligomers, Journal of Solid State
Electrochemistry 7 (2002) 49-54.

Andrea Kellenberger Habilitation Thesis
Page | 130
246. R. Singh, J. Kumar, R.K. Singh, A. Kaur, K.N. Sood, R.C. Rastogi, Effect of thermal
annealing on surface morphology and physical properties of poly(3-octylthiophene)
films, Polymer 46 (2005) 9126-9132.
247. F. Costanzo, D. Tonelli, G. Scalmani, J. Cornil, Theoretical investigation of the
electronic and optical properties of oligothiophenes upon methyl, thiol, and thiomethyl
substitutions, Polymer 47 (2006) 6692-6697.
248. J. Tarábek, P. Rapta, E. Jähne, D. Ferse, H.-J. Adler, M. Maumy, L. Dunsch,
Spectroelectrochemical and potentiometric studies of functionalized electroactive
polymers, Electrochimica Acta 50 (2005) 1643-1651.
249. P. Rapta, J. Lukkari, J. Tarábek, M. Salomäki, M. Jussila, G. Yohannes, M.-L. Riekkola,
J. Kankare, L. Dunsch, Ultrathin polyelectrolyte multilayers: in situ ESR/UV-Vis-NIR
spectroelectrochemical study of charge carriers formed under oxidation, Physical
Chemistry Chemical Physics 6 (2004) 434-441.
250. Y. Kunugi, Y. Harima, K. Yamashita, N. Ohta, S. Ito, Charge transport in a regioregular
poly(3-octylthiophene)film, Journal of Materials Chemistry 10 (2000) 2673-2677.
251. Y. Harima, Y. Kunugi, K. Yamashita and M. Shiotani, Determination of mobilities of
charge carriers in electrochemically anion-doped polythiophene film, Chemical Physics
Letters 317 (2000) 310-314.
252. Y. Harima, T. Eguchi and K. Yamashita, Enhancement of carrier mobilities in poly(3-
methylthiophene) by an electrochemical doping, Synthetic Metals 95 (1998) 69-74.
253. Y. Harima, T. Eguchi, K. Yamashita, K. Kojima, M. Shiotani, An in situ ESR study on
poly(3-methylthiophene): charge transport due to polarons and bipolarons before the
evolution of metallic conduction, Synthetic Metals 105 (1999) 121-128.
254. J. A. E. H. van Haare, E. E. Havinga, J. L. J. van Dongenn, J. L. R. A. J. Janssen, J.
Cornil, J. L. Brédas, Redox States of Long Oligothiophenes: Two Polarons on a Single
Chain, Chemistry A European Journal 4 (1998) 1509-1522.
255. G. Paasch, Transmission line description for doped conjugated polymers with polarons,
bipolarons and counterions as charged species, Electrochimica Acta 47 (2002) 2049-
2053.
256. G. Paasch, Transport in doped conjugated polymers with polarons and bipolarons
forming complexes with counter ions, Solid State Ionics 169 (2004) 87-94.
257. G. Paasch, S. Scheinert, A. Petr, L. Dunsch, Bipolarons or polaron pairs in conducting
polymers: Equilibrium and kinetics, Russian Journal of Electrochemistry 42 (2006)
1161-1168.
258. M.G. Hill, K.R. Mann, L.L. Miller, J.F. Penneau, Oligothiophene cation radical dimers.
An alternative to bipolarons in oxidized polythiophene, Journal of the American
Chemical Society 114 (1992) 2728-2730.

Andrea Kellenberger Habilitation Thesis
Page | 131
259. N. Rajalakshmi, K.S. Dhathathreyan, Nanostructured platinum catalyst layer prepared by
pulsed electrodeposition for use in PEM fuel cells, International Journal of Hydrogen
Energy 33 (2008) 5672-5677.
260. H. Kim, N.P. Subramanian, B.N. Popov, Preparation of PEM fuel cell electrodes using
pulse electrodeposition, Journal of Power Sources 138 (2004) 14–24
261. S. Karimi, F.R. Foulkes, Pulse electrodeposition of platinum catalyst using different
pulse current waveforms, Electrochemistry Communications 19 (2012) 17-20.
262. R. Muntean, D.T Pascal, G. Marginean, N. Vaszilcsin, Carbon Nanofibers Decorated
with Pt-Co Alloy Nanoparticles as Catalysts for Electrochemical Cell Applications. I.
Synthesis and Structural Characterization, International Journal of Electrochemical
Science 12 (2017) 4597-4609.
263. M.-C. Tsai, T.-K. Yeh, C.-H. Tsai, Methanol oxidation efficiencies on carbon-nanotube-
supported platinum and platinum–ruthenium nanoparticles prepared by pulsed
electrodeposition, International Journal of Hydrogen Energy 36 (2011) 8261-8266.
264. H.-Y. Chou, C.-K. Hsieh, M.-C. Tsai, Y.-H. Wei, T.-K. Yeh, C.-H. Tsai, Pulse
electrodeposition of Pt and Pt–Ru methanol-oxidation nanocatalysts onto carbon
nanotubes in citric acid aqueous solutions, Thin Solid Films 584 (2015) 98-102.
265. J. Li, N. Zhang, Q. Sun, Z. Bai, J. Zheng, Electrochemical sensor for dopamine based
on imprinted silica matrix- poly(aniline boronic acid) hybrid as recognition element,
Talanta 159 (2016) 379-386.
266. J. Anzai, Recent progress in electrochemical biosensors based on phenylboronic acid
and derivatives, Materials Science and Engineering C 67 (2016) 737-746.
267. M. Dervisevic, M. Senel, E. Cevik, Novel impedimetric dopamine biosensor based on
boronic acid functional polythiophene modified electrodes, Materials Science and
Engineering C 72 (2017) 641-649.
268. S. Lupu, F.J. del Campo, F.X. Muñoz, Sinusoidal voltage electrodeposition and
characterization of conducting polymers on gold microelectrode arrays, Journal of
Electroanalytical Chemistry 687 (2012) 71–78.
269. C. Lete, B. Lakard, J.-Y. Hihn, F.J. del Campo, S. Lupu, Use of sinusoidal voltage with
fixed frequency in the preparation of tyrosinase based electrochemical biosensor for
dopamine electroanalysis, Sensors and Actuators B: Chemical 240 (2017) 801-809.
270. X. Zhang, L.-X. Ma, Y.-C. Zhang, Electrodeposition of platinum nanosheets on C60
decorated glassy carbon electrode as a stable electrochemical biosensor for simultaneous
detection of ascorbic acid, dopamine and uric acid, Electrochimica Acta 177 (2015)
118–127.
271. F.R. Caetano, L.B. Felippe, A.J.G. Zarbin, M.F. Bergamini, L.H. Marcolino-Junior,
Gold nanoparticles supported on multi-walled carbon nanotubes produced by biphasic
modified method and dopamine sensing application, Sensors and Actuators B 243
(2017) 43–50.

Andrea Kellenberger Habilitation Thesis
Page | 132
272. C. Wang, J. Du, H. Wang, C. Zou, F. Jiang, P. Yang, Y. Du, A facile electrochemical
sensor based on reduced graphene oxide and Au nanoplates modified glassy carbon
electrode for simultaneous detection of ascorbic acid, dopamine and uric acid, Sensors
and Actuators B 204 (2014) 302–309.
273. D.N. Oko, S. Garbarino, J. Zhang, Z. Xu, M. Chaker, D. Ma, D. Guay, A.C. Tavares,
Dopamine and ascorbic acid electro-oxidation on Au, AuPt and Pt nanoparticles
prepared by pulse laser ablation in water, Electrochimica Acta 159 (2015) 174–183.
274. A.K. Bhakta, R.J. Mascarenhas, O.J. D'Souza, A.K. Satpati, S. Detriche, Z. Mekhalif, J.
Dalhalle, Iron nanoparticles decorated multi-wall carbon nanotubes modified carbon
paste electrode as an electrochemical sensor for the simultaneous determination of uric
acid in the presence of ascorbic acid, dopamine and L-tyrosine, Materials Science and
Engineering C 57 (2015) 328–337.

Andrea Kellenberger Habilitation Thesis
Page | 133
List of Figures
Figure 1. Electrocatalytic enhancement of electrode reactions without mechanism change
(left) and by changing the mechanism (right). ............................................................... 16
Figure 2. Steady-state polarization curves (left) and Tafel plots (right) for hydrogen evolution
reaction on copper electrode in 1 mol L-1 H2SO4 solution in the absence and presence of
various concentrations of benzylamine. ......................................................................... 19
Figure 3. Steady-state polarization curves (left) and Tafel plots (right) for hydrogen evolution
reaction on copper electrode in 1 mol L-1 H2SO4 solution with 5 10-2 mol L-1
benzylamine at different temperatures. .......................................................................... 21
Figure 4. Experimental Nyquist (a) and Bode (b) plots at E = –0.75 V, for HER on copper in
1 mol L-1 H2SO4 solution in the absence and presence of various concentrations of
benzylamine. .................................................................................................................. 22
Figure 5. Molecular dipole moment (arrow) of protonated benzylamine molecule. .............. 23
Figure 6. Chemical structure of aniline derivatives used as proton carriers for HER on copper.
........................................................................................................................................ 24
Figure 7. Steady-state polarization curves for hydrogen evolution reaction on copper
electrode in 0.5 mol L-1 H2SO4 solution with 10-4 mol L-1 of different aniline derivatives.
........................................................................................................................................ 24
Figure 8. Tafel plots for hydrogen evolution reaction on copper electrode in 0.5 mol L-1
H2SO4 solution with 10-4 mol L-1 of different aniline derivatives. ................................. 25
Figure 9. Complex plane plots for HER on copper in 0.5 mol L-1 H2SO4 in the presence of
10-4 mol L-1 aromatic amines. Inset: electrical equivalent circuit used to model
impedance data. .............................................................................................................. 26
Figure 10. Chemical structure of aliphatic/aromatic amines used as proton carriers for HER
on gold. ........................................................................................................................... 28
Figure 11. Linear voltammograms on gold electrode in 0.5 mol L-1 H2SO4 solution at 25°C,
concentration of amines: 10-3 mol L-1, scan rate: 10 mV s-1. .......................................... 28
Figure 12. Linear polarization curves for HER on gold in 0.5 mol L-1 H2SO4 at different
temperatures for a concentration of the selected amines of 10-6 mol L-1 (upper row) and
10-3 mol L-1 (lower row). ................................................................................................ 29
Figure 13. Tafel plots for HER on gold electrode in 0.5 mol L-1 H2SO4 at different
temperatures for a concentration of the selected amines of 10-6 mol L-1 (upper row) and
10-3 mol L-1 (lower row). ................................................................................................ 29
Figure 14. Molecular dipole moment (arrow) of protonated aniline, 4-chloro-aniline and
methylamine. .................................................................................................................. 31
Figure 15. Complex plane and Bode plots plots for HER on gold in 0.5 mol L-1 H2SO4 at η = -
200 mV. .......................................................................................................................... 32

Andrea Kellenberger Habilitation Thesis
Page | 134
Figure 16. Complex plane plots for HER on gold in 0.5 mol L-1 H2SO4 at η = -200 mV in the
presence of AH+ and 4ClAH+ at concentrations of 10-6 mol L-1 (upper row) and
10-3 mol L-1 (lower row). ................................................................................................ 33
Figure 17. Electrical equivalent circuits used to model impedance data for HER on gold in
the absence of proton carriers (left) and in the presence of proton carriers (right). ....... 34
Figure 18. Catalytic effect of aniline, 4-chloro-aniline and methylamine on HER on gold
electrode. ........................................................................................................................ 35
Figure 20. Linear voltammograms for HER on platinum electrode in 0.5 mol L-1 at 25°C and
different concentrations of benzylamine (left) and aniline (right). Scan rate 5 mV s-1. . 36
Figure 21. Equivalent electrical circuits for HER without absorption (a) and HER with
indirect absorption (b). ................................................................................................... 38
Figure 22. Complex plane plots for HER in blank 0.5 mol L-1 H2SO4 solution, η = -15 mV (a)
and η = -45 mV (b). Open symbols are experimental data and continuous line is
simulated by CNLS fitting. ............................................................................................ 39
Figure 23. Complex plane plots for HER in 0.5 mol L-1 H2SO4 solution with 10-5 mol L-1 BA
(a) and 10-2 mol L-1 BA, η = -15 mV. Open symbols are experimental data and
continuous line is simulated by CNLS fitting. ............................................................... 39
Figure 24. Phase angle plots for HER at increasing overpotentials in blank 0.5 mol L-1 H2SO4
solution. .......................................................................................................................... 39
Figure 25. Phase angle plots for HER at increasing overpotentials in 0.5 mol L-1 H2SO4
solution with 10-5 mol L-1 BA (a) and 10-2 mol L-1 BA (b). ........................................... 40
Figure 26. Phase angle plots for HER at increasing overpotentials in 0.5 mol L-1 H2SO4
solution with 10-5 mol L-1 A (a) and 10-2 mol L-1 A (b). ................................................. 40
Figure 19. Mechanism of HER in the presence of proton carriers. ......................................... 43
Figure 27. Potentiodynamic deposition of Pani/Nb samples from a solution of 0.2 mol L-1
aniline in 0.5 mol L-1 H2SO4 (a) and 0.4 mol L-1 aniline in 1 mol L-1 H2SO4 (b). Scan
rate 50 mV s-1. ................................................................................................................ 48
Figure 28. Cyclic voltammograms of Pani/Nb samples in monomer free 0.5 mol L-1 H2SO4
solution. Scan rate 50 mV s-1.......................................................................................... 49
Figure 29. SEM images of polyaniline nanofibers electrodeposited on Nb by cyclic
voltammetry in 0.5 mol L-1 H2SO4: (a) Pani/Nb/1, (b) Pani/Nb/2, (c) Pani/Nb/3 and in 1
mol L-1 H2SO4: (d) Pani/Nb/4, (e) Pani/Nb/5, (f) Pani/Nb/6. ......................................... 50
Figure 30. Complex plane plots of (a) Pani/Nb/1, (b) Pani/Nb/2, (c) Pani/Nb/3, (d) Pani/Nb/4,
(e) Pani/Nb/5 and (f) Pani/Nb/6 films measured in 0.5 mol L-1 H2SO4 solution at
E = 0.4 V. ....................................................................................................................... 52
Figure 31. Dependence of the diffusional capacitance on film thickness for granular and
fibrilar Pani films obtained on Nb. ................................................................................. 53
Figure 32. Potentiodynamic deposition of Pani/Ni samples from a solution of 0.1 mol L-1
aniline in 0.5 mol L-1 H2SO4. Last scan of the cyclic voltammograms (a) and
dependence of the charge on the number of scans (b). .................................................. 54
Figure 33. Cyclic voltammograms of Pani/Ni samples in monomer free 0.5 mol L-1 H2SO4
solution. Scan rate 50 mV s-1.......................................................................................... 55

Andrea Kellenberger Habilitation Thesis
Page | 135
Figure 34. FE-SEM images of polyaniline films: Pani/Ni/10 (a), Pani/Ni/25 (b), Pani/Ni/50
(c) and Pani/Ni/100 (d). .................................................................................................. 56
Figure 35. Complex plane plots of Pani/Ni/10 measured in 0.5 mol L-1 H2SO4 solution at
different electrode potentials. ......................................................................................... 57
Figure 36. Complex plane plots of Pani/Ni/25 measured in 0.5 mol L-1 H2SO4 solution at
different electrode potentials. ......................................................................................... 58
Figure 37. Complex plane plots of Pani/Ni/50 measured in 0.5 mol L-1 H2SO4 solution at
different electrode potentials. ......................................................................................... 58
Figure 38. Complex plane plots of Pani/Ni/100 measured in 0.5 mol L-1 H2SO4 solution at
different electrode potentials. ......................................................................................... 59
Figure 39. Potentiodynamic deposition of Pani/Pt samples from a solution of 0.1 mol L-1
aniline in 0.5 mol L-1 H2SO4 at different temperatures: 25°C (a) and 40°C (b). Scan rate
50 mV s-1. ....................................................................................................................... 61
Figure 40. Last scan of the cyclic voltammograms during electrochemical deposition of
Pani/Pt samples at different temperatures(a) and dependence of the charge on the
number of scans (b). ....................................................................................................... 62
Figure 41. Cyclic voltammograms of Pani/Pt samples in monomer free 0.5 mol L-1 H2SO4
solution. Scan rate 50 mV s-1.......................................................................................... 63
Figure 42. Complex plane plots of Pani/Pt/25 measured in 0.5 mol L-1 H2SO4 solution at
different electrode potentials. ......................................................................................... 65
Figure 43. Complex plane plots of Pani/Pt/40 measured in 0.5 mol L-1 H2SO4 solution at
different electrode potentials. ......................................................................................... 65
Figure 44. Complex plane plots of Pani/Pt/60 measured in 0.5 mol L-1 H2SO4 solution at
different electrode potentials. ......................................................................................... 66
Figure 45. Cyclic voltammogram of Nb in 0.5 M H2SO4, scan rate 50 mV s-1. ..................... 67
Figure 46. AFM images of the Nb electrode oxidized in air. 2D (a) and 3D image (b). ........ 69
Figure 47. AFM images of the electrochemically passivated Nb. 2D (a) and 3D image (b). . 69
Figure 48. AFM images of Nb electrode oxidized in air (a) and electrochemically passivated
(b). .................................................................................................................................. 69
Figure 49. FTIR spectra of electrochemically synthesized Pani/Nb and Pani/Pt and of
commercial emeraldine base. ......................................................................................... 70
Figure 50. Two-step potentiodynamic deposition of Pani/60/Paba sample, consisting of Pani
initiation and growth (1a and 1b) followed by Paba growth (2). ................................... 73
Figure 51. SEM images of Paba modified electrodes: Ni/0/Paba (a) and Ni/30/Paba (b). ..... 73
Figure 52. Selective binding of dopamine by Paba and formation of boronate ester. ............ 74
Figure 53. Complex plane plots for Ni/0/Paba (a) and Ni/30/Paba (b) in phosphate buffer
solution at pH = 7.4 and different concentrations of dopamine. .................................... 74
Figure 54. Calibration curves of Rct versus dopamine concentration for Ni/0/Paba and
Ni/30/Paba modified electrodes. .................................................................................... 75
Figure 55. Chemical structure of azo red dye. ........................................................................ 76

Andrea Kellenberger Habilitation Thesis
Page | 136
Figure 56. Complex plane plots of Pani/Nb electrode as a function of time for different
concentrations of azo dye: (a) 1 × 10⁻⁵ mol L-1; (b) 2 × 10⁻⁵ mol L-1; (c) 3 × 10⁻⁵ mol L-1
and (d) 5 × 10⁻⁵ mol L-1. .................................................................................................. 77
Figure 57. Dependence of double layer capacitance (a) and surface coverage (b) as a function
of adsorption time for different dye concentrations. ...................................................... 78
Figure 58. Langmuir (a), Temkin (b), Frumkin (c) and Flory–Huggins (d) isotherms for
adsorption of azo red dye on Pani/Nb electrode. ............................................................ 79
Figure 59. ATR-FTIR spectroelectrochemical cell. Schematic view of cell and of Au
interdigitated structure deposited on top of the ZnSe crystal (left) and disassembled cell
(right).............................................................................................................................. 83
Figure 60. Pictures of the experimental setup. Reflection unit with spectroelectrochemical
cell installed (left) and complete cell installed and connected to the potentiostat (right).
........................................................................................................................................ 83
Figure 61. Structure of linear Pani and its different oxidation states. ..................................... 84
Figure 62. Structure of charged states in polyaniline. ............................................................. 85
Figure 63. Formation of phenazine rings in the structure of polyaniline [141]. ..................... 85
Figure 64. Chemical structure of Phsafr (a) and An-Phsafr copolymer (b). ........................... 86
Figure 65. Cyclic voltammograms on gold electrode during oxidation of 5 mM Phsafr (a) 50
mM An (b) and 50 mM An + 5 mM Phsafr (c) in 0.1 M sulfuric acid and 0.01 M
sodium p-toluenesulfonate, scan rate 25 mV s-1. ............................................................ 87
Figure 66. ATR-FTIR spectra of emeraldine base, polyaniline and aniline-phenosafranine
copolymer. ...................................................................................................................... 88
Figure 67. In situ ATR-FTIR spectra during oxidation of Pani (a); Pani-PPS1 (b); Pani-PPS2
(c) and Pani-PPS3 (d) between -0.5 and 0.5 V with reference state at -0.5 V. .............. 89
Figure 68. Comparison of UV-Vis-NIR absorbance, selected IR absorbance and ESR signal
intensity during oxidation of: Pani (a) and Pani-PPS3 (b). ............................................ 90
Figure 69. In situ ATR-FTIR spectra of different PANI structures upon charging. Inset shows
the simultaneous CVs with triggers marked with points. ............................................... 92
Figure 70. Mid infrared region of in situ ATR-FTIR spectra of different PANI structures
upon charging, EB2 (left) and EB3 (right). .................................................................... 92
Figure 71. Potential dependence of semiquinoid bands and of the free charge carries band for
the PANI structures EB2 (b) and EB3 (c). ..................................................................... 93
Figure 72. Potential dependence of spectroscopic data of Pani-EB3 during doping / dedoping:
single integrated ESR signal together with one selected semiquinoid IR band (a) and
with polaronic bands at 1266, 1033 and 1010 cm-1 (b)................................................... 94
Figure 73. In situ FTIR spectra of EB3 after the first and the second redox peak (black and
red line) and potential dependence of bipolaronic bands in EB3. .................................. 95
Figure 74. Scheme for formation of charged states upon electrochemical oxidation of
polyaniline. ..................................................................................................................... 95
Figure 75. Chemical structure of p3MT and p3HT................................................................. 98

Andrea Kellenberger Habilitation Thesis
Page | 137
Figure 76. In situ ATR-FTIR spectra during copolymerization of 20 mM 3MT with 40 mM
3HT in 0.1 M n-BuNPF6 acetonitrile solution. ............................................................ 100
Figure 77. In situ ESR (left) and UV-Vis-NIR (right) spectra of p3MT-co3HT. ................. 101
Figure 78. Chemical structure of the studied polyalkylthiophene derivatives. ..................... 102
Figure 79. Cyclic voltammograms of PTEtAc, PTEtAcOH and PTEtOH films on a Pt
working electrode in a TBAPF6 (0.1 M) – acetonitrile solution at 100 mV s-1. ........... 103
Figure 80. In situ ATR-FTIR spectra during p-doping (solid lines) and de-doping (dashed
lines) of PTEtAc (a), PTEtAcOH (b) and PTEtOH (c). Numbers correspond to potential
values from Fig. 79. ..................................................................................................... 104
Figure 81. In situ ESR (left) and UV-Vis-NIR (right) spectra at high doping levels of
PTEtAc. ........................................................................................................................ 106
Figure 82. CV curves in 0.1 M PBS solution (pH 7.4) of 1660 µM AA (a); 100 µM DA (b)
and a mixture of 1660 µM AA with different concentrations of DA (c) on GC-MWCNT
electrode. ...................................................................................................................... 110

Andrea Kellenberger Habilitation Thesis
Page | 138
List of Tables
Table 1. Kinetic parameters for HER on copper electrode at various concentration of BA. .. 20
Table 2. Kinetic parameters for HER on copper electrode at different temperatures in 1 mol
L-1 H2SO4 solution without / with 5 10-2 mol L-1 BA. .................................................... 21
Table 3. Experimental values and standard errors for the EEC parameters related to HER on
copper in 1 mol L-1 H2SO4 in the presence of different concentrations of BA............... 22
Table 4. Kinetic parameters for HER on copper electrode in 0.5 mol L-1 H2SO4 solution and
10-4 mol L-1 of different aromatic amines. ...................................................................... 25
Table 5. Charge transfer resistance for HER on copper in 0.5 mol L-1 H2SO4 in the presence
of 10-4 mol L-1 amines. ................................................................................................... 27
Table 6. Kinetic parameters for HER on gold electrode in 0.5 mol L-1 H2SO4 solution in the
presence of amines at different concentrations and temperatures. ................................. 30
Table 7. Molecular parameters of protonated amines. ............................................................ 31
Table 8. Values of the charge transfer resistance for HER on gold in 0.5 mol L-1 H2SO4 at η =
-200 mV in the presence of amines at different concentrations and temperatures. ........ 34
Table 9. Kinetic parameters for HER on platinum electrode in 0.5 mol L-1 H2SO4 solution. . 36
Table 10. Kinetic parameters for HER on platinum electrode in 0.5 mol L-1 H2SO4 solution in
the presence of benzylamine and aniline at different concentrations and temperatures. 37
Table 11. EEC parameter values for HER at = -25 V. ........................................................ 41
Table 12. Synthesis conditions and characteristics of the first anodic peak of Pani/Nb films
obtained at different acid concentration and aniline/acid ratio. ..................................... 48
Table 13. Capacitance values of Pani/Nb films determined from CV and EIS data. .............. 51
Table 14. Synthesis conditions and characteristics of the first peak of Pani/Ni films obtained
at different scan rates...................................................................................................... 54
Table 15. Capacitance values of Pani/Ni films determined from CV and EIS data. .............. 56
Table 16. Charge transfer and capacitance values of Pani/Ni films obtained by fitting EIS
data. ................................................................................................................................ 59
Table 17. Characteristics of the anodic peaks of Pani/Pt films obtained at different
temperatures. .................................................................................................................. 62
Table 18. Capacitance values of Pani/Pt films determined from CV and EIS data. ............... 64
Table 19. Charge transfer and capacitance values of Pani/Pt films obtained by fitting EIS
data. ................................................................................................................................ 66
Table 20. Main FTIR bands of Pani/Nb and Pani/Pt and their assignments. .......................... 70
Table 21. FTIR bands of EB, Pani, Pani-PPS1, Pani-PPS2, Pani-PPS3 and PPS. ................. 88
Table 22. Mid-IR region vibrations of in situ FTIR spectra of different PANI structures. .... 93
Table 23. Characteristic IR bands of p3MT, p3HT and p3MT-co3HT and their structural
assignments. ................................................................................................................... 99