H80-044-30-150 H80-044-60-250 H80-084-30-250 Outdoor L2 ...
385
H80-044-30-150 H80-044-60-250 H80-084-30-250 Outdoor L2 Plus GbE PoE Switch Series User Manual Copyright AETEK Inc. 2017|All rights reserved. All brand and product names are trademarks or registered trademarks of their respective companies
Transcript of H80-044-30-150 H80-044-60-250 H80-084-30-250 Outdoor L2 ...

H80-044-30-150 H80-044-60-250 H80-084-30-250
Outdoor L2 Plus GbE PoE Switch Series
User Manual
Copyright AETEK Inc. 2017|All rights reserved. All brand and product names are trademarks or registered trademarks of their respective companies
ii
About This Manual Copyright Copyright © AETEK Inc. 2017 , All rights reserved.
The products and programs described in this User Guide are licensed products of Manufacture Technology, This User Guide contains proprietary information protected by copyright, and this User Guide and all accompanying hardware, software and documentation are copyrighted. No parts of this User Guide may be copied, photocopied, reproduced, translated or reduced to any electronic medium or machine-readable from by any means by electronic or mechanical. Including photocopying, recording, or information storage and retrieval systems, for any purpose other than the purchaser’s personal use, and without the prior express written permission of Manufacture Technology.
. Purpose This GUI user guide gives specific information on how to operate and use the management
functions of the H80 Series Switch via HTTP/HTTPs web browser Audience The Manual is intended for use by network administrators who are responsible for operating and
maintaining network equipment; consequently, it assumes a basic working knowledge of general switch functions, the Internet Protocol (IP), and Hypertext Transfer Protocol (HTTP).
CONVENTIONS The following conventions are used throughout this manual to show information.
WARRANTY See the Customer Support/ Warranty booklet included with the product. A copy of the specific
warranty terms applicable to your Manufacture products and replacement parts can be obtained from your Manufacture Sales and Service Office authorized dealer.
Disclaimer AETEK Inc. does not warrant that the hardware will work properly in all environments and
applications, and marks no warranty and representation, either implied or expressed, with respect to the quality, performance, merchantability, or fitness for a particular purpose. Manufacture disclaims liability for any inaccuracies or omissions that may have occurred. Information in this User Guide is subject to change without notice and does not represent a commitment on the part of Manufacture. Manufacture assumes no responsibility for any inaccuracies that may be contained in this User Guide. Manufacture makes no commitment to update or keep current the information in this User Guide, and reserves the righter to make improvements to this User Guide and /or to the products described in this User Guide, at any time without notice.

iv
Table of Contents
ABOUT THIS MANUAL ....................................................................................................................... II INTRODUCTION ........................................................................................................................................ 1
CHAPTER 1 OPERATION OF WEB-BASED MANAGEMENT ........................................................ 2 CHAPTER 2 SYSTEM CONFIGURATION .......................................................................... 6
2‐1 SYSTEM ........................................................................................................................................................... 6 2-1.1 Information ........................................................................................................................................ 6 2-1.2 IP ......................................................................................................................................................... 7 2-1.3 NTP ................................................................................................................................................... 11 2-1.4 Time .................................................................................................................................................. 11 2-1.5 Log .................................................................................................................................................... 14 2-1.6 Digital I/O ........................................................................................................................................ 15 2-1.7 Alarm Notification ........................................................................................................................... 15
2‐2 GREEN ETHERNET ........................................................................................................................................... 19 2-2.1 Port Power Savings .......................................................................................................................... 19
2‐3 PORTS CONFIGURATION ................................................................................................................................... 18 2-3.1 Ports .................................................................................................................................................. 18 2-3.2 Ports Description ............................................................................................................................. 20
2‐4 DHCP .......................................................................................................................................................... 21 2-4.1 Server ................................................................................................................................................ 21 2-4.2 Snooping .......................................................................................................................................... 26 2-4.3 Relay ................................................................................................................................................. 27
2‐5 SECURITY ....................................................................................................................................................... 29 2-5.1 Switch ............................................................................................................................................... 29 2-5.2 Network ............................................................................................................................................ 54 2-5.3 AAA ................................................................................................................................................... 78
2‐6 AGGREGATION ................................................................................................................................................ 82 2-6.1 Static ................................................................................................................................................. 83 2-6.2 LACP ................................................................................................................................................. 84
2‐7 LINK OAM .................................................................................................................................................... 85 2-7.1 Port Settings ..................................................................................................................................... 86 2-7.2 Event Settings ................................................................................................................................... 87
2-8 LOOP PROTECTION ...................................................................................................................................... 88 2-9 SPANNING TREE ........................................................................................................................................... 90
2-9.1 Bridge Setting ................................................................................................................................... 90 2-9.2 MSTI Mapping .................................................................................................................................. 93 2-9.3 MSTI Priorities .................................................................................................................................. 95 2-9.4 CIST Ports ......................................................................................................................................... 96 2-9.5 MSTI Ports ........................................................................................................................................ 98
2-10 IPMC PROFILE .......................................................................................................................................... 99 2-10.1 Profile Table ................................................................................................................................... 99 2-10.2 Address Entry ............................................................................................................................... 101
2-11MVR ....................................................................................................................................................... 102 2-12 IPMC ..................................................................................................................................................... 105
2-12.1 IGMP Snooping ............................................................................................................................ 105 2-12.2 MLD Snooping ............................................................................................................................. 111
2-13 LLDP ...................................................................................................................................................... 116 2-13.1 LLDP .............................................................................................................................................. 116 2-13.2 LLDP-MED .................................................................................................................................... 119
2-14 POE ........................................................................................................................................................ 125 2- 14.1 Configuration .............................................................................................................................. 126

v
2- 14.2 Power Delay ................................................................................................................................ 129 2- 14.3 Schedule Profile .......................................................................................................................... 130 2- 14.4 Auto Checking ............................................................................................................................ 131 2- 14.5 Chip Reset Schedule ................................................................................................................... 132
2-15 EPS ........................................................................................................................................................ 133 2-16 MEP....................................................................................................................................................... 135 2-17 ERPS ...................................................................................................................................................... 137 2-18 MAC TABLE ............................................................................................................................................ 139 2-19 VLAN TRANSLATION ............................................................................................................................... 142
2- 19.1 Port to Group Mapping .............................................................................................................. 142 2- 19.2 VID Translation Mapping........................................................................................................... 143
2-20 VLANS ................................................................................................................................................... 144 2-21 PRIVATE VLANS ...................................................................................................................................... 148
2-21.1 Membership ................................................................................................................................. 148 2-21.2 Port Isolation ................................................................................................................................ 150
2-22 VCL ........................................................................................................................................................ 151 2-22.1 MAC-based VLAN ........................................................................................................................ 151 2-22.2 Protocol -based VLAN ................................................................................................................. 153 2-22.3 IP Subnet-based VLAN ................................................................................................................ 157
2-23 VOICE VLAN......................................................................................................................................... 159 2-23.1 Configuration ............................................................................................................................... 159 2-23.2 OUI ................................................................................................................................................ 161
2-24 ETHERNET SERVICES ................................................................................................................................. 162 2-24.1 Ports .............................................................................................................................................. 162 2-24.2 L2CP .............................................................................................................................................. 163 2-24.3 Bandwidth Profiles ...................................................................................................................... 164 2-24.4 EVCs .............................................................................................................................................. 165 2-24.5 ECEs .............................................................................................................................................. 168
2-25 QOS ....................................................................................................................................................... 171 2-25.1 Port Classification ....................................................................................................................... 171 2-25.2 Port Policing ................................................................................................................................. 173 2-25.3 Queue Policing ............................................................................................................................ 174 2-25.4 Port Scheduler .............................................................................................................................. 175 2-25.5 Port Shaping ................................................................................................................................ 178 2-25.6 Port Tag Remarking..................................................................................................................... 180 2-25.7 Port DSCP..................................................................................................................................... 183 2-25.8 DSCP-Based QoS ......................................................................................................................... 185 2-25.9 DSCP Translation ......................................................................................................................... 187 2-25.10 DSCP Classification ................................................................................................................... 189 2-25.11 QoS Control List......................................................................................................................... 191 2-25.12 Storm Control ............................................................................................................................ 196
2-26 MIRRORING ............................................................................................................................................ 198 2-27 UPNP ..................................................................................................................................................... 200 2-28 PTP ........................................................................................................................................................ 202 2-29. GVRP .................................................................................................................................................... 204
2-29.1 Global Config ............................................................................................................................... 205 2-29.2 Port Config ................................................................................................................................... 207
2-30. SFLOW ................................................................................................................................................... 208 2-31 UDLD .................................................................................................................................................... 210 2-32 RAPID RING ............................................................................................................................................ 211 2-33 SMTP .................................................................................................................................................... 212
CHAPTER 3. MONITOR .................................................................................................... 215 3-1 SYSTEM ..................................................................................................................................................... 215

vi
3-1.1 Information .................................................................................................................................... 215 3-1.2 IP Status .......................................................................................................................................... 217 3-1.3 Log .................................................................................................................................................. 219 3-1.4 Detailed Log ................................................................................................................................... 221
3-2 GREEN ETHERNET ...................................................................................................................................... 222 3-2.1 Port Power Savings ........................................................................................................................ 222
3-3 PORTS ....................................................................................................................................................... 222 3-3.1 Traffic Overview ............................................................................................................................. 223 3-3.2 Qos Statistics .................................................................................................................................. 225 3-3.3 QCL Status ...................................................................................................................................... 226 3-3.4 Detailed Statistics .......................................................................................................................... 228 3-3.5 SFP Information ............................................................................................................................. 231 3-3.6 SFP Detail Info ............................................................................................................................... 233
3-4 LINK OAM ................................................................................................................................................ 234 3-4.1 Statistics .......................................................................................................................................... 234 3-4.2 Port Status ...................................................................................................................................... 236 3-4.3 Event Status .................................................................................................................................... 238
3-5 DHCP ...................................................................................................................................................... 241 3-5.1 Server .............................................................................................................................................. 241 3-5.2 Snooping Table .............................................................................................................................. 245 3-5.3 Relay Statistics ............................................................................................................................... 246 3-5.4 Detailed Statistics .......................................................................................................................... 248
3-6 SECURITY .................................................................................................................................................. 250 3-6.1 Access Management Statistics ...................................................................................................... 250 3-6.2 Network .......................................................................................................................................... 251 3-6.3 AAA ................................................................................................................................................. 265 3-6.4 Switch ............................................................................................................................................. 272
3-7 AGGREGATION ........................................................................................................................................... 281 3-7.1 Status .............................................................................................................................................. 281 3-7.2 LACP ............................................................................................................................................... 282
3-8 LOOP PROTECTION .................................................................................................................................... 285 3-9 SPANNING TREE ......................................................................................................................................... 286
3-9.1 Bridge Status .................................................................................................................................. 286 3-9.2 Port Status ...................................................................................................................................... 288 3-9.3 Port Statistics ................................................................................................................................. 289
3-10 MVR ...................................................................................................................................................... 291 3-10.1 Statistics ....................................................................................................................................... 291 3-10.2 MVR Channels Groups ................................................................................................................ 293 3-10.3 MVR SFM Information ................................................................................................................. 295
3-11 IPMC ..................................................................................................................................................... 297 3-11.1 IGMP Snooping ............................................................................................................................ 297 3-11.2 MLD Snooping ............................................................................................................................. 303
3-12 LLDP ...................................................................................................................................................... 309 3-12.1 Neighbour .................................................................................................................................... 309 3-12.2 LLDP-MED Neighbour ................................................................................................................. 311 3-12.3 PoE ................................................................................................................................................ 314 3-12.4 EEE ................................................................................................................................................ 316 3-12.5 Port Statistics ............................................................................................................................... 318
3-13 ETHERNET SERVICES ................................................................................................................................. 319 3-13.1 EVC Statistics ............................................................................................................................... 319
3-14 PTP ........................................................................................................................................................ 321 3-15 POE ........................................................................................................................................................ 322 3-16 MAC TABLE ............................................................................................................................................ 325 3-17 VLANS ................................................................................................................................................... 327

vii
3-17.1 Membership ................................................................................................................................. 327 3-17.2 Port ............................................................................................................................................... 329
3-18 VCL ........................................................................................................................................................ 331 3-18.1 MAC-based VLAN ........................................................................................................................ 331 3-18.2 Protocol-based VLAN .................................................................................................................. 332 3-18.3 IP Subnet-based VLAN ................................................................................................................ 335
3-19 SFLOW .................................................................................................................................................... 336 3-20 UDLD .................................................................................................................................................... 338
CHAPTER 4. DIAGNOSTICS ............................................................................................. 340 4-1 PING ......................................................................................................................................................... 340 4-2 PING6 ....................................................................................................................................................... 342 4-3 VERIPHY .................................................................................................................................................. 344 4-4 TRACEROUTE ............................................................................................................................................. 345 4‐5 LINK OAM .................................................................................................................................................. 346
4-5.1 MIB Retrieval .................................................................................................................................. 346
CHAPTER 5. MAINTENANCE ............................................................................ 349 5-1 RESTART DEVICE ........................................................................................................................................ 349 5-2 REBOOT SCHEDULE .................................................................................................................................... 350 5-3 FACTORY DEFAULTS .................................................................................................................................... 351 5-4 FIRMWARE................................................................................................................................................. 352
5-4.1 Firmware upgrade ......................................................................................................................... 352 5-4.2 Firmware Selection ........................................................................................................................ 354
5-5 CONFIGURATION ........................................................................................................................................ 356 5-5.1 Save startup-config ....................................................................................................................... 356 5-5.2 Download ....................................................................................................................................... 357 5-5.3 Upload ............................................................................................................................................ 358 5-5.4 Activate ........................................................................................................................................... 360 5-5.5 Delete .............................................................................................................................................. 361
5-6 SERVER REPORT ......................................................................................................................................... 361
CHAPTER 6. DMS ............................................................................................... 362 6-1 MANAGEMENT .......................................................................................................................................... 363
6-1.1 DMS Mode ...................................................................................................................................... 363 6-1.2 Device List ...................................................................................................................................... 363
6-2 GRAPHICAL MONITORING .......................................................................................................................... 365 6-2.1 Topology View ................................................................................................................................ 365 6-2.2 Floor View ...................................................................................................................................... 372 6-2.3 Map View........................................................................................................................................ 374
6-3 MAINTENANCE .......................................................................................................................................... 375 6-3.1 Floor Image .................................................................................................................................... 375 6-3.2 Diagnostics ..................................................................................................................................... 376

1
INTRODUCTION
Overview
In this User Guide, it will not only tell you how to install and connect your network system but configure and monitor the H80 Series Switch through the web by (RJ-45) serial interface and Ethernet ports step-by-step. Many explanations in detail of hardware and software functions are shown as well as the examples of the operation for web-based interface.
The H80 Series Switch, the next generation Web managed switches from Manufacture, is a
portfolio of affordable managed switches that provides a reliable infrastructure for your business network. These switches deliver more intelligent features you need to improve the availability of your critical business applications, protect your sensitive information, and optimize your network bandwidth to deliver information and applications more effectively. It provides the ideal combination of affordability and capabilities for entry level networking includes small business or enterprise application and helps you create a more efficient, better-connected workforce.
H80 Series Switch is Industrial L2+ managed GbE PoE+ switch ; the specification is highlighted
as follows. L2+ features provide better manageability, security, QoS, and performance. Support IPv4/IPv6 dual stack management Support SSH/SSL secured management Support SNMP v1/v2c/v3 Support RMON groups 1,2,3,9 Support sFlow Support IGMP v1/v2/v3 Snooping Support MLD v1/v2 Snooping Support RADIUS and TACACS+ authentication Support IP Source Guard Support DHCP Relay (Option 82) Support DHCP Snooping Support ACL and QCL for traffic filtering Support 802.1d(STP), 802.1w(RSTP) and 802.1s(MSTP) Support LACP and static link aggregation Support Q-in-Q double tag VLAN Support GVRP dynamic VLAN
Overview of this User Guide
Chapter 1 “Operation of Web-based Management” Chapter 2 “System Configuration” Chapter 3 “Configuration” Chapter 4 “Security” Chapter 5 “Maintenance”

2
Chapter 1 Operation of Web-based Management
Initial Configuration
This chapter instructs you how to configure and manage the H80 Series Switch through the web user interface. With this facility, you can easily access and monitor through any one port of the switch all the status of the switch, including MIBs status, each port activity, Spanning tree status, port aggregation status, multicast traffic, VLAN and priority status, even illegal access record and so on.
The default values of the H80 Series Switch are listed in the table below:
IP Address 192.168.1.1 Subnet Mask 255.255.255.0 Default Gateway 192.168.1.254 Username admin Password admin
After the H80 Series Switch has been finished configuration it interface, you can browse it. For instance, type http://192.168.1.1 in the address row in a browser, it will show the following screen and ask you inputting username and password in order to login and access authentication.
The default username is “admin” and password is “admin”. For the first time to use, please enter the default username and password, and then click the <Login> button. The login process now is completed. In this login menu, you have to input the complete username and password respectively, the H80 Series Switch will not give you a shortcut to username automatically. This looks inconvenient, but safer. In the H80 Series Switch, allowed two or more users using administrator’s identity to manage this switch, which administrator to do the last setting, it will be an available configuration to effect the system.
NOTE: When you login the Switch WEB page to manage. You must first type the Username of the admin. Password was blank, so when you type after the end Username, please press enter. Management page to enter WEB. When you login H80 Series Switch Web UI management, you can use both ipv4 ipv6 login to manage
To optimize the display effect, we recommend you use Microsoft IE 6.0 above, Netscape V7.1 above or Firefox V1.00 above and have the resolution 1024x768. The switch supported neutral web browser interface
5
NOTE: AS H80 Series Switch the function enable dhcp, so If you do not have DHCP server to provide ip addresses to the switch, the Switch default ip 192.168.1.1
Figure 1 The login page

6
Chapter 2 System Configuration
This chapter describes the entire basic configuration tasks which includes the System Information and any manage of the Switch (e.g. Time, Account, IP, Syslog and NTP.)
2-1 System You can identify the system by configuring the contact information, name, and location of the switch.
2-1.1 Information
The switch system’s contact information is provided here.
Web interface To configure System Information in the web interface: 1. Click Configuration, System, and Information. 2. Write System Contact, System Name, System Location information in this page. 3. Click Apply
Figure 2-1.1: System Information
Parameter description: System Contact:
The textual identification of the contact person for this managed node, together with information on how to contact this person. The allowed string length is 0 to 128, and the allowed content is the ASCII characters from 32 to 126.
System name: An administratively assigned name for this managed node. By convention, this is the node's fully-qualified domain name. A domain name is a text string drawn from the alphabet (A-Za-z), digits (0-9), minus sign (-). No space characters are permitted as part of a name. The first character must be an alpha character. And the first or last character must not be a minus sign. The allowed string length is 0 to 255.
System Location: The physical location of this node(e.g., telephone closet, 3rd floor). The allowed string length is 0 to 128, and the allowed content is the ASCII characters from 32 to 126.
Buttons:

7
Apply – Click to save changes. Reset- Click to undo any changes made locally and revert to previously saved values.
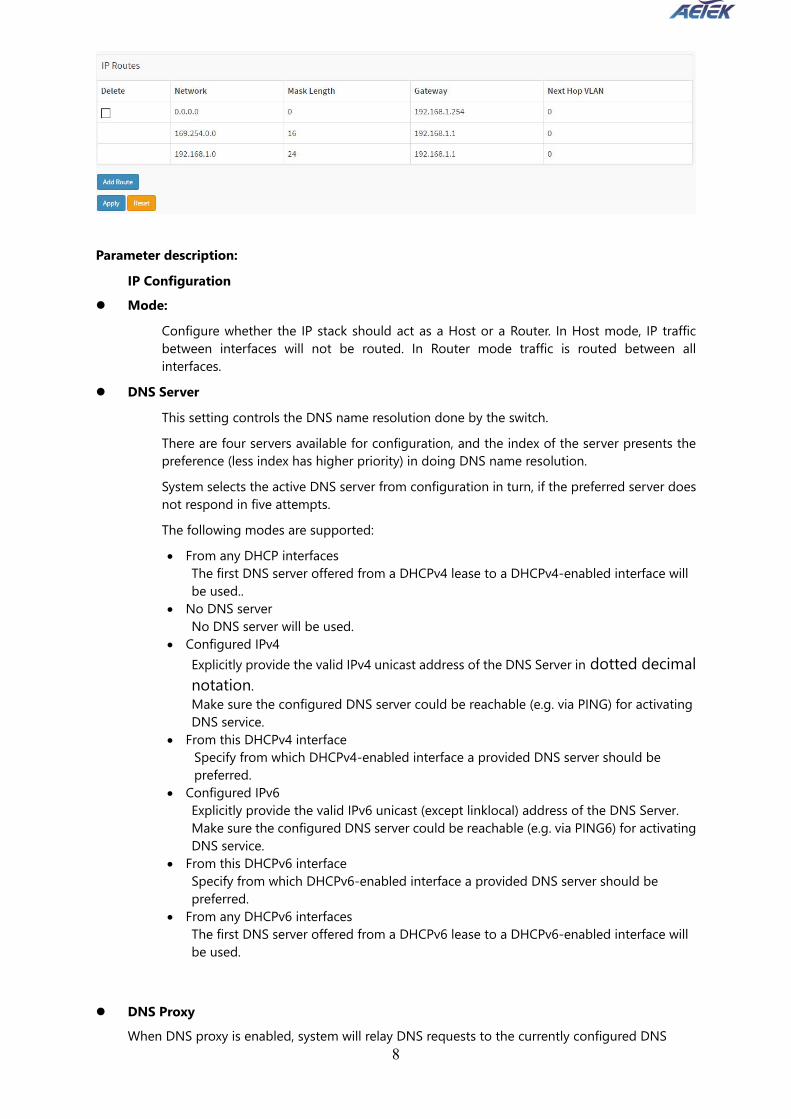
2-1.2 IP The IPv4 address for the switch could be obtained via DHCP Server for VLAN 1. To manually configure an address, you need to change the switch's default settings to values that are compatible with your network. You may also need to establish a default gateway between the switch and management stations that exist on another network segment. Configure the switch-managed IP information on this page Configure IP basic settings, control IP interfaces and IP routes. The maximum number of interfaces supported is 8 and the maximum number of routes is 32.
Web Interface To configure an IP address in the web interface: 1. Click Configuration, System, IP. 2. Click Add Interface then you can create new Interface on the switch. 3. Click Add Route then you can create new Route on the switch 4. Click Apply
Figure2-1.2: The IP configuration
8
Parameter description: IP Configuration Mode:
Configure whether the IP stack should act as a Host or a Router. In Host mode, IP traffic between interfaces will not be routed. In Router mode traffic is routed between all interfaces.
DNS Server This setting controls the DNS name resolution done by the switch. There are four servers available for configuration, and the index of the server presents the preference (less index has higher priority) in doing DNS name resolution. System selects the active DNS server from configuration in turn, if the preferred server does not respond in five attempts. The following modes are supported: From any DHCP interfaces
The first DNS server offered from a DHCPv4 lease to a DHCPv4-enabled interface will be used..
No DNS server No DNS server will be used.
Configured IPv4 Explicitly provide the valid IPv4 unicast address of the DNS Server in dotted decimal notation. Make sure the configured DNS server could be reachable (e.g. via PING) for activating DNS service.
From this DHCPv4 interface Specify from which DHCPv4-enabled interface a provided DNS server should be preferred.
Configured IPv6 Explicitly provide the valid IPv6 unicast (except linklocal) address of the DNS Server. Make sure the configured DNS server could be reachable (e.g. via PING6) for activating DNS service.
From this DHCPv6 interface Specify from which DHCPv6-enabled interface a provided DNS server should be preferred.
From any DHCPv6 interfaces The first DNS server offered from a DHCPv6 lease to a DHCPv6-enabled interface will be used.
DNS Proxy
When DNS proxy is enabled, system will relay DNS requests to the currently configured DNS

9
server, and reply as a DNS resolver to the client devices on the network. Only IPv4 DNS proxy is now supported. IP Interfaces
Delete Select this option to delete an existing IP interface.
VLAN The VLAN associated with the IP interface. Only ports in this VLAN will be able to access the IP interface. This field is only available for input when creating a new interface.
IPv4 DHCP Enabled Enable the DHCPv4 client by checking this box. If this option is enabled, the system will configure the IPv4 address and mask of the interface using the DHCPv4 protocol. The DHCPv4 client will announce the configured System Name as hostname to provide DNS lookup.
IPv4 DHCP Fallback Timeout The number of seconds for trying to obtain a DHCP lease. After this period expires, a configured IPv4 address will be used as IPv4 interface address. A value of zero disables the fallback mechanism, such that DHCP will keep retrying until a valid lease is obtained. Legal values are 0 to 4294967295 seconds.
IPv4 DHCP Current Lease For DHCP interfaces with an active lease, this column show the current interface address, as provided by the DHCP server.
IPv4 Address The IPv4 address of the interface in dotted decimal notation. If DHCP is enabled, this field configures the fallback address. The field may be left blank if IPv4 operation on the interface is not desired - or no DHCP fallback address is desired.
IPv4 Mask The IPv4 network mask, in number of bits (prefix length). Valid values are between 0 and 30 bits for a IPv4 address. If DHCP is enabled, this field configures the fallback address network mask. The field may be left blank if IPv4 operation on the interface is not desired - or no DHCP fallback address is desired.
DHCPv6 Enable Enable the DHCPv6 client by checking this box. If this option is enabled, the system will configure the IPv6 address of the interface using the DHCPv6 protocol.
DHCPv6 Rapid Commit Enable the DHCPv6 Rapid-Commit option by checking this box. If this option is enabled, the DHCPv6 client terminates the waiting process as soon as a Reply message with a Rapid Commit option is received. This option is only manageable when DHCPv6 client is enabled.
DHCPv6 Current Lease For DHCPv6 interface with an active lease, this column shows the interface address provided by the DHCPv6 server.
IPv6 Address The IPv6 address of the interface. A IPv6 address is in 128-bit records represented as eight fields of up to four hexadecimal digits with a colon separating each field (:). For example,fe80::215:c5ff:fe03:4dc7. The symbol :: is a special syntax that can be used as a shorthand way of representing multiple 16-bit groups of contiguous zeros; but it can appear only once.

10
System accepts the valid IPv6 unicast address only, except IPv4-Compatible address and IPv4-Mapped address. The field may be left blank if IPv6 operation on the interface is not desired.
IPv6 Mask The IPv6 network mask, in number of bits (prefix length). Valid values are between 1 and 128 bits for a IPv6 address. The field may be left blank if IPv6 operation on the interface is not desired.
Resolving IPv6 DAD The link-local address is formed from an interface identifier based on the hardware address which is supposed to be uniquely assigned. Once the DAD (Duplicate Address Detection) detects the address duplication, the operation on the interface SHOULD be disabled. At this moment, manual intervention is required to resolve the address duplication. For example, check whether the loop occurs in the VLAN or there is indeed other device occupying the same hardware address as the device in the VLAN. After making sure the specific link-local address is unique on the IPv6 link in use, delete and then add the specific IPv6 interface to restart the IPv6 operations on this interface.
IP Routes Delete
Select this option to delete an existing IP route. Network
The destination IP network or host address of this route. Valid format is dotted decimal notationor a valid IPv6 notation. A default route can use the value 0.0.0.0or IPv6 :: notation.
Mask Length The destination IP network or host mask, in number of bits (prefix length). It defines how much of a network address that must match, in order to qualify for this route. Valid values are between 0 and 32 bits respectively 128 for IPv6 routes. Only a default route will have a mask length of 0 (as it will match anything).
Gateway The IP address of the IP gateway. Valid format is dotted decimal notationor a valid IPv6 notation. Gateway and Network must be of the same type.
Next Hop VLAN (Only for IPv6) The VLAN ID (VID) of the specific IPv6 interface associated with the gateway. The given VID ranges from 1 to 4095 and will be effective only when the corresponding IPv6 interface is valid. If the IPv6 gateway address is link-local, it must specify the next hop VLAN for the gateway. If the IPv6 gateway address is not link-local, system ignores the next hop VLAN for the
gateway. Buttons Add Interface:
Click to add a new IP interface. A maximum of 8 interfaces is supported. Add Route:
Click to add a new IP route. A maximum of 32 routes is supported. Apply:
Click to save changes. Reset:

11
Click to undo any changes made locally and revert to previously saved values.
2-1.3 NTP
NTP is Network Time Protocol and is used to sync the network time based Greenwich Mean Time (GMT). If use the NTP mode and select a built-in NTP time server or manually specify an user-defined NTP server as well as Time Zone, the switch will sync the time in a short after pressing <Apply> button. Though it synchronizes the time automatically, NTP does not update the time periodically without user’s processing. Time Zone is an offset time off GMT. You have to select the time zone first and then perform time sync via NTP because the switch will combine this time zone offset and updated NTP time to come out the local time, otherwise, you will not able to get the correct time. The switch supports configurable time zone from –12 to +13 step 1 hour. Default Time zone: +8 Hrs.
Web Interface
To configure NTP in the web interface: 1. Click Configuration, System, NTP. 2. Specify the Time parameter in manual parameters. 3. Click Apply.
Figure 2-1.3: The NTP configuration
Parameter description: Mode :
Indicates the NTP mode operation. Possible modes are: Enabled: Enable NTP client mode operation. Disabled: Disable NTP client mode operation.
Server 1 to 5 :

12
Provide the IPv4 or IPv6 address of a NTP server. IPv6 address is in 128-bit records represented as eight fields of up to four hexadecimal digits with a colon separating each field (:). For example, 'fe80::215:c5ff:fe03:4dc7'. The symbol '::' is a special syntax that can be used as a shorthand way of representing multiple 16-bit groups of contiguous zeros; but it can appear only once. It can also represent a legally valid IPv4 address. For example, '::192.1.2.34'. In addition, it can also accept a domain name address.
Buttons Apply – Click to save changes. Reset - Click to undo any changes made locally and revert to previously saved values.

11
2-1.4 Time The switch provides manual and automatic ways to set the system time via NTP. Manual setting is simple and you just input “Year”, “Month”, “Day”, “Hour” and “Minute” within the valid value range indicated in each item.
Web Interface
To configure Time in the web interface: 1. Click Configuration, System and Time 2. Specify the Time parameter. 3. Click Apply.
Figure 2-1.4: The time configuration

12
Parameter description:
Time Configuration Clock Source:
There are two modes for configuring how the Clock Source from. Select "Use Local Settings" : Clock Source from Local Time. Select "Use NTP Server" : Clock Source from NTP Server.
System Date: Show the current time of the system. The year of system date limits between 2011 and 2037.
Time Zone Configuration Time Zone:
Lists various Time Zones worldwide. Select appropriate Time Zone from the drop down and click Apply to set.
Acronym: User can set the acronym of the time zone. This is a User configurable acronym to identify the time zone. (Range: Up to 16 characters)
Daylight Saving Time Configuration Daylight Saving Time:
This is used to set the clock forward or backward according to the configurations set below for a defined Daylight Saving Time duration. Select 'Disable' to disable the Daylight Saving Time configuration. Select 'Recurring' and configure the Daylight Saving Time duration to repeat the configuration every year. Select 'Non-Recurring' and configure the Daylight

13
Saving Time duration for single time configuration. (Default: Disabled). Recurring Configuration
Start time settings: Week - Select the starting week number. Day - Select the starting day. Month - Select the starting month. Hours - Select the starting hour. Minutes - Select the starting minute.
End time settings: Week - Select the ending week number. Day - Select the ending day. Month - Select the ending month. Hours - Select the ending hour. Minutes - Select the ending minute.
Offset settings: Offset - Enter the number of minutes to add during Daylight Saving Time. (Range: 1 to 1440)
NOTE: The under “Start Time Settings” and “End Time Settings” was displayed what you set on the “Start Time Settings” and “End Time Settings” field information.
Buttons
Apply – Click to save changes. Reset - Click to undo any changes made locally and revert to previously saved values.

14
2-1.5 Log The log is a standard for logging program messages . It allows separation of the software that generates messages from the system that stores them and the software that reports and analyzes them. It can be used as well a generalized informational, analysis and debugging messages. It is supported by a wide variety of devices and receivers across multiple platforms.
Web Interface To configure log configuration in the web interface: 1. Click Configuration, System and log. 2. Specify the syslog parameters include IP Address of Syslog server and Port number. 3. Evoke the Syslog to enable it. 4. Click Apply.
Figure2-1.5: The System Log configuration
Parameter description: Server Mode :
Indicate the server mode operation. When the mode operation is enabled, the syslog message will send out to syslog server. The syslog protocol is based on UDP communication and received on UDP port 514 and the syslog server will not send acknowledgments back sender since UDP is a connectionless protocol and it does not provide acknowledgments. The syslog packet will always send out even if the syslog server does not exist. Possible modes are: Enabled: Enable server mode operation. Disabled: Disable server mode operation.
Server Address : Indicates the IPv4 hosts address of syslog server. If the switch provide DNS feature, it also can be a host name.
Buttons Apply – Click to save changes. Reset - Click to undo any changes made locally and revert to previously saved values.

15
2-1.6 Digital I/O Configure the normal modes of digital input/output (DI/DO).
Web Interface To configure Digital I/O configuration in the web interface: 1. Click Configuration, System and Digital I/O. 2. Specify the Digital I/O Normal Mode.. 3. Click Apply.
Figure2-1.6: The Digital I/O Configuration
Parameter description: DI Normal Mode
Set the normal mode of the digital input(DI). You can set it to High or Low. DO Normal Mode
Set the normal mode of the digital output(DO). You can set it to Open or Close. Buttons
Apply – Click to save changes.
2-1.7 Alarm Notification
2-1.7.1 Trap Event Severity
This page displays current trap event severity configurations. Trap event severity can also be configured here.
Web Interface To configure Trap Event Severity in the web interface: 1. Click Configuration, System, Alarm Notification and Trap Event Severity. 2. Specify the Group Name, Severity Level, Syslog, Trap, SMIP, Switch2go and Digital out. 3. Click Apply.
Figure 2-1.7.1: The Trap Event Severity

16
Parameter description: Group Name
The name identifying the severity group. Severity Level
Every group has an severity level. The following level types are supported: <0> Emergency: System is unusable. <1> Alert: Action must be taken immediately. <2> Critical: Critical conditions. <3> Error: Error conditions. <4> Warning: Warning conditions. <5> Notice: Normal but significant conditions. <6> Information: Information messages. <7> Debug: Debug-level messages.
Syslog Enable - Select this Group Name in Syslog.
Trap Enable - Select this Group Name in Trap.
SMTP Enable - Select this Group Name in SMTP.
Switch2go Enable - Select this Group Name in Push Notification.
Digital out Enable - Select this Group Name in Digital Out.
Buttons Apply – Click to save changes.
Reset - Click to undo any changes made locally and revert to previously saved values.
2-1.7.2 Port Event Setting
This page is for configuring the port events.
Web Interface

17
To configure Trap Event Severity in the web interface: 1. Click Configuration, System, Alarm Notification and Port Event Setting. 2. Specify the Traffic and Action. 3. Click Apply.
Figure 2-7.1.2: The Port Event Setting
Parameter description: Active
To active the event handler of this port. Port
This is the logical port number for this row. Link On
Event is triggered when link on. Link Off
Event is triggered when link off. Traffic Overload
Event is triggered when the traffic is overload. Traffic Rx-Threshold
Event is triggered when Rx reach this threshold. Traffic Duration
Event is triggered when the traffic duration reach this value. Action Syslog
Enable this port for Syslog. Action Trap
Enable this port for Trap. Action SMTP
Enable this port for SMTP. Action Switch2go
Enable this port for Switch2go iPush. Action Digital Out
18
Enable this port for Digital Out. Severity
Every port has a severity level. The following level types are supported: <0> Emergency: System is unusable. <1> Alert: Action must be taken immediately. <2> Critical: Critical conditions. <3> Error: Error conditions. <4> Warning: Warning conditions. <5> Notice: Normal but significant conditions. <6> Information: Information messages. <7> Debug: Debug-level messages.
Buttons Apply – Click to save changes. Reset - Click to undo any changes made locally and revert to previously saved values.

19
2-2 Green Ethernet
2-2.1 Port Power Savings This page allows the user to configure the port power savings features. EEE is a power saving option that reduces the power usage when there is low or no traffic utilization. EEE works by powering down circuits when there is no traffic. When a port gets data to be transmitted all circuits are powered up. The time it takes to power up the circuits is named wakeup time. The default wakeup time is 17 us for 1Gbit links and 30 us for other link speeds. EEE devices must agree upon the value of the wakeup time in order to make sure that both the receiving and transmitting device has all circuits powered up when traffic is transmitted. The devices can exchange wakeup time information using the LLDP protocol. EEE works for ports in auto-negotiation mode, where the port is negotiated to either 1G or 100 Mbit full duplex mode. For ports that are not EEE-capable the corresponding EEE checkboxes are grayed out and thus impossible to enable EEE for. When a port is powered down for saving power, outgoing traffic is stored in a buffer until the port is powered up again. Because there are some overhead in turning the port down and up, more power can be saved if the traffic can be buffered up until a large burst of traffic can be transmitted. Buffering traffic will give some latency in the traffic.
Web Interface To configure a Port Power Saving Configuration in the web interface: 1. Click Configuration, Green Ethernet and Port Power Savings 2. Evoke to enable or disable the ActiPHY, PerfectReach, EEE and EEE Urgent Queues. 3. Click Apply.
Figure 2-2.1: The Port Power Saving Configuration
Parameter description:

20
Optimize EEE for The switch can be set to optimize EEE for either best power saving or least traffic latency.
Port: The switch port number of the logical port.
ActiPHY : Link down power savings enabled. ActiPHY works by lowering the power for a port when there is no link. The port is power up for short moment in order to determine if cable is inserted.
PerfectReach : Cable length power savings enabled. PerfectReach works by determining the cable length and lowering the power for ports with short cables.
EEE : Controls whether EEE is enabled for this switch port. For maximizing power savings, the circuit isn't started at once transmit data is ready for a port, but is instead queued until a burst of data is ready to be transmitted. This will give some traffic latency. If desired it is possible to minimize the latency for specific frames, by mapping the frames to a specific queue (done with QOS), and then mark the queue as an urgent queue. When an urgent queue gets data to be transmitted, the circuits will be powered up at once and the latency will be reduced to the wakeup time.
EEE Urgent Queues Queues set will activate transmission of frames as soon as data is available. Otherwise the Squeue will postpone transmission until a burst of frames can be transmitted.
Buttons Apply – Click to save changes. Reset - Click to undo any changes made locally and revert to previously saved values.

2-3 Ports Configuration
2-3.1 Ports
This page displays current port configurations. Ports can also be configured here.
Web Interface To configure a Current Port Configuration in the web interface: 1. Click Configuration, Ports Configuration, and Ports 2. Specify the Speed Configured, Flow Control, Maximum Frame size, Excessive Collision
mode and Power Control. 3. Click Apply.
Figure 2-3.1: The Port Configuration
Parameter description: Port :
This is the logical port number for this row. Link :
The current link state is displayed graphically. Green indicates the link is up and red that it is down.
Current Link Speed : Provides the current link speed of the port.
Configured Link Speed : Selects any available link speed for the given switch port. Only speeds supported by the

19
specific port is shown. Possible speeds are: Disabled - Disables the switch port operation. Auto - Port auto negotiating speed with the link partner and selects the highest speed that is compatible with the link partner. 10Mbps HDX - Forces the cu port in 10Mbps half-duplex mode. 10Mbps FDX - Forces the cu port in 10Mbps full duplex mode. 100Mbps HDX - Forces the cu port in 100Mbps half-duplex mode. 100Mbps FDX - Forces the cu port in 100Mbps full duplex mode. 1Gbps FDX - Forces the port in 1Gbps full duplex 2.5Gbps FDX - Forces the Serdes port in 2.5Gbps full duplex mode. SFP_Auto_AMS - Automatically determines the speed of the SFP. Note: There is no standardized way to do SFP auto detect, so here it is done by reading the SFP rom. Due to the missing standardized way of doing SFP auto detect some SFPs might not be detectable. The port is set in AMS mode. Cu port is set in Auto mode. 100-FX - SFP port in 100-FX speed. Cu port disabled. 1000-X - SFP port in 1000-X speed. Cu port disabled. Ports in AMS mode with 1000-X speed has Cu port preferred. Ports in AMS mode with 1000-X speed has fiber port preferred. Ports in AMS mode with 100-FX speed has fiber port preferred.
Advertise Duplex When duplex is set as auto i.e auto negotiation, the port will only advertise the specified duplex as either Fdx or Hdx to the link partner. By default port will advertise all the supported duplexes if the Duplex is Auto.
Advertise Speed When Speed is set as auto i.e auto negotiation, the port will only advertise the specified speeds (10M100M 1G) to the link partner. By default port will advertise all the supported speeds if speed is set as Auto.
Flow Control : When Auto Speed is selected on a port, this section indicates the flow control capability that is advertised to the link partner. When a fixed-speed setting is selected, that is what is used. The Current Rx column indicates whether pause frames on the port are obeyed, and the Current Tx column indicates whether pause frames on the port are transmitted. The Rx and Tx settings are determined by the result of the last Auto Negotiation. Check the configured column to use flow control. This setting is related to the setting for Configured Link Speed. NOTICE: The 100FX standard doesn't support Auto Negotiation, so when in 100FX mode the flow control capabilities will always be shown as "disabled".Maximum Frame Size :
Enter the maximum frame size allowed for the switch port, including FCS. PFC
When PFC (802.1Qbb Priority Flow Control) is enabled on a port then flow control on a priority level is enabled. Through the Priority field, range (one or more) of priorities can be configured, e.g. '0-3,7' which equals '0,1,2,3,7'. PFC is not supported through auto

20
negotiation. PFC and Flowcontrol cannot both be enabled on the same port. Maximum Frame Size
Enter the maximum frame size allowed for the switch port, including FCS. The rangeis 1518-9600 bytes.
Excessive Collision Mode : Configure port transmit collision behavior. Discard: Discard frame after 16 collisions (default). Restart: Restart backoff algorithm after 16 collisions.
Frame Length Check Configures if frames with incorrect frame length in the EtherType/Length field shall be dropped. An Ethernet frame contains a field EtherType which can be used to indicate the frame payload size (in bytes) for values of 1535 and below. If the EtherType/Length field is above 1535, it indicates that the field is used as an EtherType (indicating which protocol is encapsulated in the payload of the frame). If "frame length check" is enabled, frames with payload size less than 1536 bytes are dropped, if the EtherType/Length field doesn't match the actually payload length. If "frame length check" is disabled, frames are not dropped due to frame length mismatch. Note: No drop counters count frames dropped due to frame length mismatch
Buttons Apply – Click to save changes.
Reset- Click to undo any changes made locally and revert to previously saved values. Upper left icon (Refresh)
You can click them for refresh the Port link Status by manual
2-3.2 Ports Description This page displays current port description.
Web Interface To configure a Port Description in the web interface: 1. Click Configuration, Port, then Port Description 2. Specify the detail Port alias or description an alphanumeric string describing the full name
and version identification for the system’s hardware type, software version, and networking application.
3. Click Apply.
Figure 2-3.2: The Port Configuration

21
Parameter description: Port :
This is the logical port number for this row. Description :
Enter up to 47 characters to be descriptive name for identifies this port. Buttons
Apply – Click to save changes. Reset- Click to undo any changes made locally and revert to previously saved values.
2-4 DHCP The section describes to configure the DHCP Snooping parameters of the switch. The DHCP Snooping can prevent attackers from adding their own DHCP servers to the network.
2-4.1 Server
2-4.1.1 Mode
This page configures global mode and VLAN mode to enable/disable DHCP server per system and per VLAN.
Web Interface To configure DHCP server mode in the web interface: 4. Click Configuration, DHCP, Server, Mode 5. Select “Enabled” in the Global Mode of DHCP Server Mode Configuration. 6. Add Vlan range. 7. Click Apply.
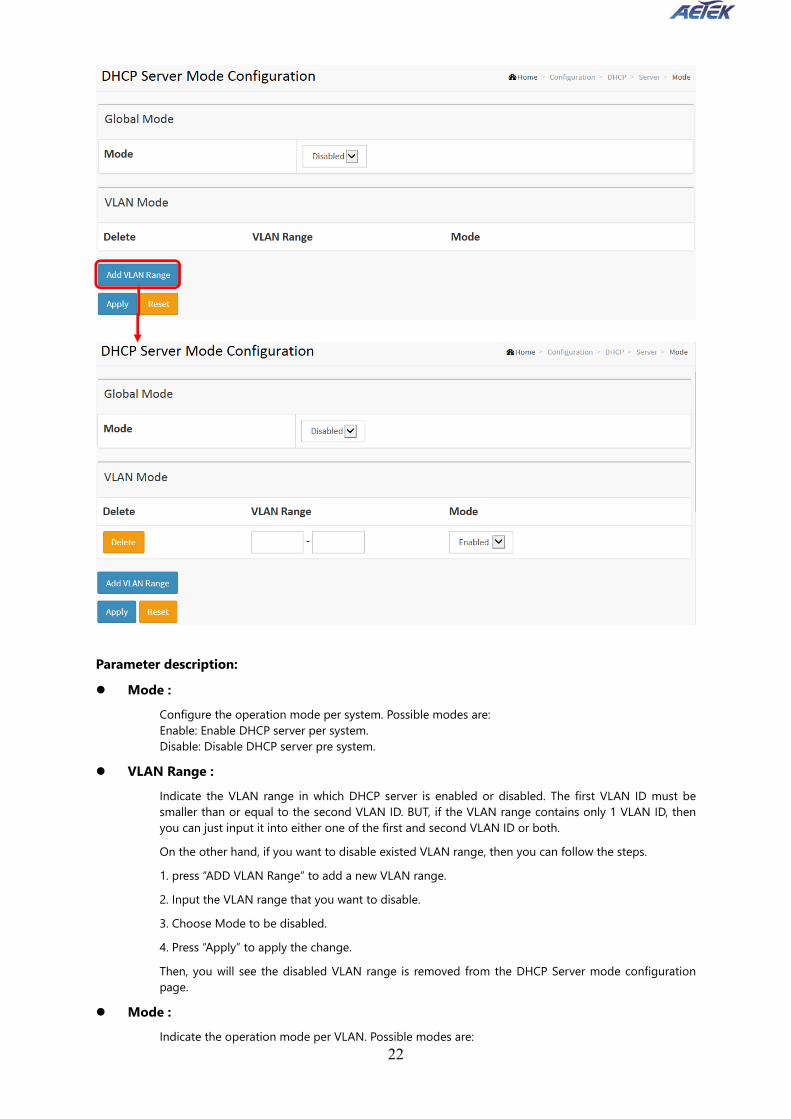
Figure 2-4.1.1: The DHCP server Mode
22
Parameter description: Mode :
Configure the operation mode per system. Possible modes are: Enable: Enable DHCP server per system. Disable: Disable DHCP server pre system.
VLAN Range : Indicate the VLAN range in which DHCP server is enabled or disabled. The first VLAN ID must be smaller than or equal to the second VLAN ID. BUT, if the VLAN range contains only 1 VLAN ID, then you can just input it into either one of the first and second VLAN ID or both.
On the other hand, if you want to disable existed VLAN range, then you can follow the steps.
1. press “ADD VLAN Range” to add a new VLAN range.
2. Input the VLAN range that you want to disable.
3. Choose Mode to be disabled.
4. Press “Apply” to apply the change.
Then, you will see the disabled VLAN range is removed from the DHCP Server mode configuration page.
Mode : Indicate the operation mode per VLAN. Possible modes are:

23
Enable: Enable DHCP server per VLAN. Disable: Disable DHCP server pre VLAN.
Buttons Add VLAN Range - Click to add a new VLAN range. Apply – Click to save changes.
Reset - Click to undo any changes made locally and revert to previously saved values.
2-4.1.2 Excluded IP
This page configures excluded IP addresses. DHCP server will not allocate these excluded IP addresses to DHCP client.
Web Interface To configure DHCP server excluded IP in the web interface: 1. Click Configuration, DHCP, Server, Excluded IP 2. Click Add IP Range then you can create new IP Range on the switch. 3. Click Apply.
Figure 2-4.1.2: The DHCP server excluded IP
Parameter description: IP Range :
Define the IP range to be excluded IP addresses. The first excluded IP must be smaller than or equal to the second excluded IP. BUT, if the IP range contains only 1 excluded IP, then you can just input it to either one of the first and second excluded IP or both.

24
Buttons Add IP Range - Click to add a new excluded IP range. Apply – Click to save changes.
Reset - Click to undo any changes made locally and revert to previously saved values.

25
2-4.1.3 Pool
This page manages DHCP pools. According to the DHCP pool, DHCP server will allocate IP address and deliver configuration parameters to DHCP client.
Web Interface To configure DHCP server pool in the web interface: 1. Click Configuration, DHCP, Server, Pool 2. Click Add New Pool then you can create new Pool on the switch. 3. Click Apply.
Figure 2-4.1.3: The DHCP server pool
Parameter description:
Pool Setting Add or delete pools. Adding a pool and giving a name is to create a new pool with "default" configuration. If you want to configure all settings including type, IP subnet mask and lease time, you can click the pool name to go into the configuration page.
Name : Configure the pool name that accepts all printable characters, except white space. If you want to configure the detail settings, you can click the pool name to go into the configuration page.
Type : Display which type of the pool is.

26
Network: the pool defines a pool of IP addresses to service more than one DHCP client.
Host: the pool services for a specific DHCP client identified by client identifier or hardware address.
If "-" is displayed, it means not defined.
IP : Display network number of the DHCP address pool.
If "-" is displayed, it means not defined.
Subnet Mask : Display subnet mask of the DHCP address pool.
If "-" is displayed, it means not defined.
Lease Time : Display lease time of the pool.
Buttons Add New Pool - Click to add a new DHCP pool. Apply – Click to save changes.
Reset - Click to undo any changes made locally and revert to previously saved values.
2-4.2 Snooping
DHCP Snooping is used to block intruder on the untrusted ports of the switch device when it tries to intervene by injecting a bogus DHCP reply packet to a legitimate conversation between the DHCP client and server. The section describes to configure the DHCP Snooping parameters of the switch. The DHCP Snooping can prevent attackers from adding their own DHCP servers to the network.
Web Interface To configure DHCP snooping in the web interface: 1. Click Configuration, DHCP, Snooping 2. Select “Enabled” in the Mode of DHCP Snooping Configuration. 3. Select “Trusted” of the specific port in the Mode of Port Mode Configuration. 4. Click Apply.
Figure 2-4.2: The DHCP Snooping Configuration

27
Parameter description: Snooping Mode :
Indicates the DHCP snooping mode operation. Possible modes are: Enabled: Enable DHCP snooping mode operation. When DHCP snooping mode operation is enabled, the DHCP request messages will be forwarded to trusted ports and only allow reply packets from trusted ports. Disabled: Disable DHCP snooping mode operation.
Port Mode Configuration Indicates the DHCP snooping port mode. Possible port modes are: Trusted: Configures the port as trusted source of the DHCP messages. Untrusted: Configures the port as untrusted source of the DHCP messages.
Buttons Apply – Click to save changes.
Reset - Click to undo any changes made locally and revert to previously saved values.
2-4.3 Relay
A DHCP relay agent is used to forward and to transfer DHCP messages between the clients and the server when they are not in the same subnet domain. It stores the incoming interface IP address in the GIADDR field of the DHCP packet. The DHCP server can use the value of GIADDR field to determine the assigned subnet. For such condition, please make sure the switch configuration of VLAN interface IP address and PVID(Port VLAN ID) correctly.
Web Interface To configure DHCP Relay in the web interface: 1. Click Configuration, DHCP, Relay

28
2. Specify the Relay Mode, Relay server, Relay Information Mode, Relay Information police. 3. Click Apply.
Figure 2-4.3: The DHCP Relay Configuration
Parameter description: Relay Mode :
Indicates the DHCP relay mode operation. Possible modes are: Enabled: Enable DHCP relay mode operation. When DHCP relay mode operation is enabled, the agent forwards and transfers DHCP messages between the clients and the server when they are not in the same subnet domain. And the DHCP broadcast message won't be flooded for security considerations. Disabled: Disable DHCP relay mode operation.
Relay Server Indicates the DHCP relay server IP address.
Relay Information Mode Indicates the DHCP relay information mode option operation. The option 82 circuit ID format as "[vlan_id][module_id][port_no]". The first four characters represent the VLAN ID, the fifth and sixth characters are the module ID(in standalone device it always equal 0, in stackable device it means switch ID), and the last two characters are the port number. For example, "00030108" means the DHCP message receive form VLAN ID 3, switch ID 1, port No 8. And the option 82 remote ID value is equal the switch MAC address. Possible modes are: Enabled: Enable DHCP relay information mode operation. When DHCP relay information mode operation is enabled, the agent inserts specific information (option 82) into a DHCP message when forwarding to DHCP server and removes it from a DHCP message when transferring to DHCP client. It only works when DHCP relay operation mode is enabled. Disabled: Disable DHCP relay information mode operation.
Relay Information Policy : Indicates the DHCP relay information option policy. When DHCP relay information mode operation is enabled, if the agent receives a DHCP message that already contains relay agent information it will enforce the policy. The 'Replace' policy is invalid when relay information mode is disabled. Possible policies are: Replace: Replace the original relay information when a DHCP message that already contains

29
it is received. Keep: Keep the original relay information when a DHCP message that already contains it is received. Drop: Drop the package when a DHCP message that already contains relay information is received.
Buttons Apply – Click to save changes.
Reset - Click to undo any changes made locally and revert to previously saved values.
2-5 Security This section shows you to configure the Port Security settings of the Switch. You can use the Port Security feature to restrict input to an interface by limiting and identifying MAC addresses.
2-5.1 Switch
2-5.1.1 Users
This page provides an overview of the current users. Currently the only way to login as another user on the web server is to close and reopen the browser
Web Interface
To configure User in the web interface: 1. Click Configuration, Security, Switch, Users. 2. Click Add new user 3. Specify the User Name parameter. 4. Click Apply.
Figure 2-5.1.1: The Users configuration

30
Parameter description: User Name The name identifying the user. This is also a link to Add/Edit User.Password
The password of the user. The allowed string length is 0 to 31. Any printable characters including space is accepted.
Privilege Level The privilege level of the user. The allowed range is 0 to 15. If the privilege level value is 15, it can access all groups, i.e. that is granted the fully control of the device. But others value need to refer to each group privilege level. User's privilege should be same or greater than the group privilege level to have the access of that group. By default setting, most groups privilege level 5 has the read-only access and privilege level 10 has the read-write access. And the system maintenance (software upload, factory defaults and etc.) need user privilege level 15. Generally, the privilege level 15 can be used for an administrator account, privilege level 10 for a standard user account and privilege level 5 for a guest account.
Buttons Add New User: Click to add a new user.
2-5.1.2 Privilege Level
This page provides an overview of the privilege levels.
Web Interface To configure Privilege Level in the web interface: 1. Click SYSTEM, Account, Privilege Level. 2. Specify the Privilege parameter. 3. Click Apply.
Figure2-5.1.2: The Privilege Level configuration

31
Parameter description: Group Name
The name identifying the privilege group. In most cases, a privilege level group consists of a single module (e.g. LACP, RSTP or QoS), but a few of them contains more than one. The following description defines these privilege level groups in details: System: Contact, Name, Location, Timezone, Daylight Saving Time, Log. Security: Authentication, System Access Management, Port (contains Dot1x port, MAC based and the MAC Address Limit), ACL, HTTPS, SSH, ARP Inspection, IP source guard. IP: Everything except 'ping'. Port: Everything except 'VeriPHY'. Diagnostics: 'ping' and 'VeriPHY'. Maintenance: CLI- System Reboot, System Restore Default, System Password, Configuration Save, Configuration Load and Firmware Load. Web- Users, Privilege Levels and everything in Maintenance. Debug: Only present in CLI.
Privilege Levels Every group has an authorization Privilege level for the following sub groups: configuration read-only, configuration/execute read-write, status/statistics read-only, and status/statistics read-write (e.g. for clearing of statistics). User Privilege should be same or greater than the authorization Privilege level to have the access to that group.
Buttons Apply – Click to save changes.
Reset - Click to undo any changes made locally and revert to previously saved values.

32
2-5.1.3 Authentication Method
This page shows how to configure a user with authenticated when he logs into the switch via one of the management client interfaces.
Web Interface To configure a Authentication Method Configuration in the web interface: 1. Specify the Client (console, telent, ssh, web) which you want to monitor. 2. Specify the Authentication Method (none,local, radius, tacacs+) 3. Checked Fallback. 4. Click Apply.
Figure 2-5.1.3: The Authentication Method Configuration
Parameter description: Client :
The management client for which the configuration below applies. Authentication Method :
Authentication Method can be set to one of the following values:

33
none : authentication is disabled and login is not possible. local : use the local user database on the switch for authentication. radius : use a remote RADIUS server for authentication. tacacs+ : use a remote TACACS+ server for authentication.
Methods that involves remote servers are timed out if the remote servers are offline. In this case the next method is tried. Each method is tried from left to right and continues until a method either approves or rejects a user. If a remote server is used for primary authentication it is recommended to configure secondary authentication as 'local'. This will enable the management client to login via the local user database if none of the configured authentication servers are alive.
Buttons: Apply – Click to save changes. Reset- Click to undo any changes made locally and revert to previously saved values.
2-5.1.4 SSH This section shows you to use SSH (Secure SHell) to securely access the Switch. SSH is a secure communication protocol that combines authentication and data encryption to provide secure encrypted communication.
Web Interface
To configure a SSH Configuration in the web interface: 1. Select “Enabled” in the Mode of SSH Configuration. 2. Click Apply.
Figure 2-5.1.4: The SSH Configuration
Parameter description: Mode :
Indicates the SSH mode operation. Possible modes are: Enabled: Enable SSH mode operation. Disabled: Disable SSH mode operation.
Buttons: Apply – Click to save changes. Reset - Click to undo any changes made locally and revert to previously saved values.

34
2-5.1.5 HTTPs This section shows you how to use HTTPS to securely access the Switch. HTTPS is a secure communication protocol that combines authentication and data encryption to provide secure encrypted communication via the browser.
Web Interface
To configure a HTTPS Configuration in the web interface: 1. Select “Enabled” in the Mode of HTTPS Configuration. 2. Select “Enabled” in the Automatic Redirect of HTTPS Configuration. 3. Click Apply.
Figure 2-5.1.5: The HTTPS Configuration
Parameter description: Mode :
Indicates the HTTPS mode operation. Possible modes are: Enabled: Enable HTTPS mode operation. Disabled: Disable HTTPS mode operation.
Automatic Redirect : Indicates the HTTPS redirect mode operation. Automatically redirect web browser to HTTPS when HTTPS mode is enabled. Possible modes are: Enabled: Enable HTTPS redirect mode operation. Disabled: Disable HTTPS redirect mode operation.

35
2-5.1.6 Access Management This section shows you to configure access management table of the Switch including HTTP/HTTPS, SNMP, and TELNET/SSH. You can manage the Switch over an Ethernet LAN, or over the Internet.
Web Interface
To configure an Access Management Configuration in the web interface: 1. Select “Enabled” in the Mode of Access Management Configuration. 2. Click “Add new entry”. 3. Specify the Start IP Address, End IP Address. 4. Checked Access Management method (HTTP/HTTPS, SNMP, and TELNET/SSH) in the entry. 5. Click Apply. Figure 2-5.1.6: The Access Management Configuration
Parameter description: Mode :
Indicates the access management mode operation. Possible modes are: Enabled: Enable access management mode operation. Disabled: Disable access management mode operation.
VLAN ID : Indicates the VLAN ID for the access management entry.
Delete : Check to delete the entry. It will be deleted during the next save.

36
Start IP address : Indicates the start IP address for the access management entry.
End IP address : Indicates the end IP address for the access management entry.
HTTP/HTTPS : Indicates that the host can access the switch from HTTP/HTTPS interface if the host IP address matches the IP address range provided in the entry.
SNMP : Indicates that the host can access the switch from SNMP interface if the host IP address matches the IP address range provided in the entry.
TELNET/SSH : Indicates that the host can access the switch from TELNET/SSH interface if the host IP address matches the IP address range provided in the entry.
Buttons: Add New Entry – Click to add a new access management entry. Apply – Click to save changes. Reset- Click to undo any changes made locally and revert to previously saved values.
2-5.1.7 SNMP
Any Network Management System (NMS) running the Simple Network Management Protocol (SNMP) can manage the Managed devices equipped with SNMP agent, provided that the Management Information Base (MIB) is installed correctly on the managed devices. The SNMP is a protocol that is used to govern the transfer of information between SNMP manager and agent and traverses the Object Identity (OID) of the management Information Base (MIB), described in the form of SMI syntax. SNMP agent is running on the switch to response the request issued by SNMP manager. Basically, it is passive except issuing the trap information. The switch supports a switch to turn on or off the SNMP agent. If you set the field SNMP “Enable”, SNMP agent will be started up. All supported MIB OIDs, including RMON MIB, can be accessed via SNMP manager. If the field SNMP is set “Disable”, SNMP agent will be de-activated, the related Community Name, Trap Host IP Address, Trap and all MIB counters will be ignored.
2-5.1.7.1 System This section describes how to configure SNMP System on the switch. This function is used to configure SNMP settings, community name, trap host and public traps as well as the throttle of SNMP. A SNMP manager must pass the authentication by identifying both community names, then it can access the MIB information of the target device. So, both parties must have the same community name. Once completing the setting, click <Apply> button, the setting takes effect.
Web Interface
To display the configure SNMP System in the web interface: 1. Click SNMP, System. 2. Evoke SNMP State to enable or disable the SNMP function.

37
3. Specify the Engine ID 4. Click Apply.
Figure2-5.1.7.1: The SNMP System Configuration
Parameter description: Mode :
Indicates the SNMP mode operation. Possible modes are: Enabled: Enable SNMP mode operation.
Disabled: Disable SNMP mode operation.
Version Indicates the SNMP supported version. Possible versions are: SNMP v1: Set SNMP supported version 1. SNMP v2c: Set SNMP supported version 2c. SNMP v3: Set SNMP supported version 3.
Read Community Indicates the community read access string to permit access to SNMP agent. The allowed string length is 0 to 255, and the allowed content is the ASCII characters from 33 to 126. The field is applicable only when SNMP version is SNMPv1 or SNMPv2c. If SNMP version is SNMPv3, the community string will be associated with SNMPv3 communities table. It provides more flexibility to configure security name than a SNMPv1 or SNMPv2c community string. In addition to community string, a particular range of source addresses can be used to restrict source subnet.
Write Community Indicates the community write access string to permit access to SNMP agent. The allowed string length is 0 to 255, and the allowed content is the ASCII characters from 33 to 126. The field is applicable only when SNMP version is SNMPv1 or SNMPv2c. If SNMP version is SNMPv3, the community string will be associated with SNMPv3 communities table. It provides more flexibility to configure security name than a SNMPv1 or SNMPv2c community string. In addition to community string, a particular range of source addresses can be used to restrict source subnet.
Engine ID
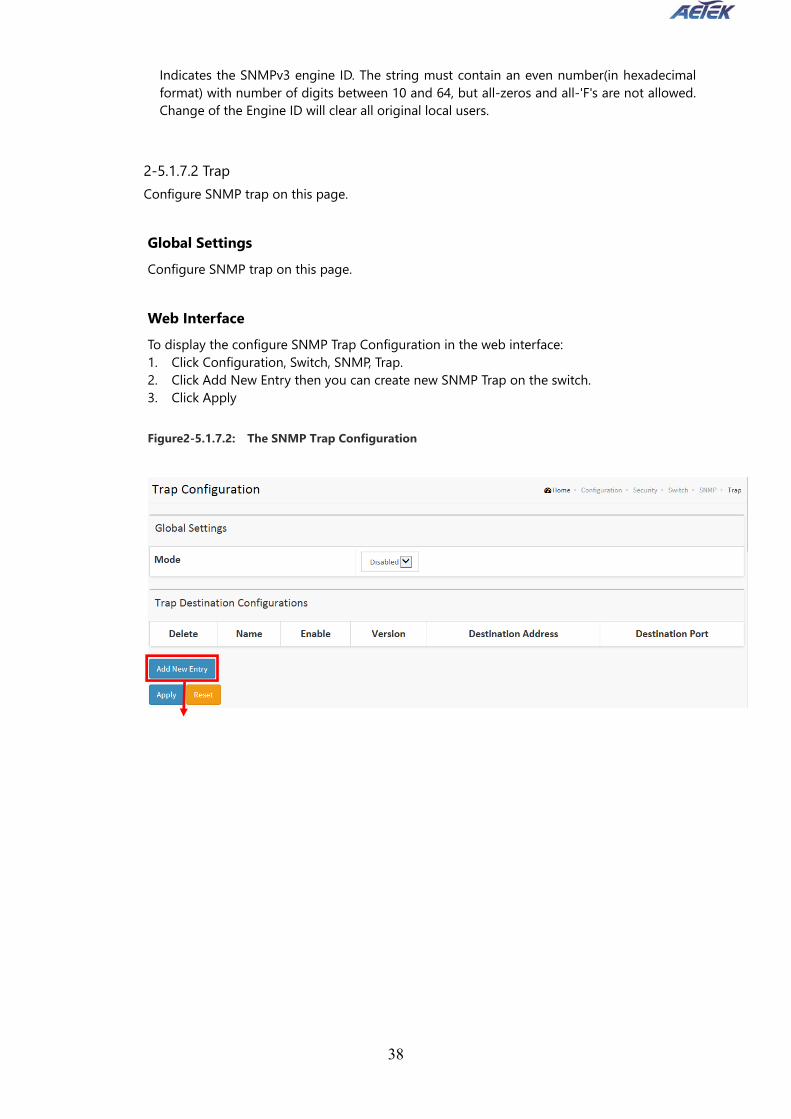
38
Indicates the SNMPv3 engine ID. The string must contain an even number(in hexadecimal format) with number of digits between 10 and 64, but all-zeros and all-'F's are not allowed. Change of the Engine ID will clear all original local users.
2-5.1.7.2 Trap Configure SNMP trap on this page.
Global Settings Configure SNMP trap on this page.
Web Interface To display the configure SNMP Trap Configuration in the web interface: 1. Click Configuration, Switch, SNMP, Trap. 2. Click Add New Entry then you can create new SNMP Trap on the switch. 3. Click Apply
Figure2-5.1.7.2: The SNMP Trap Configuration
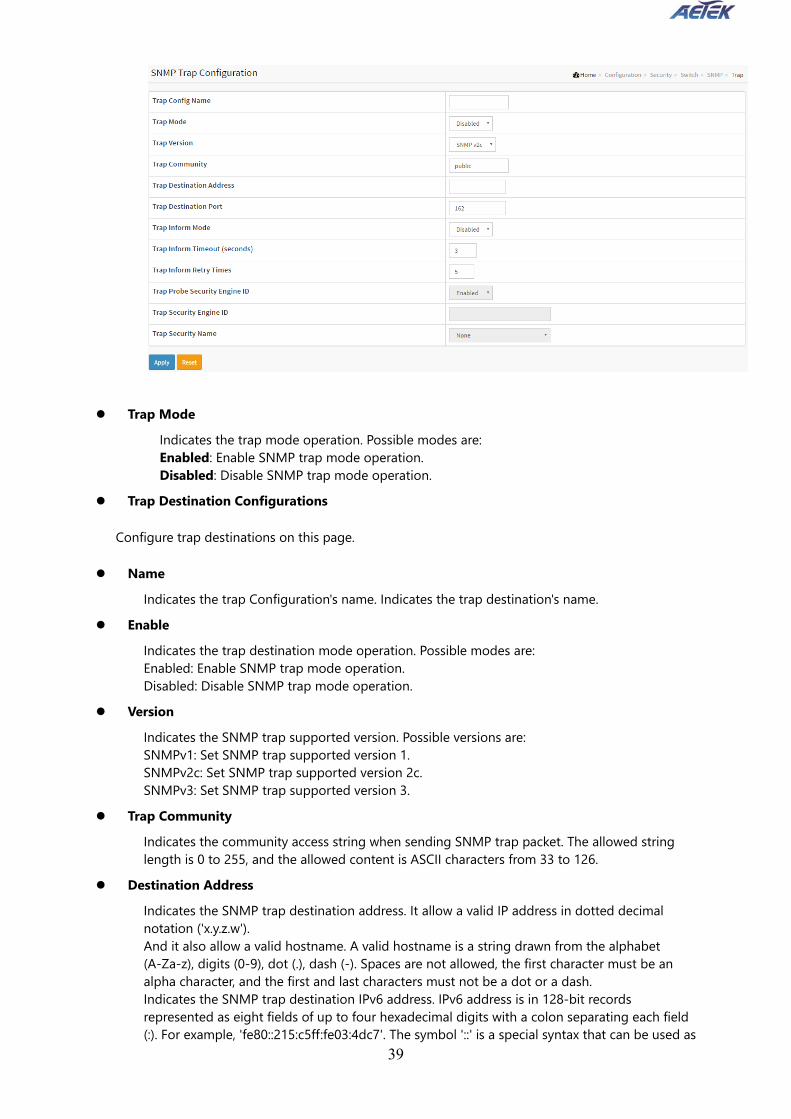
39
Trap Mode Indicates the trap mode operation. Possible modes are: Enabled: Enable SNMP trap mode operation. Disabled: Disable SNMP trap mode operation.
Trap Destination Configurations
Configure trap destinations on this page.
Name Indicates the trap Configuration's name. Indicates the trap destination's name.
Enable Indicates the trap destination mode operation. Possible modes are: Enabled: Enable SNMP trap mode operation. Disabled: Disable SNMP trap mode operation.
Version Indicates the SNMP trap supported version. Possible versions are: SNMPv1: Set SNMP trap supported version 1. SNMPv2c: Set SNMP trap supported version 2c. SNMPv3: Set SNMP trap supported version 3.
Trap Community Indicates the community access string when sending SNMP trap packet. The allowed string length is 0 to 255, and the allowed content is ASCII characters from 33 to 126.
Destination Address Indicates the SNMP trap destination address. It allow a valid IP address in dotted decimal notation ('x.y.z.w'). And it also allow a valid hostname. A valid hostname is a string drawn from the alphabet (A-Za-z), digits (0-9), dot (.), dash (-). Spaces are not allowed, the first character must be an alpha character, and the first and last characters must not be a dot or a dash. Indicates the SNMP trap destination IPv6 address. IPv6 address is in 128-bit records represented as eight fields of up to four hexadecimal digits with a colon separating each field (:). For example, 'fe80::215:c5ff:fe03:4dc7'. The symbol '::' is a special syntax that can be used as

40
a shorthand way of representing multiple 16-bit groups of contiguous zeros; but it can appear only once. It can also represent a legally valid IPv4 address. For example, '::192.1.2.34'.
Destination port Indicates the SNMP trap destination port. SNMP Agent will send SNMP message via this port, the port range is 1~65535.
Trap Inform Mode Indicates the SNMP trap inform mode operation. Possible modes are: Enabled: Enable SNMP trap inform mode operation. Disabled: Disable SNMP trap inform mode operation.
Trap Inform Timeout (seconds) Indicates the SNMP trap inform timeout. The allowed range is 0 to 2147.
Trap Inform Retry Times Indicates the SNMP trap inform retry times. The allowed range is 0 to 255.
Trap Probe Security Engine ID Indicates the SNMP trap probe security engine ID mode of operation. Possible values are: Enabled: Enable SNMP trap probe security engine ID mode of operation. Disabled: Disable SNMP trap probe security engine ID mode of operation.
Trap Security Engine ID Indicates the SNMP trap security engine ID. SNMPv3 sends traps and informs using USM for authentication and privacy. A unique engine ID for these traps and informs is needed. When "Trap Probe Security Engine ID" is enabled, the ID will be probed automatically. Otherwise, the ID specified in this field is used. The string must contain an even number (in hexadecimal format) with number of digits between 10 and 64, but all-zeros and all-'F's are not allowed.
Trap Security Name Indicates the SNMP trap security name. SNMPv3 traps and informs using USM for authentication and privacy. A unique security name is needed when traps and informs are enabled.

41
2-5.1.7.3 Communities
The function is used to configure SNMPv3 communities. The Community and UserName is unique. To create a new community account, please check <Add new community> button, and enter the account information then check <Save>. Max Group Number: 4.
Web Interface To display the configure SNMP Communities in the web interface: 1. Click SNMP, Communities. 2. Click Add new community. 3. Specify the SNMP communities parameters. 4. Click Apply. 5. If you want to modify or clear the setting then click Reset.
Figure2-5.1.7.3: The SNMPv1/v2 Communities Security Configuration
Parameter description: Delete
Check to delete the entry. It will be deleted during the next save. Community
Indicates the community access string to permit access to SNMPv3 agent. The allowed string length is 1 to 32, and the allowed content is ASCII characters from 33 to 126. The community string will be treated as security name and map a SNMPv1 or SNMPv2c community string.
Source IP Indicates the SNMP access source address. A particular range of source addresses can be used to restrict source subnet when combined with source mask.
Source Mask

42
Indicates the SNMP access source address mask
2-5.1.7.4 Users The function is used to configure SNMPv3 user. The Entry index key is UserName. To create a new UserName account, please check <Add new user> button, and enter the user information then check <Save>. Max Group Number: 10.
Web Interface To display the configure SNMP Users in the web interface: 1. Click SNMP, Users. 2. Specify the Privilege parameter. 3. Click Apply.
Figure 2-5.1.7.4: The SNMP Users Configuration
Parameter description: Delete
Check to delete the entry. It will be deleted during the next save. Engine ID
An octet string identifying the engine ID that this entry should belong to. The string must contain an even number (in hexadecimal format) with number of digits between 10 and 64, but all-zeros and all-'F's are not allowed. The SNMPv3 architecture uses the User-based Security Model (USM) for message security and the View-based Access Control Model (VACM) for access control. For the USM entry, the usmUserEngineID and usmUserName are the entry's keys. In a simple agent, usmUserEngineID is always that agent's own snmpEngineID value. The value can also take the value of the snmpEngineID of a remote SNMP engine with which this user can communicate. In other words, if user engine ID equal system engine ID then it is local user; otherwise it's remote user.

43
User Name A string identifying the user name that this entry should belong to. The allowed string length is 1 to 32, and the allowed content is ASCII characters from 33 to 126.
Security Level Indicates the security model that this entry should belong to. Possible security models are: NoAuth, NoPriv: No authentication and no privacy. Auth, NoPriv: Authentication and no privacy. Auth, Priv: Authentication and privacy. The value of security level cannot be modified if entry already exists. That means it must first be ensured that the value is set correctly.
Authentication Protocol Indicates the authentication protocol that this entry should belong to. Possible authentication protocols are: None: No authentication protocol. MD5: An optional flag to indicate that this user uses MD5 authentication protocol. SHA: An optional flag to indicate that this user uses SHA authentication protocol. The value of security level cannot be modified if entry already exists. That means must first ensure that the value is set correctly.
Authentication Password A string identifying the authentication password phrase. For MD5 authentication protocol, the allowed string length is 8 to 32. For SHA authentication protocol, the allowed string length is 8 to 40. The allowed content is ASCII characters from 33 to 126.
Privacy Protocol Indicates the privacy protocol that this entry should belong to. Possible privacy protocols are: None: No privacy protocol. DES: An optional flag to indicate that this user uses DES authentication protocol.
Privacy Password A string identifying the privacy password phrase. The allowed string length is 8 to 32, and the allowed content is ASCII characters from 33 to 126.
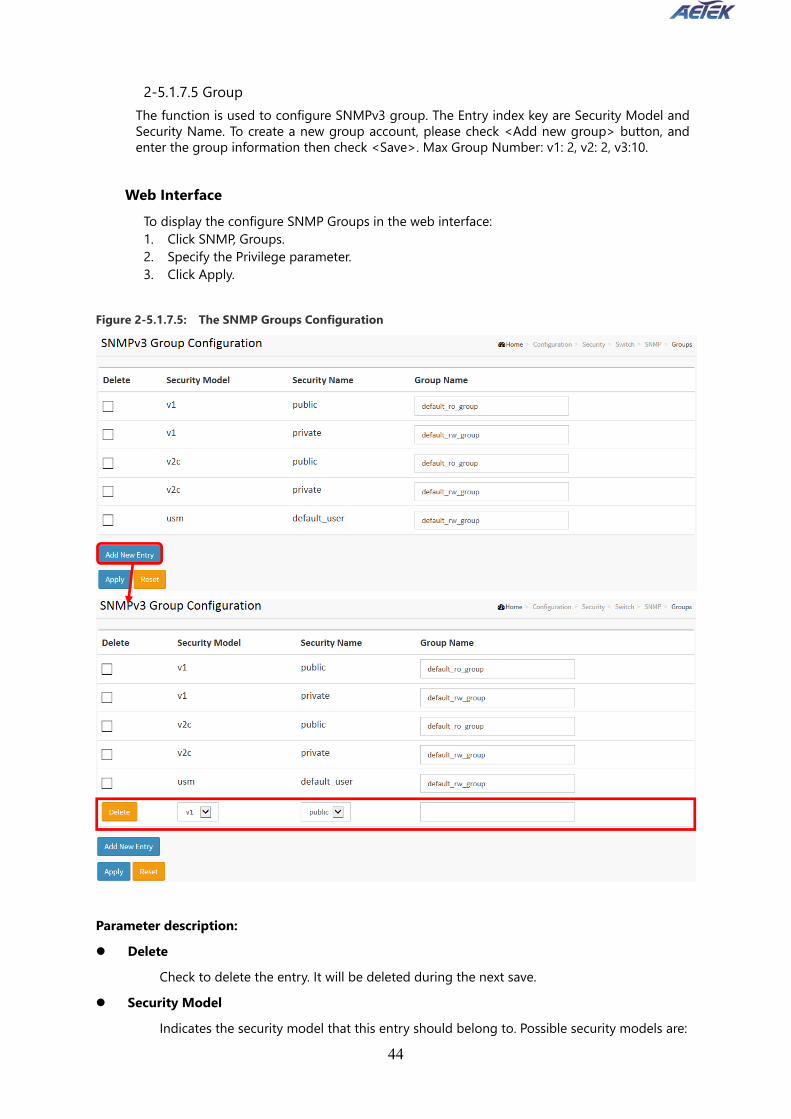
44
2-5.1.7.5 Group The function is used to configure SNMPv3 group. The Entry index key are Security Model and Security Name. To create a new group account, please check <Add new group> button, and enter the group information then check <Save>. Max Group Number: v1: 2, v2: 2, v3:10.
Web Interface
To display the configure SNMP Groups in the web interface: 1. Click SNMP, Groups. 2. Specify the Privilege parameter. 3. Click Apply.
Figure 2-5.1.7.5: The SNMP Groups Configuration
Parameter description: Delete
Check to delete the entry. It will be deleted during the next save. Security Model
Indicates the security model that this entry should belong to. Possible security models are:

45
v1: Reserved for SNMPv1. v2c: Reserved for SNMPv2c. usm: User-based Security Model (USM).
Security Name A string identifying the security name that this entry should belong to. The allowed string length is 1 to 32, and the allowed content is ASCII characters from 33 to 126.
Group Name A string identifying the group name that this entry should belong to. The allowed string length is 1 to 32, and the allowed content is ASCII characters from 33 to 126.

46
2-5.1.7.6 Views
The function is used to configure SNMPv3 view. The Entry index keys are OID Subtree and View Name. To create a new view account, please check <Add new view> button, and enter the view information then check <Save>. Max Group Number: 28.
Configure SNMPv3 view table on this page. The entry index keys are View Name and OID Subtree.
Web Interface To display the configure SNMP views in the web interface: 1. Click SNMP, Views. 2. Click Add new View. 3. Specify the SNMP View parameters. 4. Click Apply. 5. If you want to modify or clear the setting then click Reset.
Figure 2-5.1.7.6: The SNMP Views Configuration
Parameter description: Delete
Check to delete the entry. It will be deleted during the next save. View Name
A string identifying the view name that this entry should belong to. The allowed string length is 1 to 32, and the allowed content is ASCII characters from 33 to 126.
View Type Indicates the view type that this entry should belong to. Possible view types are: Included: An optional flag to indicate that this view subtree should be included.

47
Excluded: An optional flag to indicate that this view subtree should be excluded. In general, if a view entry's view type is 'excluded', there should be another view entry existing with view type as 'included' and it's OID subtree should overstep the 'excluded' view entry.
OID Subtree The OID defining the root of the subtree to add to the named view. The allowed OID length is 1 to 128. The allowed string content is digital number or asterisk(*).
2-5.1.7.7 Access The function is used to configure SNMPv3 accesses. The Entry index key are Group Name, Security Model and Security level. To create a new access account, please check <Add new access> button, and enter the access information then check <Save>. Max Group Number : 14
Web Interface
To display the configure SNMP Access in the web interface: 1. Click SNMP, Accesses. 2. Click Add new Access. 3. Specify the SNMP Access parameters. 4. Click Apply. 5. If you want to modify or clear the setting then click Reset. .
Figure 2-5.1.7.7: The SNMP Accesses Configuration
Parameter description: Delete

48
Check to delete the entry. It will be deleted during the next save. Group Name
A string identifying the group name that this entry should belong to. The allowed string length is 1 to 32, and the allowed content is ASCII characters from 33 to 126.
Security Model Indicates the security model that this entry should belong to. Possible security models are: Any: Any security model accepted(v1|v2c|usm). v1: Reserved for SNMPv1. v2c: Reserved for SNMPv2c. usm: User-based Security Model (USM).
Security Level Indicates the security model that this entry should belong to. Possible security models are: NoAuth, NoPriv: No authentication and no privacy. Auth, NoPriv: Authentication and no privacy. Auth, Priv: Authentication and privacy.
Read View Name The name of the MIB view defining the MIB objects for which this request may request the current values. The allowed string length is 1 to 32, and the allowed content is ASCII characters from 33 to 126.
Write View Name The name of the MIB view defining the MIB objects for which this request may potentially set new values. The allowed string length is 1 to 32, and the allowed content is ASCII characters from 33 to 126.
2-5.1.8 RMON
An RMON implementation typically operates in a client/server model. Monitoring devices contain RMON software agents that collect information and analyze packets. These probes act as servers and the Network Management applications that communicate with them act as clients.
2-5.1.8.1 Statistics Configure RMON Statistics table on this page. The entry index key is ID.
Web Interface To display the configure RMON configuration in the web interface: 1. Click RMON, Statistics. 2. Click Add New Entry. 3. Specify the ID parameters. 4. Click Apply.

49
Figure 2-5.1.8.1: The RMON Statics Configuration
Parameter description:
These parameters are displayed on the RMON Statistics Configuration page: Delete
Check to delete the entry. It will be deleted during the next save. ID
Indicates the index of the entry. The range is from 1 to 65535. Data Source
Indicates the port ID which wants to be monitored. If in stacking switch, the value must add 1000*(switch ID-1), for example, if the port is switch 3 port 5, the value is 2005
Interval Indicates the interval in seconds for sampling the history statistics data. The range is from 1 to 3600, default value is 1800 seconds.
Buckets Indicates the maximum data entries associated this History control entry stored in RMON. The range is from 1 to 3600, default value is 50.
Buckets Granted The number of data shall be saved in the RMON.
2-5.1.8.2 History Configure RMON History table on this page. The entry index key is ID.
Web Interface To display the configure RMON History in the web interface: 1. Click RMON, History. 2. Click Add New Entry. 3. Specify the ID parameters.

50
4. Click Apply.
Figure 2-5.1.8.2: The RMON History Configuration
Parameter description:
These parameters are displayed on the RMON History Configuration page: Delete
Check to delete the entry. It will be deleted during the next save. ID
Indicates the index of the entry. The range is from 1 to 65535. Data Source
Indicates the port ID which wants to be monitored. If in stacking switch, the value must add 1000*(switch ID-1), for example, if the port is switch 3 port 5, the value is 2005
Interval Indicates the interval in seconds for sampling the history statistics data. The range is from 1 to 3600, default value is 1800 seconds.
Buckets Indicates the maximum data entries associated this History control entry stored in RMON. The range is from 1 to 3600, default value is 50.
Buckets Granted The number of data shall be saved in the RMON.
2-5.1.8.3 Alarm Configure RMON Alarm table on this page. The entry index key is ID.
Web Interface

51
To display the configure RMON Alarm in the web interface: 1. Click RMON, Alarm. 2. Click Add New Entry. 3. Specify the ID parameters. 4. Click Apply.
Figure 2-5.1.8.3: The RMON Alarm Configuration
Parameter description:
These parameters are displayed on the RMON Alarm Configuration page: Delete
Check to delete the entry. It will be deleted during the next save. ID
Indicates the index of the entry. The range is from 1 to 65535. Interval
Indicates the interval in seconds for sampling and comparing the rising and falling threshold. The range is from 1 to 2^31-1.
Variable Indicates the particular variable to be sampled, the possible variables are: InOctets: The total number of octets received on the interface, including framing characters. InUcastPkts: The number of uni-cast packets delivered to a higher-layer protocol. InNUcastPkts: The number of broad-cast and multi-cast packets delivered to a higher-layer protocol. InDiscards: The number of inbound packets that are discarded even the packets are normal. InErrors:

52
The number of inbound packets that contained errors preventing them from being deliverable to a higher-layer protocol. InUnknownProtos: the number of the inbound packets that were discarded because of the unknown or un-support protocol. OutOctets: The number of octets transmitted out of the interface , including framing characters. OutUcastPkts: The number of uni-cast packets that request to transmit. OutNUcastPkts: The number of broad-cast and multi-cast packets that request to transmit. OutDiscards: The number of outbound packets that are discarded event the packets is normal. OutErrors: The The number of outbound packets that could not be transmitted because of errors. OutQLen: The length of the output packet queue (in packets).
Sample Type The method of sampling the selected variable and calculating the value to be compared against the thresholds, possible sample types are: Absolute: Get the sample directly. Delta: Calculate the difference between samples (default).
Value The value of the statistic during the last sampling period.
Startup Alarm The method of sampling the selected variable and calculating the value to be compared against the thresholds, possible sample types are: RisingTrigger alarm when the first value is larger than the rising threshold. FallingTrigger alarm when the first value is less than the falling threshold. RisingOrFallingTrigger alarm when the first value is larger than the rising threshold or less than the falling threshold (default).
Rising Threshold Rising threshold value (-2147483648-2147483647).
Rising Index Rising event index (1-65535).
Falling Threshold Falling threshold value (-2147483648-2147483647)
Falling Index Falling event index (1-65535).
2-5.1.8.4 Event

53
Configure RMON Event table on this page. The entry index key is ID.
Web Interface To display the configure RMON Event in the web interface: 1. Click RMON, Event. 2. Click Add New Entry. 3. Specify the ID parameters. 4. Click Apply.
Figure 2-5.1.8.4: The RMON Event Configuration
Parameter description:
These parameters are displayed on the RMON History Configuration page: Delete
Check to delete the entry. It will be deleted during the next save. ID
Indicates the index of the entry. The range is from 1 to 65535. Desc
Indicates this event, the string length is from 0 to 127, default is a null string. Type
Indicates the notification of the event, the possible types are: None: No SNMP log is created, no SNMP trap is sent. Log: Create SNMP log entry when the event is triggered. Snmp trap: Send SNMP trap when the event is triggered. Log and trap: Create SNMP log entry and sent SNMP trap when the event is triggered.
Community Specify the community when trap is sent, the string length is from 0 to 127, default is "public".
Event Last Time Indicates the value of sysUpTime at the time this event entry last generated an event.

54
2-5.2 Network
2-5.2.1 Limit Control This section shows you to configure the Port Security settings of the Switch. You can use the Port Security feature to restrict input to an interface by limiting and identifying MAC addresses.
Web Interface
To configure a Configuration of Limit Control in the web interface: 1. Select “Enabled” in the Mode of System Configuration. 2. Checked Aging Enabled. 3. Set Aging Period (Default is 3600 seconds).
To configure a Port Configuration of Limit Control in the web interface: 1. Select “Enabled” in the Mode of Port Configuration. 2. Specify the maximum number of MAC addresses in the Limit of Port Configuration. 3. Set Action (Trap, Shutdown, Trap & Shutdown) 4. Click Apply.
Figure 2-5.2.1: The Port Security Limit Control Configuration
Parameter description:

55
System Configuration
Mode : Indicates if Limit Control is globally enabled or disabled on the switch. If globally disabled, other modules may still use the underlying functionality, but limit checks and corresponding actions are disabled.
Aging Enabled : If checked, secured MAC addresses are subject to aging as discussed under Aging Period.
Aging Period : If Aging Enabled is checked, then the aging period is controlled with this input. If other modules are using the underlying port security for securing MAC addresses, they may have other requirements to the aging period. The underlying port security will use the shorter requested aging period of all modules that use the functionality. The Aging Period can be set to a number between 10 and 10,000,000 seconds. To understand why aging may be desired, consider the following scenario: Suppose an end-host is connected to a 3rd party switch or hub, which in turn is connected to a port on this switch on which Limit Control is enabled. The end-host will be allowed to forward if the limit is not exceeded. Now suppose that the end-host logs off or powers down. If it wasn't for aging, the end-host would still take up resources on this switch and will be allowed to forward. To overcome this situation, enable aging. With aging enabled, a timer is started once the end-host gets secured. When the timer expires, the switch starts looking for frames from the end-host, and if such frames are not seen within the next Aging Period, the end-host is assumed to be disconnected, and the corresponding resources are freed on the switch.
Port Configuration The table has one row for each port on the selected switch and a number of columns, which are:
Port : The port number to which the configuration below applies.
Mode : Controls whether Limit Control is enabled on this port. Both this and the Global Mode must be set to Enabled for Limit Control to be in effect. Notice that other modules may still use the underlying port security features without enabling Limit Control on a given port.
Action : If Limit is reached, the switch can take one of the following actions: None: Do not allow more than Limit MAC addresses on the port, but take no further action. Trap: If Limit + 1 MAC addresses is seen on the port, send an SNMP trap. If Aging is disabled, only one SNMP trap will be sent, but with Aging enabled, new SNMP traps will be sent every time the limit gets exceeded. Shutdown: If Limit + 1 MAC addresses is seen on the port, shut down the port. This implies that all secured MAC addresses will be removed from the port, and no new address will be learned. Even if the link is physically disconnected and reconnected on the port (by disconnecting the cable), the port will remain shut down. There are three ways to re-open the port:
1) Boot the switch, 2) Disable and re-enable Limit Control on the port or the switch,

56
3) Click the Reopen button. Trap & Shutdown: If Limit + 1 MAC addresses is seen on the port, both the "Trap" and the "Shutdown" actions described above will be taken.
State : This column shows the current state of the port as seen from the Limit Control's point of view. The state takes one of four values: Disabled: Limit Control is either globally disabled or disabled on the port. Ready: The limit is not yet reached. This can be shown for all actions. Limit Reached: Indicates that the limit is reached on this port. This state can only be shown if Action is set to none or Trap. Shutdown: Indicates that the port is shut down by the Limit Control module. This state can only be shown if Action is set to shut down or Trap & Shutdown.
Re-open Button : If a port is shut down by this module, you may reopen it by clicking this button, which will only be enabled if this is the case. For other methods, refer to shut down in the Action section.
NOTE: That clicking the reopen button causes the page to be refreshed, so non-committed changes will be lost
Upper right icon (Refresh):
You can click them for refresh the Port Security information by manual. Buttons:
Apply – Click to save changes. Reset- Click to undo any changes made locally and revert to previously saved values.
2-5.2.2 NAS The section describes to configure the NAS parameters of the switch. The NAS server can be employed to connect users to a variety of resources including Internet access, conference calls, printing documents on shared printers, or by simply logging on to the Internet.
Web Interface
To configure a Network Access Server in the web interface: 1. Select “Enabled” in the Mode of Network Access Server Configuration. 2. Checked Reauthentication Enabled. 3. Set Reauthentication Period (Default is 3600 seconds). 4. Set EAPOL Timeout (Default is 30 seconds). 5. Set Aging Period (Default is 300 seconds). 6. Set Hold Time (Default is 10 seconds). 7. Checked RADIUS-Assigned QoS Enabled. 8. Checked RADIUS-Assigned VLAN Enabled. 9. Checked Guest VLAN Enabled.

57
10. Specify Guest VLAN ID. 11. Specify Max. Reauth. Count. 12. Checked Allow Guest VLAN if EAPOL Seen. 13. Click Apply. Figure 2-5.2.2: The Network Access Server Configuration
Parameter description: Mode :
Indicates if NAS is globally enabled or disabled on the switch. If globally disabled, all ports are allowed forwarding of frames.
Reauthentication Enabled : If checked, successfully authenticated supplicants/clients are reauthenticated after the interval specified by the Reauthentication Period. Reauthentication for 802.1X-enabled ports can be used to detect if a new device is plugged into a switch port or if a supplicant is no longer attached. For MAC-based ports, reauthentication is only useful if the RADIUS server configuration has changed. It does not involve communication between the switch and the client, and therefore doesn't imply that a client is still present on a port (see Aging Period below).

58
Reauthentication Period : Determines the period, in seconds, after which a connected client must be reauthenticated. This is only active if the Reauthentication Enabled checkbox is checked. Valid values are in the range 1 to 3600 seconds.
EAPOL Timeout : Determines the time for retransmission of Request Identity EAPOL frames. Valid values are in the range 1 to 255 seconds. This has no effect for MAC-based ports.
Aging Period : This setting applies to the following modes, i.e. modes using the Port Security functionality to secure MAC addresses: • Single 802.1X • Multi 802.1X • MAC-Based Auth. When the NAS module uses the Port Security module to secure MAC addresses, the Port Security module needs to check for activity on the MAC address in question at regular intervals and free resources if no activity is seen within a given period of time. This parameter controls exactly this period and can be set to a number between 10 and 1000000 seconds. If reauthentication is enabled and the port is in an 802.1X-based mode, this is not so critical, since supplicants that are no longer attached to the port will get removed upon the next re-authentication, which will fail. But if re-authentication is not enabled, the only way to free resources is by aging the entries. For ports in MAC-based Auth. mode, reauthentication doesn't cause direct communication between the switch and the client, so this will not detect whether the client is still attached or not, and the only way to free any resources is to age the entry.
Hold Time : This setting applies to the following modes, i.e. modes using the Port Security functionality to secure MAC addresses: • Single 802.1X • Multi 802.1X • MAC-Based Auth. If a client is denied access - either because the RADIUS server denies the client access or because the RADIUS server request times out (according to the timeout specified on the "Configuration→Security→AAA" page) - the client is put on hold in the Un-authorized state. The hold timer does not count during an on-going authentication. In MAC-based Auth. mode, the switch will ignore new frames coming from the client during the hold time. The Hold Time can be set to a number between 10 and 1000000 seconds.
Port Configuration : The table has one row for each port on the selected switch and a number of columns, which are:
Port : The port number for which the configuration below applies.
Admin State :

59
If NAS is globally enabled, this selection controls the port's authentication mode. The following modes are available:
Force Authorized : In this mode, the switch will send one EAPOL Success frame when the port link comes up, and any client on the port will be allowed network access without authentication.
Force Unauthorized : In this mode, the switch will send one EAPOL Failure frame when the port link comes up, and any client on the port will be disallowed network access.
Port-based 802.1X : In the 802.1X-world, the user is called the supplicant, the switch is the authenticator, and the RADIUS server is the authentication server. The authenticator acts as the man-in-the-middle, forwarding requests and responses between the supplicant and the authentication server. Frames sent between the supplicant and the switch are special 802.1X frames, known as EAPOL (EAP Over LANs) frames. EAPOL frames encapsulate EAP PDUs (RFC3748). Frames sent between the switch and the RADIUS server are RADIUS packets. RADIUS packets also encapsulate EAP PDUs together with other attributes like the switch's IP address, name, and the supplicant's port number on the switch. EAP is very flexible, in that it allows for different authentication methods, like MD5-Challenge, PEAP, and TLS. The important thing is that the authenticator (the switch) doesn't need to know which authentication method the supplicant and the authentication server are using, or how many information exchange frames are needed for a particular method. The switch simply encapsulates the EAP part of the frame into the relevant type (EAPOL or RADIUS) and forwards it. When authentication is complete, the RADIUS server sends a special packet containing a success or failure indication. Besides forwarding this decision to the supplicant, the switch uses it to open up or block traffic on the switch port connected to the supplicant
NOTE: Suppose two backend servers are enabled and that the server timeout is configured to X seconds (using the AAA configuration page), and suppose that the first server in the list is currently down (but not considered dead). Now, if the supplicant retransmits EAPOL Start frames at a rate faster than X seconds, then it will never get authenticated, because the switch will cancel on-going backend authentication server requests whenever it receives a new EAPOL Start frame from the supplicant. And since the server hasn't yet failed (because the X seconds haven't expired), the same server will be contacted upon the next backend authentication server request from the switch. This scenario will loop forever. Therefore, the server timeout should be smaller than the supplicant's EAPOL Start frame retransmission rate.
Single 802.1X :
In port-based 802.1X authentication, once a supplicant is successfully authenticated on a port, the whole port is opened for network traffic. This allows other clients connected to the port (for instance through a hub) to piggy-back on the successfully authenticated client and get network access even though they really aren't authenticated. To overcome this security breach, use the Single 802.1X variant. Single 802.1X is really not an IEEE standard, but features many of the same characteristics as does port-based 802.1X. In Single 802.1X, at most one supplicant can get authenticated on the port at a time. Normal EAPOL frames are

60
used in the communication between the supplicant and the switch. If more than one supplicant is connected to a port, the one that comes first when the port's link comes up will be the first one considered. If that supplicant doesn't provide valid credentials within a certain amount of time, another supplicant will get a chance. Once a supplicant is successfully authenticated, only that supplicant will be allowed access. This is the most secure of all the supported modes. In this mode, the Port Security module is used to secure a supplicant's MAC address once successfully authenticated.
Multi 802.1X : In port-based 802.1X authentication, once a supplicant is successfully authenticated on a port, the whole port is opened for network traffic. This allows other clients connected to the port (for instance through a hub) to piggy-back on the successfully authenticated client and get network access even though they really aren't authenticated. To overcome this security breach, use the Multi 802.1X variant. Multi 802.1X is really not an IEEE standard, but features many of the same characteristics as does port-based 802.1X. Multi 802.1X is - like Single 802.1X - not an IEEE standard, but a variant that features many of the same characteristics. In Multi 802.1X, one or more supplicants can get authenticated on the same port at the same time. Each supplicant is authenticated individually and secured in the MAC table using the Port Security module. In Multi 802.1X it is not possible to use the multicast BPDU MAC address as destination MAC address for EAPOL frames sent from the switch towards the supplicant, since that would cause all supplicants attached to the port to reply to requests sent from the switch. Instead, the switch uses the supplicant's MAC address, which is obtained from the first EAPOL Start or EAPOL Response Identity frame sent by the supplicant. An exception to this is when no supplicants are attached. In this case, the switch sends EAPOL Request Identity frames using the BPDU multicast MAC address as destination - to wake up any supplicants that might be on the port. The maximum number of supplicants that can be attached to a port can be limited using the Port Security Limit Control functionality.
MAC-based Auth.: Unlike port-based 802.1X, MAC-based authentication is not a standard, but merely a best-practices method adopted by the industry. In MAC-based authentication, users are called clients, and the switch acts as the supplicant on behalf of clients. The initial frame (any kind of frame) sent by a client is snooped by the switch, which in turn uses the client's MAC address as both username and password in the subsequent EAP exchange with the RADIUS server. The 6-byte MAC address is converted to a string on the following form "xx-xx-xx-xx-xx-xx", that is, a dash (-) is used as separator between the lower-cased hexadecimal digits. The switch only supports the MD5-Challenge authentication method, so the RADIUS server must be configured accordingly. When authentication is complete, the RADIUS server sends a success or failure indication, which in turn causes the switch to open up or block traffic for that particular client, using the Port Security module. Only then will frames from the client be forwarded on the switch. There are no EAPOL frames involved in this authentication, and therefore, MAC-based Authentication has nothing to do with the 802.1X standard. The advantage of MAC-based authentication over port-based 802.1X is that several clients can be connected to the same port (e.g. through a 3rd party switch or a hub) and still require individual authentication, and that the clients don't need special supplicant software to authenticate. The advantage of MAC-based authentication over 802.1X-based authentication is that the clients don't need special supplicant software to authenticate. The disadvantage is that MAC addresses can be spoofed by malicious users - equipment whose MAC address is a valid RADIUS user can be used by anyone. Also, only the MD5-Challenge method is supported. The maximum number of clients that can be attached to a port can be

61
limited using the Port Security Limit Control functionality. RADIUS-Assigned QoS Enabled :
When RADIUS-Assigned QoS is both globally enabled and enabled (checked) on a given port, the switch reacts to QoS Class information carried in the RADIUS Access-Accept packet transmitted by the RADIUS server when a supplicant is successfully authenticated. If present and valid, traffic received on the supplicant's port will be classified to the given QoS Class. If (re-)authentication fails or the RADIUS Access-Accept packet no longer carries a QoS Class or it's invalid, or the supplicant is otherwise no longer present on the port, the port's QoS Class is immediately reverted to the original QoS Class (which may be changed by the administrator in the meanwhile without affecting the RADIUS-assigned). This option is only available for single-client modes, i.e. • Port-based 802.1X • Single 802.1X RADIUS attributes used in identifying a QoS Class: Refer to the written documentation for a description of the RADIUS attributes needed in order to successfully identify a QoS Class. The User-Priority-Table attribute defined in RFC4675 forms the basis for identifying the QoS Class in an Access-Accept packet. Only the first occurrence of the attribute in the packet will be considered, and to be valid, it must follow this rule: • All 8 octets in the attribute's value must be identical and consist of ASCII characters in the range '0' - '3', which translates into the desired QoS Class in the range [0; 3].
RADIUS-Assigned VLAN Enabled : When RADIUS-Assigned VLAN is both globally enabled and enabled (checked) for a given port, the switch reacts to VLAN ID information carried in the RADIUS Access-Accept packet transmitted by the RADIUS server when a supplicant is successfully authenticated. If present and valid, the port's Port VLAN ID will be changed to this VLAN ID, the port will be set to be a member of that VLAN ID, and the port will be forced into VLAN unaware mode. Once assigned, all traffic arriving on the port will be classified and switched on the RADIUS-assigned VLAN ID. If (re-)authentication fails or the RADIUS Access-Accept packet no longer carries a VLAN ID or it's invalid, or the supplicant is otherwise no longer present on the port, the port's VLAN ID is immediately reverted to the original VLAN ID (which may be changed by the administrator in the meanwhile without affecting the RADIUS-assigned). This option is only available for single-client modes, i.e. • Port-based 802.1X • Single 802.1X For trouble-shooting VLAN assignments, use the "Monitor→VLANs→VLAN Membership and VLAN Port" pages. These pages show which modules have (temporarily) overridden the current Port VLAN configuration. RADIUS attributes used in identifying a VLAN ID: RFC2868 and RFC3580 form the basis for the attributes used in identifying a VLAN ID in an Access-Accept packet. The following criteria are used: • The Tunnel-Medium-Type, Tunnel-Type, and Tunnel-Private-Group-ID attributes must all be present at least once in the Access-Accept packet. • The switch looks for the first set of these attributes that have the same Tag value and fulfil the following requirements (if Tag == 0 is used, the Tunnel-Private-Group-ID does not need
62
to include a Tag): - Value of Tunnel-Medium-Type must be set to "IEEE-802" (ordinal 6). - Value of Tunnel-Type must be set to "VLAN" (ordinal 13). - Value of Tunnel-Private-Group-ID must be a string of ASCII chars in the range '0' - '9', which is interpreted as a decimal string representing the VLAN ID. Leading '0's are discarded. The final value must be in the range [1; 4095].
Guest VLAN Enabled : When Guest VLAN is both globally enabled and enabled (checked) for a given port, the switch considers moving the port into the Guest VLAN according to the rules outlined below. This option is only available for EAPOL-based modes, i.e.: • Port-based 802.1X • Single 802.1X • Multi 802.1X For trouble-shooting VLAN assignments, use the "Monitor→VLANs→VLAN Membership and VLAN Port" pages. These pages show which modules have (temporarily) overridden the current Port VLAN configuration. Guest VLAN Operation: When a Guest VLAN enabled port's link comes up, the switch starts transmitting EAPOL Request Identity frames. If the number of transmissions of such frames exceeds Max. Reauth. Count and no EAPOL frames have been received in the meanwhile, the switch considers entering the Guest VLAN. The interval between transmissions of EAPOL Request Identity frames is configured with EAPOL Timeout. If Allow Guest VLAN if EAPOL Seen is enabled, the port will now be placed in the Guest VLAN. If disabled, the switch will first check its history to see if an EAPOL frame has previously been received on the port (this history is cleared if the port link goes down or the port's Admin State is changed), and if not, the port will be placed in the Guest VLAN. Otherwise it will not move to the Guest VLAN, but continue transmitting EAPOL Request Identity frames at the rate given by EAPOL Timeout. Once in the Guest VLAN, the port is considered authenticated, and all attached clients on the port are allowed access on this VLAN. The switch will not transmit an EAPOL Success frame when entering the Guest VLAN. While in the Guest VLAN, the switch monitors the link for EAPOL frames, and if one such frame is received, the switch immediately takes the port out of the Guest VLAN and starts authenticating the supplicant according to the port mode. If an EAPOL frame is received, the port will never be able to go back into the Guest VLAN if the "Allow Guest VLAN if EAPOL Seen" is disabled.
Port State : The current state of the port. It can undertake one of the following values: Globally Disabled: NAS is globally disabled. Link Down: NAS is globally enabled, but there is no link on the port. Authorized: The port is in Force Authorized or a single-supplicant mode and the supplicant is authorized. Unauthorized: The port is in Force Unauthorized or a single-supplicant mode and the supplicant is not successfully authorized by the RADIUS server. X Auth/Y Unauth: The port is in a multi-supplicant mode. Currently X clients are authorized

63
and Y are unauthorized. Restart :
Two buttons are available for each row. The buttons are only enabled when authentication is globally enabled and the port's Admin State is in an EAPOL-based or MAC-based mode. Clicking these buttons will not cause settings changed on the page to take effect. Re-authenticate: Schedules a re-authentication whenever the quiet-period of the port runs out (EAPOL-based authentication). For MAC-based authentication, re-authentication will be attempted immediately. The button only has effect for successfully authenticated clients on the port and will not cause the clients to get temporarily unauthorized. Reinitialize: Forces a re-initialization of the clients on the port and thereby a re-authentication immediately. The clients will transfer to the unauthorized state while the re-authentication is in progress.
Buttons: Apply – Click to save changes. Reset- Click to undo any changes made locally and revert to previously saved values.
Upper right icon (Refresh): You can click them for refresh the NAS Configuration by manual.
2-5.2.3 ACL The H80 SERIES Series switch access control list (ACL) is probably the most commonly used object in the IOS. It is used for packet filtering but also for selecting types of traffic to be analyzed, forwarded, or influenced in some way. The ACLs are divided into Ether Types. IPv4, ARP protocol, MAC and VLAN parameters etc. Here we will just go over the standard and extended access lists for TCP/IP. As you create ACEs for ingress classification, you can assign a policy for each port, the policy number is 1-8, and however, each policy can be applied to any port. This makes it very easy to determine what type of ACL policy you will be working with.
2-5.2.3.1 Ports The section describes how to configure the ACL parameters (ACE) of the each switch port. These parameters will affect frames received on a port unless the frame matches a specific ACE
Web Interface To configure the ACL Ports Configuration in the web interface: 1. Click Configuration, ACL, then Ports 2. To scroll the specific parameter value to select the correct value for port ACL setting. 3. Click the save to save the setting 4. If you want to cancel the setting then you need to click the reset button. It will revert to
previously saved values. 5. After you configure complete then you could see the Counter of the port. Then you could
click refresh to update the counter or Clear the information.
Figure 2-5.2.3.1: The ACL Ports Configuration
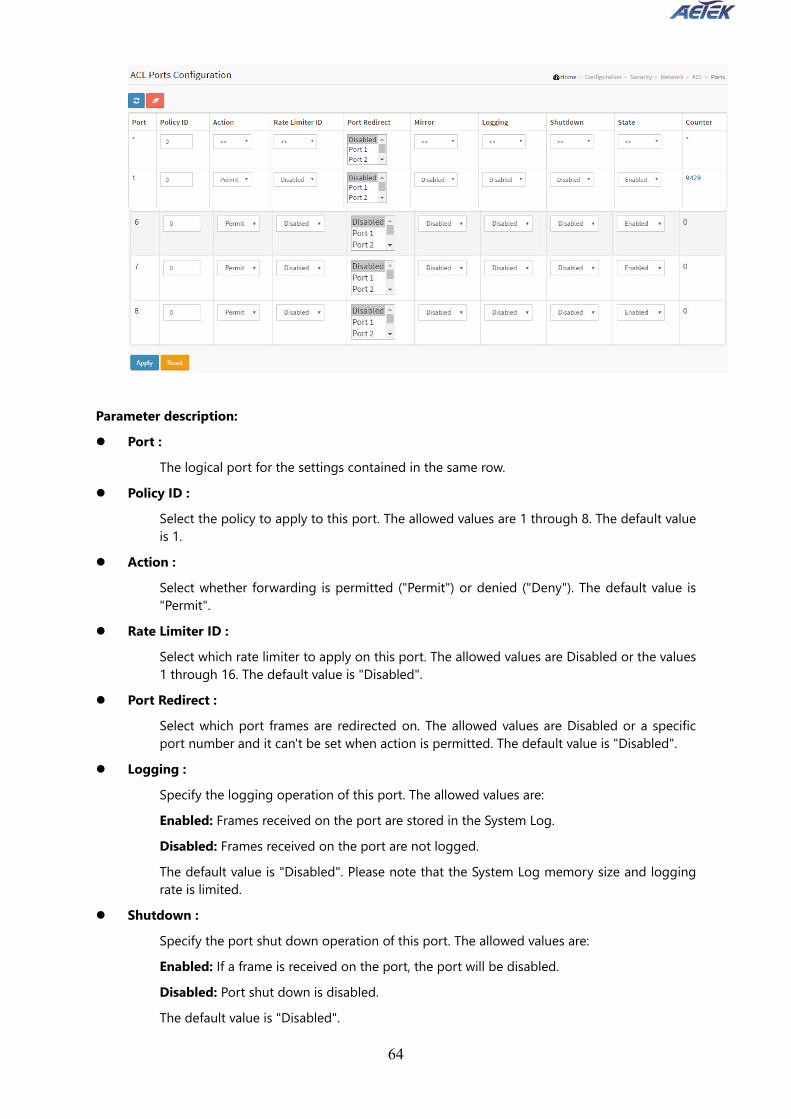
64
Parameter description: Port :
The logical port for the settings contained in the same row. Policy ID :
Select the policy to apply to this port. The allowed values are 1 through 8. The default value is 1.
Action : Select whether forwarding is permitted ("Permit") or denied ("Deny"). The default value is "Permit".
Rate Limiter ID : Select which rate limiter to apply on this port. The allowed values are Disabled or the values 1 through 16. The default value is "Disabled".
Port Redirect : Select which port frames are redirected on. The allowed values are Disabled or a specific port number and it can't be set when action is permitted. The default value is "Disabled".
Logging : Specify the logging operation of this port. The allowed values are: Enabled: Frames received on the port are stored in the System Log. Disabled: Frames received on the port are not logged. The default value is "Disabled". Please note that the System Log memory size and logging rate is limited.
Shutdown : Specify the port shut down operation of this port. The allowed values are: Enabled: If a frame is received on the port, the port will be disabled. Disabled: Port shut down is disabled. The default value is "Disabled".
65
State : Specify the port state of this port. The allowed values are: Enabled: To reopen ports by changing the volatile port configuration of the ACL user module. Disabled: To close ports by changing the volatile port configuration of the ACL user module. The default value is "Enabled"
Counter : Counts the number of frames that match this ACE.
Buttons Apply – Click to save changes.
Reset- Click to undo any changes made locally and revert to previously saved values. Upper right icon (Refresh, clear)
You can click them for refresh the ACL Port Configuration or clear them by manual.
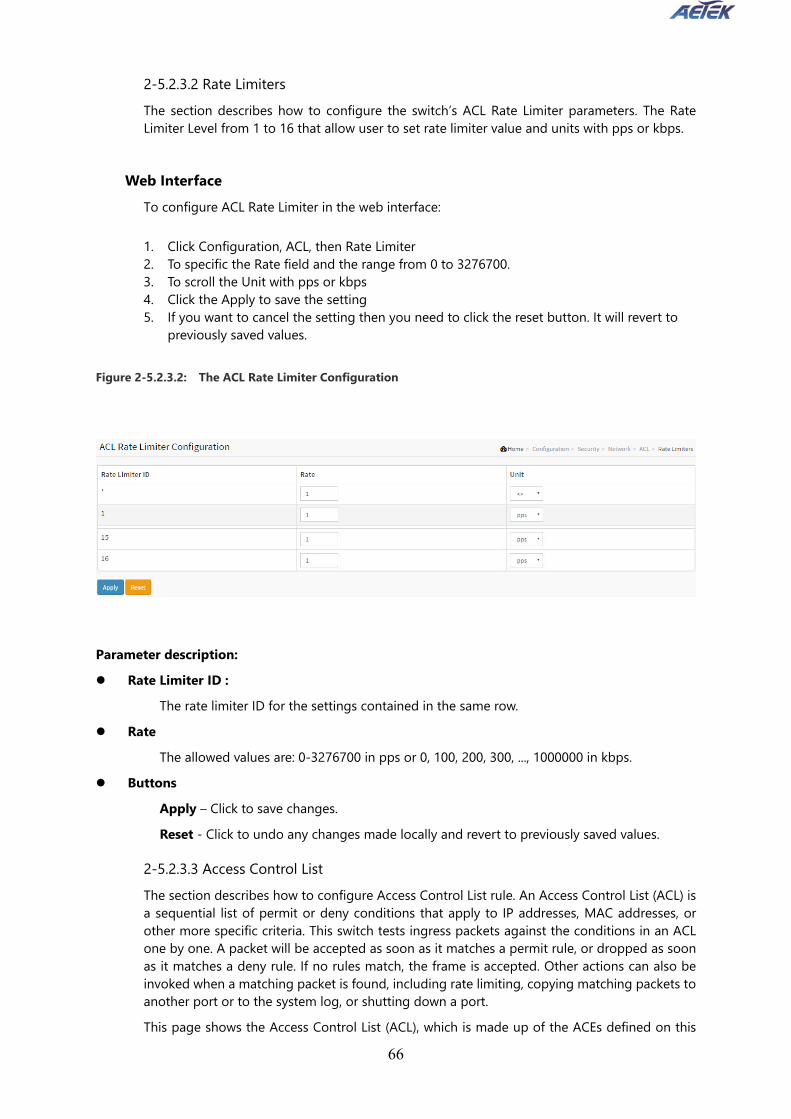
66
2-5.2.3.2 Rate Limiters The section describes how to configure the switch’s ACL Rate Limiter parameters. The Rate Limiter Level from 1 to 16 that allow user to set rate limiter value and units with pps or kbps.
Web Interface To configure ACL Rate Limiter in the web interface:
1. Click Configuration, ACL, then Rate Limiter 2. To specific the Rate field and the range from 0 to 3276700. 3. To scroll the Unit with pps or kbps 4. Click the Apply to save the setting 5. If you want to cancel the setting then you need to click the reset button. It will revert to
previously saved values.
Figure 2-5.2.3.2: The ACL Rate Limiter Configuration
Parameter description: Rate Limiter ID :
The rate limiter ID for the settings contained in the same row. Rate
The allowed values are: 0-3276700 in pps or 0, 100, 200, 300, ..., 1000000 in kbps. Buttons
Apply – Click to save changes. Reset - Click to undo any changes made locally and revert to previously saved values.
2-5.2.3.3 Access Control List The section describes how to configure Access Control List rule. An Access Control List (ACL) is a sequential list of permit or deny conditions that apply to IP addresses, MAC addresses, or other more specific criteria. This switch tests ingress packets against the conditions in an ACL one by one. A packet will be accepted as soon as it matches a permit rule, or dropped as soon as it matches a deny rule. If no rules match, the frame is accepted. Other actions can also be invoked when a matching packet is found, including rate limiting, copying matching packets to another port or to the system log, or shutting down a port. This page shows the Access Control List (ACL), which is made up of the ACEs defined on this

67
switch. Each row describes the ACE that is defined. The maximum number of ACEs is 256 on each switch. Click on the lowest plus sign to add a new ACE to the list. The reserved ACEs used for internal protocol, cannot be edited or deleted, the order sequence cannot be changed the priority is highest
Web Interface
To configure Access Control List in the web interface: 1. Click Configuration, ACL, then Configuration
2. Click the button to add a new ACL, or use the other ACL modification buttons to specify the editing action (i.e., edit, delete, or moving the relative position of entry in the list)
3. To specific the parameter of the ACE 4. Click the save to save the setting 5. If you want to cancel the setting then you need to click the reset button.
It will revert to previously saved values. 6. When editing an entry on the ACE Configuration page, note that the
Items displayed depend on various selections, such as Frame Type and IP Protocol Type. Specify the relevant criteria to be matched for this rule, and set the actions to take when a rule is matched (such as Rate Limiter, Port Copy, Logging, and Shutdown).
Figure 2-5.2.3.3: The ACL Rate Limiter Configuration
Parameter description: Ingress Port :
Indicates the ingress port of the ACE. Possible values are: Any: The ACE will match any ingress port. Policy: The ACE will match ingress ports with a specific policy.

68
Port: The ACE will match a specific ingress port. Policy / Bitmask :
Indicates the policy number and bitmask of the ACE. Frame Type :
Indicates the frame type of the ACE. Possible values are: Any: The ACE will match any frame type. EType: The ACE will match Ethernet Type frames. Note that an Ethernet Type based ACE will not get matched by IP and ARP frames. ARP: The ACE will match ARP/RARP frames. IPv4: The ACE will match all IPv4 frames. IPv4/ICMP: The ACE will match IPv4 frames with ICMP protocol. IPv4/UDP: The ACE will match IPv4 frames with UDP protocol. IPv4/TCP: The ACE will match IPv4 frames with TCP protocol. IPv4/Other: The ACE will match IPv4 frames, which are not ICMP/UDP/TCP. IPv6: The ACE will match all IPv6 standard frames.
Action : Indicates the forwarding action of the ACE. Permit: Frames matching the ACE may be forwarded and learned. Deny: Frames matching the ACE are dropped. Filter: Frames matching the ACE are filtered.
Rate Limiter : Indicates the rate limiter number of the ACE. The allowed range is 1 to 16. When Disabled is displayed, the rate limiter operation is disabled.
Port Copy : Indicates the port copy operation of the ACE. Frames matching the ACE are copied to the port number. The allowed values are Disabled or a specific port number. When Disabled is displayed, the port copy operation is disabled.
Logging : Indicates the logging operation of the ACE. Possible values are: Enabled: Frames matching the ACE are stored in the System Log. Disabled: Frames matching the ACE are not logged. Please note that the System Log memory size and logging rate is limited.
Shutdown : Indicates the port shut down operation of the ACE. Possible values are: Enabled: If a frame matches the ACE, the ingress port will be disabled. Disabled: Port shut down is disabled for the ACE.
Counter : The counter indicates the number of times the ACE was hit by a frame. Modification Buttons You can modify each ACE (Access Control Entry) in the table using the following buttons:

69
: Inserts a new ACE before the current row.
: Edits the ACE row.
: Moves the ACE up the list.
: Moves the ACE down the list.
: Deletes the ACE.
: The lowest plus sign adds a new entry at the bottom of the ACE listings. MAC Parameter:
SMAC Filter (Only displayed when the frame type is Ethernet Type or ARP.) Specify the source MAC filter for this ACE. Any: No SMAC filter is specified. (SMAC filter status is "don't-care".) Specific: If you want to filter a specific source MAC address with this ACE, choose this value. A field for entering an SMAC value appears.
SMAC Value When "Specific" is selected for the SMAC filter, you can enter a specific source MAC address. The legal format is "xx-xx-xx-xx-xx-xx" or "xx.xx.xx.xx.xx.xx" or "xxxxxxxxxxxx" (x is a hexadecimal digit). A frame that hits this ACE matches this SMAC value.
DMAC Filter Specify the destination MAC filter for this ACE. Any: No DMAC filter is specified. (DMAC filter status is "don't-care".) MC: Frame must be multicast. BC: Frame must be broadcast. UC: Frame must be unicast. Specific: If you want to filter a specific destination MAC address with this ACE, choose this value. A field for entering a DMAC value appears.
DMAC Value When "Specific" is selected for the DMAC filter, you can enter a specific destination MAC address. The legal format is "xx-xx-xx-xx-xx-xx" or "xx.xx.xx.xx.xx.xx" or "xxxxxxxxxxxx" (x is a hexadecimal digit). A frame that hits this ACE matches this DMAC value.
Buttons Apply – Click to save changes. Reset- Click to undo any changes made locally and revert to previously saved values.
Auto-refresh: To evoke the auto-refresh to refresh the information automatically.
Upper right icon (Refresh, clear, Remove All) You can click them for refresh the ACL configuration or clear them by manual. Others remove all to clean up all ACL configurations on the table.

70
2-5.2.4 IP Source Guard The section describes to configure the IP Source Guard detail parameters of the switch. You could use the IP Source Guard configure to enable or disable with the Port of the switch.
2-5.2.4.1 Configuration This section describes how to configure IP Source Guard setting including: Mode (Enabled and Disabled) Maximum Dynamic Clients (0, 1, 2, Unlimited)
Web Interface
To configure an IP Source Guard Configuration in the web interface: 1. Select “Enabled” in the Mode of IP Source Guard Configuration. 2. Select “Enabled” of the specific port in the Mode of Port Mode Configuration. 3. Select Maximum Dynamic Clients (0, 1, 2, Unlimited) of the specific port in the Mode of
Port Mode Configuration. 4. Click Apply.
Figure 2-5.2.4.1: The IP Source Guard Configuration
Parameter description: Mode of IP Source Guard Configuration :
Enable the Global IP Source Guard or disable the Global IP Source Guard. All configured ACEs will be lost when the mode is enabled.
Port Mode Configuration : Specify IP Source Guard is enabled on which ports. Only when both Global Mode and Port Mode on a given port are enabled, IP Source Guard is enabled on this given port.
Max Dynamic Clients : Specify the maximum number of dynamic clients that can be learned on given port. This value can be 0, 1, 2 or unlimited. If the port mode is enabled and the value of max dynamic

71
client is equal to 0, it means only allow the IP packets forwarding that are matched in static entries on the specific port.
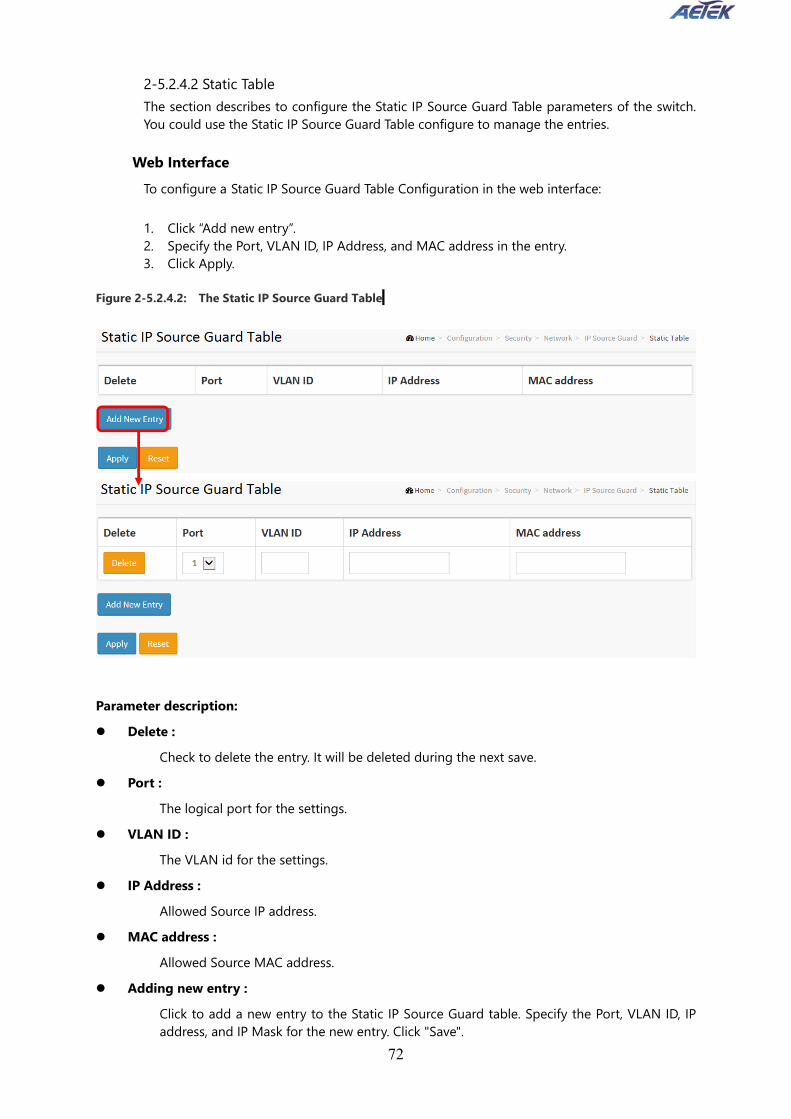
72
2-5.2.4.2 Static Table The section describes to configure the Static IP Source Guard Table parameters of the switch. You could use the Static IP Source Guard Table configure to manage the entries.
Web Interface
To configure a Static IP Source Guard Table Configuration in the web interface: 1. Click “Add new entry”. 2. Specify the Port, VLAN ID, IP Address, and MAC address in the entry. 3. Click Apply.
Figure 2-5.2.4.2: The Static IP Source Guard Table ////////
Parameter description: Delete :
Check to delete the entry. It will be deleted during the next save. Port :
The logical port for the settings. VLAN ID :
The VLAN id for the settings. IP Address :
Allowed Source IP address. MAC address :
Allowed Source MAC address. Adding new entry :
Click to add a new entry to the Static IP Source Guard table. Specify the Port, VLAN ID, IP address, and IP Mask for the new entry. Click "Save".

73
Buttons: Apply – Click to save changes. Reset- Click to undo any changes made locally and revert to previously saved values.
2-5.2.5 ARP Inspection The section describes to configure the ARP Inspection parameters of the switch. You could use the ARP Inspection configure to manage the ARP table.
2-5.2.5.1 Port Configuration This section describes how to configure ARP Inspection setting including: Mode (Enabled and Disabled) Port (Enabled and Disabled)
Web Interface
To configure an ARP Inspection Configuration in the web interface: 1. Select “Enabled” in the Mode of ARP Inspection Configuration. 2. Select “Enabled” of the specific port in the Mode of Port Mode Configuration. 3. Click Apply. Figure 2-5.2.5.1: The ARP Inspection Configuration
Parameter description: Mode of ARP Inspection Configuration :
Enable the Global ARP Inspection or disable the Global ARP Inspection. Port Mode Configuration :
Specify ARP Inspection is enabled on which ports. Only when both Global Mode and Port Mode on a given port are enabled, ARP Inspection is enabled on this given port. Possible modes are:

74
Enabled: Enable ARP Inspection operation. Disabled: Disable ARP Inspection operation. If you want to inspect the VLAN configuration, you have to enable the setting of "Check VLAN". The default setting of "Check VLAN" is disabled. When the setting of "Check VLAN" is disabled, the log type of ARP Inspection will refer to the port setting. And the setting of "Check VLAN" is enabled, the log type of ARP Inspection will refer to the VLAN setting. Possible setting of "Check VLAN" are: Enabled: Enable check VLAN operation. Disabled: Disable check VLAN operation. Only the Global Mode and Port Mode on a given port are enabled, and the setting of "Check VLAN" is disabled, the log type of ARP Inspection will refer to the port setting. There are four log types and possible types are: None: Log nothing. Deny: Log denied entries. Permit: Log permitted entries. ALL: Log all entries.
Buttons: Apply – Click to save changes. Reset- Click to undo any changes made locally and revert to previously saved values.
2-5.2.5.2 VLAN Configuration Each page shows up to 9999 entries from the VLAN table, default being 20, selected through the "entries per page" input field. When first visited, the web page will show the first 20 entries from the beginning of the VLAN Table. The first displayed will be the one with the lowest VLAN ID found in the VLAN Table. The "VLAN" input fields allow the user to select the starting point in the VLAN Table. Clicking the button will update the displayed table starting from that or the closest next VLAN Table match. The will use the next entry of the currently displayed VLAN entry as a basis for the next lookup. When the end is reached the warning message is shown in the displayed table. Use the button to start over.
Web Interface To configure a VLAN Mode Configuration in the web interface: 1. Click “Add new entry”. 2. Specify the VLAN ID, Log Type 3. Click Apply.
Figure 2-5.2.5.2: The VLAN Mode Configuration

75
Parameter description: VLAN Mode Configuration
Specify ARP Inspection is enabled on which VLANs. First, you have to enable the port setting on Port mode configuration web page. Only when both Global Mode and Port Mode on a given port are enabled, ARP Inspection is enabled on this given port. Second, you can specify which VLAN will be inspected on VLAN mode configuration web page. The log type also can be configured on per VLAN setting. Possible types are: None: Log nothing. Deny: Log denied entries. Permit: Log permitted entries. ALL: Log all entries.
Buttons Add New Entry: Click to add a new VLAN to the ARP Inspection VLAN table. Apply: Click to save changes. Reset: Click to undo any changes made locally and revert to previously saved values.

76
2-5.2.5.3 Static Table The section describes to configure the Static ARP Inspection Table parameters of the switch. You could use the Static ARP Inspection Table configure to manage the ARP entries.
Web Interface
To configure a Static ARP Inspection Table Configuration in the web interface: 1. Click Configuration, Security, Network, ARP Inspection and Static Table. 2. Specify the Port, VLAN ID, IP Address, and MAC address in the entry. 3. Click Apply.
Figure 2-5.2.5.3: The Static ARP Inspection Table
Parameter description: Delete :
Check to delete the entry. It will be deleted during the next save. Port :
The logical port for the settings. VLAN ID :
The vlan id for the settings. MAC Address :
Allowed Source MAC address in ARP request packets. IP Address :
Allowed Source IP address in ARP request packets. Adding new entry :

77
Click to add a new entry to the Static ARP Inspection table. Specify the Port, VLAN ID, MAC address, and IP address for the new entry. Click "Save".
Buttons: Apply – Click to save changes. Reset- Click to undo any changes made locally and revert to previously saved values.
2-5.2.5.4 Dynamic Table Entries in the Dynamic ARP Inspection Table are shown on this page. The Dynamic ARP Inspection Table contains up to 1024 entries, and is sorted first by port, then by VLAN ID, then by MAC address, and then by IP address. Navigating the ARP Inspection Table Each page shows up to 99 entries from the Dynamic ARP Inspection table, default being 20, selected through the "entries per page" input field. When first visited, the web page will show the first 20 entries from the beginning of the Dynamic ARP Inspection Table. The "Start from port address", "VLAN", "MAC address" and "IP address" input fields allow the user to select the starting point in the Dynamic ARP Inspection Table. Clicking the button will update the displayed table starting from that or the closest next Dynamic ARP Inspection Table match. In addition, the two input fields will - upon a button click - assume the value of the first displayed entry, allowing for continuous refresh with the same start address. The will use the last entry of the currently displayed table as a basis for the next lookup. When the end is reached the text "No more entries" is shown in the displayed table. Use the button to start over.
Web Interface To configure a Dynamic ARP Inspection Table Configuration in the web interface: 1. Click Configuration, Security, Network, ARP Inspection and Dynamic Table 2. Specify the Port, VLAN ID, IP Address, and MAC address in the entry. 3. Click Apply.
Figure 2-5.2.5.4: The Dynamic ARP Inspection Table
Parameter description: ARP Inspection Table Columns

78
Port Switch Port Number for which the entries are displayed.
VLAN ID VLAN-ID in which the ARP traffic is permitted.
MAC Address User MAC address of the entry.
IP Address User IP address of the entry.
Translate to static Select the checkbox to translate the entry to static entry.
Buttons: Apply – Click to save changes. Reset- Click to undo any changes made locally and revert to previously saved values.
Auto-refresh: Check this box to refresh the page automatically. Automatic refresh occurs every 3 seconds.
Refresh: Refreshes the displayed table starting from the input fields.
Save: Click to save changes.
Reset: Click to undo any changes made locally and revert to previously saved values.
<<: Updates the table starting from the first entry in the Dynamic ARP Inspection Table.
>>: Updates the table, starting with the entry after the last entry currently displayed
2-5.3 AAA This section shows you to use an AAA (Authentication, Authorization, and Accounting) server to provide access control to your network. The AAA server can be a TACACS+ or RADIUS server to create and manage objects that contain settings for using AAA servers.
2-5.3.1 RADIUS Web Interface
To configure a Common Configuration of AAA, RADIUS in the web interface: 1. Click Configuration, Security, AAA and RADIUS. 2. Specify the Parameter. 3. Click Apply.
Figure 2-5.3.1: The RADIUS Authentication Server Configuration

79
Parameter description: Global Configuration
These setting are common for all of the RADIUS servers. Timeout
Timeout is the number of seconds, in the range 1 to 1000, to wait for a reply from a RADIUS server before retransmitting the request.
Retransmit Retransmit is the number of times, in the range 1 to 1000, a RADIUS request is retransmitted to a server that is not responding. If the server has not responded after the last retransmit it is considered to be dead.
Deadtime Deadtime, which can be set to a number between 0 to 1440 minutes, is the period during which the switch will not send new requests to a server that has failed to respond to a

80
previous request. This will stop the switch from continually trying to contact a server that it has already determined as dead. Setting the Deadtime to a value greater than 0 (zero) will enable this feature, but only if more than one server has been configured.
Key The secret key - up to 63 characters long - shared between the RADIUS server and the switch.
NAS-IP-Address (Attribute 4) The IPv4 address to be used as attribute 4 in RADIUS Access-Request packets. If this field is left blank, the IP address of the outgoing interface is used.
NAS-IPv6-Address (Attribute 95) The IPv6 address to be used as attribute 95 in RADIUS Access-Request packets. If this field is left blank, the IP address of the outgoing interface is used.
NAS-Identifier (Attribute 32) The identifier - up to 255 characters long - to be used as attribute 32 in RADIUS Access-Request packets. If this field is left blank, the NAS-Identifier is not included in the packet.
Server Configuration The table has one row for each RADIUS server and a number of columns, which are:
Delete To delete a RADIUS server entry, check this box. The entry will be deleted during the next Save.
Hostname The IP address or hostname of the RADIUS server.
Auth Port The UDP port to use on the RADIUS server for authentication.
Acct Port The UDP port to use on the RADIUS server for accounting.
Timeout This optional setting overrides the global timeout value. Leaving it blank will use the global timeout value.
Retransmit This optional setting overrides the global retransmit value. Leaving it blank will use the global retransmit value.
Key This optional setting overrides the global key. Leaving it blank will use the global key.
Adding a New Server
Click to add a new RADIUS server. An empty row is added to the table, and the RADIUS server can be configured as needed. Up to 5 servers are supported. The button can be used to undo the addition of the new server.

81
Buttons Apply:
Click to save changes. Reset:
Click to undo any changes made locally and revert to previously saved values.
2-5.3.2 TACACS+
Web Interface To configure a Common Configuration of AAA, TACACS+ in the web interface: 1. Click Configuration, Security, AAA and TACACS+. 2. Specify the Parameter. 3. Click Apply.
Figure 2-5.3.2: The TACACS+ Authentication Server Configuration
Parameter description:
Global Configuration

82
These setting are common for all of the TACACS+ servers. Timeout
Timeout is the number of seconds, in the range 1 to 1000, to wait for a reply from a TACACS+ server before it is considered to be dead.
Deadtime Deadtime, which can be set to a number between 0 to 1440 minutes, is the period during which the switch will not send new requests to a server that has failed to respond to a previous request. This will stop the switch from continually trying to contact a server that it has already determined as dead. Setting the Deadtime to a value greater than 0 (zero) will enable this feature, but only if more than one server has been configured.
Key The secret key - up to 63 characters long - shared between the TACACS+ server and the switch.
Server Configuration The table has one row for each TACACS+ server and a number of columns, which are:
Delete To delete a TACACS+ server entry, check this box. The entry will be deleted during the next Save.
Hostname The IP address or hostname of the TACACS+ server.
Port The TCP port to use on the TACACS+ server for authentication.
Timeout This optional setting overrides the global timeout value. Leaving it blank will use the global timeout value.
Key This optional setting overrides the global key. Leaving it blank will use the global key.
Adding a New Server Click to add a new TACACS+ server. An empty row is added to the table, and the TACACS+ server can be configured as needed. Up to 5 servers are supported. The button can be used to undo the addition of the new server.
Buttons Apply:
Click to save changes. Reset:
Click to undo any changes made locally and revert to previously saved values.
2-6 Aggregation
The Aggregation is used to configure the settings of Link Aggregation. You can bundle more than one port with the same speed, full duplex and the same MAC to be a single logical port, thus the logical port aggregates the bandwidth of these ports. This means you can apply your

83
current Ethernet equipment’s to build the bandwidth aggregation. For example, if there are three Fast Ethernet ports aggregated in a logical port, then this logical port has bandwidth three times as high as a single Fast Ethernet port has.
2-6.1 Static
Ports using Static Trunk as their trunk method can choose their unique Static GroupID to form a logic “trunked port”. The benefit of using Static Trunk method is that a port can immediately become a member of a trunk group without any handshaking with its peer port. This is also a disadvantage because the peer ports of your static trunk group may not know that they should be aggregate together to form a “logic trunked port”. Using Static Trunk on both end of a link is strongly recommended. Please also note that low speed links will stay in “not ready” state when using static trunk to aggregate with high speed links.
Web Interface
To configure the Trunk Aggregation Hash mode and Aggregation Group in the web interface: 1. Click Configuration, Aggregation, Static and then Aggregation Mode Configuration. 2. Evoke to enable or disable the aggregation mode function.
Evoke Aggregation Group ID and Port members 3. Click the save to save the setting 4. If you want to cancel the setting then you need to click the reset button. It
will revert to previously saved values.
Figure 2-6.1: The Aggregation Mode Configuration
Parameter description: Hash Code Contributors

84
Source MAC Address : The Source MAC address can be used to calculate the destination port for the frame. Check to enable the use of the Source MAC address, or uncheck to disable. By default, Source MAC Address is enabled.
Destination MAC Address : The Destination MAC Address can be used to calculate the destination port for the frame. Check to enable the use of the Destination MAC Address, or uncheck to disable. By default, Destination MAC Address is disabled.
IP Address : The IP address can be used to calculate the destination port for the frame. Check to enable the use of the IP Address, or uncheck to disable. By default, IP Address is enabled.
TCP/UDP Port Number : The TCP/UDP port number can be used to calculate the destination port for the frame. Check to enable the use of the TCP/UDP Port Number, or uncheck to disable. By default, TCP/UDP Port Number is enabled.
Aggregation Group Configuration Group ID :
Indicates the group ID for the settings contained in the same row. Group ID "Normal" indicates there is no aggregation. Only one group ID is valid per port.
Port Members : Each switch port is listed for each group ID. Select a radio button to include a port in an aggregation, or clear the radio button to remove the port from the aggregation. By default, no ports belong to any aggregation group. Only full duplex ports can join an aggregation and ports must be in the same speed in each group.
Buttons Apply – Click to save changes. Reset- Click to undo any changes made locally and revert to previously saved values.
2-6.2 LACP This page allows the user to inspect the current LACP port configurations, and possibly change them as well An LACP trunk group with more than one ready member-ports is a “real trunked” group. An LACP trunk group with only one or less than one ready member-ports is not a “real trunked” group.
Web Interface
To configure the Trunk Aggregation LACP parameters in the web interface: 1. Click Configuration, LACP, Configuration 2. Evoke to enable or disable the LACP on the port of the switch.
Scroll the Key parameter with Auto or Specific Default is Auto. 3. Scroll the Role with Active or Passive. Default is Active 4. Click the save to save the setting 5. If you want to cancel the setting then you need to click the reset button.
It will revert to previously saved values

85
Figure 2-6.2: The LACP Port Configuration
Parameter description: Port :
The switch port number. LACP Enabled
Controls whether LACP is enabled on this switch port. LACP will form an aggregation when 2 or more ports are connected to the same partner.
Key The Key value incurred by the port, range 1-65535 . The Auto setting will set the key as appropriate by the physical link speed, 10Mb = 1, 100Mb = 2, 1Gb = 3. Using the Specific setting, a user-defined value can be entered. Ports with the same Key value can participate in the same aggregation group, while ports with different keys cannot.
Role The Role shows the LACP activity status. The Active will transmit LACP packets each second, while Passive will wait for a LACP packet from a partner (speak if spoken to).
Timeout The Timeout controls the period between BPDU transmissions. Fast will transmit LACP packets each second, while Slow will wait for 30 seconds before sending a LACP packet.
Prio The Prio controls the priority of the port. If the LACP partner wants to form a larger group than is supported by this device then this parameter will control which ports will be active and which ports will be in a backup role. Lower number means greater priority.
Buttons Apply – Click to save changes. Reset- Click to undo any changes made locally and revert to previously saved values.
2-7 Link OAM

86
2-7.1 Port Settings
This page allows the user to inspect the current Link OAM port configurations, and change them as well.
Web Interface
To configure the Port Setting in the web interface: 1. Click Configuration, Link OAM and Event Settings. 2. Evoke Port members 3. Click the Apply to save the setting
Figure 2-7.1: The Port Setting
Parameter description: Port
The switch port number. OAM Enabled
Controls whether Link OAM is enabled on this switch port. Enabling Link OAM provides the network operators the ability to monitor the health of the network and quickly determine the location of failing links or fault conditions.
OAM Mode Configures the OAM Mode as Active or Passive. The default mode is Passive.
Active mode DTE's configured in Active mode initiate the exchange of Information OAMPDUs as defined by the Discovery process. Once the Discovery process completes, Active DTE's are permitted to send any OAMPDU while connected to a remote OAM peer entity in Active mode. Active DTE's operate in a limited respect if the remote OAM entity is operating in Passive mode. Active devices should not respond to OAM remote loopback commands and variable requests from a Passive peer.

87
Passive mode DTE's configured in Passive mode do not initiate the Discovery process. Passive DTE's react to the initiation of the Discovery process by the remote DTE. This eliminates the possibility of passive to passive links. Passive DTE's shall not send Variable Request or Loopback Control OAMPDUs.
Loopback Support Controls whether the loopback support is enabled for the switch port. Link OAM remote loopback can be used for fault localization and link performance testing. Enabling the loopback support will allow the DTE to execute the remote loopback command that helps in the fault detection.
Link Monitor Support Controls whether the Link Monitor support is enabled for the switch port. On enabling the Link Monitor support, the DTE supports event notification that permits the inclusion of diagnostic information.
MIB Retrieval Support Controls whether the MIB Retrieval Support is enabled for the switch port. On enabling the MIB retrieval support, the DTE supports polling of various Link OAM based MIB variables' contents.
Loopback Operation If the Loopback support is enabled, enabling this field will start a loopback operation for the port.
Buttons Apply – Click to save changes. Reset- Click to undo any changes made locally and revert to previously saved values.
2-7.2 Event Settings This page allows the user to inspect the current Link OAM Link Event configurations, and change them as well. Web Interface
To configure the Event Setting in the web interface: 1. Click Configuration, Link OAM and Event Settings. 2. Evoke Port members 3. Click the Apply to save the setting
Figure 2-7.2: The Event Settings

88
Parameter description: Port :
The switch port number. Event Name
Name of the Link Event which is being configured. Error Window
Represents the window period in the order of 1 sec for the observation of various link events.
Error Threshold Represents the threshold value for the window period for the appropriate Link event so as to notify the peer of this error.
Error Frame Event The Errored Frame Event counts the number of errored frames detected during the specified period. The period is specified by a time interval ( Window in order of 1 sec). This event is generated if the errored frame count is equal to or greater than the specified threshold for that period (Period Threshold). Errored frames are frames that had transmission errors as detected at the Media Access Control sublayer. Error Window for 'Error Frame Event' must be an integer value between 1-60 and its default value is '1'. Whereas Error Threshold must be between 0-4294967295 and its default value is '0'.
Symbol Period Error Event The Errored Symbol Period Event counts the number of symbol errors that occurred during the specified period. The period is specified by the number of symbols that can be received in a time interval on the underlying physical layer. This event is generated if the symbol error count is equal to or greater than the specified threshold for that period. Error Window for 'Symbol Period Error Event' must be an integer value between 1-60 and its default value is '1'. Whereas Error Threshold must be between 0-4294967295 and its default value is '0'.
Seconds Summary Event The Errored Frame Seconds Summary Event TLV counts the number of errored frame seconds that occurred during the specified period. The period is specified by a time interval. This event is generated if the number of errored frame seconds is equal to or greater than the specified threshold for that period. An errored frame second is a one second interval wherein at least one frame error was detected. Errored frames are frames that had transmission errors as detected at the Media Access Control sublayer. Error Window for 'Seconds Summary Event' must be an integer value between 10-900 and its default value is '60'. Whereas Error Threshold must be between 0-65535 and its default value is '1'.
Buttons Apply – Click to save changes. Reset- Click to undo any changes made locally and revert to previously saved values.
2-8 Loop Protection The loop Protection is used to detect the presence of traffic. When switch receives packet’s (looping detection frame) MAC address the same as oneself from port, show Loop Protection happens. The port will be locked when it received the looping Protection frames. If you want to resume the locked port, please find out the looping path and take off the looping path, then

89
select the resume the locked port and click on “Resume” to turn on the locked ports.
Web Interface
To configure the Loop Protection parameters in the web interface: 1. Click Configuration, Loop Protection. 2. Evoke to select enable or disable the port loop Protection 3. Click the save to save the setting 4. If you want to cancel the setting then you need to click the Reset button. It will revert to
previously saved values Figure 2-8: The Loop Protection Configuration.
Parameter description: Enable Loop Protection:
Controls whether loop protections is enabled (as a whole). Transmission Time:
The interval between each loop protection PDU sent on each port. Valid values are 1 to 10 seconds.
Shutdown Time: The period (in seconds) for which a port will be kept disabled in the event of a loop is detected (and the port action shuts down the port). Valid values are 0 to 604800 seconds (7 days). A value of zero will keep a port disabled (until next device restart).
Port No: The switch port number of the port.

90
Enable : Controls whether loop protection is enabled on this switch port
Action: Configures the action performed when a loop is detected on a port. Valid values are Shutdown Port, Shutdown Port and Log or Log Only.
Tx Mode : Controls whether the port is actively generating loop protection PDU's, or whether it is just passively looking for looped PDU's.
Buttons: Apply – Click to save changes. Reset- Click to undo any changes made locally and revert to previously saved values.
2-9 Spanning Tree
The Spanning Tree Protocol (STP) can be used to detect and disable network loops, and to provide backup links between switches, bridges or routers. This allows the switch to interact with other bridging devices (that is, an STP-compliant switch, bridge or router) in your network to ensure that only one route exists between any two stations on the network, and provide backup links which automatically take over when a primary link goes down. STP - STP uses a distributed algorithm to select a bridging device (STP- compliant switch, bridge or router) that serves as the root of the spanning tree network. It selects a root port on each bridging device (except for the root device) which incurs the lowest path cost when forwarding a packet from that device to the root device. Then it selects a designated bridging device from each LAN which incurs the lowest path cost when forwarding a packet from that LAN to the root device. All ports connected to designated bridging devices are assigned as designated ports. After determining the lowest cost spanning tree, it enables all root ports and designated ports, and disables all other ports. Network packets are therefore only forwarded between root ports and designated ports, eliminating any possible network loops.
Once a stable network topology has been established, all bridges listen for Hello BPDUs (Bridge Protocol Data Units) transmitted from the Root Bridge. If a bridge does not get a Hello BPDU after a predefined interval (Maximum Age), the bridge assumes that the link to the Root Bridge is down. This bridge will then initiate negotiations with other bridges to reconfigure the network to reestablish a valid network topology.
2-9.1 Bridge Setting The section describes that how to configure the Spanning Tree Bridge and STP System settings. It allows you to configure STP System settings are used by all STP Bridge instance in the switch.

91
Web Interface To configure the Spanning Tree Bridge Settings parameters in the web interface: 1. Click Configuration, Spanning Tree, Bridge Settings 2. Scroll to select the parameters and write down available value of parameters in blank field
in Basic Settings 3. Evoke to enable or disable the parameters and write down available value of parameters in
blank field in Advanced settings 4. Click the apply to save the setting 5. If you want to cancel the setting then you need to click the Reset button. It will revert to
previously saved values

92
Figure 2-9.1: The STP Bridge Configuration
Parameter description:
Basic Settings Protocol Version :
The STP protocol version setting. Valid values are STP, RSTP and MSTP. Bridge Priority :
Controls the bridge priority. Lower numeric values have better priority. The bridge priority plus the MSTI instance number, concatenated with the 6-byte MAC address of the switch forms a Bridge Identifier. For MSTP operation, this is the priority of the CIST. Otherwise, this is the priority of the STP/RSTP Bridge.
Forward Delay : The delay used by STP Bridges to transit Root and Designated Ports to Forwarding (used in STP compatible mode). Valid values are in the range 4 to 30 seconds.
Max Age : The maximum age of the information transmitted by the Bridge when it is the Root Bridge. Valid values are in the range 6 to 40 seconds, and MaxAge must be <= (FwdDelay-1)*2.
Maximum Hop Count : This defines the initial value of remaining Hops for MSTI information generated at the boundary of an MSTI region. It defines how many bridges a root bridge can distribute its BPDU information to. Valid values are in the range 6 to 40 hops.
Transmit Hold Count : The number of BPDU's a bridge port can send per second. When exceeded, transmission of the next BPDU will be delayed. Valid values are in the range 1 to 10 BPDU's per second.
Advanced Settings
Edge Port BPDU Filtering : Control whether a port explicitly configured as Edge will transmit and receive BPDUs.
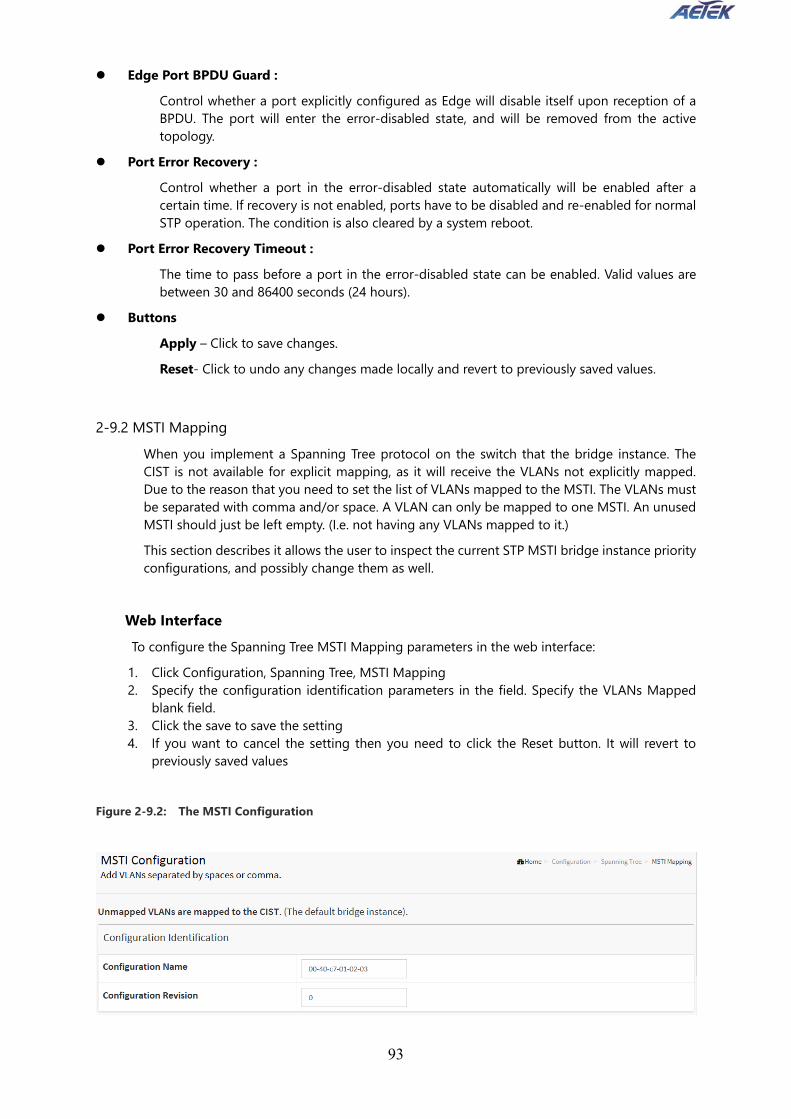
93
Edge Port BPDU Guard : Control whether a port explicitly configured as Edge will disable itself upon reception of a BPDU. The port will enter the error-disabled state, and will be removed from the active topology.
Port Error Recovery : Control whether a port in the error-disabled state automatically will be enabled after a certain time. If recovery is not enabled, ports have to be disabled and re-enabled for normal STP operation. The condition is also cleared by a system reboot.
Port Error Recovery Timeout : The time to pass before a port in the error-disabled state can be enabled. Valid values are between 30 and 86400 seconds (24 hours).
Buttons Apply – Click to save changes. Reset- Click to undo any changes made locally and revert to previously saved values.
2-9.2 MSTI Mapping When you implement a Spanning Tree protocol on the switch that the bridge instance. The CIST is not available for explicit mapping, as it will receive the VLANs not explicitly mapped. Due to the reason that you need to set the list of VLANs mapped to the MSTI. The VLANs must be separated with comma and/or space. A VLAN can only be mapped to one MSTI. An unused MSTI should just be left empty. (I.e. not having any VLANs mapped to it.) This section describes it allows the user to inspect the current STP MSTI bridge instance priority configurations, and possibly change them as well.
Web Interface To configure the Spanning Tree MSTI Mapping parameters in the web interface:
1. Click Configuration, Spanning Tree, MSTI Mapping 2. Specify the configuration identification parameters in the field. Specify the VLANs Mapped
blank field. 3. Click the save to save the setting 4. If you want to cancel the setting then you need to click the Reset button. It will revert to
previously saved values Figure 2-9.2: The MSTI Configuration

94
Parameter description:
Configuration Identification Configuration Name :
The name identifying the VLAN to MSTI mapping. Bridges must share the name and revision (see below), as well as the VLAN-to-MSTI mapping configuration in order to share spanning trees for MSTI's (Intra-region). The name is at most 32 characters.
Configuration Revision : The revision of the MSTI configuration named above. This must be an integer between 0 and 65535.
MSTI : The bridge instance. The CIST is not available for explicit mapping, as it will receive the VLANs not explicitly mapped.
VLANs Mapped : The list of VLANs mapped to the MSTI. The VLANs can be given as a single (xx, xx being between 1 and 4094) VLAN, or a range (xx-yy), each of which must be separated with comma and/or space. A VLAN can only be mapped to one MSTI. An unused MSTI should just be left empty. (I.e. not having any VLANs mapped to it.) Example: 2,5,20-40.

95
2-9.3 MSTI Priorities When you implement a Spanning Tree protocol on the switch that the bridge instance. The CIST is the default instance which is always active. For controls the bridge priority. Lower numeric values have better priority. The bridge priority plus the MSTI instance number, concatenated with the 6-byte MAC address of the switch forms a Bridge Identifier The section describes it allows the user to inspect the current STP MSTI bridge instance priority configurations, and possibly change them as well.
Web Interface To configure the Spanning Tree MSTI Priorities parameters in the web interface: 1. Click Configuration, Spanning Tree, MSTI Priorities 2. Scroll the Priority maximum is 240. Default is 128. 3. Click the save to save the setting 4. If you want to cancel the setting then you need to click the Reset button. It will revert to
previously saved values Figure 2-9.3: The MSTI Configuration
Parameter description: MSTI :
The bridge instance. The CIST is the default instance, which is always active. Priority :
Controls the bridge priority. Lower numeric values have better priority. The bridge priority plus the MSTI instance number, concatenated with the 6-byte MAC address of the switch forms a Bridge Identifier.
Buttons

96
Apply – Click to save changes. Reset- Click to undo any changes made locally and revert to previously saved values.
2-9.4 CIST Ports When you implement an Spanning Tree protocol on the switch that the bridge instance. You need to configure the CIST Ports. The section describes it allows the user to inspect the to inspect the current STP CIST port configurations, and possibly change them as well.
Web Interface
To configure the Spanning Tree CIST Ports parameters in the web interface: 1. Click Configuration, Spanning Tree, CIST Ports 2. Scroll and evoke to set all parameters of CIST Aggregated Port Configuration. 3. Evoke to enable or disable the STP, then scroll and evoke to set all parameters of the CIST
normal Port configuration. 4. Click the apply to save the setting 5. If you want to cancel the setting then you need to click the Reset button. It will revert to
previously saved values Figure 2-9.4: The STP CIST Port Configuration
Parameter description: Port :
The switch port number of the logical STP port. STP Enabled :

97
Controls whether STP is enabled on this switch port. Path Cost :
Controls the path cost incurred by the port. The Auto setting will set the path cost as appropriate by the physical link speed, using the 802.1D recommended values. Using the Specific setting, a user-defined value can be entered. The path cost is used when establishing the active topology of the network. Lower path cost ports are chosen as forwarding ports in favor of higher path cost ports. Valid values are in the range 1 to 200000000.
Priority : Controls the port priority. This can be used to control priority of ports having identical port cost. (See above).
operEdge (state flag) : Operational flag describing whether the port is connecting directly to edge devices. (No Bridges attached). Transition to the forwarding state is faster for edge ports (having operEdge true) than for other ports.The value of this flag is based on AdminEdge and AutoEdge fields. This flag is displayed as Edge in Monitor->Spanning Tree -> STP Detailed Bridge Status.
AdminEdge : Controls whether the operEdge flag should start as set or cleared. (The initial operEdge state when a port is initialized).
AutoEdge : Controls whether the bridge should enable automatic edge detection on the bridge port. This allows operEdge to be derived from whether BPDU's are received on the port or not.
Restricted Role : If enabled, causes the port not to be selected as Root Port for the CIST or any MSTI, even if it has the best spanning tree priority vector. Such a port will be selected as an Alternate Port after the Root Port has been selected. If set, it can cause lack of spanning tree connectivity. It can be set by a network administrator to prevent bridges external to a core region of the network influence the spanning tree active topology, possibly because those bridges are not under the full control of the administrator. This feature is also known as Root Guard.
Restricted TCN : If enabled, causes the port not to propagate received topology change notifications and topology changes to other ports. If set it can cause temporary loss of connectivity after changes in a spanning tree's active topology as a result of persistently incorrect learned station location information. It is set by a network administrator to prevent bridges external to a core region of the network, causing address flushing in that region, possibly because those bridges are not under the full control of the administrator or the physical link state of the attached LANs transits frequently.
BPDU Guard : If enabled, causes the port to disable itself upon receiving valid BPDU's. Contrary to the similar bridge setting, the port Edge status does not affect this setting. A port entering error-disabled state due to this setting is subject to the bridge Port Error Recovery setting as well.
Point to Point Controls whether the port connects to a point-to-point LAN rather than to a shared medium. This can be automatically determined, or forced either true or false. Transition to the forwarding state is faster for point-to-point LANs than for shared media.
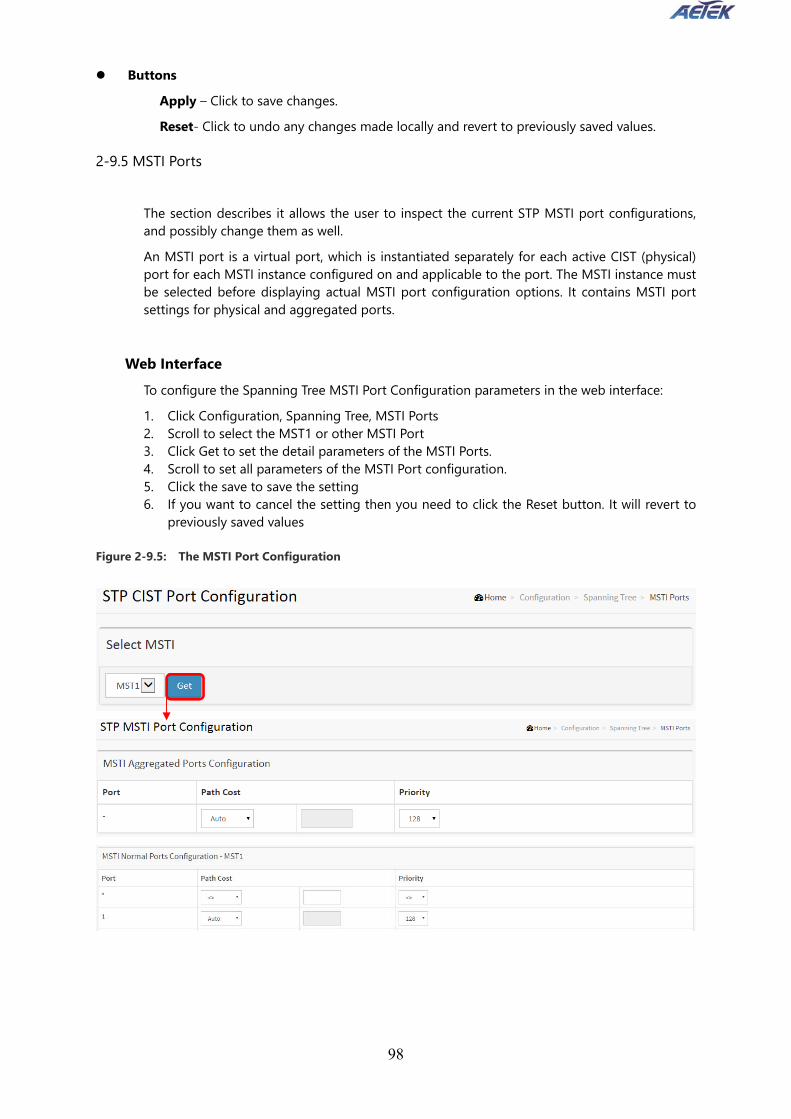
98
Buttons Apply – Click to save changes. Reset- Click to undo any changes made locally and revert to previously saved values.
2-9.5 MSTI Ports The section describes it allows the user to inspect the current STP MSTI port configurations, and possibly change them as well. An MSTI port is a virtual port, which is instantiated separately for each active CIST (physical) port for each MSTI instance configured on and applicable to the port. The MSTI instance must be selected before displaying actual MSTI port configuration options. It contains MSTI port settings for physical and aggregated ports.
Web Interface
To configure the Spanning Tree MSTI Port Configuration parameters in the web interface: 1. Click Configuration, Spanning Tree, MSTI Ports 2. Scroll to select the MST1 or other MSTI Port 3. Click Get to set the detail parameters of the MSTI Ports. 4. Scroll to set all parameters of the MSTI Port configuration. 5. Click the save to save the setting 6. If you want to cancel the setting then you need to click the Reset button. It will revert to
previously saved values
Figure 2-9.5: The MSTI Port Configuration

99
Parameter description: Port :
The switch port number of the corresponding STP CIST (and MSTI) port. Path Cost :
Controls the path cost incurred by the port. The Auto setting will set the path cost as appropriate by the physical link speed, using the 802.1D recommended values. Using the Specific setting, a user-defined value can be entered. The path cost is used when establishing the active topology of the network. Lower path cost ports are chosen as forwarding ports in favor of higher path cost ports. Valid values are in the range 1 to 200000000.
Priority : Controls the port priority. This can be used to control priority of ports having identical port cost. (See above).
Buttons Apply – Click to save changes.
Reset- Click to undo any changes made locally and revert to previously saved values.
2-10 IPMC Profile This page provides IPMC Profile related configurations.
2-10.1 Profile Table The IPMC profile is used to deploy the access control on IP multicast streams. It is allowed to create at maximum 64 Profiles with at maximum 128 corresponding rules for each.
Web Interface
To configure the IPMC Profile Configuration in the web interface: 1. Click Configuration, IPMC Profile, Profile Table 2. Evoke to enable or disable the IPMC Profile parameter. 3. Click Apply
Figure 2-10.1: The IPMC Profile Configuration

100
Parameter description: Global Profile Mode
Enable/Disable the Global IPMC Profile. System starts to do filtering based on profile settings only when the global profile mode is enabled.
Delete Check to delete the entry. The designated entry will be deleted during the next save.
Profile Name

101
The name used for indexing the profile table. Each entry has the unique name which is composed of at maximum 16 alphabetic and numeric characters. At least one alphabet must be present.
Profile Description Additional description, which is composed of at maximum 64 alphabetic and numeric characters, about the profile. No blank or space characters are permitted as part of description. Use "_" or "-" to separate the description sentence.
Rule When the profile is created, click the edit button to enter the rule setting page of the designated profile. Summary about the designated profile will be shown by clicking the view button. You can manage or inspect the rules of the designated profile by using the following buttons:
: List the rules associated with the designated profile. : Adjust the rules associated with the designated profile.
Buttons
Add New IPMC Profile – Click to add new IPMC profile. Specify the name and configure the new entry. Click "Save". Apply – Click to save changes. Reset – Click to undo any changes made locally and revert to previously saved values.
2-10.2 Address Entry This page provides address range settings used in IPMC profile. The address entry is used to specify the address range that will be associated with IPMC Profile. It is allowed to create at maximum 128 address entries in the system.
Web Interface To configure the IPMC Profile Address Configuration in the web interface: 1. Click Configuration, IPMC Profile, Address Entry. 2. Specify the Entry Name, Start Address, End Address. 3. Click Apply
Figure 2-10.2: The IPMC Profile Address Configuration
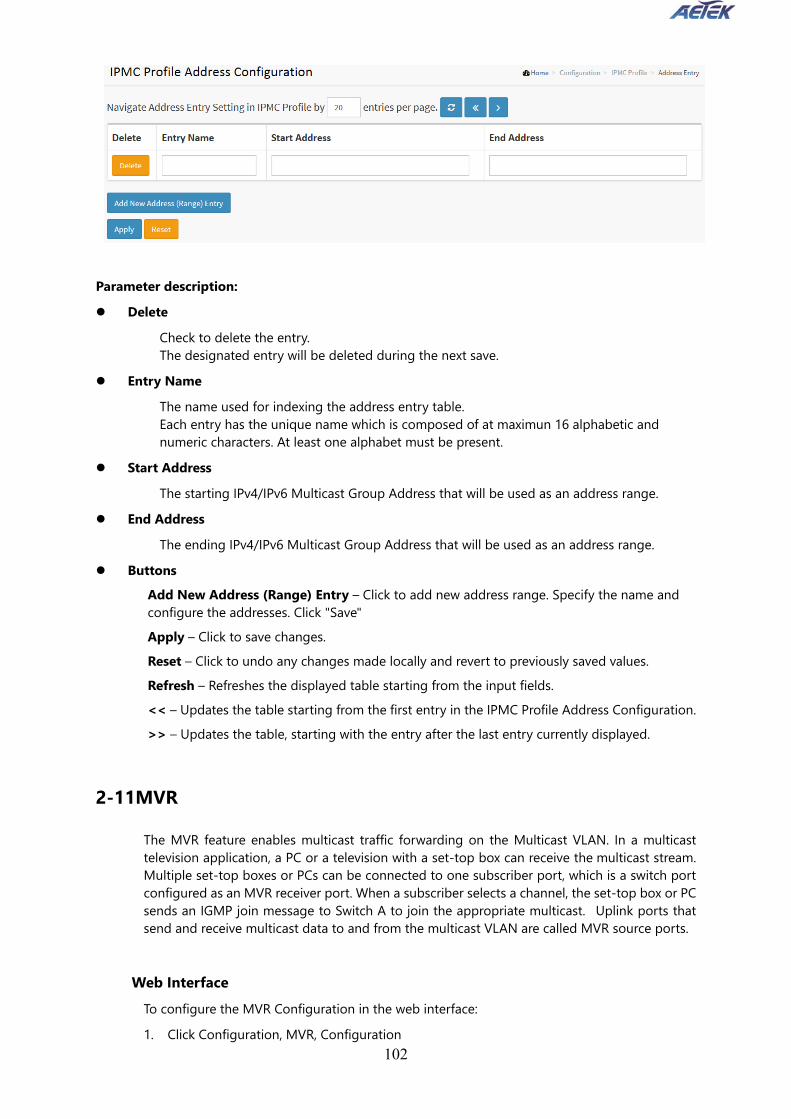
102
Parameter description: Delete
Check to delete the entry. The designated entry will be deleted during the next save.
Entry Name The name used for indexing the address entry table. Each entry has the unique name which is composed of at maximun 16 alphabetic and numeric characters. At least one alphabet must be present.
Start Address The starting IPv4/IPv6 Multicast Group Address that will be used as an address range.
End Address The ending IPv4/IPv6 Multicast Group Address that will be used as an address range.
Buttons Add New Address (Range) Entry – Click to add new address range. Specify the name and configure the addresses. Click "Save" Apply – Click to save changes. Reset – Click to undo any changes made locally and revert to previously saved values. Refresh – Refreshes the displayed table starting from the input fields. << – Updates the table starting from the first entry in the IPMC Profile Address Configuration. >> – Updates the table, starting with the entry after the last entry currently displayed.
2-11MVR The MVR feature enables multicast traffic forwarding on the Multicast VLAN. In a multicast television application, a PC or a television with a set-top box can receive the multicast stream. Multiple set-top boxes or PCs can be connected to one subscriber port, which is a switch port configured as an MVR receiver port. When a subscriber selects a channel, the set-top box or PC sends an IGMP join message to Switch A to join the appropriate multicast. Uplink ports that send and receive multicast data to and from the multicast VLAN are called MVR source ports.
Web Interface
To configure the MVR Configuration in the web interface: 1. Click Configuration, MVR, Configuration

103
2. Scroll the MVR mode to enable or disable and Scroll to set all parameters. 3. Click the save to save the setting 4. If you want to cancel the setting then you need to click the Reset button. It will revert to
previously saved values Figure 2-11: The MVR Configuration

104
Parameter description: MVR Mode
Enable/Disable the Global MVR. The Unregistered Flooding control depends on the current configuration in IGMP/MLD Snooping. It is suggested to enable Unregistered Flooding control when the MVR group table is full.
Delete Check to delete the entry. The designated entry will be deleted during the next save.
MVR VID Specify the Multicast VLAN ID. Be Caution: MVR source ports are not recommended to be overlapped with management VLAN ports.
MVR Name MVR Name is an optional attribute to indicate the name of the specific MVR VLAN. Maximum length of the MVR VLAN Name string is 32. MVR VLAN Name can only contain alphabets or numbers. When the optional MVR VLAN name is given, it should contain at least one alphabet. MVR VLAN name can be edited for the existing MVR VLAN entries or it can be added to the new entries.
IGMP Address Define the IPv4 address as source address used in IP header for IGMP control frames. The default IGMP address is not set (0.0.0.0). When the IGMP address is not set, system uses IPv4 management address of the IP interface associated with this VLAN. When the IPv4 management address is not set, system uses the first available IPv4 management address. Otherwise, system uses a pre-defined value. By default, this value will be 192.0.2.1.
Mode Specify the MVR mode of operation. In Dynamic mode, MVR allows dynamic MVR membership reports on source ports. In Compatible mode, MVR membership reports are forbidden on source ports. The default is Dynamic mode.
Tagging Specify whether the traversed IGMP/MLD control frames will be sent as Untagged or Tagged with MVR VID. The default is tagged.
Priority Specify how the traversed IGMP/MLD control frames will be sent in prioritized manner. The default Priority is 0.
LLQI Define the maximum time to wait for IGMP/MLD report memberships on a receiver port before removing the port from multicast group membership. The value is in units of tenths of a seconds. The range is from 0 to 31744. The default LLQI is 5 tenths or one-half second.
Interface Channel Setting When the MVR VLAN is created, click the Edit symbol to expand the corresponding multicast channel settings for the specific MVR VLAN. Summary about the Interface Channel Setting (of the MVR VLAN) will be shown besides the Edit symbol.
105
Port The logical port for the settings.
Port Role Configure an MVR port of the designated MVR VLAN as one of the following roles. Inactive: The designated port does not participate MVR operations. Source: Configure uplink ports that receive and send multicast data as source ports. Subscribers cannot be directly connected to source ports. Receiver: Configure a port as a receiver port if it is a subscriber port and should only receive multicast data. It does not receive data unless it becomes a member of the multicast group by issuing IGMP/MLD messages. Be Caution: MVR source ports are not recommended to be overlapped with management VLAN ports. Select the port role by clicking the Role symbol to switch the setting. I indicates Inactive; S indicates Source; R indicates Receiver. The default Role is Inactive.
Immediate Leave Enable the fast leave on the port.
2-12 IPMC
ICMP is an acronym for Internet Control Message Protocol. It is a protocol that generated the error response, diagnostic or routing purposes. ICMP messages generally contain information about routing difficulties or simple exchanges such as time-stamp or echo transactions.
2-12.1 IGMP Snooping The function, is used to establish the multicast groups to forward the multicast packet to the member ports, and, in nature, avoids wasting the bandwidth while IP multicast packets are running over the network. This is because a switch that does not support IGMP or IGMP Snooping cannot tell the multicast packet from the broadcast packet, so it can only treat them all as the broadcast packet. Without IGMP Snooping, the multicast packet forwarding function is plain and nothing is different from broadcast packet. A switch supported IGMP Snooping with the functions of query, report and leave, a type of packet exchanged between IP Multicast Router/Switch and IP Multicast Host, can update the information of the Multicast table when a member (port) joins or leaves an IP Multicast Destination Address. With this function, once a switch receives an IP multicast packet, it will forward the packet to the members who joined in a specified IP multicast group before. The packets will be discarded by the IGMP Snooping if the user transmits multicast packets to the multicast group that had not been built up in advance. IGMP mode enables the switch to issue IGMP function that you enable IGMP proxy or snooping on the switch, which connects to a router closer to the root of the tree. This interface is the upstream interface. The router on the upstream interface should be running IGMP.
2-12.1.1 Basic Configuration
The section describes how to set the basic IGMP snooping on the switch, which connects to a router closer to the root of the tree. This interface is the upstream interface. The router on the upstream interface should be running IGMP
Web Interface

106
To configure the IGMP Snooping parameters in the web interface: 1. Click Configuration, IPMC,IGMP Snooping, Basic Configuration 2. Evoke to select enable or disable which Global configuration 3. Evoke which port wants to become a Router Port or enable/ disable the Fast Leave
function.. 4. Scroll to set the Throtting parameter. 5. Click the apply to save the setting 6. If you want to cancel the setting then you need to click the Reset button. It will revert to
previously saved values
Figure 2-12.1.1: The IGMP Snooping Configuration.
Parameter description: Snooping Enabled:
Enable the Global IGMP Snooping. Unregistered IPMCv4 Flooding enabled :
Enable unregistered IPMCv4 traffic flooding. IGMP SSM Range :
SSM (Source-Specific Multicast) Range allows the SSM-aware hosts and routers run the SSM service model for the groups in the address range. Format: (IP address/ sub mask)
Leave Proxy Enable: Enable IGMP Leave Proxy. This feature can be used to avoid forwarding unnecessary leave messages to the router side.
Proxy Enabled : Enable IGMP Proxy. This feature can be used to avoid forwarding unnecessary join and leave

107
messages to the router side. Port :
It shows the physical Port index of switch. Router Port :
Specify which ports act as router ports. A router port is a port on the Ethernet switch that leads towards the Layer 3 multicast device or IGMP querier. If an aggregation member port is selected as a router port, the whole aggregation will act as a router port.
Fast Leave : Enable the fast leave on the port.
Throttling : Enable to limit the number of multicast groups to which a switch port can belong.
2-12.1.2 VLAN Configuration
The section describes the VLAN configuration setting process integrated with IGMP Snooping function. For Each setting page shows up to 99 entries from the VLAN table, default being 20, selected through the "entries per page" input field. When first visited, the web page will show the first 20 entries from the beginning of the VLAN Table. The first displayed will be the one with the lowest VLAN ID found in the VLAN Table. The "VLAN" input fields allow the user to select the starting point in the VLAN Table. Clicking the button will update the displayed table starting from that or the next closest VLAN Table match.
Web Interface
To configure the IGMP Snooping VLAN Configuration in the web interface: 1. Click Configuration, IPMC, IGMP Snooping, VLAN Configuration 2. Evoke to select enable or disable Snooping, IGMP Querier. Specify the parameters in the
blank field. 3. Click the refresh to update the data or click << or >> to display previous entry or next
entry. 4. Click the save to save the setting 5. If you want to cancel the setting then you need to click the Reset button. It will revert to
previously saved values Figure 2-12.1.2: The IGMP Snooping VLAN Configuration.

108
Parameter description: Delete :
Check to delete the entry. The designated entry will be deleted during the next save. VLAN ID :
It displays the VLAN ID of the entry. IGMP Snooping Enabled :
Enable the per-VLAN IGMP Snooping. Only up to 32 VLANs can be selected. . Querier Election :
Enable to join IGMP Querier election in the VLAN. Disable to act as an IGMP Non-Querier. Querier Address :
Define the IPv4 address as source address used in IP header for IGMP Querier election. When the Querier address is not set, system uses IPv4 management address of the IP interface associated with this VLAN. When the IPv4 management address is not set, system uses the first available IPv4 management address. Otherwise, system uses a pre-defined value. By default, this value will be 192.0.2.1.
Compatibility : Compatibility is maintained by hosts and routers taking appropriate actions depending on the versions of IGMP operating on hosts and routers within a network. The allowed selection is IGMP-Auto, Forced IGMPv1, Forced IGMPv2, Forced IGMPv3, default compatibility value is IGMP-Auto.
PRI : Priority of Interface. It indicates the IGMP control frame priority level generated by the system. These values can be used to prioritize different classes of traffic. The allowed range is 0 (best effort) to 7 (highest), default interface priority value is 0.
Rv : Robustness Variable. The Robustness Variable allows tuning for the expected packet loss on a network. The allowed range is 1 to 255; default robustness variable value is 2.
QI : Query Interval. The Query Interval is the interval between General Queries sent by the Querier. The allowed range is 1 to 31744 seconds; default query interval is 125 seconds.
QRI :

109
Query Response Interval. The Max Response Time used to calculate the Max Resp Code inserted into the periodic General Queries. The allowed range is 0 to 31744 in tenths of seconds; default query response interval is 100 in tenths of seconds (10 seconds).
LLQI (LMQI for IGMP) : Last Member Query Interval. The Last Member Query Time is the time value represented by the Last Member Query Interval, multiplied by the Last Member Query Count. The allowed range is 0 to 31744 in tenths of seconds; default last member query interval is 10 in tenths of seconds (1 second).
URI : Unsolicited Report Interval. The Unsolicited Report Interval is the time between repetitions of a host's initial report of membership in a group. The allowed range is 0 to 31744 seconds, default unsolicited report interval is 1 second. .
Buttons : Apply – Click to save changes. Reset- Click to undo any changes made locally and revert to previously saved values.
Upper right icon (Refresh, |<<, >>) : You can click them Refreshes the displayed table starting from the "VLAN" input fields. Or click “|<<” to update the table starting from the first entry in the VLAN table, i.e. the entry with the lowest VLAN ID. Others click “>> “ to update the table, starting with the entry after the last entry currently displayed.
2-12.1.3 Port Filtering Profile
The section describes how to set the IGMP Port Group Filtering? With the IGMP filtering feature, a user can exert this type of control. In some network Application environments, as like the metropolitan or multiple-dwelling unit (MDU) installations, a user might want to control the multicast groups to which a user on a switch port can belong. It allows the user to control the distribution of multicast services, such as IP/TV, based on some type of subscription or service plan. With this feature, you can filter multicast joins on a per-port basis by configuring IP multicast profiles and associating them with individual switch ports. An IGMP profile can contain one or more multicast groups and specifies whether access to the group is permitted or denied. If an IGMP profile denying access to a multicast group is applied to a switch port, the IGMP join report requesting the stream of IP multicast traffic is dropped, and the port is not allowed to receive IP multicast traffic from that group. If the filtering action permits access to the multicast group, the IGMP report from the port is forwarded for normal processing. IGMP filtering controls only IGMP membership join reports and has no relationship to the function that directs the forwarding of IP multicast traffic.
Web Interface
To configure the IGMP Snooping Port Group Configuration in the web interface: 1. Click Configuration, IPMC, IGMP Snooping, Port Group Filtering 2. Click Add new Filtering Group 3. Scroll the Port to enable the Port Group Filtering. Specify the Filtering Groups in the blank
field. 4. Click the save to save the setting 5. If you want to cancel the setting then you need to click the Reset button. It will revert to

110
previously saved values
Figure 2-12.1.3: The IGMP Snooping Port Group Filtering Profile.
Parameter description: Port :
The logical port for the settings. Filtering Profile :
Select the IPMC Profile as the filtering condition for the specific port. Summary about the designated profile will be shown by clicking the view button.
Profile Management Button : You can inspect the rules of the designated profile by using the following button:
: List the rules associated with the designated profile. Buttons:
Apply – Click to save changes. Reset- Click to undo any changes made locally and revert to previously saved values.
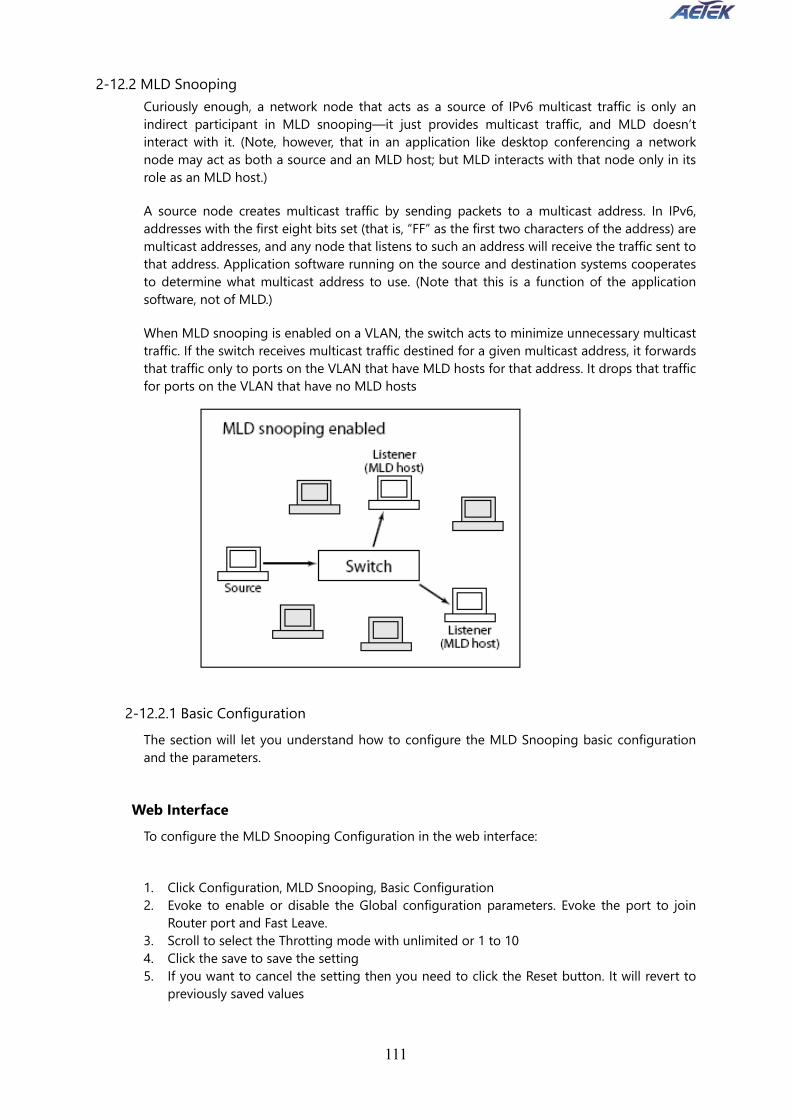
111
2-12.2 MLD Snooping Curiously enough, a network node that acts as a source of IPv6 multicast traffic is only an indirect participant in MLD snooping—it just provides multicast traffic, and MLD doesn’t interact with it. (Note, however, that in an application like desktop conferencing a network node may act as both a source and an MLD host; but MLD interacts with that node only in its role as an MLD host.)
A source node creates multicast traffic by sending packets to a multicast address. In IPv6, addresses with the first eight bits set (that is, “FF” as the first two characters of the address) are multicast addresses, and any node that listens to such an address will receive the traffic sent to that address. Application software running on the source and destination systems cooperates to determine what multicast address to use. (Note that this is a function of the application software, not of MLD.)
When MLD snooping is enabled on a VLAN, the switch acts to minimize unnecessary multicast traffic. If the switch receives multicast traffic destined for a given multicast address, it forwards that traffic only to ports on the VLAN that have MLD hosts for that address. It drops that traffic for ports on the VLAN that have no MLD hosts
2-12.2.1 Basic Configuration The section will let you understand how to configure the MLD Snooping basic configuration and the parameters.
Web Interface To configure the MLD Snooping Configuration in the web interface: 1. Click Configuration, MLD Snooping, Basic Configuration 2. Evoke to enable or disable the Global configuration parameters. Evoke the port to join
Router port and Fast Leave. 3. Scroll to select the Throtting mode with unlimited or 1 to 10 4. Click the save to save the setting 5. If you want to cancel the setting then you need to click the Reset button. It will revert to
previously saved values

112
Figure 2-12.2.1: The MLD Snooping Basic Configuration.
Parameter description: Snooping Enabled :
Enable the Global MLD Snooping. Unregistered IPMCv6 Flooding enabled :
Enable unregistered IPMCv6 traffic flooding. The flooding control takes effect only when MLD Snooping is enabled. When MLD Snooping is disabled, unregistered IPMCv6 traffic flooding is always active in spite of this setting.
MLD SSM Range : SSM (Source-Specific Multicast) Range allows the SSM-aware hosts and routers run the SSM service model for the groups in the address (Using IPv6 Address) range.
Leave Proxy Enabled : Enable MLD Leave Proxy. This feature can be used to avoid forwarding unnecessary leave messages to the router side.
Proxy Enabled : Enable MLD Proxy. This feature can be used to avoid forwarding unnecessary join and leave messages to the router side.
Fast Leave :

113
To evoke to enable the fast leave on the port. Router Port :
Specify which ports act as router ports. A router port is a port on the Ethernet switch that leads towards the Layer 3 multicast device or MLD querier. If an aggregation member port is selected as a router port, the whole aggregation will act as a router port.
Throttling : Enable to limit the number of multicast groups to which a switch port can belong.
Buttons: Apply – Click to save changes. Reset- Click to undo any changes made locally and revert to previously saved values.
2-12.2.2 VLAN Configuration
When MLD snooping is enabled on a VLAN, the switch acts to minimize unnecessary multicast traffic. If the switch receives multicast traffic destined for a given multicast address, it forwards that traffic only to ports on the VLAN that have MLD hosts for that address. It drops that traffic for ports on the VLAN that have no MLD hosts The will use the last entry of the currently displayed entry as a basis for the next lookup. When the end is reached the text "No more entries" is shown in the displayed table. Use the button to start over.
Web Interface
To configure the MLD Snooping VLAN Configuration in the web interface: 1. Click Configuration, IPMC, MLD Snooping, VLAN Configuration 2. Specify the VLAN ID with entries per page. 3. Click “Refresh” to refresh an entry of the MLD Snooping VLAN Configuration Information. 4. Click “<< or >> “to move to previous or next entry.
Figure 2-12.2.2: The MLD Snooping VLAN Configuration.
Parameter description: Delete :
Check to delete the entry. The designated entry will be deleted during the next save. VLAN ID :
It displays the VLAN ID of the entry.
114
IGMP Snooping Enabled : Enable the per-VLAN IGMP Snooping. Only up to 32 VLANs can be selected. .
Querier Election : Enable to join IGMP Querier election in the VLAN. Disable to act as an IGMP Non-Querier.
Querier Address : Define the IPv4 address as source address used in IP header for IGMP Querier election. When the Querier address is not set, system uses IPv4 management address of the IP interface associated with this VLAN. When the IPv4 management address is not set, system uses the first available IPv4 management address. Otherwise, system uses a pre-defined value. By default, this value will be 192.0.2.1.
Compatibility : Compatibility is maintained by hosts and routers taking appropriate actions depending on the versions of IGMP operating on hosts and routers within a network. The allowed selection is IGMP-Auto, Forced IGMPv1, Forced IGMPv2, Forced IGMPv3, default compatibility value is IGMP-Auto.
PRI : Priority of Interface. It indicates the IGMP control frame priority level generated by the system. These values can be used to prioritize different classes of traffic. The allowed range is 0 (best effort) to 7 (highest), default interface priority value is 0.
Rv : Robustness Variable. The Robustness Variable allows tuning for the expected packet loss on a network. The allowed range is 1 to 255; default robustness variable value is 2.
QI : Query Interval. The Query Interval is the interval between General Queries sent by the Querier. The allowed range is 1 to 31744 seconds; default query interval is 125 seconds.
QRI : Query Response Interval. The Max Response Time used to calculate the Max Resp Code inserted into the periodic General Queries. The allowed range is 0 to 31744 in tenths of seconds; default query response interval is 100 in tenths of seconds (10 seconds).
LLQI (LMQI for IGMP) : Last Member Query Interval. The Last Member Query Time is the time value represented by the Last Member Query Interval, multiplied by the Last Member Query Count. The allowed range is 0 to 31744 in tenths of seconds; default last member query interval is 10 in tenths of seconds (1 second).
URI : Unsolicited Report Interval. The Unsolicited Report Interval is the time between repetitions of a host's initial report of membership in a group. The allowed range is 0 to 31744 seconds, default unsolicited report interval is 1 second. .
Buttons : Apply – Click to save changes. Reset- Click to undo any changes made locally and revert to previously saved values.

115
Upper right icon (Refresh, |<<, >>) : You can click them Refreshes the displayed table starting from the "VLAN" input fields. Or click “|<<” to update the table starting from the first entry in the VLAN table, i.e. the entry with the lowest VLAN ID. Others click “>> “ to update the table, starting with the entry after the last entry currently displayed.
2-12.2.3 Port Group Filtering
The section describes that you could to set the Port Group Filtering in the MLD Snooping function. On the UI that you could add new filtering group and safety policy.
Web Interface
To configure the MLD Snooping Port Group Configuration in the web interface: 1. Click Configuration, IPMC, MLD Snooping, Port Group Filtering Configuration 2. Click the Add new Filtering Group 3. Specify the Filtering Groups with entries per page. 4. Click the Apply to save the setting 5. If you want to cancel the setting then you need to click the Reset button. It will revert to
previously saved values Figure 2-12.2.3: The MLD Snooping Port Group Filtering Configuration
Parameter description: Port :
The logical port for the settings. Filtering Profile :
Select the IPMC Profile as the filtering condition for the specific port. Summary about the designated profile will be shown by clicking the view button.
Profile Management Button : You can inspect the rules of the designated profile by using the following button:
: List the rules associated with the designated profile. Buttons:
Apply – Click to save changes.

116
Reset- Click to undo any changes made locally and revert to previously saved values.
2-13 LLDP
The switch supports the LLDP. For current information on your switch model, The Link Layer Discovery Protocol (LLDP) provides a standards-based method for enabling switches to advertise themselves to adjacent devices and to learn about adjacent LLDP devices. The Link Layer Discovery Protocol (LLDP) is a vendor-neutral Link Layer protocol in the Internet Protocol Suite used by network devices for advertising their identity, capabilities, and neighbors on a IEEE 802 local area network, principally wired Ethernet. The protocol is formally referred to by the IEEE as Station and Media Access Control Connectivity Discovery specified in standards document IEEE 802.1AB.
2-13.1 LLDP You can per port to do the LLDP configuration and the detail parameters, the settings will take effect immediately. This page allows the user to inspect and configure the current LLDP port settings.
Web Interface To configure LLDP: 1. Click LLDP configuration 2. Modify LLDP timing parameters 3. Set the required mode for transmitting or receiving LLDP messages 4. Specify the information to include in the TLV field of advertised messages 5. Click Apply
Figure 2-13.1: The LLDP Configuration

117
Parameter description:
LLDP Parameters
Tx Interval : The switch periodically transmits LLDP frames to its neighbours for having the network discovery information up-to-date. The interval between each LLDP frame is determined by the Tx Interval value. Valid values are restricted to 5 - 32768 seconds.
Tx Hold : Each LLDP frame contains information about how long the information in the LLDP frame shall be considered valid. The LLDP information valid period is set to Tx Hold multiplied by Tx Interval seconds. Valid values are restricted to 2 - 10 times.
Tx Delay : If some configuration is changed (e.g. the IP address) a new LLDP frame is transmitted, but the time between the LLDP frames will always be at least the value of Tx Delay seconds. Tx Delay cannot be larger than 1/4 of the Tx Interval value. Valid values are restricted to 1 - 8192 seconds.
Tx Reinit : When a port is disabled, LLDP is disabled or the switch is rebooted, an LLDP shutdown frame is transmitted to the neighboring units, signaling that the LLDP information isn't valid anymore. Tx Reinit controls the amount of seconds between the shutdown frame and a new LLDP initialization. Valid values are restricted to 1 - 10 seconds.
LLDP Port Configuration
The LLDP port settings relate to the currently selected, as reflected by the page header. Port :
The switch port number of the logical LLDP port. Mode :
Select LLDP mode. Rx only The switch will not send out LLDP information, but LLDP information from neighbor units is analyzed. Tx only The switch will drop LLDP information received from neighbors, but will send out LLDP information. Disabled The switch will not send out LLDP information, and will drop LLDP information received from neighbors. Enabled the switch will send out LLDP information, and will analyze LLDP information received from neighbors.
CDP Aware :

118
Select CDP awareness. The CDP operation is restricted to decoding incoming CDP frames (The switch doesn't transmit CDP frames). CDP frames are only decoded if LLDP on the port is enabled. Only CDP TLVs that can be mapped to a corresponding field in the LLDP neighbors’ table are decoded. All other TLVs are discarded (Unrecognized CDP TLVs and discarded CDP frames are not shown in the LLDP statistics.). CDP TLVs are mapped onto LLDP neighbors’ table as shown below. CDP TLV "Device ID" is mapped to the LLDP "Chassis ID" field. CDP TLV "Address" is mapped to the LLDP "Management Address" field. The CDP address TLV can contain multiple addresses, but only the first address is shown in the LLDP neighbors’ table. CDP TLV "Port ID" is mapped to the LLDP "Port ID" field. CDP TLV "Version and Platform" is mapped to the LLDP "System Description" field. Both the CDP and LLDP support "system capabilities", but the CDP capabilities cover capabilities that are not part of the LLDP. These capabilities are shown as "others" in the LLDP neighbors’ table. If all ports have CDP awareness disabled the switch forwards CDP frames received from neighbor devices. If at least one port has CDP awareness enabled all CDP frames are terminated by the switch.
NOTE: When CDP awareness on a port is disabled the CDP information isn't removed immediately, but gets when the hold time is exceeded.
Port Descr :
Optional TLV: When checked the "port description" is included in LLDP information transmitted.
Sys Name : Optional TLV: When checked the "system name" is included in LLDP information transmitted.
Sys Descr : Optional TLV: When checked the "system description" is included in LLDP information transmitted.
Sys Capa : Optional TLV: When checked the "system capability" is included in LLDP information transmitted.
Mgmt Addr : Optional TLV: When checked the "management address" is included in LLDP information transmitted.
Buttons: Apply – Click to save changes. Reset- Click to undo any changes made locally and revert to previously saved values.
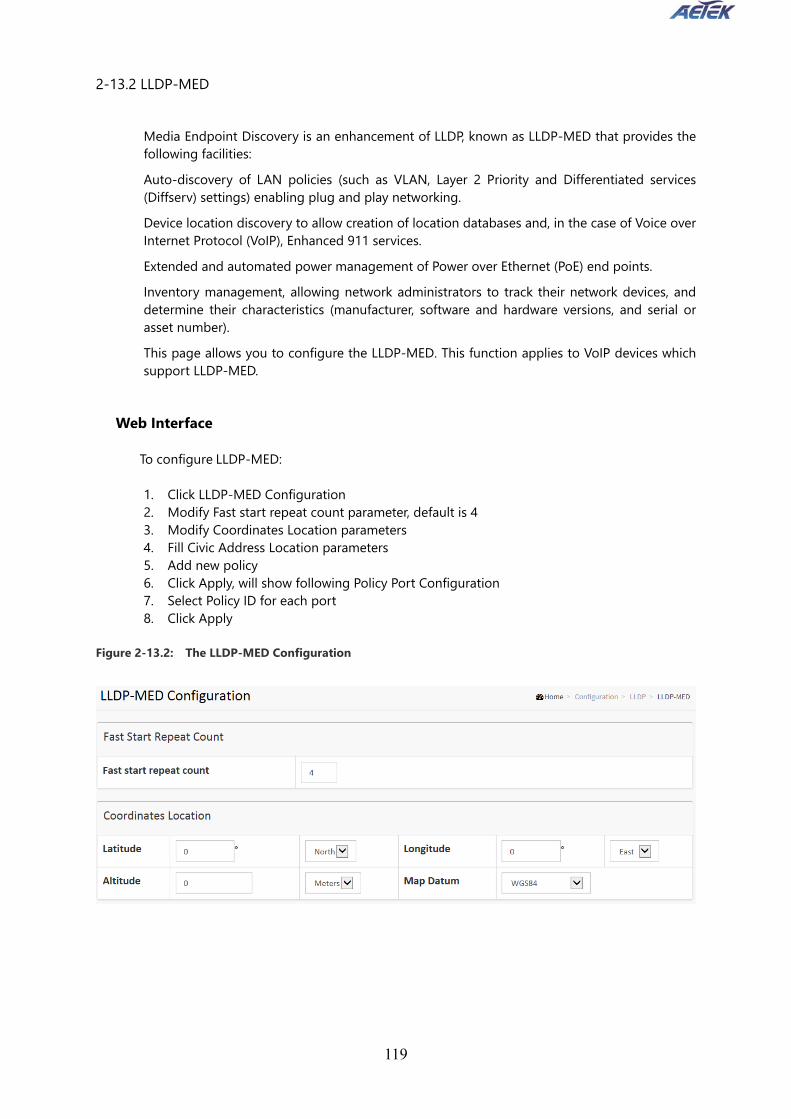
119
2-13.2 LLDP-MED
Media Endpoint Discovery is an enhancement of LLDP, known as LLDP-MED that provides the following facilities: Auto-discovery of LAN policies (such as VLAN, Layer 2 Priority and Differentiated services (Diffserv) settings) enabling plug and play networking. Device location discovery to allow creation of location databases and, in the case of Voice over Internet Protocol (VoIP), Enhanced 911 services. Extended and automated power management of Power over Ethernet (PoE) end points. Inventory management, allowing network administrators to track their network devices, and determine their characteristics (manufacturer, software and hardware versions, and serial or asset number). This page allows you to configure the LLDP-MED. This function applies to VoIP devices which support LLDP-MED.
Web Interface
To configure LLDP-MED: 1. Click LLDP-MED Configuration 2. Modify Fast start repeat count parameter, default is 4 3. Modify Coordinates Location parameters 4. Fill Civic Address Location parameters 5. Add new policy 6. Click Apply, will show following Policy Port Configuration 7. Select Policy ID for each port 8. Click Apply
Figure 2-13.2: The LLDP-MED Configuration

120
Parameter description:
Fast start repeat count Rapid startup and Emergency Call Service Location Identification Discovery of endpoints is a critically important aspect of VoIP systems in general. In addition, it is best to advertise only those pieces of information which are specifically relevant to particular endpoint types (for example only advertise the voice network policy to permitted voice-capable devices), both in order to conserve the limited LLDPU space and to reduce security and system integrity issues that can come with inappropriate knowledge of the network policy. With this in mind LLDP-MED defines an LLDP-MED Fast Start interaction between the protocol and the application layers on top of the protocol, in order to achieve these related properties. Initially, a Network Connectivity Device will only transmit LLDP TLVs in an LLDPDU. Only after an LLDP-MED Endpoint Device is detected, will an LLDP-MED capable Network Connectivity Device start to advertise LLDP-MED TLVs in outgoing LLDPDUs on the associated port. The LLDP-MED application will temporarily speed up the transmission of the LLDPDU to start within a second, when a new LLDP-MED neighbour has been detected in order share LLDP-MED information as fast as possible to new neighbours. Because there is a risk of an LLDP frame being lost during transmission between neighbours, it is recommended to repeat the fast start transmission multiple times to increase the possibility of the neighbours receiving the LLDP frame. With Fast start repeat count it is possible to specify the number of times the fast start transmission would be repeated. The recommended value is 4 times, given that 4 LLDP frames with a 1 second interval will be transmitted, when an LLDP frame with new information is received.

121
It should be noted that LLDP-MED and the LLDP-MED Fast Start mechanism is only intended to run on links between LLDP-MED Network Connectivity Devices and Endpoint Devices, and as such does not apply to links between LAN infrastructure elements, including Network Connectivity Devices, or other types of links.
Coordinates Location Latitude :
Latitude SHOULD be normalized to within 0-90 degrees with a maximum of 4 digits. It is possible to specify the direction to either North of the equator or South of the equator.
Longitude : Longitude SHOULD be normalized to within 0-180 degrees with a maximum of 4 digits. It is possible to specify the direction to either East of the prime meridian or West of the prime meridian.
Altitude : Altitude SHOULD be normalized to within -32767 to 32767 with a maximum of 4 digits. It is possible to select between two altitude types (floors or meters). Meters: Representing meters of Altitude defined by the vertical datum specified. Floors: Representing altitude in a form more relevant in buildings which have different floor-to-floor dimensions. An altitude = 0.0 is meaningful even outside a building, and represents ground level at the given latitude and longitude. Inside a building, 0.0 represents the floor level associated with ground level at the main entrance.
Map Datum : The Map Datum is used for the coordinates given in these options: WGS84: (Geographical 3D) - World Geodesic System 1984, CRS Code 4327, and Prime Meridian Name: Greenwich. NAD83/NAVD88: North American Datum 1983, CRS Code 4269, Prime Meridian Name: Greenwich; the associated vertical datum is the North American Vertical Datum of 1988 (NAVD88). This datum pair is to be used when referencing locations on land, not near tidal water (which would use Datum = NAD83/MLLW). NAD83/MLLW: North American Datum 1983, CRS Code 4269, Prime Meridian Name: Greenwich; the associated vertical datum is Mean Lower Low Water (MLLW). This datum pair is to be used when referencing locations on water/sea/ocean.
Civic Address Location IETF Geopriv Civic Address based Location Configuration Information (Civic Address LCI).
Country code : The two-letter ISO 3166 country code in capital ASCII letters - Example: DK, DE or US.
State : National subdivisions (state, canton, region, province, prefecture).
County : County, parish, gun (Japan), district.
City : City, township, shi (Japan) - Example: Copenhagen.

122
City district : City division, borough, city district, ward, chou (Japan).
Block (Neighbourhood) : Neighbourhood, block.
Street : Street - Example: Poppelvej.
Leading street direction : Leading street direction - Example: N.
Trailing street suffix : Trailing street suffix - Example: SW.
Street suffix : Street suffix - Example: Ave, Platz.
House no. : House number - Example: 21.
House no. suffix : House number suffix - Example: A, 1/2.
Landmark : Landmark or vanity address - Example: Columbia University.
Additional location info : Additional location info - Example: South Wing.
Name : Name (residence and office occupant) - Example: Flemming Jahn.
Zip code : Postal/zip code - Example: 2791.
Building : Building (structure) - Example: Low Library.
Apartment : Unit (Apartment, suite) - Example: Apt 42.
Floor : Floor - Example: 4.
Room no. : Room number - Example: 450F.
Place type : Place type - Example: Office.
Postal community name : Postal community name - Example: Leonia.
P.O. Box : Post office box (P.O. BOX) - Example: 12345.

123
Additional code : Additional code - Example: 1320300003.
Emergency Call Service: Emergency Call Service (e.g. E911 and others), such as defined by TIA or NENA.
Emergency Call Service : Emergency Call Service ELIN identifier data format is defined to carry the ELIN identifier as used during emergency call setup to a traditional CAMA or ISDN trunk-based PSAP. This format consists of a numerical digit string, corresponding to the ELIN to be used for emergency calling.
Policies Network Policy Discovery enables the efficient discovery and diagnosis of mismatch issues with the VLAN configuration, along with the associated Layer 2 and Layer 3 attributes, which apply for a set of specific protocol applications on that port. Improper network policy configurations are a very significant issue in VoIP environments that frequently result in voice quality degradation or loss of service. Policies are only intended for use with applications that have specific 'real-time' network policy requirements, such as interactive voice and/or video services. The network policy attributes advertised are: 1. Layer 2 VLAN ID (IEEE 802.1Q-2003) 2. Layer 2 priority value (IEEE 802.1D-2004) 3. Layer 3 Diffserv code point (DSCP) value (IETF RFC 2474) This network policy is potentially advertised and associated with multiple sets of application types supported on a given port. The application types specifically addressed are: 1. Voice 2. Guest Voice 3. Softphone Voice 4. Video Conferencing 5. Streaming Video 6. Control / Signalling (conditionally support a separate network policy for the media types above) A large network may support multiple VoIP policies across the entire organization, and different policies per application type. LLDP-MED allows multiple policies to be advertised per port, each corresponding to a different application type. Different ports on the same Network Connectivity Device may advertise different sets of policies, based on the authenticated user identity or port configuration.
It should be noted that LLDP-MED is not intended to run on links other than between Network Connectivity Devices and Endpoints, and therefore does not need to advertise the multitude of network policies that frequently run on an aggregated link interior to the LAN.
Delete : Check to delete the policy. It will be deleted during the next save.
Policy ID : ID for the policy. This is auto generated and shall be used when selecting the polices that

124
shall be mapped to the specific ports. Application Type :
Intended use of the application types: 1. Voice - for use by dedicated IP Telephony handsets and other similar appliances supporting interactive voice services. These devices are typically deployed on a separate VLAN for ease of deployment and enhanced security by isolation from data applications. 2. Voice Signalling (conditional) - for use in network topologies that require a different policy for the voice signalling than for the voice media. This application type should not be advertised if all the same network policies apply as those advertised in the Voice application policy. 3. Guest Voice - support a separate 'limited feature-set' voice service for guest users and visitors with their own IP Telephony handsets and other similar appliances supporting interactive voice services. 4. Guest Voice Signalling (conditional) - for use in network topologies that require a different policy for the guest voice signalling than for the guest voice media. This application type should not be advertised if all the same network policies apply as those advertised in the Guest Voice application policy. 5. Softphone Voice - for use by softphone applications on typical data centric devices, such as PCs or laptops. This class of endpoints frequently does not support multiple VLANs, if at all, and are typically configured to use an 'untagged' VLAN or a single 'tagged' data specific VLAN. When a network policy is defined for use with an 'untagged' VLAN (see Tagged flag below), then the L2 priority field is ignored and only the DSCP value has relevance. 6. Video Conferencing - for use by dedicated Video Conferencing equipment and other similar appliances supporting real-time interactive video/audio services. 7. Streaming Video - for use by broadcast or multicast based video content distribution and other similar applications supporting streaming video services that require specific network policy treatment. Video applications relying on TCP with buffering would not be an intended use of this application type. 8. Video Signalling (conditional) - for use in network topologies that require a separate policy for the video signalling than for the video media. This application type should not be advertised if all the same network policies apply as those advertised in the Video Conferencing application policy.
Tag : Tag indicating whether the specified application type is using a 'tagged' or an 'untagged' VLAN. Untagged indicates that the device is using an untagged frame format and as such does not include a tag header as defined by IEEE 802.1Q-2003. In this case, both the VLAN ID and the Layer 2 priority fields are ignored and only the DSCP value has relevance. Tagged indicates that the device is using the IEEE 802.1Q tagged frame format, and that both the VLAN ID and the Layer 2 priority values are being used, as well as the DSCP value. The tagged format includes an additional field, known as the tag header. The tagged frame format also includes priority tagged frames as defined by IEEE 802.1Q-2003.
VLAN ID : VLAN identifier (VID) for the port as defined in IEEE 802.1Q-2003.
L2 Priority : L2 Priority is the Layer 2 priority to be used for the specified application type. L2 Priority may specify one of eight priority levels (0 through 7), as defined by IEEE 802.1D-2004. A value of

125
0 represents use of the default priority as defined in IEEE 802.1D-2004. DSCP :
DSCP value to be used to provide Diffserv node behaviour for the specified application type as defined in IETF RFC 2474. DSCP may contain one of 64 code point values (0 through 63). A value of 0 represents use of the default DSCP value as defined in RFC 2475.
Adding a new policy : Click to add a new policy. Specify the Application type, Tag, VLAN ID, L2 Priority and DSCP for the new policy. Click "Save".
Port Policies Configuration : Every port may advertise a unique set of network policies or different attributes for the same network policies, based on the authenticated user identity or port configuration.
Port : The port number to which the configuration applies.
Policy Id : The set of policies that shall apply to a given port. The set of policies is selected by check marking the checkboxes that corresponds to the policies.
Buttons: Apply – Click to save changes. Reset- Click to undo any changes made locally and revert to previously saved values.
2-14 PoE PoE is an acronym for Power over Ethernet. Power over Ethernet is used to transmit electrical power, to remote devices over standard Ethernet cable. It could for example be used for powering IP telephones, wireless LAN access points and other equipment, where it would be difficult or expensive to connect the equipment to main power supply.
The PoE detect function is follow the table Stages of Powering up a PoE Link
Stage Action Volts specified [V]
802.3af 802.3at Detection PSE detects if the PD has the correct
signature resistance of 19–26.5 kΩ 2.7-10.1
Classification PSE detects resistor indicating power range
14.5-20.5
Mark 1 Signals PSE is 802.3at capable. PD presents a 0.25–4 mA load.
─ 7-10
Class 2 PSE outputs classification voltage again to indicate 802.3at capability
─ 14.5-20.5
Mark 2 Signals PSE is 802.3at capable. PD presents a 0.25–4 mA load.
─ 7-10
Startup Startup voltage >42 >42

126
Normal operation
Supply power to device 37-45 42.5-57
Power levels available
Class Usage Power range [Watt]
Class description
0 Default 15.4 Classification unimplemented
1 Optional 4 Very Low power 2 Optional 7 Low power 3 Optional 15.4 Mid power 4 Valid for 802.3at (Type
2) devices, not allowed for 802.3af devices
30 High power
2- 14.1 Configuration This page allows the user to inspect and configure the current PoE port settings and show all PoE Supply W.
Web Interface
To configure Power over Ethernet in the web interface: 1. Click configuration, PoE, and configuration 2. Specify the Reserved Power determined and Power Management ode. Specify the PoE or
PoE+ and Priority. 3. Click Apply.
Figure 2-14.1: The PoE Configuration

127
Parameter description:
Power Supply Configuration Reserved Power determined by :
There are three modes for configuring how the ports/PDs may reserve power. 1. Allocated mode: In this mode the user allocates the amount of power that each port may reserve. The allocated/reserved power for each port/PD is specified in the Maximum Power fields. 2. Class mode: In this mode each port automatically determines how much power to reserve according to the class the connected PD belongs to, and reserves the power accordingly. Four different port classes exist and one for 4, 7, 15.4 or 30 Watts. In this mode the Maximum Power fields have no effect. 3. LLDP-MED mode: This mode is similar to the Class mode expect that each port determine the amount power it reserves by exchanging PoE information using the LLDP protocol and reserves power accordingly. If no LLDP information is available for a port, the port will reserve power using the class mode In this mode the Maximum Power fields have no effect for all modes: If a port uses more power than the reserved power for the port, the port is shut down.
Power Management Mode : There are 2 modes for configuring when to shut down the ports: 1. Actual Consumption: In this mode the ports are shut down when the actual power consumption for all ports exceeds the amount of power that the power supply can deliver or if the actual power consumption for a given port exceeds the reserved power for that port. The ports are shut down according to the ports priority. If two ports have the same priority the port with the highest port number is shut down. 2. Reserved Power: In this mode the ports are shut down when total reserved powered exceeds the amount of power that the power supply can deliver. In this mode the port power is not turned on if the PD requests more power than available from the power supply.
Primary and Backup Power Source : Some switches support having two PoE power supplies. One is used as primary power source, and one as backup power source. If the switch doesn't support backup power supply only the primary power supply settings will be shown. In case that the primary power source fails the backup power source will take over. For being able to determine the amount of power the PD may use, it must be defined what amount of power the primary and backup power sources can deliver. Valid values are in the range 0 to 2000 Watts.
Port : This is the logical port number for this row. Ports that are not PoE-capable are grayed out and thus impossible to configure PoE for.
PoE Mode :

128
The PoE Mode represents the PoE operating mode for the port. Disabled: PoE disabled for the port. PoE : Enables PoE IEEE 802.3af (Class 4 PDs limited to 15.4W) PoE+ : Enables PoE+ IEEE 802.3at (Class 4 PDs limited to 30W)
Priority : The Priority represents the ports priority. There are three levels of power priority named Low, High and Critical. The priority is used in the case where the remote devices requires more power than the power supply can deliver. In this case the port with the lowest priority will be turn off starting from the port with the highest port number.
Maximum Power : The Maximum Power value contains a numerical value that indicates the maximum power in watts that can be delivered to a remote device. The maximum allowed value is 30 W.

129
2- 14.2 Power Delay This page allows the user to setting the delay time of power providing after device rebooted.
Web Interface
To Display Power over Ethernet Status in the web interface: 1. Click Configuration, PoE, and Power delay. 2. Enable the port to the power device. 3. Specify the power providing delay time when reboot. 4. Click Apply to apply the change.
Figure 2-14.2: The PoE Power Delay
Parameter description:
Power Supply Configuration Port :
This is the logical port number for this row. Delay Mode :
Turn on / off the power delay function. Enabled: Enable POE Power Delay. Disabled: Disable POE Power Delay.
Delay Time(0~300sec) : When rebooting, the PoE port will start to provide power to the PD when it out of delay time. Default: 0, range: 0-300 sec.

130
2- 14.3 Schedule Profile This page allows the user to make a perfect schedule of PoE power supply. PoE Scheduling not only makes PoE management easier but also saves more energy
Web Interface
To Display Power Over Ethernet Scheduling in the web interface: 1. Click Configuration, PoE, and Scheduling. 2. Select the local port and enable. 3. Select time and day to supply power. 4. Click Apply to apply the change. Figure 2-13.3: The Schedule Profile
Parameter description:
Power Supply Configuration Port :
This is the logical port number for this row. Status :
PoE Scheduling Status. Enabled: Enable POE Scheduling.

131
Disabled: Disable POE Scheduling. Hour :
The time of PoE port provide power of a day.
2- 14.4 Auto Checking This page allows the user to specify the auto detection parameters to check the linking status between PoE ports and PDs. When it detected the fail connect, will reboot remote PD automatically.
Web Interface
To Display Power over Ethernet Auto Checking in the web interface: 1. Click Configuration, PoE, and Auto checking. 2. Enable the Ping Check function. 3. Specify the PD’s IP address, checking interval, retry time, failure action and reboot time. 4. Click Apply to apply the change. Figure 2-14.4: The PoE Scheduling
Parameter description:
Power Supply Configuration Ping Check :
Enable Ping Check function can detects the connection between PoE port and power device. Disable will turn off the detection.
Port : This is the logical port number for this row.
Ping IP Address : The PD's IP Address the system should ping.
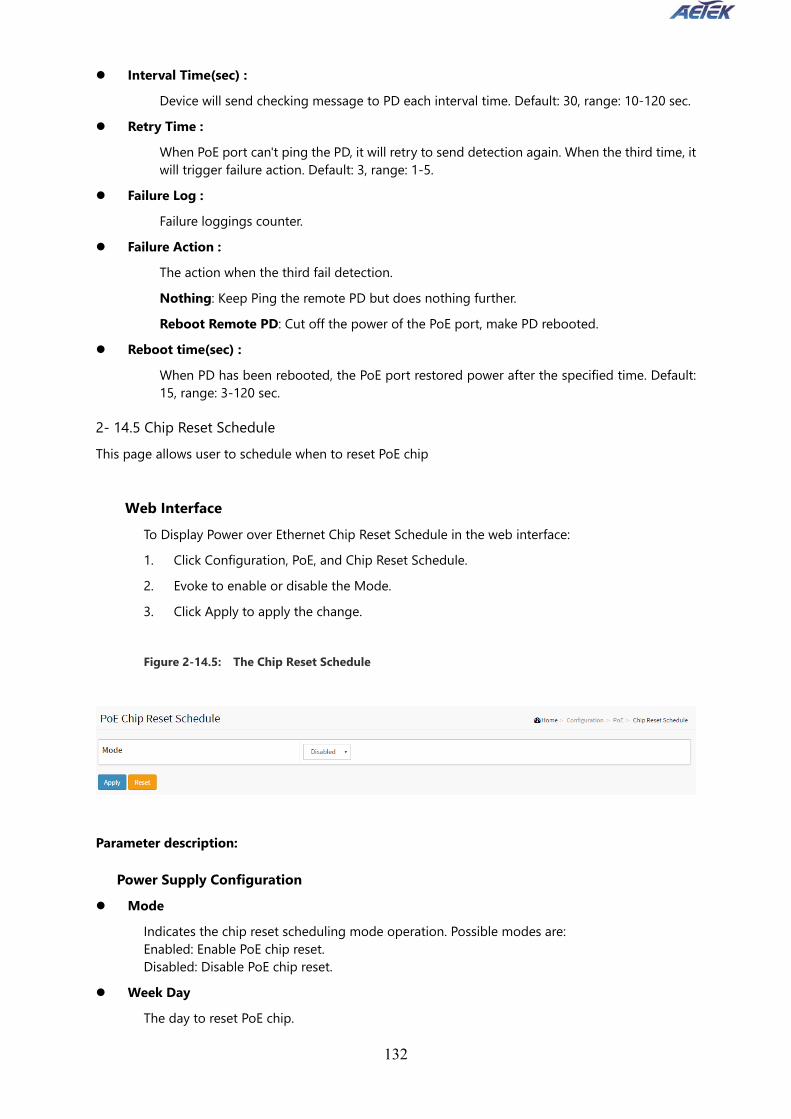
132
Interval Time(sec) : Device will send checking message to PD each interval time. Default: 30, range: 10-120 sec.
Retry Time : When PoE port can't ping the PD, it will retry to send detection again. When the third time, it will trigger failure action. Default: 3, range: 1-5.
Failure Log : Failure loggings counter.
Failure Action : The action when the third fail detection. Nothing: Keep Ping the remote PD but does nothing further. Reboot Remote PD: Cut off the power of the PoE port, make PD rebooted.
Reboot time(sec) : When PD has been rebooted, the PoE port restored power after the specified time. Default: 15, range: 3-120 sec.
2- 14.5 Chip Reset Schedule This page allows user to schedule when to reset PoE chip
Web Interface
To Display Power over Ethernet Chip Reset Schedule in the web interface: 1. Click Configuration, PoE, and Chip Reset Schedule. 2. Evoke to enable or disable the Mode. 3. Click Apply to apply the change. Figure 2-14.5: The Chip Reset Schedule
Parameter description:
Power Supply Configuration Mode
Indicates the chip reset scheduling mode operation. Possible modes are: Enabled: Enable PoE chip reset. Disabled: Disable PoE chip reset.
Week Day The day to reset PoE chip.

133
PoE Chip Reset Time The time to reset PoE chip.
Buttons: Apply – Click to save changes. Reset- Click to undo any changes made locally and revert to previously saved values.
2-15 EPS The Ethernet (Linear) Protection Switch instances are configured here.
Web Interface
To configure the EPS parameters in the web interface: 1. Click Configuration and EPS. 2. Specify the Ethernet Protection Switching parameters. 3. Click Apply to apply the change. Figure 2-15: The Ethernet Protection Switching
Parameter description:
Power Supply Configuration Delete
This box is used to mark an EPS for deletion in next save operation. EPS ID
The ID of the EPS. Click on the ID of an EPS to enter the configuration page. The range is 1-100. Domain
Port: This will create an EPS in the Port Domain. 'W/P Flow' is a Port.
Architecture
Port: This will create a 1+1 EPS.
Port: This will create a 1:1 EPS.
W Flow

134
The working flow for the EPS - See 'Domain'. P Flow
The protecting flow for the EPS - See 'Domain'. W SF MEP
The working Signal Fail reporting MEP. P SF MEP
The protecting Signal Fail reporting MEP. APS MEP
The APS PDU handling MEP. Alarm
There is an active alarm on the EPS. Buttons:
Apply – Click to save changes. Reset- Click to undo any changes made locally and revert to previously saved values.

135
2-16 MEP The Maintenance Entity Point instances are configured here.
Web Interface
To configure the MEP parameters in the web interface: 1. Click Configuration and MEP. 2. Specify the Maintenance Entity Point parameters. 3. Click Apply to apply the change. Figure 2-16: The Maintenance Entity Point
Parameter description:
Power Supply Configuration Delete
This box is used to mark a MEP for deletion in next Save operation. Instance
The ID of the MEP. Click on the ID of a MEP to enter the configuration page. The range is from 1 through 100.
Domain Port: This is a MEP in the Port Domain. EVC: This is a MEP in the EVC Domain. 'Flow Instance' is an EVC. The EVC must be created VLAN: This is a MEP in the VLAN Domain. 'Flow Instance' is a VLAN. In case of Up-MEP the VLAN must be created
Mode MEP: This is a Maintenance Entity End Point. MIP: This is a Maintenance Entity Intermediate Point.
Direction Down: This is a Down MEP - monitoring ingress OAM and traffic on 'Residence Port'. Up: This is a Up MEP - monitoring egress OAM and traffic on 'Residence Port'.
Residence Port The port where MEP is monitoring - see 'Direction'. For a EVC MEP the port must be a port in the EVC. For a VLAN MEP the port must be a VLAN member.
Level The MEG level of this MEP.

136
Flow Instance The MEP is related to this flow - See 'Domain'. This is not relevant and not shown in case of Port MEP.
Tagged VID Port MEP: An outer C/S-tag (depending on VLAN Port Type) is added with this VID. Entering '0' means no TAG added. EVC MEP: This is not used. VLAN MEP: This is not used. EVC MIP: On Serval, this is the Subscriber VID that identify the subscriber flow in this EVC where the MIP is active.
This MAC The MAC of this MEP - can be used by other MEP when unicast is selected (Info only).
Alarm There is an active alarm on the MEP. Buttons:
Apply – Click to save changes. Reset- Click to undo any changes made locally and revert to previously saved values.

137
2-17 ERPS The ERPS instances are configured here.
Web Interface
To configure the Ethernet Ring Protection Switching parameters in the web interface: 1. Click Configuration and ERPS. 2. Specify the Ethernet Ring Protection Switching parameters. 3. Click Apply to apply the change. Figure 2-17: The Ethernet Ring Protection Switching
Parameter description:
Power Supply Configuration Delete
This box is used to mark an EPS for deletion in next save operation. EPS ID
The ID of the EPS. Click on the ID of an EPS to enter the configuration page. The range is 1-100. Domain
Port: This will create an EPS in the Port Domain. 'W/P Flow' is a Port.
Architecture
Port: This will create a 1+1 EPS.
Port: This will create a 1:1 EPS.
W Flow The working flow for the EPS - See 'Domain'.
P Flow The protecting flow for the EPS - See 'Domain'.
W SF MEP The working Signal Fail reporting MEP.
P SF MEP

138
The protecting Signal Fail reporting MEP. APS MEP
The APS PDU handling MEP. Alarm
There is an active alarm on the EPS. Buttons:
Apply – Click to save changes. Reset- Click to undo any changes made locally and revert to previously saved values.

139
2-18 MAC Table Switching of frames is based upon the DMAC address contained in the frame. The switch builds up a table that maps MAC addresses to switch ports for knowing which ports the frames should go to (based upon the DMAC address in the frame). This table contains both static and dynamic entries. The static entries are configured by the network administrator if the administrator wants to do a fixed mapping between the DMAC address and switch ports. The frames also contain a MAC address (SMAC address), which shows the MAC address of the equipment sending the frame. The SMAC address is used by the switch to automatically update the MAC table with these dynamic MAC addresses. Dynamic entries are removed from the MAC table if no frame with the corresponding SMAC address have been seen after a configurable age time
Web Interface To configure MAC Address Table in the web interface: Aging Configuration 1. Click configuration. 2. Specify the Disable Automatic Aging and Aging Time. 3. Click Apply. MAC Table Learning 1. Click configuration. 2. Specify the Port Members (Auto, Disable, Secure). 3. Click Apply. Static MAC Table Configuration 1. Click configuration and Add new Static entry. 2. Specify the VLAN IP and Mac address, Port Members. 3. Click Apply. Figure 2-18: The MAC Address Table Configuration

140
Parameter description: Aging Configuration :
By default, dynamic entries are removed from the MAC table after 300 seconds. This removal is also called aging. Configure aging time by entering a value here in seconds; for example, Age time seconds. The allowed range is 10 to 1000000 seconds.
Disable the automatic aging of dynamic entries by checking Disable automatic aging.
MAC Table Learning If the learning mode for a given port is greyed out, another module is in control of the mode, so that it cannot be changed by the user. An example of such a module is the MAC-Based Authentication under 802.1X. Each port can do learning based upon the following settings:
Auto : Learning is done automatically as soon as a frame with unknown SMAC is received.
Disable : No learning is done.
Secure : Only static MAC entries are learned, all other frames are dropped.
NOTE: Make sure that the link used for managing the switch is added to the Static Mac Table before changing to secure learning mode, otherwise the management link is lost and can only be restored by using another non-secure port or by connecting to the switch via the serial interface.
Static MAC Table Configuration
The static entries in the MAC table are shown in this table. The static MAC table can contain 64 entries. The maximum of 64 entries is for the whole stack, and not per switch. The MAC table is sorted first by VLAN ID and then by MAC address.
Delete : Check to delete the entry. It will be deleted during the next save.
VLAN ID : The VLAN ID of the entry.
MAC Address : The MAC address of the entry.
Port Members : Checkmarks indicate which ports are members of the entry. Check or uncheck as needed to modify the entry.
Adding a New Static Entry : Click to add a new entry to the static MAC table. Specify the VLAN ID, MAC address, and port members for the new entry. Click "Apply".

141
Buttons: Apply – Click to save changes. Reset- Click to undo any changes made locally and revert to previously saved values.

142
2-19 VLAN Translation
2- 19.1 Port to Group Mapping This page allows you to configure switch Ports to use a given VLAN Translation Mapping Group. This will enable all VLAN Translation mappings of that group (if any) on the selected switch port. The displayed settings are:
Web Interface To configure Port to Group Mapping in the web interface: 1. Click configuration, VLAN Translation and Port to Group Mapping 2. Specify the Port and Group Configuration. 3. Click Apply.
Figure 2-19.1: The Port to Group Mapping
Parameter description:
Power Supply Configuration Port:
The Port column shows the list of ports for which you can configure the VLAN Translation Mapping Group.
Default To set the switch port to use the default VLAN Translation Group click the checkbox and press Save.
Group ID The VLAN Translation mappings are organized into Groups, identified by the Group ID. This way a port is configured to use a number of VLAN Translation mappings easily by simply configuring it to use a given group. Then number of possible groups in a switch is equal to the number of ports present in this switch. A port can be configured to use any of the groups, but only one at any given time. Multiple ports can be configured to use the same group. A valid Group ID is an integer value from 1 to 12. Note: By default, each port is set to use the group with Group ID equal to the port number.

143
For example, port #1 is by default set to use group with GID = 1. Buttons:
Apply – Click to save changes. Reset- Click to undo any changes made locally and revert to previously saved values
2- 19.2 VID Translation Mapping This page displays current VLAN Translation mapping configurations. The settings can also be configured here.
Web Interface To configure VID Translation Mapping in the web interface: 1. Click configuration, VLAN Translation and VID Translation Mapping. 2. Specify the Group ID, VID and TVID. 3. Click Apply.
Figure 2-19.2: The VID Translation Mapping
Parameter description:
Power Supply Configuration Group ID
The VLAN Translation mappings are organized into Groups, identified by the Group ID. This way a port is configured to use a number of VLAN Translation mappings easily by simply configuring it to use a given group. Then number of possible groups in a switch is equal to the number of ports present in this switch. A port can be configured to use any of the groups, but only one at any given time. Multiple ports can be configured to use the same group. A valid Group ID is an integer value from 1 to 12. Note: By default, each port is set to use the group with Group ID equal to the port number. For example, port #1 is by default set to use group with GID = 1.
VID Indicates the VLAN of the mapping (i.e. 'source' VLAN). A valid VLAN ID ranges from 1 to 4095.
TVID

144
Indicates the VLAN ID to which VLAN ID of an ingress frame will be translated to (granted that the mapping is enabled on the ingress port that the frame arrived at). A valid VLAN ID ranges from 1 to 4095.
Buttons: Apply – Click to save changes. Reset- Click to undo any changes made locally and revert to previously saved values Cancel- Return to the previous page; any changes made locally will be undone.
2-20 VLANs
To assign a specific VLAN for management purpose. The management VLAN is used to establish an IP connection to the switch from a workstation connected to a port in the VLAN. This connection supports a VSM, SNMP, and Telnet session. By default, the active management VLAN is VLAN 1, but you can designate any VLAN as the management VLAN using the Management VLAN window. Only one management VLAN can be active at a time. When you specify a new management VLAN, your HTTP connection to the old management VLAN is lost. For this reason, you should have a connection between your management station and a port in the new management VLAN or connect to the new management VLAN through a multi-VLAN route
Web Interface
To configure VLAN membership configuration in the web interface: 1. Click Configuration VLANS. 2. Specify Existing VLANs, Ether type for Custom S-ports 3. Click Apply.
Figure 2-20.1: The VLAN Configuration

145
Parameter description: Global VLAN Configuration Existing VLANs :
This field shows the VLANs that are created on the switch. By default, only VLAN 1 exists. More VLANs may be created by using a list syntax where the individual elements are separated by commas. Ranges are specified with a dash separating the lower and upper bound. The following example will create VLANs 1, 10, 11, 12, 13, 200, and 300: 1,10-13,200,300. Spaces are allowed in between the delimiters.
Ethertype for Custom S-ports : This field specifies the ethertype/TPID (specified in hexadecimal) used for Custom S-ports. The setting is in force for all ports whose Port Type is set to S-Custom-Port.
Port VLAN Configuration Port :
This is the logical port number of this row. Mode :
The port mode (default is Access) determines the fundamental behavior of the port in question. A port can be in one of three modes as described below. Whenever a particular mode is selected, the remaining fields in that row will be either grayed out or made changeable depending on the mode in question. Grayed out fields show the value that the port will get when the mode is applied. Access: Access ports are normally used to connect to end stations. Dynamic features like Voice VLAN may add the port to more VLANs behind the scenes. Access ports have the following characteristics: • Member of exactly one VLAN, the Port VLAN (a.k.a. Access VLAN), which by default is 1, • accepts untagged frames and C-tagged frames, • discards all frames that are not classified to the Access VLAN, • on egress all frames are transmitted untagged. Trunk: Trunk ports can carry traffic on multiple VLANs simultaneously, and are normally used to connect to other switches. Trunk ports have the following characteristics: • By default, a trunk port is member of all existing VLANs. This may be limited by the use of Allowed VLANs, • unless VLAN Trunking is enabled on the port, frames classified to a VLAN that the port is not a member of will be discarded, • by default, all frames but frames classified to the Port VLAN (a.k.a. Native VLAN) get tagged on egress. Frames classified to the Port VLAN do not get C-tagged on egress, • egress tagging can be changed to tag all frames, in which case only tagged frames are accepted on ingress, • VLAN trunking may be enabled. Hybrid: Hybrid ports resemble trunk ports in many ways, but adds additional port configuration features. In addition to the characteristics described for trunk ports, hybrid ports have these abilities: • Can be configured to be VLAN tag unaware, C-tag aware, S-tag aware, or S-custom-tag aware, • ingress filtering can be controlled, • ingress acceptance of frames and configuration of egress tagging can be configured independently.
Port VLAN : Determines the port's VLAN ID (a.k.a. PVID). Allowed VLANs are in the range 1 through 4095, default
146
being 1. On ingress, frames get classified to the Port VLAN if the port is configured as VLAN unaware, the frame is untagged, or VLAN awareness is enabled on the port, but the frame is priority tagged (VLAN ID = 0). On egress, frames classified to the Port VLAN do not get tagged if Egress Tagging configuration is set to untag Port VLAN. The Port VLAN is called an "Access VLAN" for ports in Access mode and Native VLAN for ports in Trunk or Hybrid mode.
Port Type : Ports in hybrid mode allow for changing the port type, that is, whether a frame's VLAN tag is used to classify the frame on ingress to a particular VLAN, and if so, which TPID it reacts on. Likewise, on egress, the Port Type determines the TPID of the tag, if a tag is required. Unaware: On ingress, all frames, whether carrying a VLAN tag or not, get classified to the Port VLAN, and possible tags are not removed on egress. C-Port: On ingress, frames with a VLAN tag with TPID = 0x8100 get classified to the VLAN ID embedded in the tag. If a frame is untagged or priority tagged, the frame gets classified to the Port VLAN. If frames must be tagged on egress, they will be tagged with a C-tag. S-Port: On ingress, frames with a VLAN tag with TPID = 0x8100 or 0x88A8 get classified to the VLAN ID embedded in the tag. If a frame is untagged or priority tagged, the frame gets classified to the Port VLAN. If frames must be tagged on egress, they will be tagged with an S-tag. S-Custom-Port: On ingress, frames with a VLAN tag with a TPID = 0x8100 or equal to the Ethertype configured for Custom-S ports get classified to the VLAN ID embedded in the tag. If a frame is untagged or priority tagged, the frame gets classified to the Port VLAN. If frames must be tagged on egress, they will be tagged with the custom S-tag.
Ingress Filtering : Hybrid ports allow for changing ingress filtering. Access and Trunk ports always have ingress filtering enabled. If ingress filtering is enabled (checkbox is checked), frames classified to a VLAN that the port is not a member of get discarded. If ingress filtering is disabled, frames classified to a VLAN that the port is not a member of are accepted and forwarded to the switch engine. However, the port will never transmit frames classified to VLANs that it is not a member of.
VLAN Trunking : Trunk and Hybrid ports allow for enabling VLAN trunking. When VLAN trunking is enabled, frames classified to unknown VLANs are accepted on the port whether ingress filtering is enabled or not. This is useful in scenarios where a cloud of intermediary switches must bridge VLANs that haven't been created. By configuring the ports that connect the cloud of switches as trunking ports, they can seemlessly carry those VLANs from one end to the other.
Ingress Acceptance : Hybrid ports allow for changing the type of frames that are accepted on ingress. Tagged and untagged both tagged and untagged frames are accepted. Tagged Only Only tagged frames are accepted on ingress. Untagged frames are discarded. Untagged Only

147
Only untagged frames are accepted on ingress. Tagged frames are discarded. Egress Tagging :
Ports in Trunk and Hybrid mode may control the tagging of frames on egress. Untag Port VLAN Frames classified to the Port VLAN are transmitted untagged. Other frames are transmitted with the relevant tag. Tag All All frames, whether classified to the Port VLAN or not, are transmitted with a tag. Untag All All frames, whether classified to the Port VLAN or not, are transmitted without a tag. This option is only available for ports in Hybrid mode.
Allowed VLANs : Ports in Trunk and Hybrid mode may control which VLANs they are allowed to become members of. Access ports can only be member of one VLAN, the Access VLAN. The field's syntax is identical to the syntax used in the Existing VLANs field. By default, a port may become member of all possible VLANs, and is therefore set to 1-4095. The field may be left empty, which means that the port will not be member of any of the existing VLANs, but if it is configured for VLAN Trunking it will still be able to carry all unknown VLANs.
Forbidden VLANs : A port may be configured to never be member of one or more VLANs. This is particularly useful when dynamic VLAN protocols like MVRP and GVRP must be prevented from dynamically adding ports to VLANs. The trick is to mark such VLANs as forbidden on the port in question. The syntax is identical to the syntax used in the Existing VLANs field. By default, the field is left blank, which means that the port may become a member of all possible VLANs.

148
2-21 Private VLANs In a private VLAN, communication between ports in that private VLAN is not permitted. A VLAN can be configured as a private VLAN.
2-21.1 Membership The Private VLAN membership configurations for the switch can be monitored and modified here. rivate VLANs can be added or deleted here. Port members of each Private VLAN can be added or removed here. Private VLANs are based on the source port mask, and there are no connections to VLANs. This means that VLAN IDs and Private VLAN IDs can be identical. A port must be a member of both a VLAN and a Private VLAN to be able to forward packets. By default, all ports are VLAN unaware and members of VLAN 1 and Private VLAN 1. A VLAN unaware port can only be a member of one VLAN, but it can be a member of multiple Private VLANs.
Web Interface To configure Membership in the web interface: 1. Click Configuration, Private VLANs and Membership. 2. Evoke which port want to enable Port Members. 3. Click Apply. Figure 2-21.1: The Membership
Parameter description: Delete
To delete a private VLAN entry, check this box. The entry will be deleted during the next save. Private VLAN ID
Indicates the ID of this particular private VLAN. Port Members
A row of check boxes for each port is displayed for each private VLAN ID. To include a port in a Private VLAN, check the box. To remove or exclude the port from the Private VLAN, make sure the box is unchecked. By default, no ports are members, and all boxes are unchecked.
Adding a New Private VLAN Click to add a new private VLAN ID. An empty row is added to the table, and the private VLAN can be configured as needed. The allowed range for a private VLAN ID is the same as the switch

149
port number range. Any values outside this range are not accepted, and a warning message appears. Click "OK" to discard the incorrect entry, or click "Cancel" to return to the editing and make a correction. The Private VLAN is enabled when you click "Save". The button can be used to undo the addition of new Private VLANs
Buttons: Refresh- Click to refresh the page immediately. Apply – Click to save changes. Reset- Click to undo any changes made locally and revert to previously saved values.

150
2-21.2 Port Isolation This page is used for enabling or disabling port isolation on ports in a Private VLAN. A port member of a VLAN can be isolated to other isolated ports on the same VLAN and Private VLAN.
Web Interface
To configure Port Isolation configuration in the web interface: 1. Click Configuration, Private VLAN, Port Isolation. 2. Evoke which port want to enable Port Isolation 3. Click Apply. Figure 2-21.2: The Port Isolation Configuration
Parameter description: Port Members :
A check box is provided for each port of a private VLAN. When checked, port isolation is enabled on that port. When unchecked, port isolation is disabled on that port. By default, port isolation is disabled on all ports.
Buttons: Refresh- Click to refresh the page immediately. Apply – Click to save changes. Reset- Click to undo any changes made locally and revert to previously saved values.

151
2-22 VCL
2-22.1 MAC-based VLAN MAC address-based VLAN decides the VLAN for forwarding an untagged frame based on the source MAC address of the frame. A most common way of grouping VLAN members is by port, hence the name port-based VLAN. Typically, the device adds the same VLAN tag to untagged packets that are received through the same port. Later on, these packets can be forwarded in the same VLAN. Port-based VLAN is easy to configure, and applies to networks where the locations of terminal devices are relatively fixed. As mobile office and wireless network access gain more popularity, the ports that terminal devices use to access the networks are very often non-fixed. A device may access a network through Port A this time, but through Port B the next time. If Port A and Port B belong to different VLANs, the device will be assigned to a different VLAN the next time it accesses the network. As a result, it will not be able to use the resources in the old VLAN. On the other hand, if Port A and Port B belong to the same VLAN, after terminal devices access the network through Port B, they will have access to the same resources as those accessing the network through Port A do, which brings security issues. To provide user access and ensure data security in the meantime, the MAC-based VLAN technology is developed.
MAC-based VLANs group VLAN members by MAC address. With MAC-based VLAN configured, the device adds a VLAN tag to an untagged frame according to its source MAC address. MAC-based VLANs are mostly used in conjunction with security technologies such as 802.1X to provide secure, flexible network access for terminal devices.
Web Interface To configure MAC address-based VLAN configuration in the web interface: 1. Click VLC, MAC-based VLAN configuration and add new entry. 2. Specify the MAC address and VLAN ID. 3. Click Apply. Figure 2-22.1: The MAC-based VLAN Membership Configuration
Parameter description: Delete :
To delete a MAC-based VLAN entry, check this box and press save. The entry will be deleted on the selected switch in the stack.

152
MAC Address : Indicates the MAC address.
VLAN ID : Indicates the VLAN ID.
Port Members : A row of check boxes for each port is displayed for each MAC-based VLAN entry. To include a port in a MAC-based VLAN, check the box. To remove or exclude the port from the MAC-based VLAN, make sure the box is unchecked. By default, no ports are members, and all boxes are unchecked.
Adding a New MAC-based VLAN Click to add a new MAC-based VLAN entry. An empty row is added to the table, and the MAC-based VLAN entry can be configured as needed. Any unicast MAC address can be configured for the MAC-based VLAN entry. No broadcast or multicast MAC addresses are allowed. Legal values for a VLAN ID are 1 through 4095. The MAC-based VLAN entry is enabled on the selected stack switch unit when you click on "Save". A MAC-based VLAN without any port members on any stack unit will be deleted when you click "Save". The button can be used to undo the addition of new MAC-based VLANs.
Buttons: Apply – Click to save changes. Reset- Click to undo any changes made locally and revert to previously saved values.

153
2-22.2 Protocol -based VLAN
This section describe Protocol -based VLAN, The Switch support Protocol include Ethernet LLC SNAP Protocol, LLC The Logical Link Control (LLC) data communication protocol layer is the upper sub-layer of the Data Link Layer (which is itself layer 2, just above the Physical Layer) in the seven-layer OSI reference model. It provides multiplexing mechanisms that make it possible for several network protocols (IP, IPX, Decent and Appletalk) to coexist within a multipoint network and to be transported over the same network media, and can also provide flow control and automatic repeat request (ARQ) error management mechanisms. SNAP The Subnetwork Access Protocol (SNAP) is a mechanism for multiplexing, on networks using IEEE 802.2 LLC, more protocols than can be distinguished by the 8-bit 802.2 Service Access Point (SAP) fields. SNAP supports identifying protocols by Ethernet type field values; it also supports vendor-private protocol identifier spaces. It is used with IEEE 802.3, IEEE 802.4, IEEE 802.5, IEEE 802.11 and other IEEE 802 physical network layers, as well as with non-IEEE 802 physical network layers such as FDDI that use 802.2 LLC.
2-22.2.1 Protocol to Group This page allows you to add new protocols to Group Name (unique for each Group) mapping entries as well as allow you to see and delete already mapped entries for the selected stack switch unit switch.
Web Interface To configure Protocol -based VLAN configuration in the web interface: 1. Click Protocol -based VLAN configuration and add new entry. 2. Specify the Ethernet LLC SNAP Protocol and Group Name. 3. Click Apply. Figure 2-22.2.1: The Protocol to Group Mapping Table
Parameter description: Delete :

154
To delete a Protocol to Group Name map entry, check this box. The entry will be deleted on the switch during the next Save.
Frame Type : Frame Type can have one of the following values: 1. Ethernet 2. LLC 3. SNAP
NOTE: On changing the Frame type field, valid value of the following text field will vary depending on the new frame type you selected.
Value :
Valid value that can be entered in this text field depends on the option selected from the the preceding Frame Type selection menu. Below is the criteria for three different Frame Types:
1. For Ethernet: Values in the text field when Ethernet is selected as a Frame Type is called etype. Valid values for etype ranges from 0x0600-0xffff
2. For LLC: Valid value in this case is comprised of two different sub-values. a. DSAP: 1-byte long string (0x00-0xff) b. SSAP: 1-byte long string (0x00-0xff)
3. For SNAP: Valid value in this case also is comprised of two different sub-values. a.OUI: OUI (Organizationally Unique Identifier) is value in format of xx-xx-xx where each pair (xx) in string is a hexadecimal value ranges from 0x00-0xff. b. PID: If the OUI is hexadecimal 000000, the protocol ID is the Ethernet type (EtherType) field value for the protocol running on top of SNAP; if the OUI is an OUI for a particular organization, the protocol ID is a value assigned by that organization to the protocol running on top of SNAP. In other words, if value of OUI field is 00-00-00 then value of PID will be etype (0x0600-0xffff) and if value of OUI is other than 00-00-00 then valid value of PID will be any value from 0x0000 to 0xffff.
Group Name : A valid Group Name is a unique 16-character long string for every entry which consists of a combination of alphabets (a-z or A-Z) and integers (0-9).
NOTE: Special character and underscore (_) are not allowed.
Adding a New Group to VLAN mapping entry :
Click to add a new entry in mapping table. An empty row is added to the table; Frame Type, Value and the Group Name can be configured as needed. The button can be used to undo the addition of new entry.
Buttons: Apply – Click to save changes. Reset- Click to undo any changes made locally and revert to previously saved values.

155
Upper right icon (Refresh): You can click them for refresh the Protocol Group Mapping information by manual.

156
2-22.2.2 Group to VLAN
This section allows you to map an already configured Group Name to a VLAN for the selected stack switch unit switch.
Web Interface
To Display Group Name to VLAN mapping table configured in the web interface: 1. Click Group Name VLAN configuration and add new entry. 2. Specify the Group Name and VLAN ID. 3. Click Apply.
Figure 2-22.2.2: The Group Name of VLAN Mapping Table
Parameter description: Delete :
To delete a Group Name to VLAN map entry, check this box. The entry will be deleted on the switch during the next Save
Group Name : A valid Group Name is a string of almost 16 characters which consists of a combination of alphabets (a-z or A-Z) and integers (0-9), no special character is allowed. Whichever Group name you try map to a VLAN must be present in Protocol to Group mapping table and must not be perused by any other existing mapping entry on this page.
VLAN ID : Indicates the ID to which Group Name will be mapped. A valid VLAN ID ranges from 1-4095.
Port Members : A row of check boxes for each port is displayed for each Group Name to VLAN ID mapping. To include a port in a mapping, check the box. To remove or exclude the port from the mapping, make sure the box is unchecked. By default, no ports are members, and all boxes are unchecked.
Adding a New Group to VLAN mapping entry : Click to add a new entry in mapping table. An empty row is added to the table, the Group Name, VLAN ID and port members can be configured as needed. Legal values for a VLAN ID are 1 through 4095. The button can be used to undo the addition of new entry.
Buttons:

157
Apply – Click to save changes. Reset- Click to undo any changes made locally and revert to previously saved values.
Auto-refresh : To evoke the auto-refresh icon then the device will refresh the information automatically.
Upper right icon (Refresh): You can click them for refresh the Protocol Group Mapping information by manual.
2-22.3 IP Subnet-based VLAN The IP subnet-based VLAN entries can be configured here. This page allows for adding, updating and deleting IP subnet-based VLAN entries and assigning the entries to different ports. This page shows only static entries.
Web Interface To Display IP subnet-based VLAN Membership to configured in the web interface: 1. Click VCL, Group Name VLAN configuration and add new entry. 2. Specify the VCE ID, IP Address, Mask Length, VLAN ID and select Port Members. 3. Click Apply. Figure 2-22.3: IP Subnet-based VLAN Membership Configuration
Parameter description: Delete
To delete a IP subnet-based VLAN entry, check this box and press save. The entry will be deleted on the selected switch in the stack.
VCE ID Indicates the index of the entry. It is user configurable. Its value ranges from 0-128. If a VCE ID is 0, application will auto-generate the VCE ID for that entry. Deletion and lookup of IP subnet-based VLAN are based on VCE ID.
IP Address Indicates the IP address.
Mask Length Indicates the network mask length.
VLAN ID Indicates the VLAN ID. VLAN ID can be changed for the existing entries.
Port Members

158
A row of check boxes for each port is displayed for each IP subnet-based VLAN entry. To include a port in a IP subnet-based VLAN, check the box. To remove or exclude the port from the IP subnet-based VLAN, make sure the box is unchecked. By default, no ports are members, and all boxes are unchecked.
Adding a New IP subnet-based VLAN Click “Add New Entry” to add a new IP subnet-based VLAN entry. An empty row is added to the table, and the IP subnet-based VLAN entry can be configured as needed. Any IP address/mask can be configured for the IP subnet-based VLAN entry. Legal values for a VLAN ID are 1 through 4095. The IP subnet-based VLAN entry is enabled on the selected stack switch unit when you click on "Save". The “Delete” button can be used to undo the addition of new IP subnet-based VLANs. The maximum possible IP subnet-based VLAN entries are limited to 128.

159
2-23 VOICE VLAN Voice VLAN is VLAN configured specially for voice traffic. By adding the ports with voice devices attached to voice VLAN, we can perform QoS-related configuration for voice data, ensuring the transmission priority of voice traffic and voice quality.
2-23.1 Configuration The Voice VLAN feature enables voice traffic forwarding on the Voice VLAN, then the switch can classify and schedule network traffic. It is recommended that there be two VLANs on a port - one for voice, one for data. Before connecting the IP device to the switch, the IP phone should configure the voice VLAN ID correctly. It should be configured through its own GUI.
Web Interface To configure Voice VLAN in the web interface: 1. Select “Enabled” in the Voice VLAN Configuration. 2. Specify VLAN ID Aging Time Traffic Class. 3. Specify (Port Mode, Security, Discovery Protocol)
in the Port Configuration 4. Click Apply.
Figure 2-23.1: The Voice VLAN Configuration

160
Parameter description: Mode :
Indicates the Voice VLAN mode operation. We must disable MSTP feature before we enable Voice VLAN. It can avoid the conflict of ingress filtering. Possible modes are: Enabled: Enable Voice VLAN mode operation. Disabled: Disable Voice VLAN mode operation.
VLAN ID : Indicates the Voice VLAN ID. It should be a unique VLAN ID in the system and cannot equal each port PVID. It is a conflict in configuration if the value equals management VID, MVR VID, PVID etc. The allowed range is 1 to 4095.
Aging Time : Indicates the Voice VLAN secure learning aging time. The allowed range is 10 to 10000000 seconds. It is used when security mode or auto detect mode is enabled. In other cases, it will be based on hardware aging time. The actual aging time will be situated between the [age_time; 2 * age_time] interval.
Traffic Class : Indicates the Voice VLAN traffic class. All traffic on the Voice VLAN will apply this class.
Port Mode : Indicates the Voice VLAN port mode. When the port mode isn't equal disabled, we must disable MSTP feature before we enable Voice VLAN. It can avoid the conflict of ingress filtering. Possible port modes are: Disabled: Disjoin from Voice VLAN. Auto: Enable auto detect mode. It detects whether there is VoIP phone attached to the specific port and configures the Voice VLAN members automatically. Forced: Force join to Voice VLAN.
Port Security : Indicates the Voice VLAN port security mode. When the function is enabled, all non-telephonic MAC addresses in the Voice VLAN will be blocked for 10 seconds. Possible port modes are: Enabled: Enable Voice VLAN security mode operation. Disabled: Disable Voice VLAN security mode operation.
Port Discovery Protocol : Indicates the Voice VLAN port discovery protocol. It will only work when auto detect mode is enabled. We should enable LLDP feature before configuring discovery protocol to "LLDP" or "Both". Changing the discovery protocol to "OUI" or "LLDP" will restart auto detect process. Possible discovery protocols are: OUI: Detect telephony device by OUI address. LLDP: Detect telephony device by LLDP. Both: Both OUI and LLDP.
Buttons: Apply – Click to save changes.

161
Reset- Click to undo any changes made locally and revert to previously saved values.
2-23.2 OUI The section describes to Configure VOICE VLAN OUI table. The maximum entry number is 16. Modifying the OUI table will restart auto detection of OUI process.
Web Interface
To configure Voice VLAN OUI Table in the web interface: 1. Select “Add new entry”, “delete” in the Voice VLAN OUI table.. 2. Specify Telephony OUI, Description. 3. Click Apply. Figure 2-23.2: The Voice VLAN OUI Table
Parameter description: Delete :
Check to delete the entry. It will be deleted during the next save. Telephony OUI :
A telephony OUI address is a globally unique identifier assigned to a vendor by IEEE. It must be 6 characters long and the input format is "xx-xx-xx" (x is a hexadecimal digit).
Description : The description of OUI address. Normally, it describes which vendor telephony device it belongs to. The allowed string length is 0 to 32.
Add New entry : Click to add a new entry in Voice VLAN OUI table. An empty row is added to the table, the Telephony OUI, Description.
Buttons: Apply – Click to save changes. Reset- Click to undo any changes made locally and revert to previously saved values.

162
2-24 Ethernet Services 2-24.1 Ports
This page displays current EVC port configurations. The settings can also be configured here.
Web Interface To configure Port Configuration in the web interface: 1. Click configuration, Ethernet Services and ports. 2. Specify DEI Mode, Tag Mode and Address Mode. 3. Click Apply. Figure 2-24.1: The Port Configuration
Parameter description:. Port
The logical port for the settings contained in the same row. DEI Mode
The DEI mode for an NNI port determines whether frames transmitted on the port will have the DEI field in the outer tag marked based on the colour of the frame. The allowed values are: Coloured: The DEI is 1 for yellow frames and 0 for green frames. Fixed: The DEI value is determined by ECE rules.
Tag Mode The tag mode specifying whether the EVC classification must be based on the outer or inner tag. This can be used on NNI ports connected to another service provider, where an outer "tunnel" tag is added together with the inner tag identifying the EVC. The allowed values are: Inner: Enable inner tag in EVC classification. Outer: Enable outer tag in EVC classification.
Address Mode The IP/MAC address mode specifying whether the EVC classification must be based on source (SMAC/SIP) or destination (DMAC/DIP) addresses. The allowed values are: Source: Enable SMAC/SIP matching. Destination: Enable DMAC/DIP matching.
Buttons:

163
Apply – Click to save changes. Reset- Click to undo any changes made locally and revert to previously saved values.
2-24.2 L2CP This page displays current EVC L2CP configurations. The settings can also be configured here.
Web Interface To configure L2CP Port Configuration in the web interface: 1. Click configuration, Ethernet Services and L2CP. 2. Specify DMAC and L2CP Mode. 3. Click Apply. Figure 2-24.2: The L2CP Port Configuration
Parameter description:. DMAC
The destination BPDU MAC addresses (01-80-C2-00-00-0X) and GARP (01-80-C2-00-00-2X) MAC addresses for the settings contained in the same row.
L2CP Mode The L2CP mode for the specific port. The possible values are: Peer: Allow to peer L2CP frames. Forward: Allow to forward L2CP frames.Buttons:
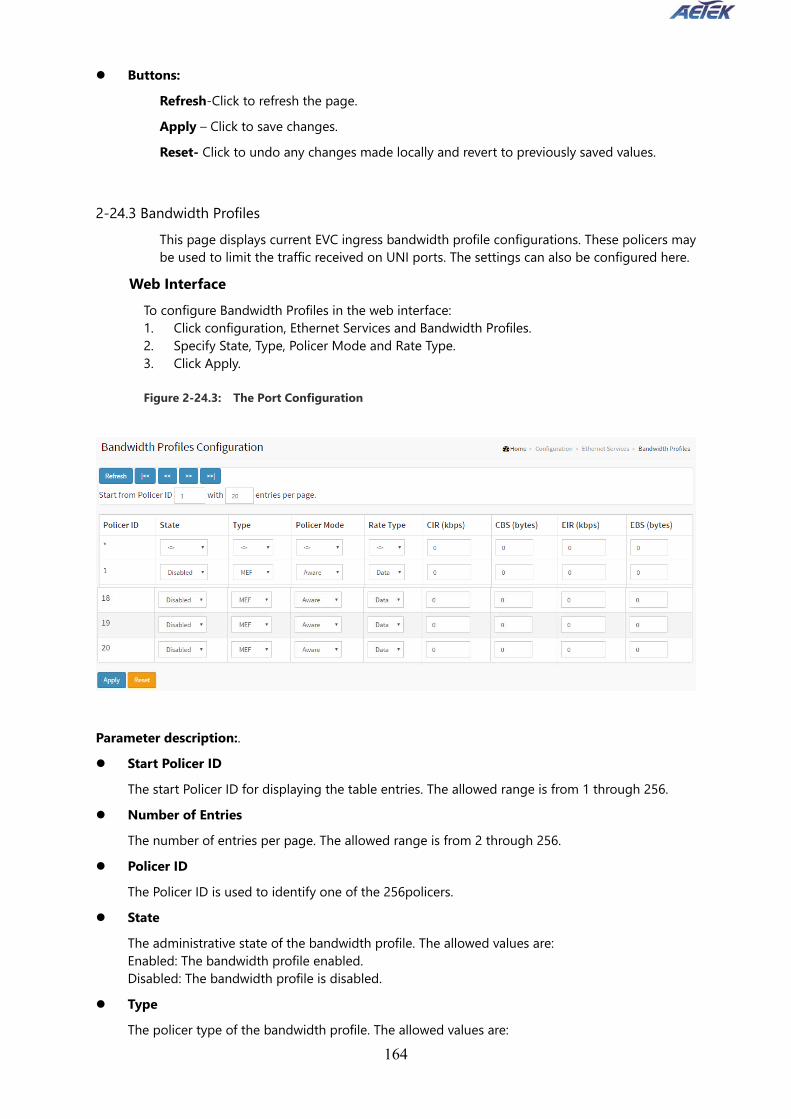
164
Buttons: Refresh-Click to refresh the page. Apply – Click to save changes. Reset- Click to undo any changes made locally and revert to previously saved values.
2-24.3 Bandwidth Profiles This page displays current EVC ingress bandwidth profile configurations. These policers may be used to limit the traffic received on UNI ports. The settings can also be configured here.
Web Interface To configure Bandwidth Profiles in the web interface: 1. Click configuration, Ethernet Services and Bandwidth Profiles. 2. Specify State, Type, Policer Mode and Rate Type. 3. Click Apply. Figure 2-24.3: The Port Configuration
Parameter description:. Start Policer ID
The start Policer ID for displaying the table entries. The allowed range is from 1 through 256. Number of Entries
The number of entries per page. The allowed range is from 2 through 256. Policer ID
The Policer ID is used to identify one of the 256policers. State
The administrative state of the bandwidth profile. The allowed values are: Enabled: The bandwidth profile enabled. Disabled: The bandwidth profile is disabled.
Type The policer type of the bandwidth profile. The allowed values are:

165
MEF: MEF ingress bandwidth profile. Single: Single bucket policer.
Policer Mode The colour mode of the bandwidth profile. The allowed values are: Coupled: Colour-aware mode with coupling enabled. Aware: Colour-aware mode with coupling disabled.
Rate Type The rate type of the bandwidth profile. The allowed values are: Data: Specify that this bandwidth profile operates on data rate. Line: Specify that this bandwidth profile operates on line rate.
CIR The Committed Information Rate of the bandwidth profile. The allowed range is from 0 through 10000000 kilobit per second.
CBS The Committed Burst Size of the bandwidth profile. The allowed range is from 0 through 100000bytes.
EIR The Excess Information Rate for MEF type bandwidth profile. The allowed range is from 0through 10000000 kilobit per second.
EBS The Excess Burst Size for MEF type bandwidth profile. The allowed range is from 0 through 100000 bytes..
Buttons:
Refresh- Refreshes the displayed table starting from the input fields.
|<<- Updates the table, starting with the first entry in the table.
<<- Updates the table, ending at the entry before the first entry currently displayed.
>>- Updates the table, starting with the entry after the last entry currently displayed.
>>|- Updates the table, ending at the last entry in the table.
Apply- Click to save changes.
Reset- Click to undo any changes made locally and revert to previously saved values.
2-24.4 EVCs This page displays current EVC configurations. On this system, only Provider Bridge based EVCs are supported.
Web Interface To configure EVCs Control list Configuration in the web interface: 1. Click configuration, Ethernet Services and EVCs. 2. Specify EVC ID, VID, IVID, Learning, Inner Tag and Outer Tag.

166
3. Click Apply. Figure 2-24.4: The EVCs
Parameter description:. EVC ID
The EVC ID identifies the EVC. The range is from 1through 256. VID
The VLAN ID in the PB network. It may be inserted in a C-tag, S-tag or S-custom tag depending on the NNI port VLAN configuration. The range is from 1through 4095.
IVID The Internal/classified VLAN ID in the PB network. The range is from 1 through 4095.

167
Learning The learning mode for the EVC controls whether source MAC addresses are learned for frames matching the EVC. Learning may be disabled if the EVC only includes two UNI/NNI ports. The possible values are: Enabled: Learning is enabled (MAC addresses are learned). Disabled: Learning is disabled (MAC addresses are not learned).
Inner Tag Type The inner tag type is used to determine whether an inner tag is inserted in frames forwarded to NNI ports. The possible values are: None: An inner tag is not inserted. C-tag: An inner C-tag is inserted. S-tag: An inner S-tag is inserted. S-custom-tag: An inner tag is inserted and the tag type is determined by the VLAN port configuration of the NNI.
Inner VID Mode The inner VID Mode affects the VID in the inner and outer tag. The possible values are: Normal: The VID of the two outer tags aren't swapped. Tunnel: The VID of the two outer tags are swapped, so that the VID of the outer tag is taken from the Inner Tag configuration and the VID of the inner tag is the EVC VID. In this mode, the NNI ports are normally configured to do EVC classification based on the inner tag.
Inner Tag VID The Inner tag VLAN ID. The allowed range is from 0 through 4095.
Inner Tag PCP/DEI Preservation The inner tag PCP and DEI preservation. The possible values are: Preserved: The inner tag PCP and DEI is preserved. Fixed: The inner tag PCP and DEI is fixed.
Inner Tag PCP The inner tag PCP value. The allowed range is from 0 through 7.
Inner Tag DEI The inner tag DEI value. The allowed value is 0 or 1.
Outer Tag VID The EVC outer tag VID for UNI ports. The allowed range is from 0 through 4095.
NNI Ports The list of Network to Network Interfaces for the EVC.
Modification Buttons:
You can modify each EVC in the table using the following buttons: : Edits the EVC row. : Deletes the EVC. : Adds new EVC.
Buttons: Refresh –Click to refresh the page. Remove All- Click to remove all EVCs.

168
2-24.5 ECEs This page displays the current EVC Control Entries (ECEs). The settings can also be configured here.
Web Interface To configure ECE Control List Configuration in the web interface: 1. Click configuration, Ethernet Services and ECEs. 2. Specify ECE ID, Ingress Matching, Actions and Egress outer Tag. 3. Click Apply. Figure 2-24.5: The ECEs

169
Parameter description:. ECE ID
The ECE ID identifies the ECE. Unique ECE IDs are automatically assigned to ECEs added. The possible range is from 1 through 256
Ingress Matching UNI Ports
The list of User Network Interfaces for the ECE. Tag Type
The tag type for the ECE. The possible values are: Any: The ECE will match both tagged and untagged frames. Untagged: The ECE will match untagged frames only. C-Tagged: The ECE will match custom tagged frames only. S-Tagged: The ECE will match service tagged frames only. Tagged: The ECE will match tagged frames only.
VID The VLAN ID for the ECE. It only significant if tag type 'Tagged' is selected. The possible values are: Specific: The range is from 0 through 4095. Any: The ECE will match any VLAN ID.
PCP The PCP value for the ECE. It only significant if tag type 'Tagged' is selected. The possible values are: Specific: The ECE will match a specific PCP in the range 0 through 7. Range: The ECE will match PCP values in the selected range 0-1, 2-3, 4-5, 6-7, 0-3or 4-7. Any: The ECE will match any PCP value.
DEI The DEI value for the ECE. It only significant if tag type 'Tagged' is selected. The possible values is: 0, 1 or Any.
Frame Type The frame type for the ECE. The possible values are: Any: The ECE will match any frame type. IPv4: The ECE will match IPv4 frames only. IPv6: The ECE will match IPv6 frames only.
Actions Direction

170
The EVCs and ECEs are used to setup flows in one or both directions as determined by the ECE Direction parameter. If the ECE is bidirectional, the ingress rules of the NNI ports will be setup to match the traffic being forwarded to NNI ports. Possible values are: Both: Bidirectional. UNI-to-NNI: Unidirectional from UNI to NNI. NNI-to-UNI: Unidirectional from NNI to UNI.
EVC ID The EVC ID for the ECE. The ECE is only active when mapping to an existing EVC. Possible values are: Specific: The range is from 1 through 256. None: The ECE does not map to an EVC.
Tag Pop Count The ingress tag pop count for the ECE. The possible range is from 0 through 2.
Policy ID The ACL Policy ID for the ECE. The range is from 0 through 255.
Class The traffic class for the ECE. The range is from 0through 7.
Egress Outer Tag Outer Tag Mode
The outer tag for nni-to-uni direction for the ECE. The possible values are: Enable: Enable outer tag for nni-to-uni direction for the ECE. Disable: Disable outer tag for nni-to-uni direction for the ECE.
Outer Tag PCP/DEI Preservation The outer tag PCP and DEI preservation for the ECE. The possible values are: Preserved: The outer tag PCP and DEI are preserved. Disable: The outer tag PCP and DEI are fixed.
Outer Tag PCP The outer tag PCP value for the ECE. The possible range is from 0 through 7.
Outer Tag DEI The outer tag DEI value for the ECE. The possible value is 0 or 1.
Conflict Indicates the hardware status of the specific ECE. The specific ECE is not applied to the hardware due to hardware limitations.
Modification Buttons
You can modify each ECE (EVC Control Entry) in the table using the following buttons:
: Inserts a new ECE before the current row.
: Edits the ECE row.
: Moves the ECE up the list.
: Moves the ECE down the list.
: Deletes the ECE.
: The lowest plus sign adds a new entry at the bottom of the ECE listings. Buttons:

171
Refresh –Click to refresh the page. Remove All- Click to remove all ECEs.
2-25 QoS The switch support four QoS queues per port with strict or weighted fair queuing scheduling. It supports QoS Control Lists (QCL) for advance programmable QoS classification, based on IEEE 802.1p, Ethertype, VID, IPv4/IPv6 DSCP and UDP/TCP ports and ranges. High flexibility in the classification of incoming frames to a QoS class. The QoS classification looks for information up to Layer 4, including IPv4 and IPv6 DSCP, IPv4 TCP/UDP port numbers, and user priority of tagged frames. This QoS classification mechanism is implemented in a QoS control list (QCL). The QoS class assigned to a frame is used throughout the device for providing queuing, scheduling, and congestion control guarantees to the frame according to what was configured for that specific QoS class. The switch support advanced memory control mechanisms providing excellent performance of all QoS classes under any traffic scenario, including jumbo frame. A super priority queue with dedicated memory and strict highest priority in the arbitration. The ingress super priority queue allows traffic recognized as CPU traffic to be received and queued for transmission to the CPU even when all the QoS class queues are congested.
2-25.1 Port Classification The section allows you to configure the basic QoS Ingress Classification settings for all switch ports. and the settings relate to the currently selected stack unit, as reflected by the page header.
Web Interface
To configure the QoS Port Classification parameters in the web interface: 1. Click Configuration, QoS, Port Classification 2. Scroll to select QoS class, DP Level, PCP and DEI parameters 3. Click the save to save the setting 4. If you want to cancel the setting then you need to click the Reset button.
It will revert to previously saved values Figure 2-25.1: The QoS Configuration
172
Parameter description: Port :
The port number for which the configuration below applies. CoS :
Controls the default class of service. All frames are classified to a CoS. There is a one to one mapping between CoS, queue and priority. A CoS of 0 (zero) has the lowest priority. If the port is VLAN aware, the frame is tagged and Tag Class. is enabled, then the frame is classified to a CoS that is mapped from the PCP and DEI value in the tag. Otherwise the frame is classified to the default CoS. The classified CoS can be overruled by a QCL entry. Note: If the default CoS has been dynamically changed, then the actual default CoS is shown in parentheses after the configured default CoS.
DPL : Controls the default drop precedence level. All frames are classified to a drop precedence level. If the port is VLAN aware, the frame is tagged and Tag Class. is enabled, then the frame is classified to a DPL that is mapped from the PCP and DEI value in the tag. Otherwise the frame is classified to the default DPL. The classified DPL can be overruled by a QCL entry.
PCP : Controls the default PCP value. All frames are classified to a PCP value. If the port is VLAN aware and the frame is tagged, then the frame is classified to the PCP value in the tag. Otherwise the frame is classified to the default PCP value.
DEI : Controls the default DEI value. All frames are classified to a DEI value. If the port is VLAN aware and the frame is tagged, then the frame is classified to the DEI value in the tag. Otherwise the frame is classified to the default DEI value.
Tag Class. : Shows the classification mode for tagged frames on this port. Disabled: Use default QoS class and DP level for tagged frames. Enabled: Use mapped versions of PCP and DEI for tagged frames. Click on the mode in order to configure the mode and/or mapping.
NOTE: This setting has no effect if the port is VLAN unaware. Tagged frames received on VLAN unaware ports are always classified to the default CoS and DPL.
DSCP Based :
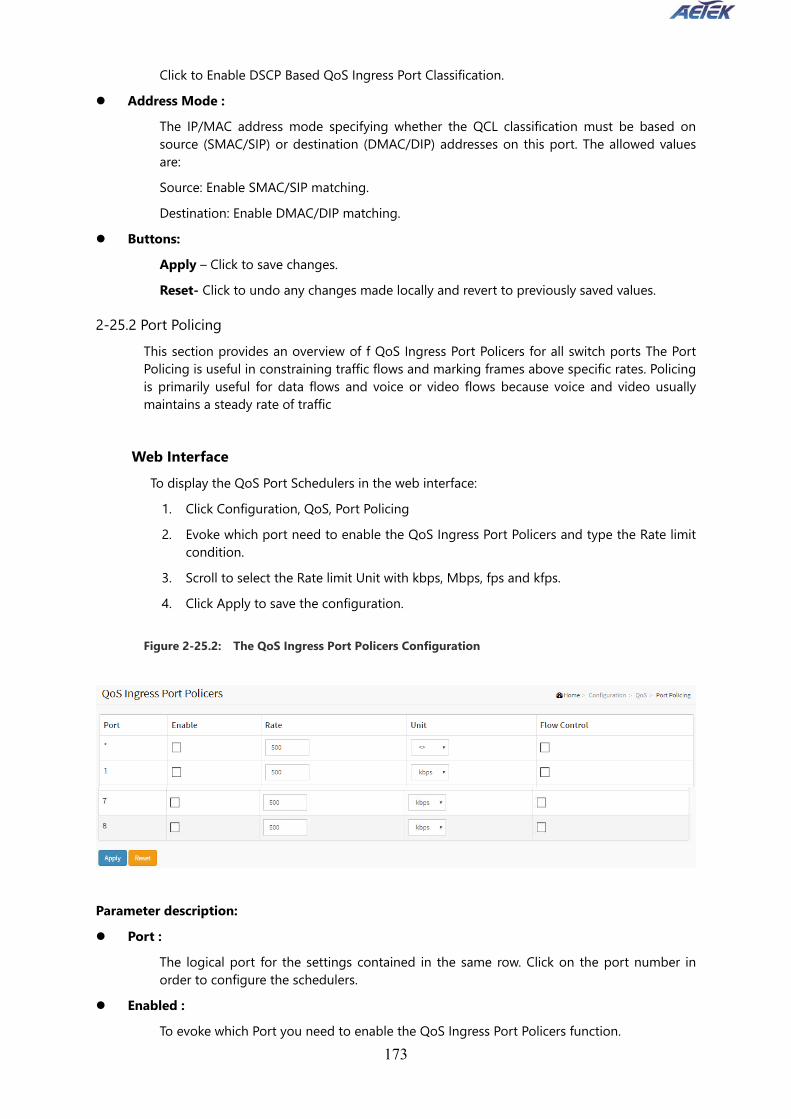
173
Click to Enable DSCP Based QoS Ingress Port Classification. Address Mode :
The IP/MAC address mode specifying whether the QCL classification must be based on source (SMAC/SIP) or destination (DMAC/DIP) addresses on this port. The allowed values are: Source: Enable SMAC/SIP matching. Destination: Enable DMAC/DIP matching.
Buttons: Apply – Click to save changes. Reset- Click to undo any changes made locally and revert to previously saved values.
2-25.2 Port Policing This section provides an overview of f QoS Ingress Port Policers for all switch ports The Port Policing is useful in constraining traffic flows and marking frames above specific rates. Policing is primarily useful for data flows and voice or video flows because voice and video usually maintains a steady rate of traffic
Web Interface To display the QoS Port Schedulers in the web interface:
1. Click Configuration, QoS, Port Policing 2. Evoke which port need to enable the QoS Ingress Port Policers and type the Rate limit
condition. 3. Scroll to select the Rate limit Unit with kbps, Mbps, fps and kfps. 4. Click Apply to save the configuration.
Figure 2-25.2: The QoS Ingress Port Policers Configuration
Parameter description: Port :
The logical port for the settings contained in the same row. Click on the port number in order to configure the schedulers.
Enabled : To evoke which Port you need to enable the QoS Ingress Port Policers function.

174
Rate : To set the Rate limit value for this port, the default is 500.
Unit : To scroll to select what unit of rate includes kbps, Mbps, fps and kfps. The default is kbps.
Flow Control : If flow control is enabled and the port is in flow control mode, then pause frames are sent instead of discarding frames.
Buttons: Apply – Click to save changes. Reset- Click to undo any changes made locally and revert to previously saved values.
2-25.3 Queue Policing This page allows you to configure the Queue Policer settings for all switch ports. The displayed settings are:
Web Interface To display the Queue Policing in the web interface:
1. Click Configuration, QoS and Queue Policing 2. Specify the Queue Policing parameter.
Figure 2-25.3: The Queue Policing
Parameter description: Port
The port number for which the configuration below applies. Enable (E)
Enable or disable the queue policer for this switch port. Rate
Controls the rate for the queue policer. This value is restricted to 100-3276700 when "Unit" is kbps, and 1-3276 when "Unit" is Mbps. The rate is internally rounded up to the nearest value supported by the queue policer. This field is only shown if at least one of the queue policers are enabled.

175
Unit Controls the unit of measure for the queue policer rate as kbps or Mbps. This field is only shown if at least one of the queue policers are enabled.
Buttons: Apply – Click to save changes. Reset- Click to undo any changes made locally and revert to previously saved values.
2-25.4 Port Scheduler This section provides an overview of QoS Egress Port Schedulers for all switch ports. and the ports belong to the currently selected stack unit, as reflected by the page header.
Web Interface To display the QoS Port Schedulers in the web interface:
1. Click Configuration, QoS, Port Schedulers 2. Display the QoS Egress Port Schedulers
Figure 2-25.4: The QoS Egress Port Schedules
ClickthePortindextosettheQoSEgressPortSchedulers
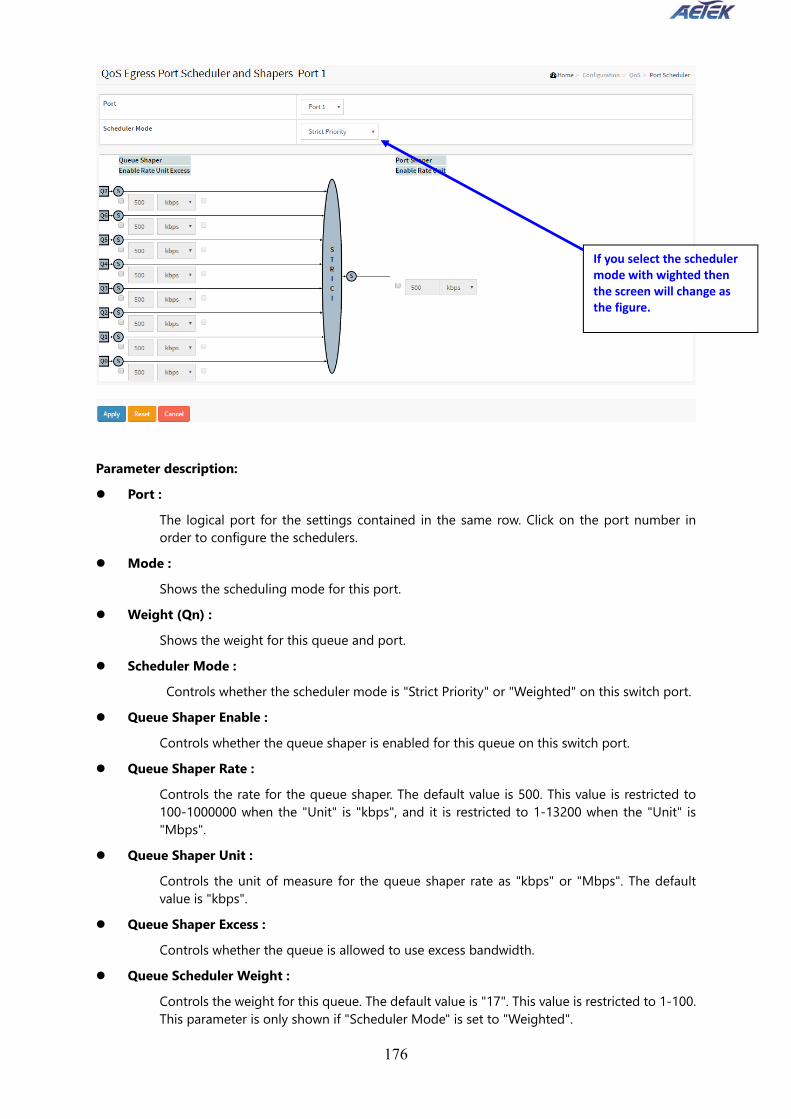
176
Parameter description: Port :
The logical port for the settings contained in the same row. Click on the port number in order to configure the schedulers.
Mode : Shows the scheduling mode for this port.
Weight (Qn) : Shows the weight for this queue and port.
Scheduler Mode : Controls whether the scheduler mode is "Strict Priority" or "Weighted" on this switch port.
Queue Shaper Enable : Controls whether the queue shaper is enabled for this queue on this switch port.
Queue Shaper Rate : Controls the rate for the queue shaper. The default value is 500. This value is restricted to 100-1000000 when the "Unit" is "kbps", and it is restricted to 1-13200 when the "Unit" is "Mbps".
Queue Shaper Unit : Controls the unit of measure for the queue shaper rate as "kbps" or "Mbps". The default value is "kbps".
Queue Shaper Excess : Controls whether the queue is allowed to use excess bandwidth.
Queue Scheduler Weight : Controls the weight for this queue. The default value is "17". This value is restricted to 1-100. This parameter is only shown if "Scheduler Mode" is set to "Weighted".
If you select the scheduler mode with wighted then the screen will change as the figure.

177
Queue Scheduler Percent : Shows the weight in percent for this queue. This parameter is only shown if "Scheduler Mode" is set to "Weighted"
Port Shaper Enable : Controls whether the port shaper is enabled for this switch port.
Port Shaper Rate : Controls the rate for the port shaper. The default value is 500. This value is restricted to 100-1000000 when the "Unit" is "kbps", and it is restricted to 1-13200 when the "Unit" is "Mbps".
Port Shaper Unit : Controls the unit of measure for the port shaper rate as "kbps" or "Mbps". The default value is "kbps".
Buttons: Apply – Click to save changes. Reset- Click to undo any changes made locally and revert to previously saved values.

178
2-25.5 Port Shaping This section provides an overview of QoS Egress Port Shapers for all switch ports. Others the user could get all detail information ot the ports belong to the currently selected stack unit, as reflected by the page header.
Web Interface
To display the QoS Port Shapers in the web interface: 1. Click Configuration, QoS, Port Shapers 2. Display the QoS Egress Port Shapers
Figure 2-25.5: The QoS Egress Port Shapers
Parameter description: Port :
The logical port for the settings contained in the same row. Click on the port number in order to configure the shapers.
If you select the scheduler mode with wighted then the screen will change as the figure.
ClickthePortindextosettheQoSEgressPortShapers

179
Mode : Shows the scheduling mode for this port.
Shapers (Qn) : Shows "disabled" or actual queue shaper rate - e.g. "800 Mbps".
Scheduler Mode : Controls whether the scheduler mode is "Strict Priority" or "Weighted" on this switch port.
Queue Shaper Enable : Controls whether the queue shaper is enabled for this queue on this switch port.
Queue Shaper Rate : Controls the rate for the queue shaper. The default value is 500. This value is restricted to 100-1000000 when the "Unit" is "kbps", and it is restricted to 1-13200 when the "Unit" is "Mbps".
Queue Shaper Unit : Controls the unit of measure for the queue shaper rate as "kbps" or "Mbps". The default value is "kbps".
Queue Shaper Excess : Controls whether the queue is allowed to use excess bandwidth.
Queue Scheduler Weight : Controls the weight for this queue. The default value is "17". This value is restricted to 1-100. This parameter is only shown if "Scheduler Mode" is set to "Weighted".
Queue Scheduler Percent : Shows the weight in percent for this queue. This parameter is only shown if "Scheduler Mode" is set to "Weighted"
Port Shaper Enable : Controls whether the port shaper is enabled for this switch port.
Port Shaper Rate : Controls the rate for the port shaper. The default value is 500. This value is restricted to 100-1000000 when the "Unit" is "kbps", and it is restricted to 1-13200 when the "Unit" is "Mbps".
. Port Shaper Unit : Controls the unit of measure for the port shaper rate as "kbps" or "Mbps". The default value is "kbps".
. Buttons: Apply – Click to save changes. Reset- Click to undo any changes made locally and revert to previously saved values.

180
2-25.6 Port Tag Remarking The Section provides user to get an overview of QoS Egress Port Tag Remarking for all switch ports. Others the ports belong to the currently selected stack unit, as reflected by the page header. .
Web Interface
To display the QoS Port Tag Remarking in the web interface: 1. Click Configuration, QoS, Port Tag Remarking
Figure 2-25.6: The Port Tag Remarking
ClickthePortindextosettheQoSPortTagRemarking

181
Parameter description: Mode :
Controls the tag remarking mode for this port. Classified: Use classified PCP/DEI values. Default: Use default PCP/DEI values. Mapped: Use mapped versions of QoS class and DP level.
PCP/DEI Configuration :

182
Controls the default PCP and DEI values used when the mode is set to Default. (QoS class, DP level) to (PCP, DEI) Mapping :
Controls the mapping of the classified (QoS class, DP level) to (PCP, DEI) values when the mode is set to Mapped.
Buttons: Apply – Click to save changes. Reset- Click to undo any changes made locally and revert to previously saved values. Cancel – Click to cancel the changes.

183
2-25.7 Port DSCP The section will teach user to set the QoS Port DSCP configuration that was allowed you to configure the basic QoS Port DSCP Configuration settings for all switch ports. Others the settings relate to the currently selected stack unit, as reflected by the page header.
Web Interface
To configure the QoS Port DSCP parameters in the web interface: 1. Click Configuration, QoS, Port DSCP 2. Evoke to enable or disable the Ingress Translate and Scroll the Classify
Parameter configuration 3. Scroll to select Egress Rewrite parameters 4. Click the save to save the setting 5. If you want to cancel the setting then you need to click the Reset button.
It will revert to previously saved values Figure 2-25.7: The QoS Port DSCP Configuration
Parameter description: Port :
The Port coulmn shows the list of ports for which you can configure dscp ingress and egress settings.
Ingress : In Ingress settings you can change ingress translation and classification settings for individual ports. There are two configuration parameters available in Ingress:
3. Translate : To Enable the Ingress Translation click the checkbox 4. Classify: Classification for a port have 4 different values
Disable: No Ingress DSCP Classification. DSCP=0: Classify if incoming (or translated if enabled) DSCP is 0. Selected: Classify only selected DSCP for which classification is enabled as specified in
DSCP Translation window for the specific DSCP. All: Classify all DSCP.

184
Egress : Port Egress Rewriting can be one of below parameters
Disable: No Egress rewrite. Enable: Rewrite enable without remapped. Remap: DSCP from analyzer is remapped and frame is remarked with remapped
DSCP value.
Buttons: Apply – Click to save changes. Reset- Click to undo any changes made locally and revert to previously saved values.
Auto-refresh : To evoke the auto-refresh icon then the device will refresh the information automatically.
Upper right icon (Refresh): You can click them for refresh the QoS Port DSCP information by manual.
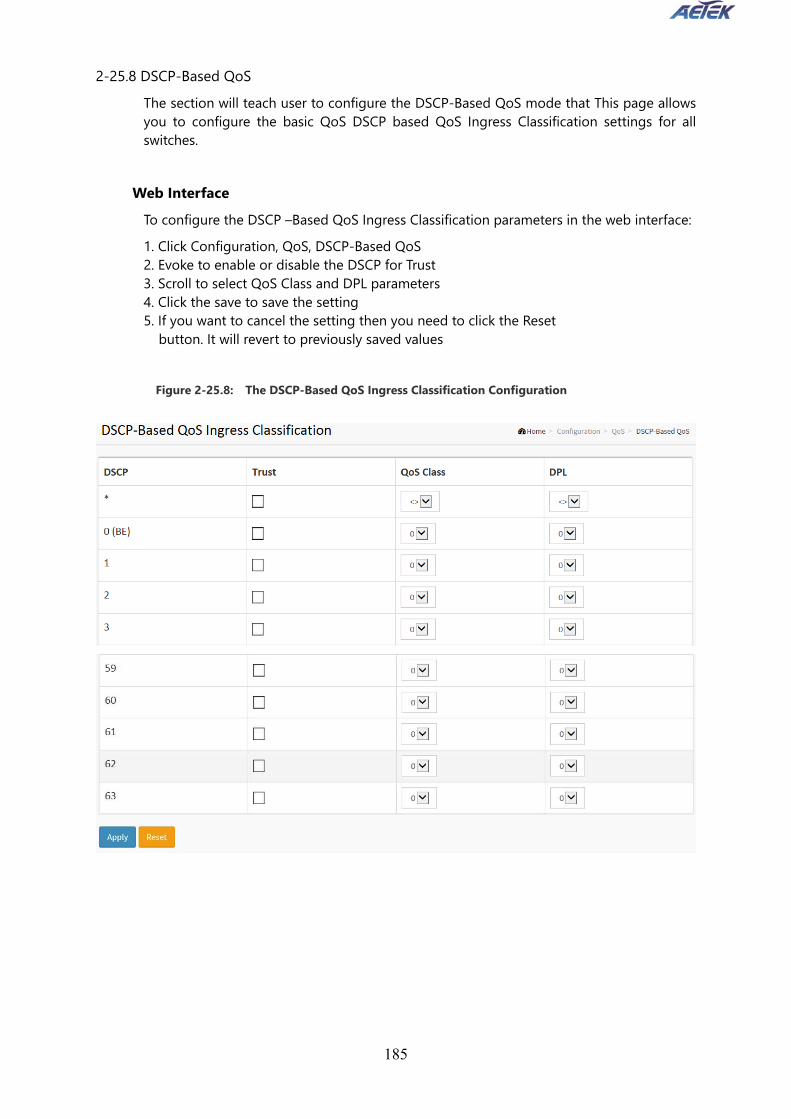
185
2-25.8 DSCP-Based QoS The section will teach user to configure the DSCP-Based QoS mode that This page allows you to configure the basic QoS DSCP based QoS Ingress Classification settings for all switches.
Web Interface To configure the DSCP –Based QoS Ingress Classification parameters in the web interface: 1. Click Configuration, QoS, DSCP-Based QoS 2. Evoke to enable or disable the DSCP for Trust 3. Scroll to select QoS Class and DPL parameters 4. Click the save to save the setting 5. If you want to cancel the setting then you need to click the Reset
button. It will revert to previously saved values
Figure 2-25.8: The DSCP-Based QoS Ingress Classification Configuration

186
Parameter description: DSCP :
Maximum number of support ed DSCP values are 64. Trust :
Click to check if the DSCP value is trusted. QoS Class :
QoS Class value can be any of (0-7) DPL :
Drop Precedence Level (0-3) Buttons:
Apply – Click to save changes. Reset- Click to undo any changes made locally and revert to previously saved values.
Auto-refresh : To evoke the auto-refresh icon then the device will refresh the information automatically.
Upper right icon (Refresh): You can click them for refresh the DSCP-Based QoS Ingress Classification information by manual.
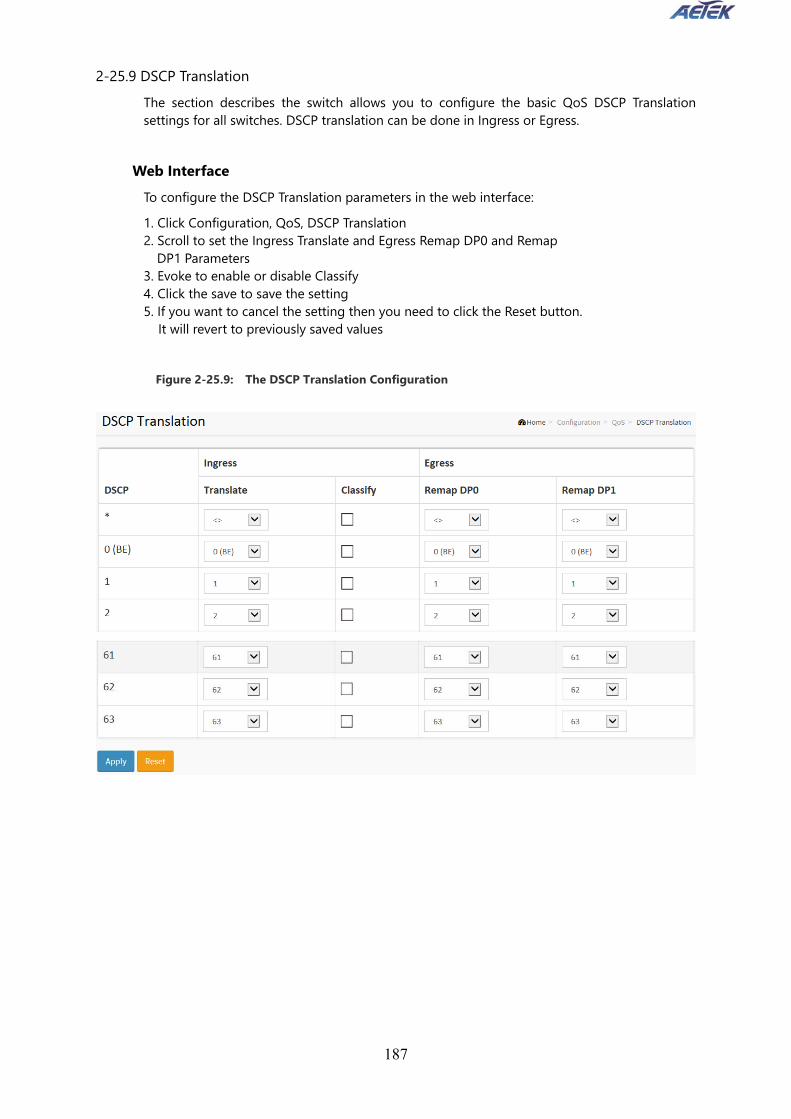
187
2-25.9 DSCP Translation The section describes the switch allows you to configure the basic QoS DSCP Translation settings for all switches. DSCP translation can be done in Ingress or Egress.
Web Interface To configure the DSCP Translation parameters in the web interface: 1. Click Configuration, QoS, DSCP Translation 2. Scroll to set the Ingress Translate and Egress Remap DP0 and Remap
DP1 Parameters 3. Evoke to enable or disable Classify 4. Click the save to save the setting 5. If you want to cancel the setting then you need to click the Reset button.
It will revert to previously saved values Figure 2-25.9: The DSCP Translation Configuration

188
Parameter description: DSCP :
Maximum number of supported DSCP values are 64 and valid DSCP value ranges from 0 to 63.
Ingress : Ingress side DSCP can be first translated to new DSCP before using the DSCP for QoS class and DPL map. There are two configuration parameters for DSCP Translation –
1. Translate : DSCP at Ingress side can be translated to any of (0-63) DSCP values. 2. Classify : Click to enable Classification at Ingress side.
Egress :
There are following configurable parameters for Egress side – 1. Remap DP0 : Select the DSCP value from select menu to which you want to
remap. DSCP value ranges from 0 to 63 2. Remap DP1 : Select the DSCP value from select menu to which you want to
remap. DSCP value ranges from 0 to 63. There is following configurable parameter for Egress side -
Remap: Select the DSCP value from select menu to which you want to remap. DSCP value ranges from 0 to 63.
Buttons: Apply – Click to save changes. Reset- Click to undo any changes made locally and revert to previously saved values.
Auto-refresh : To evoke the auto-refresh icon then the device will refresh the information automatically.
Upper right icon (Refresh): You can click them for refresh the DSCP Translation information by manual.

189
2-25.10 DSCP Classification The section describes to teach user to configure and allows you to map DSCP value to a QoS Class and DPL value. Others the settings relate to the currently selected stack unit, as reflected by the page header.
Web Interface To configure the DSCP Classification parameters in the web interface: 1. Click Configuration, QoS, DSCP Translation 2. Scroll to set the DSCP Parameters 3. Click the save to save the setting 4. If you want to cancel the setting then you need to click the Reset button.
It will revert to previously saved values
Figure 2-25.10: The DSCP Classification Configuration
Parameter description: QoS Class :
Available QoS Class value ranges from 0 to 7. QoS Class (0-7) can be mapped to followed parameters.
DSCP : Select DSCP value (0-63) from DSCP menu to map DSCP to corresponding QoS Class and DPL value
Buttons: Apply – Click to save changes. Reset- Click to undo any changes made locally and revert to previously saved values.
Auto-refresh :

190
To evoke the auto-refresh icon then the device will refresh the information automatically. Upper right icon (Refresh):
You can click them for refresh the DSCP Classification information by manual.

191
2-25.11 QoS Control List The section shows the QoS Control List (QCL), which is made up of the QCEs. Each row describes a QCE that is defined. The maximum number of QCEs is 256 on each switch. Click on the lowest plus sign to add a new QCE to the list.
Web Interface To configure the QoS Control List parameters in the web interface: 1. Click Configuration, QoS, QoS Contol List 2. Click the to add a new QoS Control List 3. Scroll all parameters and evoke the Port Member to join the QCE rules 4. Click the save to save the setting 5. If you want to cancel the setting then you need to click the Reset button.
It will revert to previously saved values Figure 2-25.11: The QoS Control List Configuration

192
Parameter description: QCE# :
Indicates the index of QCE. Port :
Indicates the list of ports configured with the QCE. DMAC :
Indicates the destination MAC address. Possible values are: Any: Match any DMAC. Unicast: Match unicast DMAC. Multicast: Match multicast DMAC. Broadcast: Match broadcast DMAC. <MAC>: Match specific DMAC. The default value is 'Any'.
SMAC : Match specific source MAC address or 'Any'. If a port is configured to match on DMAC/DIP, this field indicates the DMAC.
Tag Type : Indicates tag type. Possible values are: Any: Match tagged and untagged frames. Untagged: Match untagged frames. Tagged: Match tagged frames. C-Tagged: Match C-tagged frames. S-Tagged: Match S-tagged frames. The default value is 'Any'.
VID : Indicates (VLAN ID), either a specific VID or range of VIDs. VID can be in the range 1-4095 or 'Any'
PCP : Priority Code Point: Valid values of PCP are specific (0, 1, 2, 3, 4, 5, 6, 7) or range(0-1, 2-3, 4-5, 6-7, 0-3, 4-7) or 'Any'.
DEI : Drop Eligible Indicator: Valid value of DEI are 0, 1 or 'Any'.
Frame Type :

193
Indicates the type of frame to look for incoming frames. Possible frame types are: Any: The QCE will match all frame type. Ethernet: Only Ethernet frames (with Ether Type 0x600-0xFFFF) are allowed. LLC: Only (LLC) frames are allowed. SNAP: Only (SNAP) frames are allowed IPv4: The QCE will match only IPV4 frames. IPv6: The QCE will match only IPV6 frames.
Action : Indicates the classification action taken on ingress frame if parameters configured are matched with the frame's content. There are three action fields: Class, DPL and DSCP. Class: Classified QoS Class; if a frame matches the QCE it will be put in the queue. DPL: Drop Precedence Level; if a frame matches the QCE then DP level will set to value displayed under DPL column. DSCP: If a frame matches the QCE then DSCP will be classified with the value displayed under DSCP column.
Modification Buttons : You can modify each QCE (QoS Control Entry) in the table using the following buttons:
: Inserts a new QCE before the current row.
: Edits the QCE.
: Moves the QCE up the list.
: Moves the QCE down the list.
: Deletes the QCE.
: The lowest plus sign adds a new entry at the bottom of the QCE listings. Port Members :
Check the checkbox button in case you what to make any port member of the QCL entry. By default all ports will be checked
Key Parameters : Key configuration are described as below: Tag Value of Tag field can be 'Any', 'Untag' or 'Tag' VID Valid value of VLAN ID can be any value in the range 1-4095 or 'Any'; user can enter either a specific value or a range of VIDs PCP Priority Code Point: Valid value PCP are specific (0, 1, 2, 3, 4, 5, 6, 7) or range (0-1, 2-3, 4-5, 6-7, 0-3, 4-7) or 'Any' DEI Drop Eligible Indicator: Valid value of DEI can be any of values between 0, 1 or 'Any' SMAC Source MAC address: 24 MS bits (OUI) or 'Any' DMAC Type Destination MAC type: possible values are unicast (UC), multicast (MC), broadcast (BC) or 'Any' Frame Type Frame Type can have any of the following values

194
1. Any 2. Ethernet 3. LLC 4. SNAP 5. IPv4 6. IPv6
NOTE: All frame types are explained below: 1. Any: Allow all types of frames. 2. Ethernet: Ethernet Type Valid Ethernet type can have value within 0x600-0xFFFF or 'Any', default value is 'Any'. 3. LLC: SSAP Address Valid SSAP(Source Service Access Point) can vary from 0x00 to 0xFF or 'Any', the default value is 'Any' DSAP Address Valid DSAP(Destination Service Access Point) can vary from 0x00 to 0xFF or 'Any', the default value is 'Any' Control Address Valid Control Address can vary from 0x00 to 0xFF or 'Any', the default value is 'Any' 4. SNAP : PID Valid PID(a.k.a Ethernet type) can have value within 0x00-0xFFFF or 'Any', default value is 'Any' 5. IPv4: Protocol IP protocol number: (0-255, TCP or UDP) or 'Any' Source IP Specific Source IP address in value/mask format or 'Any'. IP and Mask are in the format x.y.z.w where x, y, z, and w are decimal numbers between 0 and 255. When Mask is converted to a 32-bit binary string and read from left to right, all bits following the first zero must also be zero DSCP Diffserv Code Point value (DSCP): It can be specific value, range of value or 'Any'. DSCP values are in the range 0-63 including BE, CS1-CS7, EF or AF11-AF43 IP Fragment IPv4 frame fragmented option: yes|no|any Sport Source TCP/UDP port:(0-65535) or 'Any', specific or port range applicable for IP protocol UDP/TCP Dport Destination TCP/UDP port:(0-65535) or 'Any', specific or port range applicable for IP protocol UDP/TCP 6. IPv6 :Protocol IP protocol number: (0-255, TCP or UDP) or 'Any' Source IP IPv6 source address: (a.b.c.d) or 'Any', 32 LS bits DSCP Diffserv Code Point value (DSCP): It can be specific value, range of value or 'Any'. DSCP values are in the range 0-63 including BE, CS1-CS7, EF or AF11-AF43 Sport Source TCP/UDP port:(0-65535) or 'Any', specific or port range applicable for IP protocol UDP/TCP Dport Destination TCP/UDP port:(0-65535) or 'Any', specific or port range applicable for IP protocol UDP/TCP
Action Configuration :
Class QoS Class: "class (0-7)", default- basic classification DP Valid DP Level can be (0-3)", default- basic classification DSCP Valid dscp value can be (0-63, BE, CS1-CS7, EF or AF11-AF43)

195
Buttons: Apply – Click to save changes. Reset- Click to undo any changes made locally and revert to previously saved values.
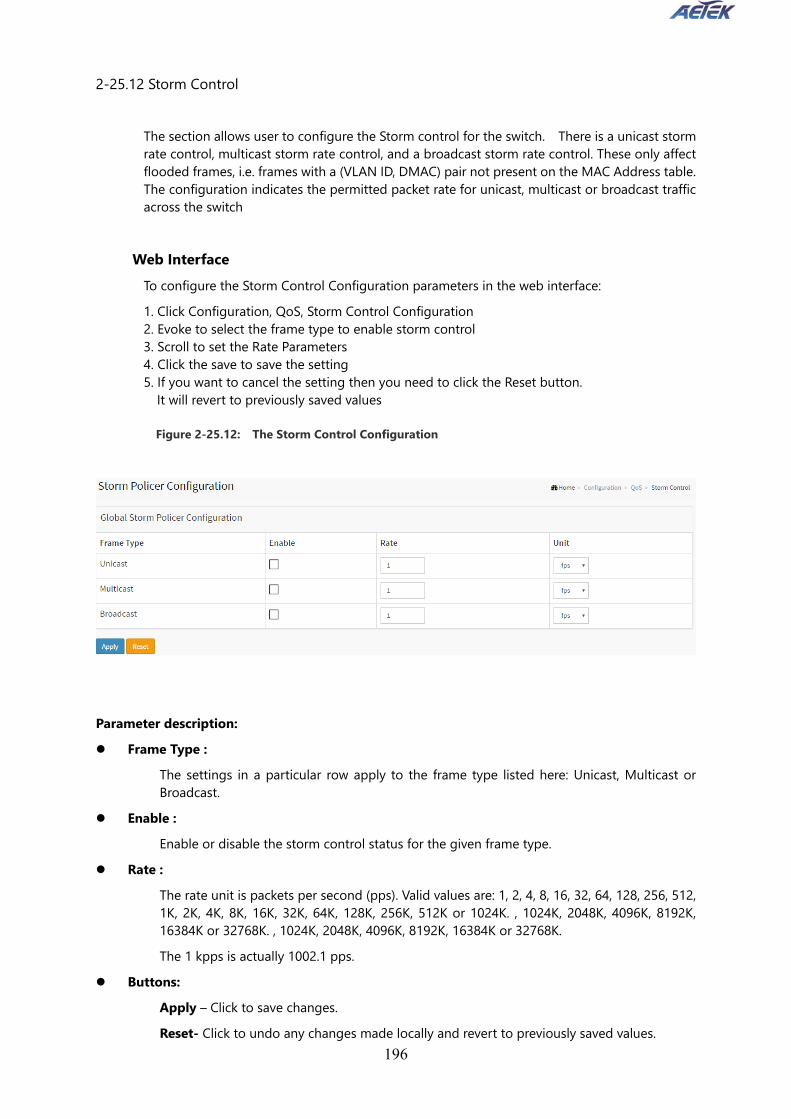
196
2-25.12 Storm Control The section allows user to configure the Storm control for the switch. There is a unicast storm rate control, multicast storm rate control, and a broadcast storm rate control. These only affect flooded frames, i.e. frames with a (VLAN ID, DMAC) pair not present on the MAC Address table. The configuration indicates the permitted packet rate for unicast, multicast or broadcast traffic across the switch
Web Interface To configure the Storm Control Configuration parameters in the web interface: 1. Click Configuration, QoS, Storm Control Configuration 2. Evoke to select the frame type to enable storm control 3. Scroll to set the Rate Parameters 4. Click the save to save the setting 5. If you want to cancel the setting then you need to click the Reset button.
It will revert to previously saved values Figure 2-25.12: The Storm Control Configuration
Parameter description: Frame Type :
The settings in a particular row apply to the frame type listed here: Unicast, Multicast or Broadcast.
Enable : Enable or disable the storm control status for the given frame type.
Rate : The rate unit is packets per second (pps). Valid values are: 1, 2, 4, 8, 16, 32, 64, 128, 256, 512, 1K, 2K, 4K, 8K, 16K, 32K, 64K, 128K, 256K, 512K or 1024K. , 1024K, 2048K, 4096K, 8192K, 16384K or 32768K. , 1024K, 2048K, 4096K, 8192K, 16384K or 32768K. The 1 kpps is actually 1002.1 pps.
Buttons: Apply – Click to save changes. Reset- Click to undo any changes made locally and revert to previously saved values.

197

198
2-26 Mirroring You can mirror traffic from any source port to a target port for real-time analysis. You can then attach a logic analyzer or RMON probe to the target port and study the traffic crossing the source port in a completely unobtrusive manner. Mirror Configuration is to monitor the traffic of the network. For example, we assume that Port A and Port B are Monitoring Port and Monitored Port respectively, thus, the traffic received by Port B will be copied to Port A for monitoring.
Web Interface To configure the Mirror in the web interface: 1. Click Configuration, Mirroring 2. Scroll to select Port to mirror on which port 3. Scroll to disabled, enable, TX Only and RX only to set the Port mirror mode 4. Click the save to save the setting 5. If you want to cancel the setting then you need to click the Reset button.
It will revert to previously saved values . Figure 2-26: The Mirror Configuration

199
Parameter description: Port to mirror on :
Port to mirror also known as the mirror port. Frames from ports that have either source (rx) or destination (tx) mirroring enabled are mirrored on this port. Disabled disables mirroring.
Mirror Port Configuration
The following table is used for Rx and Tx enabling. Port :
The logical port for the settings contained in the same row. Mode :
Select mirror mode. Rx only Frames received on this port are mirrored on the mirror port. Frames transmitted are not mirrored. Tx only Frames transmitted on this port are mirrored on the mirror port. Frames received are not mirrored. Disabled neither frames transmitted nor frames received are mirrored. Enabled Frames received and frames transmitted are mirrored on the mirror port.
NOTE: For a given port, a frame is only transmitted once. It is therefore not possible to mirror Tx frames on the mirror port. Because of this, mode for the selected mirror port is limited to Disabled or Rx only.
Buttons:
Apply – Click to save changes. Reset- Click to undo any changes made locally and revert to previously saved values.

200
2-27 UPnP UPnP is an acronym for Universal Plug and Play. The goals of UPnP are to allow devices to connect seamlessly and to simplify the implementation of networks in the home (data sharing, communications, and entertainment) and in corporate environments for simplified installation of computer components
Web Interface To configure the UPnP Configuration in the web interface: 1. Click Configuration, UPnP 2. Scroll to select the mode to enable or disable 3. Specify the parameters in each blank field. 4. Click the save to save the setting 5. If you want to cancel the setting then you need to click the Reset button.
It will revert to previously saved values
Figure 2-27: The UPnP Configuration
Parameter description:
These parameters are displayed on the UPnP Configuration page: Mode :
Indicates the UPnP operation mode. Possible modes are: Enabled: Enable UPnP mode operation. Disabled: Disable UPnP mode operation. When the mode is enabled, two ACEs are added automatically to trap UPNP related packets to CPU. The ACEs are automatically removed when the mode is disabled. .
TTL : The TTL value is used by UPnP to send SSDP advertisement messages. Valid values are in the range 1 to 255.
Advertising Duration : The duration, carried in SSDP packets, is used to inform a control point or control points how often it or they should receive an SSDP advertisement message from this switch. If a control point does not receive any message within the duration, it will think that the switch no longer exists. Due to the unreliable nature of UDP, in the standard it is recommended that such refreshing of advertisements to be done at less than one-half of the advertising

201
duration. In the implementation, the switch sends SSDP messages periodically at the interval one-half of the advertising duration minus 30 seconds. Valid values are in the range 100 to 86400.
Buttons: Apply – Click to save changes. Reset- Click to undo any changes made locally and revert to previously saved values.

202
2-28 PTP This page allows the user to configure and inspect the current PTP clock settings.
Web Interface To configure the PTP in the web interface: 1. Click Configuration, UPnP 2. Scroll to select the mode to enable or disable 3. Specify the parameters in each blank field. 4. Click the save to save the setting 5. If you want to cancel the setting then you need to click the Reset button.
It will revert to previously saved values
Figure 2-28: The PTP
Parameter description: PTP External Clock Configuration One_PPS_Mode
This Selection box will allow you to select the One_pps_mode configuration. The following values are possible: 1. Output : Enable the 1 pps clock output 2. Input : Enable the 1 pps clock input 3. Disable : Disable the 1 pps clock in/out-put
External Enable This Selection box will allow you to configure the External Clock output. The following values are possible: 1. True : Enable the external clock output 2. False : Disable the external clock output
Adjust Method

203
This Selection box will allow you to configure the Frequency adjustment configuration. 1. LTC frequency : Select Local Time Counter (LTC) frequency control 2. SyncE-DPLL : Select SyncE DPLL frequency control, if allowed by SyncE 3. Oscillator : Select an oscillator independent of SyncE for frequency control, if supported by the HW 4. LTC phase : Select Local Time Counter (LTC) phase control (assumes that the frequency is locked by means of SyncE)
Clock Frequency This will allow to set the Clock Frequency. The possible range of values are 1 - 25000000 (1 - 25MHz)
PTP Clock Configuration Delete
Check this box and click on 'Save' to delete the clock instance. Inst
Indicates the Instance of a particular Clock Instance [0..3]. Click on the Clock Instance number to edit the Clock details.
ClkDom Indicates the Clock domain used by the Instance of a particular Clock Instance [0..3]. More instances may use the same clock domain, e.g. a Boundary clock and a Transparent clock. Only one Slave or Boundary clock is allowed within the same Clock domain.
Device Type Indicates the Type of the Clock Instance. There are five Device Types. 1. Ord-Bound - clock's Device Type is Ordinary-Boundary Clock. 2. P2p Transp - clock's Device Type is Peer to Peer Transparent Clock. 3. E2e Transp - clock's Device Type is End to End Transparent Clock. 4. Master Only - clock's Device Type is Master Only. 5. Slave Only - clock's Device Type is Slave Only.
Port List Set check mark for each port configured for this Clock Instance. One port can only be active within one Clock domain. I.e. enabling a port which is already active in an other Clock domain is rejected.
2 Step Flag Static member: defined by the system, true if two-step Sync events and Pdelay_Resp events are used
Clock Identity It shows unique clock identifier
One Way If true, one-way measurements are used. This parameter applies only to a slave. In one-way mode no delay measurements are performed, i.e. this is applicable only if frequency synchronization is needed. The master always responds to delay requests.

204
Protocol Transport protocol used by the PTP protocol engine Ethernet PTP over Ethernet multicast EthernetMixed PTP using a combination of Ethernet multicast and unicast IPv4Multi PTP over IPv4 multicast IPv4Mixed PTP using a combination of IPv4 multicast and unicast IPv4Uni PTP over IPv4 unicast Note : IPv4 unicast protocol only works in Master only and Slave only clocks See parameter Device Type In a unicast Slave only clock you also need configure which master clocks to request Announce and Sync messages from. See: Unicast Slave Configuration
VLAN Tag Enable Enables the VLAN tagging for the PTP frames. Note: Packets are only tagged if the port is configured for vlan tagging for the configured VLAN. I.e the VLAN Tag Enable parameter is ignored
VID VLAN Identifier used for tagging the PTP frames.
PCP Priority Code Point value used for PTP frames.
Buttons: Add New PTP Clock – Click to create a new clock instance. Apply –Click to save the page immediately. Reset- Click to reset the the page immediately.
2-29. GVRP The Generic Attribute Registration Protocol (GARP) provides a generic framework whereby devices in a bridged LAN, e.g. end stations and switches, can register and de-register attribute values, such as VLAN Identifiers, with each other. In doing so, the attributes are propagated to devices in the bridged LAN, and these devices form a ¡°reachability¡± tree that is a subset of an active topology. GARP defines the architecture, rules of operation, state machines and variables for the registration and de-registration of attribute values. A GARP participation in a switch or an end station consists of a GARP application component, and a GARP Information Declaration (GID) component associated with each port or the switch. The propagation of information between GARP participants for the same application in a bridge is carried out by the GARP Information Propagation (GIP) component. Protocol exchanges take place between GARP participants by means of LLC Type 1 services, using the group MAC address and PDU format defined for the GARP application concerned.

205
2-29.1 Global Config
The switch stores its configuration in a number of text files in CLI format. The files are either virtual (RAM-based) or stored in flash on the switch.
There are three system files:
Running-config: A virtual file that represents the currently active configuration on the switch. This file is volatile.
Startup-config: The startup configuration for the switch, read at boot time. Default-config: A read-only file with vendor-specific configuration. This file is read
when the system is restored to default settings.
It is also possible to store up to two other files and apply them to running-config, thereby switching configuration.
Web Interface
To configure the GVRP in the web interface: 1. Click Configuration, GVRP, Global Config 2. Specify Join-time, Leave-time, Leave All-time, Max VLANs 3. Click Apply
Figure 2-29.1: The GVRP Configuration
Enable GVRP globally The GVRP feature is enabled by setting the check mark in the checkbox named Enable
GVRP.
GVRP protocol timers
Join-time is a value in the range 1-20 in the units of centi seconds, i.e. in units of one hundredth of a second. The default is 20.
Leave-time is a value in the range 60-300 in the units of centi seconds, i.e. in units of one hundredth of a second. The default is 60.

206
Leave All-time is a value in the range 1000-5000 in the units of centi seconds, i.e. in units of one hundredth of a second. The default is 1000.
Max number of VLANs
When GVRP is enabled a maximum number of VLANs supported by GVRP is specified. By default this number is 20. This number can only be changed when GVRP is turned off.

207
2-29.2 Port Config
This page allows you to configure the basic GVRP Configuration settings for all switch ports. The settings relate to the currently selected unit, as reflected by the page header.
Web Interface
To configure the sFlow Agent in the web interface: 1. Click Configuration, GVRP, Port Config 2. Specify Port, mode 3. Click Apply
Figure 2-29.2: The GVRP Configuration
Parameter description: GVRP Mode
This configuration is to enable/disable GVRP Mode on particular port locally. Disable: Select to Disable GVRP mode on this port. Enable: Select to Enable GVRP mode on this port.
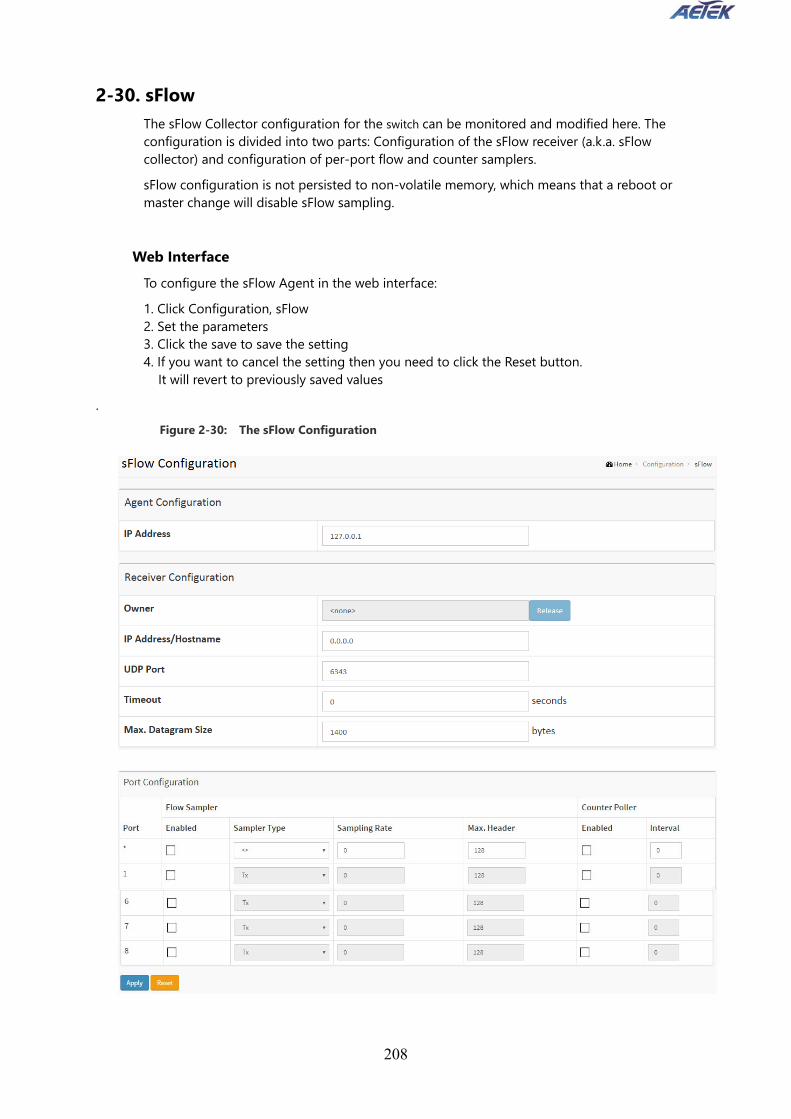
208
2-30. sFlow The sFlow Collector configuration for the switch can be monitored and modified here. The configuration is divided into two parts: Configuration of the sFlow receiver (a.k.a. sFlow collector) and configuration of per-port flow and counter samplers. sFlow configuration is not persisted to non-volatile memory, which means that a reboot or master change will disable sFlow sampling.
Web Interface
To configure the sFlow Agent in the web interface: 1. Click Configuration, sFlow 2. Set the parameters 3. Click the save to save the setting 4. If you want to cancel the setting then you need to click the Reset button.
It will revert to previously saved values .
Figure 2-30: The sFlow Configuration

209
Parameter description:
Agent Configuration IP Address
The IP address used as Agent IP address in sFlow datagrams. It serves as a unique key that will identify this agent over extended periods of time. Both IPv4 and IPv6 addresses are supported.
Receiver Configuration Owner
Basically, sFlow can be configured in two ways: Through local management using the Web or CLI interface or through SNMP. This read-only field shows the owner of the current sFlow configuration and assumes values as follows: • If sFlow is currently unconfigured/unclaimed, Owner contains <none>. • If sFlow is currently configured through Web or CLI, Owner contains <Configured through local management>. • If sFlow is currently configured through SNMP, Owner contains a string identifying the sFlow receiver. If sFlow is configured through SNMP, all controls - except for the Release-button - are disabled to avoid inadvertent reconfiguration. The button allows for releasing the current owner and disable sFlow sampling. The button is disabled if sFlow is currently unclaimed. If configured through SNMP, the release must be confirmed (a confirmation request will appear).
IP Address/Hostname The IP address or hostname of the sFlow receiver. Both IPv4 and IPv6 addresses are supported.
UDP Port The UDP port on which the sFlow receiver listens to sFlow datagrams. If set to 0 (zero), the default port (6343) is used.
Timeout The number of seconds remaining before sampling stops and the current sFlow owner is released. While active, the current time left can be updated with a click on the Refresh-button. If locally managed, the timeout can be changed on the fly without affecting any other settings.
Max. Datagram Size The maximum number of data bytes that can be sent in a single sample datagram. This should be set to a value that avoids fragmentation of the sFlow datagrams. Valid range is 200 to 1468 bytes with default being 1400 bytes.
Port Configuration Port
The port number for which the configuration below applies. Flow Sampler Enabled
Enables/disables flow sampling on this port. Flow Sampler Sampling Rate
The statistical sampling rate for packet sampling. Set to N to sample on average 1/Nth of
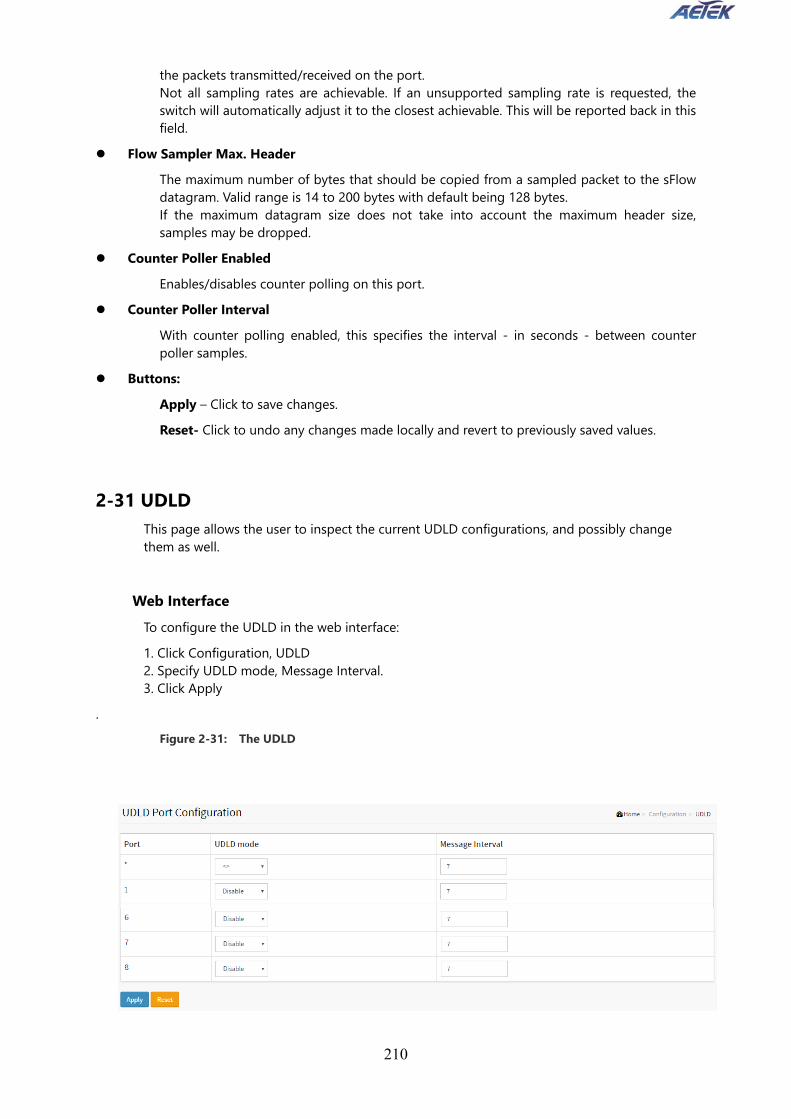
210
the packets transmitted/received on the port. Not all sampling rates are achievable. If an unsupported sampling rate is requested, the switch will automatically adjust it to the closest achievable. This will be reported back in this field.
Flow Sampler Max. Header The maximum number of bytes that should be copied from a sampled packet to the sFlow datagram. Valid range is 14 to 200 bytes with default being 128 bytes. If the maximum datagram size does not take into account the maximum header size, samples may be dropped.
Counter Poller Enabled Enables/disables counter polling on this port.
Counter Poller Interval With counter polling enabled, this specifies the interval - in seconds - between counter poller samples.
Buttons: Apply – Click to save changes. Reset- Click to undo any changes made locally and revert to previously saved values.
2-31 UDLD This page allows the user to inspect the current UDLD configurations, and possibly change them as well.
Web Interface
To configure the UDLD in the web interface: 1. Click Configuration, UDLD 2. Specify UDLD mode, Message Interval. 3. Click Apply
. Figure 2-31: The UDLD
211
Parameter description: Port
Port number of the switch. UDLD Mode
Configures the UDLD mode on a port. Valid values are Disable, Normal and Aggressive. Default mode is Disable. Disable In disabled mode, UDLD functionality doesn't exists on port. Normal In normal mode, if the link state of the port was determined to be unidirectional, it will not affect the port state. Aggressive In aggressive mode, unidirectional detected ports will get shutdown. To bring back the ports up, need to disable UDLD on that port.
Message Interval Configures the period of time between UDLD probe messages on ports that are in the advertisement phase and are determined to be bidirectional. The range is from 7 to 90 seconds(Default value is 7 seconds)(Currently default time interval is supported, due to lack of detailed information in RFC 5171).
Buttons: Apply – Click to save changes. Reset- Click to undo any changes made locally and revert to previously saved values.
2-32 Rapid Ring This page allows the user to inspect the current Rapid Ring Configuration, and possibly change them as well
Web Interface
To configure the Rapid Ring in the web interface: 1. Click Configuration, Rapid Ring. 2. Specify the Role, Port, Status. 3. Click Apply.
. Figure 2-32: The Rapid Ring

212
Parameter description:
Role Configuration Role
Set role value. Port
The switch port number of the port. Status
The current Rapid Ring status of the port.Buttons: Apply – Click to save changes. Reset- Click to undo any changes made locally and revert to previously saved values.
2-33 SMTP The function, is used to set a Alarm trap when the switch alarm then you could set the SMTP server to send you the alarm mail.
Web Interface To configure the SMTP Configuration in the web interface: 1. Click Configuration, SMTP Configuration 2. Scroll to select the Severity Level 3. Specify the parameters in each blank field. 4. Click the apply to save the setting 5. If you want to cancel the setting then you need to click the Reset button.
It will revert to previously saved values
Figure 2-34: The SMTP Configuration

213
Parameter description:
These parameters are displayed on the SMTP Configuration page: Mail Server :
Specify the IP Address of the server transferring your email. Username :
Specify the username on the mail server. Password :
Specify the password on the mail server. Severity Level :
Indicates what kind of message will send to mail server. Possible modes are: <0> Emergency: System is unusable. <1> Alert: Action must be taken immediately. <2> Critical: Critical conditions. <3> Error: Error conditions. <4> Warning: Warning conditions. <5> Notice: Normal but significant conditions. <6> Information: Information messages. <7> Debug: Debug-level messages.
Sender : To set the mail sender name.
Return-Path : To set the mail return-path as sender mail address.
Email Address 1-6 : Email address that would like to receive the alarm message.
Buttons: Apply – Click to apply changes.

214
Reset- Click to undo any changes made locally and revert to previously saved values.

215
Chapter 3. Monitor
This chapter describes all of the basic network statistics which includes the Ports, Layer 2 network protocol (e.g. NAS, ACL, DHCP, AAA and RMON etc.) and any setting of the Switch.
3-1 System After you login, the switch shows you the system information. This page is default and tells you the basic information of the system, including “Model Name”, “System Description”, “Contact”, “Location”, “System Up Time”, “Firmware Version”, “Host Mac Address”, “Device Port”. With this information, you will know the software version used, MAC address, serial number, how many ports good and so on. This is helpful while malfunctioning.
3-1.1 Information
The switch system information is provided here.
Web interface To configure System Information in the web interface: 1. Click Monitor, System and Information. 2. Check the contact information for the system administrator as well as the name and
location of the switch. Also indicate the local time zone by configuring the appropriate offset.
3. Click the “Refresh”
Figure 3-1.1: System Information

216
Parameter description: Model Name
Displays the factory defined model name for identification purpose. System Description
Displays the system description. Location
The system location configured in Configuration | System | Information | System Location. Contact
The system contact configured in Configuration | System | Information | System Contact. Platform Name
Displays the user-defined system name that configured in System | System Information | Configuration | System Name.
System Date The current (GMT) system time and date. The system time is obtained through the Timing server running on the switch, if any.
System Uptime The period of time the device has been operational.
Bootloader Version Displays the current boot loader version number.
Firmware Version The software version of this switch.
Hardware-Mechanical Version The hardware and mechanical version of this switch.
Series Number The serial number of this switch.
MAC Address The MAC Address of this switch.
Memory Displays the memory size of the system.
FLASH Displays the flash size of the system.

217
3-1.2 IP Status This page displays the status of the IP protocol layer. The status is defined by the IP interfaces, the IP routes and the neighbour cache (ARP cache) status.
Web Interface
To display the log configuration in the web interface: 1. Click Monitor, System and IP Status. 2. Display the IP address information.
Figure 3-1.2: The IP Status
Parameter description:

218
IP Interfaces Interface
Show the name of the interface. Type
Show the address type of the entry. This may be LINK or IPv4. Address
Show the current address of the interface (of the given type). Status
Show the status flags of the interface (and/or address). IP Routes Network
Show the destination IP network or host address of this route. Gateway
Show the gateway address of this route. Status
Show the status flags of the route. Neighbour cache IP Address
Show the IP address of the entry. Link Address
Show the Link (MAC) address for which a binding to the IP address given exist.
Buttons
Auto-refresh: Check this box to refresh the page automatically. Automatic refresh occurs every 3 seconds.
Refresh: Click to refresh the page immediately.
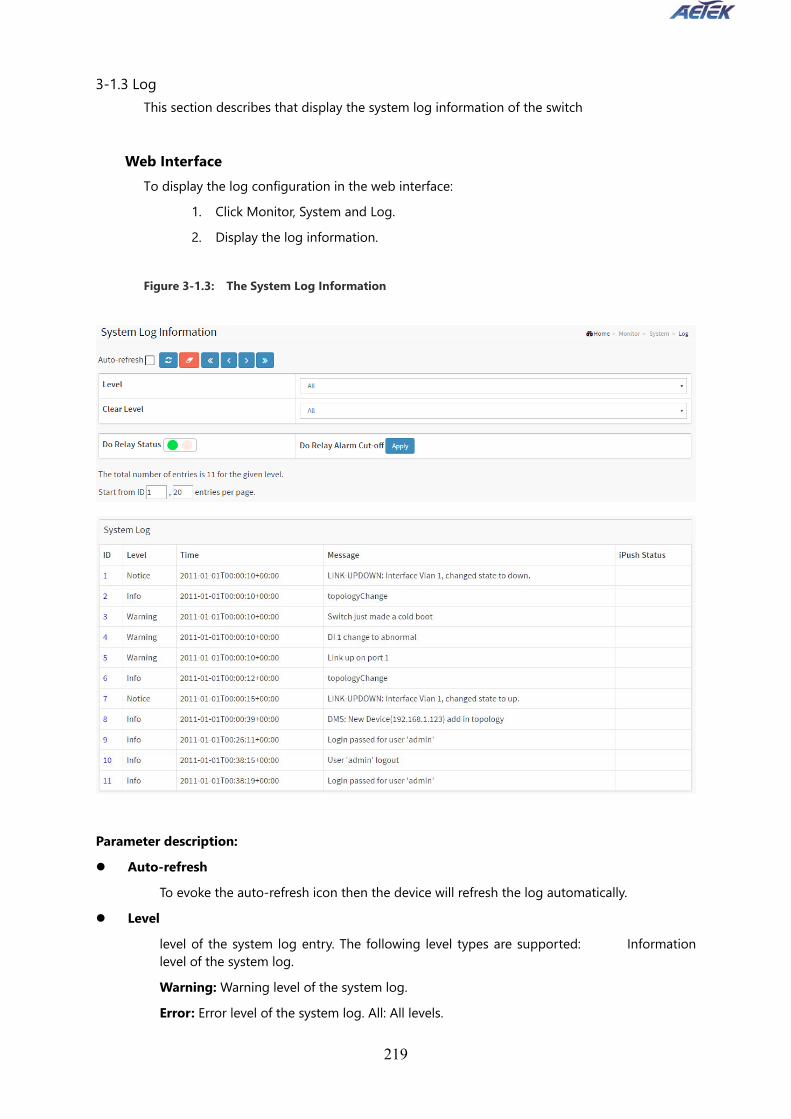
219
3-1.3 Log This section describes that display the system log information of the switch
Web Interface
To display the log configuration in the web interface: 1. Click Monitor, System and Log. 2. Display the log information.
Figure 3-1.3: The System Log Information
Parameter description: Auto-refresh
To evoke the auto-refresh icon then the device will refresh the log automatically. Level
level of the system log entry. The following level types are supported: Information level of the system log. Warning: Warning level of the system log. Error: Error level of the system log. All: All levels.

220
ID ID (>= 1) of the system log entry.
Time It will display the log record by device time. The time of the system log entry.
Message It will display the log detail message. The message of the system log entry.
Buttons
Auto-refresh: Check this box to refresh the page automatically. Automatic refresh occurs every 3 seconds.
Refresh: Updates the system log entries, starting from the current entry ID. Clear: Flushes the selected log entries. |<<: Updates the system log entries, starting from the first available entry ID. << : Updates the system log entries, ending at the last entry currently displayed. >> : Updates the system log entries, starting from the last entry currently displayed. >>|: Updates the system log entries, ending at the last available entry ID

221
3-1.4 Detailed Log This section describes that display the detailed log information of the switch
Web Interface To display the detailed log configuration in the web interface: 1. Click Monitor, System and Detailed Log. 2. Display the log information.
Figure 3-1.4: The Detailed System Log Information
Parameter description: ID
The ID (>= 1) of the system log entry. Message
The detailed message of the system log entry. Upper right icon (Refresh, clear…)
You can click them for refresh the system log or clear them by manual, others for next/up page or entry.
Buttons
Refresh: Updates the system log entries, starting from the current entry ID. |<<: Updates the system log entries to the first available entry ID << : Updates the system log entry to the previous available entry ID >> : Updates the system log entry to the next available entry ID >>|: Updates the system log entry to the last available entry ID.

222
3-2 Green Ethernet 3-2.1 Port Power Savings
This page provides the current status for EEE.
Web Interface To display the power Saving in the web interface: 1. Click Monitor, Port Power Savings.
Figure 3-2.1: The Ports States
Parameter description: Local Port
This is the logical port number for this row. Link
Shows if the link is up for the port (green = link up, red = link down). EEE
Shows if EEE is enabled for the port (reflects the settings at the Port Power Savings configuration page).
LP EEE cap Shows if the link partner is EEE capable.
EEE Savings Shows if the system is currently saving power due to EEE. When EEE is enabled, the system will powered down if no frame has been received or transmitted in 5 uSec.
Actiphy Savings Shows if the system is currently saving power due to ActiPhy.
PerfectReach Savings Shows if the system is currently saving power due to PerfectReach.
3-3 Ports
The section describes to configure the Port detail parameters of the switch. Others you could

223
using the Port configure to enable or disable the Port of the switch. Monitor the ports content or status in the function.
3-3.1 Traffic Overview The section describes to the Port statistics information and provides overview of general traffic statistics for all switch ports.
Web Interface To Display the Port Statistics Overview in the web interface: 1. Click Monitor, Port, then Traffic Overview 2. If you want to auto-refresh then you need to evoke the “Auto-refresh”. 3. Click “ Refresh“ to refresh the port statistics or clear all information when you click
“ Clear”.
Figure 3-3.1: The Port Statistics Overview
Parameter description: Port :
The logical port for the settings contained in the same row. Packets :
The number of received and transmitted packets per port. Bytes :
The number of received and transmitted bytes per port. Errors
The number of frames received in error and the number of incomplete transmissions per port.
Drops The number of frames discarded due to ingress or egress congestion.
Filtered

224
The number of received frames filtered by the forwarding Buttons
Auto-refresh: Check this box to refresh the page automatically. Automatic refresh occurs every 3 seconds. Refresh: Click to refresh the page. Clear: Clears the counters for all ports.

225
3-3.2 Qos Statistics The section describes that switch could display the QoS detailed Queuing counters for a specific switch port. for the different queues for all switch ports.
Web Interface
To Display the Queuing Counters in the web interface: 1. Click Monitor, Ports, then QoS Statistics 2. If you want to auto-refresh the information then you need to evoke the “Auto-refresh”. 3. Click “Refresh” to refresh the Queuing Counters or clear all information when you click
“Clear”.
Figure 3-3.2: The Queuing Counters Overview
Parameter description: Port :
The logical port for the settings contained in the same row. Qn :
Qn is the Queue number, There are 8 QoS queues per port. Q0 is the lowest priority queue. Rx/Tx :
The number of received and transmitted packets per queue. Buttons
Auto-refresh: Check this box to refresh the page automatically. Automatic refresh occurs every 3 seconds. Refresh: Click to refresh the page. Clear: Clears the counters for all ports.

226
3-3.3 QCL Status The section will let you know how to configure and shows the QCL status by different QCL users. Each row describes the QCE that is defined. It is a conflict if a specific QCE is not applied to the hardware due to hardware limitations. The maximum number of QCEs is 256 on each switch.
Web Interface To display the QoS Control List Status in the web interface: 1. Click Monitor, Ports, then QCL Status 2. If you want to auto-refresh the information then you need to evoke the “Auto-refresh”. 3. Scroll to select the combined, static, Voice VLAN and conflict. 4. To click the “Refresh” to refresh an entry of the MVR Statistics Information.
Figure 3-3.3: The QoS Control List Status
Parameter description: User :
Indicates the QCL user. QCE#
Indicates the index of QCE. Frame Type :
Indicates the type of frame to look for incoming frames. Possible frame types are: Any: The QCE will match all frame type. Ethernet: Only Ethernet frames (with Ether Type 0x600-0xFFFF) are allowed. LLC: Only (LLC) frames are allowed LLC: Only (SNAP) frames are allowed. IPv4: The QCE will match only IPV4 frames. IPv6: The QCE will match only IPV6 frames.
Port : Indicates the list of ports configured with the QCE.
Action : Indicates the classification action taken on ingress frame if parameters configured are matched with the frame's content. There are three action fields: Class, DPL and DSCP.

227
Class: Classified QoS Class; if a frame matches the QCE it will be put in the queue. DPL: Drop Precedence Level; if a frame matches the QCE then DP level will set to value displayed under DPL column. DSCP: If a frame matches the QCE then DSCP will be classified with the value displayed under DSCP column.
Conflict : Displays Conflict status of QCL entries. It may happen that resources required to add a QCE may not available, in that case it shows conflict status as 'Yes', otherwise it is always 'No’. Please note that conflict can be resolved by releasing the H/W resources required to add QCL entry on pressing 'Resolve Conflict' button.
Buttons
Auto-refresh: Check this box to refresh the page automatically. Automatic refresh occurs every 3 seconds. Resolve Conflict: Click to release the resources required to add QCL entry, incase conflict status for any QCL entry is 'yes'. Refresh: Click to refresh the page.

228
3-3.4 Detailed Statistics The section describes how to provide detailed traffic statistics for a specific switch port. Use the port select box to select which switch port details to display. The displayed counters are the totals for receive and transmit, the size counters for receive and transmit, and the error counters for receive and transmit.
Web Interface
To Display per port detailed Statistics Overview in the web interface: 1. Click Monitor, Ports, then Detailed Port Statistics 2. Scroll the Port Index to select which port you want to show the detailed 3. Port statistics overview”. 4. If you want to auto-refresh the information then you need to evoke the “Auto-refresh”. 5. Click “Refresh” to refresh the port detailed statistics or clear all information when you click
“Clear”. Figure 3-3.4: The Detailed Port Statistics

229
Parameter description: Auto-refresh:
To evoke the auto-refresh to refresh the Port Statistics information automatically. Upper left scroll bar:
To scroll which port to display the Port statistics with “Port-0”, “Port-1...
Receive Total and Transmit Total Rx and Tx Packets :
The number of received and transmitted (good and bad) packets. Rx and Tx Octets :
The number of received and transmitted (good and bad) bytes. Includes FCS, but excludes framing bits.
Rx and Tx Unicast The number of received and transmitted (good and bad) unicast packets.
Rx and Tx Multicast : The number of received and transmitted (good and bad) multicast packets.
Rx and Tx Broadcast : The number of received and transmitted (good and bad) broadcast packets.

230
Rx and Tx Pause : A count of the MAC Control frames received or transmitted on this port that have an opcode indicating a PAUSE operation.
Receive and Transmit Size Counters The number of received and transmitted (good and bad) packets split into categories based on their respective frame sizes.
Receive and Transmit Queue Counters The number of received and transmitted packets per input and output queue.
Receive Error Counters Rx Drops :
The number of frames dropped due to lack of receive buffers or egress congestion. Rx CRC/Alignment :
The number of frames received with CRC or alignment errors. Rx Undersize :
The number of short 1 frames received with valid CRC. Rx Oversize :
The number of long 2 frames received with valid CRC. Rx Fragments :
The number of short 1 frames received with invalid CRC. Rx Jabber :
The number of long 2 frames received with invalid CRC. Rx Filtered :
The number of received frames filtered by the forwarding process. Short frames are frames that are smaller than 64 bytes. Long frames are frames that are longer than the configured maximum frame length for this port.
Transmit Error Counters Tx Drops :
The number of frames dropped due to output buffer congestion. Tx Late/Exc. Coll. :
The number of frames dropped due to excessive or late collisions. Auto-refresh:
To evoke the auto-refresh to refresh the Queuing Counters automatically. Upper right icon (Refresh, clear)
You can click them for refresh the Port Detail Statistics or clear them by manual. Buttons

231
Auto-refresh: Check this box to refresh the page automatically. Automatic refresh occurs every 3 seconds. Clear: Clears the counters for the selected port. Refresh: Click to refresh the page.
3-3.5 SFP Information This page displays general SFP information and monitoring information.
Web Interface To Display the SFP information in the web interface: 1. Click Monitor, Ports, then SFP Information 2. To display the SFP Information.
Figure 3-3.5: The SFP Information Overview
Parameter description: Port
The logical port for the settings contained in the same row. Tx Central Wavelength
Displays the nominal transmitter output wavelength in nm. Bit rate
Displays the nominal bit rate of the transceiver. Temperature
Displays the internally measured transceiver temperature. Temperature accuracy is vendor specific but must be better than 3 degrees Celsius over specified operating temperature and voltage.
Vcc Displays the internally measured transceiver supply voltage. Accuracy is vendor specific but must be better than 3 percent of the manufacturer's nominal value over specified operating temperature and voltage. Note that in some transceivers, transmitter supply voltage and receiver supply voltage are isolated. In that case, only one supply is monitored. Refer to the device specification for more detail.

232
Mon1 (Bias) Displays the measured TX bias current in uA. Accuracy is vendor specific but must be better than 10 percent of the manufacturer's nominal value over specified operating temperature and voltage.
Mon2 (TX PWR) Displays the measured coupled TX output power in mW. Accuracy is vendor specific but must be better than 3dB over specified operating temperature and voltage. Data is assumed to be based on measurement of a laser monitor photodiode current. Data is not valid when the transmitter is disabled.
Mon3 (RX PWR) Displays the measured received optical power in mW. Absolute accuracy is dependent upon the exact optical wavelength. For the vendor specified wavelength, accuracy should be better than 3dB over specified temperature and voltage. This accuracy should be maintained for input power levels up to the lesser of maximum transmitted or maximum received optical power per the appropriate standard. It should be maintained down to the minimum transmitted power minus cable plant loss (insertion loss or passive loss) per the appropriate standard. Absolute accuracy beyond this minimum required received input optical power range is vendor specific.
Buttons
Auto-refresh: Check this box to refresh the page automatically. Automatic refresh occurs every 3 seconds. Clear: Clears the counters for the selected port. Refresh: Click to refresh the page.

233
3-3.6 SFP Detail Info This page displays general SFP information and monitoring information.
Web Interface
To configure the SFP Detail Info in the web interface: 1. Click Monitor, Port and SFP Detail Info. 2. To display the SFP Information.
Figure 3-3.6: The SFP Detail Info
Parameter description: Connector Type
Displays the external optical or electrical cable connector provided as the media interface. Fiber Type
Displays the fiber channel transmission media. Tx Central Wavelength
Displays the nominal transmitter output wavelength in nm. Bit rate
Displays the nominal bit rate of the transceiver. Vendor OUI
Displays the vendor IEEE company ID. Vendor Name
Displays the vendor name. Vendor P/N
Displays the vendor part number or product name. Vendor Revision
Displays the vendor¡¦s product revision.

234
Vendor Serial Number Displays the vendor serial number for the transceiver.
Date Code Displays the vendor's manufacturing date code.
Temperature Displays the internally measured transceiver temperature. Temperature accuracy is vendor specific but must be better than 3 degrees Celsius over specified operating temperature and voltage.
Vcc Displays the internally measured transceiver supply voltage. Accuracy is vendor specific but must be better than 3 percent of the manufacturer's nominal value over specified operating temperature and voltage. Note that in some transceivers, transmitter supply voltage and receiver supply voltage are isolated. In that case, only one supply is monitored. Refer to the device specification for more detail.
Mon1 (Bias) Displays the measured TX bias current in uA. Accuracy is vendor specific but must be better than 10 percent of the manufacturer's nominal value over specified operating temperature and voltage.
Mon2 (TX PWR) Displays the measured coupled TX output power in mW. Accuracy is vendor specific but must be better than 3dB over specified operating temperature and voltage. Data is assumed to be based on measurement of a laser monitor photodiode current. Data is not valid when the transmitter is disabled.
Mon3 (RX PWR) Displays the measured received optical power in mW. Absolute accuracy is dependent upon the exact optical wavelength. For the vendor specified wavelength, accuracy should be better than 3dB over specified temperature and voltage. This accuracy should be maintained for input power levels up to the lesser of maximum transmitted or maximum received optical power per the appropriate standard. It should be maintained down to the minimum transmitted power minus cable plant loss (insertion loss or passive loss) per the appropriate standard. Absolute accuracy beyond this minimum required received input optical power range is vendor specific.
Buttons
Auto-refresh: Check this box to refresh the page automatically. Automatic refresh occurs every 3 seconds. Clear: Clears the counters for the selected port. Refresh: Click to refresh the page.
3-4 Link OAM 3-4.1 Statistics
This page provides detailed OAM traffic statistics for a specific switch port. Use the port select box to select which switch port details to display.
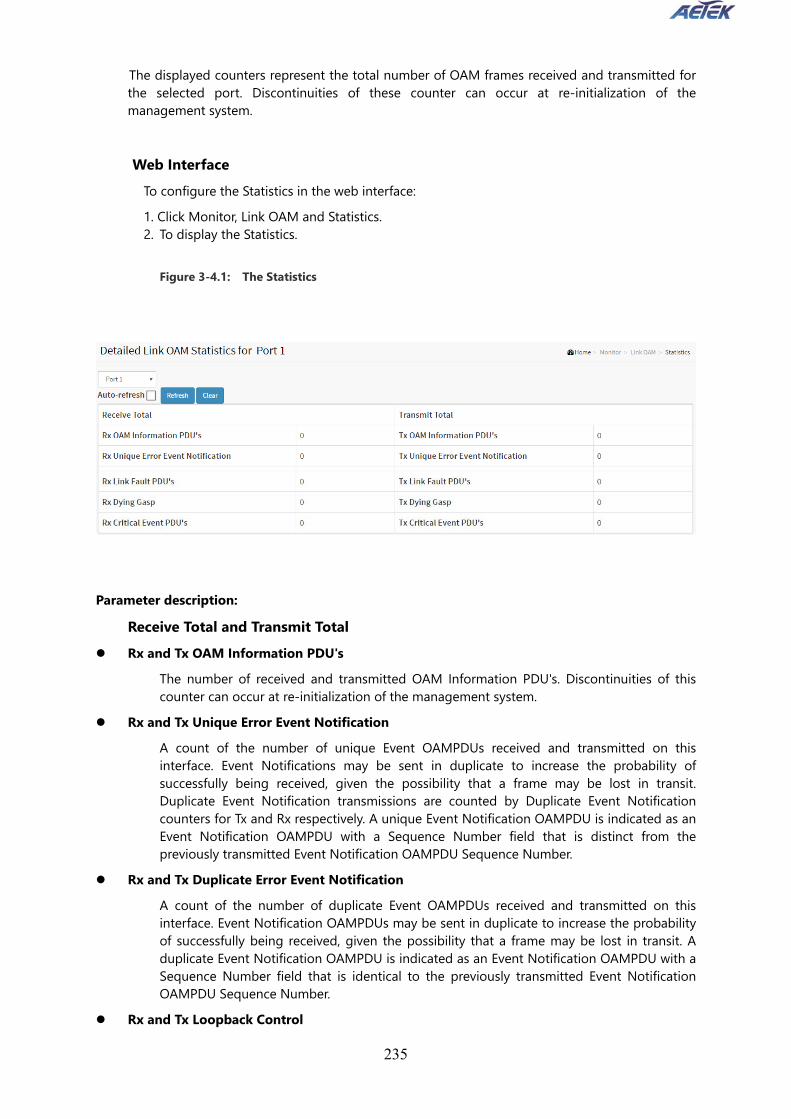
235
The displayed counters represent the total number of OAM frames received and transmitted for the selected port. Discontinuities of these counter can occur at re-initialization of the management system.
Web Interface
To configure the Statistics in the web interface: 1. Click Monitor, Link OAM and Statistics. 2. To display the Statistics.
Figure 3-4.1: The Statistics
Parameter description:
Receive Total and Transmit Total Rx and Tx OAM Information PDU's
The number of received and transmitted OAM Information PDU's. Discontinuities of this counter can occur at re-initialization of the management system.
Rx and Tx Unique Error Event Notification A count of the number of unique Event OAMPDUs received and transmitted on this interface. Event Notifications may be sent in duplicate to increase the probability of successfully being received, given the possibility that a frame may be lost in transit. Duplicate Event Notification transmissions are counted by Duplicate Event Notification counters for Tx and Rx respectively. A unique Event Notification OAMPDU is indicated as an Event Notification OAMPDU with a Sequence Number field that is distinct from the previously transmitted Event Notification OAMPDU Sequence Number.
Rx and Tx Duplicate Error Event Notification A count of the number of duplicate Event OAMPDUs received and transmitted on this interface. Event Notification OAMPDUs may be sent in duplicate to increase the probability of successfully being received, given the possibility that a frame may be lost in transit. A duplicate Event Notification OAMPDU is indicated as an Event Notification OAMPDU with a Sequence Number field that is identical to the previously transmitted Event Notification OAMPDU Sequence Number.
Rx and Tx Loopback Control
236
A count of the number of Loopback Control OAMPDUs received and transmitted on this interface.
Rx and Tx Variable Request A count of the number of Variable Request OAMPDUs received and transmitted on this interface.
Rx and Tx Variable Response A count of the number of Variable Response OAMPDUs received and transmitted on this interface.
Rx and Tx Org Specific PDU's A count of the number of Organization Specific OAMPDUs transmitted on this interface.
Rx and Tx Unsupported Codes A count of the number of OAMPDUs transmitted on this interface with an unsupported op-code.
Rx and Tx Link fault PDU's A count of the number of Link fault PDU's received and transmitted on this interface.
Rx and Tx Dying Gasp A count of the number of Dying Gasp events received and transmitted on this interface.
Rx and Tx Critical Event PDU's A count of the number of Critical event PDU's received and transmitted on this interface.
Buttons
Auto-refresh: Check this box to refresh the page automatically. Automatic refresh occurs every 3 seconds. Clear: Clears the counters for the selected port. Refresh: Click to refresh the page.
3-4.2 Port Status This page provides Link OAM configuration operational status. The displayed fields shows the active configuration status for the selected port.
Web Interface
To configure the Port Status in the web interface: 1. Click Monitor, Link OAM and Port Status. 2. To display the Port Status.
Figure 3-4.2: The Port Status
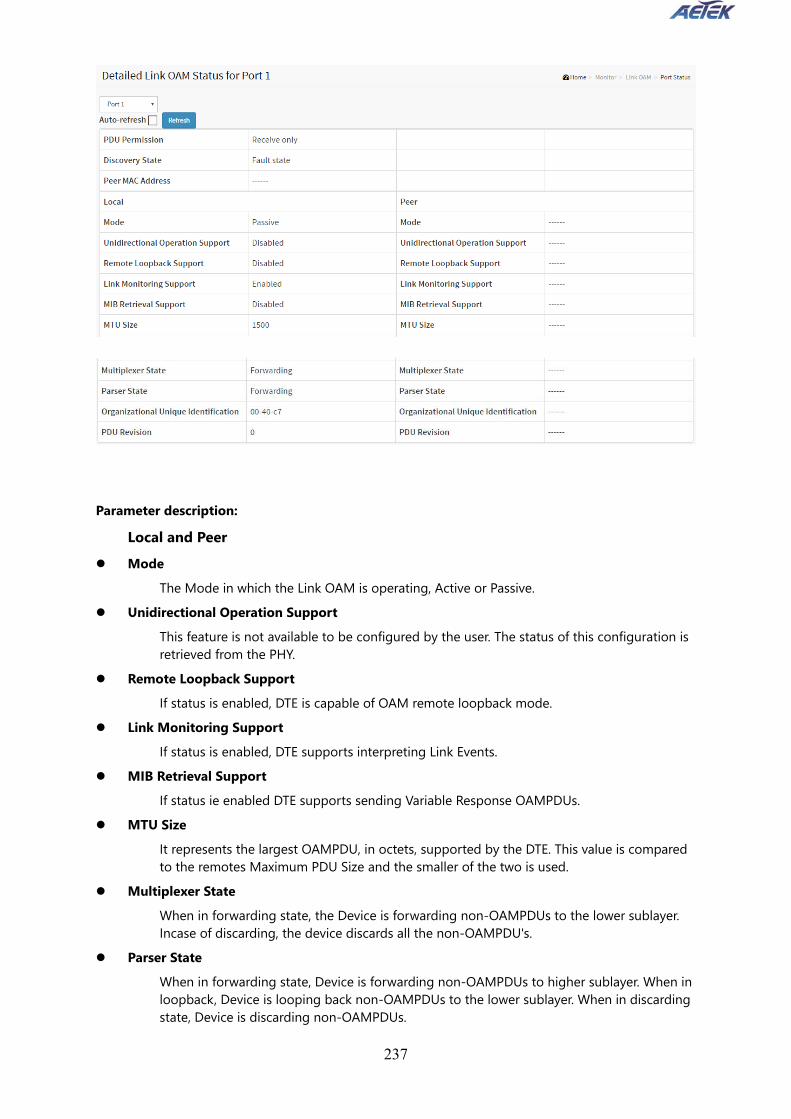
237
Parameter description:
Local and Peer Mode
The Mode in which the Link OAM is operating, Active or Passive. Unidirectional Operation Support
This feature is not available to be configured by the user. The status of this configuration is retrieved from the PHY.
Remote Loopback Support If status is enabled, DTE is capable of OAM remote loopback mode.
Link Monitoring Support If status is enabled, DTE supports interpreting Link Events.
MIB Retrieval Support If status ie enabled DTE supports sending Variable Response OAMPDUs.
MTU Size It represents the largest OAMPDU, in octets, supported by the DTE. This value is compared to the remotes Maximum PDU Size and the smaller of the two is used.
Multiplexer State When in forwarding state, the Device is forwarding non-OAMPDUs to the lower sublayer. Incase of discarding, the device discards all the non-OAMPDU's.
Parser State When in forwarding state, Device is forwarding non-OAMPDUs to higher sublayer. When in loopback, Device is looping back non-OAMPDUs to the lower sublayer. When in discarding state, Device is discarding non-OAMPDUs.

238
Organizational Unique Identification 24-bit Organizationally Unique Identifier of the vendor.
PDU Revision It indicates the current revision of the Information TLV. The value of this field shall start at zero and be incremented each time something in the Information TLV changes. Upon reception of an Information TLV from a peer, an OAM client may use this field to decide if it needs to be processed (an Information TLV that is identical to the previous Information TLV doesn't need to be parsed as nothing in it has changed).
PDU Permission This field is available only for the Local DTE. It displays the current permission rules set for the local DTE. Possible values are "Link fault","Receive only", "Information exchange only","ANY".
Discovery State Displays the current state of the discovery process. Possible states are Fault state, Active state, Passive state, SEND_LOCAL_REMOTE_STATE, SEND_LOCAL_REMOTE_OK_STATE, SEND_ANY_STATE.
Buttons
Auto-refresh: Check this box to refresh the page automatically. Automatic refresh occurs every 3 seconds. Refresh: Click to refresh the page.
3-4.3 Event Status This page allows the user to inspect the current Link OAM Link Event configurations, and change them as well. The left pane displays the Event status for the Local OAM unit while the right pane displays the status for the Peer for the respective port. Web Interface
To configure the Event Status in the web interface: 1. Click Monitor, Link OAM and Event Status. 2. To display the Event Status.
Figure 3-4.1: The Event Status
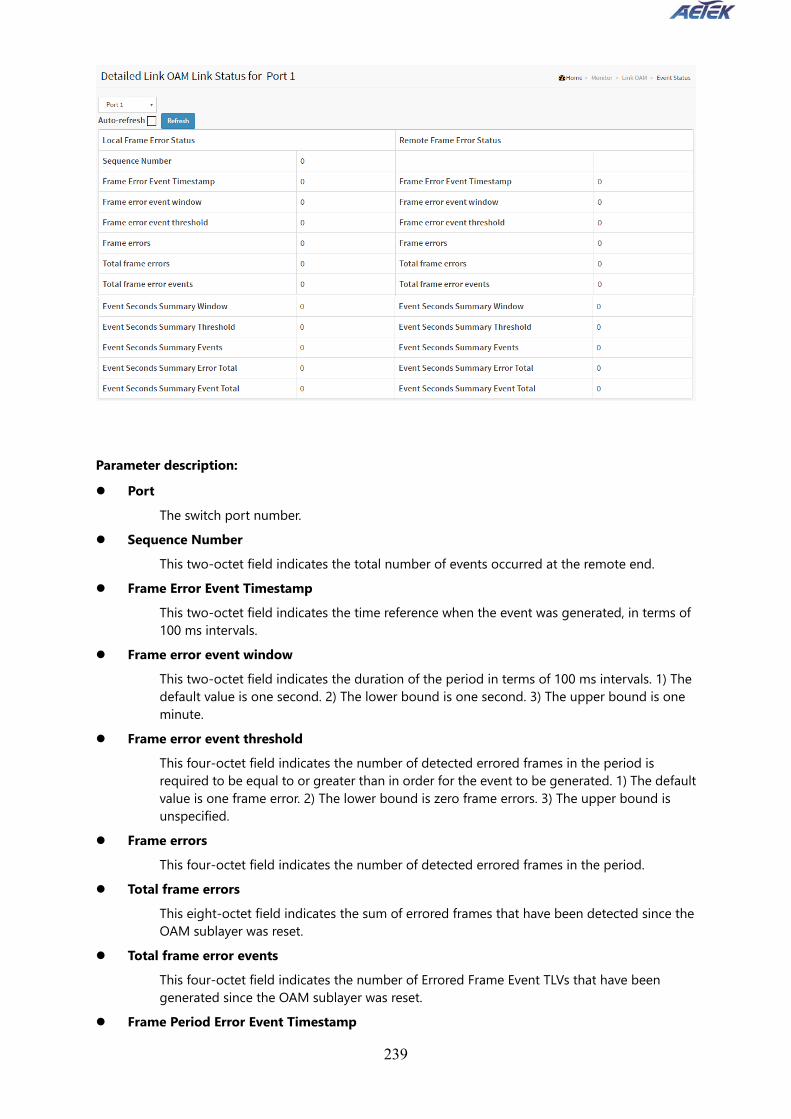
239
Parameter description: Port
The switch port number. Sequence Number
This two-octet field indicates the total number of events occurred at the remote end. Frame Error Event Timestamp
This two-octet field indicates the time reference when the event was generated, in terms of 100 ms intervals.
Frame error event window This two-octet field indicates the duration of the period in terms of 100 ms intervals. 1) The default value is one second. 2) The lower bound is one second. 3) The upper bound is one minute.
Frame error event threshold This four-octet field indicates the number of detected errored frames in the period is required to be equal to or greater than in order for the event to be generated. 1) The default value is one frame error. 2) The lower bound is zero frame errors. 3) The upper bound is unspecified.
Frame errors This four-octet field indicates the number of detected errored frames in the period.
Total frame errors This eight-octet field indicates the sum of errored frames that have been detected since the OAM sublayer was reset.
Total frame error events This four-octet field indicates the number of Errored Frame Event TLVs that have been generated since the OAM sublayer was reset.
Frame Period Error Event Timestamp

240
This two-octet field indicates the time reference when the event was generated, in terms of 100 ms intervals.
Frame Period Error Event Window This four-octet field indicates the duration of period in terms of frames.
Frame Period Error Event Threshold This four-octet field indicates the number of errored frames in the period is required to be equal to or greater than in order for the event to be generated.
Frame Period Errors This four-octet field indicates the number of frame errors in the period.
Total frame period errors This eight-octet field indicates the sum of frame errors that have been detected since the OAM sublayer was reset.
Total frame period error events This four-octet field indicates the number of Errored Frame Period Event TLVs that have been generated since the OAM sublayer was reset.
Symbol Period Error Event Timestamp This two-octet field indicates the time reference when the event was generated, in terms of 100 ms intervals.
Symbol Period Error Event Window This eight-octet field indicates the number of symbols in the period.
Symbol Period Error Event Threshold This eight-octet field indicates the number of errored symbols in the period is required to be equal to or greater than in order for the event to be generated.
Symbol Period Errors This eight-octet field indicates the number of symbol errors in the period.
Symbol frame period errors This eight-octet field indicates the sum of symbol errors since the OAM sublayer was reset.
Symbol frame period error events This four-octet field indicates the number of Errored Symbol Period Event TLVs that have been generated since the OAM sublayer was reset.
Event Seconds Summary Time Stamp This two-octet field indicates the time reference when the event was generated, in terms of 100 ms intervals, encoded as a 16-bit unsigned integer.
Event Seconds Summary Window This two-octet field indicates the duration of the period in terms of 100 ms intervals, encoded as a 16-bit unsigned integer.
Event Seconds Summary Threshold This two-octet field indicates the number of errored frame seconds in the period is required to be equal to or greater than in order for the event to be generated, encoded as a 16-bit unsigned integer.
Event Seconds Summary Events This two-octet field indicates the number of errored frame seconds in the period, encoded as a 16-bit unsigned integer.

241
Event Seconds Summary Error Total This four-octet field indicates the sum of errored frame seconds that have been detected since the OAM sublayer was reset.
Event Seconds Summary Event Total This four-octet field indicates the number of Errored Frame Seconds Summary Event TLVs that have been generated since the OAM sublayer was reset, encoded as a 32bit unsigned integer.
Buttons
Auto-refresh: Check this box to refresh the page automatically. Automatic refresh occurs every 3 seconds. Refresh: Click to refresh the page.
3-5 DHCP 3-5.1 Server
DHCP Server is used to allocate network addresses and deliver configuration parameters to dynamically configured hosts called DHCP client.
3-5.1.1 Statistics This page displays the database counters and the number of DHCP messages sent and received by DHCP server.
Web Interface Display the DHCP server Statistics Overview in the web interface: Click Protocol -based VLAN configuration and add new entry.
Figure 3-5.1.1: The Protocol to Group Mapping Table

242
Parameter description: Database Counters Pool :
Number of pools. Excluded IP Address :
Number of excluded IP address ranges. Declined IP Address :
Number of sec lined IP addresses. Database Counters Automatic Binding :
Number of bindings with network-type pools. Manual Binding :
Number of bindings that administrator assigns an IP address to a client. That is, the pool is of host type.
Expired Binding : Number of bindings that their lease time expired or they are cleared from Automatic/Manual type bindings.
DHCP Message Received Counters DISCOVER :
Number of DHCP DISCOVER messages received. REQUEST :
Number of DHCP REQUEST messages received. DECLINE :
Number of DHCP DECLINE messages received.

243
RELEASE : Number of DHCP RELEASE messages received.
INFORM : Number of DHCP INFORM messages received.
DHCP Message Sent Counters OFFER :
Number of DHCP OFFER messages sent. ACK :
Number of DHCP ACK messages sent. NAK :
Number of DHCP NAK messages sent.
3-5.1.2 Binding
This page displays bindings generated for DHCP clients.
Web Interface
To Display DHCP Server Binding IP in the web interface: Click DHCP, Server and Binding.
Figure 3-5.1.2: The Group Name of VLAN Mapping Table
Parameter description: IP :
IP address allocated to DHCP client. Type :
Type of binding. Possible types are Automatic, Manual, and Expired. State :
State of binding. Possible states are Committed, Allocated, and Expired. Pool Name :
The pool that generates the binding. Server ID :
Server IP address to service the binding.

244
3-5.1.3 Declined IP This page displays declined IP addresses.
Web Interface
To Display DHCP Server Declined IP in the web interface: Click DHCP, Server and Declined IP.
Figure 3-5.1.3: The Declined IP
Parameter description: IP :
IP address allocated to DHCP client. Type :
Type of binding. Possible types are Automatic, Manual, and Expired. State :
State of binding. Possible states are Committed, Allocated, and Expired. Pool Name :
The pool that generates the binding. Server ID :
Server IP address to service the binding.
245
3-5.2 Snooping Table This page display the dynamic IP assigned information after DHCP Snooping mode is disabled. All DHCP clients obtained the dynamic IP address from the DHCP server will be listed in this table except for local VLAN interface IP addresses. Entries in the Dynamic DHCP snooping Table are shown on this page.
Web Interface To monitor a DHCP in the web interface:
1. Click Monitor, DHCP, and Snooping table 2. Checked “Auto-refresh”.
3. Click “Refresh” to refresh the port detailed statistics or clear all information when you click “Clear”.
Figure 3-5.2: The DHCP snooping table
Parameter description: MAC Address :
User MAC address of the entry. VLAN ID :
VLAN-ID in which the DHCP traffic is permitted. Source Port:
Switch Port Number for which the entries are displayed. IP Address :
User IP address of the entry. IP Subnet Mask :
User IP subnet mask of the entry. DHCP Server Address :
DHCP Server address of the entry.

246
3-5.3 Relay Statistics This page provides statistics for DHCP relay.
Web Interface To monitor a DHCP Relay statistics in the web interface:
4. Click Monitor, DHCP, Relay Statistics 5. Checked “Auto-refresh”.
6. Click “Refresh” to refresh the port detailed statistics or clear all information when you click “Clear”.
Figure 3-5.3: The DHCP relay statistics
Parameter description: Server Statistics Transmit to Server :
The number of packets that are relayed from client to server. Transmit Error :
The number of packets that resulted in errors while being sent to clients. Receive from Server :
The number of packets received from server. Receive Missing Agent Option:
The number of packets received without agent information options. Receive Missing Circuit ID :
The number of packets received with the Circuit ID option missing. Receive Missing Remote ID :
The number of packets received with the Remote ID option missing. Receive Bad Circuit ID:

247
The number of packets whose Circuit ID option did not match known circuit ID. Receive Bad Remote ID :
The number of packets whose Remote ID option did not match known Remote ID. Client Statistics Transmit to Client :
The number of relayed packets from server to client. Transmit Error :
The number of packets that resulted in error while being sent to servers. Receive from Client :
The number of received packets from server. Receive Agent Option :
The number of received packets with relay agent information option. Replace Agent Option :
The number of packets which were replaced with relay agent information option. Keep Agent Option :
The number of packets whose relay agent information was retained. Drop Agent Option :
The number of packets that were dropped which were received with relay agent information.

248
3-5.4 Detailed Statistics This page provides statistics for DHCP snooping. Notice that the normal forward per-port TX statistics isn't increased if the incoming DHCP packet is done by L3 forwarding mechanism. And clear the statistics on specific port may not take effect on global statistics since it gathers the different layer overview.
Web Interface To monitor an DHCP Relay statistics in the web interface:
1. Click Monitor, DHCP, Detailed Statistics 2. Checked “Auto-refresh”.
3. Click “Refresh” to refresh the port detailed statistics or clear all information when you click “Clear”.
Figure 3-5.4: The DHCP Detailed Statistics
Parameter description: Server Statistics Rx and Tx Discover :
The number of discover (option 53 with value 1) packets received and transmitted. Rx and Tx Offer :
The number of offer (option 53 with value 2) packets received and transmitted. Rx and Tx Request :

249
The number of request (option 53 with value 3) packets received and transmitted. Rx and Tx Decline:
The number of decline (option 53 with value 4) packets received and transmitted. Rx and Tx ACK:
The number of ACK (option 53 with value 5) packets received and transmitted. Rx and Tx NAK:
The number of NAK (option 53 with value 6) packets received and transmitted. Rx and Tx Release:
The number of release (option 53 with value 7) packets received and transmitted. Rx and Tx Inform:
The number of inform (option 53 with value 8) packets received and transmitted. Rx and Tx Lease Query:
The number of lease query (option 53 with value 10) packets received and transmitted. Rx and Tx Lease Unassigned:
The number of lease unassigned (option 53 with value 11) packets received and transmitted. Rx and Tx Lease Unknown:
The number of lease unknown (option 53 with value 12) packets received and transmitted. Rx and Tx Lease Active
Rx and Tx Lease Active: The number of lease active (option 53 with value 13) packets received and transmitted.
Rx Discarded checksum error: The number of discard packet that IP/UDP checksum is error.
Rx Discarded from Untrusted: The number of discarded packet that are coming from untrusted port.

250
3-6 Security 3-6.1 Access Management Statistics
This page provides statistics for access management.
Web Interface
To configure an Assess Management Statistics in the web interface: 1. Click Security, Access Management Statistics. 2. Checked “Auto-refresh”.
3. Click “Refresh” to refresh the port detailed statistics or clear all information when you click “Clear”.
Figure 3-6.1: The Access Management Statistics
Parameter description: Interface :
The interface type through which the remote host can access the switch. Received Packets :
Number of received packets from the interface when access management mode is enabled. Allowed Packets :
Number of allowed packets from the interface when access management mode is enabled Discarded Packets. :
Number of discarded packets from the interface when access management mode is enabled.
Buttons
Auto-refresh: Check this box to refresh the page automatically. Automatic refresh occurs every 3 seconds.

251
Refresh: Click to refresh the page. Clear: Clears the counters for the selected port.
3-6.2 Network 3-6.2.1 Port Security
3-6.2.1.1 Switch
This page shows the Port Security status. Port Security is a module with no direct configuration. Configuration comes indirectly from other modules - the user modules. When a user module has enabled port security on a port, the port is set-up for software-based learning. In this mode, frames from unknown MAC addresses are passed on to the port security module, which in turn asks all user modules whether to allow this new MAC address to forward or block it. For a MAC address to be set in the forwarding state, all enabled user modules must unanimously agree on allowing the MAC address to forward. If only one chooses to block it, it will be blocked until that user module decides otherwise. The status page is divided into two sections - one with a legend of user modules and one with the actual port status.
Web Interface
To configure a Port Security Switch Status Configuration in the web interface: 1. Click Security, Network, Port Security, then Switch 2. Checked “Auto-refresh”.
3. Click “Refresh” to refresh the port detailed statistics. Figure 3-6.2.1.1: The Port Security Switch Status
Parameter description:

252
User Module Legend The legend shows all user modules that may request Port Security services.
User Module Name The full name of a module that may request Port Security services.
Abbr A one-letter abbreviation of the user module. This is used in the Users column in the port status table.
Port Status The table has one row for each port on the switch and a number of columns, which are:
Port The port number for which the status applies. Click the port number to see the status for this particular port.
Users Each of the user modules has a column that shows whether that module has enabled Port Security or not. A '-' means that the corresponding user module is not enabled, whereas a letter indicates that the user module abbreviated by that letter (see Abbr) has enabled port security.
State Shows the current state of the port. It can take one of four values: Disabled: No user modules are currently using the Port Security service. Ready: The Port Security service is in use by at least one user module, and is awaiting frames from unknown MAC addresses to arrive. Limit Reached: The Port Security service is enabled by at least the Limit Control user module, and that module has indicated that the limit is reached and no more MAC addresses should be taken in. Shutdown: The Port Security service is enabled by at least the Limit Control user module, and that module has indicated that the limit is exceeded. No MAC addresses can be learned on the port until it is administratively re-opened on the Limit Control configuration Web-page.
MAC Count (Current, Limit) The two columns indicate the number of currently learned MAC addresses (forwarding as well as blocked) and the maximum number of MAC addresses that can be learned on the port, respectively. If no user modules are enabled on the port, the Current column will show a dash (-). If the Limit Control user module is not enabled on the port, the Limit column will show a dash (-).
Buttons
Auto-refresh: Check this box to refresh the page automatically. Automatic refresh occurs every 3 seconds. Refresh: Click to refresh the page.

253
3-6.2.1.2 Port This section shows the MAC addresses secured by the Port Security module. Port Security is a module with no direct configuration. Configuration comes indirectly from other modules - the user modules. When a user module has enabled port security on a port, the port is set-up for software-based learning. In this mode, frames from unknown MAC addresses are passed on to the port security module, which in turn asks all user modules whether to allow this new MAC address to forward or block it. For a MAC address to be set in the forwarding state, all enabled user modules must unanimously agree on allowing the MAC address to forward. If only one chooses to block it, it will be blocked until that user module decides otherwise.
Web Interface To configure a Port Security Switch Status Configuration in the web interface: 1. Click Security, Network, Port Security, and then Port. 2. Specify the Port which you want to monitor.
3. Checked “Auto-refresh”.
4. Click “Refresh” to refresh the port detailed statistics.
Figure 3-6.2.1.2: The Port Security Port Status
Parameter description: MAC Address & VLAN ID :
The MAC address and VLAN ID that is seen on this port. If no MAC addresses are learned, a single row stating "No MAC addresses attached" is displayed.
State : Indicates whether the corresponding MAC address is blocked or forwarding. In the blocked state, it will not be allowed to transmit or receive traffic.
Time of Addition : Shows the date and time when this MAC address was first seen on the port.
Age/Hold : If at least one user module has decided to block this MAC address, it will stay in the blocked state until the hold time (measured in seconds) expires. If all user modules have decided to allow this MAC address to forward, and aging is enabled, the Port Security module will periodically check that this MAC address still forwards traffic. If the age period (measured in

254
seconds) expires and no frames have been seen, the MAC address will be removed from the MAC table. Otherwise a new age period will begin. If aging is disabled or a user module has decided to hold the MAC address indefinitely, a dash (-) will be shown.
Buttons
Auto-refresh: Check this box to refresh the page automatically. Automatic refresh occurs every 3 seconds. Refresh: Click to refresh the page.

255
3-6.2.2 NAS
3-6.2.2.1 Switch The section describes to show the each port NAS status information of the switch. The status includes Admin State Port State, Last Source, Last ID, QoS Class, and Port VLAN ID.
Web Interface To configure a NAS Switch Status Configuration in the web interface: 1. Click Security, Network, NAS, and then Port. 2. Checked “Auto-refresh”. 3. Click “Refresh” to refresh the port detailed statistics.
Figure 3-6.2.2.1: The Network Access Server Switch Status
Parameter description: Port :
The switch port number. Click to navigate to detailed NAS statistics for this port. Admin State :
The port's current administrative state. Refer to NAS Admin State for a description of possible values.
Port State : The current state of the port. Refer to NAS Port State for a description of the individual states.
Last Source : The source MAC address carried in the most recently received EAPOL frame for EAPOL-based authentication, and the most recently received frame from a new client for MAC-based authentication.
Last ID : The user name (supplicant identity) carried in the most recently received Response Identity EAPOL frame for EAPOL-based authentication, and the source MAC address from the most recently received frame from a new client for MAC-based authentication.
QoS Class : QoS Class assigned to the port by the RADIUS server if enabled.

256
Port VLAN ID : The VLAN ID that NAS has put the port in. The field is blank, if the Port VLAN ID is not overridden by NAS. If the VLAN ID is assigned by the RADIUS server, "(RADIUS-assigned)" is appended to the VLAN ID. Read more about RADIUS-assigned VLANs here. If the port is moved to the Guest VLAN, "(Guest)" is appended to the VLAN ID. Read more about Guest VLANs here.
Buttons
Auto-refresh: Check this box to refresh the page automatically. Automatic refresh occurs every 3 seconds. Refresh: Click to refresh the page.

257
3-6.2.2.2 Port The section describes to provide detailed NAS statistics for a specific switch port running EAPOL-based IEEE 802.1X authentication. For MAC-based ports, it shows selected backend server (RADIUS Authentication Server) statistics, only.
Web Interface
To configure a NAS Port Status Configuration in the web interface: 1. Click Security, Network, NAS, and then Port. 2. Checked “Auto-refresh”. 3. Click “Refresh” to refresh the port detailed statistics.
Figure 3-6.2.2.2: The NAS Statistics
Parameter description:
Port State Admin State :
The port's current administrative state. Refer to NAS Admin State for a description of possible values.
Port State : The current state of the port. Refer to NAS Port State for a description of the individual states.
QoS Class : The QoS class assigned by the RADIUS server. The field is blank if no QoS class is assigned.
Port VLAN ID : The VLAN ID that NAS has put the port in. The field is blank, if the Port VLAN ID is not overridden by NAS. If the VLAN ID is assigned by the RADIUS server, "(RADIUS-assigned)" is appended to the VLAN ID. Read more about RADIUS-assigned VLANs here. If the port is moved to the Guest VLAN, "(Guest)" is appended to the VLAN ID. Read more about Guest VLANs here.
Port Counters EAPOL Counters :
These supplicant frame counters are available for the following administrative states:
258
• Force Authorized • Force Unauthorized • Port-based 802.1X • Single 802.1X • Multi 802.1X
Backend Server Counters : These backend (RADIUS) frame counters are available for the following administrative states: • Port-based 802.1X • Single 802.1X • Multi 802.1X • MAC-based Auth.
Last Supplicant/Client Info : Information about the last supplicant/client that attempted to authenticate. This information is available for the following administrative states: • Port-based 802.1X • Single 802.1X • Multi 802.1X • MAC-based Auth.
Selected Counters Selected Counters :
The Selected Counters table is visible when the port is in one of the following administrative states: • Multi 802.1X • MAC-based Auth. The table is identical to and is placed next to the Port Counters table, and will be empty if no MAC address is currently selected. To populate the table, select one of the attached MAC Addresses from the table below.
Attached MAC Addresses Identity :
Shows the identity of the supplicant, as received in the Response Identity EAPOL frame. Clicking the link causes the supplicant's EAPOL and Backend Server counters to be shown in the Selected Counters table. If no supplicants are attached, it shows No supplicants attached. This column is not available for MAC-based Auth.
MAC Address : For Multi 802.1X, this column holds the MAC address of the attached supplicant.For MAC-based Auth., this column holds the MAC address of the attached client. Clicking the link causes the client's Backend Server counters to be shown in the Selected Counters table. If no clients are attached, it shows No clients attached.
VLAN ID

259
This column holds the VLAN ID that the corresponding client is currently secured through the Port Security module.
State : The client can either be authenticated or unauthenticated. In the authenticated state, it is allowed to forward frames on the port, and in the unauthenticated state, it is blocked. As long as the backend server hasn't successfully authenticated the client, it is unauthenticated. If an authentication fails for one or the other reason, the client will remain in the unauthenticated state for Hold Time seconds.
Last Authentication :
Shows the date and time of the last authentication of the client (successful as well as unsuccessful).
Buttons
Auto-refresh: Check this box to refresh the page automatically. Automatic refresh occurs every 3 seconds. Refresh: Click to refresh the page. Clear: This button is available in the following modes: • Force Authorized • Force Unauthorized • Port-based 802.1X • Single 802.1X Clear All: Click to clear the counters for the selected port. This button is available in the following modes: • Multi 802.1X • MAC-based Auth.X Clear This: Click to clear both the port counters and all of the attached client's counters. The "Last Client" will not be cleared, however. This button is available in the following modes: • Multi 802.1X • MAC-based Auth.X Click to clear only the currently selected client's counters.
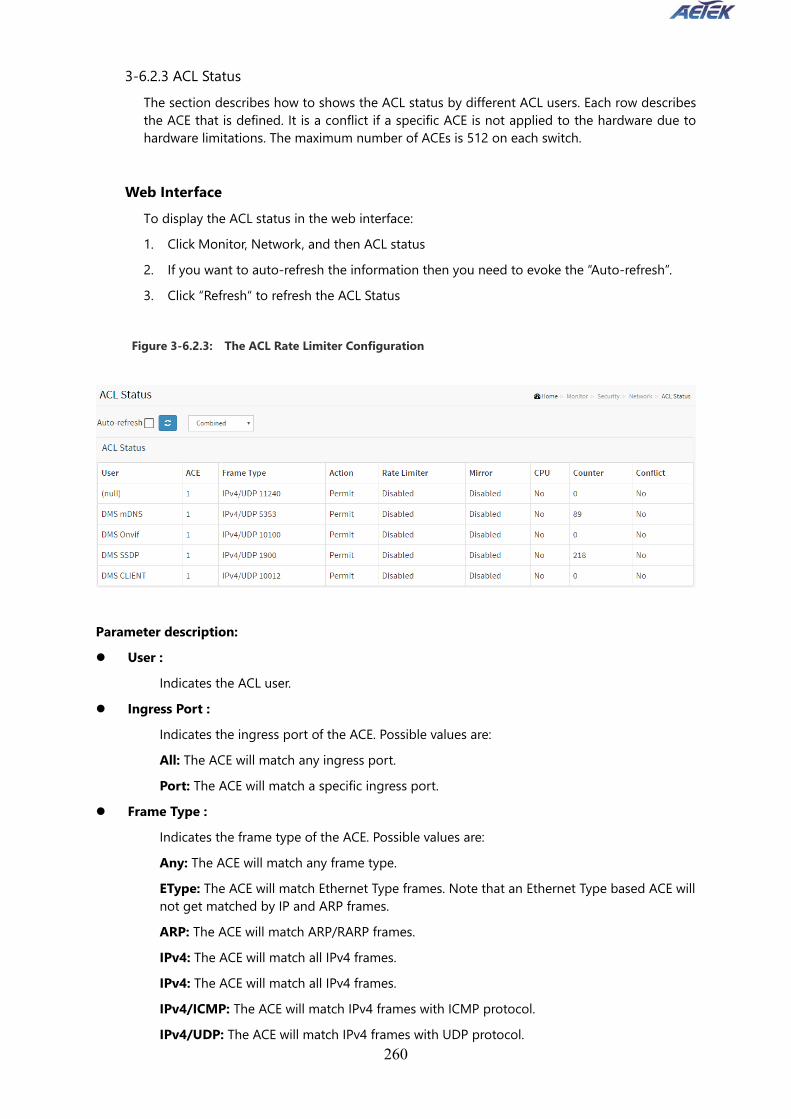
260
3-6.2.3 ACL Status The section describes how to shows the ACL status by different ACL users. Each row describes the ACE that is defined. It is a conflict if a specific ACE is not applied to the hardware due to hardware limitations. The maximum number of ACEs is 512 on each switch.
Web Interface
To display the ACL status in the web interface: 1. Click Monitor, Network, and then ACL status 2. If you want to auto-refresh the information then you need to evoke the “Auto-refresh”. 3. Click “Refresh“ to refresh the ACL Status
Figure 3-6.2.3: The ACL Rate Limiter Configuration
Parameter description: User :
Indicates the ACL user. Ingress Port :
Indicates the ingress port of the ACE. Possible values are: All: The ACE will match any ingress port. Port: The ACE will match a specific ingress port.
Frame Type : Indicates the frame type of the ACE. Possible values are: Any: The ACE will match any frame type. EType: The ACE will match Ethernet Type frames. Note that an Ethernet Type based ACE will not get matched by IP and ARP frames. ARP: The ACE will match ARP/RARP frames. IPv4: The ACE will match all IPv4 frames. IPv4: The ACE will match all IPv4 frames. IPv4/ICMP: The ACE will match IPv4 frames with ICMP protocol. IPv4/UDP: The ACE will match IPv4 frames with UDP protocol.

261
IPv4/TCP: The ACE will match IPv4 frames with TCP protocol. IPv4/Other: The ACE will match IPv4 frames, which are not ICMP / UDP / TCP. IPv6: The ACE will match all IPv6 standard frames.
Action : Indicates the forwarding action of the ACE. Permit: Frames matching the ACE may be forwarded and learned. Deny: Frames matching the ACE are dropped. Filter: Frames matching the ACE are filtered.
Rate Limiter : Indicates the rate limiter number of the ACE. The allowed range is 1 to 16. When Disabled is displayed, the rate limiter operation is disabled.
Port Redirect : Indicates the port copy operation of the ACE. Frames matching the ACE are copied to the port number. The allowed values are Disabled or a specific port number. When Disabled is displayed, the port copy operation is disabled.
CPU : Forward packet that matched the specific ACE to CPU.
CPU Once : Forward first packet that matched the specific ACE to CPU.
Counter : The counter indicates the number of times the ACE was hit by a frame.
Conflict : Indicates the hardware status of the specific ACE. The specific ACE is not applied to the hardware due to hardware limitations.
Buttons
Auto-refresh: Check this box to refresh the page automatically. Automatic refresh occurs every 3 seconds. Refresh: Click to refresh the page.

262
3-6.2.4 ARP Inspection The section describes to configure the Dynamic ARP Inspection Table parameters of the switch. The Dynamic ARP Inspection Table contains up to 1024 entries, and is sorted first by port, then by VLAN ID, then by MAC address, and then by IP address.
Web Interface
To configure a Dynamic ARP Inspection Table Configuration in the web interface: 1. Click Security, Network, ARP Inspection. 2. Checked “Auto-refresh”.
3. Click “Refresh” to refresh the port detailed statistics. 4. Specify the Start from port, VLAN ID, MAC Address, IP Address, and entries per page.
. Figure 3-6.2.4: The Dynamic ARP Inspection Table
Parameter description: Navigating the ARP Inspection Table: Each page shows up to 99 entries from the Dynamic ARP Inspection table, default being 20, selected through the "entries per page" input field. When first visited, the web page will show the first 20 entries from the beginning of the Dynamic ARP Inspection Table. The "Start from port address", "VLAN", "MAC address" and "IP address" input fields allow the user to select the starting point in the Dynamic ARP Inspection Table. Clicking the button will update the displayed table starting from that or the closest next Dynamic ARP Inspection Table match. In addition, the two input fields will - upon a button click - assume the value of the first displayed entry, allowing for continuous refresh with the same start address. The will use the last entry of the currently displayed table as a basis for the next lookup. When the end is reached the text "No more entries" is shown in the displayed table. Use the button to start over. Port :
Switch Port Number for which the entries are displayed. VLAN ID :
VLAN-ID in which the ARP traffic is permitted. MAC Address :
User MAC address of the entry. IP Address :

263
User IP address of the entry. Buttons
Auto-refresh: Check this box to refresh the page automatically. Automatic refresh occurs every 3 seconds. Refresh: Click to refresh the page. |<<: Updates the system log entries to the first available entry ID. >> : Updates the system log entry to the next available entry ID.
3-6.2.5 IP Source Guard Entries in the Dynamic IP Source Guard Table are shown on this page. The Dynamic IP Source Guard Table is sorted first by port, then by VLAN ID, then by IP address, and then by MAC address.
Web Interface
To configure a Dynamic IP Source Guard Table Configuration in the web interface: 1. Click Security, Network, IP Source Guard. 2. Checked “Auto-refresh”.
3. Click “Refresh” to refresh the port detailed statistics. 4. Specify the Start from port, VLAN ID, IP Address, and entries per page. Figure 3-6.2.5: The Dynamic IP Source Table
Parameter description: Port :
Switch Port Number for which the entries are displayed. VLAN ID :
VLAN-ID in which the IP traffic is permitted. IP Address :
User IP address of the entry. MAC Address :
Source MAC address.

264
Buttons
Auto-refresh: Check this box to refresh the page automatically. Automatic refresh occurs every 3 seconds. Refresh: Click to refresh the page. |<<: Updates the system log entries to the first available entry ID. >> : Updates the system log entry to the next available entry ID.

265
3-6.3 AAA
3-6.3.1 RADIUS Overview This section shows you an overview of the RADIUS Authentication and Accounting servers’ status to ensure the function is workable.
Web Interface
To configure a RADIUS Overview Configuration in the web interface: 1. Click Security, AAA, RADIUS Overview.
2. Checked “Auto-refresh”. 3. Click “Refresh” to refresh the port detailed statistics. Figure 3-6.3.1: The RADIUS Authentication Server Status Overview
Parameter description: # :
The RADIUS server number. Click to navigate to detailed statistics for this server. IP Address :
The IP address and UDP port number (in <IP Address>:<UDP Port> notation) of this server. State :
The current state of the server. This field takes one of the following values: Disabled: The server is disabled. Not Ready: The server is enabled, but IP communication is not yet up and running. Ready: The server is enabled, IP communication is up and running, and the RADIUS module is ready to accept access attempts. Dead (X seconds left): Access attempts were made to this server, but it did not reply within the configured timeout. The server has temporarily been disabled, but will get re-enabled when the dead-time expires. The number of seconds left before this occurs is displayed in parentheses. This state is only reachable when more than one server is enabled.
RADIUS Accounting Servers
# :

266
The RADIUS server number. Click to navigate to detailed statistics for this server. IP Address :
The IP address and UDP port number (in <IP Address>:<UDP Port> notation) of this server. State :
The current state of the server. This field takes one of the following values: Disabled: The server is disabled. Not Ready: The server is enabled, but IP communication is not yet up and running. Ready: The server is enabled, IP communication is up and running, and the RADIUS module is ready to accept accounting attempts. Dead (X seconds left): Accounting attempts were made to this server, but it did not reply within the configured timeout. The server has temporarily been disabled, but will get re-enabled when the dead-time expires. The number of seconds left before this occurs is displayed in parentheses. This state is only reachable when more than one server is enabled.

267
3-6.3.2 RADIUS Details This section shows you a detailed statistics for a particular RADIUS server.
Web Interface To configure a RADIUS Details Configuration in the web interface: 1. Specify Port which want to check.
2. Click Security, AAA, RADIUS Overview.
3. Checked “Auto-refresh”.
4. Click “Refresh” to refresh the port detailed statistics or clear all information when you click “Clear”. Fresh”.
Figure 3-6.3.2: The RADIUS Authentication Statistics Server

268
Parameter description:
RADIUS Authentication Statistics
The statistics map closely to those specified in RFC4668 - RADIUS Authentication Client MIB. Use the server select box to switch between the backend servers to show details for.
Packet Counters RADIUS authentication server packet counter. There are seven receive and four transmit counters.
Direction Name RFC4668 Name Description
Rx Access Accepts
radiusAuthClientExtAccessAccepts
The number of RADIUS Access-Accept packets (valid or invalid) received from the server.
Rx Access Rejects
radiusAuthClientExtAccessRejects
The number of RADIUS Access-Reject packets (valid or invalid) received from the server.
Rx Access Challenges
radiusAuthClientExtAccessChallenges
The number of RADIUS Access-Challenge packets (valid or invalid) received from the server.
Rx Malformed Access Responses
radiusAuthClientExtMalformedAccessResponses
The number of malformed RADIUS Access-Response packets received from the server. Malformed packets include packets with an invalid length. Bad authenticators or Message Authenticator attributes or unknown types are not included as malformed access responses.
Rx Bad Authenticators
radiusAuthClientExtBadAuthenticators
The number of RADIUS Access-Response packets containing invalid authenticators or Message Authenticator attributes received from the server.
Rx Unknown Types
radiusAuthClientExtUnknownTypes
The number of RADIUS packets that were received with unknown types from the server on the authentication port and dropped.

269
Rx Packets Dropped
radiusAuthClientExtPacketsDropped
The number of RADIUS packets that were received from the server on the authentication port and dropped for some other reason.
Tx Access Requests
radiusAuthClientExtAccessRequests
The number of RADIUS Access-Request packets sent to the server. This does not include retransmissions.
Tx Access Retransmissions
radiusAuthClientExtAccessRetransmissions
The number of RADIUS Access-Request packets retransmitted to the RADIUS authentication server.
Tx Pending Requests
radiusAuthClientExtPendingRequests
The number of RADIUS Access-Request packets destined for the server that have not yet timed out or received a response. This variable is incremented when an Access-Request is sent and decremented due to receipt of an Access-Accept, Access-Reject, Access-Challenge, timeout, or retransmission.
Tx Timeouts radiusAuthClientExtTimeouts
The number of authentication timeouts to the server. After a timeout, the client may retry to the same server, send to a different server, or give up. A retry to the same server is counted as a retransmit as well as a timeout. A send to a different server is counted as a Request as well as a timeout.
Other Info This section contains information about the state of the server and the latest round-trip time.
Name RFC4668 Name Description IP Address - IP address and UDP port for the authentication server in
question.
State -
Shows the state of the server. It takes one of the following values: Disabled: The selected server is disabled. Not Ready: The server is enabled, but IP communication is not yet up and running. Ready: The server is enabled, IP communication is up and running, and the RADIUS module is ready to accept access attempts. Dead (X seconds left): Access attempts were made to this server, but it did not reply within the configured timeout. The server has temporarily been disabled, but will get re-enabled when the dead-time expires. The number of seconds left before this occurs is displayed in parentheses. This state is only reachable when more than one server is enabled.
Round-Trip Time
radiusAuthClientExtRoundTripTime
The time interval (measured in milliseconds) between the most recent Access-Reply/Access-Challenge and the Access-Request that matched it from the RADIUS authentication server. The granularity of this measurement is 100 ms. A value of 0 ms indicates that there hasn't been round-trip communication with the server yet.

270
RADIUS Accounting Statistics
The statistics map closely to those specified in RFC4670 - RADIUS Accounting Client MIB. Use the server select box to switch between the backend servers to show details for.
Packet Counters RADIUS accounting server packet counter. There are five receive and four transmit counters.
Direction Name RFC4670 Name Description Rx Responses radiusAccClientExtResponses The number of RADIUS packets (valid
or invalid) received from the server.
Rx Malformed Responses
radiusAccClientExtMalformedResponses
The number of malformed RADIUS packets received from the server. Malformed packets include packets with an invalid length. Bad authenticators or unknown types are not included as malformed access responses.
Rx Bad Authenticators
radiusAcctClientExtBadAuthenticators
The number of RADIUS packets containing invalid authenticators received from the server.
Rx Unknown Types radiusAccClientExtUnknownTypes
The number of RADIUS packets of unknown types that were received from the server on the accounting port.
Rx Packets Dropped
radiusAccClientExtPacketsDropped
The number of RADIUS packets that were received from the server on the accounting port and dropped for some other reason.
Tx Requests radiusAccClientExtRequests The number of RADIUS packets sent to the server. This does not include retransmissions.
Tx Retransmissions radiusAccClientExtRetransmissions
The number of RADIUS packets retransmitted to the RADIUS accounting server.
Tx Pending Requests
radiusAccClientExtPendingRequests
The number of RADIUS packets destined for the server that have not yet timed out or received a response. This variable is incremented when a Request is sent and decremented due to receipt of a Response, timeout, or retransmission.
Tx Timeouts radiusAccClientExtTimeouts
The number of accounting timeouts to the server. After a timeout, the client may retry to the same server, send to a different server, or give up. A retry to the same server is counted as a retransmit as well as a timeout. A send to a different server is counted as a Request as well as a timeout.
Other Info

271
This section contains information about the state of the server and the latest round-trip time.
Name RFC4670 Name Description IP Address - IP address and UDP port for the accounting server in
question.
State -
Shows the state of the server. It takes one of the following values: Disabled: The selected server is disabled. Not Ready: The server is enabled, but IP communication is not yet up and running. Ready: The server is enabled, IP communication is up and running, and the RADIUS module is ready to accept accounting attempts. Dead (X seconds left): Accounting attempts were made to this server, but it did not reply within the configured timeout. The server has temporarily been disabled, but will get re-enabled when the dead-time expires. The number of seconds left before this occurs is displayed in parentheses. This state is only reachable when more than one server is enabled.
Round-Trip Time radiusAccClientExtRoundTripTime
The time interval (measured in milliseconds) between the most recent Response and the Request that matched it from the RADIUS accounting server. The granularity of this measurement is 100 ms. A value of 0 ms indicates that there hasn't been round-trip communication with the server yet.
Buttons:
Auto-refresh –Check this box to enable an automatic refresh of the page at regular intervals. Refresh - Click to refresh the page immediately. Clear - Clears the counters for the selected server. The "Pending Requests" counter will not
be cleared by this operation.

272
3-6.4 Switch 3-6.4.1 RMON
3-6.4.1.1 Statistics This section provides an overview of RMON Statistics entries. Each page shows up to 99 entries from the Statistics table, default being 20, selected through the "entries per page" input field. When first visited, the web page will show the first 20 entries from the beginning of the Statistics table. The first displayed will be the one with the lowest ID found in the Statistics table. The "Start from Control Index" allows the user to select the starting point in the Statistics table. Clicking the button will update the displayed table starting from that or the next closest Statistics table match. The will use the last entry of the currently displayed entry as a basis for the next lookup. When the end is reached the text "No more entries" is shown in the displayed table. Use the button to start over.
Web Interface
To configure a RMON Statistics in the web interface: 1. Specify Port which want to check. 2. Click Security, Switch, RMON, Statistics. 3. Checked “Auto-refresh”. 4. Click “Refresh” to refresh the port detailed statistics.
Figure 3-6.4.1.1: The RMON Statistics Status Overview
Parameter description: ID
Indicates the index of Statistics entry. Data Source(if Index)
The port ID which wants to be monitored. Drop
The total number of events in which packets were dropped by the probe due to lack of resources.
Octets The total number of octets of data (including those in bad packets) received on the network.

273
Pkts The total number of packets (including bad packets, broadcast packets, and multicast packets) received.
Broad-cast The total number of good packets received that were directed to the broadcast address.
Multi-cast The total number of good packets received that were directed to a multicast address.
CRC Errors The total number of packets received that had a length (excluding framing bits, but including FCS octets) of between 64 and 1518 octets, inclusive, but had either a bad Frame Check Sequence (FCS) with an integral number of octets (FCS Error) or a bad FCS with a non-integral number of octets (Alignment Error).
Under-size The total number of packets received that were less than 64 octets.
Over-size The total number of packets received that were longer than 1518 octets.
Frag. The number of frames which size is less than 64 octets received with invalid CRC.
Jabb. The number of frames which size is larger than 64 octets received with invalid CRC.
Coll. The best estimate of the total number of collisions on this Ethernet segment.
64 The total number of packets (including bad packets) received that were 64 octets in length.
65~127 The total number of packets (including bad packets) received that were between 65 to 127 octets in length.
128~255 The total number of packets (including bad packets) received that were between 128 to 255 octets in length.
256~511 The total number of packets (including bad packets) received that were between 256 to 511 octets in length.
512~1023 The total number of packets (including bad packets) received that were between 512 to 1023 octets in length.
1024~1588 The total number of packets (including bad packets) received that were between 1024 to 1588 octets in length.
Buttons

274
Auto-refresh: Check this box to refresh the page automatically. Automatic refresh occurs every 3 seconds.
Refresh: Click to refresh the page immediately. |<< : Updates the table starting from the first entry in the Statistics table, i.e. the entry with the lowest ID. >> : Updates the table, starting with the entry after the last entry currently displayed.

275
3-6.4.1.2 History This section provides an overview of RMON History entries. Each page shows up to 99 entries from the History table, default being 20, selected through the "entries per page" input field. When first visited, the web page will show the first 20 entries from the beginning of the History table. The first displayed will be the one with the lowest History Index and Sample Index found in the History table. The "Start from History Index and Sample Index" allows the user to select the starting point in the History table. The "Start from History Index and Sample Index" allows the user to select the starting point in the History table. Clicking the button will update the displayed table starting from that or the next closest History table match. The will use the last entry of the currently displayed entry as a basis for the next lookup. When the end is reached the text "No more entries" is shown in the displayed table. Use the button to start over.
Web Interface
To configure a RMON history Configuration in the web interface: 1. Specify Port which wants to check. 2. Click Security, Switch, RMON, History. 3. Checked “Auto-refresh”. 4. Click “Refresh” to refresh the port detailed statistics or clear all information when you click
“ Clear”.
Figure 3-6.4.1.2: RMON History Overview
Parameter description: History Index
Indicates the index of History control entry. Sample Index
Indicates the index of the data entry associated with the control entry. Sample Start
The value of sysUpTime at the start of the interval over which this sample was measured. Drop
The total number of events in which packets were dropped by the probe due to lack of resources.
Octets

276
The total number of octets of data (including those in bad packets) received on the network. Pkts
The total number of packets (including bad packets, broadcast packets, and multicast packets) received.
Broadcast The total number of good packets received that were directed to the broadcast address.
Multicast The total number of good packets received that were directed to a multicast address.
CRCErrors The total number of packets received that had a length (excluding framing bits, but including FCS octets) of between 64 and 1518 octets, inclusive, but had either a bad Frame Check Sequence (FCS) with an integral number of octets (FCS Error) or a bad FCS with a non-integral number of octets (Alignment Error).
Undersize The total number of packets received that were less than 64 octets.
Oversize The total number of packets received that were longer than 1518 octets.
Frag. The number of frames which size is less than 64 octets received with invalid CRC.
Jabb. The number of frames which size is larger than 64 octets received with invalid CRC.
Coll. The best estimate of the total number of collisions on this Ethernet segment.
Utilization The best estimate of the mean physical layer network utilization on this interface during this sampling interval, in hundredths of a percent.
Buttons
Auto-refresh: Check this box to refresh the page automatically. Automatic refresh occurs every 3 seconds.
Refresh: Click to refresh the page immediately. |<< : Updates the table starting from the first entry in the History table, i.e., the entry with the lowest History Index and Sample Index >> : Updates the table, starting with the entry after the last entry currently displayed

277
3-6.4.1.3 Alarm This page provides an overview of RMON Alarm entries. Each page shows up to 99 entries from the Alarm table, default being 20, selected through the "entries per page" input field. When first visited, the web page will show the first 20 entries from the beginning of the Alarm table. The first displayed will be the one with the lowest ID found in the Alarm table. The "Start from Control Index" allows the user to select the starting point in the Alarm table. Clicking the button will update the displayed table starting from that or the next closest Alarm table match. The will use the last entry of the currently displayed entry as a basis for the next lookup. When the end is reached the text "No more entries" is shown in the displayed table. Use the button to start over.
Web Interface
To configure a RMON Alarm Overview in the web interface: 1. Specify Port which wants to check. 2. Click Security, Switch, RMON, Alarm. 3. Checked “Auto-refresh”. 4. Click “Refresh” to refresh the port detailed statistics.
Figure 3-6.4.1.3: RMON Alarm Overview
Parameter description: ID
Indicates the index of Alarm control entry. Interval
Indicates the interval in seconds for sampling and comparing the rising and falling threshold.
Variable Indicates the particular variable to be sampled
Sample Type The method of sampling the selected variable and calculating the value to be compared against the thresholds.
Value The value of the statistic during the last sampling period.

278
Startup Alarm The alarm that may be sent when this entry is first set to valid.
Rising Threshold Rising threshold value.
Rising Index Rising event index.
Falling Threshold Falling threshold value.
Falling Index Falling event index.
Buttons
Auto-refresh: Check this box to refresh the page automatically. Automatic refresh occurs every 3 seconds.
Refresh: Click to refresh the page immediately.
|<<: Updates the table starting from the first entry in the Alarm Table, i.e. the entry with the lowest ID.
>> : Updates the table, starting with the entry after the last entry currently displayed.

279
3-6.4.1.4 Event This page provides an overview of RMON Event table entries. Each page shows up to 99 entries from the Event table, default being 20, selected through the "entries per page" input field. When first visited, the web page will show the first 20 entries from the beginning of the Event table. The first displayed will be the one with the lowest Event Index and Log Index found in the Event table . The "Start from Event Index and Log Index" allows the user to select the starting point in the Event table. Clicking the button will update the displayed table starting from that or the next closest Event table match. The will use the last entry of the currently displayed entry as a basis for the next lookup. When the end is reached the text "No more entries" is shown in the displayed table. Use the button to start over.
Web Interface To configure a RMON Event Overview in the web interface: 1. Click Security, Switch, RMON, Event. 2. Checked “Auto-refresh”. 3. Click “ Refresh“ to refresh the port detailed statistics 4. Specify Port which wants to check.
Figure 3-6.4.1.4: RMON Event Overview
Parameter description: Event Index
Indicates the index of the event entry. Log Index
Indicates the index of the log entry. LogTIme
Indicates Event log time LogDescription
Indicates the Event description. Buttons
Auto-refresh: Check this box to refresh the page automatically. Automatic refresh occurs

280
every 3 seconds.
Refresh: Click to refresh the page immediately. |<< : Updates the table starting from the first entry in the Event Table, i.e. the entry with the lowest Event Index and Log Index. >>: Updates the table, starting with the entry after the last entry currently displayed

281
3-7 Aggregation 3-7.1 Status
This page is used to see the status of ports in Aggregation group Web Interface
To display the status of ports in the web interface: 1. Click Monitor, Aggregation, Status 2. Checked “Auto-refresh”. 3. Click “Refresh” to refresh the port detailed statistics. Figure 3-7.1 The LACP System Status
Parameter description: Aggr ID :
The Aggregation ID associated with this aggregation instance. Name
Name of the Aggregation group ID. Type
Type of the Aggregation group(Static or LACP). Speed
Speed of the Aggregation group. Configured ports
Configured member ports of the Aggregation group. Aggregated ports
Aggregated member ports of the Aggregation group Buttons
Auto-refresh: Check this box to refresh the page automatically. Automatic refresh occurs every 3 seconds. Refresh: Click to refresh the page.

282
3-7.2 LACP
3-7.2.1.1 System Status This page provides a status overview for all LACP instances
Web Interface To display the System Status in the web interface: 1. Click Monitor, LACP, System Status 2. If you want to auto-refresh the information then you need to evoke the “Auto refresh”. 3. 3. Click “Refresh” to refresh the LACP Statistics.
Figure 3-7.2.1.1: The System Status
Parameter description: Aggr ID
The Aggregation ID associated with this aggregation instance. For LLAG the id is shown as 'isid:aggr-id' and for GLAGs as 'aggr-id'
Partner System ID The system ID (MAC address) of the aggregation partner.
Partner Key The Key that the partner has assigned to this aggregation ID.
Partner Prio The priority of this partner.
Last Changed The time since this aggregation changed.
Local Ports Shows which ports are a part of this aggregation for this switch.
Buttons
Auto-refresh: Check this box to refresh the page automatically. Automatic refresh occurs every 3 seconds. Refresh: Click to refresh the page.
3-7.2.1.2 Port Status

283
This page provides a status overview for LACP status for all ports.
Web Interface To display the Port Status in the web interface:
1. Click Monitor, LACP, Port Status 2. If you want to auto-refresh the information then you need to evoke the “Auto
refresh”. 3. Click “Refresh” to refresh the LACP Status.
Figure 3-7.2.1.1: The System Status
Parameter description: Port
The switch port number. LACP
'Yes' means that LACP is enabled and the port link is up. 'No' means that LACP is not enabled or that the port link is down. 'Backup' means that the port could not join the aggregation group but will join if other port leaves. Meanwhile it's LACP status is disabled.
Key The key assigned to this port. Only ports with the same key can aggregate together.
Aggr ID The Aggregation ID assigned to this aggregation group.
Partner System ID The partner's System ID (MAC address).
Partner Port The partner's port number connected to this port.
Partner Prio The partner's port priority.
Buttons
Auto-refresh: Check this box to refresh the page automatically. Automatic refresh occurs every 3 seconds. Refresh: Click to refresh the page.
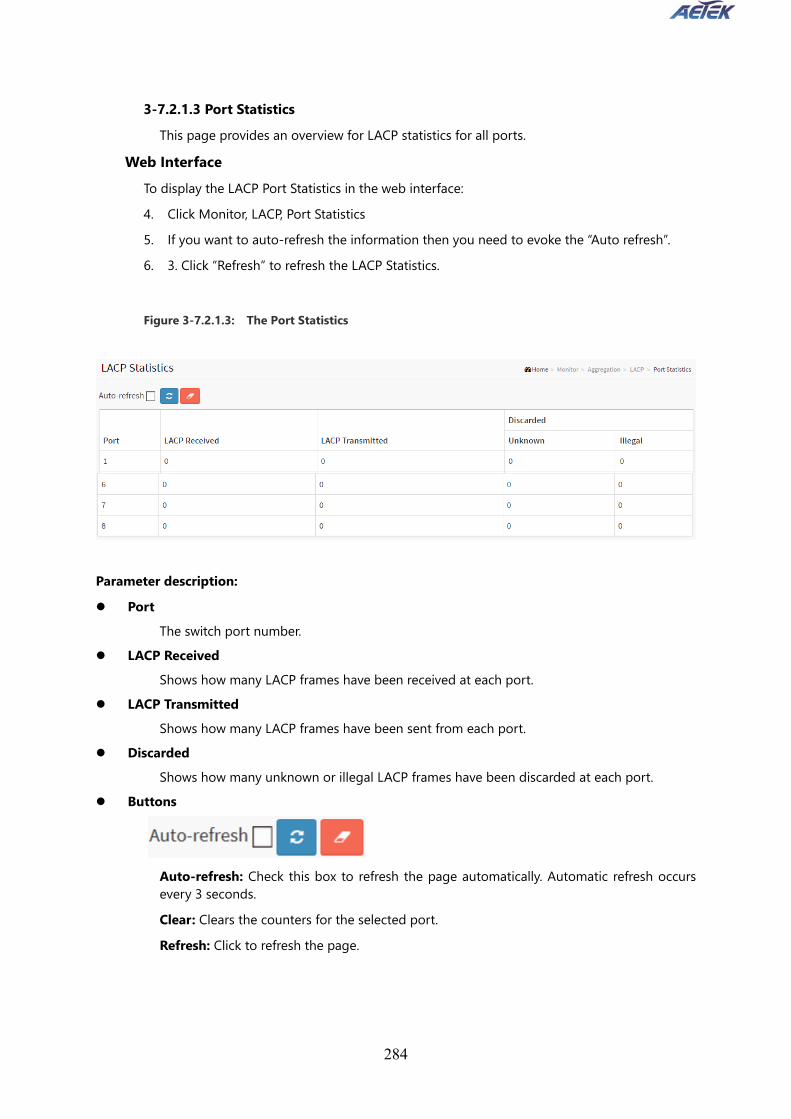
284
3-7.2.1.3 Port Statistics This page provides an overview for LACP statistics for all ports.
Web Interface To display the LACP Port Statistics in the web interface: 4. Click Monitor, LACP, Port Statistics 5. If you want to auto-refresh the information then you need to evoke the “Auto refresh”. 6. 3. Click “Refresh” to refresh the LACP Statistics.
Figure 3-7.2.1.3: The Port Statistics
Parameter description: Port
The switch port number. LACP Received
Shows how many LACP frames have been received at each port. LACP Transmitted
Shows how many LACP frames have been sent from each port. Discarded
Shows how many unknown or illegal LACP frames have been discarded at each port. Buttons
Auto-refresh: Check this box to refresh the page automatically. Automatic refresh occurs every 3 seconds. Clear: Clears the counters for the selected port. Refresh: Click to refresh the page.

285
3-8 Loop Protection
This section displays the loop protection port status the ports of the currently selected switch.
Web Interface To display the Loop Protection status in the web interface: 1. Click Monitor, Loop Protection 2. If you want to auto-refresh the information then you need to evoke the “Auto refresh”. 3. Click “Refresh” to refresh the LACP Statistics.
Figure 3-8 : Loop Protection Status
Parameter description: Port
The switch port number of the logical port. Action
The currently configured port action. Transmit
The currently configured port transmit mode. Loops
The number of loops detected on this port. Status
The current loop protection status of the port. Loop
Whether a loop is currently detected on the port. Time of Last Loop
The time of the last loop event detected. Buttons
Refresh: Click to refresh the page immediately. Auto-refresh: Check this box to enable an automatic refresh of the page at regular intervals.

286
3-9 Spanning Tree 3-9.1 Bridge Status
After you complete the MSTI Port configuration then you could to ask the switch display the Bridge Status. The Section provides a status overview of all STP bridge instances. The displayed table contains a row for each STP bridge instance, where the column displays the following information:
Web Interface To display the STP Bridges status in the web interface: 1. Click Monitor, Spanning Tree, STP Bridges 2. If you want to auto-refresh the information then you need to evoke the “Auto-refresh”. 3. Click “Refresh” to refresh the STP Bridges. 4. Click “CIST “to next page “STP Detailed Bridge Status”.
Figure 3-9.1: The STP Bridges status
Parameter description: MSTI :
The Bridge Instance. This is also a link to the STP Detailed Bridge Status. Bridge ID :
The Bridge ID of this Bridge instance. Root ID :
The Bridge ID of the currently elected root bridge. Root Port :
The switch port currently assigned the root port role. Root Cost :
Root Path Cost. For the Root Bridge it is zero. For all other Bridges, it is the sum of the Port Path Costs on the least cost path to the Root Bridge.
Topology Flag : The current state of the Topology Change Flag of this Bridge instance.
Topology Change Last : The time since last Topology Change occurred.
Buttons

287
Auto-refresh: Check this box to refresh the page automatically. Automatic refresh occurs every 3 seconds. Refresh: Click to refresh the page.

288
3-9.2 Port Status After you complete the STP configuration then you could to ask the switch display the STP Port Status. The Section provides you to ask switch to display the STP CIST port status for physical ports of the currently selected switch.
Web Interface To display the STP Port status in the web interface: 1. Click Monitor, Spanning Tree, STP Port Status 2. If you want to auto-refresh the information then you need to evoke the “Auto-refresh”. 3. Click “Refresh” to refresh the STP Bridges.
Figure 3-9.2: The STP Port status
Parameter description: Port :
The switch port number of the logical STP port. CIST Role :
The current STP port role of the CIST port. The port role can be one of the following values: AlternatePort, Backup Port, RootPort, DesignatedPort Disabled.
CIST State : The current STP port state of the CIST port. The port state can be one of the following values: Blocking Learning Forwarding.
Uptime The time since the bridge port was last initialized.
Buttons
Auto-refresh: Check this box to refresh the page automatically. Automatic refresh occurs every 3 seconds. Refresh: Click to refresh the page.

289
3-9.3 Port Statistics After you complete the STP configuration then you could to let the switch display the STP Statistics. The Section provides you to ask switch to display the STP Statistics detail counters of bridge ports in the currently selected switch.
Web Interface
To display the STP Port status in the web interface: 1. Click Monitor, Spanning Tree, Port Statistics 2. If you want to auto-refresh the information then you need to evoke the “Auto-refresh”. 3. Click “Refresh” to refresh the STP Bridges. Figure 3-9.3: The STP Statistics
Parameter description: Port :
The switch port number of the logical STP port. MSTP :
The number of MSTP Configuration BPDU's received/transmitted on the port. RSTP :
The number of RSTP Configuration BPDU's received/transmitted on the port. STP :
The number of legacy STP Configuration BPDU's received/transmitted on the port. TCN :
The number of (legacy) Topology Change Notification BPDU's received/transmitted on the port.
Discarded Unknown : The number of unknown Spanning Tree BPDU's received (and discarded) on the port.
Discarded Illegal : The number of illegal Spanning Tree BPDU's received (and discarded) on the port.
Buttons
Auto-refresh: Check this box to refresh the page automatically. Automatic refresh occurs every 3 seconds.

290
Clear: Clears the counters for the selected port. Refresh: Click to refresh the page.

291
3-10 MVR 3-10.1 Statistics
The section describes the switch will display the MVR detail Statistics after you had configured MVR on the switch. It provides the detail MVR Statistics Information
Web Interface To display the MVR Statistics Information in the web interface:
1. Click Monitor, MVR, Statistics 2. If you want to auto-refresh the information then you need to evoke the “Auto-refresh”. 3. To click the “Refresh” to refresh an entry of the MVR Statistics Information.
Figure 3-10.1: The MVR Statistics Information
Parameter description: VLAN ID
The Multicast VLAN ID. IGMP/MLD Queries Received
The number of Received Queries for IGMP and MLD, respectively. IGMP/MLD Queries Transmitted
The number of Transmitted Queries for IGMP and MLD, respectively. IGMPv1 Joins Received
The number of Received IGMPv1 Join's. IGMPv2/MLDv1 Report's Received
The number of Received IGMPv2 Join's and MLDv1 Report's, respectively. IGMPv3/MLDv2 Report's Received
The number of Received IGMPv1 Join's and MLDv2 Report's, respectively. IGMPv2/MLDv1 Leave's Received
The number of Received IGMPv2 Leave's and MLDv1 Done's, respectively. Buttons
Auto-refresh: Check this box to refresh the page automatically. Automatic refresh occurs every 3 seconds. Clear: Clears the counters for the selected port.

292
Refresh: Click to refresh the page.

293
3-10.2 MVR Channels Groups The section describes user could display the MVR Groups detail information on the switch. Entries in the MVR Group Table are shown on this page. The MVR Group Table is sorted first by VLAN ID, and then by group
Web Interface To display the MVR Groups Information in the web interface: 1. Click Monitor, MVR, Groups Information 2. If you want to auto-refresh the information then you need to evoke the “Auto-refresh”. 3. To click the “Refresh” to refresh an entry of the MVR Groups Information. 4. Click “<< or >> “to move to previous or next entry.
Figure 3-10.2: The MVR Groups Information
Parameter description:
Navigating the MVR Channels (Groups) Information Table
Each page shows up to 99 entries from the MVR Group table, default being 20, selected through the "entries per page" input field. When first visited, the web page will show the first 20 entries from the beginning of the MVR Channels (Groups) Information Table. The "Start from VLAN", and "Group Address" input fields allow the user to select the starting point in the MVR Channels (Groups) Information Table. Clicking the button will update the displayed table starting from that or the closest next MVR Channels (Groups) Information Table match. In addition, the two input fields will - upon a button click - assume the value of the first displayed entry, allowing for continuous refresh with the same start address. The will use the last entry of the currently displayed table as a basis for the next lookup. When the end is reached the text "No more entries" is shown in the displayed table. Use the button to start over
MVR Channels (Groups) Information Table Columns
VLAN ID : VLAN ID of the group.
Groups : Group ID of the group displayed.

294
Port Members : Ports under this group.
Buttons
Auto-refresh: Check this box to refresh the page automatically. Automatic refresh occurs every 3 seconds. Refresh: Click to refresh the page. |<<: Updates the system log entries to the first available entry ID >> : Updates the system log entry to the next available entry ID

295
3-10.3 MVR SFM Information The MVR SFM (Source-Filtered Multicast) Information Table also contains the SSM (Source-Specific Multicast) information. This table is sorted first by VLAN ID, then by group, and then by Port. Different source addresses belong to the same group are treated as single entry.
Web Interface
To display the MVR SFM Information in the web interface: 1. Click Monitor, MVR, MVR SFM Information 2. If you want to auto-refresh the information then you need to evoke the “Auto-refresh”. 3. To click the “Refresh” to refresh an entry of the MVR Groups Information. 4. Click “<< or >> “to move to previous or next entry.
Figure 3-10.3: The MVR SFM Information
Parameter description:
Navigating the MVR SFM Information Table
Each page shows up to 99 entries from the MVR SFM Information Table, default being 20, selected through the "entries per page" input field. When first visited, the web page will show the first 20 entries from the beginning of the MVR SFM Information Table. The "Start from VLAN", and "Group Address" input fields allow the user to select the starting point in the MVR SFM Information Table. Clicking the button will update the displayed table starting from that or the closest next MVR SFM Information Table match. In addition, the two input fields will - upon a button click - assume the value of the first displayed entry, allowing for continuous refresh with the same start address. The will use the last entry of the currently displayed table as a basis for the next lookup. When the end is reached the text "No more entries" is shown in the displayed table. Use the button to start over.
MVR SFM Information Table Columns
VLAN ID VLAN ID of the group.
Group Group address of the group displayed.

296
Port Switch port number.
Mode Indicates the filtering mode maintained per (VLAN ID, port number, Group Address) basis. It can be either Include or Exclude.
Source Address IP Address of the source. Currently, system limits the total number of IP source addresses for filtering to be 128. When there is no any source filtering address, the text "None" is shown in the Source Address field.
Type Indicates the Type. It can be either Allow or Deny.
Hardware Filter/Switch Indicates whether data plane destined to the specific group address from the source IPv4/IPv6 address could be handled by chip or not.
Buttons
Auto-refresh: Check this box to refresh the page automatically. Automatic refresh occurs every 3 seconds. Refresh: Click to refresh the page. |<<: Updates the system log entries to the first available entry ID >> : Updates the system log entry to the next available entry ID
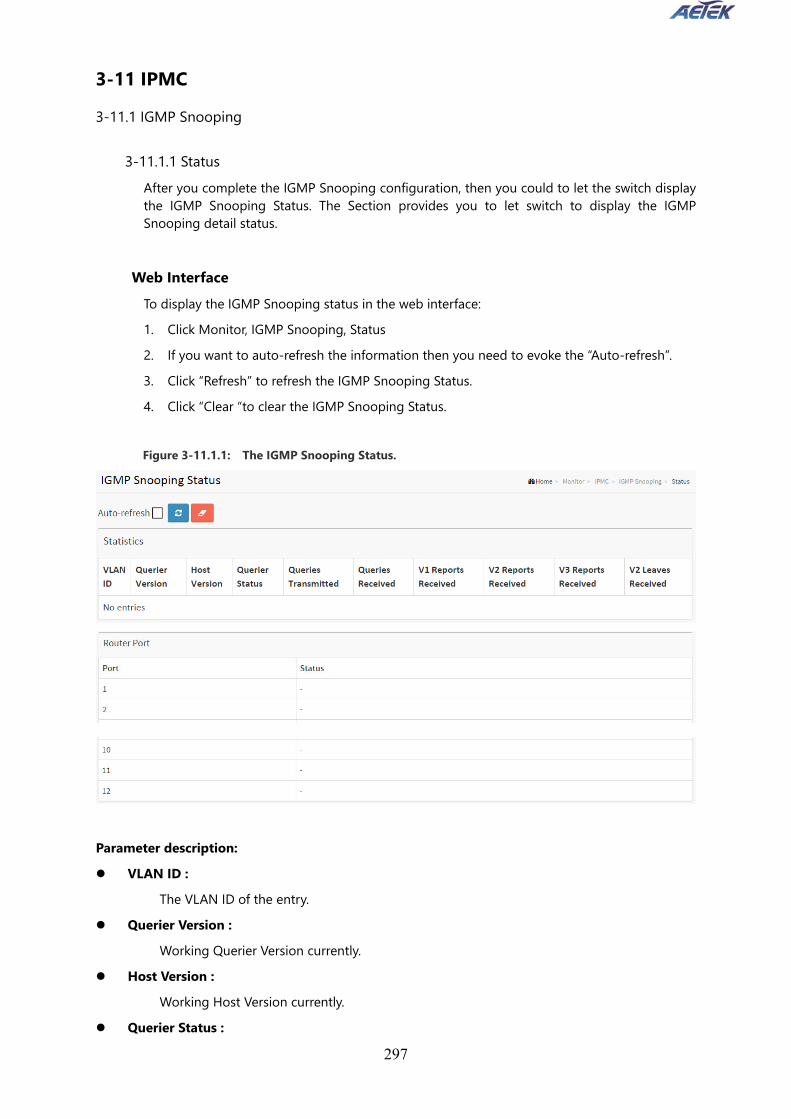
297
3-11 IPMC 3-11.1 IGMP Snooping
3-11.1.1 Status After you complete the IGMP Snooping configuration, then you could to let the switch display the IGMP Snooping Status. The Section provides you to let switch to display the IGMP Snooping detail status.
Web Interface
To display the IGMP Snooping status in the web interface: 1. Click Monitor, IGMP Snooping, Status 2. If you want to auto-refresh the information then you need to evoke the “Auto-refresh”. 3. Click “Refresh” to refresh the IGMP Snooping Status. 4. Click “Clear “to clear the IGMP Snooping Status.
Figure 3-11.1.1: The IGMP Snooping Status.
Parameter description: VLAN ID :
The VLAN ID of the entry. Querier Version :
Working Querier Version currently. Host Version :
Working Host Version currently. Querier Status :

298
Shows the Querier status is "ACTIVE" or "IDLE". "DISABLE" denotes the specific interface is administratively disabled.
Queries Transmitted : The number of Transmitted Queries.
Queries Received : The number of Received Queries.
V1 Reports Received : The number of Received V1 Reports.
V2 Reports Received : The number of Received V2 Reports.
V3 Reports Received : The number of Received V3 Reports.
V2 Leaves Received : The number of Received V2 Leaves.
Router Port Display which ports act as router ports. A router port is a port on the Ethernet switch that leads towards the Layer 3 multicast device or IGMP querier. Static denotes the specific port is configured to be a router port. Dynamic denotes the specific port is learnt to be a router port. Both denote the specific port is configured or learnt to be a router port.
Port Switch port number.
Status Indicate whether specific port is a router port or not.
Buttons
Auto-refresh: Check this box to refresh the page automatically. Automatic refresh occurs every 3 seconds. Clear: Clears the counters for the selected port. Refresh: Click to refresh the page.

299
3-11.1.2 Group Information After you complete to set the IGMP Snooping function then you could let the switch to display the IGMP Snooping Group Information. Entries in the IGMP Group Table are shown on this page. The IGMP Group Table is sorted first by VLAN ID, and then by group. The will use the last entry of the currently displayed table as a basis for the next lookup. When the end is reached the text "No more entries" is shown in the displayed table. Use the button to start over.
Web Interface To display the IGMP Snooping Group Information in the web interface: 1. Click Monitor, IGMP Snooping, Group Information 2. If you want to auto-refresh the information then you need to evoke the “Auto-refresh”. 3. Click “Refresh” to refresh an entry of the IGMP Snooping Groups Information. 4. Click “<< or >> “to move to previous or next entry. Figure 3-11.1.2: The IGMP Snooping Groups Information.
Parameter description:
Navigating the IGMP Group Table
Each page shows up to 99 entries from the IGMP Group table, default being 20, selected through the "entries per page" input field. When first visited, the web page will show the first 20 entries from the beginning of the IGMP Group Table. The "Start from VLAN", and "group" input fields allow the user to select the starting point in the IGMP Group Table. Clicking the button will update the displayed table starting from that or the closest next IGMP Group Table match. In addition, the two input fields will - upon a button click - assume the value of the first displayed entry, allowing for continuous refresh with the same start address. The will use the last entry of the currently displayed table as a basis for the next lookup. When the end is reached the text "No more entries" is shown in the displayed table. Use the button to start over.
IGMP Group Table Columns
VLAN ID : VLAN ID of the group.
Groups :

300
Group address of the group displayed. Port Members :
Ports under this group. Buttons
Auto-refresh: Check this box to refresh the page automatically. Automatic refresh occurs every 3 seconds. Refresh: Click to refresh the page. |<<: Updates the system log entries to the first available entry ID >> : Updates the system log entry to the next available entry ID

301
3-11.1.3 IPv4 SFM Information Entries in the IGMP SFM Information Table are shown on this page. The IGMP SFM (Source-Filtered Multicast) Information Table also contains the SSM (Source-Specific Multicast) information. This table is sorted first by VLAN ID, then by group, and then by Port. Different source addresses belong to the same group are treated as single entry.
Web Interface
To display the IPv4 SSM Information in the web interface: 1. Click Monitor, IGMP Snooping, IPv4 SSM Information 2. If you want to auto-refresh the information then you need to evoke the “Auto-refresh”. 3. Click “Refresh” to refresh an entry of the IPv4 SFM Information. 4. Click “<< or >> “to move to previous or next entry.
Figure 3-11.1.3: The IPv4 SFM Information.
Parameter description:
Navigating the IGMP SFM Information Table
Each page shows up to 99 entries from the IGMP SFM Information table, default being 20, selected through the "entries per page" input field. When first visited, the web page will show the first 20 entries from the beginning of the IGMP SFM Information Table. The "Start from VLAN", and "group" input fields allow the user to select the starting point in the IGMP SFM Information Table. Clicking the button will update the displayed table starting from that or the closest next IGMP SFM Information Table match. In addition, the two input fields will - upon a button click - assume the value of the first displayed entry, allowing for continuous refresh with the same start address. The will use the last entry of the currently displayed table as a basis for the next lookup. When the end is reached the text "No more entries" is shown in the displayed table. Use the button to start over.
IGMP SFM Information Table Columns
VLAN ID : VLAN ID of the group.
Group : Group address of the group displayed.

302
Port : Switch port number.
Mode : Indicates the filtering mode maintained per (VLAN ID, port number, Group Address) basis. It can be either Include or Exclude.
Source Address : IP Address of the source. Currently, system limits the total number of IP source addresses for filtering to be 128.
Type : Indicates the Type. It can be either Allow or Deny.
Hardware Filter/Switch Indicates whether data plane destined to the specific group address from the source IPv4 address could be handled by chip or not.
Buttons
Auto-refresh: Check this box to refresh the page automatically. Automatic refresh occurs every 3 seconds. Refresh: Click to refresh the page. |<<: Updates the system log entries to the first available entry ID >>: Updates the system log entry to the next available entry ID

303
3-11.2 MLD Snooping
3-11.2.1 Status The section describes when you complete the MLD Snooping and how to display the MLD Snooping Status and detail information. It will help you to find out the detail information of MLD Snooping status.
Web Interface To display the MLD Snooping Status in the web interface: 1. Click Monitor, MLD Snooping, Status 2. If you want to auto-refresh the information then you need to evoke the “Auto-refresh” 3. Click “Refresh” to refresh an entry of the MLD Snooping Status Information. 4. Click “Clear “to clear the MLD Snooping Status.
Figure 3-11.2.1: The MLD Snooping Status
Parameter description: VLAN ID :
The VLAN ID of the entry. Querier Version :
Working Querier Version currently. Host Version :
Working Host Version currently. Querier Status :
Show the Querier status is "ACTIVE" or "IDLE". "DISABLE" denotes the specific interface is administratively disabled.

304
Queries Transmitted : The number of Transmitted Queries.
Queries Received : The number of Received Queries.
V1 Reports Received : The number of Received V1 Reports.
V2 Reports Received : The number of Received V2 Reports.
V1 Leaves Received : The number of Received V1 Leaves.
Router Port Display which ports act as router ports. A router port is a port on the Ethernet switch that leads towards the Layer 3 multicast device or MLD querier. Static denotes the specific port is configured to be a router port. Dynamic denotes the specific port is learnt to be a router port. Both denote the specific port is configured or learnt to be a router port.
Port Switch port number.
Status Indicate whether specific port is a router port or not.
Buttons
Auto-refresh: Check this box to refresh the page automatically. Automatic refresh occurs every 3 seconds. Clear: Clears the counters for the selected port. Refresh: Click to refresh the page.
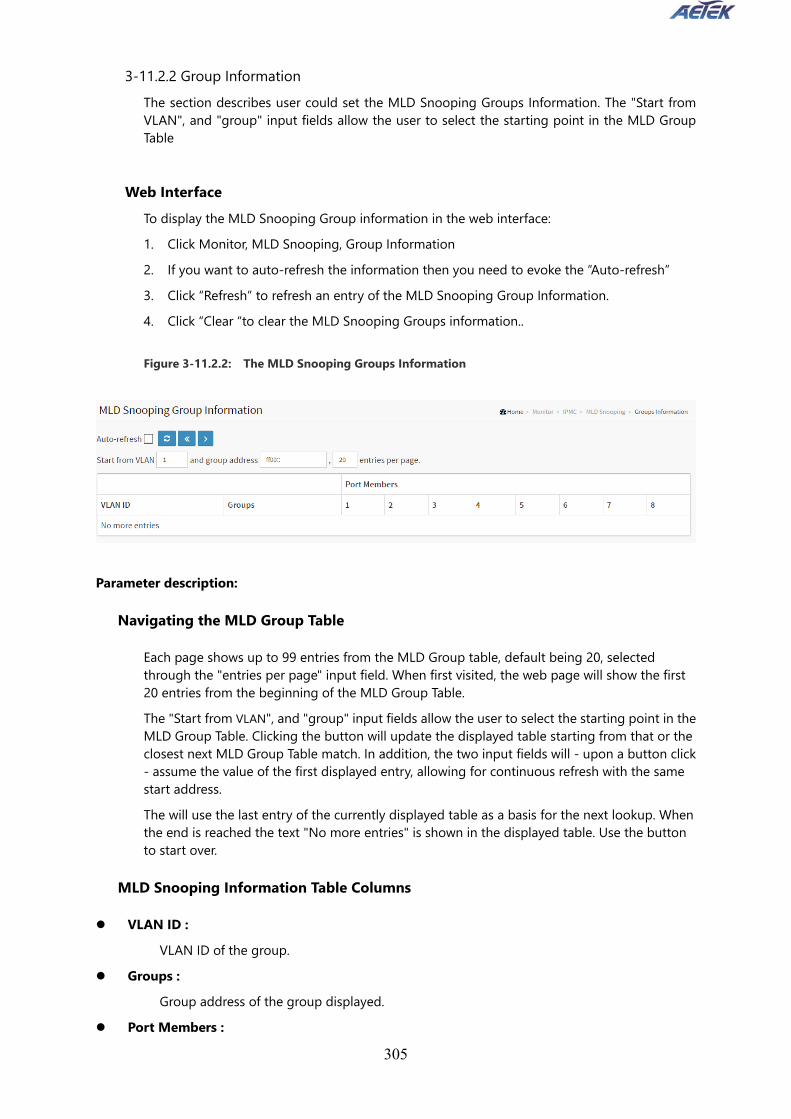
305
3-11.2.2 Group Information The section describes user could set the MLD Snooping Groups Information. The "Start from VLAN", and "group" input fields allow the user to select the starting point in the MLD Group Table
Web Interface
To display the MLD Snooping Group information in the web interface: 1. Click Monitor, MLD Snooping, Group Information 2. If you want to auto-refresh the information then you need to evoke the “Auto-refresh” 3. Click “Refresh” to refresh an entry of the MLD Snooping Group Information. 4. Click “Clear “to clear the MLD Snooping Groups information.. Figure 3-11.2.2: The MLD Snooping Groups Information
Parameter description:
Navigating the MLD Group Table
Each page shows up to 99 entries from the MLD Group table, default being 20, selected through the "entries per page" input field. When first visited, the web page will show the first 20 entries from the beginning of the MLD Group Table. The "Start from VLAN", and "group" input fields allow the user to select the starting point in the MLD Group Table. Clicking the button will update the displayed table starting from that or the closest next MLD Group Table match. In addition, the two input fields will - upon a button click - assume the value of the first displayed entry, allowing for continuous refresh with the same start address. The will use the last entry of the currently displayed table as a basis for the next lookup. When the end is reached the text "No more entries" is shown in the displayed table. Use the button to start over.
MLD Snooping Information Table Columns
VLAN ID : VLAN ID of the group.
Groups : Group address of the group displayed.
Port Members :

306
Ports under this group. Buttons
Auto-refresh: Check this box to refresh the page automatically. Automatic refresh occurs every 3 seconds. Refresh: Click to refresh the page. |<<: Updates the system log entries to the first available entry ID >> : Updates the system log entry to the next available entry ID
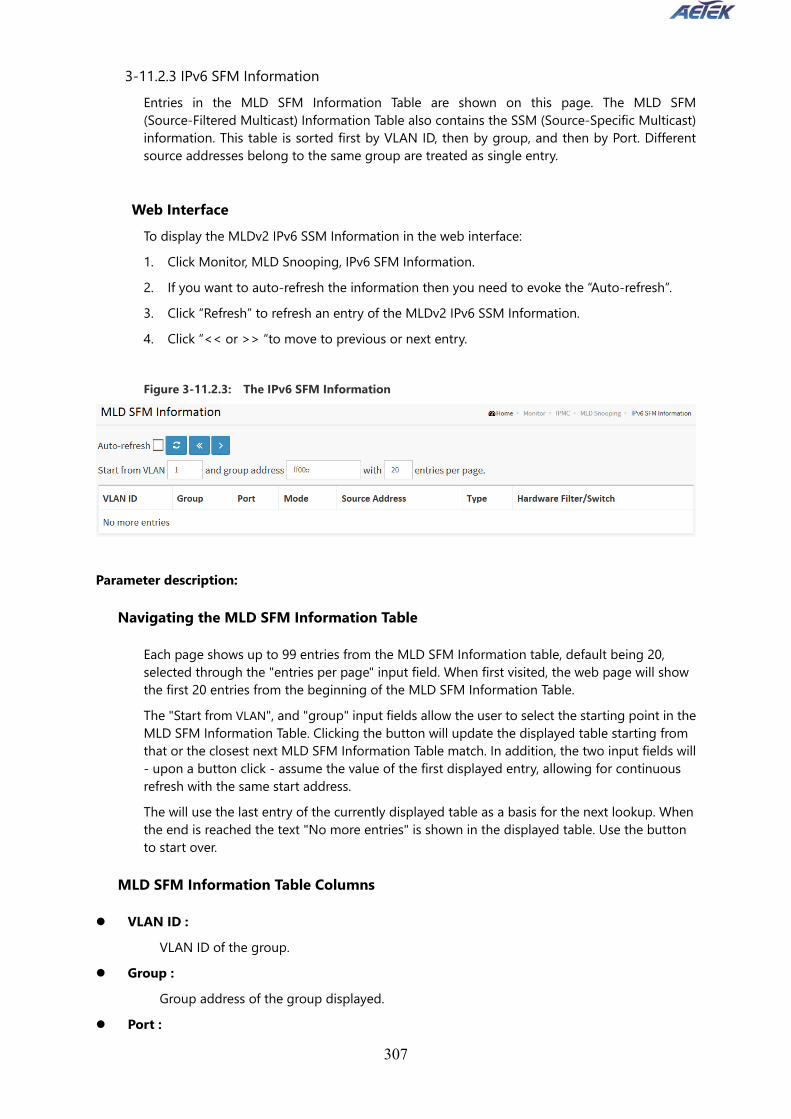
307
3-11.2.3 IPv6 SFM Information Entries in the MLD SFM Information Table are shown on this page. The MLD SFM (Source-Filtered Multicast) Information Table also contains the SSM (Source-Specific Multicast) information. This table is sorted first by VLAN ID, then by group, and then by Port. Different source addresses belong to the same group are treated as single entry.
Web Interface
To display the MLDv2 IPv6 SSM Information in the web interface: 1. Click Monitor, MLD Snooping, IPv6 SFM Information. 2. If you want to auto-refresh the information then you need to evoke the “Auto-refresh”. 3. Click “Refresh” to refresh an entry of the MLDv2 IPv6 SSM Information. 4. Click “<< or >> “to move to previous or next entry. Figure 3-11.2.3: The IPv6 SFM Information
Parameter description:
Navigating the MLD SFM Information Table
Each page shows up to 99 entries from the MLD SFM Information table, default being 20, selected through the "entries per page" input field. When first visited, the web page will show the first 20 entries from the beginning of the MLD SFM Information Table. The "Start from VLAN", and "group" input fields allow the user to select the starting point in the MLD SFM Information Table. Clicking the button will update the displayed table starting from that or the closest next MLD SFM Information Table match. In addition, the two input fields will - upon a button click - assume the value of the first displayed entry, allowing for continuous refresh with the same start address. The will use the last entry of the currently displayed table as a basis for the next lookup. When the end is reached the text "No more entries" is shown in the displayed table. Use the button to start over.
MLD SFM Information Table Columns
VLAN ID : VLAN ID of the group.
Group : Group address of the group displayed.
Port :

308
Switch port number. Mode :
Indicates the filtering mode maintained per (VLAN ID, port number, Group Address) basis. It can be either Include or Exclude.
Source Address : IP Address of the source. Currently, system limits the total number of IP source addresses for filtering to be 128.
Type : Indicates the Type. It can be either Allow or Deny.
Hardware Filter/Switch Indicates whether data plane destined to the specific group address from the source IPv6 address could be handled by chip or not.
Buttons
Auto-refresh: Check this box to refresh the page automatically. Automatic refresh occurs every 3 seconds. Refresh: Click to refresh the page. |<<: Updates the system log entries to the first available entry ID >> : Updates the system log entry to the next available entry ID

309
3-12 LLDP 3-12.1 Neighbour
This page provides a status overview for all LLDP neighbours. The displayed table contains a row for each port on which an LLDP neighbour is detected. The columns hold the following information:
Web Interface
To show LLDP neighbours: 1. Click Monitor, LLDP, Neighbours. 2. Click Refresh for manual update web screen 3. Click Auto-refresh for auto-update web screen
Figure 3-12.1: The LLDP Neighbours information
NOTE: If your network without any device supports LLDP then the table will show “No LLDP neighbour information found”.
Parameter description: Local Port :
The port on which the LLDP frame was received. Chassis ID :
The Chassis ID is the identification of the neighbour's LLDP frames. Port ID :
The Remote Port ID is the identification of the neighbour port. Port Description :
Port Description is the port description advertised by the neighbour unit. System Name :
System Name is the name advertised by the neighbour unit. System Capabilities :
System Capabilities describes the neighbour unit's capabilities. The possible capabilities are: 1. Other 2. Repeater

310
3. Bridge 4. WLAN Access Point 5. Router 6. Telephone 7. DOCSIS cable device 8. Station only 9. Reserved When a capability is enabled, the capability is followed by (+). If the capability is disabled, the capability is followed by (-).
Management Address : Management Address is the neighbour unit's address that is used for higher layer entities to assist discovery by the network management. This could for instance hold the neighbour's IP address.
Buttons
Auto-refresh: Check this box to refresh the page automatically. Automatic refresh occurs every 3 seconds. Refresh: Click to refresh the page.

311
3-12.2 LLDP-MED Neighbour This page provides a status overview of all LLDP-MED neighbours. The displayed table contains a row for each port on which an LLDP neighbour is detected. This function applies to VoIP devices which support LLDP-MED. The columns hold the following information:
Web Interface To show LLDP-MED neighbor: 1. Click Monitor, LLDP, LLDP-MED Neighbor. 2. Click Refresh for manual update web screen 3. Click Auto-refresh for auto-update web screen
Figure 3-12.2: The LLDP-MED Neighbours information
NOTE: If your network without any device supports LLDP-MED then the table will show “No LLDP-MED neighbour information found”.
Parameter description: Port :
The port on which the LLDP frame was received. Device Type :
LLDP-MED Devices are comprised of two primary Device Types: Network Connectivity Devices and Endpoint Devices.
LLDP-MED Network Connectivity Device Definition LLDP-MED Network Connectivity Devices, as defined in TIA-1057, provide access to the IEEE 802 based LAN infrastructure for LLDP-MED Endpoint Devices. An LLDP-MED Network Connectivity Device is a LAN access device based on any of the following technologies: 1. LAN Switch/Router 2. IEEE 802.1 Bridge 3. IEEE 802.3 Repeater (included for historical reasons) 4. IEEE 802.11 Wireless Access Point 5. Any device that supports the IEEE 802.1AB and MED extensions defined by TIA-1057 and can relay IEEE 802 frames via any method.
LLDP-MED Endpoint Device Definition : LLDP-MED Endpoint Devices, as defined in TIA-1057, are located at the IEEE 802 LAN network edge, and participate in IP communication service using the LLDP-MED framework.

312
Within the LLDP-MED Endpoint Device category, the LLDP-MED scheme is broken into further Endpoint Device Classes, as defined in the following. Each LLDP-MED Endpoint Device Class is defined to build upon the capabilities defined for the previous Endpoint Device Class. For-example will any LLDP-MED Endpoint Device claiming compliance as a Media Endpoint (Class II) also support all aspects of TIA-1057 applicable to Generic Endpoints (Class I), and any LLDP-MED Endpoint Device claiming compliance as a Communication Device (Class III) will also support all aspects of TIA-1057 applicable to both Media Endpoints (Class II) and Generic Endpoints (Class I).
LLDP-MED Generic Endpoint (Class I) : The LLDP-MED Generic Endpoint (Class I) definition is applicable to all endpoint products that require the base LLDP discovery services defined in TIA-1057, however do not support IP media or act as an end-user communication appliance. Such devices may include (but are not limited to) IP Communication Controllers, other communication related servers, or any device requiring basic services as defined in TIA-1057. Discovery services defined in this class include LAN configuration, device location, network policy, power management, and inventory management.
LLDP-MED Media Endpoint (Class II) : The LLDP-MED Media Endpoint (Class II) definition is applicable to all endpoint products that have IP media capabilities however may or may not be associated with a particular end user. Capabilities include all of the capabilities defined for the previous Generic Endpoint Class (Class I), and are extended to include aspects related to media streaming. Example product categories expected to adhere to this class include (but are not limited to) Voice / Media Gateways, Conference Bridges, Media Servers, and similar. Discovery services defined in this class include media-type-specific network layer policy discovery.
LLDP-MED Communication Endpoint (Class III) : The LLDP-MED Communication Endpoint (Class III) definition is applicable to all endpoint products that act as end user communication appliances supporting IP media. Capabilities include all of the capabilities defined for the previous Generic Endpoint (Class I) and Media Endpoint (Class II) classes, and are extended to include aspects related to end user devices. Example product categories expected to adhere to this class include (but are not limited to) end user communication appliances, such as IP Phones, PC-based softphones, or other communication appliances that directly support the end user. Discovery services defined in this class include provision of location identifier (including ECS / E911 information), embedded L2 switch support, inventory management.
LLDP-MED Capabilities : LLDP-MED Capabilities describes the neighborhood unit's LLDP-MED capabilities. The possible capabilities are: 1. LLDP-MED capabilities 2. Network Policy 3. Location Identification 4. Extended Power via MDI - PSE 5. Extended Power via MDI - PD 6. Inventory 7. Reserved
Application Type :

313
Application Type indicating the primary function of the application(s) defined for this network policy, advertised by an Endpoint or Network Connectivity Device. The possible application types are shown below. 1. Voice - for use by dedicated IP Telephony handsets and other similar appliances supporting interactive voice services. These devices are typically deployed on a separate VLAN for ease of deployment and enhanced security by isolation from data applications. 2. Voice Signalling - for use in network topologies that require a different policy for the voice signalling than for the voice media. 3. Guest Voice - to support a separate limited feature-set voice service for guest users and visitors with their own IP Telephony handsets and other similar appliances supporting interactive voice services. 4. Guest Voice Signalling - for use in network topologies that require a different policy for the guest voice signalling than for the guest voice media. 5. Softphone Voice - for use by softphone applications on typical data centric devices, such as PCs or laptops. 6. Video Conferencing - for use by dedicated Video Conferencing equipment and other similar appliances supporting real-time interactive video/audio services. 7. Streaming Video - for use by broadcast or multicast based video content distribution and other similar applications supporting streaming video services that require specific network policy treatment. Video applications relying on TCP with buffering would not be an intended use of this application type. 8. Video Signalling - for use in network topologies that require a separate policy for the video signalling than for the video media.
Policy : Policy indicates that an Endpoint Device wants to explicitly advertise that the policy is required by the device. Can be either Defined or Unknown Unknown: The network policy for the specified application type is currently unknown. Defined: The network policy is defined.
TAG : TAG is indicative of whether the specified application type is using a tagged or an untagged VLAN. Can be Tagged or Untagged. Untagged: The device is using an untagged frame format and as such does not include a tag header as defined by IEEE 802.1Q-2003. Tagged: The device is using the IEEE 802.1Q tagged frame format.
VLAN ID : VLAN ID is the VLAN identifier (VID) for the port as defined in IEEE 802.1Q-2003. A value of 1 through 4094 is used to define a valid VLAN ID. A value of 0 (Priority Tagged) is used if the device is using priority tagged frames as defined by IEEE 802.1Q-2003, meaning that only the IEEE 802.1D priority level is significant and the default PVID of the ingress port is used instead.
Priority : Priority is the Layer 2 priority to be used for the specified application type.One of the eight priority levels (0 through 7).
DSCP : DSCP is the DSCP value to be used to provide Diffserv node behavior for the specified

314
application type as defined in IETF RFC 2474. Contain one of 64 code point values (0 through 63).
Auto-negotiation Auto-negotiation identifies if MAC/PHY auto-negotiation is supported by the link partner.
Auto-negotiation status Auto-negotiation status identifies if auto-negotiation is currently enabled at the link partner. If Auto-negotiation is supported and Auto-negotiation status is disabled, the 802.3 PMD operating mode will be determined the operational MAU type field value rather than by auto-negotiation.
Auto-negotiation Capabilities Auto-negotiation Capabilities shows the link partners MAC/PHY capabilities.
Buttons
Auto-refresh: Check this box to refresh the page automatically. Automatic refresh occurs every 3 seconds. Refresh: Click to refresh the page.
3-12.3 PoE This page allows the user to inspect the current status for all PoE ports. The section show all
port Power Over Ethernet Status.
Web Interface
To show LLDP EEE neighbors: 1. Click Monitor ,LLDP, PoE 2. Display Power Over Ethernet Status Information 3. Click Auto-refresh for auto-update web screen
Figure 3-12.3: The LLDP Neighbors EEE information
Parameter description: Local Port :
The port for this switch on which the LLDP frame was received. Power Type :
The Power Type represents whether the device is a Power Sourcing Entity (PSE) or Power Device (PD). If the Power Type is unknown it is represented as "Reserved".

315
Power Source : The Power Source represents the power source being utilized by a PSE or PD device. If the device is a PSE device it can either run on its Primary Power Source or its Backup Power Source. If it is unknown whether the PSE device is using its Primary Power Source or its Backup Power Source it is indicated as "Unknown" If the device is a PD device it can either run on its local power supply or it can use the PSE as power source. It can also use both its local power supply and the PSE. If it is unknown what power supply the PD device is using it is indicated as "Unknown"
Power Priority : Power Priority represents the priority of the PD device, or the power priority associated with the PSE type device's port that is sourcing the power. There are three levels of power priority. The three levels are: Critical, High and Low. If the power priority is unknown it is indicated as "Unknown"
Maximum Power : The Maximum Power Value contains a numerical value that indicates the maximum power in watts required by a PD device from a PSE device, or the minimum power a PSE device is capable of sourcing over a maximum length cable based on its current configuration. The maximum allowed value is 102.3 W. If the device indicates value higher than 102.3 W, it is represented as "reserved"
Buttons
Auto-refresh: Check this box to refresh the page automatically. Automatic refresh occurs every 3 seconds. Refresh: Click to refresh the page.

316
3-12.4 EEE By using EEE power savings can be achieved at the expense of traffic latency. This latency occurs due to that the circuits EEE turn off to save power, need time to boot up before sending traffic over the link. This time is called "wakeup time". To achieve minimal latency, devices can use LLDP to exchange information about their respective tx and rx "wakeup time ", as a way to agree upon the minimum wakeup time they need. This page provides an overview of EEE information exchanged by LLDP.
Web Interface
To show LLDP EEE neighbors: 1. Click Monitor ,LLDP, then click EEE to show discover EEE devices 2. Click Refresh for manual update web screen 3. Click Auto-refresh for auto-update web screen
Figure 3-12.4: The LLDP Neighbors EEE information
NOTE: If your network without any devices which enables EEE function then the table will show “No LLDP EEE information found”.
Parameter description: Local Port :
The port on which LLDP frames are received or transmitted. Tx Tw :
The link partner’s maximum time that transmit path can hold off sending data after reassertion of LPI.
Rx Tw : The link partner’s time that receiver would like the transmitter to hold off to allow time for the receiver to wake from sleep.
Fallback Receive Tw : The link partner’s fallback receive Tw. A receiving link partner may inform the transmitter of an alternate desired Tw_sys_tx. Since a receiving link partner is likely to have discrete levels for savings, this provides the transmitter with additional information that it may use for a more efficient allocation. Systems that do not implement this option default the value to be the same as that of the Receive Tw_sys_tx.
Echo Tx Tw : The link partner's Echo Tx Tw value. The respective echo values shall be defined as the local link partner’s reflection (echo) of the

317
remote link partners respective values. When a local link partner receives its echoed values from the remote link partner it can determine whether or not the remote link partner has received, registered and processed its most recent values. For example, if the local link partner receives echoed parameters that do not match the values in its local MIB, then the local link partner infers that the remote link partners request was based on stale information.
Echo Rx Tw : The link partner's Echo Rx Tw value.
Resolved Tx Tw : The resolved Tx Tw for this link. Note: NOT the link partner The resolved value that is the actual "tx wakeup time” used for this link (based on EEE information exchanged via LLDP).
Resolved Rx Tw : The resolved Rx Tw for this link. Note: NOT the link partner The resolved value that is the actual "tx wakeup time” used for this link (based on EEE information exchanged via LLDP).
EEE in Sync Shows whether the switch and the link partner have agreed on wake times. Red - Switch and link partner have not agreed on wakeup times. Green - Switch and link partner have agreed on wakeup times.
Buttons
Auto-refresh: Check this box to refresh the page automatically. Automatic refresh occurs every 3 seconds. Refresh: Click to refresh the page.

318
3-12.5 Port Statistics Two types of counters are shown. Global counters are counters that refer to the whole switch, while local counters refer to per port counters for the currently selected switch
Web Interface To show LLDP Statistics: 1. Click Monitor ,LLDP, then click Port Statistics to show LLDP counters 2. Click Refresh for manual update web screen 3. Click Auto-refresh for auto-update web screen 4. Click Clear to clear all counters Figure 3-12.5: The LLDP Port Statistics information
Parameter description:
Global Counters Neighbour entries were last changed at :
It also shows the time when the last entry was last deleted or added. It also shows the time elapsed since the last change was detected.
Total Neighbours Entries Added : Shows the number of new entries added since switch reboot.
Total Neighbours Entries Deleted : Shows the number of new entries deleted since switch reboot.
Total Neighbours Entries Dropped : Shows the number of LLDP frames dropped due to the entry table being full.

319
Total Neighbours Entries Aged Out : Shows the number of entries deleted due to Time-To-Live expiring.
Local Counters The displayed table contains a row for each port. The columns hold the following information:
Local Port : The port on which LLDP frames are received or transmitted.
Tx Frames : The number of LLDP frames transmitted on the port.
Rx Frames : The number of LLDP frames received on the port.
Rx Errors : The number of received LLDP frames containing some kind of error.
Frames Discarded : If an LLDP frame is received on a port, and the switch's internal table has run full, the LLDP frame is counted and discarded. This situation is known as "Too Many Neighbours" in the LLDP standard. LLDP frames require a new entry in the table when the Chassis ID or Remote Port ID is not already contained within the table. Entries are removed from the table when a given port's link is down, an LLDP shutdown frame is received, or when the entry ages out.
TLVs Discarded : Each LLDP frame can contain multiple pieces of information, known as TLVs (TLV is short for "Type Length Value"). If a TLV is malformed, it is counted and discarded.
TLVs Unrecognized : The number of well-formed TLVs, but with an unknown type value.
Org. Discarded : The number of organizationally received TLVs.
Age-Outs : Each LLDP frame contains information about how long time the LLDP information is valid (age-out time). If no new LLDP frame is received within the age out time, the LLDP information is removed, and the Age-Out counter is incremented.
Buttons
Auto-refresh: Check this box to refresh the page automatically. Automatic refresh occurs every 3 seconds. Clear: Clears the counters for the selected port. Refresh: Click to refresh the page.
3-13 Ethernet Services 3-13.1 EVC Statistics
This page provides NNI port traffic statistics for the selected EVC. It also shows counters for UNI ports of ECEs mapping to the EVC. And the MPLS Pseudo-Wires counters are included when the

320
PW ID is attached to the selected EVC.
Web Interface
To show Ethernet Statistics: Click Monitor Ethernet Statistics
Click Refresh for manual update web screen Click Auto-refresh for auto-update web screen Click Clear to clear all counters
. Figure 3-13.1: The Ethernet Statistics
Parameter description: Class
The traffic class for the EVC. Rx Green
The number of green received. Tx Green
The number of green transmitted. Rx Yellow
The number of yellow received. Tx Yellow
The number of yellow transmitted. Rx Red
The number of red received. Green Discarded
The number of discarded in the green color. Yellow Discarded
The number of discarded in the yellow color Buttons

321
Auto-refresh: Check this box to refresh the page automatically. Automatic refresh occurs every 3 seconds. Refresh: Click to refresh the page. Clear: Clears the counters for the selected port.
3-14 PTP This page allows the user to inspect the current PTP clock settings.
Web Interface
To show PTP: Click Monitor, PTP. Click Refresh for manual update web screen Click Auto-refresh for auto-update web screen Click Clear to clear all counters
. Figure 3-14: The PTP
Parameter description:
PTP External Clock Description
One_PPS_Mode Shows the current One_pps_mode configured. 1. Output : Enable the 1 pps clock output 2. Input : Enable the 1 pps clock input
322
3. Disable : Disable the 1 pps clock in/out-put External Enable
Shows the current External clock output configuration. 1. True : Enable the external clock output 2. False : Disable the external clock output
Adjust Method Shows the current Frequency adjustment configuration. 1. LTC frequency : Local Time Counter (LTC) frequency control 2. SyncE-DPLL : SyncE DPLL frequency control, if allowed by SyncE 3. Oscillator : Oscillator independent of SyncE for frequency control, if supported by the HW 4. LTC phase : Local Time Counter (LTC) phase control (assumes that the frequency is locked by means of SyncE)
Clock Frequency Shows the current clock frequency used by the External Clock. The possible range of values are 1 - 25000000 (1 - 25MHz) PTP Clock Description
Inst Indicates the Instance of a particular Clock Instance [0..3]. Click on the Clock Instance number to monitor the Clock details.
ClkDom Indicates the Clock domain used by the Instance of a particular Clock Instance [0..3].
Device Type Indicates the Type of the Clock Instance. There are five Device Types. 1. Ord-Bound - Clock's Device Type is Ordinary-Boundary Clock. 2. P2p Transp - Clock's Device Type is Peer to Peer Transparent Clock. 3. E2e Transp - Clock's Device Type is End to End Transparent Clock. 4. Master Only - Clock's Device Type is Master Only. 5. Slave Only - Clock's Device Type is Slave Only.
Port List Shows the ports configured for that Clock Instance.
Buttons
Auto-refresh: Check this box to refresh the page automatically. Automatic refresh occurs every 3 seconds. Refresh: Click to refresh the page.
3-15 PoE This page allows the user to inspect the current status for all PoE ports.

323
Web Interface To Display ECE Statistics in the web interface: 1. Click Monitor, PoE 2. Checked “Auto-refresh”.
3. Click “Refresh” to refresh the port detailed statistics.
Figure 3-15: The PoE Statistics
Parameter description: Local Port
This is the logical port number for this row. PD Class
Each PD is classified according to a class that defines the maximum power the PD will use. The PD Class shows the PDs class. Five Classes are defined: Class 0: Max. power 15.4 W Class 1: Max. power 4.0 W Class 2: Max. power 7.0 W Class 3: Max. power 15.4 W Class 4: Max. power 30.0 W
Power Requested The Power Requested shows the requested amount of power the PD wants to be reserved.
Power Allocated The Power Allocated shows the amount of power the switch has allocated for the PD.
Power Used The Power Used shows how much power the PD currently is using.
Current Used The Power Used shows how much current the PD currently is using.
Priority

324
The Priority shows the port's priority configured by the user. Port Status
The Port Status shows the port's status. The status can be one of the following values: PoE not available - No PoE chip found - PoE not supported for the port. PoE turned OFF - PoE disabled : PoE is disabled by user. PoE turned OFF - Power budget exceeded - The total requested or used power by the PDs exceeds the maximum power the Power Supply can deliver, and port(s) with the lowest priority is/are powered down. No PD detected - No PD detected for the port. PoE turned OFF - PD overload - The PD has requested or used more power than the port can deliver, and is powered down. PoE turned OFF - PD is off. Invalid PD - PD detected, but is not working correctly.
Buttons
Auto-refresh: Check this box to refresh the page automatically. Automatic refresh occurs every 3 seconds. Refresh: Click to refresh the page.

325
3-16 MAC Table
Entries in the MAC Table are shown on this page. The MAC Table contains up to 8192 entries, and is sorted first by VLAN ID, then by MAC address.
Web Interface To Display MAC Address Table in the web interface: 1. Click Monitor, Dynamic MAC Table. 2. Specify the VLAN and MAC Address. 3. Display MAC Address Table.
Figure 3-16: The MAC Address Table
Parameter description:
Navigating the MAC Table Each page shows up to 999 entries from the MAC table, default being 20, selected through the "entries per page" input field. When first visited, the web page will show the first 20 entries from the beginning of the MAC Table. The first displayed will be the one with the lowest VLAN ID and the lowest MAC address found in the MAC Table. The "Start from MAC address" and "VLAN" input fields allow the user to select the starting point in the MAC Table. Clicking the “Refresh” button will update the displayed table starting from that or the closest next MAC Table match. In addition, the two input fields will - upon a “Refresh” button click - assume the value of the first displayed entry, allowing for continuous refresh with the same start address. The >> will use the last entry of the currently displayed VLAN/MAC address pairs as a basis for the next lookup. When the end is reached the text "No more entries" is shown in the displayed table. Use the l<< button to start over.
MAC Table Columns
Switch (stack only) The stack unit where the entry is learned.
Type :

326
Indicates whether the entry is a static or a dynamic entry. VLAN :
The VLAN ID of the entry. MAC address :
The MAC address of the entry. Port Members :
The ports that are members of the entry. Buttons
Auto-refresh: Check this box to refresh the page automatically. Automatic refresh occurs every 3 seconds. Clear: Clears the counters for the selected port. Refresh: Click to refresh the page. |<<: Updates the system log entries to the first available entry ID >> : Updates the system log entry to the next available entry ID
NOTE: 00-40-C7-73-01-29 : your switch MAC address (for IPv4) 33-33-00-00-00-01 : Destination MAC (for IPv6 Router Advertisement) (reference IPv6 RA.JPG) 33-33-00-00-00-02 : Destination MAC (for IPv6 Router Solicitation) (reference IPv6 RS.JPG) 33-33-FF-73-01-29 : Destination MAC (for IPv6 Neighbor Solicitation) (reference IPv6 DAD.JPG) 33-33-FF-A8-01-01: your switch MAC address (for IPv6 global IP) FF-FF-FF-FF-FF-FF: for Broadcast.

327
3-17 VLANs 3-17.1 Membership
This page provides an overview of membership status of VLAN users. The ports belong to the currently selected stack unit, as reflected by the page header.
Web Interface To configure VLAN membership configuration in the web interface: 1. Click Monitor, VLANs, VLAN membership. 2. Scroll the bar to choice which VLANs would like to show up. 3. Click Refresh to update the state.
Figure 3-17.1: VLAN Membership Status for Combined users
Parameter description: VLAN USER
VLAN User module uses services of the VLAN management functionality to configure VLAN memberships and VLAN port configurations such as PVID and UVID. Currently we support the following VLAN user types: CLI/Web/SNMP : These are referred to as static. NAS : NAS provides port-based authentication, which involves communications between a Supplicant, Authenticator, and an Authentication Server. MVRP : Multiple VLAN Registration Protocol (MVRP) allows dynamic registration and deregistration of VLANs on ports on a VLAN bridged network. Voice VLAN : Voice VLAN is a VLAN configured specially for voice traffic typically originating from IP phones. MVR : MVR is used to eliminate the need to duplicate multicast traffic for subscribers in each VLAN. Multicast traffic for all channels is sent only on a single (multicast) VLAN. MSTP : The 802.1s Multiple Spanning Tree protocol (MSTP) uses VLANs to create multiple spanning trees in a network, which significantly improves network resource utilization while maintaining a loop-free environment.
VLAN ID VLAN ID for which the Port members are displayed.
Port Members A row of check boxes for each port is displayed for each VLAN ID.

328
If a port is included in a VLAN, an image will be displayed. If a port is included in a Forbidden port list, an image will be displayed. If a port is included in a Forbidden port list and dynamic VLAN user register VLAN on same Forbidden port, then conflict port will be displayed as .
VLAN Membership The VLAN Membership Status Page shall show the current VLAN port members for all VLANs configured by a selected VLAN User (selection shall be allowed by a Combo Box). When ALL VLAN Users are selected, it shall show this information for all the VLAN Users, and this is by default. VLAN membership allows the frames classified to the VLAN ID to be forwarded on the respective VLAN member ports.
Navigating the VLAN Monitor page Each page shows up to 99 entries from the VLAN table, default being 20, selected through the "entries per page" input field. When first visited, the web page will show the first 20 entries from the beginning of the VLAN Table. The first displayed will be the one with the lowest VLAN ID found in the VLAN Table. The "VLAN" input fields allow the user to select the starting point in the VLAN Table. Clicking the “Refresh” button will update the displayed table starting from that or the closest next VLAN Table match. The “ >> ”will use the last entry of the currently displayed VLAN entry as a basis for the next lookup. When the end is reached the text "No more entries" is shown in the displayed table. Use the “ |<< ”button to start over.
Buttons
Auto-refresh: Check this box to refresh the page automatically. Automatic refresh occurs every 3 seconds. Refresh: Click to refresh the page.
329
3-17.2 Port The function Port Status gathers the information of all VLAN status and reports it by the order of Static NAS MVRP MVP Voice VLAN MSTP GVRP Combined.
Web Interface To Display VLAN Port Status in the web interface: 1. Click Monitor, VLAN Port Status. 2. Specify the Static NAS MVRP MVP Voice VLAN MSTP GVRP Combined. 3. Display Port Status information.
Figure 3-17.2: The VLAN Port Status for Static user
Parameter description:
VLAN USER
VLAN User module uses services of the VLAN management functionality to configure VLAN memberships and VLAN port configuration such as PVID, UVID. Currently we support following VLAN User types: CLI/Web/SNMP : These are referred to as static. NAS : NAS provides port-based authentication, which involves communications between a Supplicant, Authenticator, and an Authentication Server. Voice VLAN : Voice VLAN is a VLAN configured specially for voice traffic typically originating from IP phones. MVR : MVR is used to eliminate the need to duplicate multicast traffic for subscribers in each VLAN. Multicast traffic for all channels is sent only on a single (multicast) VLAN. MSTP : The 802.1s Multiple Spanning Tree protocol (MSTP) uses VLANs to create multiple spanning trees in a network, which significantly improves network resource utilization while maintaining a loop-free environment.
Port : The logical port for the settings contained in the same row.
Port Type :

330
Shows the Port Type. Port type can be any of Unaware, C-port, S-port, Custom S-port. If Port Type is Unaware, all frames are classified to the Port VLAN ID and tags are not removed. C-port is Customer Port. S-port is Service port. Custom S-port is S-port with Custom TPID.
Ingress Filtering : Shows the ingress filtering on a port. This parameter affects VLAN ingress processing. If ingress filtering is enabled and the ingress port is not a member of the classified VLAN, the frame is discarded.
Frame Type : Shows whether the port accepts all frames or only tagged frames. This parameter affects VLAN ingress processing. If the port only accepts tagged frames, untagged frames received on that port are discarded.
Port VLAN ID : Shows the Port VLAN ID (PVID) that a given user wants the port to have. The field is empty if not overridden by the selected user.
Tx Tag : Shows egress filtering frame status whether tagged or untagged.
UVID : Shows UVID (untagged VLAN ID). Port's UVID determines the packet's behavior at the egress side.
Conflicts : Shows status of Conflicts whether exists or not. When a Volatile VLAN User requests to set VLAN membership or VLAN port configuration, the following conflicts can occur: Functional Conflicts between features. Conflicts due to hardware limitation. Direct conflict between user modules.
Buttons
Auto-refresh: Check this box to refresh the page automatically. Automatic refresh occurs every 3 seconds. Refresh: Click to refresh the page.

331
3-18 VCL 3-18.1 MAC-based VLAN
This section shows MAC-based VLAN entries configured by various MAC-based VLAN users. Currently we support following VLAN User types: CLI/Web/SNMP: These are referred to as static. NAS: NAS provides port-based authentication, which involves communications between a Supplicant, Authenticator, and an Authentication Server.
Web Interface To Display MAC-based VLAN configuration in the web interface: 1. Click Monitor, MAC-based VLAN Status. 2. Specify the Static, NAS, Combined. 3. Display MAC-based information.
Figure 3-18.1: The MAC-based VLAN Membership Status for User Static
Parameter description: MAC Address :
Indicates the MAC address. VLAN ID :
Indicates the VLAN ID. Port Members :
Port members of the MAC-based VLAN entry. Buttons
Auto-refresh: Check this box to refresh the page automatically. Automatic refresh occurs every 3 seconds. Refresh: Click to refresh the page.

332
3-18.2 Protocol-based VLAN
3-18.2.1 Protocol to Group This page shows you the protocols to Group Name (unique for each Group) mapping entries for the switch.
Web Interface To Display Protocol-based VLAN configuration in the web interface: 1. Click Monitor, VCL, Protocol to Group. 2. Checked “Auto-refresh”.
3. Click “Refresh” to refresh the port detailed statistics.
Figure 3-18.2.1: The MAC-based VLAN Membership Status for User Static
Parameter description: Frame Type :
Frame Type can have one of the following values: 1. Ethernet 2. LLC 3. SNAP
NOTE: On changing the Frame type field, valid value of the following text field will vary depending on the new frame type you selected.
Value :
Valid value that can be entered in this text field depends on the option selected from the preceding Frame Type selection menu. Below is the criteria for three different Frame Types: 1. For Ethernet: Values in the text field when Ethernet is selected as a Frame Type is called etype. Valid values for etype ranges from 0x0600-0xffff 2. For LLC: Valid value in this case is comprised of two different sub-values. a. DSAP: 1-byte long string (0x00-0xff) b. SSAP: 1-byte long string (0x00-0xff) 3. For SNAP: Valid value in this case also is comprised of two different sub-values.

333
a. OUI: OUI (Organizationally Unique Identifier) is value in format of xx-xx-xx where each pair (xx) in string is a hexadecimal value ranges from 0x00-0xff. b. PID: If the OUI is hexadecimal 000000, the protocol ID is the Ethernet type (EtherType) field value for the protocol running on top of SNAP; if the OUI is an OUI for a particular organization, the protocol ID is a value assigned by that organization to the protocol running on top of SNAP. In other words, if value of OUI field is 00-00-00 then value of PID will be etype (0x0600-0xffff) and if value of OUI is other than 00-00-00 then valid value of PID will be any value from 0x0000 to 0xffff.
Group Name : A valid Group Name is a unique 16-character long string for every entry which consists of a combination of alphabets (a-z or A-Z) and integers (0-9).
NOTE: special character and underscore(_) are not allowed.
Buttons
Auto-refresh: Check this box to refresh the page automatically. Automatic refresh occurs every 3 seconds. Refresh: Click to refresh the page.

334
3-18.2.2 Group to VLAN This page shows you the configured Group Name to a VLAN for the switch.
Web Interface To Display Group to VLAN configuration in the web interface: 1. Click Monitor, VCL, Group to VLAN. 2. Checked “Auto-refresh”.
3. Click “Refresh” to refresh the port detailed statistics.
Figure 3-17.2.2: The MAC-based VLAN Membership Status for User Static
Parameter description: Group Name :
A valid Group Name is a string at the most 16 characters which consists of a combination of alphabets (a-z or A-Z) and integers(0-9), no special character is allowed. Whichever Group name you try map to a VLAN must be present in Protocol to Group mapping table and must not be pre-used by any other existing mapping entry on this page.
VLAN ID : Indicates the ID to which Group Name will be mapped. A valid VLAN ID ranges from 1-4095.
Port Members : A row of check boxes for each port is displayed for each Group Name to VLAN ID mapping. To include a port in a mapping, check the box. To remove or exclude the port from the mapping, make sure the box is unchecked. By default, no ports are members, and all boxes are unchecked.
Buttons
Auto-refresh: Check this box to refresh the page automatically. Automatic refresh occurs every 3 seconds. Refresh: Click to refresh the page.

335
3-18.3 IP Subnet-based VLAN The page shows IP subnet-based VLAN entries. This page shows only static entries.
Web Interface To Display MAC-based VLAN configuration in the web interface: 1. Click Monitor, VCL, and IP Subnet-based VLAN. 2. Checked “Auto-refresh”.
3. Click “Refresh” to refresh the port detailed statistics.
Figure 3-17.3: The MAC-based VLAN Membership Status for User Static
Parameter description: VCE ID :
Indicates the index of the entry. It is user configurable. Its value ranges from 0-128. If a VCE ID is 0, application will auto-generate the VCE ID for that entry. Deletion and lookup of IP subnet-based VLAN are based on VCE ID.
IP Address : Indicates the IP address.
Mask Length : Indicates the network mask length.
VLAN ID : Indicates the VLAN ID. VLAN ID can be changed for the existing entries.
Port Members : A row of check boxes for each port is displayed for each IP subnet-based VLAN entry. To include a port in a IP subnet-based VLAN, check the box. To remove or exclude the port from the IP subnet-based VLAN, make sure the box is unchecked. By default, no ports are members, and all boxes are unchecked.
Buttons
Auto-refresh: Check this box to refresh the page automatically. Automatic refresh occurs every 3 seconds. Refresh: Click to refresh the page.

336
3-19 sFlow This session shows receiver and per-port sFlow statistics
Web Interface
To Display MAC-based VLAN configuration in the web interface: 1. Click Monitor, sFlow 2. Display sFlow information.
Figure 3-19: The sFlow Statistics
Parameter description: Owner
This field shows the current owner of the sFlow configuration. It assumes one of three values as follows: • If sFlow is currently unconfigured/unclaimed, Owner contains <none>. • If sFlow is currently configured through Web or CLI, Owner contains <Configured through local management>. • If sFlow is currently configured through SNMP, Owner contains a string identifying the sFlow receiver.`
IP Address/Hostname The IP address or hostname of the sFlow receiver.

337
Timeout The number of seconds remaining before sampling stops and the current sFlow owner is released.
Tx Successes The number of UDP datagrams successfully sent to the sFlow receiver.
Tx Errors The number of UDP datagrams that has failed transmission. The most common source of errors is invalid sFlow receiver IP/hostname configuration. To diagnose, paste the receiver's IP address/hostname into the Ping Web page (Diagnostics → Ping/Ping6).
Flow Samples The total number of flow samples sent to the sFlow receiver.
Counter Samples The total number of counter samples sent to the sFlow receiver.
Port Statistics Port
The port number for which the following statistics applies. Rx and Tx Flow Samples
The number of flow samples sent to the sFlow receiver originating from this port. Here, flow samples are divided into Rx and Tx flow samples, where Rx flow samples contains the number of packets that were sampled upon reception (ingress) on the port and Tx flow samples contains the number of packets that were sampled upon transmission (egress) on the port.
Counter Samples The total number of counter samples sent to the sFlow receiver originating from this port.
Buttons
Auto-refresh: Check this box to refresh the page automatically. Automatic refresh occurs every 3 seconds. Refresh: Click to refresh the page. Clear Receiver: Clears the sFlow receiver counters. Clear Ports: Clears the per-port counters.

338
3-20 UDLD
This page displays the UDLD status of the ports
Web Interface
To Display UDLD in the web interface: Click Monitor, UDLD Display UDLD information.
Figure 3-20: The UDLD
Parameter description:
UDLD port status UDLD Admin State
The current port state of the logical port, Enabled if any of state(Normal,Aggressive) is Enabled.
Device ID(local) The ID of Device.
Device Name(local) Name of the Device.
Bidirectional State The current state of the por
Neighbour Status Port
The current port of neighbour device. Device ID
The current ID of neighbour device. Link Status
The current link status of neighbour port.

339
Device Name Name of the Neighbour Device.
Buttons
Auto-refresh: Check this box to refresh the page automatically. Automatic refresh occurs every 3 seconds. Refresh: Click to refresh the page.

340
Chapter 4. Diagnostics
This chapter provides a set of basic system diagnosis. It let users know that whether the system is health or needs to be fixed. The basic system check includes ICMP Ping, Link OAM, ICMPv6, and VeriPHY Cable Diagnostics.
4-1 Ping This section allows you to issue ICMP PING packets to troubleshoot IPv6 connectivity issues.
Web Interface
To configure an ICMP PING Configuration in the web interface: 1. Specify ICMP PING IP Address. 2. Specify ICMP PING Size. 3. Click Start.
Figure 4-1: The ICMP Ping
Parameter description: IP Address :
To set the IP Address of device what you want to ping it. Ping Length:
The payload size of the ICMP packet. Values range from 2 bytes to 1452 bytes. Ping Count:
The count of the ICMP packet. Values range from 1 time to 60 times. Ping Interval:
The interval of the ICMP packet. Values range from 0 second to 30 seconds. Egress Interface (Only for IPv6):

341
The VLAN ID (VID) of the specific egress IPv6 interface which ICMP packet goes. The given VID ranges from 1 to 4094 and will be effective only when the corresponding IPv6 interface is valid. When the egress interface is not given, PING6 finds the best match interface for destination. Do not specify egress interface for loopback address. Do specify egress interface for link-local or multicast address.
Start: Click the “Start” button then the switch will start to ping the device using ICMP packet size what set on the switch. After you press , 5 ICMP packets are transmitted, and the sequence number and roundtrip time are displayed upon reception of a reply. The page refreshes automatically until responses to all packets are received, or until a timeout occurs. PING6 server ::10.10.132.20 64 bytes from ::10.10.132.20: icmp_seq=0, time=0ms 64 bytes from ::10.10.132.20: icmp_seq=1, time=0ms 64 bytes from ::10.10.132.20: icmp_seq=2, time=0ms 64 bytes from ::10.10.132.20: icmp_seq=3, time=0ms 64 bytes from ::10.10.132.20: icmp_seq=4, time=0ms Sent 5 packets, received 5 OK, 0 bad

342
4-2 Ping6 This section allows you to issue ICMPv6 PING packets to troubleshoot IPv6 connectivity issues.
Web Interface
To configure an ICMPv6 PING Configuration in the web interface: 1. Specify ICMPv6 PING IP Address. 2. Specify ICMPv6 PING Size. 3. Click Start. Figure 4-2: The ICMPv6 Ping
Parameter description: IP Address :
The destination IP Address with IPv6 Ping Length :
The payload size of the ICMP packet. Values range from 2 bytes to 1452 bytes. Ping Count :
The count of the ICMP packet. Values range from 1 time to 60 times. Ping Interval :
The interval of the ICMP packet. Values range from 0 second to 30 seconds. Egress Interface (Only for IPv6) :
The VLAN ID (VID) of the specific egress IPv6 interface which ICMP packet goes. The given VID ranges from 1 to 4094 and will be effective only when the corresponding IPv6 interface is valid. When the egress interface is not given, PING6 finds the best match interface for destination. Do not specify egress interface for loopback address. Do specify egress interface for link-local or multicast address.
Start: Click the “Start” button then the switch will start to ping the device using ICMPv6 packet size what set on the switch.

343
After you press, 5 ICMPv6 packets are transmitted, and the sequence number and roundtrip time are displayed upon reception of a reply. The page refreshes automatically until responses to all packets are received, or until a timeout occurs. PING server 10.10.132.20 64 bytes from 10.10.132.20: icmp_seq=0, time=0ms 64 bytes from 10.10.132.20: icmp_seq=1, time=0ms 64 bytes from 10.10.132.20: icmp_seq=2, time=0ms 64 bytes from 10.10.132.20: icmp_seq=3, time=0ms 64 bytes from 10.10.132.20: icmp_seq=4, time=0ms Sent 5 packets, received 5 OK, 0 bad You can configure the following properties of the issued ICMP packets:

344
4-3 VeriPHY This section is used for running the VeriPHY Cable Diagnostics. Press to run the diagnostics. This will take approximately 5 seconds. If all ports are selected, this can take approximately 15 seconds. When completed, the page refreshes automatically, and you can view the cable diagnostics results in the cable status table. Note that VeriPHY is only accurate for cables of length 7 -140 meters.10 and 100 Mbps ports will be linked down while running VeriPHY. Therefore, running VeriPHY on a 10 or 100 Mbps management port will cause the switch to stop responding until VeriPHY is complete.
Web Interface
To configure a VeriPHY Cable Diagnostics Configuration in the web interface: 1. Specify Port which want to check. 2. Click Start. Figure 4-3: The VeriPHY
Parameter description: Port :
The port where you are requesting VeriPHY Cable Diagnostics. Cable Status :
Port: Port number. Pair: The status of the cable pair. Length: The length (in meters) of the cable pair.

345
4-4 Traceroute This page allows you to issue ICMP, TCP, or UDP packets to diagnose network connectivity issues.
Web Interface
To configure an ICMPv6 PING Configuration in the web interface: 1. Specify traceroute IP Address. 2. Specify traceroute Size. 3. Click Start. Figure 4-4: The Traceroute
Parameter description: Protocol :
The protocol(ICMP, UDP, TCP) packets to send. IP Address :
The destination IP Address. Wait Time :
Set the time (in seconds) to wait for a response to a probe (default 5.0 sec). Values range from 1 to 60. The payload size of the ICMP packet. Values range from 2 bytes to 1452 bytes.
Max TTL : Specifies the maximum number of hops (max time-to-live value) traceroute will probe. Values range from 1 to 255. The default is 30.
Probe Count : Sets the number of probe packets per hop. Values range from 1 to 10. The default is 3.

346
4-5 Link OAM
4-5.1 MIB Retrieval
This page provides detailed OAM traffic statistics for a specific switch port. Use the port select box to select which switch port details to display. The displayed counters represent the total number of OAM frames received and transmitted for the selected port. Discontinuities of these counter can occur at re-initialization of the management system.
Web Interface
To configure the Statistics in the web interface: 1. Click Monitor, Link OAM and Statistics. 2. To display the Statistics.
Figure 4-5.1: MIB Retrieval
Parameter description:
Ping
This page allows you to issue ICMP PING packets to troubleshoot IP connectivity issues. After you press ”Start” , ICMP packets are transmitted, and the sequence number and round trip time are displayed upon reception of a reply. The amount of data received inside of an IP packet of type ICMP ECHO_REPLY will always be 8 bytes more than the requested data space (the ICMP header). The page refreshes automatically until responses to all packets are received, or until a timeout occurs.
PING server 10.10.132.20, 56 bytes of data.
64 bytes from 10.10.132.20: icmp_seq=0, time=0ms
64 bytes from 10.10.132.20: icmp_seq=1, time=0ms
64 bytes from 10.10.132.20: icmp_seq=2, time=0ms
64 bytes from 10.10.132.20: icmp_seq=3, time=0ms
347
64 bytes from 10.10.132.20: icmp_seq=4, time=0ms
Sent 5 packets, received 5 OK, 0 bad
Link OAM MIB Retrieval
This page allows you to retrieve the local or remote OAM MIB variable data on a particular port. Select the appropriate radio button and enter the port number of the switch to retrieve the content of interest. Click on “Star” to retrieve the content. Click on “New Retrieval” to retrieve another content of interest.
Ping6
This page allows you to issue ICMPv6 PING packets to troubleshoot IPv6 connectivity issues. After you press “Start” , ICMPv6 packets are transmitted, and the sequence number and round trip time are displayed upon reception of a reply. The page refreshes automatically until responses to all packets are received, or until a timeout occurs. PING6 server ff02::2, 56 bytes of data. 64 bytes from fe80::219:5bff:fe2f:b47: icmp_seq=0, time=10ms 64 bytes from fe80::215:58ff:feed:69dd: icmp_seq=0, time=10ms 64 bytes from fe80::219:5bff:fe2f:b47: icmp_seq=1, time=0ms 64 bytes from fe80::215:58ff:feed:69dd: icmp_seq=1, time=0ms 64 bytes from fe80::219:5bff:fe2f:b47: icmp_seq=2, time=0ms 64 bytes from fe80::215:58ff:feed:69dd: icmp_seq=2, time=0ms 64 bytes from fe80::219:5bff:fe2f:b47: icmp_seq=3, time=0ms 64 bytes from fe80::215:58ff:feed:69dd: icmp_seq=3, time=0ms 64 bytes from fe80::219:5bff:fe2f:b47: icmp_seq=4, time=0ms 64 bytes from fe80::215:58ff:feed:69dd: icmp_seq=4, time=0ms Sent 5 packets, received 10 OK, 0 bad You can configure the following properties of the issued ICMP packets:
IP Address The destination IP Address.
Ping Length The payload size of the ICMP packet. Values range from 2 bytes to 1452 bytes.
Ping Count The count of the ICMP packet. Values range from 1time to 60 times.
Ping Interval The interval of the ICMP packet. Values range from 0second to 30 seconds.
Egress Interface (Only for IPv6) The VLAN ID (VID) of the specific egress IPv6 interface which ICMP packet goes. The given VID ranges from 1 to 4094 and will be effective only when the corresponding IPv6 interface is valid. When the egress interface is not given, PING6 finds the best match interface for destination. Do not specify egress interface for loopback address. Do specify egress interface for link-local or multicast address.

348
Traceroute
This page allows you to issue ICMP, TCP, or UDPpackets to diagnose network connectivity issues. After you press “Start”, Traceroute sends packets with gradually increasing TTL value, starting with TTL value of 1. The first router receives the packet, decrements the TTL value and drops the packet because it then has TTL value zero. The router sends an ICMP Time Exceeded message back to the source. The next set of packets are given a TTL value of 2, so the first router forwards the packets, but the second router drops them and replies with ICMP Time Exceeded. Proceeding in this way, traceroute uses the returned ICMP Time Exceeded messages to build a list of routers that packets traverse, until the destination is reached and returns an ICMP Echo Reply message. traceroute to 202.39.253.11 (202.39.253.11), 30 hops max, 40 byte packets 1 192.168.10.254 ae-2-3508.edge4.Atlanta2.Level3.net. (192.168.10.254) 10 ms 10 ms 10 ms 2 59-125-13-254.HINET-IP.hinet.net. (59.125.13.254) 20 ms 20 ms 20 ms 3 h146.s228.ts.hinet.net. (168.95.228.146) 20 ms 10 ms 20 ms 4 tchn-3011.hinet.net. (220.128.16.194) 20 ms TCHN-3112.hinet.net. (220.128.17.142) 20 ms tchn-3011.hinet.net. (220.128.16.202) 20 ms 5 TPDT-3012.hinet.net. (220.128.17.6) 20 ms TPDT-3011.hinet.net. (220.128.16.10) 20 ms TPDT-3012.hinet.net. (220.128.17.6) 40 ms 6 CHCH-3112.hinet.net. (220.128.2.13) 20 ms tchn-3011.hinet.net. (220.128.1.9) 10 ms CHCH-3112.hinet.net. (220.128.2.13) 30 ms 7 211.22.41.237 CHCH-3112.hinet.net. (211.22.41.237) 20 ms 30 ms 30 ms 8 202-39-253-11.HINET-IP.hinet.net. (202.39.253.11) 10 ms 10 ms You can configure the following properties:
Protocol The protocol(ICMP, UDP, TCP) packets to send.
IP Address The destination IP Address.
Wait Time Set the time (in seconds) to wait for a response to a probe (default 5.0 sec). Values range from 1 to 60. The payload size of the ICMP packet. Values range from 2bytes to 1452 bytes.
Max TTL Specifies the maximum number of hops (max time-to-live value) traceroute will probe. Values range from 1 to 255. The default is 30.
Probe Count Sets the number of probe packets per hop. Values range from 1 to 10. The default is 3.
Buttons Start: Click to start transmitting ICMP packets. New Ping: Click to re-start diagnostics with PING.

349
Chapter 5. Maintenance This chapter describes the entire switch Maintenance configuration tasks to enhance the performance of local network including Restart Device, Firmware upgrade, Save/Restore, Import/Export.
5-1 Restart Device This section describes how to restart switch for any maintenance needs. Any configuration files or scripts that you saved in the switch should still be available afterwards.
Web Interface To configure a Restart Device Configuration in the web interface: 1. Chick Restart Device. 2. Click Yes.
Figure 5-1: Restart Device
Parameter description: Restart Device :
You can restart the switch on this page. After restart, the switch will boot normally. Buttons:
Yes – Click to “Yes” then the device will restart. No- Click to undo any restart action.

350
5-2 Reboot Schedule This page allows user to schedule the time to reboot the switch.
Web Interface To configure a Reboot Schedule in the web interface:
1. Chick Reboot Schedule 2. Set the parameters 3. Click Apply.
Figure 5-2: Reboot Schedule
Parameter description: Mode
Indicates the reboot scheduling mode operation. Possible modes are: Enabled: Enable switch reboot scheduling. Disabled: Disable switch reboot scheduling.
Week Day The day to reboot this switch.
Reboot Time The time to reboot the switch.
Buttons: Apply–Click to save changes. Reset–Click to undo any changes made locally and revert to previously saved values.

351
5-3 Factory Defaults This section describes how to reset the Switch configuration to Factory Defaults. Any configuration files or scripts will recover to factory default values.
Web Interface
To configure a Factory Defaults Configuration in the web interface:
1. Chick Factory Defaults. 2. Click Yes.
Figure 5-2: The Factory Defaults
Parameter description: Buttons:
Yes – Click to “Yes” button to reset the configuration to Factory Defaults. No- Click to to return to the Port State page without resetting the configuration.

352
5-4 Firmware This section describes how to upgrade Firmware. The Switch can be enhanced with more value-added functions by installing firmware upgrades.
5-4.1 Firmware upgrade This page facilitates an update of the firmware controlling the switch..
Web Interface To configure a Firmware Upgrade Configuration in the web interface: 1. Chick Browser to select Maintenance/Software in you device. 2. Click Download.
Figure 5-4.1 The firmware Download
Parameter description: Browse :
Click the “Browse...” button to search the Firmware URL and filename.
NOTE: This page facilitates an update of the firmware controlling the switch. Uploading software will update all managed switches to the location of a software image and click. After the software image is uploaded, a page announces that the firmware update is initiated. After about a minute, the firmware is updated and all managed switches restart. the switch restarts.
WARNING: While the firmware is being updated, Web access appears to be defunct. The front LED flashes Green/Off with a frequency of 10 Hz while the firmware update is in progress. Do not restart or power off the device at this time or the switch may fail to function afterwards.
Brows

353

354
5-4.2 Firmware Selection This page provides information about the active and alternate (backup) firmware images in the device, and allows you to revert to the alternate image. The web page displays two tables with information about the active and alternate firmware images. Note:
1. In case the active firmware image is the alternate image, only the "Active Image" table is shown. In this case, the Activate Alternate Image button is also disabled.
2. If the alternate image is active (due to a corruption of the primary image or by manual intervention), uploading a new firmware image to the device will automatically use the primary image slot and activate this.
3. The firmware version and date information may be empty for older firmware releases. This does not constitute an error.
Web Interface To configure a Firmware Upgrade Configuration in the web interface: 1. Chick Browser to select Maintenance/Software in you device. 2. Click Image Select.
Figure 5-4.2 The Firmware selection
Image Information Image
The flash index name of the firmware image. The name of primary (preferred) image is image, the alternate image is named image.bk.
Version The version of the firmware image.
Date

355
The date where the firmware was produced. Buttons
Activate Alternate Image: Click to use the “Activate Alternate Image”. This button may be disabled depending on system state. Cancel: Cancel activating the backup image. Navigates away from this page.

356
5-5 Configuration The switch stores its configuration in a number of text files in CLI format. The files are either
virtual (RAM-based) or stored in flash on the switch.
There are three system files:
running-config: A virtual file that represents the currently active configuration on the
switch. This file is volatile.
startup-config: The startup configuration for the switch, read at boot time.
default-config: A read-only file with vendor-specific configuration. This file is read when
the system is restored to default settings.
It is also possible to store up to two other files and apply them to running-config, thereby
switching configuration.
5-5.1 Save startup-config This copy running-config to startup-config, thereby ensuring that the currently active configuration will be used at the next reboot.
Web Interface To save running configuration in the web interface: 1. Chick Browser to select Maintenance/Configuration in you device. 2. Click Apply Startup-Config Select.
Figure 5-5.1: The Save Startup Configuration
Parameter description: Buttons :
Save Configuration: Click to save configuration, the running configuration will be written to flash memory for system boot up to load this startup configuration file.
357
5-5.2 Download The switch stores its configuration in a number of text files in CLI format. The files are either virtual (RAM-based) or stored in flash on the switch. The available files are: running-config: A virtual file that represents the currently active configuration on the switch. This file is volatile. startup-config: The startup configuration for the switch, read at boot time. If this file doesn't exist at boot time, the switch will start up in default configuration. default-config: A read-only file with vendor-specific configuration. This file is read when the system is restored to default settings. Up to 99 other files, typically used for configuration backups or alternative configurations.
Web Interface
To download configuration in the web interface: 1. Chick Browser to select Maintenance/Configuration in you device. 2. Click Download Select.
Figure 5-5.2: Download
Parameter Save startup-config
This copies running-config to startup-config, thereby ensuring that the currently active configuration will be used at the next reboot.
Download It is possible to download any of the files on the switch to the web browser. Select the file and click “Download Configuration”. Download of running-config may take a little while to complete, as the file must be prepared for download.
Upload It is possible to upload a file from the web browser to all the files on the switch, except default-configwhich is read-only. Select the file to upload, select the destination file on the target, then click “Upload Configuration”. If the destination is running-config, the file will be applied to the switch configuration. This can
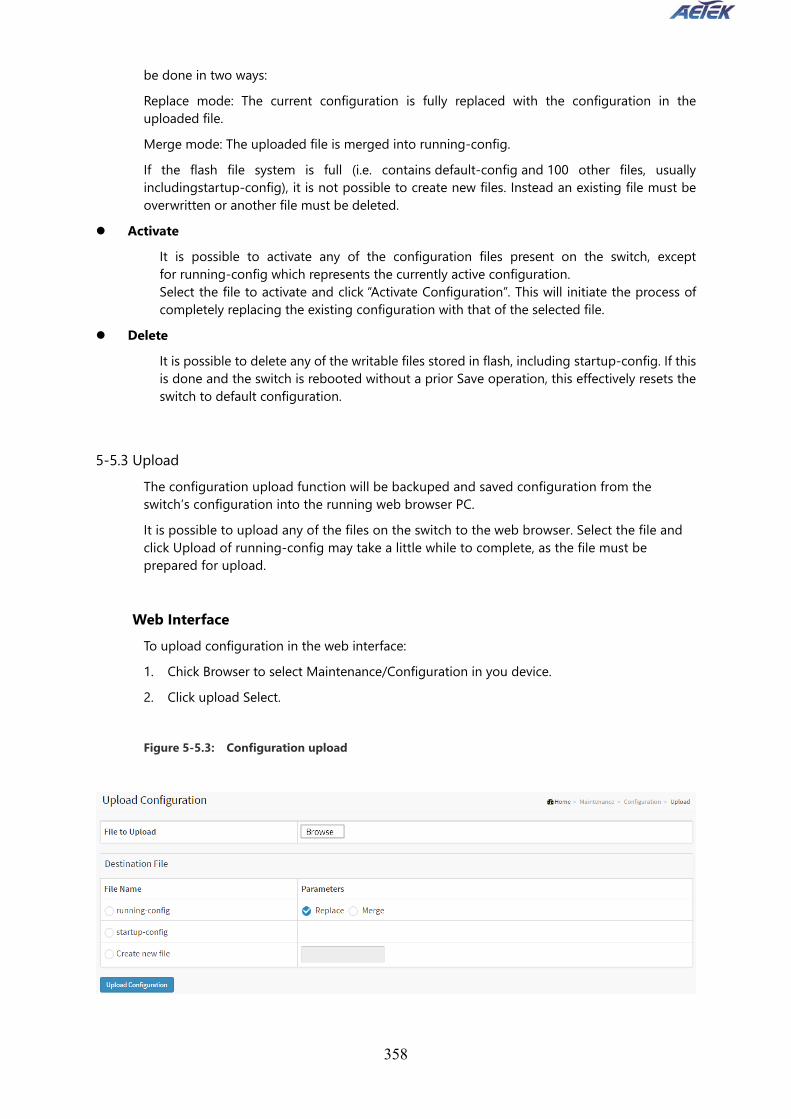
358
be done in two ways: Replace mode: The current configuration is fully replaced with the configuration in the uploaded file. Merge mode: The uploaded file is merged into running-config. If the flash file system is full (i.e. contains default-config and 100 other files, usually includingstartup-config), it is not possible to create new files. Instead an existing file must be overwritten or another file must be deleted.
Activate It is possible to activate any of the configuration files present on the switch, except for running-config which represents the currently active configuration. Select the file to activate and click “Activate Configuration”. This will initiate the process of completely replacing the existing configuration with that of the selected file.
Delete It is possible to delete any of the writable files stored in flash, including startup-config. If this is done and the switch is rebooted without a prior Save operation, this effectively resets the switch to default configuration.
5-5.3 Upload The configuration upload function will be backuped and saved configuration from the switch’s configuration into the running web browser PC. It is possible to upload any of the files on the switch to the web browser. Select the file and click Upload of running-config may take a little while to complete, as the file must be prepared for upload.
Web Interface
To upload configuration in the web interface: 1. Chick Browser to select Maintenance/Configuration in you device. 2. Click upload Select.
Figure 5-5.3: Configuration upload

359
There are three system files: 1. running-config: A virtual file that represents the currently active configuration on the switch.
This file is volatile. 2. startup-config: The startup configuration for the switch, read at boot time. 3. default-config: A read-only file with vendor-specific configuration. This file is read when the
system is restored to default settings. Parameter description: Buttons :
Upload Configuration: Click the “Upload” button then the running web management PC will start to upload the configuration from the managed switch configuration into the location PC, user can configure web browser’s upload file path to keep configuration file.

360
5-5.4 Activate The switch stores its configuration in a number of text files in CLI format. The files are either virtual (RAM-based) or stored in flash on the switch. The available files are: running-config: A virtual file that represents the currently active configuration on the switch. This file is volatile. startup-config: The startup configuration for the switch, read at boot time. If this file doesn't exist at boot time, the switch will start up in default configuration. default-config: A read-only file with vendor-specific configuration. This file is read when the system is restored to default settings. Up to 99 other files, typically used for configuration backups or alternative configurations. Web Interface
To activate configuration in the web interface: 1. Chick Browser to select Maintenance/Configuration in you device. 2. Click Activate Select.
Figure 5-5.4: Configuration Activation
There are two system files:
1. default-config: A read-only file with vendor-specific configuration. This file is read when the system is restored to default settings.
2. startup-config: The startup configuration for the switch, read at boot time. Parameter description: Buttons :
Activate Configuration: Click the “Activate” button then the default-config or startup-config file will be activated and to be this switch's running configuration.

361
5-5.5 Delete It is possible to delete any of the writable files stored in flash, including startup-config. If this is done and the switch is rebooted without a prior save operation, this effectively resets the switch to default configuration.
Web Interface
To delete configuration in the web interface: 1. Chick Browser to select Maintenance/Configuration in you device. 2. Click Delete Select.
Figure 5-5.5: Delete Configuration
There is one system files:
startup-config: The startup configuration for the switch, read at boot time. Parameter description: Buttons :
Delete Configuration: Click the “Delete” button then the startup-config file will be deleted, this effectively resets the switch to default configuration.
5-6 Server Report It is possible to download server report file on the switch to the web browser. Download of server-report may take a little while to complete, as the file must be prepared for download. Web Interface
To delete configuration in the web interface: 1. Chick Browser to select Maintenance/Configuration in you device. 2. Click Server Report
Figure 5-6: Server Report

362
Chapter 6. DMS
1. DMS is an intelligent management tool embedded in switches to intuitively help IT/TS reduce support cost/time/effort.
2. All devices connected to the switches can be discovered and displayed by DMS automatically using standard networking protocols such as LLDP, UPnP, ONVIF, Bonjour, etc.
3. Users can operate the features below via an intuitive web GUI. - Power down, remotely, the IP cameras, NVRs, or any PoE devices. - Identify where exactly the broken cable is, remotely. - Detect abnormal traffic issues on IP cameras/NVR. - Monitor devices status intuitively, e.g. link up, PoE power, traffic, etc. - Configure VLAN/QoS intuitively for better solution quality/reliability.
4. DMS supports up to 1,000 devices within 4 subnets. The embedded Device Managed System is designed to be extremely easy-to-use/manage/install IP Phone, IP Cam, or Wifi-AP for enterprise applications. User can deploy IP Device through Topology/ Floor/ Map View to installation location, and through Diagnostics and Traffic Monitor, they may also check link status and monitor throughput as well.
Figure 6-1: The DMS Overview

363
6-1 Management 6-1.1 DMS Mode
Figure 6-2: The DMS mode
DMS Mode: Enable/ Disable the DMS function. Total Device: Here will show how many IP devices are detected and displayed in the topology view. On-Line Devices: Here will show how many IP devices on-line in the topology view. Off-Line Device: Here will show how many IP devices off-line in the topology view. Controller IP: It show the Master IP.
6-1.2 Device List It will show all devices and their information which are detected by DMS.
Figure 6-3: The Devices List
A. If you want to auto-refresh the information then you need to evoke the “Auto refresh”.
A C B D
E

364
B. Click this icon to Refresh the status of all devices.
C. Click this icon to Edit Device Name and http Port. User can press “Edit” icon to edit device name and HTTP port for each IP device. This
function can also be configured in the Dashboard of Topology view. There is no HTTP connection function for Unknown Device and PC type devices, so UI
doesn’t provide “Edit HTTP port” function for configuring it.
Figure 6-4: The Edit of Devices List
D. Search devices by key words with full text search.
E. Only Offline devices provide “Remove” function to remove from DMS device list.
Note: The device name will not save until you click Apply button. Please do not click refresh, auto-refresh or edit button before you apply new device name.

365
6-2 Graphical Monitoring 6-2.1 Topology View DMS can automatically discover all IP devices and display the devices by graphic networking topology view. User could manage and monitor them by the Topology View, such as to remotely diagnose the cable connection status, auto alarm notifications on critical events, remotely reboot PoE device when it’s not alive. Therefore, the user can apply DMS platform to solve the abnormal issues anytime and anywhere by tablet or smart phone, and keep the network works smoothly. Click Graphical Monitoring Topology View, you can see a visual view of the network topology.
Figure 6-5: The Topology View
Parameter description:
1. Icon with plus and minus marks: Zoom in and zoom out the topology view. User can scroll up/down with mouse to achieve the same purpose.
2. Icon with information list: User can select what kind of information should be shown on the topology view of each device. Up to 3 items can be selected.
1
2
3 4

366
Figure 6-6: The Information List
3. Device picture
Icon with black mark: Device link up. User can select function and check issues.
Icon with red mark: Device link down. User can diagnose the link status.
Icon with numbers: It means some events happened (e.g. Device Off-line, IP Duplicate…etc.) on the IP device, user can click on the device icon to check events in Notification.
Icon with question: It means the IP device is detected by DMS, but the device type can’t be recognized which will be classified as an unknown device type.
To left-click any device icon to display the device consoles for further actions:
Figure 6-7: The Device Console
Test

367
A. Dashboard Console: It displays device info and related actions for the device. Different device type supports different function:
- If an IP device is recognized as DMS switch, it will support “Upgrade“, “PoE Config“ and “Find Switch” function.
- If an IP device is recognized as PoE device, it will support “PoE Reboot” function in addition to “Upgrade” and “Find Switch”.
- If an IP device is recognized as IP cam via ONVIF protocol, it will support “Streaming” function.
Device Type: It can be displayed automatically. If an unknown type is detected, user can still select type from a pre-defined list.
Device Name: Create your own Device Name or alias for easy management such as, 1F_Lobby_Cam1.
Model Name, MAC Address, IPv4 Address, Subnet Mask, Gateway, PoE Supply and PoE Used are displayed automatically by DMS.
Http Port: Re-assign http port number to the device for better security. DHCP Client: Enable or Disable the DHCP client. If this feature is enabled, the system will configure
the IPv4 address and mask of the interface using the DHCP protocol. The DHCP client will announce the configured System Name as hostname to provide DNS lookup.
Login: Click the Login Action Icon to log in the device via http for further configuration or status monitoring.
Upgrade: Click it to upgrade software version.
Find Switch: When this feature is activated, the switch LED will all lighten up and flicker for 15 seconds.
PoE Config: Click it to configure the PoE function, enable/disable PoE Auto Checking or enable/disable PoE mode for per port.

368
Figure 6-8: The PoE Configure
Diagnostics: Click Diagnostic Action Icon to perform the cable diagnostics, to exam where the broken cable is, and, check if the device connection is alive or not by ping.
Cable Status: - Green icon: Cable is connected correctly. - Red icon: Cable is not connected correctly. User can check the distance info
(XX meters) to identify the broken cable location. Connection:
- Green icon: Device is pinged correctly. - Red icon: Device is not transmitted /receiving data correctly. Which means it
might not be pinged successfully.
Figure 6-9: The Diagnostics
PoE Reboot: Click Reboot Action Icon to reboot the device remotely so as recover the device back to its normal operation.
Streaming: Click Streaming Action Icon to display the video images streaming, if the device supports this feature.
Icon with blank node: When DMS switch detects more than two IP devices from the same port, switch can’t resolve this IP device’s layout, instead, it will show a blank node to present this situation. User can use “Parent Node” function to adjust layout in Dashboard.
B. Notification Console: It displays alarms and logs triggered by events.

369
Figure 6-10: The Notification Console
C. Monitor Console: It displays the traffics for device health check purpose. For each IP device except DMS switches, User can set a threshold of throughput for IP devices, and
get notification when throughput is lower or higher than settings. If both values are “0”, it means the function is disabled. Polling interval is 1 second, when the page is closed, the Polling interval will change to around 5
seconds.
Figure 6-11: The Monitor Console
4. In the upper right corner, there is a “Setting icon”. When user clicks the icon, it will pop-up Device, Group, Config, export topology view and advanced search functions for the topology.

370
Device Search Console All devices and info. will show on the list.
Figure 6-12: The Device Search Console
A. Group Setting Console User can set VLAN group for each IP device by OUI or clicking device icon, and
configure traffic priority (0~7) for each VLAN group. Using Mac Based VLAN to isolate groups. One IP device only can join one VLAN group.
Figure 6-13: The Group Setting Console
B. System Setting Console
Test01 Test01
Test02
Test04
Test03 Test03
Test04
A C
B
Test02 Function A. Filter devices by Device Type
B. Search devices by key words full text search
C. Save the whole View to SVG, PNG or PDF
Function
A. Group devices by filtering, searching, clicking device icons, or specifying OUI.
B. Configure traffic priority for the VLAN.
C. Assign VLAN ID or Name to Group. C
B
A
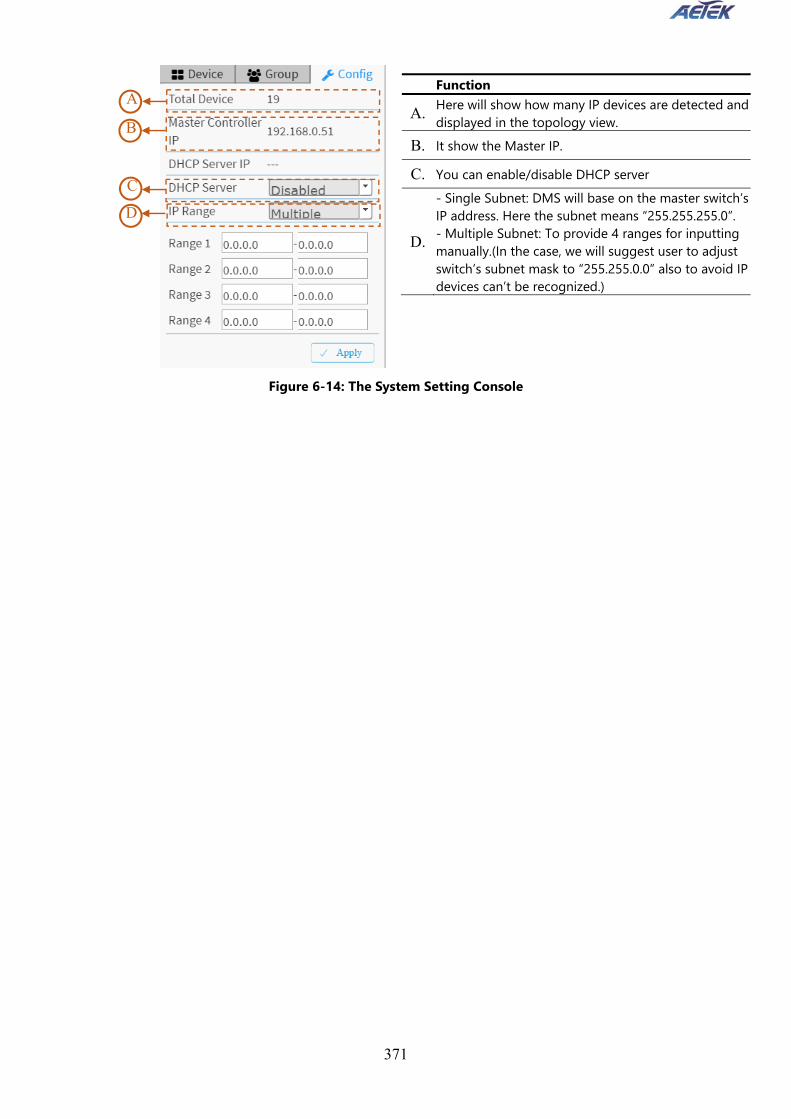
371
Figure 6-14: The System Setting Console
A
B
C
D
Function
A.Here will show how many IP devices are detected and displayed in the topology view.
B. It show the Master IP.
C. You can enable/disable DHCP server
D.
- Single Subnet: DMS will base on the master switch’s IP address. Here the subnet means “255.255.255.0”. - Multiple Subnet: To provide 4 ranges for inputting manually.(In the case, we will suggest user to adjust switch’s subnet mask to “255.255.0.0” also to avoid IP devices can’t be recognized.)

372
6-2.2 Floor View User can easily plan IP devices installation location onto the custom uploaded floor images.
Figure 6-15: The Floor View
Anchor Devices onto Floor Maps Find Device Location Instantly 10 Maps can be Stored in Each Switch IP Surveillance/VoIP/WiFi Applications Other Feature same as Topology View To place and remove a device icon:
To select a device and click its icon from the device list. The device icon will show on the floor image’s default location. To click and hold left mouse by dragging-and-dropping the icon to the correct location on
the floor view. To click cross sign on the right side of device icon to remove a device from all floor view
images.
Test01
Test01
Test02
Test02
Test03
Test03
Test04
Test04

373
Figure 6-16: The Device Icon to Remove a Device
If there are more than two floor images, it can be selected from the field.
Figure 6-17: The Device Icon to Select floor
Test01
Test01
Test02
Test02
Test01
Test01
Test02
Test02

374
6-2.3 Map View It can help to find the location of the devices even they are installed in different building. User can place the device icon on the Map View of which navigated by Google map.
Figure 6-18: The Map View
Anchor Devices onto Google Map. Find Devices Instantly from Map. On-Line Search Company/Address. Outdoor IP Cam/WiFi Applications. Other Feature same as Topology View.
Test01
Test02
Test03
Test04

375
6-3 Maintenance 6-3.1 Floor Image In this page, user can add or delete a floor image.
Figure 6-19: The Floor Image
Each DMS switch provides 10 files space for uploading. Only support JPG and PNG formats. File size is limited to 512KB. All DMS switches’ floor image in the same network can be shared together.
For example: If Switch1 has uploaded 10 floor images, Switch2 uploaded 5 images, the total 15 floor images can be shared and selected on all DMS switches in the same network.
File name will attach IP address to let user know the floor image is stored on which DMS switch.

376
6-3.2 Diagnostics In this page, all IP devices will be listed in a table, user can diagnose connection status of IP device in the network
Figure 6-20: The Diagnostics List
User select a device, the diagnostics procedure will start automatically.
Figure 6-21: The Select a Device to Diagnostics
To press “Another Try” to back IP device list page. The diagnostic function can also be found in Dashboard of topology view.