H7 Review of Opex and Commercial Revenues: Initial Proposals
187
13 th October 2021 Civil Aviation Authority Review of H7 Opex and Commercial Revenues: Initial Assessment and Forecasts Final report (REDACTED)
Transcript of H7 Review of Opex and Commercial Revenues: Initial Proposals
13th October 2021
Civil Aviation Authority
Review of H7 Opex and Commercial Revenues: Initial Assessment and Forecasts
Final report (REDACTED)
Important Information
2
This document was prepared by CEPA LLP (trading as CEPA) and Taylor Airey for the exclusive use of the recipient(s) named herein.
The information contained in this document has been compiled by CEPA and/or Taylor Airey and may include material from other sources, which is believed to be
reliable but has not been verified or audited. Public information, industry and statistical data are from sources we deem to be reliable; however, no reliance may be
placed for any purposes whatsoever on the contents of this document or on its completeness. No representation or warranty, express or implied, is given and no
responsibility or liability is or will be accepted by or on behalf of CEPA or by any of its directors, members, employees, agents or any other person as to the
accuracy, completeness or correctness of the information contained in this document and any such liability is expressly disclaimed.
The findings enclosed in this document may contain predictions based on current data and historical trends. Any such predictions are subject to inherent risks and
uncertainties.
The opinions expressed in this document are valid only for the purpose stated herein and as of the date stated. No obligation is assumed to revise this document to
reflect changes, events or conditions, which occur subsequent to the date hereof.
CEPA does not accept or assume any responsibility in respect of the document to any readers of it (third parties), other than the recipient(s) named herein. To the
fullest extent permitted by law, CEPA will accept no liability in respect of the document to any third parties. Should any third parties choose to rely on the
document, then they do so at their own risk.
The content contained within this document is the copyright of the recipient(s) named herein, or CEPA has licensed its copyright to recipient(s) named herein. The
recipient(s) or any third parties may not reproduce or pass on this document, directly or indirectly, to any other person in whole or in part, for any other purpose
than stated herein, without our prior approval.

Contents
Executive Summary 4
1. Introduction 40
2. Review of HAL’s overall forecasting approach 45
3. Opex forecasts 52
A. Efficiency of 2019 figures as a baseline
B. Elasticities
C. People
D. Operational costs (incl. Insurance)
E. Facilities and Maintenance
F. Rates, Utilities and Distribution Contract
G. Surface access initiatives
H. Frontier shift and input price inflation
I. Capital investment
J. Overall results
4. Commercial revenue forecasts 131
A. Efficiency of 2019 figures as a baseline
B. Elasticities
C. Retail
D. Surface access
E. Property
F. Other non-aeronautical revenues
G. Cargo revenues
H. Capital investment
I. Overall results
3
Executive Summary
Our terms of reference
5
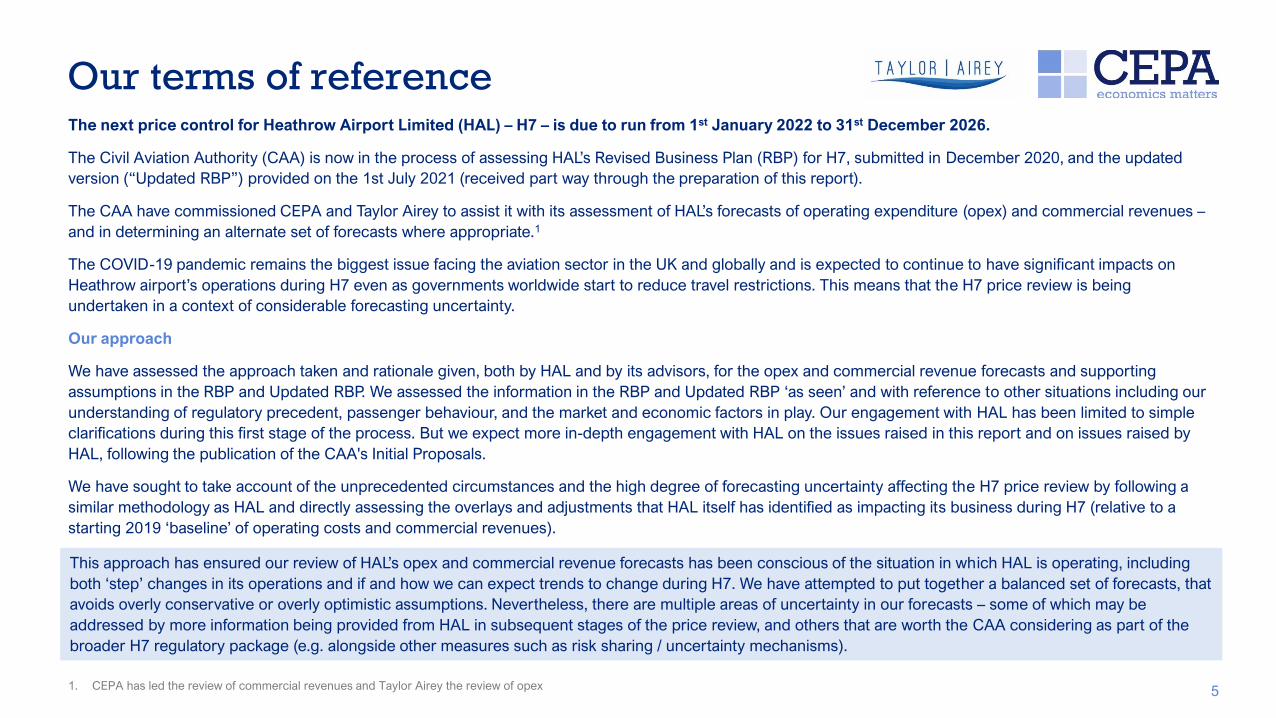
The next price control for Heathrow Airport Limited (HAL) – H7 – is due to run from 1st January 2022 to 31st December 2026.
The Civil Aviation Authority (CAA) is now in the process of assessing HAL’s Revised Business Plan (RBP) for H7, submitted in December 2020, and the updated
version (“Updated RBP”) provided on the 1st July 2021 (received part way through the preparation of this report).
The CAA have commissioned CEPA and Taylor Airey to assist it with its assessment of HAL’s forecasts of operating expenditure (opex) and commercial revenues –
and in determining an alternate set of forecasts where appropriate.1
The COVID-19 pandemic remains the biggest issue facing the aviation sector in the UK and globally and is expected to continue to have significant impacts on
Heathrow airport’s operations during H7 even as governments worldwide start to reduce travel restrictions. This means that the H7 price review is being
undertaken in a context of considerable forecasting uncertainty.
Our approach
We have assessed the approach taken and rationale given, both by HAL and by its advisors, for the opex and commercial revenue forecasts and supporting
assumptions in the RBP and Updated RBP. We assessed the information in the RBP and Updated RBP ‘as seen’ and with reference to other situations including our
understanding of regulatory precedent, passenger behaviour, and the market and economic factors in play. Our engagement with HAL has been limited to simple
clarifications during this first stage of the process. But we expect more in-depth engagement with HAL on the issues raised in this report and on issues raised by
HAL, following the publication of the CAA's Initial Proposals.
We have sought to take account of the unprecedented circumstances and the high degree of forecasting uncertainty affecting the H7 price review by following a
similar methodology as HAL and directly assessing the overlays and adjustments that HAL itself has identified as impacting its business during H7 (relative to a
starting 2019 ‘baseline’ of operating costs and commercial revenues).
This approach has ensured our review of HAL’s opex and commercial revenue forecasts has been conscious of the situation in which HAL is operating, including
both ‘step’ changes in its operations and if and how we can expect trends to change during H7. We have attempted to put together a balanced set of forecasts, that
avoids overly conservative or overly optimistic assumptions. Nevertheless, there are multiple areas of uncertainty in our forecasts – some of which may be
addressed by more information being provided from HAL in subsequent stages of the price review, and others that are worth the CAA considering as part of the
broader H7 regulatory package (e.g. alongside other measures such as risk sharing / uncertainty mechanisms).
1. CEPA has led the review of commercial revenues and Taylor Airey the review of opex

HAL’s forecasting approach
6
HAL has adopted a relatively standard Base-Step-Trend approach to producing its RBP forecasts:
• Base: HAL has chosen to use a 2019 base (with adjustments), as opposed to using a 2020 base as its starting point year. HAL also
assumes its 2019 baseline opex and commercial revenues are both efficient – and has therefore made limited efficiency adjustments.
• The approach of using a 2019 base is the most pragmatic option – there are issues with this (as discussed within this report), but in
the time available and given the information we have access to, we consider the approach to be reasonable.
• However, we have identified a number of issues with the evidence HAL has provided around the efficiency of the 2019 base. This
evidence base has been reviewed and challenged as part of our analysis.
• Step: HAL has applied several top-down overlays, or ‘step’ changes’ to both opex and commercial revenues, mostly relating to the
COVID-19 pandemic.
• In a few areas, the logic underpinning the inclusion of overlays is not provided and the evidence around the size (£m) of overlays
requested is not always sufficiently substantiated. However, the updated RBP includes a lot more detail around the forecasts.
• Trend: HAL has taken a top-down approach of applying cost/revenue drivers and associated elasticities.
• We consider the evidence around the elasticities is stronger than the evidence HAL provided for iH7 but believe there is more scope
for scenario-based analysis given this presents a key area of uncertainty.

Step
Our forecasting approach
7
HAL has applied several overlays to both its opex and commercial revenue forecasts, citing the impact of the pandemic, structural shifts to consumer needs and
demands, etc. Although we understand the rationale behind this approach, each overlay takes away from the relatively simple forecasting approach originally
adopted. A more robust, transparent approach would have been to do a full bottom-up assessment – where, for certain categories of cost or revenue that are affected
by substantial step changes, the costs/revenues are built-up based on the new operating structure.
In the time available to produce this report, and with the data/information we have had access to, it has not been feasible for us to take a fully bottom-up approach.
We have, therefore, mimicked HAL’s forecasting approach, disaggregating where necessary and feasible. We have identified the key assumptions that drive HAL’s
forecasts, challenged the evidence base underpinning them, and where necessary, presented alternate assumptions that we consider are supported by a stronger
logic or evidence base given current information. We provide final opex and commercial revenue forecasts for each of the CAA’s passenger forecast scenarios
(High, Mid, Low) but in our reporting typically use HAL’s Mid case passenger forecasts to allow a like for like comparison between our forecasts and HAL’s.
Top-down methodology
What is a good
starting point?
TrendBase
Is the starting point
reflective of an efficient
baseline?
What is
the
need?
Is it
additional?
What evidence
supports size of
adjustment
Are the cost/ rev
drivers logical &
comprehensive?
Are elasticities valid
for the context they
are used in?
• 2019 is a pragmatic start year.
• We have reviewed previous CAA and HAL-
commissioned evidence.
• We have validated the starting point of key sub-
categories with bottom-up analysis.
• We tested the logic and evidence for the need
and additionality of step changes.
• Where HAL’s evidence for the size of their
adjustment is inadequate, we produce alternate
estimates using other evidence sources or using
transparent assumptions.
• We review any econometric analysis used to
support the elasticity estimates.
• We derive ‘bottom-up’ elasticities where more
appropriate.

0
1,000
2,000
,000
,000
,000
HAL RBP Update 1 CEPA Airline Alternative BP ( eb)
m, 201
0
1,000
2,000
,000
,000
,000
,000
HAL RBP Update 1 Taylor Airey Airline Alternative BP ( eb)
m, 201
Summary of our initial assessment
8
Our review of HAL’s Updated RBP has led us to propose alternative forecasts for both opex and commercial revenues.
In the pages below we provide a more detailed summary of our findings which inform these initial forecasts.
Opex Commercial revenues and Cargo revenue
Our initial forecasts are
31% higher than HAL’s
Updated RBP forecast with
no capex overlay
Total commercial and cargo revenues in H7, £m 2018 RPI Total opex in H7, £m 2018 RPI Our initial forecasts are 15% lower than HAL’s Updated
RBP forecast before incorporating CAA’s pax forecasts
Source: Taylor Airey analysis Source: CEPA analysis
It is important to note that our adjustments to HAL’s forecasts reflect the information as seen in the RBP and Updated RBP. To the extent that HAL can provide
additional supporting information and evidence to more robustly justify its assumptions as compared to our own, then we would expect to review our
findings and conclusions. We have set out in this report the key areas of the Updated RBP where the CAA should seek further information and analysis from HAL.
No
minimal
capex
overlay
Minimal
capex
overlay **
HAL* Mid
pax
forecasts
CAA* Mid
pax
forecasts
* Both HAL and the CAA have developed High, Mid, Low pax forecasts for the H7 period. We use the Mid pax forecast for figures presented.
** In HAL’s no RAB adjustment scenario (which we use as the basis of comparison), HAL apply a negative overlay to their revenue forecasts. This negative overlay is to reflect the impact on revenues from not
having their preferred levels of capital investment.
HAL* Mid
pax
forecasts
CAA* Mid
pax
forecasts

TA (HAL pax volumes) Cost inflation Baseline adjustments Elasticity assumptions rontier shift ecurity transformation ther HAL
1,000
2,000
,000
,000
,000
,000
Waterfall chart of Taylor Airey initial forecasts vs. HAL Updated RBP, total for H7 (£m, 2018 RPI prices)
Comparison of HAL and TA opex forecasts: Key drivers of differences
9
Upwards adjustment
Downwards adjustment
We consider
costs will
generally
increase with
CPI rather than
RPI, and we
make fewer
real price
effects
adjustments
than HAL
Source: Taylor Airey analysis
We disagree with
HAL’s assertion
that 2019 is at
the frontier of
efficiency, and
we consider
some of HAL’s
pandemic-related
efficiency
measures can be
carried forward
into H7
We use specific
elasticity
assumptions for
operational and
non-operational
staff costs, and do
not allow HAL’s
proposed
elasticities where
they are not
supported by the
evidence provided
We consider
the ongoing
efficiency
challenge
should not be
linked to the
size of the
capital plan
We consider that
security
transformation will
have a significant
benefit on people
costs and that it
should not be
linked to capital
plan

CEPA (HAL pax) Management stretch Retail tax and passenger
mix changes
Cargo elasticity Mode share
assumptions
Rail overlay ther HAL (incl. Cargo without
capex adjustment)
00
1,000
1, 00
2,000
2, 00
,000
, 00
,000
, 00
Comparison of HAL and CEPA revenue forecasts: Key drivers of differences
10
Waterfall chart of CEPA initial revenue forecasts vs. HAL Updated RBP, total for H7 (£m, 2018 RPI prices)
Upwards adjustment
Downwards adjustment
We apply a 2%
management
stretch
challenge,
whereas HAL
do not assume
any explicit
management
stretch
Source: CEPA analysis
We differ in our
assessment of
the impact on
changes to
taxation rules
and passenger
mix on retail
income
We apply an
elasticity of
cargo revenues
with respect to
passenger
numbers of -8.5
compared with
HAL’s -1
We construct
an alternate set
of mode share
assumptions
using the
evidence
provided by
HAL
We do not consider
HAL has justified why
it needs to reduce
ticket prices to
maintain HEx mode
shares during the
pandemic

▪ Efficiency of 2019 and the need for baseline adjustments
▪ Stretch and opportunity – example Security Transformation
▪ Frontier shift and capital substitution
▪ Selected overlays
▪ Overall results
Opex forecasts
Executive Summary

2019 and the need for baseline adjustments
We consider three issues when determining the need for adjustments to our 2019 baseline:
1. The efficiency of 2019 as a baseline – We consider whether the information presented by HAL demonstrates it was operating at the frontier of efficiency
in 2019.
2. HAL’s adjustments to its baseline – We review whether the adjustments HAL makes to its 2019 costs before using it as a baseline, are appropriate.
In doing so, we consider both the reasons for adjustments and the size of the adjustment made. In particular, we look for evidence to show that staff costs
associated with the Heathrow Expansion Programme have been fully removed and that these are not included in the base and projected forwards.
3. Actions taken since 2019 – We review the extent to which HAL’s cost control actions taken in 2020 and 2021 are sustainable and can be carried forward
into the H7 period.
The tests above are used to inform our assessment of the need for an adjustment to our 2019 opex to make it a suitable baseline for our forecast. We summarise
our findings in the table below:
HAL Taylor Airey
£m
(nominal)
£m
(nominal)Rationale Category Period
1 Efficiency of 2019 as a baseline -17 We have considered average productivity achieved in the last 3 years of the
Q6/ Q+1 period to smooth variations in individual years, in particular, opex
increases in 2019.
Pro-rated
across
categories
From 2020
2 HAL adjustments to 2019 baseline: We have used HAL’s proposed adjustment for the removal of expansion
costs, pending further assessment. And we allow some of HAL’s overlay for
the London Living Wage, but we consider further evidence is required before
allowing the full overlay.
Multiple From 2020
3 Actions taken since 2019 At least 50% of the pa (2018 RPI prices) benefits of reorganisation
identified by HAL would be expected to be sustainable.
People From 2020
Comparison of HAL and Taylor Airey views regarding the efficiency of 2019 as a base and the need for adjustments:
Source: Taylor Airey analysis
12

Security Transformation: Our view
13
Comments on HAL’s approach to modelling benefits:
1. Maturity of HAL’s analysis
As security staff costs represented between 40-45% of the staff cost base in Q6, benefits in this
critical area would be expected to be modelled in detail at every stage of the business planning
process.
This modelling will be informed by the pilot projects that have recently commenced and will
undoubtedly be refined as these project progress. However, as the processes and technologies are
relatively well understood, it would be expected that HAL’s modelling would already have produced
reliable indicators of the impacts of the security transformation programme.
In comparison with similar developments in train at other airports, it would also be expected that HAL
would have commenced process improvement initiatives to ameliorate the well-known throughput
penalties of operating the new systems with existing processes.
2. Dependency on capex
Experience from other airports as well as from HAL's past initiatives shows that benefits can be
derived from operational process improvements which are independent of infrastructure or
equipment change, i.e. the way that staff are deployed and the tasks they do, as well as the way the
passengers are directed through the process. As the screening technology changes are mandated by
regulation, operational processes will change regardless of the capital allowance.
We therefore disagree with HAL’s view that no efficiency improvements are possible without
higher capital expenditure.
Our alternate view:
Rather than the airlines’ approach of deriving an
absolute figure per annum, benefits from
security transformation will be volume related
and it would be more accurate to treat them as
an amended elasticity with respect to
passengers for security staff FTE rather than an
overlay.
We have therefore undertaken detailed
modelling to create a bottom-up validation of
relevant elasticities to use for Security people
costs.
In this way we have derived multiple elasticities
to account for the step changes produced by the
introduction of new technologies.
The assumptions, approach and outputs from
this analysis are shown on the following pages.
We conclude that opex benefits can arise from improving security efficiency through people and process change, regardless of the level of
capital investment in security. Benefits should be modelled directly in the People cost category rather than as capital substitution effects.

Security: Estimating staff costs
14
We have created a queuing model to estimate the impacts of the security transformation on the requirements for security full time
equivalents (FTE) staff and have applied this model to calculate the relationship (elasticity) between passenger volume and the number of
FTEs required. We have overlaid this model with expected efficiencies in terms of passenger throughput and process improvement
indicated by HAL and through comparison with stretch targets anticipated at other UK airports operating similar equipment and processes.
Assumptions and sources:
1. Security staff requirements comprise a variable part, associated with passenger
and hand baggage screening, that depends on passenger volumes, and a fixed
part, e.g. for fixed posts, that is inelastic to passenger volumes.
2. HAL’s future security processes will take advantage of the capabilities of the new
technologies – body scanners, computed tomography (CT) screening, etc – that
are mandated in the same way that other airports operate or plan to operate.
3. HAL suggest that throughput will increase from passengers per hour per
security lane to passengers per hour per lane: we assume that this change is
phased from 2022 to 2026, that is an improvement of over five years or
approximately per year.
4. Our experience of comparison with the aspirations of other UK and international
airports suggests that process improvement initiatives can reduce the variable
staff requirements for security lanes by typically over five years: we assume
this starts in 2023 and that is an annual improvement of per year.
5. In parallel, technology improvements and process efficiency will
reduce the requirement for fixed staffing levels by 1% per year
starting in 2023.
6. Historic staff numbers to 2018 are sourced from the Steer
report on opex efficiency with 2019 figures being sourced from
the PA-Nyras report commissioned by the LACC.
7. The fixed component of the staff cohort is estimated from staff
classified as “campus” and “other” in the teer report with the
variable component of the staff cohort derived from the
remaining staff, assigned to terminals in the Steer report.
8. Historical costs are derived from HAL’s regulatory accounts.
9. Projected costs are estimated using the 2019 cost per security
FTE of derived from the regulatory accounts and the PA-
Nyras report, meaning that wage inflation and counteracting
measures to reduce costs are not included (or cancel each
other out).
Sources:
PA Consulting (Nyras) (2020) Operating Cost Report and Presentation Benchmarking Study
Steer, December 2019: Operating Cost
2021.03.02 - Airline Community Presentation to CAA_RBP Feedback and ABP_Final
Note:
Detail on the approach used to estimate security staff costs is provided in section 3, "opex forecasts" part
C "people"

99.
9 .2
101.
9 .
100.0
7 .7
.9
7 .9
.
.
.7
2.7
0
20
0
0
0
100
120
201 201 2017 201 2019 2020 2021 2022 202 202 202 202
Propotion of 2019 staff opex
Taylor Airey HAL
Estimating staff costs: Results
15
The figure below compares our estimates of staff costs, historical through to projections in nominal terms referenced to the 2019 baseline.
or comparison, HAL’s projections from the RBP model (Update 1) are also shown normalised to 2019.
Projection of staff costs as a proportion of 2019 costs, nominal
Note: This TA curve shown in this chart does not include wage inflation nor efficiency frontier adjustments
Source: Taylor Airey analysis
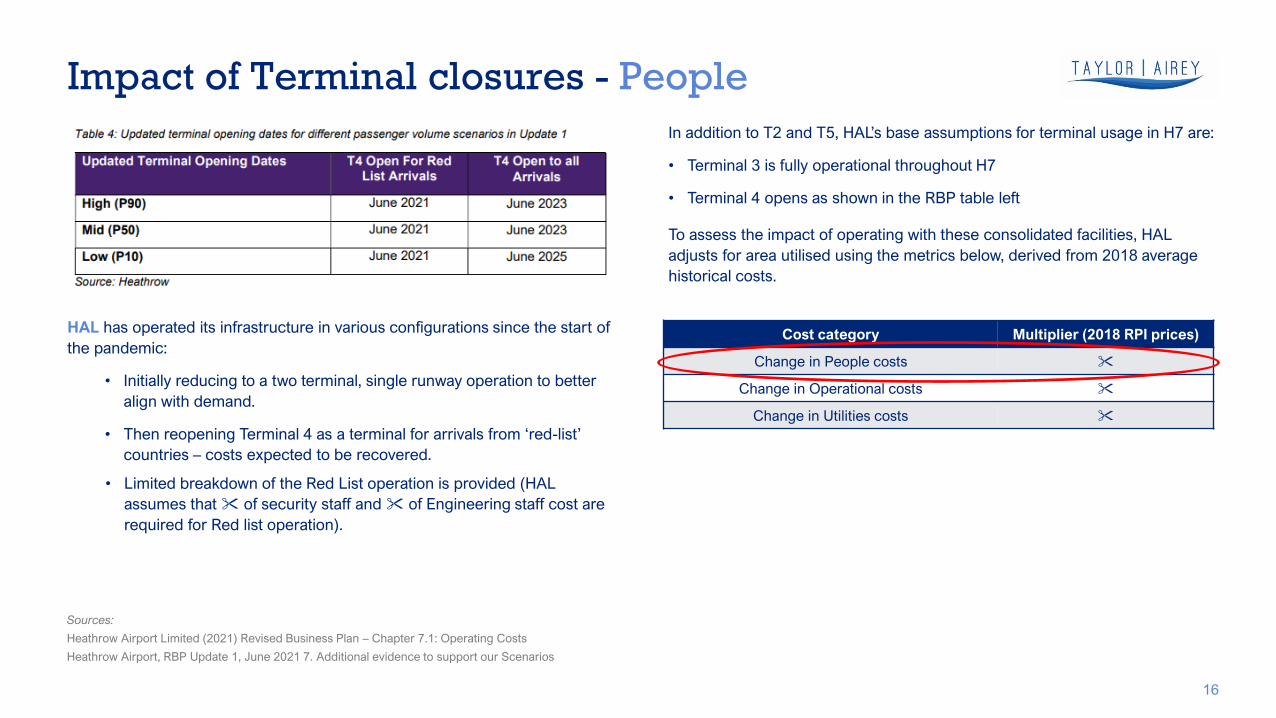
In addition to T2 and T , HAL’s base assumptions for terminal usage in H7 are:
• Terminal 3 is fully operational throughout H7
• Terminal 4 opens as shown in the RBP table left
To assess the impact of operating with these consolidated facilities, HAL
adjusts for area utilised using the metrics below, derived from 2018 average
historical costs.
Impact of Terminal closures - People
16
Cost category Multiplier (2018 RPI prices)
Change in People costs
Change in Operational costs
Change in Utilities costs
Sources:
Heathrow Airport Limited (2021) Revised Business Plan – Chapter 7.1: Operating Costs
Heathrow Airport, RBP Update 1, June 2021 7. Additional evidence to support our Scenarios
HAL has operated its infrastructure in various configurations since the start of
the pandemic:
• Initially reducing to a two terminal, single runway operation to better
align with demand.
• Then reopening Terminal as a terminal for arrivals from ‘red-list’
countries – costs expected to be recovered.
• Limited breakdown of the Red List operation is provided (HAL
assumes that of security staff and of Engineering staff cost are
required for Red list operation).

Impact of Terminal closures: People
17
Efficiency:
HAL commissioned Frontier Economics to undertake analysis of the elasticity
of operating costs to various cost drivers at the airport.1
As Frontier Economics could find no relationship between HAL's historical
people costs and their drivers, we question whether these multipliers could be
considered appropriate or efficient. Our forecasting approach broadly
follows Heathrow’s but we will consider further ways to validate their
assumptions at a later stage.
Also, the inclusion of T use as a Red list terminal makes it unclear in HAL’s
model whether the costs returned post-opening match the savings made
whilst the terminal was closed.
• e.g.
Reopening of T4 for all arrivals:
We agree with HAL’s approach of ramping up costs in the months preceding
full reopening of T4 as staff are retrained and re-familiarised.
However, the proposed trajectory () and the approach of applying a space
driver to people costs is likely to be overly cautious as it means that 100% of
T4 people cost returns on the day that T4 is reopened, regardless of the
passenger volume served.
If we accept HAL’s proposed multiplier of , our more conservative
assumptions would equate to a further potential saving of £5m (2018 RPI
prices) in 2023 over that modelled by HAL in their forecasts.
Commentary on the impact of terminal closures on Operational Costs and Utilities costs are
included in our later discussions of those costs categories.
Source: Taylor Airey analysis
Proportion of T4 staff savings possible due to terminal closure - 2023
Note 1: Frontier Economics (2019) Developing opex and commercial revenue elasticities for H7

Frontier shift and capital benefits
18
HAL approach
HAL combines these factors as follows:
• 0.1% benefit pa based on productivity improvements as an appropriate level
for a Frontier Shift, based on analysis prepared by First Economics (applied
to all cost categories except Rates and Distribution Contract).
• 1.1% savings based on opex benefits arising from the opex benefits of
capital investment.
In HAL’s proposal, the 1.1 capex benefit is contingent on approval of the
£4.2bn capital plan as HAL claims that the projects that deliver opex efficiency
are not included in lower cost capex plans.
Our view
We agree that there are likely to be two broad factors delivering the
opportunity for improved efficiency in H7:
• A total factor productivity (TFP) type benefit
• Improvements in labour productivity potential above TFP growth – such as
opex benefits arising from capital investment
However, we disagree with the approach taken by HAL to calculating potential
‘capital substitution’ effect and do not feel that it is supported by the study
commissioned from First Economics or the precedents it quotes. We would
expect capital investment to have a lagging effect when it comes to delivering
benefits, and not be solely linked to projects in train as part of the H7 capital
plan.
We therefore feel that the calculation of 1.1% provided by HAL in the RBP and
the conditionality on particular projects being allowed in the agreed H7 capital
plan is not supported by precedent or the evidence provided.
While recognising that more recent price determinations (e.g. RIIO-2, PR19)
have considered frontier shift estimates of >1%, we apply an overall frontier
shift estimate of 1% reflecting ongoing productivity gains supported by
precedent developed over several price controls and reflecting that large, one-
off efficiency savings are captured as overlays. We propose not linking the
frontier shift estimate with the size of the capital plan.
ollowing HAL’s approach, we apply our frontier shift estimate to all cost
categories except for rates, the electricity distribution contract, and the new
cost overlays introduced for H7 (e.g. opex related to the terminal drop-off
charge, Covid-19 overlay etc).
Source: First Economics August 2019 - Frontier Shift, Input Price Inflation and Productivity Growth
A report prepared for Heathrow Airport

Opex benefits from capital investment: Our view
19
The ‘ afety nly’ capital plan delivers a portfolio of projects under the
banner Protect the Business with two objectives:
• Asset management and compliance (£2.138bn)
• Protect efficiency and revenue (£0.36bn)
Our view is that there are likely to be operating cost benefits arising
from programmes in this plan – we disagree with HAL’s view that opex
benefits are only possible with the Optimal Plan.
Having considered the additional detail provided on the rationale and
prioritisation of these programmes provided by the RBP Update, we suggest
that benefits are likely to be delivered by the following programmes in the
Safety Only plan:
• Asset replacement (£1.5bn)
• T2 Baggage (£0.18bn)
• Regulated Compliance (£0.42bn)
• Avoid material Opex increases (£0.1bn)
We understand that the primary objective of this part of the capital portfolio is
to deliver on mandatory requirements rather than enhance the asset base. In
principle however, the replacement of end-of-life assets with newer, modern
equipment with greater reliability would be expected to reduce the amount of
time and resource required for planned and corrective maintenance with a
positive benefit on the Facilities and Maintenance opex category.
Around 60% of the investment proposed in this plan is under the heading of
Asset Replacement (£1.5bn). In this section of the RBP Update1, HAL
considers that a further £400m could have been added to the Asset
Replacement budget. However, as a mitigation for not including this, it refers to
the potential need for, “…a 10% uplift in maintenance opex to allow for
increased maintenance regimes across the airport (which) could extend the
life of assets and help to mitigate against assets being out of service…”
As HAL considers the downside risk of higher opex due to lower capital
spend on asset replacement, it seems inconsistent that it does not
consider the upside opportunity for opex reduction arising from a
considerable investment in new and more resilient assets.
1. Heathrow Airport Limited (2021) Revised Business Plan Update – 5.3 H7 Capital plan updates
We conclude that HAL should consider whether opex benefits, for example in Facilities and Maintenance costs, arise from other parts of the
capex portfolio, even in the Safety Only capital plan.

or the “ ull RAB Adjustment case”, HAL asserts that an additional (2018 RPI prices) per annum is required as
an enhanced service cost overlay (E ) to deliver a “I feel cared for and supported” consumer outcome. This
comprises:
1. £ for the 9 of passengers requiring support who choose not to use “our dedicated assistance service”;
2. an additional maintenance to ensure resilience of passenger sensitive equipment (PSE) that has suffered
under investment and cannot be replaced under the current capital programme;
3. £ for digital services bridging a customer services gap; and
4. £ to support the roll-out of new automated, touchless parts of the passenger journey.
Enhanced service cost overlay: Summary
20
Need
Additionality
Efficiency
With the exception of (2) on resilience, none of the above elements of the enhanced service overlay would appear
to be additional to business as usual activities. Of the allocated to resilience, part of this may be justified for old,
difficult to maintain, equipment, but there is a risk of overlap with standard maintenance and a potential inflation as
equipment in, for example, Terminal 2, is not likely to be at end of life or difficult to maintain.
As the enhanced service overlay appears to cover or overlap with business as usual activities accounted for
elsewhere, specifically standard maintenance and support to passengers with reduced mobility (PRM), we propose
to apply a reduced enhanced service cost overlay of £7m in 2022 adjusted for efficiencies going forward.

There have clearly been costs incurred in the immediate pandemic response in 2020/21 which are unprecedented
and could not be expected to be included in historical short run elasticities. However there is not a convincing case
presented to evidence why such effects are expected to continue throughout the H7 period at a constant level (,
2018 RPI prices) without any mitigation.
Covid overlay
21
Need
Additionality
Efficiency
Due to a lack of transparency of the data it is difficult to determine whether the cost of public health responses may
duplicate items that would have already been accounted for in facilities, cleaning and maintenance.
Given the unique characteristics of HAL’s business and its operational responses it is difficult to benchmark what
an efficient cost might look like. However 2020 actual costs would be expected to be an unrealistically high
estimate for the H7 years as:
• The immediacy of the responses required may not have allowed time for best value solutions to be sourced
• The supplier base for certain items may have been limited and competing demand in the market high (for
example for hand sanitiser, wipes, PPE etc) in the early stages of the pandemic response
• No mitigations had yet been developed
• Costs incurred in 2020 arose in response to guidelines in force at that time. These are unlikely to be the same
in the later years of the H7 period
Therefore, we propose using an overlay which tapers from (2018 RPI prices) in 2022 to 0 by 2026

Summary of opex forecasts
22
HAL forecasts: HAL mid pax forecasts, No RAB Adjustment Taylor Airey forecasts: HAL mid pax forecasts, No RAB Adjustment
2018 RPI prices, £m 2022 2023 2024 2025 2026
People 224 238 245 240 233
Operational excl. insurance 204 227 238 240 237
Insurance
Facilities and maintenance 134 145 151 152 152
Rates 113 112 111 110 109
Utilities exc. distribution 50 56 59 60 61
Distribution contract
General expenses 95 102 106 106 105
Surface access initiatives 8 9 9 11 10
Other overlays 17 15 12 10 7
Total 891 949 974 971 957
Total per passenger, £ 21.44 16.89 14.84 13.80 13.28
Difference with HAL, £m -121 -144 -163 -188 -211
Cumulative difference, £m -827
2018 RPI prices, £m 2022 2023 2024 2025 2026
People
Operational excl. insurance
Insurance
Facilities and maintenance
Rates
Utilities exc. distribution
Distribution contract
General expenses
Surface access initiatives
Other overlays
Total 1,012 1,093 1,137 1,159 1,168
Total per passenger, £ 24.36 19.44 17.32 16.46 16.21
Source: HAL Analysis
Note – HAL and Taylor Airey opex forecasts are reported on a consistent HAL Mid pax forecast
scenario.
Source: Taylor Airey Analysis
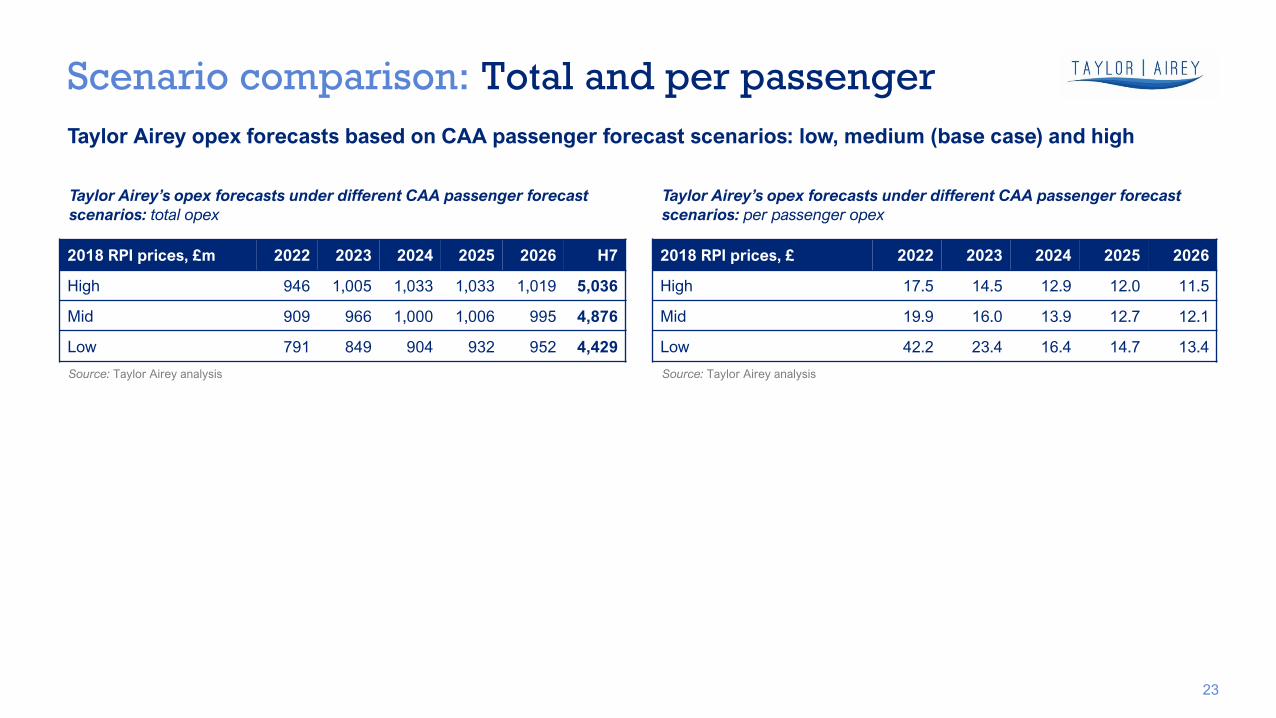
Taylor Airey opex forecasts based on CAA passenger forecast scenarios: low, medium (base case) and high
Scenario comparison: Total and per passenger
23
Taylor Airey’s opex forecasts under different CAA passenger forecast
scenarios: per passenger opex
2018 RPI prices, £ 2022 2023 2024 2025 2026
High 17.5 14.5 12.9 12.0 11.5
Mid 19.9 16.0 13.9 12.7 12.1
Low 42.2 23.4 16.4 14.7 13.4
Source: Taylor Airey analysis
Taylor Airey’s opex forecasts under different CAA passenger forecast
scenarios: total opex
2018 RPI prices, £m 2022 2023 2024 2025 2026 H7
High 946 1,005 1,033 1,033 1,019 5,036
Mid 909 966 1,000 1,006 995 4,876
Low 791 849 904 932 952 4,429
Source: Taylor Airey analysis
0
1,000
2,000
,000
,000
,000
,000
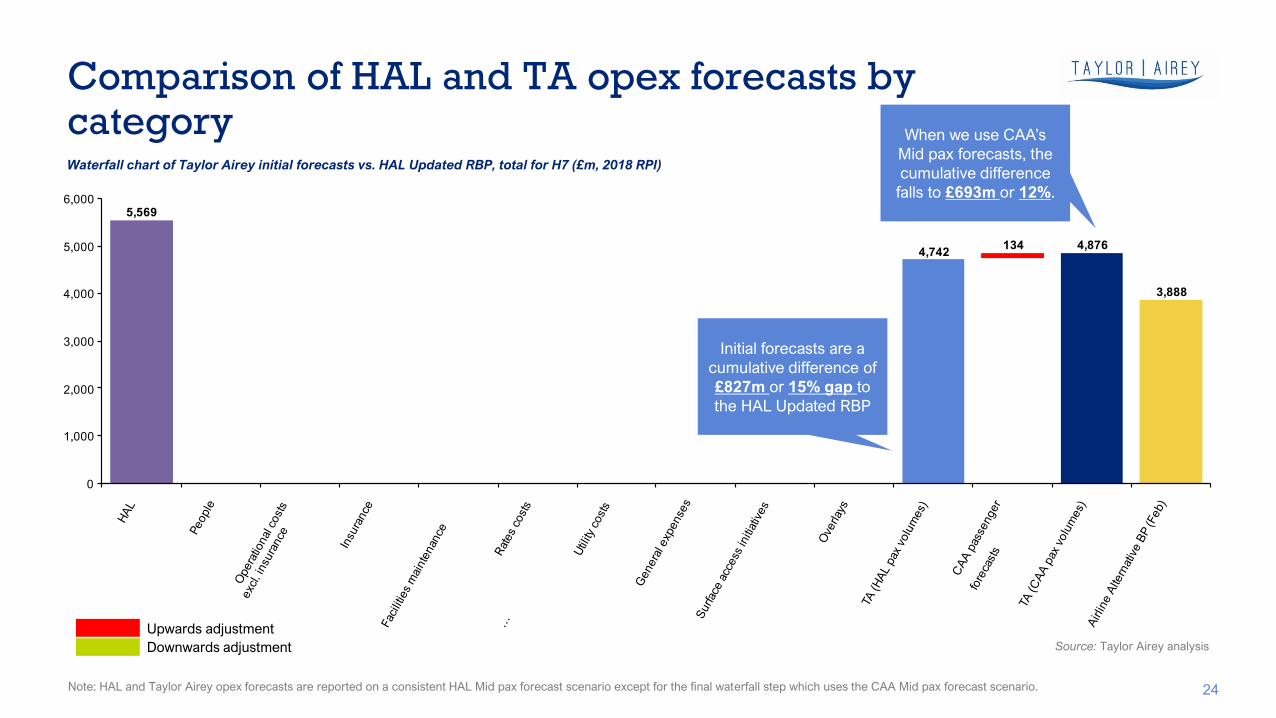
Waterfall chart of Taylor Airey initial forecasts vs. HAL Updated RBP, total for H7 (£m, 2018 RPI)
Comparison of HAL and TA opex forecasts by category
24
Upwards adjustment
Downwards adjustment
Initial forecasts are a
cumulative difference of
£827m or 15% gap to
the HAL Updated RBP
Source: Taylor Airey analysis
Note: HAL and Taylor Airey opex forecasts are reported on a consistent HAL Mid pax forecast scenario except for the final waterfall step which uses the CAA Mid pax forecast scenario.
When we use CAA’s
Mid pax forecasts, the
cumulative difference
falls to £693m or 12%.

. . .
. . .
.
.
.
. . .
.
.
. . .
.
.
. . .
0
10
1
20
2
0
0
201 201 201 2017 201 2019 2020 2021 2022 202 202 202 202
Per passenger opex ( , 201 RPI prices)
Historical HAL (Mid, no RAB adjustment) Taylor Airey (HAL pax forecasts) Tailor Airey (CAA pax forecasts)
Comparison of HAL and TA opex forecasts
25
Comparison of per passenger opex forecasts
Source: Taylor Airey analysis
Note: Both HAL and the CAA have developed High, Mid, Low pax forecasts for the H7 period. We use the Mid pax forecast for figures presented above.
▪ Efficiency of 2019 figures as a baseline
▪ Elasticities
▪ Retail
▪ Surface access
▪ Other elements of commercial revenues
▪ Overall results
Commercial revenue forecasts
Executive Summary
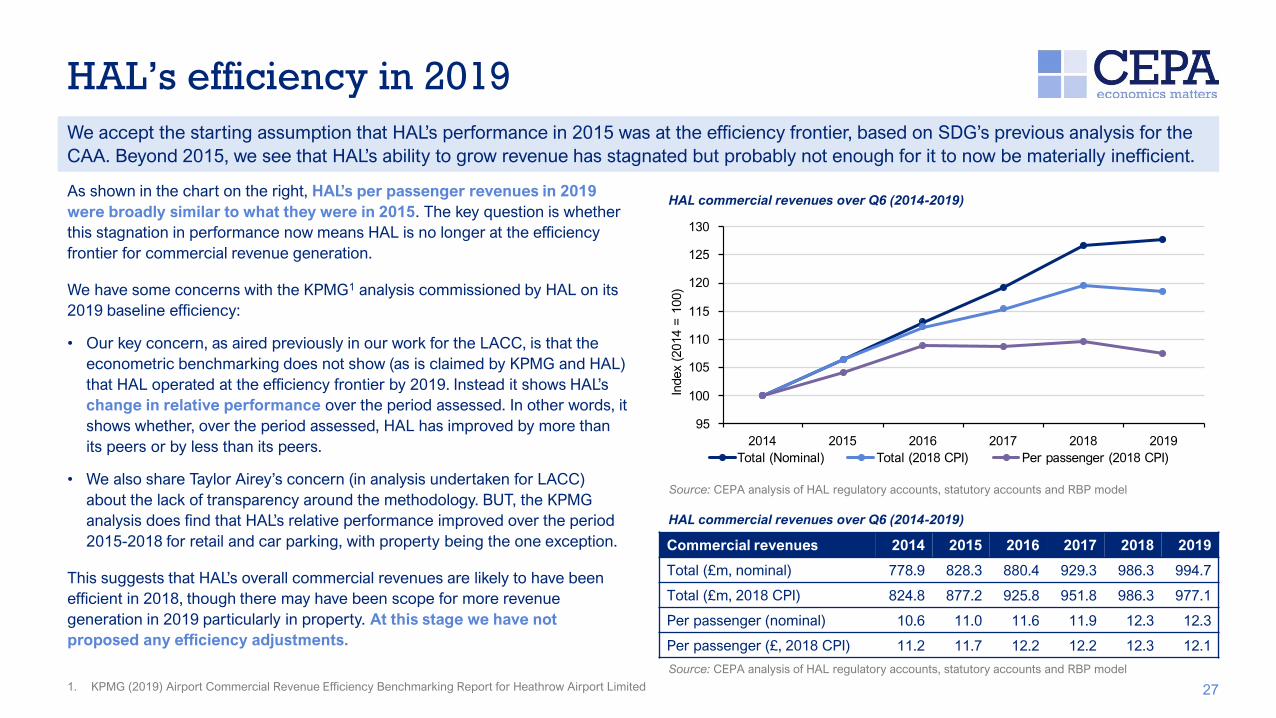
HAL’s efficiency in 2019
27
As shown in the chart on the right, HAL’s per passenger revenues in
were broadly similar to what they were in 2015. The key question is whether
this stagnation in performance now means HAL is no longer at the efficiency
frontier for commercial revenue generation.
We have some concerns with the KPMG1 analysis commissioned by HAL on its
2019 baseline efficiency:
• Our key concern, as aired previously in our work for the LACC, is that the
econometric benchmarking does not show (as is claimed by KPMG and HAL)
that HAL operated at the efficiency frontier by 2019. Instead it shows HAL’s
change in relative performance over the period assessed. In other words, it
shows whether, over the period assessed, HAL has improved by more than
its peers or by less than its peers.
• We also share Taylor Airey’s concern (in analysis undertaken for LACC)
about the lack of transparency around the methodology. BUT, the KPMG
analysis does find that HAL’s relative performance improved over the period
2015-2018 for retail and car parking, with property being the one exception.
This suggests that HAL’s overall commercial revenues are likely to have been
efficient in 2018, though there may have been scope for more revenue
generation in 2019 particularly in property. At this stage we have not
proposed any efficiency adjustments.
We accept the starting assumption that HAL’s performance in 201 was at the efficiency frontier, based on DG’s previous analysis for the
CAA. Beyond 201 , we see that HAL’s ability to grow revenue has stagnated but probably not enough for it to now be materially inefficient.
Commercial revenues 2014 2015 2016 2017 2018 2019
Total (£m, nominal) 778.9 828.3 880.4 929.3 986.3 994.7
Total (£m, 2018 CPI) 824.8 877.2 925.8 951.8 986.3 977.1
Per passenger (nominal) 10.6 11.0 11.6 11.9 12.3 12.3
Per passenger (£, 2018 CPI) 11.2 11.7 12.2 12.2 12.3 12.1
HAL commercial revenues over Q6 (2014-2019)
HAL commercial revenues over Q6 (2014-2019)
Source: CEPA analysis of HAL regulatory accounts, statutory accounts and RBP model
Source: CEPA analysis of HAL regulatory accounts, statutory accounts and RBP model
9
100
10
110
11
120
12
1 0
201 201 201 2017 201 2019
Index (201 100)
Total ( ominal) Total (201 CPI) Per passenger (201 CPI)
1. KPMG (2019) Airport Commercial Revenue Efficiency Benchmarking Report for Heathrow Airport Limited

Elasticities to estimate volume effects
28
We have made a number of adjustments to HAL’s Updated RBP assumptions for elasticities to estimate volume effects
Management
challenge
HAL claims its elasticity estimates are inclusive of a
management challenge and, therefore, no separate adjustment
is required. We disagree with this as volume effects and the
management challenge are two different concepts – we do not
consider it logical to assume that volume effects and
management challenge always work in the same direction. We
propose a separate management challenge adjustment of
2% per annum, based on HAL’s historical performance in terms
of increasing revenues above passenger growth.
Retail
elasticity
HAL has proposed an elasticity of for forecasting retail
volumes with respect to passenger numbers, drawing on
econometric analysis undertaken by Frontier Economics. We
conclude that there is a small risk of upward bias to this elasticity
estimate given the management challenge has not been
captured as a separate variable but have chosen not to make an
adjustment for this in our forecasts for this report and so use
in our modelling.
HAL has proposed an elasticity of for property revenue with
respect to utilised terminal space. This is not supported by any
evidence in the RBP. We use an alternate elasticity estimate of
0.25, based on data on the number of contracts HAL has with
different types of property customers. We make assumptions on
the types of contracts that are likely to be driven by terminal
usage and derive our estimate accordingly.
Property
elasticity
Car parking
/ rental
revenue
Heathrow
Express
revenue
Other service
revenue
HAL has proposed an elasticity of with respect to passenger
numbers. We identify a number of reasons why this may be an
overestimate (e.g. fuel sales are unlikely to be affected by
passenger volumes) and so, we have used an elasticity of 0.8
for the purposes of our forecasts.
HAL has proposed an elasticity of with respect to car
parking/rental passengers. In the absence of robust econometric
evidence to justify an alternative assumption, we are content
with this proposal – the implicit assumption being the marginal
passenger yields as much revenue as the average passenger.
We separately consider the impact of COVID-19 on average
yields.
HAL has proposed an elasticity of with respect to HEx
passengers. As the impact on yields as a result of COVID-19 and
the introduction of Crossrail services is dealt with separately, we
have accepted HAL’s elasticity proposal of for our initial
forecasts.

Summary of HAL’s narrative supporting their retail forecasts
29
Retail tax changes
HAL assumes the impact of the various tax changes will reduce retail revenues by
in 2022 relative to 2019, falling to in 2026 (previously a uniform reduction in
the December 2020 RBP). The tax changes can be broadly split into three categories:
• The loss of airside tax free pricing, which will lead to:
• A reduction in retail concession income from store closures (mostly luxury and fashion,
technology and duty-free);
• Less retail concession income from retailers who choose to absorb the additional VAT in
return for lower concession rates;
• Lost sales due to the passenger response to price increases, leading to a loss in
concession income.
• The removal of the VAT RES scheme, which will lead to:
• Lost concession income from Travelex who process VAT Refunds; and
• An indirect loss in revenue from retail sales that are made by passengers using the cash
they receive from VAT refunds.
• The extension of excise duty relief on alcohol and tobacco to EU passengers, which will lead
to higher duty free income.
Bureaux
HAL assumes
a decline
in bureaux income
relative to 2019.
This is based on a
decline in currency
exchange transactions
affecting the
renegotiation of the
Travelex contract.
HAL has presented retail as being an area subject to a series of headwinds – an unfavourable passenger mix due to pandemic-related restrictions, a
general move towards online shopping, the removal of airside tax-free shopping, the removal of the VAT retail-export scheme, and the continued
decline of the currency exchange business. Of these, three specific overlays have been applied to the forecasts.
Retail impacts from
COVID-19
HAL assumes that
changes in the passenger mix
will lead to a decline in
revenue (relative to 2019) in
2022 and a decline in
2023, before returning to
normal.
This is based on their forecast
of the passenger mix, with
fewer higher-spending
Asia/Pacific passengers, and
more lower spending
domestic and European
passengers.

Our view on HAL’s proposed retail overlays for the tax and passenger mix changes
30
We understand the logic of changes in passenger mix affecting retail revenues received by HAL. And we accept
that such changes in the passenger mix are likely to be material during H7 given the impact of the pandemic.
In terms of the tax changes, the impact of removing airside tax free on revenues, even when accounting for the
duty free extension on alcohol and tobacco sales, remains material and needs to be considered as a separate
overlay. Similarly, the removal of the VAT RES scheme will lead to a loss in income from the Travelex VAT refund
concession, which also needs to be covered as an overlay.
However, the indirect loss of sales due to the removal of the VAT RES scheme does not meet the needs test. No
convincing evidence has been provided by HAL to support the assumption that the refunds received by
passengers are then spent at the departure lounge. As a result, we have not made an adjustment to account for
this component of the overlay.
Need
Additionality
Efficiency
We consider the impact of changes in the passenger mix are unlikely to be accounted for through the passenger
volume elasticity. Similarly, the tax changes are genuine step changes that are not accounted for elsewhere.
We can not conclude that the size of the overlays proposed by HAL reflect efficient adjustments to HAL’s retail
revenue forecasts. Key assumptions that drive the size of the adjustment have not been explained or supported by
any evidence. As such, we propose alternative approaches that are described further overleaf.
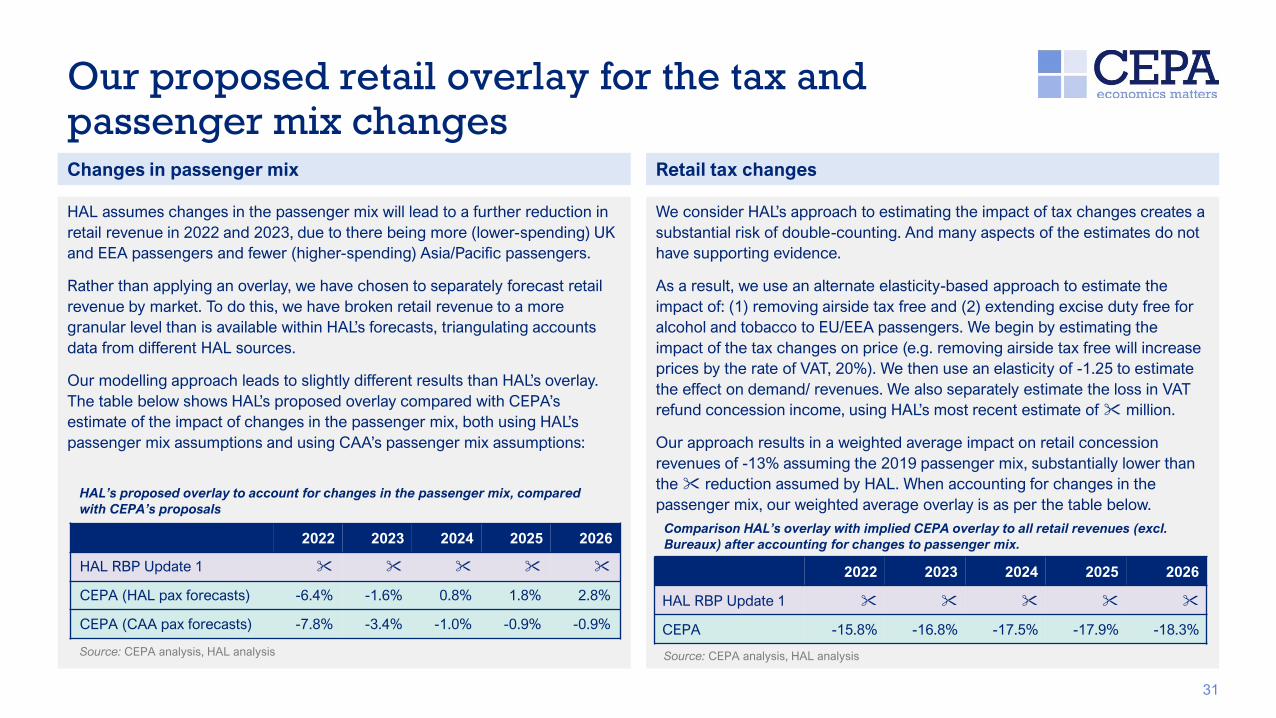
Retail tax changes
We consider HAL’s approach to estimating the impact of tax changes creates a
substantial risk of double-counting. And many aspects of the estimates do not
have supporting evidence.
As a result, we use an alternate elasticity-based approach to estimate the
impact of: (1) removing airside tax free and (2) extending excise duty free for
alcohol and tobacco to EU/EEA passengers. We begin by estimating the
impact of the tax changes on price (e.g. removing airside tax free will increase
prices by the rate of VAT, 20%). We then use an elasticity of -1.25 to estimate
the effect on demand/ revenues. We also separately estimate the loss in VAT
refund concession income, using HAL’s most recent estimate of million.
Our approach results in a weighted average impact on retail concession
revenues of -13% assuming the 2019 passenger mix, substantially lower than
the reduction assumed by HAL. When accounting for changes in the
passenger mix, our weighted average overlay is as per the table below.
2022 2023 2024 2025 2026
HAL RBP Update 1
CEPA -15.8% -16.8% -17.5% -17.9% -18.3%
Comparison HAL’s overlay with implied CEPA overlay to all retail revenues (excl.
Bureaux) after accounting for changes to passenger mix.
Our proposed retail overlay for the tax and passenger mix changes
31
Changes in passenger mix
HAL assumes changes in the passenger mix will lead to a further reduction in
retail revenue in 2022 and 2023, due to there being more (lower-spending) UK
and EEA passengers and fewer (higher-spending) Asia/Pacific passengers.
Rather than applying an overlay, we have chosen to separately forecast retail
revenue by market. To do this, we have broken retail revenue to a more
granular level than is available within HAL’s forecasts, triangulating accounts
data from different HAL sources.
ur modelling approach leads to slightly different results than HAL’s overlay.
The table below shows HAL’s proposed overlay compared with CEPA’s
estimate of the impact of changes in the passenger mix, both using HAL’s
passenger mix assumptions and using CAA’s passenger mix assumptions:
2022 2023 2024 2025 2026
HAL RBP Update 1
CEPA (HAL pax forecasts) -6.4% -1.6% 0.8% 1.8% 2.8%
CEPA (CAA pax forecasts) -7.8% -3.4% -1.0% -0.9% -0.9%
HAL’s proposed overlay to account for changes in the passenger mix, compared
with CEPA’s proposals
Source: CEPA analysis, HAL analysis Source: CEPA analysis, HAL analysis

HAL has suggested that Bureaux revenue will reduce by relative to 2019 during H7. The RBP offers little
explanation for the make up of this , but based on discussions with airlines and our review of additional material
presented to the CAA, we have developed a clearer understanding of the issues faced by HAL.
The material presented to the CAA provides some justification for an overlay. Travelex experienced a decline in
walk-up currency exchange transactions at Heathrow from 2015-2019.1 The previous concession contract operated
largely on a fixed payment basis, which has so far protected HAL from these broader market trends. We understand
that this contract expired in 2020, and we also note that Travelex entered into administration in 2020. HAL argues that
the renegotiated contract has far less generous terms and does not offer fixed payment protections. Consequently, we
find that the needs test for an overlay has been met.
Our view of HAL’s proposed overlay to Bureaux revenue
32
There has been a long-term decline in walk-up FX transactions and currency exchange more generally, with
passengers favouring electronic payments and currency cards. Based on industry insights, we expect this trend to
continue – with the airport currency exchange market under pressure from both the move away from cash, and savvier
travellers making more effective use of online price comparisons.
As no explanation has been provided for the size of the overlay, we have developed an alternate set of assumptions
to test its efficiency. We assume the decline in walk-up transactions represents the longer term decline in currency
exchange revenues, implying a 10% annual reduction. We then assume there is a step change in 2021 revenues to
account for the cumulative reduction in income from 2014-2020 (when fixed payment protections expired), and that
revenues from 2022 onwards decline with the same long-term trend.
This implies a reduction of 56% in
2022 rising to a 71% reduction in
202 , suggesting that HAL’s
estimate may be overstated.
1. CAA session on commercial revenues in the RBP (4 December 2020)
Need
Additionality
Efficiency
% reduction from 2019 levels 2022 2023 2024 2025 2026
Currency exchange -56% -60% -64% -67% -71%
Source: CEPA analysis

Summary of HAL’s narrative around the surface access forecasts
33
In their RBP and subsequent presentations, HAL has presented a series of headwinds and opportunities related to surface access. These
broadly sit in three categories – the impact of the COVID-19 pandemic, the introduction of Crossrail services, and management initiatives to
increase revenues.
The pandemic is expected to lead to some short-term structural
shifts in how passengers travel to/from the airport and the types
of passengers that use different surface access services.
▪ Change in passenger mix, with more leisure and short-haul
passengers and fewer business and long-haul passengers:
• This is assumed to lead to lower average transaction values (ATV) for
HAL’s car rental and car parking services
• Less revenue from Heathrow Express
▪ Fewer passengers:
• Less revenue from all surface access services
▪ A shift from public transport to private transport modes:
• Less Heathrow Express revenue
• More transactions from car rental and car parking
The introduction of Crossrail services is expected to
lead to a step change in how passengers travel to the
airport, with a shift from other transport modes to
Crossrail.
▪ Transfer of passengers from Heathrow Express to Crossrail
• Less rail revenue
HAL is considering several management initiatives
that may lead to a step increase in surface access
revenues.
▪ Using closed car parks for alternate purposes until
demand returns:
• Mitigating impact of lower volumes
▪ Terminal drop-off charge:
• New revenue stream

Our view of the surface access forecasts
34
HAL’s surface access revenues are driven by assumptions and modelling of passenger mode share to the airport. The main driver of HAL’s forecasts are
from off-model adjustments to its standard surface access modelling tools. In general, these adjustments are not adequately explained, and the changes
made between the original RBP and the most recent update (RBP Update 1) are in some cases counterintuitive.
We have used alternative mode share estimates to model surface access revenues for our commercial revenue forecasts, broadly matching HAL’s methodology.
We assume that HAL’s 2020 mode share assumptions are largely based on actual survey data. We also assume the changes in mode share between 2019 and
2020 are reflective of the impact of the COVID-19 pandemic. In line with HAL’s assumptions, we assume mode shares return to normal (2019 levels) by 2024,
before we account for other changes such as the terminal drop-off charge. Finally, we apply as overlays, the impact of the terminal drop-off charge and the
introduction of Crossrail services on mode shares, as per HAL’s assumptions.
We then separately consider the step-changes HAL has applied to its surface access revenue forecasts
COVID-related overlays: We have accepted the overlay HAL has proposed in its RBP to parking and rental income, as we understand why
changes in the ratio of business to leisure passengers would affect average transaction values. However, we do not think the needs case has been
met for the overlay related to HAL’s proposed price reduction for Heathrow Express. We would like HAL to provide evidence showing how it
determined that a reduction in yield (which we assume is a result of a reduction in ticket prices) is the revenue maximising strategy in response
to demand moving away from Heathrow Express.
Crossrail overlay: We understand the logic underpinning HAL reducing ticket prices to compete more effectively with Crossrail services.
Although HAL has not presented any evidence justifying the size of its proposed price reduction, material previously shared with CEPA during the
iH7 business planning period provides some supporting evidence. As such, we consider the needs test has been met for this overlay and we use
the same overlay as HAL. However, we do not apply our overlay to track access revenue, which we understand would remain unaffected.
Terminal drop-off charge overlay: The terminal drop-off charge proposed by HAL will be introduced in Q 2021 and will be applied to ‘Kiss &
ly’ and Taxi trips. HAL has not provided the underlying calculations it has used to estimate the revenue impact from the drop-off charge, but it has
provided some of the supporting assumptions and parameters. We use the same assumptions in our revenue overlay, except for the mode share
assumptions where we use our own, and one other parameter (vehicle occupancy) where we found evidence to support an alternate figure.

Our view of other elements of HAL’s revenue forecasts
35
HAL’s RBP includes commercial revenues from a number of other sources such as property and services. It also includes forecasts for cargo revenue,
which has increased in importance during the pandemic.
Other commercial revenues
Cargo revenues
In its RBP and subsequent presentations, HAL has presented a series of headwinds and opportunities related to property revenues. HAL expects
that the COVID-19 pandemic leads to some long-term and short-term structural shifts in property revenues and has identified various
management initiatives to mitigate the effect of the COVID-19 pandemic. We have largely accepted HAL’s proposed overlay to its property
revenue forecasts but have changed the elasticity used to better align it with evidence around the sources of HAL’s property revenue and
the likelihood of such revenue being volume driven. We also include a separate management challenge adjustment.
Service revenue includes commercial revenue from other services, with HAL listing areas such as advertising, the Fast-Track service, VIP
charges, and aviation fuel. There is little discussion of, or adjustments made to, these in the RBP except advertising where HAL proposes a
impact on advertising revenue (included within HAL’s retail overlay). We have adjusted the elasticity we use to project future service revenue
and include a management challenge adjustment but make no other changes.
HAL has a strong share of the cargo market, with 40% of UK exports and 62% of airfreight exports in 2019.1 HAL experienced a 650% increase in
cargo revenues between 2019 and 2020 in response to higher demand. However, HAL’s forecasts do not reflect the actual increase in revenues
experienced in 2020 and anticipated in 2021 and so, we present an alternative set of assumptions that reflects our expectation that cargo
revenues will be higher than they have been historically due to spare capacity at Heathrow. Overall, our forecasts assume higher cargo
revenues than HAL although we assume revenues taper down towards the end of H7, when passenger numbers recover.
1. HAL RBP Section 7.2 – Commercial Revenues

Commercial Revenues: Summary
36
2018 RPI, £m 2022 2023 2024 2025 2026
Retail excl. Bureaux
Bureaux
Surface access
Service excl. surface access
Property
Rail
Other
Terminal drop-off charge
Red terminal revenue (HMT)
Minimal capex overlay
Total 442 546 618 653 656
Total per passenger, £ 10.63 9.71 9.41 9.28 9.11
HAL forecasts: HAL mid pax forecasts, No RAB Adjustment CEPA forecasts: HAL mid pax forecasts, No RAB Adjustment
2018 RPI, £m 2022 2023 2024 2025 2026
Retail excl. Bureaux 215 298 354 384 399
Bureaux 10 12 12 12 11
Surface access 91 118 125 137 142
Service excl. surface access 34 42 48 51 53
Property 113 118 121 123 124
Rail 72 91 94 100 103
Other 1 1 1 1 1
Terminal drop-off charge 53 63 68 82 78
Red terminal revenue (HMT) 16 6 0 0 0
Minimal capex overlay 0 0 0 0 0
Total 603 749 825 891 912
Total per passenger, £ 14.51 13.33 12.56 12.67 12.66
Difference with HAL, £m 161 204 207 238 256
Cumulative difference, £m 1,066
Cumulative difference excl. capex overlay, £m 875
Cargo, £m Cargo, £m 57 40 30 24 22
Source: HAL Analysis
Notes:
- HAL and CEPA revenue forecasts are reported on a consistent HAL Mid pax forecast scenario.
- The Retail excl. Bureaux lines have been taken from HAL’s model rather than the RBP Update 1
Commercial revenues chapter. Over the H7 period, the Retail revenue forecasts are approximately
£180m higher in the model than in the chapter.
Source: HAL Analysis Source: CEPA Analysis

Scenario comparison: Total and per passenger revenues (commercial and cargo)
CEPA’s revenue forecasts under different CAA passenger forecast scenarios: Per
passenger commercial revenues and cargo
2018 RPI prices, £ 2022 2023 2024 2025 2026
High 14.29 13.13 12.22 12.20 12.14
Mid 15.21 13.68 12.61 12.51 12.42
Low 23.96 16.50 13.68 13.36 12.97
Source: CEPA analysis
CEPA’s forecasts under different CAA passenger forecast scenarios: Total
commercial revenues and cargo
2018 RPI prices, £m 2022 2023 2024 2025 2026 H7
High 774 910 979 1,052 1,072 4,788
Mid 694 823 908 993 1,018 4,436
Low 449 598 755 848 919 3,569
Source: CEPA analysis
CEPA forecasts based on CAA passenger forecast scenarios: low, mid (base case) and high
37

0
00
1,000
1, 00
2,000
2, 00
,000
, 00
,000
, 00
,000
Comparison of HAL and CEPA revenue forecasts
38
Waterfall chart of CEPA initial forecasts vs. HAL Updated RBP, total for H7 (£m, 2018 RPI)
Upwards adjustment
Downwards adjustmentSource: CEPA analysis
Our initial forecasts for
commercial and cargo
revenues are a cumulative
difference of £983m or
31% gap to HAL’s
Updated RBP (excluding
the minimal capex
overlay).
Retail drives a large proportion of the
overall gap with HAL. We have used an
alternate elasticity based framework to
estimating the impact of tax changes in
retail revenues, which we consider to
be an overall more robust approach.
Note: HAL and CEPA commercial revenue forecasts are reported on a consistent HAL Mid pax forecast scenario except for the final waterfall step which uses the CAA Mid pax forecast scenario.
When we use CAA’s pax forecasts, the cumulative
difference increases to £1,265m or 40%.

. .
. . . .
.
.
. . . .
.
.
. . . .
.
. . .
0
10
1
20
2
201 201 201 2017 201 2019 2020 2021 2022 202 202 202 202
Per passenger commercial and cargo reve
nues ( , 201 RPI
prices)
Historical HAL (Mid, no RAB adjustment) CEPA (HAL pax forecasts) CEPA (CAA pax forecasts)
Comparison of HAL and CEPA revenue forecasts
39
Comparison of per passenger commercial and cargo revenue forecasts
Source: CEPA analysis
Note: Both HAL and the CAA have developed High, Mid, Low pax forecasts for the H7 period. We use the Mid pax forecast for figures presented above.

Section One
Introduction

Background to this study
41
The next price control for Heathrow Airport Limited (HAL) – H7 – is due to run from 1st January 2022 to 31st December 2026.
• The Civil Aviation Authority (CAA) is now in the process of assessing HAL’s Revised Business Plan (RBP), submitted in December 2020, and an updated version
(RBP Update 1) provided on the 1st July 2021 (which was received part way through the preparation of this report).
• The CAA have commissioned CEPA and Taylor Airey to assist it with assessing HAL’s forecasts of operating expenditure (opex) and commercial revenues – and
in proposing an alternate set of efficient forecasts where appropriate.1
• This report sets out our initial assessment and forecasts, bringing together our review of HAL’s approach to developing its opex and commercial revenue
forecasts, any analysis we have undertaken to review the key assumptions, and our proposals for the alternate forecasts.
We set out in this report our initial review of HAL’s:
Overall forecasting approach (Section 2)
• Approach
• Chosen baseline
• Indexation
• Scenarios
Opex forecasts (Section 3)
• Chosen baseline
• Elasticities
• People
• Operational costs
• Facilities and maintenance
• Rates and utilities
• Surface access
• Frontier shift
• Input price inflation
• Capital investment
Commercial / cargo revenues (Section 4)2
• Efficiency of 2019 figures as a
baseline
• Elasticities
• Retail
• Surface access
• Property
• Other non-aeronautical revenues
• Cargo
• Capital investment
1. CEPA has led the review of commercial and cargo revenues and Taylor Airey the review of opex.
2. Although cargo revenue is not a commercial revenue stream, we have captured our forecasts of cargo revenue within the commercial revenues section

Our approach to the study
42
We have assessed the approach taken and rationale given, both by HAL and by its advisors, for the opex and commercial revenue forecasts and
supporting assumptions in the RBP. We assessed this information ‘as seen’ and with reference to other situations including our understanding of
regulatory precedent, passenger behaviour, and the market and economic factors in play. This approach has ensured that our review of HAL’s operating
costs and commercial revenues forecasts has been conscious of the situation in which HAL is operating, including step changes and if and how we can
expect trends to change during H7.
• Where appropriate, we have also proposed our own forecasts, using alternative assumptions and analysis – we have also grouped together these forecasts to
represent an alternative overall assessment of efficient opex and commercial revenues during H7.
• When determining our own efficient forecasts, our approach has focused on a top-down approach with three stages similar to HAL’s approach:
Determining an appropriate starting point (baseline)
Consideration of relevant ‘step changes’ / overlays during H7, such as the impact of Crossrail
Consideration of trends in cost or revenue drivers (and any expected changes in those
drivers during H7)
• We also consider scenarios, which are based on three characteristics which impact drivers of opex and commercial revenues:
Level of passenger growth Passenger mixLength of COVID-19 impact on
operating principles
1 2 3
AB C
We have modelled multiple scenarios in our analysis using both HAL and CAA passenger forecasts. In this report, we present our results under HAL’s mid
passenger forecasts from the RBP Update 1, to allow for a like-for-like comparison with HAL’s opex and revenue forecasts. Ultimately however, our opex and
revenue forecasts are derived from CAA’s passenger forecasts.
We have had limited direct engagement with HAL due to the short timescales available to develop our forecasts. As such, we have largely assessed HAL’s RBP
material “as is” with some small clarifications where straightforward to resolve. We expect there will be a need for more detailed engagement following the
publication of these forecasts

Context to producing H7 forecasts
43
It is important to recognise that the H7 price review is being undertaken during an unprecedented period for the UK aviation industry as a result of the
COVID-19 pandemic and its impact on the demand for aviation travel.
COVID-19 remains the biggest issue facing the aviation sector and is expected to continue to impact Heathrow Airport’s operations during H7 even as
governments worldwide start to reduce travel restrictions. This means that the CAA’s H7 price control review – including the assignment the CAA has
commissioned CEPA and Taylor Airey to undertake – is being undertaken in the context of considerable uncertainty.
This uncertainty makes forecasting HAL’s opex and commercial revenues in H7 challenging. Given this context, our review of the HAL RBP has sought to account
for the uncertainty of the short and medium term impacts of the COVID-19 pandemic on Heathrow as follows:
• As noted above, we have used a similar approach to produce forecasts of opex and commercial revenues as HAL has applied to produce its RBP and have
assessed the various overlays HAL has proposed to account for the impact of the pandemic on Heathrow’s operations.
• This has helped to ensure consistency in our respective forecasting approach and form of assumptions used to account for the impact of pandemic, including
the relevant overlays HAL has identified to its baseline (2019) operations.
• We have also sought to identify opportunities that the pandemic could provide HAL to evaluate how it structures its operations and commercial strategies
going forward as the sector recovers from the impacts of the pandemic.
We have attempted to produce a balanced set of forecasts – not relying too much an overly optimistic or overly conservative assumptions. We have also
attempted to make our efficiency challenges credible and deliverable within the timeframe available to HAL.
However, there still remains a substantial amount of uncertainty in any set of opex and commercial revenue forecasts for H7. Given the level uncertainty it may be
this needs to be managed by the CAA through other mechanisms in the H7 regulatory framework (e.g. risk sharing / uncertainty mechanisms) to avoid adverse
outcomes for users and/or the airport operator in H7.
We understand the CAA is considering a number of regulatory framework changes for H7 as part of price review process which were not part of CEPA and Taylor
Airey’s scope of work for this assignment. In light of the findings of our initial review of the RBP, we would support the CAA continuing its discussions with
stakeholders on different options for managing uncertainty as part of the H7 regulatory framework.

Quality assurance statement
44
Reasonableness of analysis / scope for challenge
We have undertaken our initial assessment over a relatively short period of time, given constraints on the price control determination timetable. The time limitations
have meant we have not been able to undertake detailed assessments of all aspects of HAL’s RBP, and our assessment of the material presented by HAL has
largely been ‘as seen,’ with some limited opportunities for clarification. evertheless, we consider we have undertaken proportionate analysis for this stage of the
price control determination process and have appropriately prioritised the areas of HAL’s RBP that are most consequential for the resultant forecasts.
Our analysis primarily relies on material presented by HAL and other publicly available sources of evidence. The quality of evidence available varies but within our
report we have highlighted the key areas where further evidence would strengthen our analysis. Similarly, we highlight where the assumptions we are using could
be strengthened by evidence from HAL or other stakeholders. We would welcome any evidence that would support us in validating these assumptions.
Quality assurance / robustness of analysis
The analysis underpinning our forecasts relies on relatively standard approaches to cost and revenue efficiency assessment. We have used appropriately skilled
and experienced staff to both undertake and review the analysis, and we have allowed sufficient time to both develop the analysis and quality assure it. We have
undertaken several layers of quality assurance:
• A sense check of all the analysis by the respective CEPA and Taylor Airey technical leads, as well as the CEPA Project Director and CAA staff
• A review of modelling inputs for transcription errors, and a similar review of report tables produced from our model for transcription errors
• A review of model logic and calculations within our spreadsheet model, with a higher level review by the CEPA Project Director and CAA staff
Uncertainty
Our opex and commercial revenue forecasts have been produced under a backdrop of substantial uncertainty, relating to the speed of recovery of passenger
numbers, the extent to which the COVID-19 pandemic leads to permanent changes in the passenger mix, and the extent to which the COVID-19 pandemic will
lead to permanent changes in how Heathrow operates as an airport. We have sought to address this through our use of coherent scenarios and overlays applied to
standard cost and revenue forecasting approaches. However, there remains a substantial amount of uncertainty in any set of opex and commercial revenue
forecasts for H7, and we consider there is scope for further mitigation through the use of a wider range of scenarios and risk sharing/uncertainty mechanisms.

Section Two
Review of HAL’s overall forecasting
approach

HAL’s forecasting approach
46
HAL has adopted a relatively standard Base-Step-Trend approach to producing its RBP forecasts:
• Base: For its starting point year HAL has chosen to use a 2019 base (i.e. a pre-pandemic year), as opposed to using a 2020 where the impact
of the pandemic was felt. HAL also assumes its 2019 baseline opex and commercial revenues are both efficient – and have therefore made
limited efficiency adjustments.
• The approach of using a 2019 base is the most pragmatic option – there are issues with this (as discussed within this report), but in the
time available and given the information we have access to, we consider the approach to be reasonable.
• However, we have identified a number of issues with the evidence HAL has provided around the efficiency of the 2019 base. This
evidence base has been reviewed and challenged as part of our analysis.
• Step: HAL has applied several top-down overlays, or ‘step’ changes’ to both opex and commercial revenues, mostly relating to the COVID-19
pandemic.
• In a few areas, the logic underpinning the inclusion of overlays is not provided and the evidence around the size (£m) of overlays
requested is not always sufficiently substantiated. However, the updated RBP includes a lot more detail around the forecasts.
• Trend: HAL has taken a top-down approach of applying cost/revenue drivers and associated elasticities.
• We consider the evidence around the elasticities is stronger than the evidence HAL provided in the run-up to the iH7 price control. But
we consider they may be more scope for scenario-based analysis given this presents a key area of uncertainty.
Step
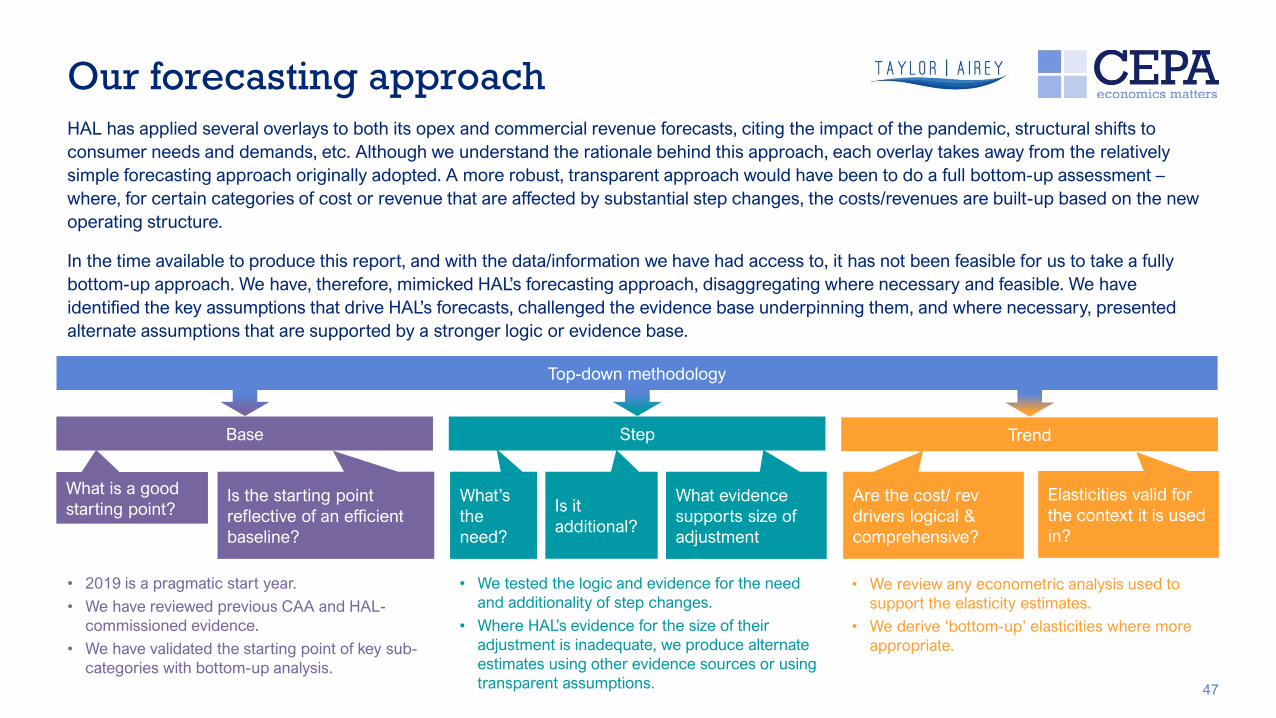
Our forecasting approach
47
HAL has applied several overlays to both its opex and commercial revenue forecasts, citing the impact of the pandemic, structural shifts to
consumer needs and demands, etc. Although we understand the rationale behind this approach, each overlay takes away from the relatively
simple forecasting approach originally adopted. A more robust, transparent approach would have been to do a full bottom-up assessment –
where, for certain categories of cost or revenue that are affected by substantial step changes, the costs/revenues are built-up based on the new
operating structure.
In the time available to produce this report, and with the data/information we have had access to, it has not been feasible for us to take a fully
bottom-up approach. We have, therefore, mimicked HAL’s forecasting approach, disaggregating where necessary and feasible. We have
identified the key assumptions that drive HAL’s forecasts, challenged the evidence base underpinning them, and where necessary, presented
alternate assumptions that are supported by a stronger logic or evidence base.
Top-down methodology
What is a good
starting point?
TrendBase
Is the starting point
reflective of an efficient
baseline?
What’s
the
need?
Is it
additional?
What evidence
supports size of
adjustment
Are the cost/ rev
drivers logical &
comprehensive?
Elasticities valid for
the context it is used
in?
• 2019 is a pragmatic start year.
• We have reviewed previous CAA and HAL-
commissioned evidence.
• We have validated the starting point of key sub-
categories with bottom-up analysis.
• We tested the logic and evidence for the need
and additionality of step changes.
• Where HAL’s evidence for the size of their
adjustment is inadequate, we produce alternate
estimates using other evidence sources or using
transparent assumptions.
• We review any econometric analysis used to
support the elasticity estimates.
• We derive ‘bottom-up’ elasticities where more
appropriate.

Cross-cutting issue: Choosing a start point
48
A key challenge in the context of the current price control is the suitability of historical cost and revenue evidence to inform future
efficient costs and revenues.
• COVID-19 may have fundamentally altered the relationship between key cost/revenue drivers and outturn costs and revenues. That may make
historic efficiency analysis, less relevant and potentially misleading:
• For example, closure of terminals and staff redundancies forced on by the pandemic, may allow for a reconsideration of whether newer
more efficient practices can be implemented in the recovery period.
• Alternatively, if the pandemic leads to a longer-term shift in passenger mix, this may affect the appropriate retail offer necessary and in
turn, affect the likely retail concession income.
• This means the relevance of 2019 costs and revenues for future costs and revenues, is likely to be limited.
• However, we don’t know what the future relationship between inputs (passengers, terminal space etc.) and outputs (costs, revenues) may
be. Choosing a 2019 base is, therefore, a pragmatic option.
• Using 2020 figures as a base is an option – but it poses an additional challenge in terms of removing any one-off pandemic-related
impacts, and in terms of applying appropriate elasticities (the elasticities we have access to are designed to be used for marginal changes
in passenger numbers).
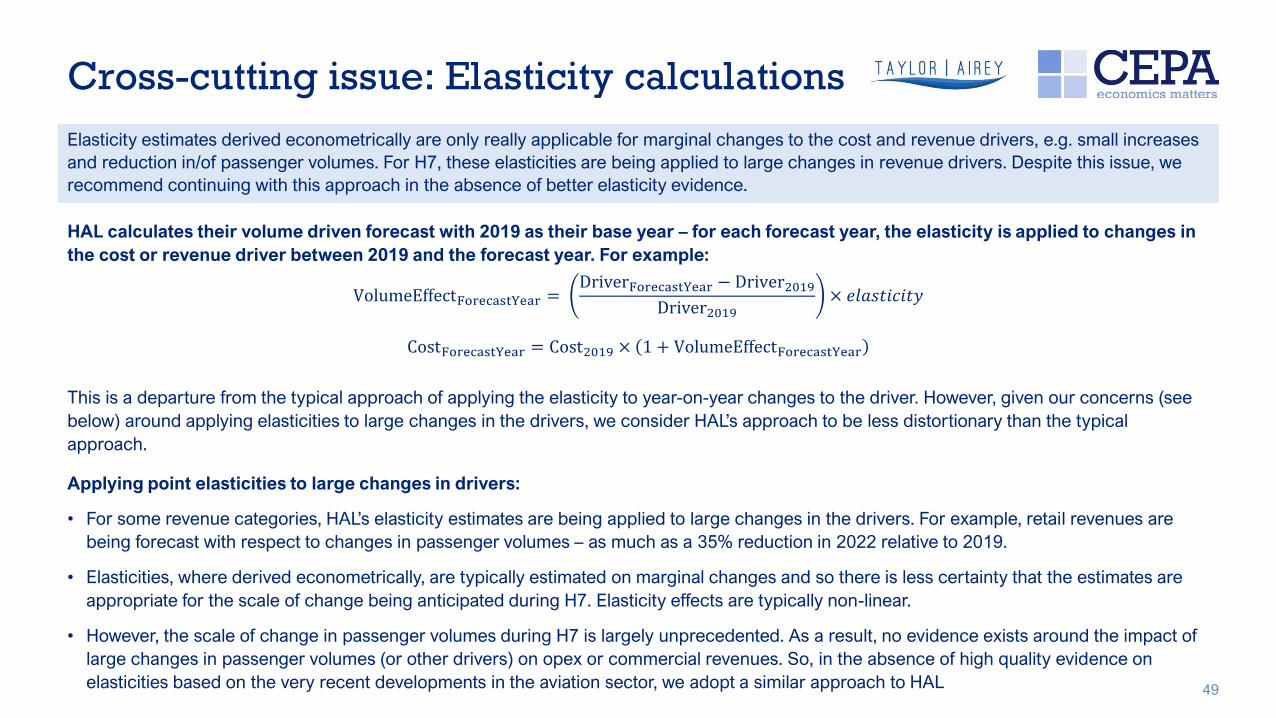
Cross-cutting issue: Elasticity calculations
49
HAL calculates their volume driven forecast with 2019 as their base year – for each forecast year, the elasticity is applied to changes in
the cost or revenue driver between 2019 and the forecast year. For example:
VolumeEffectForecastYear =DriverForecastYear − Driver2019
Driver2019× 𝑒𝑙𝑎𝑠𝑡𝑖𝑐𝑖𝑡𝑦
CostForecastYear = Cost2019 × 1 + VolumeEffectForecastYear
This is a departure from the typical approach of applying the elasticity to year-on-year changes to the driver. However, given our concerns (see
below) around applying elasticities to large changes in the drivers, we consider HAL’s approach to be less distortionary than the typical
approach.
Applying point elasticities to large changes in drivers:
• or some revenue categories, HAL’s elasticity estimates are being applied to large changes in the drivers. or example, retail revenues are
being forecast with respect to changes in passenger volumes – as much as a 35% reduction in 2022 relative to 2019.
• Elasticities, where derived econometrically, are typically estimated on marginal changes and so there is less certainty that the estimates are
appropriate for the scale of change being anticipated during H7. Elasticity effects are typically non-linear.
• However, the scale of change in passenger volumes during H7 is largely unprecedented. As a result, no evidence exists around the impact of
large changes in passenger volumes (or other drivers) on opex or commercial revenues. So, in the absence of high quality evidence on
elasticities based on the very recent developments in the aviation sector, we adopt a similar approach to HAL
Elasticity estimates derived econometrically are only really applicable for marginal changes to the cost and revenue drivers, e.g. small increases
and reduction in/of passenger volumes. For H7, these elasticities are being applied to large changes in revenue drivers. Despite this issue, we
recommend continuing with this approach in the absence of better elasticity evidence.

Cross-cutting issue: Inflation index
50
The choice of inflation index relates to four distinct areas:
• RAB indexation, which is not relevant for our study;
• To present form of price cap (i.e. RPI - X, CPIH - X), which is also not directly within the scope of our study, but relevant for the next issue;
• To deflate / inflate historic costs and revenues; and,
• To index future costs and revenues – inappropriate to use RPI.
HAL has used RPI to deflate / inflate historic costs and revenues. This is inappropriate as it creates a misleading impression around
historic opex and commercial revenue growth. Specifically, it:
• Implies opex has fallen by more in real terms than is actually the case, and it
• Distorts any assessment of HAL’s historic outperformance of the CAA forecast.
HAL also assumes its commercial revenues and certain categories of opex will grow in nominal terms by RPI. Other categories of opex
have been indexed using bespoke indices. The use of RPI is inappropriate in this context also as it is an inaccurate measure of
economy-wide inflation.
CPI is widely recognised as a more appropriate measure of inflation, though we must recognise that it is set based on consumer spending
patterns and not the spending patterns of a regulated company such as HAL. It is therefore appropriate to consider whether the prices for
certain costs and revenues will grow by another price index. However, this should be done with reference to CPI.
To aid comparisons with HAL’s analysis, we are using a 201 price base in this report, using RPI as the deflator. evertheless, in our
analysis of HAL’s historic performance, we have deflated by CPI to allow us to make appropriate comparisons across years. We also assume
costs and revenues will grow by CPI in nominal terms, with a separate allowance for real price effects where necessary.

Cross-cutting issue: Incorporating scenarios
Testing how these different scenarios affect the forecasts of efficient opex and commercial revenues may inform whether it is in the consumer
interest to adopt a different risk sharing mechanism than has been adopted for previous price controls.
The scenarios considered by HAL (and being considered by the CAA) are predominantly linked to the pace of recovery in passenger
numbers. But it is possible to create scenarios that reflect the other key areas of uncertainty:
High Pax growth,
permanent change
in pax mix
“Long”
COVID
impact on
operating
principles
“ hort”
COVID
impact on
operating
principles
“Bounce back to
normal” by end of
price control. Limited
long-term structural
changes
Fast recovery from
pandemic in
passenger terms, but
long-term impact on
operating
environment
1 4
Passenger numbers
recover but with a
substantially different
passenger mix
2
Passenger numbers
recover but with long-
term shift in
passenger mix and on
the operating
environment3
High Pax growth, re-
establishment of
historical mix
Low pax growth,
permanent change
in pax mix
“Long”
COVID
impact on
operating
principles
“ hort”
COVID
impact on
operating
principles
Slow recovery to
passenger numbers
but other pandemic-
related effects
dissipate over time
Slow recovery of
passenger numbers
with long-term impact
on operating
environment
5 6
Slow recovery with
changes to
passenger mix but
changes to operating
environment
dissipate over time7
Slow recovery to a
substantially different
airport operation,
with a substantially
different passenger
mix8
Low pax growth,
re-establishment of
historical mix
51

A. Efficiency of 2019 figures as a
baseline
B. Elasticities
C. People
D. Operational costs (incl. Insurance)
E. Facilities and Maintenance
F. Rates, Utilities and Distribution
Contract
G. Surface access initiatives
H. Frontier shift and input price inflation
I. Capital Investment
J. Overall results
Section Three
Opex forecasts
Section Three
A. Efficiency of 2019 figures as a baseline
Opex forecasts

2019 and the need for baseline adjustments
In this section we consider three issues:
1. The efficiency of 2019 as a baseline – We consider whether the information presented by HAL demonstrates it was operating at the frontier of efficiency
in 2019.
2. HAL’s adjustments to its baseline – We review whether the adjustments HAL makes to its 2019 costs before using it as the basis of forecasting, are
appropriate, considering both the reasons for adjustments and the size of the adjustment made. In particular, we are looking for evidence to show that staff
costs associated with the Heathrow Expansion Programme have been fully removed and that these are not included in the base and projected forwards.
3. Actions taken since 2019 – We review the extent to which HAL’s cost control actions taken in 2020 and 2021 are sustainable and can be carried forward
into the H7 period.
The tests above are used to inform our assessment of the need for an adjustment to our 2019 opex to make it a suitable baseline for our forecast. We summarise
our findings in the table below:
HAL Taylor Airey
£m
(nominal)
£m
(nominal)Rationale Category Period
1 Efficiency of 2019 as a baseline -17 We have considered average productivity achieved in the last 3 years of the
Q6/ Q+1 period to smooth variations in individual years, in particular, opex
increases in 2019.
Pro-rated
across
categories
From 2020
2 HAL adjustments to 2019 baseline: We have used HAL’s proposed adjustment for the removal of expansion
costs, pending further assessment. And we allow some of HAL’s overlay for
the London Living Wage, but we consider further evidence is required before
allowing the full overlay.
Multiple From 2020
3 Actions taken since 2019 At least 50% of the (2018 RPI prices) benefits of reorganisation identified
by HAL would be expected to be sustainable.
People From 2020
Comparison of HAL and Taylor Airey views regarding the efficiency of 2019 as a base and the need for adjustments:
Source: Taylor Airey analysis, HAL Analysis54
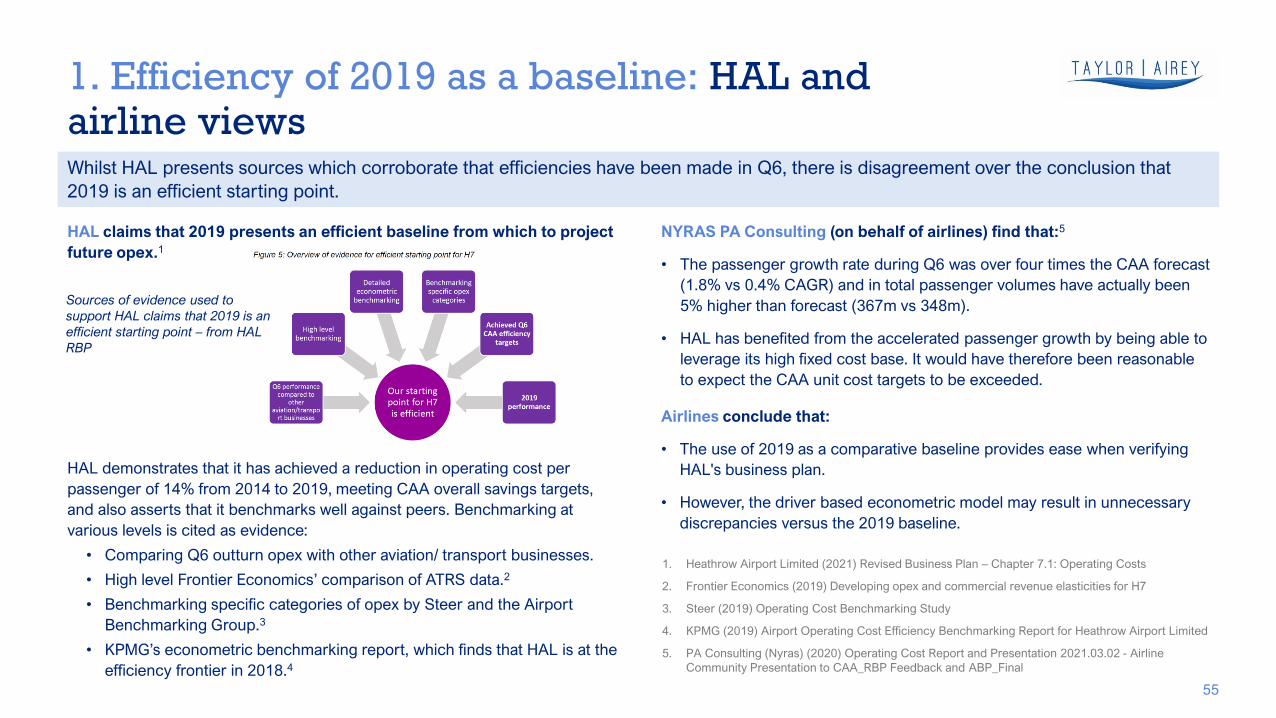
HAL claims that 2019 presents an efficient baseline from which to project
future opex.1
HAL demonstrates that it has achieved a reduction in operating cost per
passenger of 14% from 2014 to 2019, meeting CAA overall savings targets,
and also asserts that it benchmarks well against peers. Benchmarking at
various levels is cited as evidence:
• Comparing Q6 outturn opex with other aviation/ transport businesses.
• High level rontier Economics’ comparison of ATR data.2
• Benchmarking specific categories of opex by Steer and the Airport
Benchmarking Group.3
• KPMG’s econometric benchmarking report, which finds that HAL is at the
efficiency frontier in 2018.4
1. Efficiency of 2019 as a baseline: HAL and airline views
55
NYRAS PA Consulting (on behalf of airlines) find that:5
• The passenger growth rate during Q6 was over four times the CAA forecast
(1.8% vs 0.4% CAGR) and in total passenger volumes have actually been
5% higher than forecast (367m vs 348m).
• HAL has benefited from the accelerated passenger growth by being able to
leverage its high fixed cost base. It would have therefore been reasonable
to expect the CAA unit cost targets to be exceeded.
Airlines conclude that:
• The use of 2019 as a comparative baseline provides ease when verifying
HAL's business plan.
• However, the driver based econometric model may result in unnecessary
discrepancies versus the 2019 baseline.
1. Heathrow Airport Limited (2021) Revised Business Plan – Chapter 7.1: Operating Costs
2. Frontier Economics (2019) Developing opex and commercial revenue elasticities for H7
3. Steer (2019) Operating Cost Benchmarking Study
4. KPMG (2019) Airport Operating Cost Efficiency Benchmarking Report for Heathrow Airport Limited
5. PA Consulting (Nyras) (2020) Operating Cost Report and Presentation 2021.03.02 - Airline
Community Presentation to CAA_RBP Feedback and ABP_Final
Sources of evidence used to
support HAL claims that 2019 is an
efficient starting point – from HAL
RBP
Whilst HAL presents sources which corroborate that efficiencies have been made in Q6, there is disagreement over the conclusion that
2019 is an efficient starting point.

1. Efficiency of 2019 as a baseline: Our view
56
While there is general consensus that HAL’s Q performance shows
improvement across the period, this does not imply that efficient levels have
been achieved.
Although HAL did meet the Q6 price control targets, this was not universal
across all categories of cost and People costs were a notable exception.
We also considered that HAL's opex benchmarking against others did not
provide compelling evidence. For example, the data used is dated and it is not
always clear that comparators chosen are directly relevant.
Comparison between 2019 and 2018 opex
2019 opex data did not form part of the KPMG study1 that HAL uses to
support their case for being at the efficiency frontier. As we show on the right,
opex in 2019 has increased from 2018 levels (the last year considered by
KPMG).
• There has been a 6% increase in total opex (nominal) and 5% increase in
opex per pax.
• Most notably, this included a 29% increase in General Expenses, 15%
increase in Operational costs and 11% increase in Utilities costs.
• The reasons for these increases are not clearly provided but it cannot be
explained by volume effects.
Expenditure 2014 2015 2016 2017 2018 2019
Total (£m, nominal) 1,123.3 1,152.4 1,119.0 1,114.0 1,120.7 1,204.0
Total (£m, 2018 CPI) 1,190.2 1,220.4 1,177.5 1,141.5 1,120.7 1,183.0
Per pax (£, 2018 CPI) 16.2 16.3 15.6 14.6 14.0 14.6
1. KPMG (2019) Airport Operating Cost Efficiency Benchmarking Report for Heathrow Airport Limited
Average 2017 – 2019 14.4
-1.4%
We propose that the 2019 baseline is adjusted down by 1.4%, £14.4m (2018 CPI) to represent an efficient starting position. This is derived
from considering average productivity achieved in the last 3 years of the Q6/ Q+1 period and smoothing variations in individual years.
90
9
100
10
110
201 201 201 2017 201 2019
Index (201 100)
Total ( ominal) Total (201 CPI) Per passenger (201 CPI)
HAL opex over Q6 (2014-2019)
HAL opex over Q6 (2014-2019)
Source: Taylor Airey analysis of HAL data
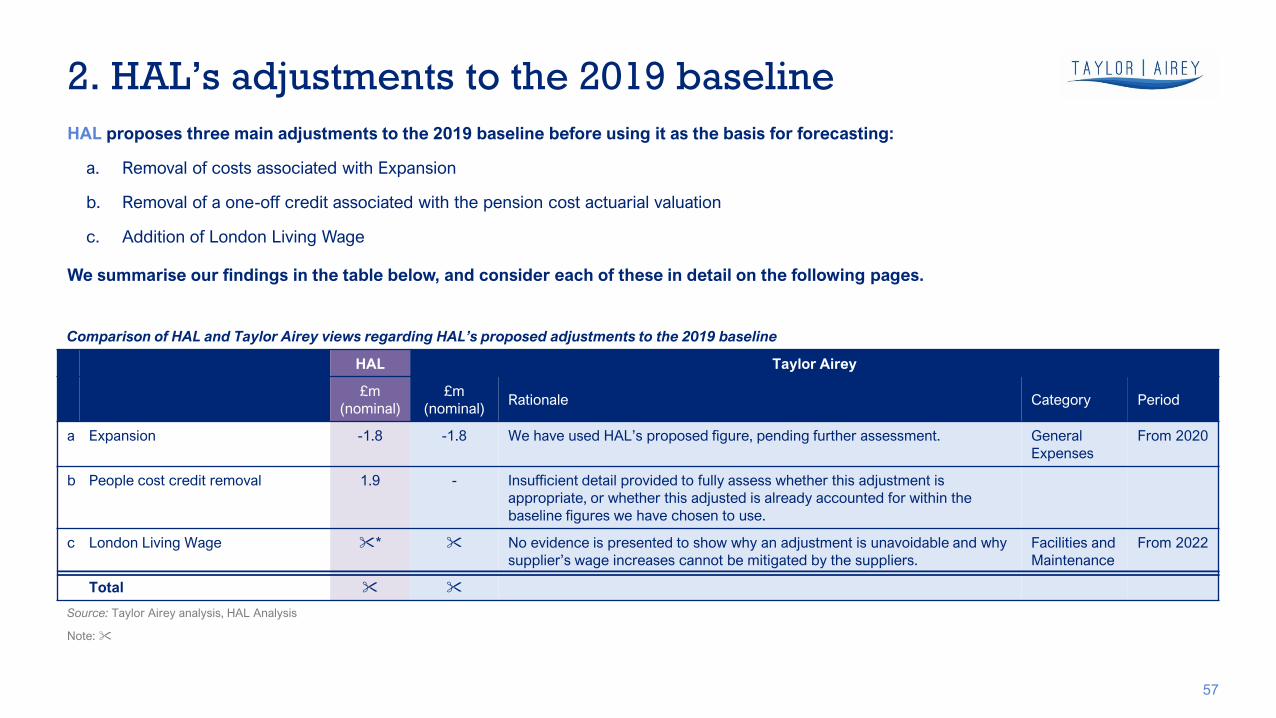
2. HAL’s adjustments to the 2019 baseline
57
HAL proposes three main adjustments to the 2019 baseline before using it as the basis for forecasting:
a. Removal of costs associated with Expansion
b. Removal of a one-off credit associated with the pension cost actuarial valuation
c. Addition of London Living Wage
We summarise our findings in the table below, and consider each of these in detail on the following pages.
HAL Taylor Airey
£m
(nominal)
£m
(nominal)Rationale Category Period
a Expansion -1.8 -1.8 We have used HAL’s proposed figure, pending further assessment. General
Expenses
From 2020
b People cost credit removal 1.9 - Insufficient detail provided to fully assess whether this adjustment is
appropriate, or whether this adjusted is already accounted for within the
baseline figures we have chosen to use.
c London Living Wage * No evidence is presented to show why an adjustment is unavoidable and why
supplier’s wage increases cannot be mitigated by the suppliers.
Facilities and
Maintenance
From 2022
Total
Comparison of HAL and Taylor Airey views regarding HAL’s proposed adjustments to the 2019 baseline
Source: Taylor Airey analysis, HAL Analysis
Note:

2. HAL adjustments to 2019 baseline: Expansion
58
HAL states that it has fully removed costs associated with expansion with a £1.8m (nominal) reduction from general expenses. In the RBP Update, HAL
refers to its 2019 Category B submission, explaining that this figure represents two main areas of spend: 1
“CAA Fees - the charge from the CAA to fund the additional headcount required to support the CAA’s activities directly related to the development of the
expansion of Heathrow. This has been completely categorised as Category B.
Security - The Heathrow Expansion Programme activity has increased the threat of protestor activity. Additional security resource has been provided to
mitigate this risk directly caused by our proposals to seek planning consent”.
Our view: Assessing whether Expansion costs have been fully removed from the baseline requires a detailed understanding of the capitalisation of staff and
professional services costs which has been applied. As a principle, we are concerned that a lack of clarity in the treatment of capitalised staff costs in the Statutory
and Regulated accounts may disguise inconsistencies or double counting. We also note that concerns were raised early in the H7 process regarding capitalisation
of staff costs2 and cost and revenue allocation3.
Pending further assessment, we would suggest that 1. m nominal is removed from the base, in line with HAL’s proposals.
1. Heathrow Airport, RBP Update 1 H7 Operating Cost Updates Section 5.4.3
2. CAP1563c, Review of Efficiency of Operating Expenditure of Heathrow Airport, by CEPA, June 2017
3. CAP1676 A study of Heathrow's cost and revenue allocation, by PA Consulting, June 2018
It is difficult to assess whether Expansion costs have been fully removed without a detailed deep-dive review of the capitalisation treatment
of these costs and the resultant impact on opex. This would require more detailed disclosure from HAL than is currently available.

Our view:
Given our difficulty in determining the need, additionality and efficiency of
HAL’s proposed overlay for the London Living Wage, we propose applying a
2 efficiency adjustment to HAL’s proposals, subject to any additional
supporting evidence provided by HAL for the final forecasts. This means we
allow for a (2018 RPI prices) / (nominal) addition to our baseline.
We agree that this is a topic that may have the effect of causing
upwards pressure on contract costs. We also note that airlines
are in principle, not opposed to the payment of the LLW to
workers in the supply chain. However, no evidence is presented
to show why an adjustment is unavoidable and why supplier’s
wage increases cannot be mitigated by the suppliers
themselves. For example, rather than passing costs on to the
customer, it could be assumed that higher levels of pay may
lead to improved staff morale and motivation and reduced
turnover, with resultant increases in productivity.
2. HAL adjustments to 2019 baseline: Pension credit and London Living Wage
591. Heathrow Airport, RBP Update 1 H7 Operating Cost Updates Section 5.4.3
As employers of large staff groups, HAL’s supply chain have
been subject to various changes in social and employment
conditions over previous periods and the changes proposed in
H7 could be considered business as usual.
No evidence is presented to provide a breakdown of the pa
cost making it impossible to assess its efficiency.
b. Removal of one-off credit
HAL states that it has reversed a one-off credit from people costs with a value
of £1.9m (nominal). The RBP Update1 explains that this is related to removal of
a one-off credit associated with the pension cost actuarial valuation and
therefore should not be included in the baseline for H7.
Our view: There is insufficient detail provided in the RBP and associated
documents to fully assess whether this adjustment is appropriate. At this
stage we are therefore not making an adjustment for this factor.
c. London Living Wage
Heathrow Airport were accredited as a Living Wage Employer by the Living
Wage Foundation in 2017. This involved making a commitment that directly
employed staff and all workers in the supply chain will be paid the London
Living Wage.
ince then, we note that London City airport have also followed Heathrow’s
lead and made a similar commitment. In the IBP, it was assumed that this
would be achieved from 2020 but the target date was deferred to 2022 as a
result of the pandemic. HAL states that in 2019 only 64 out of 108 suppliers
were paying the London Living Wage.
To achieve this target, it proposes to adjust Facilities and Maintenance
upwards by pa (2018 RPI prices) from 2022.
Need
Additionality
Efficiency

3. Actions taken since 2019
60
HAL states that £260m (2018 RPI prices) of operating cost reductions
have been delivered in 2020 compared with 2019 costs
• Material components include: in People cost category, contract
cost reduction, from terminal consolidation, and removal of
discretionary spend.
• However, it suggests that very little of these savings can be sustained in
H7 and costs will return as volumes increase (see table overleaf).
Airlines note that:
• There are further opex savings that should be carried forward into the H7
period.
• Specifically, airlines would expect that benefits from structural change
cost savings from re-organisation of people should be carried forward.
Sources:
CAP1563c, Review of Efficiency of Operating Expenditure of Heathrow Airport, by CEPA, June 2017
CAP1676 A study of Heathrow's cost and revenue allocation, by PA Consulting, June 2018
2021.03.02 - Airline Community Presentation to CAA_RBP Feedback and ABP_Final
Our view:
We agree that some of these changes are temporary and will be reversed or
superseded prior to H7, for example temporary pay reductions, furlough
scheme. However, benefits from organisational change and revised contract
terms would be expected to be retained despite future volume growth.
HAL also notes that some of the Magenta benefits are delivered through back-
office FTE reductions which won't be counted in H7 years as it has already
been realised in 2020/21. It would be inconsistent if these costs were then
assumed to return.
We would also expect that some areas of contract costs or discretionary
spend described as non-essential would not need to be retained.
We therefore propose to apply a pa (2018 RPI prices) saving to account for
these issues, representing 50% of the total savings identified by HAL for
organisational change.
Having considered what changes to the cost base from 2019 to 2020 are temporary and what is sustainable over H7 period, we conclude
that at least 50% of the pa (2018 RPI prices) benefits of reorganisation identified by HAL should be built in as a baseline adjustment.
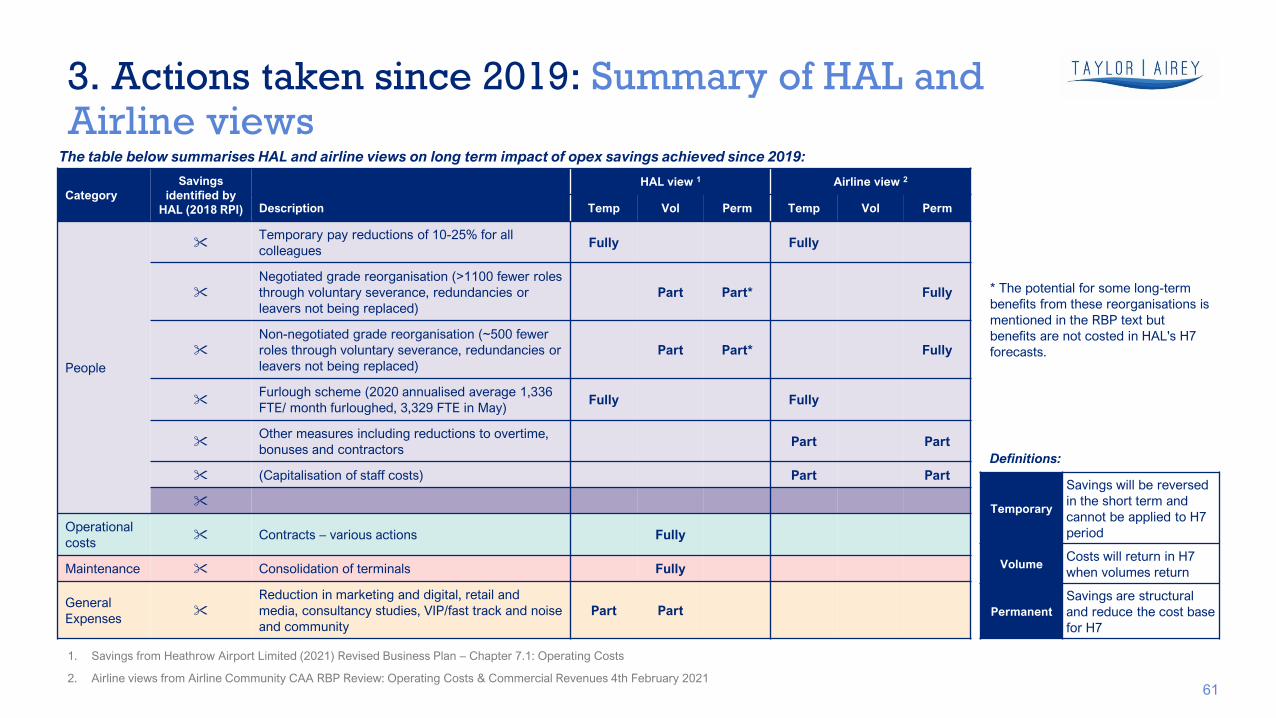
3. Actions taken since 2019: Summary of HAL and Airline views
61
Category
Savings
identified by
HAL (2018 RPI)
HAL view 1 Airline view 2
Description Temp Vol Perm Temp Vol Perm
People
Temporary pay reductions of 10-25% for all
colleaguesFully Fully
Negotiated grade reorganisation (>1100 fewer roles
through voluntary severance, redundancies or
leavers not being replaced)
Part Part* Fully
Non-negotiated grade reorganisation (~500 fewer
roles through voluntary severance, redundancies or
leavers not being replaced)
Part Part* Fully
Furlough scheme (2020 annualised average 1,336
FTE/ month furloughed, 3,329 FTE in May)Fully Fully
Other measures including reductions to overtime,
bonuses and contractorsPart Part
(Capitalisation of staff costs) Part Part
Operational
costs Contracts – various actions Fully
Maintenance Consolidation of terminals Fully
General
Expenses
Reduction in marketing and digital, retail and
media, consultancy studies, VIP/fast track and noise
and community
Part Part
1. Savings from Heathrow Airport Limited (2021) Revised Business Plan – Chapter 7.1: Operating Costs
2. Airline views from Airline Community CAA RBP Review: Operating Costs & Commercial Revenues 4th February 2021
The table below summarises HAL and airline views on long term impact of opex savings achieved since 2019:
Temporary
Savings will be reversed
in the short term and
cannot be applied to H7
period
VolumeCosts will return in H7
when volumes return
Permanent
Savings are structural
and reduce the cost base
for H7
Definitions:
* The potential for some long-term
benefits from these reorganisations is
mentioned in the RBP text but
benefits are not costed in HAL's H7
forecasts.
Section Three
B. Elasticities
Opex forecasts
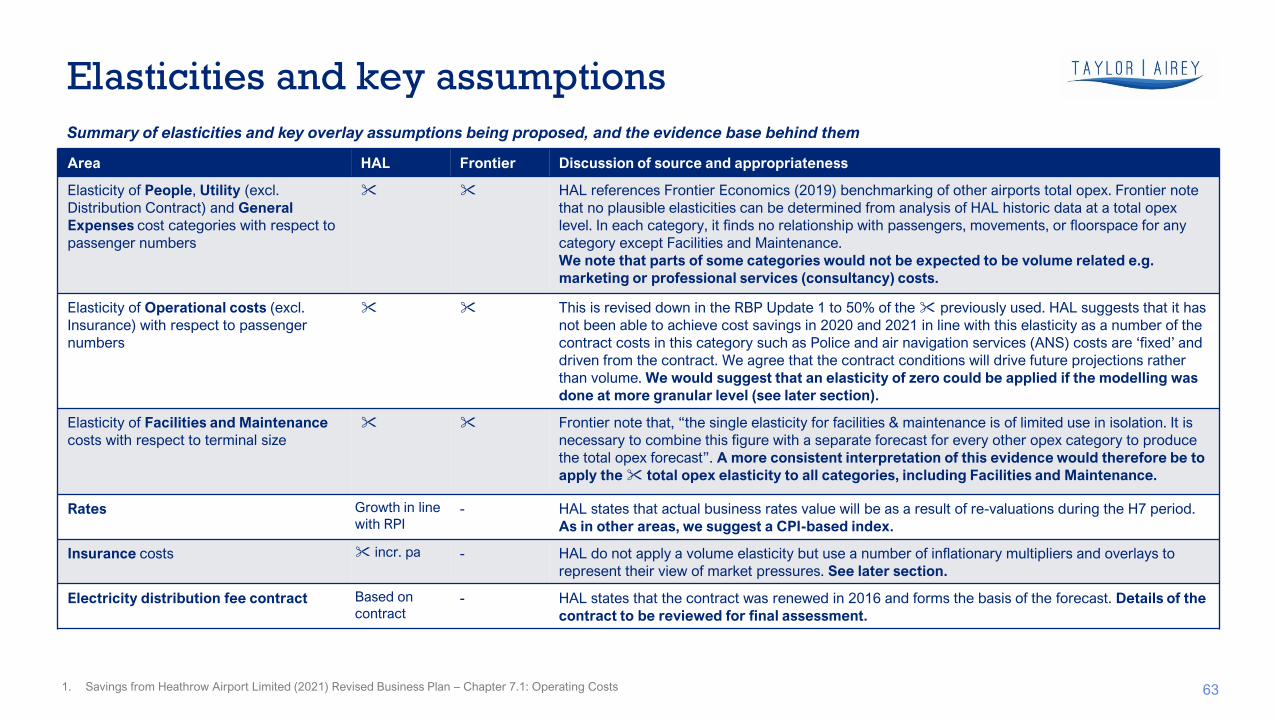
Elasticities and key assumptions
63
Summary of elasticities and key overlay assumptions being proposed, and the evidence base behind them
Area HAL Frontier Discussion of source and appropriateness
Elasticity of People, Utility (excl.
Distribution Contract) and General
Expenses cost categories with respect to
passenger numbers
HAL references Frontier Economics (2019) benchmarking of other airports total opex. Frontier note
that no plausible elasticities can be determined from analysis of HAL historic data at a total opex
level. In each category, it finds no relationship with passengers, movements, or floorspace for any
category except Facilities and Maintenance.
We note that parts of some categories would not be expected to be volume related e.g.
marketing or professional services (consultancy) costs.
Elasticity of Operational costs (excl.
Insurance) with respect to passenger
numbers
This is revised down in the RBP Update 1 to 50% of the previously used. HAL suggests that it has
not been able to achieve cost savings in 2020 and 2021 in line with this elasticity as a number of the
contract costs in this category such as Police and air navigation services (A ) costs are ‘fixed’ and
driven from the contract. We agree that the contract conditions will drive future projections rather
than volume. We would suggest that an elasticity of zero could be applied if the modelling was
done at more granular level (see later section).
Elasticity of Facilities and Maintenance
costs with respect to terminal size
rontier note that, “the single elasticity for facilities & maintenance is of limited use in isolation. It is
necessary to combine this figure with a separate forecast for every other opex category to produce
the total opex forecast”. A more consistent interpretation of this evidence would therefore be to
apply the total opex elasticity to all categories, including Facilities and Maintenance.
Rates Growth in line
with RPI- HAL states that actual business rates value will be as a result of re-valuations during the H7 period.
As in other areas, we suggest a CPI-based index.
Insurance costs incr. pa - HAL do not apply a volume elasticity but use a number of inflationary multipliers and overlays to
represent their view of market pressures. See later section.
Electricity distribution fee contract Based on
contract- HAL states that the contract was renewed in 2016 and forms the basis of the forecast. Details of the
contract to be reviewed for final assessment.
1. Savings from Heathrow Airport Limited (2021) Revised Business Plan – Chapter 7.1: Operating Costs

Elasticities: Comments on HAL’s proposals
64
General
We would expect that it should be possible to disaggregate the cost categories and their drivers to apply elasticities for each category rather than applying a single
elasticity to passenger growth to all main categories.
This would more accurately reflect the expected driver of each category and more clearly show which costs should be volume related and which are more fixed in
nature.
Within the main categories, we would also expect there to be significant differences between the elasticities that should be applied to the various components of
cost that make up that category. An example of how a more granular approach may affect the forecasts is illustrated with our alternate analysis of People costs in a
later section.
Our proposed approach
Based on historical precedent , we assume that opex has an overall elasticity with respect to passenger numbers of 0.4. We have, therefore, tried to ensure our
proposed elasticities for each category aggregate to an overall elasticity of 0.4.
• For categories of opex where we have been able to derive a specific elasticity with respect to passenger numbers (namely operational security staff), we have
used this elasticity.
• For categories of opex that are clearly unrelated to passenger numbers, we have used an elasticity of 0.
• For the remaining categories, we use an average elasticity such that the overall elasticity is 0.4.
Further commentary on our proposed elasticities is included in the relevant sections.

Section Three
C. People
Opex forecasts
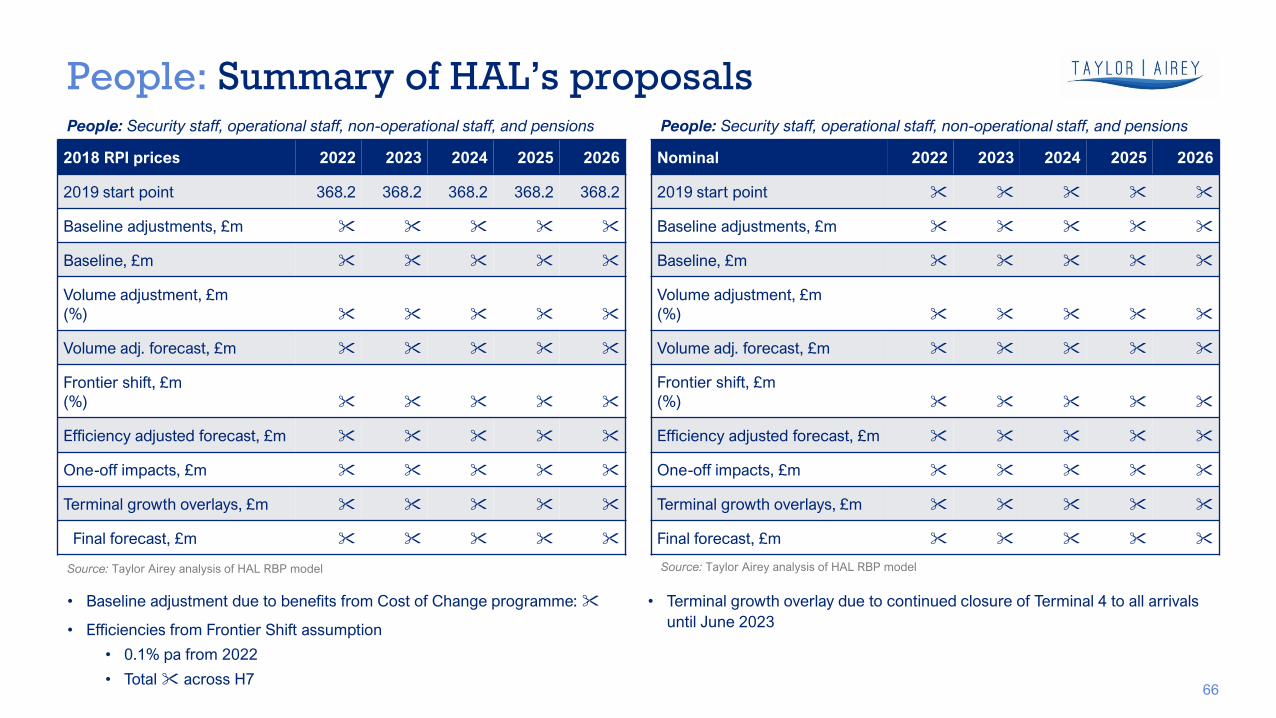
Nominal 2022 2023 2024 2025 2026
2019 start point
Baseline adjustments, £m
Baseline, £m
Volume adjustment, £m
(%)
Volume adj. forecast, £m
Frontier shift, £m
(%)
Efficiency adjusted forecast, £m
One-off impacts, £m
Terminal growth overlays, £m
Final forecast, £m
People: Security staff, operational staff, non-operational staff, and pensions
People: Summary of HAL’s proposals
• Baseline adjustment due to benefits from Cost of Change programme:
• Efficiencies from Frontier Shift assumption
• 0.1% pa from 2022
• Total across H7
• Terminal growth overlay due to continued closure of Terminal 4 to all arrivals
until June 2023
2018 RPI prices 2022 2023 2024 2025 2026
2019 start point 368.2 368.2 368.2 368.2 368.2
Baseline adjustments, £m
Baseline, £m
Volume adjustment, £m
(%)
Volume adj. forecast, £m
Frontier shift, £m
(%)
Efficiency adjusted forecast, £m
One-off impacts, £m
Terminal growth overlays, £m
Final forecast, £m
People: Security staff, operational staff, non-operational staff, and pensions
Source: Taylor Airey analysis of HAL RBP model Source: Taylor Airey analysis of HAL RBP model
66

0.0
0.5
1.0
1.5
2.0
2.5
9m2014 2015 2016 2017 2018 2019
£/p
ax (
no
min
al)
Security Other operational Non operational
People cost elasticities: Our view
67
Terminal 1
closure
As with any airport business, HAL’s total staff costs arise from:
• Staff groups whose cost would be expected to vary in line with volume,
for which it may be appropriate to apply an elasticity – Security and
Other operational
• Staff groups whose cost would be expected to be driven by other
factors – Non operational
As illustrated by the analyses right, the proportion of the overall staff cost
base arising from these different groups has changed significantly over the
Q6 and iH7 period.
The lower chart clearly illustrates that:
• non-operational staff costs have no relationship with passenger
numbers; and,
• other effects such as terminal utilisation can produce effects which
could otherwise be interpreted as efficiencies.
While the use of a single elasticity to volume may be appropriate to forecast
overall People costs in a relatively stable period, we conclude that caution
should be exercised when deriving historical elasticities from the Q6 period
or applying them in this way to forecast H7.
45% 44% 40% 41% 42% 39% 42%
29% 29%28% 30% 25% 23%
29%
26% 27% 32% 29% 34% 38%29%
0%
20%
40%
60%
80%
100%
9m2014 2015 2016 2017 2018 2019 2020
Security Other operational Non operational
Source: Taylor Airey analysis, Heathrow Airport Limited Regulatory Accounts (2014-2020)
HAL uses a single elasticity ( to pax) for all categories including People. Having reviewed the evolution of Q6 People costs, we suggest
there is a need to consider elasticities at the lowest possible level of granularity, particularly with the uncertainties of the H7 period.
Proportion of People costs (excl. Pensions) arising from different staff types
People cost per pax (excl. Pensions) arising from different staff types
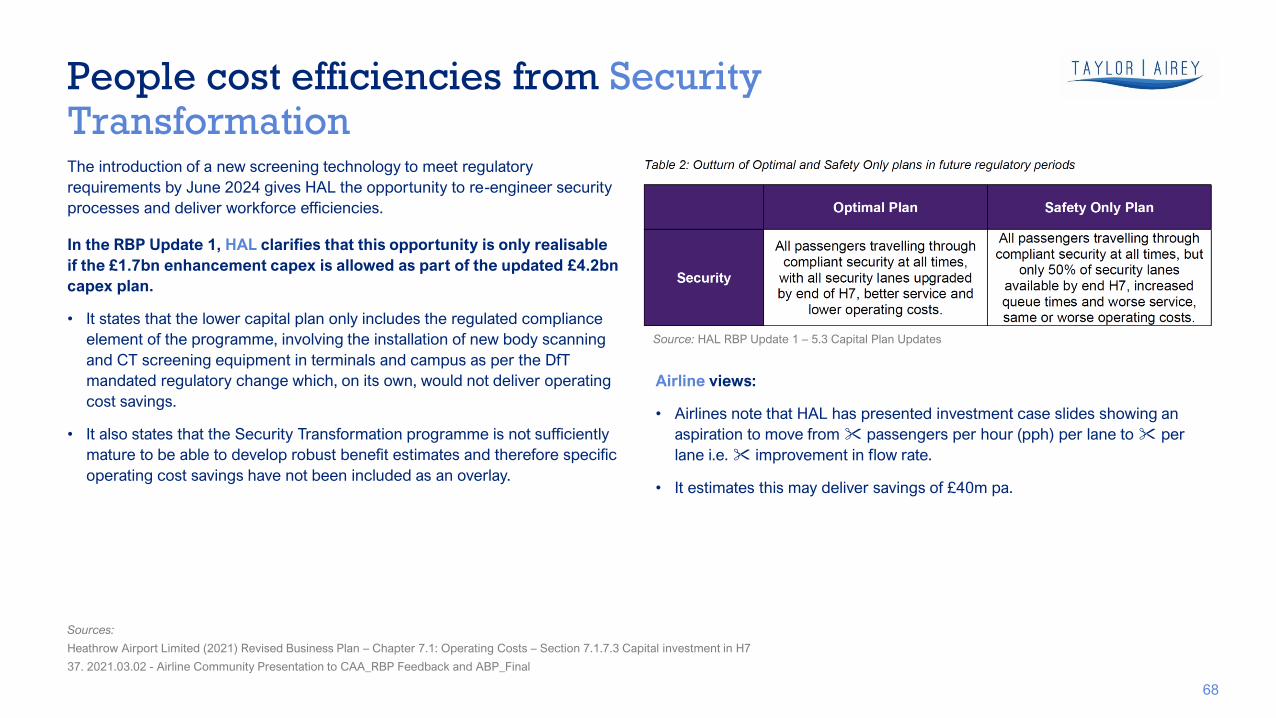
People cost efficiencies from Security Transformation
68
The introduction of a new screening technology to meet regulatory
requirements by June 2024 gives HAL the opportunity to re-engineer security
processes and deliver workforce efficiencies.
In the RBP Update 1, HAL clarifies that this opportunity is only realisable
if the £1.7bn enhancement capex is allowed as part of the updated £4.2bn
capex plan.
• It states that the lower capital plan only includes the regulated compliance
element of the programme, involving the installation of new body scanning
and CT screening equipment in terminals and campus as per the DfT
mandated regulatory change which, on its own, would not deliver operating
cost savings.
• It also states that the Security Transformation programme is not sufficiently
mature to be able to develop robust benefit estimates and therefore specific
operating cost savings have not been included as an overlay.
Airline views:
• Airlines note that HAL has presented investment case slides showing an
aspiration to move from passengers per hour (pph) per lane to per
lane i.e. improvement in flow rate.
• It estimates this may deliver savings of £40m pa.
Sources:
Heathrow Airport Limited (2021) Revised Business Plan – Chapter 7.1: Operating Costs – Section 7.1.7.3 Capital investment in H7
37. 2021.03.02 - Airline Community Presentation to CAA_RBP Feedback and ABP_Final
Source: HAL RBP Update 1 – 5.3 Capital Plan Updates

Security Transformation: Our view
69
Comments on HAL’s approach to modelling benefits:
1. Maturity of HAL’s analysis
It seems unrealistic for HAL to claim that their modelling of the benefits of the
Security Transformation programme is not yet mature as it already has
experience of early installations of the new technology in some terminal areas.
As security staff costs represented between 40-45% of the staff cost base in
Q6, benefits in this critical area would be expected to be modelled in detail,
even at this stage of the business planning process.
2. Dependency on capex
Experience from other airports as well as from HAL's past initiatives shows that
benefits can be derived from operational process improvements which are
independent of infrastructure or equipment change i.e. the way that staff are
deployed and the tasks it does as well as the way the passengers are directed
through the process. As the screening technology changes are mandated by
regulation, operational processes will change regardless of the capital
allowance.
We therefore disagree with HAL’s view that no efficiency improvements are
possible without higher capital expenditure.
Our alternate view:
Rather than the airlines’ approach of deriving an absolute figure per
annum, benefits from security transformation will be volume related and
it would be more accurate to treat them as an amended elasticity with
respect to passengers for security staff FTE rather than an overlay.
We have therefore undertaken detailed modelling to create a bottom-up
validation of relevant elasticities to use for Security people costs.
In this way we have derived multiple elasticities to account for the step
changes produced by the introduction of new technologies.
The assumptions, approach and outputs from this analysis is shown on
the following pages.
We conclude that opex benefits can arise from improving security efficiency through people and process change, regardless of the level of
capital investment in security. Benefits should be modelled directly in the People cost category rather than as capital substitution effects.

Security: Establishing a model for elasticity
70
In order to estimate elasticities with respect to passengers for security staff, we have applied a simple queuing model to understand how
the requirements for the security officer resources needed to staff screening lanes varies with passenger demand. This model, which has
been validated against a range of scenarios at other airports, is also used to estimate the savings from improvements in passenger
throughput and process efficiency.
Derive baseline number
of security lanes needed
across the day
Calculate baseline
security officer FTEs
needed to staff lanes
(F)
Set baseline for quarter-
hourly passenger numbers
Inflate quarter-hourly
passenger numbers
Derive number
of security lanes needed
across the day
Calculate inflated
security officer FTEs
needed to staff lanes
(F + ΔF)
Estimate departing
passenger demand
profile
Calculate elasticity of
security lane staff with
respect to passengers
𝜀 = ൙
∆𝐹𝐹
∆𝑁𝑁
Throughput efficiencies
are applied here
Process efficiencies
are applied here
The demand profile across the
day is based on an average
typical of Heathrow historically,
derived from flight data, e.g.
from Flightradar24
The demand profile is used to
distribute Heathrow’s
passengers quarter- hourly
across the day for different
levels of annual demand, both
observed historically and
intermediate, theoretical levels
created to model elasticity
under different conditions
The number of security lanes
needed to meet demand is
calculated at quarter hour
intervals from the demand
profile and the lane throughput.
The baseline throughput was
set at passengers per lane
per hour and increased in
increments up to
passengers per lane per hour to
model efficiencies and test the
effects on elasticity
The number of hours needed to
staff the open lanes is
calculated and translated into
FTE numbers. Based on
experience at other airports a
baseline of staff per lane
was used and decreased to a
target level of staff per lane
to estimate efficiencies and test
the impact on elasticity.
Depending on throughputs and
staffing levels assumed the
derived elasticity for security
lane staff with respect to
passengers varied from 0.6 to
0.8.
Increment in passengers
from N to N+ΔN

Security: Estimating staff costs
71
We have applied the model described above to calculate the relationship (elasticity) between passenger volume and the number of security
FTEs required. We have overlaid this model with expected efficiencies in terms of passenger throughput and process improvement
indicated by HAL and through comparison with stretch targets anticipated at other UK airports operating similar equipment and processes.
Assumptions and sources:
1. Security staff requirements comprise a variable part, associated with
passenger and hand baggage screening, that depends on passenger
volumes with elasticities derived as shown on the previous page, and a
fixed part, e.g. for fixed posts, that is inelastic to passenger volumes.
2. HAL’s future security processes will take advantage of the capabilities of
the new technologies (body scanners, CT screening, etc) that are
mandated in the same way that other airports operate or plan to operate.
3. HAL suggest that throughput will increase from passengers per hour
per security lane to passengers per hour per lane: we assume that this
change is phased from 2022 to 2026, that is an improvement of over
five years or approximately per year.
4. Our experience of comparison with the aspirations of other airports
suggests that process improvement initiatives can reduce the variable
staff requirements for security lanes by (e.g. from to staff per
lane) typically over five years: we assume this starts in 2023 and that is an
annual improvement of per year.
5. In parallel, technology improvements and process efficiency will reduce
the requirement for fixed staffing levels by 1% per year starting in 2023.
6. Historic staff numbers to 2018 are sourced from the Steer report on
opex efficiency with 2019 figures being sourced from the PA-Nyras
report commissioned by the LACC.
7. The fixed component of the staff cohort is estimated from staff
classified as “campus” and “other” in the teer report with the variable
component of the staff cohort derived from the remaining staff,
assigned to terminals in the Steer report.
8. Historical costs are derived from HAL’s regulatory accounts.
9. Projected costs are estimated using the 2019 cost per security FTE of
derived from the regulatory accounts and the PA-Nyras report,
meaning that wage inflation and counteracting measures to reduced
costs are not included (or cancel each other out).
Sources:
PA Consulting (Nyras) (2020) Operating Cost Report and Presentation Benchmarking Study
Steer, December 2019: Operating Cost
2021.03.02 - Airline Community Presentation to CAA_RBP Feedback and ABP_Final
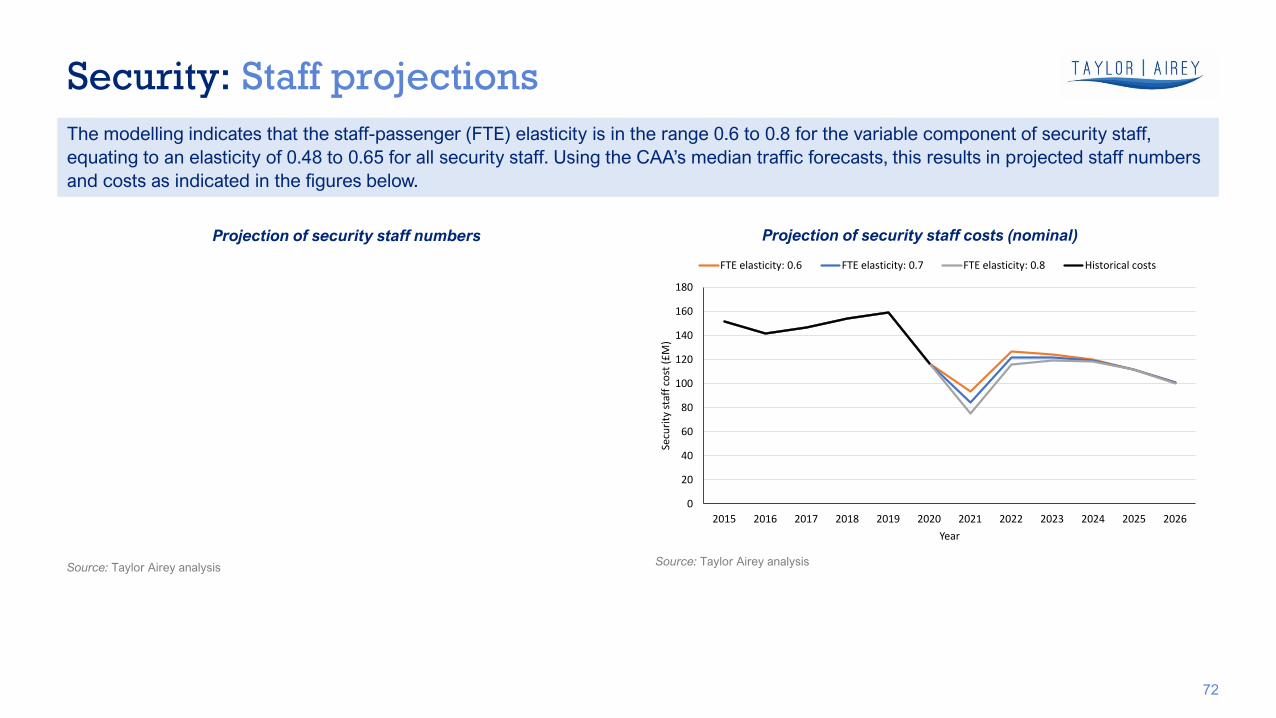
Security: Staff projections
72
The modelling indicates that the staff-passenger (FTE) elasticity is in the range 0.6 to 0.8 for the variable component of security staff,
equating to an elasticity of 0. to 0. for all security staff. Using the CAA’s median traffic forecasts, this results in projected staff numbers
and costs as indicated in the figures below.
0
20
40
60
80
100
120
140
160
180
2015 2016 2017 2018 2019 2020 2021 2022 2023 2024 2025 2026
Secu
rity
sta
ff c
ost
(£
M)
Year
FTE elasticity: 0.6 FTE elasticity: 0.7 FTE elasticity: 0.8 Historical costs
Projection of security staff numbers Projection of security staff costs (nominal)
Source: Taylor Airey analysisSource: Taylor Airey analysis
Estimating other staff costs: Approach
73
Along with security, the staff cost category is classified into operational, non-operational and pensions costs in the regulatory accounts.
These historical costs have been used as the basis of future cost projections but because of the lack of information on staff numbers and
roles, it has only been possible to undertake simple analysis based on costs alone.
Operational staff:
1. perational costs are derived from HAL’s regulatory accounts and used
unadjusted.
2. Future staffing levels have been estimated using a cost elasticity of 0.4
compared to the 2019 baseline, which is our average elasticity estimate
for categories where we do not have a specific elasticity estimate. We
then separately estimate real wage effects (see Section H on input price
inflation)
3. No other efficiency measures have been assumed.
Non-operational staff:
1. Costs associated with non-operational staff have been derived from HAL’s
regulatory accounts adjusted for the level of staff cost capitalisation,
reported in the regulatory and statutory accounts.
2. Future staffing levels have been estimated using an elasticity of 0 given
we do not expect these costs to vary with passenger numbers. We then
separately estimate real wage effects.
3. No other efficiency measures have been assumed.
Pension costs:
1. Costs associated with non-operational staff have been derived from HAL’s
regulatory accounts adjusted for the level of staff cost capitalisation,
reported in the regulatory and statutory accounts.
2. Future pension costs have been estimated using a cost elasticity of 0.4
compared to the 2019 baseline, which is our average elasticity estimate
for categories where we do not have a specific elasticity estimate. We
also assume pension costs grow in line with average wages.
3. No other efficiency measures have been assumed.

99.
9 .2
101.
9 .
100.0
7 .7
.9
7 .9
.
.
.7
2.7
0
20
0
0
0
100
120
201 201 2017 201 2019 2020 2021 2022 202 202 202 202
Propotion of 2019 staff opex
Taylor Airey HAL
Estimating staff costs: Results
74
It is very difficult to reconcile our estimates of staff costs with those generated by HAL in its RBP because HAL appears to make various
adjustments between regulatory and statutory accounts that are not transparent at individual cost category levels. To overcome this issue,
the figure below compares our estimates of staff costs, historical through to projections in nominal terms referenced to the 2019 baseline.
or comparison, HAL’s projections from the RBP model (Update 1) are also shown normalised to 2019.
Projection of staff costs as a proportion of 2019 costs, nominal
Note: This TA curve shown in this chart does not include wage inflation nor efficiency frontier adjustments
Source: Taylor Airey analysis

In addition to T2 and T , HAL’s base assumptions for terminal usage in H7 are:
• Terminal 3 is fully operational throughout H7
• Terminal 4 opens as shown in the RBP table left
To assess the impact of operating with these consolidated facilities, HAL
adjusts for area utilised using the metrics below, derived from 2018 average
historical costs.
Impact of Terminal closures - People
75
Cost category Multiplier
Change in People costs
Change in Operational costs
Change in Utilities costs
Sources:
Heathrow Airport Limited (2021) Revised Business Plan – Chapter 7.1: Operating Costs
Heathrow Airport, RBP Update 1, June 2021 7. Additional evidence to support our Scenarios
HAL has operated its infrastructure in various configurations since the start of
the pandemic:
• Initially reducing to a two terminal, single runway operation to better
align with demand.
• Then reopening Terminal as a terminal for arrivals from ‘red-list’
countries – costs expected to be recovered.
• Limited breakdown of the Red List operation is provided (HAL
assumes that of security staff and of Engineering staff cost are
required for Red list operation).
• Insufficient detail of the recovery arrangements for the costs
associated with using terminal 4 as a Red-list terminal are provided
which obscures the 2021 figures.

Impact of Terminal closures – People: Our view
76
Efficiency:
HAL commissioned Frontier Economics to undertake analysis of the elasticity
of operating costs to various cost drivers at the airport.1
As Frontier Economics could find no relationship between HAL's historical
people costs and their drivers, we question whether these multipliers could be
considered appropriate or efficient.
Our forecasting approach broadly follows Heathrow’s but we will
consider further ways to validate their assumptions at a later stage.
The inclusion of T use as a Red list terminal makes it unclear in HAL’s model
whether the costs returned post-opening match the savings made whilst the
terminal was closed.
• e.g.
Reopening of T4 for all arrivals:
We agree with HAL’s approach of ramping up costs in the months preceding
full reopening of T4 as staff are retrained and re-familiarised.
However, the proposed trajectory () and the approach of applying a space
driver to people costs is likely to be overly cautious as it means that 100% of
T4 people cost returns on the day that T4 is reopened, regardless of the
passenger volume served.
We use HAL’s proposed multiplier of , and accept that certain non-staff costs
will need to be ramped up 3 months prior to the full reopening of the terminal.
However, we consider staffing can be ramped up at a slower trajectory, as per
the chart above.
Our more conservative assumptions equates to a further potential saving of
£1m in 2023 over that modelled by HAL in their forecasts.
Commentary on the impact of terminal closures on Operational Costs and Utilities
costs are included in our later discussions of those costs categories
Source: Taylor Airey analysis
Proportion of T4 staff savings possible due to terminal closure - 2023
1. Frontier Economics (2019) Developing opex and commercial revenue elasticities for H7
Cost of Change
77
HAL states that it has made (nominal) permanent savings (at 2019
passenger levels) through the Cost of Change programme
• HAL guarantees to deliver a saving per annum related to the cost of
change that is added to the RAB. This saving will be applied to each
year until the cost of change is fully depreciated.
Airlines’ views:
• HAL has identified more savings in the RBP which have not been
included, therefore additional cost savings should be included.
• of HAL’s stated permanent saving relates to Cost of Change, which
as per the business case only began to achieve savings in late Q4
2020.
Our view:
• savings per annum should be applied as an overlay on H7
forecasts.
• Note: We understand that this programme relates to the impacts and
benefits from making changes to staff legacy terms and conditions
and is separate from, and additional to the benefits arising from the
organisational changes referred to earlier.
Sources:
Heathrow Airport Limited (2021) Revised Business Plan – Chapter 7.1: Operating Costs
2021.03.02 - Airline Community Presentation to CAA_RBP Feedback and ABP_Final
We conclude that the savings proposed by HAL arising from the Cost of Change programme are applied to future opex forecasts as agreed
between the airport and airlines.

Magenta
78
HAL states that, “Magenta is the biggest transformational change programme
ever undertaken by Heathrow support services. We are implementing a
modern system with straightforward, intuitive processes that allows our
support functions to operate efficiently, to provide insights and to add value to
decision makers. The scope of the programme will include, our core finance
process areas, the people lifecycle, asset management, business intelligence”.
However, it also states that Magenta is not included in the Capital Investment
chapter as the capital expenditure is incurred prior to the start of H7:
• The Gateway 3 Business Case was approved by the airline community at
the August 2020 Capital Plan Board. However, the benefits associated
with Magenta reduce capitalisable costs and are therefore not included in
the operating cost forecast.
• Magenta does provide an opportunity to reduce overheads included in
the Leadership and Logistics %.
In the RBP Update, HAL reiterates that:
“…the incremental savings associated with the Magenta G3 business
case are not related to operating costs” and state that, “There has been
further engagement and clarification on this matter with the Airline
Community at the CPB where we have explained how the identified
benefits relate to capital process and cashflow efficiencies”
Our view:
Elsewhere in the RBP, HAL states that there are benefits to numbers of staff
employed in back-office functions but that these have already been realised in
the organisational change actions taken in 2020 and 2021. These savings
should be used as a basis for H7 forecasts as discussed earlier even if, as HAL
states, no further savings are possible from the Magenta programme.
Source: Heathrow Airport Limited (2021) Revised Business Plan – Chapter 7.1: Operating Costs – Section 7.1.5.1 Transforming our Support Services Efficiency

or the “ ull RAB Adjustment case”, HAL asserts that an additional (2018 RPI prices) per annum is required as
an enhanced service cost overlay (E ) to deliver a “I feel cared for and supported” consumer outcome. This
comprises:
1. £ for the 9 of passengers requiring support who choose not to use “our dedicated assistance service”;
2. an additional £ maintenance to ensure resilience of passenger sensitive equipment (PSE) that has suffered
under investment and cannot be replaced under the current capital programme;
3. £ for digital services bridging a customer services gap; and
4. £ to support the roll-out of new automated, touchless parts of the passenger journey.
Enhanced service cost overlay: Summary
79
Need
Additionality
Efficiency
With the exception of (2) on resilience, none of the above elements of the enhanced service overlay would appear
to be additional to business as usual activities. Of the £ allocated to resilience, part of this may be justified for
old, difficult to maintain equipment but there is a risk of overlap with standard maintenance and a potential inflation
as equipment in, for example, in Terminal 2, is not likely to be at end of life or difficult to maintain.
As the enhanced service overlay appears to cover or overlap with business as usual activities accounted for
elsewhere, specifically standard maintenance and support to passengers with reduced mobility (PRM), we propose
to apply a reduced enhanced service cost overlay of £7m in 2022 adjusted for efficiencies going forward. The
rationale for this approach is described on the following page.
Enhanced service cost overlay: rationale
80
The for passengers requiring support (PRS) is claimed additional to
support to Passengers with Restricted Mobility (PRM), which is treated
separately, but is to support vulnerable consumers (39%) who choose not to
use “our dedicated assistance service”. As these passengers choose not to
use the PRM service or are not directed to the PRM service by HAL, this is
therefore essentially a service quality initiative. More generally, there appears
little evidence that there is a service quality issue at Heathrow: indeed service
quality scores are reported as high. We have, therefore, not including this
component of the ESO.
HAL claims a customer digital service gap regarding customer queries
through personal digital devices and has applied an ESO to address this.
However, as many other premium airports are providing such digital services
as business-as-usual, we have not included this in the ESO.
HAL has allocated to support touchless/ automated journeys. This again
appears to be business as usual and automation would imply some efficiency
savings. We have, therefore, not included this in the ESO.
The main part of HAL’s E cost is to support resilience of passenger
sensitive equipment (PSE) comprising items such as lifts, travelators,
escalators, the T5 track transit system, stands and baggage reclaim. The
argument for this being part of the ESO is that it is needed to offset previous
capital under-investment to extend the life of assets and maintain them to
ensure that passengers have a predictable and reliable journey. HAL
estimates that this would require an uplift of in maintenance spend (),
which has been reduced to per annum as a stretch target.
The link between the increased maintenance spend and reduced risk of low
availability and reliability is not clear. Furthermore, it is not clear the extent to
which assets are nearing the end of their life and would, therefore, need
enhanced maintenance. For example, assets in Terminal 2 are only a few
years old and would not be expected to be subject to ESO. Similarly, assets
in Terminal 5 are of the order of 13 years old and, assuming a 20-year life,
would also not be subject to ESO. There are also likely to be similar recently
replaced or refurbished assets in the other terminals. Therefore, we have
included the resilience component of ESO in our assessment but at a
reduced rate of £7m per annum to maintain service quality standards,
subject to normal efficiency savings throughout the H7 period.

People: TA Proposals - nominal
81
People costs: Security staff, operational staff, non-operational staff, pension costs (HAL mid pax forecasts)
HAL forecast, £m
Difference with TA, £m
Nominal 2022 2023 2024 2025 2026
Baseline, £m 379.0 379.0 379.0 379.0 379.0
Baseline adjustments, £m
(%)
-63.9
(-17%)
-63.9
(-17%)
-63.9
(-17%)
-63.9
(-17%)
-63.9
(-17%)
Adjusted baseline, £m 315.1 315.1 315.1 315.1 315.1
Price increase, £m
(%)
4.5
(1%)
12.9
(4%)
23.1
(7%)
34.7
(11%)
47.4
(15%)
Price adj. forecast, £m 319.5 328.0 338.1 349.8 362.4
Volume adjustment, £m
(%)
-57.5
(-18%)
-37.0
(-11%)
-23.6
(-7%)
-16.8
(-5%)
-14.7
(-4%)
Volume adj. forecast, £m 262.0 291.0 314.5 332.9 347.7
Overlay, £m
(%)
-15.3
(-6%)
-19.8
(-7%)
-25.5
(-8%)
-38.6
(-12%)
-50.5
(-15%)
Frontier shift efficiency, £m
(%)
-2.5
(-1%)
-5.4
(-2%)
-8.6
(-3%)
-11.6
(-4%)
-14.6
(-5%)
Final forecast, £m 244.3 265.8 280.4 282.8 282.7 H7
Source: Taylor Airey analysis
Section Three
D. Operational Costs (incl. Insurance)
Opex forecasts

Nominal 2022 2023 2024 2025 2026
2019 start point 308.7 316.6 326.1 335.9 346.0
Baseline adjustments, £m
Baseline, £m
Volume adjustment, £m
(%)
Volume adj. forecast, £m
Frontier shift, £m
(%)
Efficiency adjusted forecast, £m
One-off impacts, £m
Terminal growth overlays, £m
Final forecast, £m
2018 RPI prices 2022 2023 2024 2025 2026
2019 start point 281.6 281.6 281.6 281.6 281.6
Baseline adjustments, £m
Baseline, £m
Volume adjustment, £m
(%)
Volume adj. forecast, £m
Frontier shift, £m
(%)
Efficiency adjusted forecast, £m
One-off impacts, £m
Terminal growth overlays, £m
Final forecast, £m
Operational costs: Summary of HAL’s proposals
Operational costs: Policing, PRM costs, IT, NATS, etc.
• Efficiencies from Frontier Shift assumption:
• 0.1% pa from 2022.
• Total across H7.
• Terminal growth overlay due to continued closure of Terminal 4 to all arrivals
until June 2023.
Operational costs: Policing, PRM costs, IT, NATS, etc.
Source: Taylor Airey analysis of HAL RBP model Source: Taylor Airey analysis of HAL RBP model

Operational costs (excluding insurance)
84
Approach
As well as Insurance, the category Operational Costs also includes: Retail Costs, NATS Costs,
Police Costs, Staff Catering, Bus Shuttle, and Other Operational Costs.
These subcategories are broken down in HAL’s Regulatory Accounts but are not forecast
individually in their RBP. We are therefore only able to consider the evolution of costs in these
categories in Q6 / iH7 and any comments made by HAL in the text of the RBP. However, given the
materiality of some of the subcategories in Operational Costs, we feel that this approach should
be sufficient at this stage.
Comment on Elasticity based approach
Whilst HAL has forecast Operational Costs with a single elasticity of to passengers in the RBP,
it has changed its approach for the RBP Update 1.
In the update it states that, “Since the RBP, we have further reviewed the variability of operational
costs with respect to passenger volumes. During 2020/21 it has not been possible to make the
level of savings that would be suggested by using the elasticity of with respect to changes in
passenger volumes. Costs such as IT, police and rent are largely fixed. Analysis of our 2019
operational costs suggests that around 50% of our operational costs are fixed in the medium
term. As a result, we have reduced the passenger volume elasticity by 50% from to for
operational costs”.
Our view: We agree that the larger components of this cost category are more likely to be driven
by the specific contracts in place for each component rather than an overall volume elasticity.
• We would suggest that HAL could take a more granular approach and use the actual contract
forecasts with an elasticity of zero, removing any volume effects.
• In the meantime we have applied our average elasticity of 0.4Sources used: Heathrow Airport RBP Update 1 Appendix 5 - Additional analysis
to support Operating Cost modelling assumptions
Variable
Fixed
Components of Operational Costs in 2019 (£m, 2018 RPI prices)
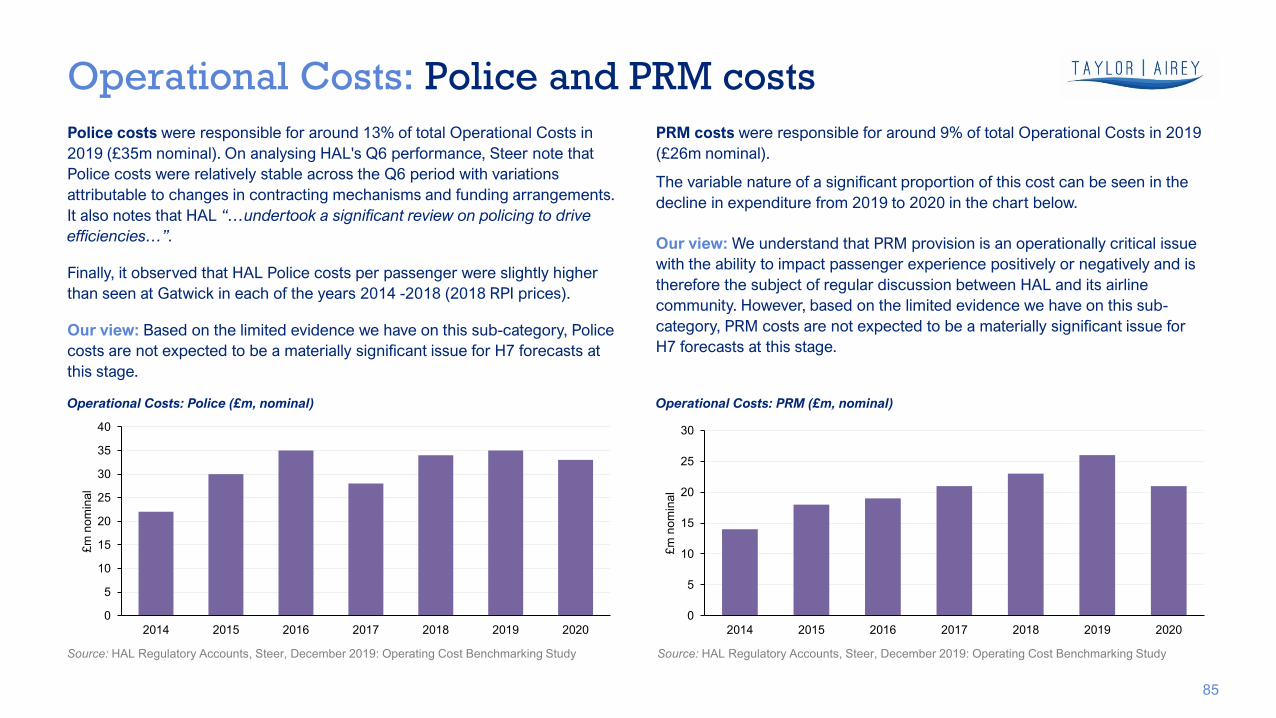
Operational Costs: Police and PRM costs
85
Police costs were responsible for around 13% of total Operational Costs in
2019 (£35m nominal). On analysing HAL's Q6 performance, Steer note that
Police costs were relatively stable across the Q6 period with variations
attributable to changes in contracting mechanisms and funding arrangements.
It also notes that HAL “…undertook a significant review on policing to drive
efficiencies…”.
Finally, it observed that HAL Police costs per passenger were slightly higher
than seen at Gatwick in each of the years 2014 -2018 (2018 RPI prices).
Our view: Based on the limited evidence we have on this sub-category, Police
costs are not expected to be a materially significant issue for H7 forecasts at
this stage.
Source: HAL Regulatory Accounts, Steer, December 2019: Operating Cost Benchmarking Study Source: HAL Regulatory Accounts, Steer, December 2019: Operating Cost Benchmarking Study
0
5
10
15
20
25
30
35
40
2014 2015 2016 2017 2018 2019 2020
£m
no
min
al
Operational Costs: Police (£m, nominal)
PRM costs were responsible for around 9% of total Operational Costs in 2019
(£26m nominal).
The variable nature of a significant proportion of this cost can be seen in the
decline in expenditure from 2019 to 2020 in the chart below.
Our view: We understand that PRM provision is an operationally critical issue
with the ability to impact passenger experience positively or negatively and is
therefore the subject of regular discussion between HAL and its airline
community. However, based on the limited evidence we have on this sub-
category, PRM costs are not expected to be a materially significant issue for
H7 forecasts at this stage.
0
5
10
15
20
25
30
2014 2015 2016 2017 2018 2019 2020
£m
no
min
al
Operational Costs: PRM (£m, nominal)
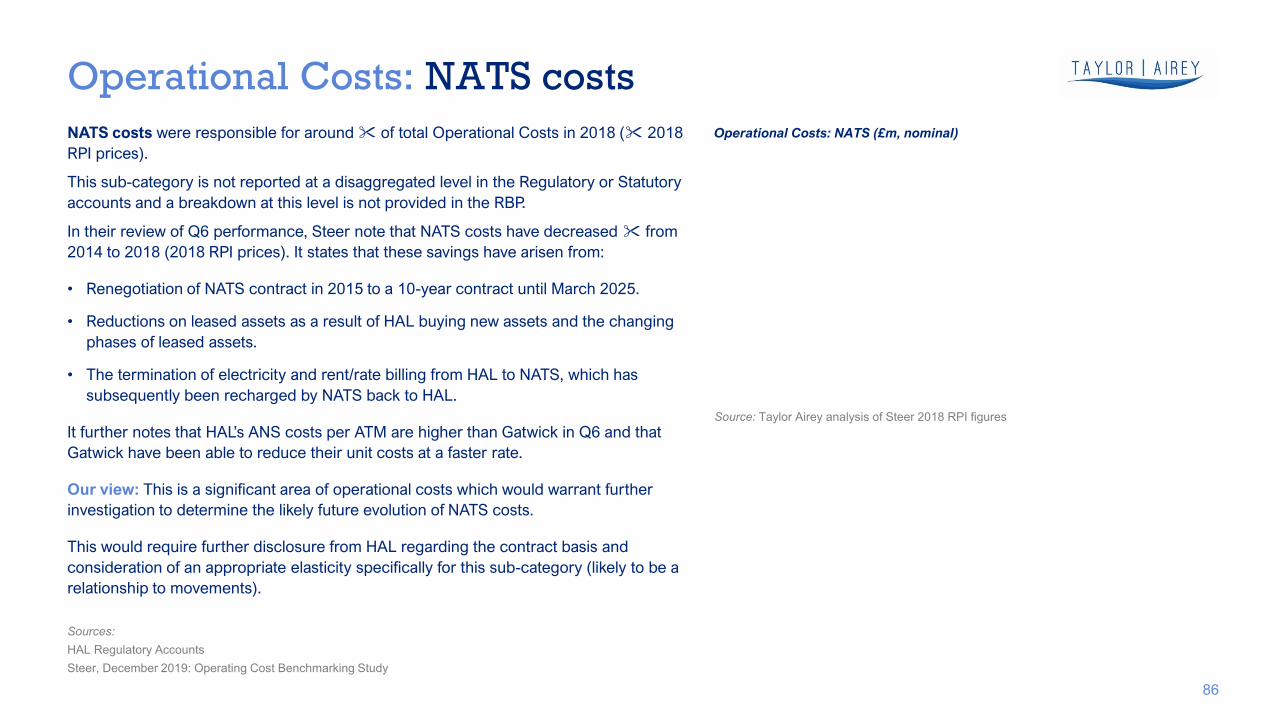
Operational Costs: NATS costs
86
NATS costs were responsible for around of total Operational Costs in 2018 ( 2018
RPI prices).
This sub-category is not reported at a disaggregated level in the Regulatory or Statutory
accounts and a breakdown at this level is not provided in the RBP.
In their review of Q6 performance, Steer note that NATS costs have decreased from
2014 to 2018 (2018 RPI prices). It states that these savings have arisen from:
• Renegotiation of NATS contract in 2015 to a 10-year contract until March 2025.
• Reductions on leased assets as a result of HAL buying new assets and the changing
phases of leased assets.
• The termination of electricity and rent/rate billing from HAL to NATS, which has
subsequently been recharged by NATS back to HAL.
It further notes that HAL’s A costs per ATM are higher than Gatwick in Q and that
Gatwick have been able to reduce their unit costs at a faster rate.
Our view: This is a significant area of operational costs which would warrant further
investigation to determine the likely future evolution of NATS costs.
This would require further disclosure from HAL regarding the contract basis and
consideration of an appropriate elasticity specifically for this sub-category (likely to be a
relationship to movements).
Source: Taylor Airey analysis of Steer 2018 RPI figures
Operational Costs: NATS (£m, nominal)
Sources:
HAL Regulatory Accounts
Steer, December 2019: Operating Cost Benchmarking Study

Impact of Terminal closures – Operational Costs
87
HAL’s approach:
To derive cost savings attributable from the closure of Terminal 4, HAL adjusts
for area utilised using the metrics below which it has derived from 2018/19
average historical costs.
To derive the multiplier for the category Operational costs, it extracts the
elements of this category which it considers are variable and related to
terminal usage as follows:
• PRMs;
• Commercial expenditure;
• Passenger ambassadors; and,
• Inter-Terminal Operations.
Together these categories represented around of the total Operational Cost
in 2018 and 2019.
Our view:
The principle that only part of this category will relate to terminal operations
and is therefore relevant to Terminal 4 closure is agreed.
We feel that further clarification could be sought on some of the attribution of
the different categories. For example, we may question whether there was an
opportunity to negotiate a temporary reduction in Police costs arising from the
reduced terminal utilisation. However the overall difference that including or
excluding specific sub-categories in this analysis would not be expected to be
material in the overall opex forecast.
Cost category Multiplier
Change in People costs
Change in Operational costs
Change in Utilities costs
Source: Heathrow Airport RBP Update 1 Appendix 5 - Additional analysis to support Operating Cost modelling assumptions

Operational costs: TA Proposals - nominal
88
Operational costs: Policing, PRM costs, IT, NATS, etc. (HAL mid pax forecasts)
HAL forecast, £m
Difference with TA, £m
Nominal 2022 2023 2024 2025 2026
Baseline, £m 288.8 288.8 288.8 288.8 288.8
Baseline adjustments, £m
(%)
-7.6
(-3%)
-7.6
(-3%)
-7.6
(-3%)
-7.6
(-3%)
-7.6
(-3%)
Adjusted baseline, £m 281.3 281.3 281.3 281.3 281.3
Price increase, £m
(%)
11.9
(4%)
17.5
(6%)
23.2
(8%)
29.3
(10%)
35.5
(13%)
Price adj. forecast, £m 293.2 298.7 304.5 310.6 316.8
Volume adjustment, £m
(%)
-57.1
(-19%)
-36.5
(-12%)
-23.0
(-8%)
-16.2
(-5%)
-13.9
(-4%)
Volume adj. forecast, £m 236.1 262.2 281.5 294.4 302.9
Overlay, £m
(%)
-11.2
(-5%)
-4.2
(-2%)
0.0
(0%)
0.0
(0%)
0.0
(0%)
Frontier shift efficiency, £m
(%)
-2.2
(-1%)
-5.1
(-2%)
-8.4
(-3%)
-11.6
(-4%)
-14.8
(-5%)
Final forecast, £m 222.7 252.9 273.2 282.8 288.1 H7
Source: Taylor Airey analysis

Nominal 2022 2023 2024 2025 2026
2019 start point
Baseline adjustments, £m
Baseline, £m
Volume adjustment, £m
(%)
Volume adj. forecast, £m
Frontier shift, £m
(%)
Efficiency adjusted forecast, £m
One-off impacts, £m
Terminal growth overlays, £m
Final forecast, £m
2018 RPI prices 2022 2023 2024 2025 2026
2019 start point
Baseline adjustments, £m
Baseline, £m
Volume adjustment, £m
(%)
Volume adj. forecast, £m
Frontier shift, £m
(%)
Efficiency adjusted forecast, £m
One-off impacts, £m
Terminal growth overlays, £m
Final forecast, £m
Insurance costs: Summary of HAL’s proposals
Insurance costs: Insurance costs:
Source: Taylor Airey analysis of HAL RBP model Source: Taylor Airey analysis of HAL RBP model
89
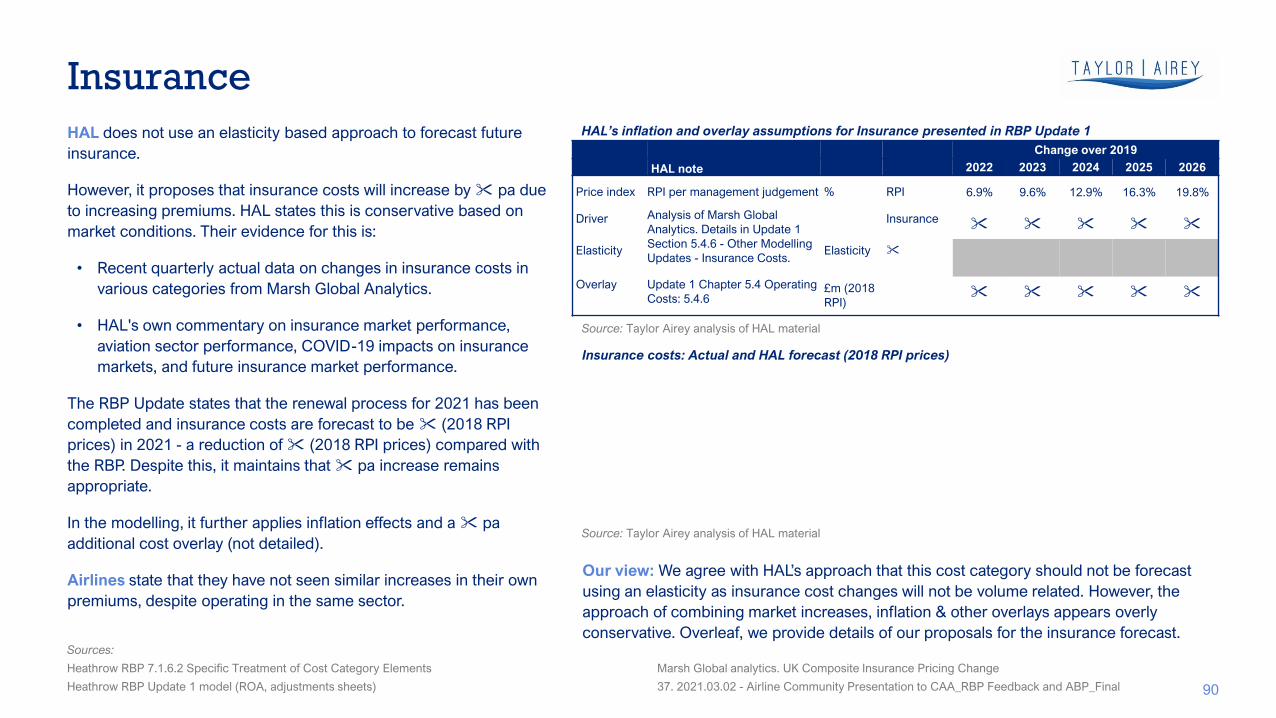
Insurance
90
HAL does not use an elasticity based approach to forecast future
insurance.
However, it proposes that insurance costs will increase by pa due
to increasing premiums. HAL states this is conservative based on
market conditions. Their evidence for this is:
• Recent quarterly actual data on changes in insurance costs in
various categories from Marsh Global Analytics.
• HAL's own commentary on insurance market performance,
aviation sector performance, COVID-19 impacts on insurance
markets, and future insurance market performance.
The RBP Update states that the renewal process for 2021 has been
completed and insurance costs are forecast to be (2018 RPI
prices) in 2021 - a reduction of (2018 RPI prices) compared with
the RBP. Despite this, it maintains that pa increase remains
appropriate.
In the modelling, it further applies inflation effects and a pa
additional cost overlay (not detailed).
Airlines state that they have not seen similar increases in their own
premiums, despite operating in the same sector.
Our view: We agree with HAL’s approach that this cost category should not be forecast
using an elasticity as insurance cost changes will not be volume related. However, the
approach of combining market increases, inflation & other overlays appears overly
conservative. Overleaf, we provide details of our proposals for the insurance forecast.Sources:
Heathrow RBP 7.1.6.2 Specific Treatment of Cost Category Elements
Heathrow RBP Update 1 model (ROA, adjustments sheets)
Marsh Global analytics. UK Composite Insurance Pricing Change
37. 2021.03.02 - Airline Community Presentation to CAA_RBP Feedback and ABP_Final
Change over 2019
HAL note 2022 2023 2024 2025 2026
Price index RPI per management judgement % RPI 6.9% 9.6% 12.9% 16.3% 19.8%
Driver Analysis of Marsh Global
Analytics. Details in Update 1
Section 5.4.6 - Other Modelling
Updates - Insurance Costs.
Insurance
Elasticity Elasticity
Overlay Update 1 Chapter 5.4 Operating
Costs: 5.4.6£m (2018
RPI)
HAL’s inflation and overlay assumptions for Insurance presented in RBP Update 1
Insurance costs: Actual and HAL forecast (2018 RPI prices)
Source: Taylor Airey analysis of HAL material
Source: Taylor Airey analysis of HAL material
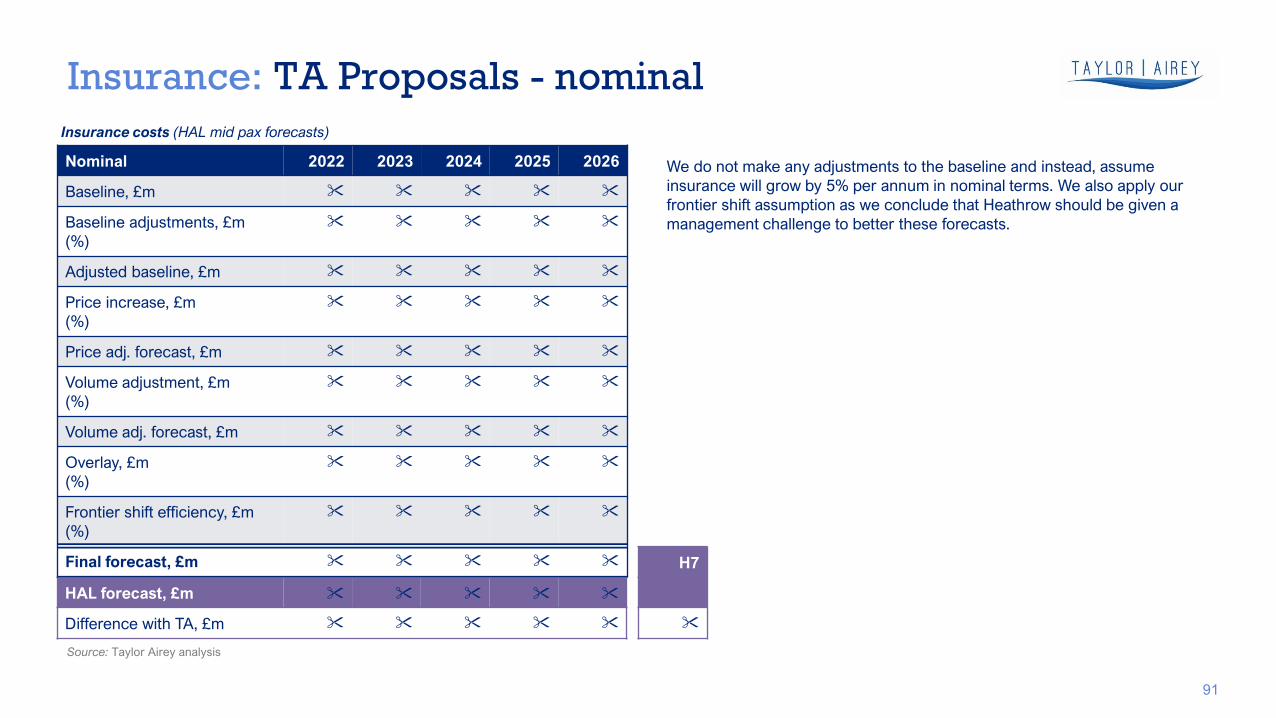
Insurance: TA Proposals - nominal
91
Insurance costs (HAL mid pax forecasts)
HAL forecast, £m
Difference with TA, £m
Nominal 2022 2023 2024 2025 2026
Baseline, £m
Baseline adjustments, £m
(%)
Adjusted baseline, £m
Price increase, £m
(%)
Price adj. forecast, £m
Volume adjustment, £m
(%)
Volume adj. forecast, £m
Overlay, £m
(%)
Frontier shift efficiency, £m
(%)
Final forecast, £m H7
Source: Taylor Airey analysis
We do not make any adjustments to the baseline and instead, assume
insurance will grow by 5% per annum in nominal terms. We also apply our
frontier shift assumption as we conclude that Heathrow should be given a
management challenge to better these forecasts.

Section Three
E. Facilities and Maintenance
Opex forecasts

Facilities & Maintenance: HAL’s proposals
2018 RPI prices 2022 2023 2024 2025 2026
2019 start point 169.3 169.3 169.3 169.3 169.3
Baseline adjustments, £m
Baseline, £m
Volume adjustment, £m
(%)
Volume adj. forecast, £m
Frontier shift, £m
(%)
Efficiency adjusted forecast,
£m
One-off impacts, £m
Terminal growth overlays, £m
Final forecast, £m
Facilities and maintenance:
Nominal 2022 2023 2024 2025 2026
2019 start point 185.5 190.3 196.0 201.9 208.0
Baseline adjustments, £m
Baseline, £m
Volume adjustment, £m
(%)
Volume adj. forecast, £m
Frontier shift, £m
(%)
Efficiency adjusted forecast,
£m
One-off impacts, £m
Terminal growth overlays, £m
Final forecast, £m
Facilities and maintenance:
• Efficiencies from Frontier Shift assumption:
• 0.1% pa from 2022
• Total across H7
Source: Taylor Airey analysis of HAL RBP model Source: Taylor Airey analysis of HAL RBP model
93
Facilities and Maintenance costs
94
Facilities and Maintenance costs split down into three main sub-categories of
costs:
• Maintenance;
• Baggage; and,
• Cleaning
The only sub-category for which any breakdown is available is Cleaning, where
actuals are reported in the Regulatory Accounts. Further detail on the build up
of Maintenance cost in particular would provide scope for a fuller analysis.
Source: Heathrow Airport RBP Update 1 Appendix 5 - Additional analysis to support Operating Cost
modelling assumptions
Components of Facilities and Maintenance Costs (£m, 2018 RPI prices)

Contract costs (incl. Baggage Contract)
95
HAL highlights a business-wide procurement strategy to rationalise their
supply chain and achieve greater value from having fewer suppliers with
larger strategic partnerships.
• (2019 prices) pa savings arise from renegotiation of baggage
operations and maintenance contract.
HAL further states that the majority of the immediate reductions in
contract costs post-COVID are temporary or volume driven as it derives
from:
• government job retention schemes;
• re-sizing of the supply chain;
• revisions to the scope of services; and
• alterations to commercial terms or models.
Airlines’ views:
• HAL has identified more savings in the RBP which have not been
included, therefore additional cost savings should be included.
• per annum, as stated by HAL should be included as additional
savings.
Our view
savings per annum should be applied as an overlay on H7 forecasts
resulting from the baggage contract in the same way as HAL has forecast.
As these savings arise form a business-wide supply chain initiative, there
would also be expected to be the potential for further long-term savings from
similar renegotiations in other areas, such as vehicle fleet management,
cleaning, etc. This could also be included for other large contracts, such as
ANS and police in the longer term but probably outside the scope of H7.
We would expect that some of the contract savings from the immediate post-
COVID response to managing the supply chain will be sustainable over the
longer terms. HAL should therefore continue to realise these benefits across
the H7 period.
These savings should be incorporated into the overarching frontier shift.
Sources:
Contract costs Heathrow Airport Limited (2021) Revised Business Plan Section 7.1.5.4
2021.03.02 - Airline Community Presentation to CAA_RBP Feedback and ABP_Final
HAL should be challenged to deliver further savings from their procurement strategy beyond the Baggage renegotiation as well as retaining
some of the short term benefits from contract renegotiations in 2020 and 2021 into the H7 period.
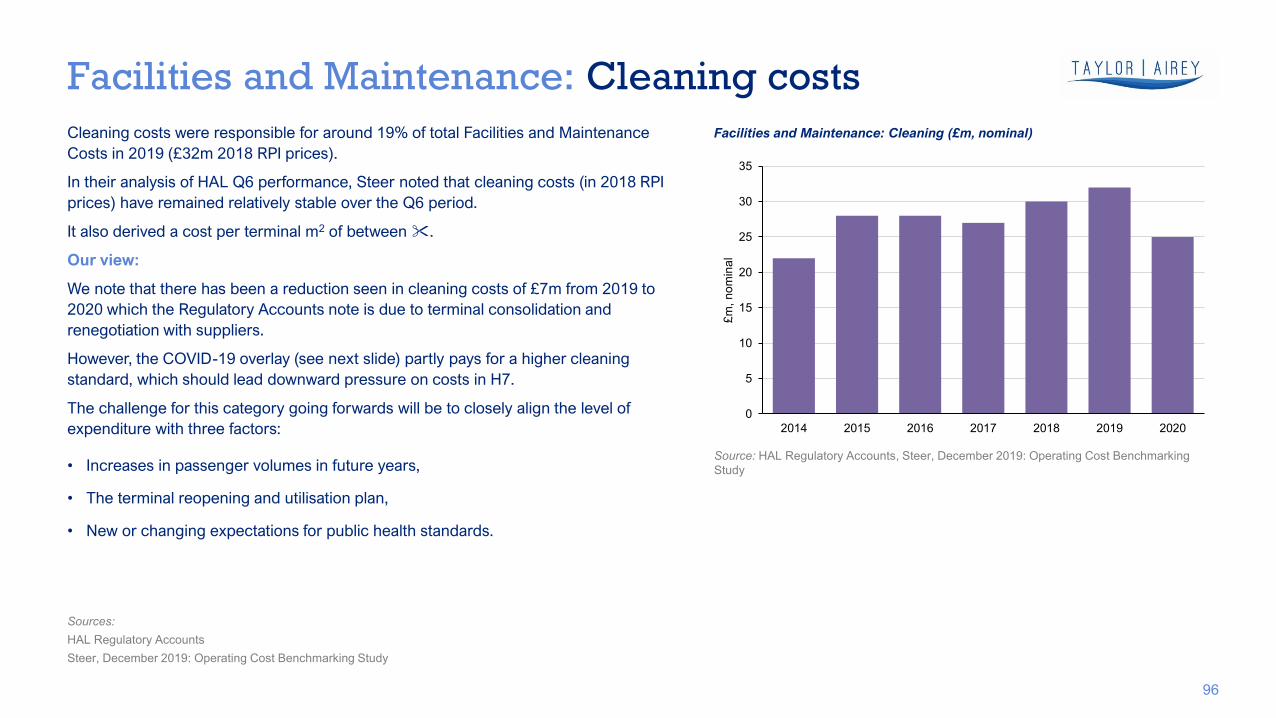
Facilities and Maintenance: Cleaning costs
96
Cleaning costs were responsible for around 19% of total Facilities and Maintenance
Costs in 2019 (£32m 2018 RPI prices).
In their analysis of HAL Q6 performance, Steer noted that cleaning costs (in 2018 RPI
prices) have remained relatively stable over the Q6 period.
It also derived a cost per terminal m2 of between .
Our view:
We note that there has been a reduction seen in cleaning costs of £7m from 2019 to
2020 which the Regulatory Accounts note is due to terminal consolidation and
renegotiation with suppliers.
However, the COVID-19 overlay (see next slide) partly pays for a higher cleaning
standard, which should lead downward pressure on costs in H7.
The challenge for this category going forwards will be to closely align the level of
expenditure with three factors:
• Increases in passenger volumes in future years,
• The terminal reopening and utilisation plan,
• New or changing expectations for public health standards.
Sources:
HAL Regulatory Accounts
Steer, December 2019: Operating Cost Benchmarking Study
0
5
10
15
20
25
30
35
2014 2015 2016 2017 2018 2019 2020
£m
, n
om
ina
l
Facilities and Maintenance: Cleaning (£m, nominal)
Source: HAL Regulatory Accounts, Steer, December 2019: Operating Cost Benchmarking
Study

There have clearly been costs incurred in the immediate pandemic response in 2020/21 which are unprecedented
and could not be expected to be included in historical short run elasticities. However there is not a compelling case
presented to evidence why such effects are expected to continue throughout the H7 period at a constant level (
pa, 2018 RPI prices) without any mitigation.
Covid overlay
97
Need
Additionality
Efficiency
Due to a lack of transparency of the data it is difficult to determine whether the cost of public health responses may
duplicate items that would have already been accounted for in facilities, cleaning and maintenance
Given the unique characteristics of HAL’s business and its operational responses it is difficult to benchmark what
an efficient cost might look like. However 2020 actual costs would be expected to be an unrealistically high
estimate for the H7 years as:
• The immediacy of the responses required may not have allowed time for best value solutions to be sourced
• The supplier base for certain items may have been limited and competing demand in the market high (for
example for hand sanitiser, wipes, PPE etc) in the early stages of the pandemic response
• No mitigations had yet been developed
• Costs incurred in 2020 arose in response to guidelines in force at that time. These are unlikely to be the same
in the later years of the H7 period
Therefore, we propose using an overlay which tapers from (2018 RPI prices) in 2022 to 0 by 2026

Facilities & Maintenance: TA Proposals - nominal
98
Facilities and Maintenance costs (HAL mid pax forecasts)
HAL forecast, £m
Difference with TA, £m
Nominal 2022 2023 2024 2025 2026
Baseline, £m 173.6 173.6 173.6 173.6 173.6
Baseline adjustments, £m
(%)
0.9
(1%)
0.9
(1%)
0.9
(1%)
0.9
(1%)
0.9
(1%)
Adjusted baseline, £m 174.5 174.5 174.5 174.5 174.5
Price increase, £m
(%)
8.9
(5%)
13.1
(8%)
17.8
(10%)
23.0
(13%)
28.6
(16%)
Price adj. forecast, £m 183.4 187.6 192.3 197.5 203.0
Volume adjustment, £m
(%)
-35.7
(-19%)
-22.9
(-12%)
-14.5
(-8%)
-10.3
(-5%)
-8.9
(-4%)
Volume adj. forecast, £m 147.7 164.6 177.8 187.2 194.1
Overlay, £m
(%)
0.0
(0%)
0.0
(0%)
0.0
(0%)
0.0
(0%)
0.0
(0%)
Frontier shift efficiency, £m
(%)
-1.5
(-1%)
-3.3
(-2%)
-5.3
(-3%)
-7.4
(-4%)
-9.5
(-5%)
Final forecast, £m 146.2 161.4 172.5 179.8 184.6 H7
Source: Taylor Airey analysis
Section Three
F. Rates, Utilities and Distribution Contract
Opex forecasts
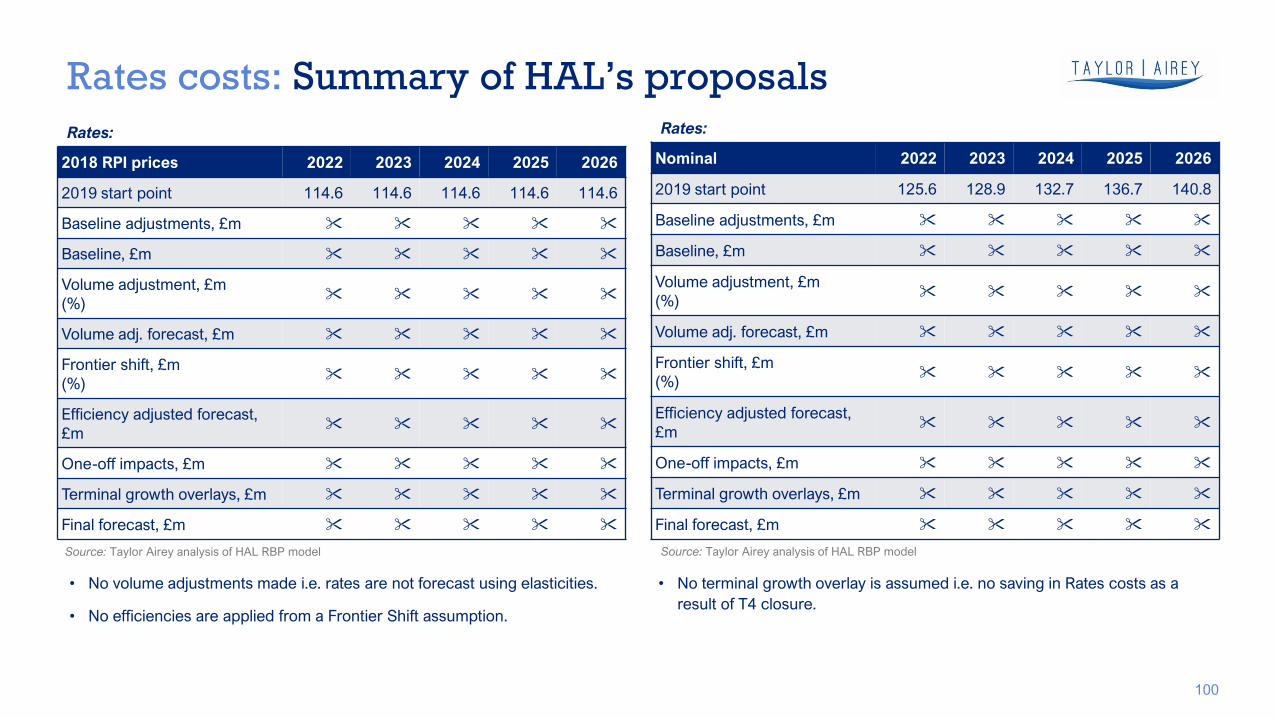
Rates costs: Summary of HAL’s proposals
2018 RPI prices 2022 2023 2024 2025 2026
2019 start point 114.6 114.6 114.6 114.6 114.6
Baseline adjustments, £m
Baseline, £m
Volume adjustment, £m
(%)
Volume adj. forecast, £m
Frontier shift, £m
(%)
Efficiency adjusted forecast,
£m
One-off impacts, £m
Terminal growth overlays, £m
Final forecast, £m
Rates:
Nominal 2022 2023 2024 2025 2026
2019 start point 125.6 128.9 132.7 136.7 140.8
Baseline adjustments, £m
Baseline, £m
Volume adjustment, £m
(%)
Volume adj. forecast, £m
Frontier shift, £m
(%)
Efficiency adjusted forecast,
£m
One-off impacts, £m
Terminal growth overlays, £m
Final forecast, £m
Rates:
• No volume adjustments made i.e. rates are not forecast using elasticities.
• No efficiencies are applied from a Frontier Shift assumption.
• No terminal growth overlay is assumed i.e. no saving in Rates costs as a
result of T4 closure.
Source: Taylor Airey analysis of HAL RBP model Source: Taylor Airey analysis of HAL RBP model
100
Business Rates
101
HAL proposed approach: HAL states that it has very limited control of
business rates and propose to make Rates an ORC in H7, ensuring 100%
sharing immediately, any savings (or liabilities) with consumers.
• HAL states that it is inappropriate that it should benefit from windfall
gains from reductions in rates. In 2020, it received from the Airport
and Ground Operations Support Scheme (AGOSS) and is not
expecting to receive any further support in 2021.
• It argues that, through the same logic, it should not bear the impact of
any policy shift in the opposite direction.
• HAL further states that treating rates as an ORC will provide airlines
with a higher degree of transparency over measures to reduce
business rate costs even as government policy may shift.
Our view: The regulatory treatment of Rates is a matter of regulatory design
that is beyond the scope of this study.
We agree with the principle of excluding Rates from the elasticity-based
modelling approach.
At this stage, we have retained HAL’s forecasts for Rates, but we index this with
CPI rather than RPI, given the Government’s announcement in the Autumn
Budget 2017 that future adjustments to business rates will be based on CPI
rather than RPI.2 This results in the differences for Rates costs.
We expect HAL to indicate in its next update to the RBP (the RBP Update 2),
whether it anticipates receiving further relief to business rates during the H7
period.
1. Heathrow Airport Limited (2021) Revised Business Plan – Chapter 7.1: Operating Costs 2. Ministry of Housing, Communities & Local Government (2020) Business Rates Information Letter
(1/2020): Rate Reliefs and Provisional 2020-21 Business Rates Multipliers

Rates: TA Proposals - nominal
102
Business Rates (HAL mid pax forecasts)
HAL forecast, £m
Difference with TA, £m
Nominal 2022 2023 2024 2025 2026
Baseline, £m 117.6 117.6 117.6 117.6 117.6
Baseline adjustments, £m
(%)
0.0
(0%)
0.0
(0%)
0.0
(0%)
0.0
(0%)
0.0
(0%)
Adjusted baseline, £m 117.6 117.6 117.6 117.6 117.6
Price increase, £m
(%)
5.0
(4%)
7.3
(6%)
9.7
(8%)
12.2
(10%)
14.8
(13%)
Price adj. forecast, £m 122.5 124.9 127.3 129.8 132.4
Volume adjustment, £m
(%)
0.0
(0%)
0.0
(0%)
0.0
(0%)
0.0
(0%)
0.0
(0%)
Volume adj. forecast, £m 122.5 124.9 127.3 129.8 132.4
Overlay, £m
(%)
0.0
(0%)
0.0
(0%)
0.0
(0%)
0.0
(0%)
0.0
(0%)
Frontier shift efficiency, £m
(%)
0.0
(0%)
0.0
(0%)
0.0
(0%)
0.0
(0%)
0.0
(0%)
Final forecast, £m 122.5 124.9 127.3 129.8 132.4 H7
Source: Taylor Airey analysis
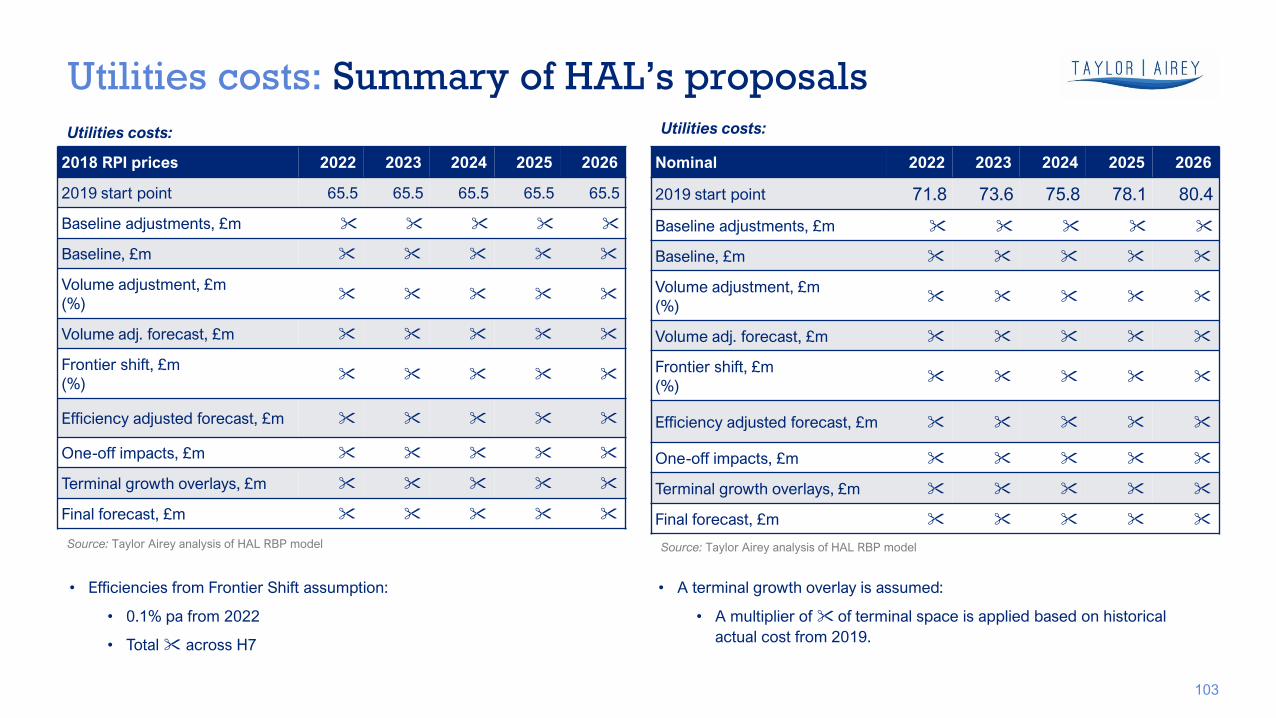
Utilities costs: Summary of HAL’s proposals
2018 RPI prices 2022 2023 2024 2025 2026
2019 start point 65.5 65.5 65.5 65.5 65.5
Baseline adjustments, £m
Baseline, £m
Volume adjustment, £m
(%)
Volume adj. forecast, £m
Frontier shift, £m
(%)
Efficiency adjusted forecast, £m
One-off impacts, £m
Terminal growth overlays, £m
Final forecast, £m
Utilities costs:
Nominal 2022 2023 2024 2025 2026
2019 start point 71.8 73.6 75.8 78.1 80.4
Baseline adjustments, £m
Baseline, £m
Volume adjustment, £m
(%)
Volume adj. forecast, £m
Frontier shift, £m
(%)
Efficiency adjusted forecast, £m
One-off impacts, £m
Terminal growth overlays, £m
Final forecast, £m
Utilities costs:
• Efficiencies from Frontier Shift assumption:
• 0.1% pa from 2022
• Total across H7
• A terminal growth overlay is assumed:
• A multiplier of of terminal space is applied based on historical
actual cost from 2019.
Source: Taylor Airey analysis of HAL RBP model Source: Taylor Airey analysis of HAL RBP model
103

Utilities costs – Volume effects
104
HAL approach:
We have considered the issue of utilities usage in light of HAL’s claim that
their 2019 operation represented a business at the frontier of efficiency.
Material presented by Steer in their 2019 operating cost analysis certainly
seems on face value to show a decrease in electricity usage. Steer state that:
• Electricity consumption has decreased from 538.9 GWh in 2014 to 460.4
GWh in 2018, representing a -15% decrease.
• However, Gas consumption has increased slightly by +4% across the
same time period, from 129.6 GWh to 134.4 GWh.
However, it should be noted that the usage in Q6 was significantly influenced
by the closure of T1 for passenger operations in 2015/16.
Our view: further improvements to utilities usage should be possible through
H7 through a focus on energy demand management projects (delivered
through a combination of capex and process improvement).
Note: Commentary on the price effects which are most appropriate to Utilities costs are included in our discussion of Price Inflation as an overarching issue
Source: Steer, December 2019 Operating Cost Benchmarking Study
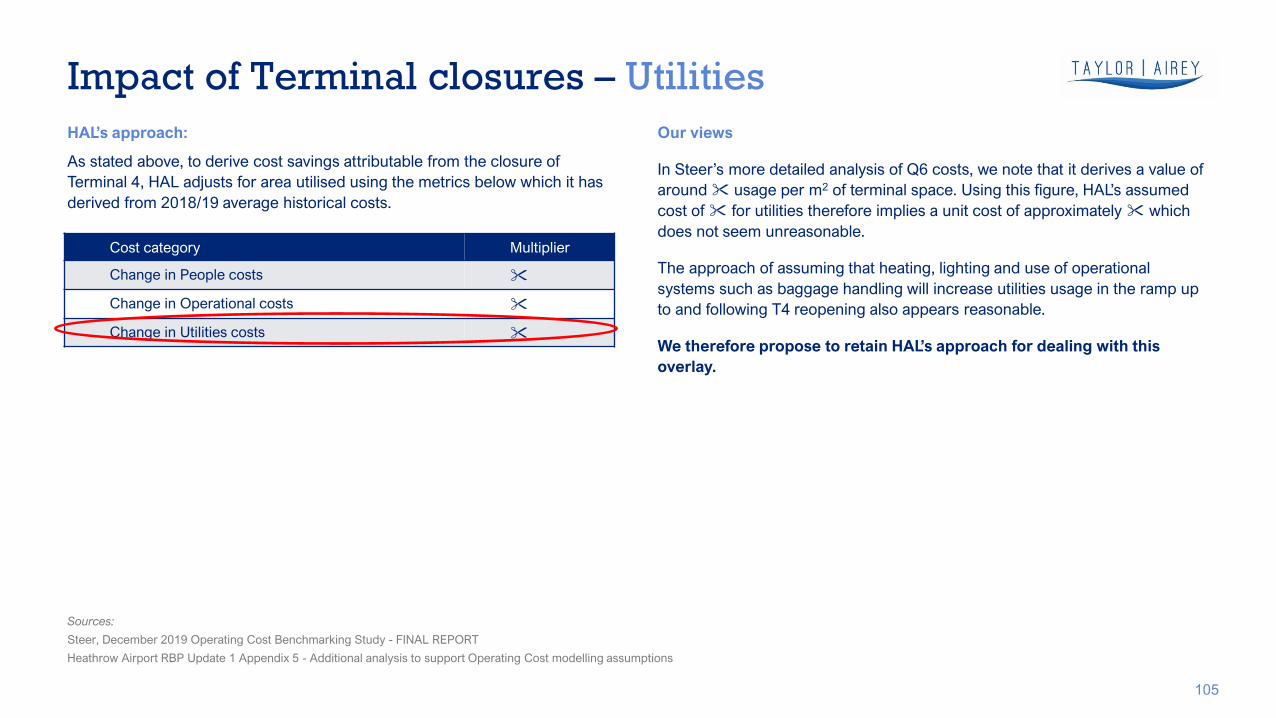
Impact of Terminal closures – Utilities
105
HAL’s approach:
As stated above, to derive cost savings attributable from the closure of
Terminal 4, HAL adjusts for area utilised using the metrics below which it has
derived from 2018/19 average historical costs.
Our views
In teer’s more detailed analysis of Q costs, we note that it derives a value of
around usage per m2 of terminal space. Using this figure, HAL’s assumed
cost of for utilities therefore implies a unit cost of approximately which
does not seem unreasonable.
The approach of assuming that heating, lighting and use of operational
systems such as baggage handling will increase utilities usage in the ramp up
to and following T4 reopening also appears reasonable.
We therefore propose to retain HAL’s approach for dealing with this
overlay.
Cost category Multiplier
Change in People costs
Change in Operational costs
Change in Utilities costs
Sources:
Steer, December 2019 Operating Cost Benchmarking Study - FINAL REPORT
Heathrow Airport RBP Update 1 Appendix 5 - Additional analysis to support Operating Cost modelling assumptions

Utilities: TA Proposals - nominal
106
Utilities costs (HAL mid pax forecasts)
HAL forecast, £m
Difference with TA, £m
Nominal 2022 2023 2024 2025 2026
Baseline, £m 67.1 67.1 67.1 67.1 67.1
Baseline adjustments, £m
(%)
0.0
(0%)
0.0
(0%)
0.0
(0%)
0.0
(0%)
0.0
(0%)
Adjusted baseline, £m 67.1 67.1 67.1 67.1 67.1
Price increase, £m
(%)
5.3
(8%)
6.8
(10%)
8.1
(12%)
10.1
(15%)
14.0
(21%)
Price adj. forecast, £m 72.5 73.9 75.2 77.2 81.1
Volume adjustment, £m
(%)
-14.1
(-19%)
-9.0
(-12%)
-5.7
(-8%)
-4.0
(-5%)
-3.6
(-4%)
Volume adj. forecast, £m 58.4 64.9 69.5 73.2 77.6
Overlay, £m
(%)
-3.5
(-6%)
-1.3
(-2%)
0.0
(0%)
0.0
(0%)
0.0
(0%)
Frontier shift efficiency, £m
(%)
-0.5
(-1%)
-1.3
(-2%)
-2.1
(-3%)
-2.9
(-4%)
-3.8
(-5%)
Final forecast, £m 54.3 62.3 67.5 70.3 73.8 H7
Source: Taylor Airey analysis
The differences between our forecast and the HAL forecast primarily relate to
differing frontier shift assumptions, where we assume a 1% efficiency per
annum, whereas HAL assume a 0.1% efficiency per annum.

Distribution contract costs: HAL’s proposals
2018 RPI prices 2022 2023 2024 2025 2026
2019 start point
Baseline adjustments, £m
Baseline, £m
Volume adjustment, £m
(%)
Volume adj. forecast, £m
Frontier shift, £m
(%)
Efficiency adjusted forecast, £m
One-off impacts, £m
Terminal growth overlays, £m
Final forecast, £m
Distribution contract costs:
Nominal 2022 2023 2024 2025 2026
2019 start point
Baseline adjustments, £m
Baseline, £m
Volume adjustment, £m
(%)
Volume adj. forecast, £m
Frontier shift, £m
(%)
Efficiency adjusted forecast, £m
One-off impacts, £m
Terminal growth overlays, £m
Final forecast, £m
Distribution contract costs:
No volume adjustments made i.e. Distribution contract costs are not forecast
using elasticities.
No efficiencies are applied from a Frontier Shift assumption.
No terminal growth overlay is assumed i.e. no saving in Distribution contract
costs as a result of T4 closure.
Source: Taylor Airey analysis of HAL RBP model Source: Taylor Airey analysis of HAL RBP model
107
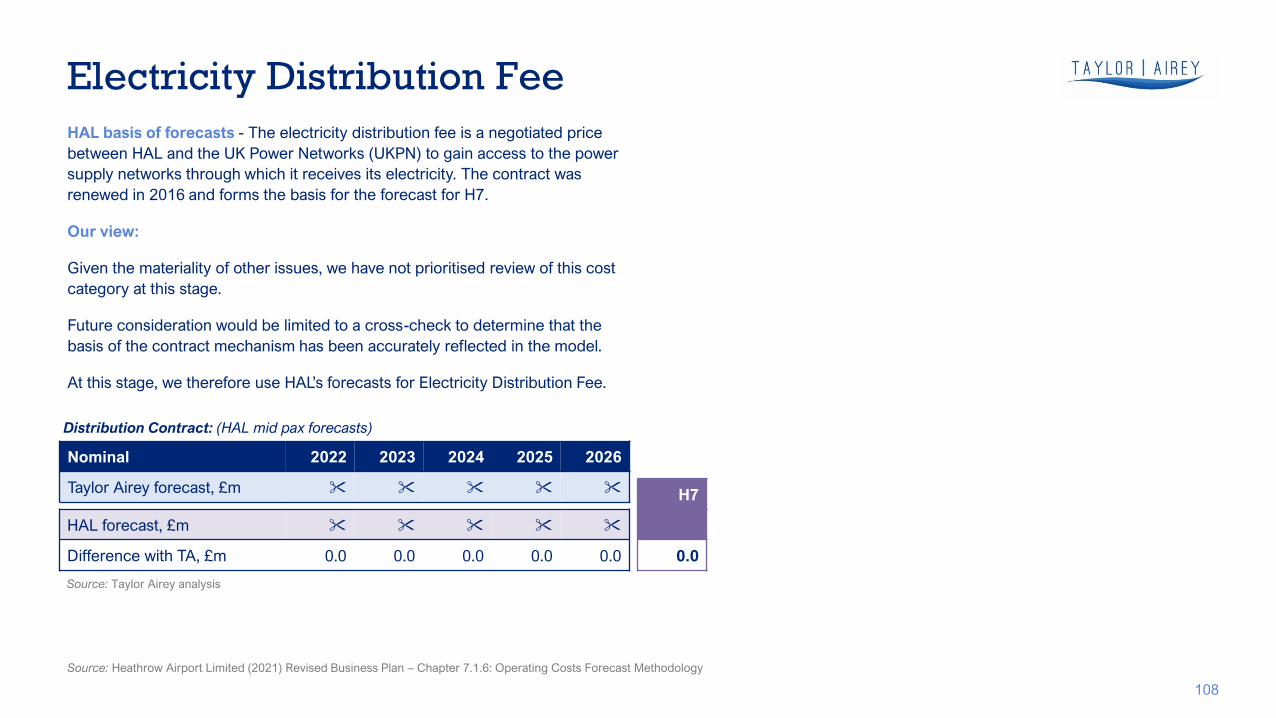
Electricity Distribution Fee
108
HAL basis of forecasts - The electricity distribution fee is a negotiated price
between HAL and the UK Power Networks (UKPN) to gain access to the power
supply networks through which it receives its electricity. The contract was
renewed in 2016 and forms the basis for the forecast for H7.
Our view:
Given the materiality of other issues, we have not prioritised review of this cost
category at this stage.
Future consideration would be limited to a cross-check to determine that the
basis of the contract mechanism has been accurately reflected in the model.
At this stage, we therefore use HAL’s forecasts for Electricity Distribution ee.
Source: Heathrow Airport Limited (2021) Revised Business Plan – Chapter 7.1.6: Operating Costs Forecast Methodology
Distribution Contract: (HAL mid pax forecasts)
HAL forecast, £m
Difference with TA, £m 0.0 0.0 0.0 0.0 0.0
Nominal 2022 2023 2024 2025 2026
Taylor Airey forecast, £m H7
0.0
Source: Taylor Airey analysis
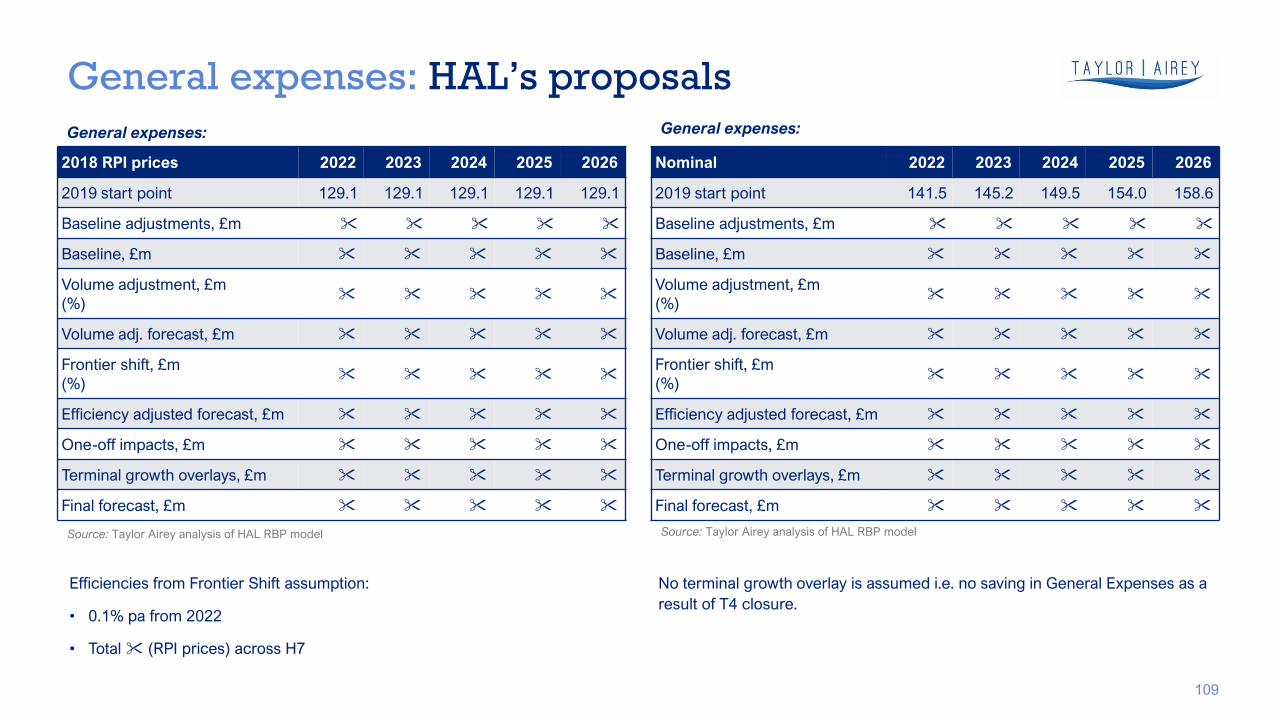
General expenses: HAL’s proposals
2018 RPI prices 2022 2023 2024 2025 2026
2019 start point 129.1 129.1 129.1 129.1 129.1
Baseline adjustments, £m
Baseline, £m
Volume adjustment, £m
(%)
Volume adj. forecast, £m
Frontier shift, £m
(%)
Efficiency adjusted forecast, £m
One-off impacts, £m
Terminal growth overlays, £m
Final forecast, £m
General expenses:
Nominal 2022 2023 2024 2025 2026
2019 start point 141.5 145.2 149.5 154.0 158.6
Baseline adjustments, £m
Baseline, £m
Volume adjustment, £m
(%)
Volume adj. forecast, £m
Frontier shift, £m
(%)
Efficiency adjusted forecast, £m
One-off impacts, £m
Terminal growth overlays, £m
Final forecast, £m
General expenses:
Efficiencies from Frontier Shift assumption:
• 0.1% pa from 2022
• Total (RPI prices) across H7
No terminal growth overlay is assumed i.e. no saving in General Expenses as a
result of T4 closure.
Source: Taylor Airey analysis of HAL RBP model Source: Taylor Airey analysis of HAL RBP model
109

General Expenses
110
There is only limited detail provided in the Heathrow RBP and RBP Update about the constituent
parts of the General Expenses category and their potential trajectory for the forecast H7 period.
However from a supporting spreadsheet1 provided by Heathrow in relation to the Initial Business
Plan (IBP), it would appear that this category covers three elements of costs:
• Consultancy and marketing costs (some of which are capitalised) –2
• Other General Expenses –2
• Intercompany costs –2
The relative sizes of some of the components of these categories are illustrated in the chart
opposite.
Our view: This is a significant cost category which contains elements which could be considered
as ‘discretionary’ spend including marketing and professional consultancy costs. We note that
during dialogue on H7 forecasting, Heathrow have noted that they are avoiding spend on new
consultancy commissions and this is an area they note they have identified as ‘non-essential’ in
their RBP discussion of actions taken in response to the pandemic.
We would expect that some of the short term cost restraint in these categories would be
maintained in H7 as passenger volumes take time to recover – this should be captured as
part of the Frontier Shift efficiency challenge discussed later.
We would also expect Heathrow to disaggregate and provide further detail on the breakdown of
categories labelled “ ther General Costs” and “ ther General Expenses” as these are likely to be
material in the context of H7 total opex.
1. Heathrow spreadsheet “219 2020 Base data in detailed categories – raw data” 2. %s of 2019 forecast General Expenses total at the time of the IBP publication ()
Component parts and relative sizes of costs in the General Expenses
Category

General expenses: TA Proposals - nominal
111
General expenses (HAL mid pax forecasts)
HAL forecast, £m
Difference with TA, £m
Nominal 2022 2023 2024 2025 2026
Baseline, £m 132.4 132.4 132.4 132.4 132.4
Baseline adjustments, £m
(%)
-7.6
(-6%)
-7.6
(-6%)
-7.6
(-6%)
-7.6
(-6%)
-7.6
(-6%)
Adjusted baseline, £m 124.8 124.8 124.8 124.8 124.8
Price increase, £m
(%)
5.3
(4%)
7.7
(6%)
10.3
(8%)
13.0
(10%)
15.8
(13%)
Price adj. forecast, £m 130.1 132.5 135.1 137.8 140.6
Volume adjustment, £m
(%)
-25.3
(-19%)
-16.2
(-12%)
-10.2
(-8%)
-7.2
(-5%)
-6.2
(-4%)
Volume adj. forecast, £m 104.8 116.3 124.9 130.6 134.4
Overlay, £m
(%)
0.0
(0%)
0.0
(0%)
0.0
(0%)
0.0
(0%)
0.0
(0%)
Frontier shift efficiency, £m
(%)
-1.0
(-1%)
-2.3
(-2%)
-3.7
(-3%)
-5.1
(-4%)
-6.6
(-5%)
Final forecast, £m 103.7 114.0 121.2 125.5 127.8 H7
Source: Taylor Airey analysis
Section Three
G. Surface access initiatives
Opex forecasts

Terminal drop-off charge costs arise from the introduction of terminal drop-off charging which is new to HAL's
operation. If terminal drop-off charging revenues are to be included in the forecast, it would therefore be consistent
to include the cost of generating those revenues. Other Surface Access costs appear to be associated with
specific initiatives which could be considered as discretionary. However, these are far less material.
Terminal drop-off charge and surface access overlay
113
Need
Additionality
Efficiency
There is insufficient evidence to determine whether the operational costs associated with terminal drop-off
charging are additional. For example, there may already be an element of operational costs associated with staff
marshalling traffic on the forecourts and this change may just mean that existing staff do their job in a different way.
Without any historical data, it is difficult to determine whether the costs proposed are efficient. Benchmarking with
other airports may be possible but this has not been prioritised at this stage due to the relative scale of this overlay
compared with other cost components.
At this stage we propose to retain the Terminal Drop-off Charge cost overlays suggested by HAL provided it
generates the revenue returns detailed elsewhere in the plan. We expect to undertake further investigation
at the final proposals stage to determine whether the costs proposed are truly efficient and fully
incremental, and would welcome additional evidence from HAL. We have not included other SAS costs as
an overlay as HAL has not provided any clear rationale for their inclusion.

Section Three
H. Frontier shift and input price inflation
Opex forecasts
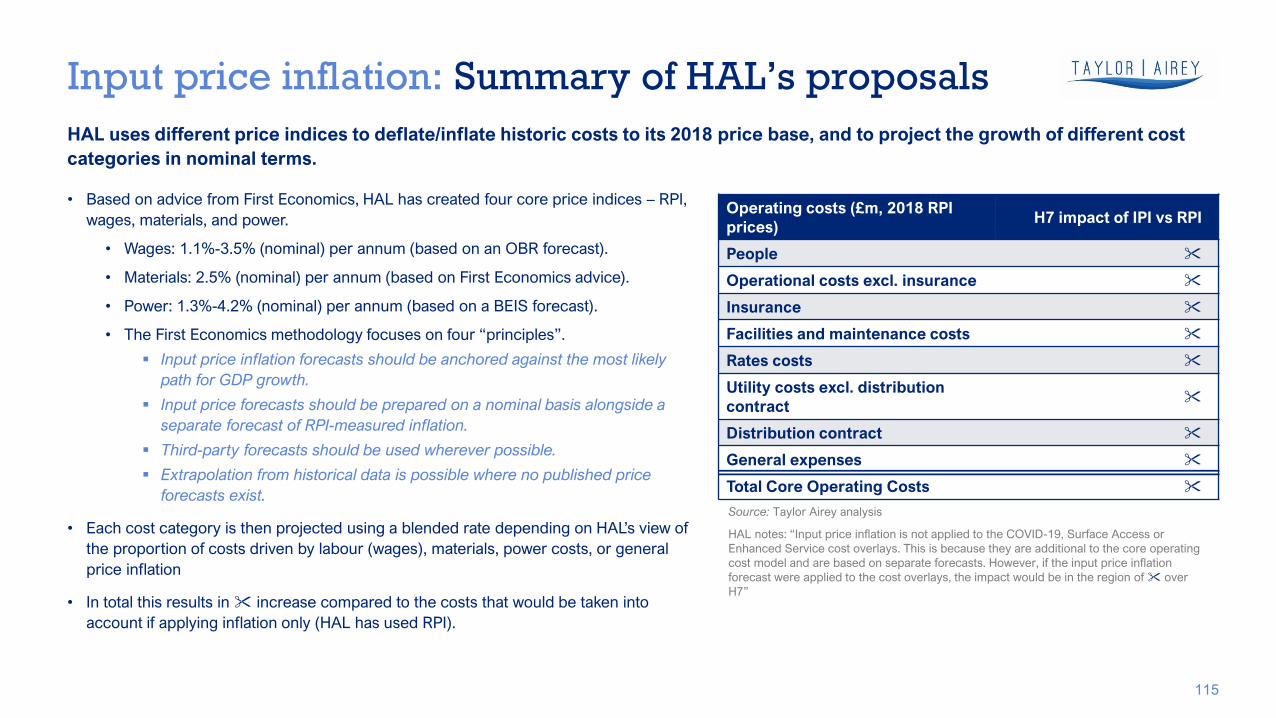
Input price inflation: Summary of HAL’s proposals
115
HAL uses different price indices to deflate/inflate historic costs to its 2018 price base, and to project the growth of different cost
categories in nominal terms.
Operating costs (£m, 2018 RPI
prices)H7 impact of IPI vs RPI
People
Operational costs excl. insurance
Insurance
Facilities and maintenance costs
Rates costs
Utility costs excl. distribution
contract
Distribution contract
General expenses
Total Core Operating Costs
• Based on advice from First Economics, HAL has created four core price indices – RPI,
wages, materials, and power.
• Wages: 1.1%-3.5% (nominal) per annum (based on an OBR forecast).
• Materials: 2.5% (nominal) per annum (based on First Economics advice).
• Power: 1.3%-4.2% (nominal) per annum (based on a BEIS forecast).
• The irst Economics methodology focuses on four “principles”.
▪ Input price inflation forecasts should be anchored against the most likely
path for GDP growth.
▪ Input price forecasts should be prepared on a nominal basis alongside a
separate forecast of RPI-measured inflation.
▪ Third-party forecasts should be used wherever possible.
▪ Extrapolation from historical data is possible where no published price
forecasts exist.
• Each cost category is then projected using a blended rate depending on HAL’s view of
the proportion of costs driven by labour (wages), materials, power costs, or general
price inflation
• In total this results in increase compared to the costs that would be taken into
account if applying inflation only (HAL has used RPI).
Source: Taylor Airey analysis
HAL notes: “Input price inflation is not applied to the C VID-19, Surface Access or
Enhanced Service cost overlays. This is because they are additional to the core operating
cost model and are based on separate forecasts. However, if the input price inflation
forecast were applied to the cost overlays, the impact would be in the region of over
H7”

Input price inflation: Our view of HAL’s overall methodology
116
Generally, the principles outlined by First Economics and applied by HAL are sensible. But, there are some key issues:
• Use of RPI as a measure of general price inflation in the economy.
• As we explain earlier on, RPI is an inappropriate measure of general price inflation in the economy. RPI has a number of shortcomings, as highlighted by
the Office of National Statistics.1
• We recommend the use of CPI instead.
• HAL’s RBP provides limited consideration of which categories may see price changes lower than the general price inflation and there is insufficient consideration
of the extent to which HAL faces input price pressures different from that implied by economy-wide forecasts.
• HAL’s assessment of real price effects has tended to focus on areas where input prices will rise higher than general price inflation, whereas in reality, some
inputs will see prices lower than general price inflation.
• There needs to be a high bar for assuming prices increase over and above inflation for any cost category – the use of a measure for general price inflation
is, by definition, a view on general price effects.
• For some cost categories, such as wages, it is likely that HAL will face less price pressure given the general weakness in the aviation sector. This has not
been considered by HAL.
• We review which categories of cost require an adjustment to reflect real price effects, and we revisit the forecasts used to estimate those.
• No real evidence to suggest that materials inflation will be consistently higher than CPI.
1. (201 ) “ hortcomings of the Retail Prices Index as a measure of inflation”. Accessible at
https://www.ons.gov.uk/economy/inflationandpriceindices/articles/shortcomingsoftheretailpricesindexasameasureofinflation/2018-03-08

Input price inflation: Our view
117
We have followed the decision framework Ofwat applied at PR191 to determine fixed (real) input price inflation allowances, to consider whether it is
appropriate to assume price increases over and above our measure of general price inflation. We have done this at a high-level looking primarily at the
evidence and narrative provided by HAL. As such, some of this is judgement driven rather than being supported by in-depth analysis.
Source: Taylor Airey analysis
1. Ofwat Criteria adapted from https://www.ofwat.gov.uk/wp-content/uploads/2019/01/Supplementary-technical-appendix-Europe-Economics-Frontier-Shift-and-Real-Price-Effects.pdf (Table 0.1).
2. We do not apply a precise materiality threshold, but generally consider costs that make up more than 10% of opex to be material, and between 5% and 10% of opex to be partly so.
Ofwat’s decision criteria People Operational costsFacilities and
MaintenanceUtilities General expenses
Is the cost category a material proportion of total
company costs?2 Yes Yes YesPartly (made up ~6%
of opex in 2019)Yes
Are there compelling reasons to think that [CPI]
does not adequately capture the input price?Yes Unclear Yes Yes
Unlikely – No HAL
analysis provided, but
no clear rationale for
why price pressures
would be higher than
general inflation
Is there a significant likelihood that the value of
the wedge between the input price and [CPI] will
differ substantially from zero over the period of
the price control?
Yes – Can expect
direct labour costs to
differ from CPI
Potential. Unclear on
data from HAL so far.
Yes – Includes large
labour component,
with limited supplier
ability to absorb
Greater price volatilityUnlikely – No evidence
to suggest it would.
Is the input price and exposure to that input price
outside the management control during the
duration of the price control?
Partly
No – mostly contracts
where price increases
can be managed
through negotiations
with suppliers
Partly Partly Yes
Use different price series? Yes No Yes Yes No
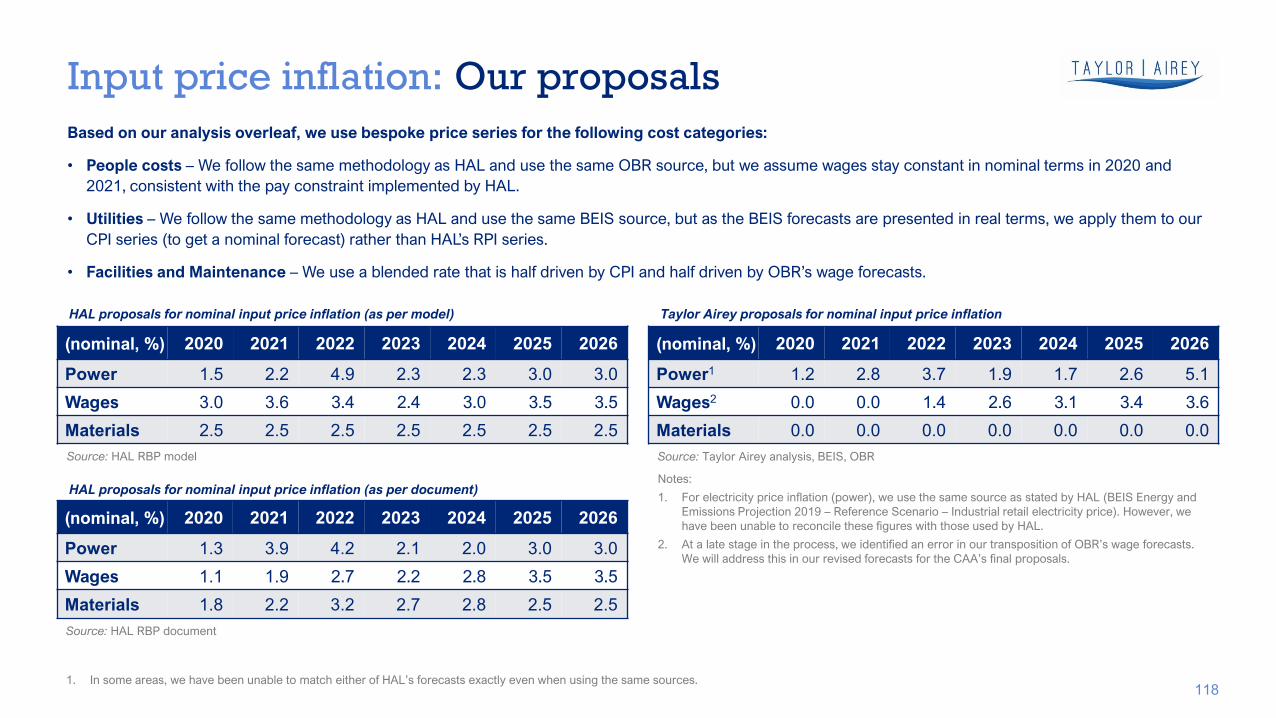
Input price inflation: Our proposals
118
Based on our analysis overleaf, we use bespoke price series for the following cost categories:
• People costs – We follow the same methodology as HAL and use the same OBR source, but we assume wages stay constant in nominal terms in 2020 and
2021, consistent with the pay constraint implemented by HAL.
• Utilities – We follow the same methodology as HAL and use the same BEIS source, but as the BEIS forecasts are presented in real terms, we apply them to our
CPI series (to get a nominal forecast) rather than HAL’s RPI series.
• Facilities and Maintenance – We use a blended rate that is half driven by CPI and half driven by BR’s wage forecasts.
(nominal, %) 2020 2021 2022 2023 2024 2025 2026
Power 1.5 2.2 4.9 2.3 2.3 3.0 3.0
Wages 3.0 3.6 3.4 2.4 3.0 3.5 3.5
Materials 2.5 2.5 2.5 2.5 2.5 2.5 2.5
HAL proposals for nominal input price inflation (as per model)
(nominal, %) 2020 2021 2022 2023 2024 2025 2026
Power1 1.2 2.8 3.7 1.9 1.7 2.6 5.1
Wages2 0.0 0.0 1.4 2.6 3.1 3.4 3.6
Materials 0.0 0.0 0.0 0.0 0.0 0.0 0.0
Taylor Airey proposals for nominal input price inflation
1. In some areas, we have been unable to match either of HAL’s forecasts exactly even when using the same sources.
(nominal, %) 2020 2021 2022 2023 2024 2025 2026
Power 1.3 3.9 4.2 2.1 2.0 3.0 3.0
Wages 1.1 1.9 2.7 2.2 2.8 3.5 3.5
Materials 1.8 2.2 3.2 2.7 2.8 2.5 2.5
HAL proposals for nominal input price inflation (as per document)
Source: HAL RBP model
Source: HAL RBP document
Source: Taylor Airey analysis, BEIS, OBR
Notes:
1. For electricity price inflation (power), we use the same source as stated by HAL (BEIS Energy and
Emissions Projection 2019 – Reference Scenario – Industrial retail electricity price). However, we
have been unable to reconcile these figures with those used by HAL.
2. At a late stage in the process, we identified an error in our transposition of BR’s wage forecasts.
We will address this in our revised forecasts for the CAA’s final proposals.
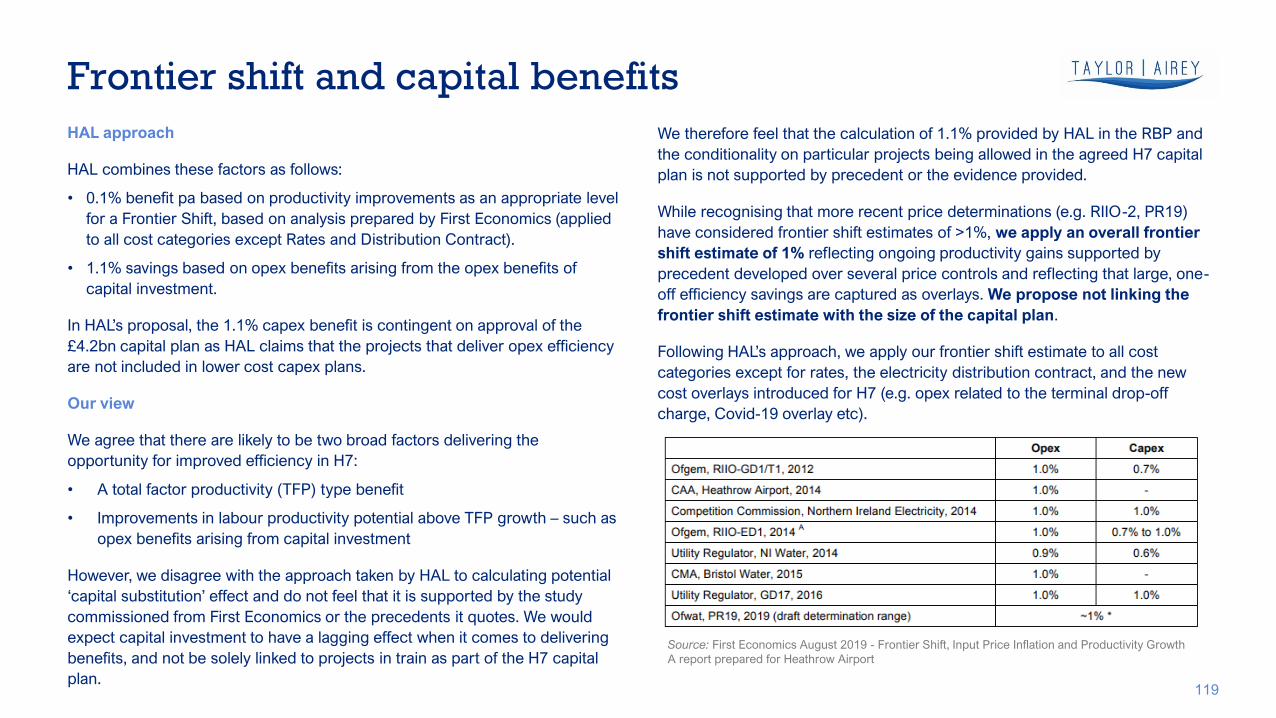
Frontier shift and capital benefits
119
HAL approach
HAL combines these factors as follows:
• 0.1% benefit pa based on productivity improvements as an appropriate level
for a Frontier Shift, based on analysis prepared by First Economics (applied
to all cost categories except Rates and Distribution Contract).
• 1.1% savings based on opex benefits arising from the opex benefits of
capital investment.
In HAL’s proposal, the 1.1 capex benefit is contingent on approval of the
£4.2bn capital plan as HAL claims that the projects that deliver opex efficiency
are not included in lower cost capex plans.
Our view
We agree that there are likely to be two broad factors delivering the
opportunity for improved efficiency in H7:
• A total factor productivity (TFP) type benefit
• Improvements in labour productivity potential above TFP growth – such as
opex benefits arising from capital investment
However, we disagree with the approach taken by HAL to calculating potential
‘capital substitution’ effect and do not feel that it is supported by the study
commissioned from First Economics or the precedents it quotes. We would
expect capital investment to have a lagging effect when it comes to delivering
benefits, and not be solely linked to projects in train as part of the H7 capital
plan.
We therefore feel that the calculation of 1.1% provided by HAL in the RBP and
the conditionality on particular projects being allowed in the agreed H7 capital
plan is not supported by precedent or the evidence provided.
While recognising that more recent price determinations (e.g. RIIO-2, PR19)
have considered frontier shift estimates of >1%, we apply an overall frontier
shift estimate of 1% reflecting ongoing productivity gains supported by
precedent developed over several price controls and reflecting that large, one-
off efficiency savings are captured as overlays. We propose not linking the
frontier shift estimate with the size of the capital plan.
ollowing HAL’s approach, we apply our frontier shift estimate to all cost
categories except for rates, the electricity distribution contract, and the new
cost overlays introduced for H7 (e.g. opex related to the terminal drop-off
charge, Covid-19 overlay etc).
Source: First Economics August 2019 - Frontier Shift, Input Price Inflation and Productivity Growth
A report prepared for Heathrow Airport

Section Three
I. Capital Investment
Opex forecasts
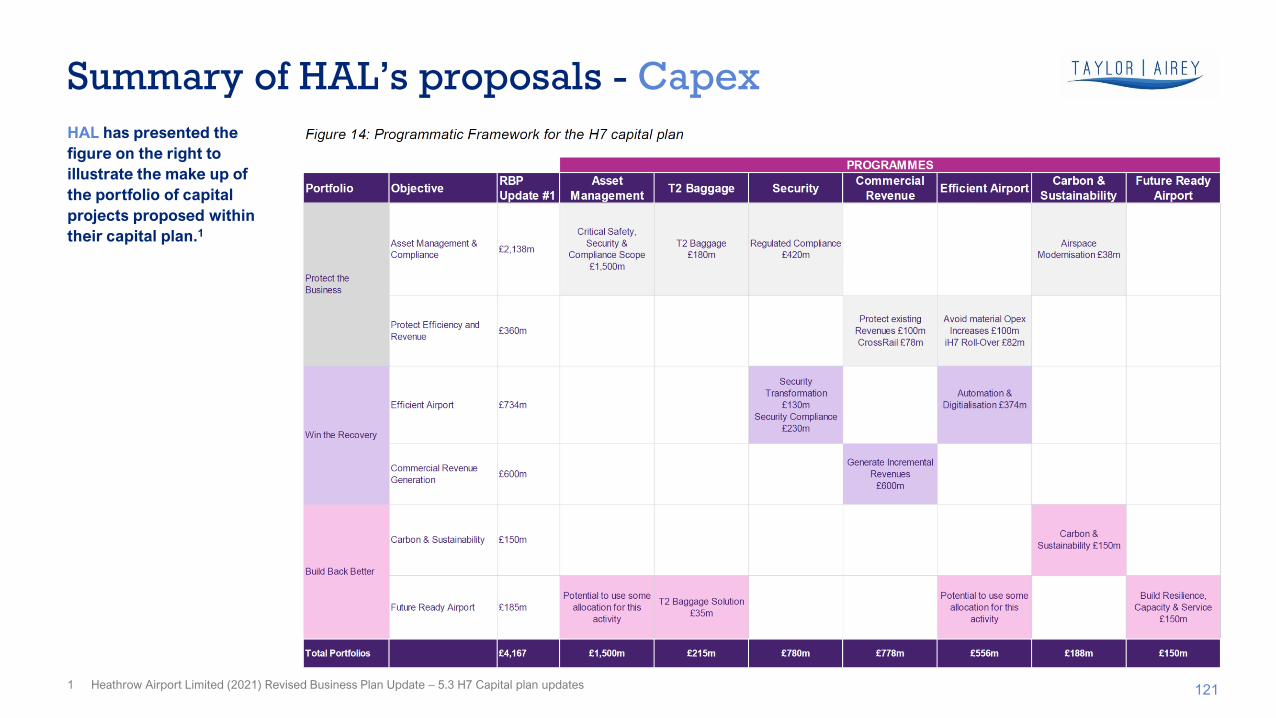
Summary of HAL’s proposals - Capex
121
HAL has presented the
figure on the right to
illustrate the make up of
the portfolio of capital
projects proposed within
their capital plan.1
1 Heathrow Airport Limited (2021) Revised Business Plan Update – 5.3 H7 Capital plan updates

Opex benefits from capital investment HAL’s view
122
HAL proposes two alternative capital plans; a ‘Safety Only’ plan (£ . bn)
and an ‘Optimal Plan’ (£ . bn)1.
It suggests that opex efficiency benefits only arise from two programmes, the
Security Transformation and Efficient Airport Programme. Both of these are
only included in the Optimal capital plan and not the Safety Only capital plan.
Example initiatives that these programmes could deliver include:2
Further, HAL claims that the impact on passenger charge for the difference
between investment in the Safety Only and Optimal capex plans would be
entirely offset by the potential benefits from opex efficiency (1.2% pa of opex),
as well as delivering benefits in Commercial Revenues.
Overleaf we consider the logic of these claims and the potential for opex
benefits to arise from other elements of the Capital Plan. We have included a
specific discussion on the Security Transformation elements of the proposed
capita investment in the People costs section of this report.
1 Heathrow Airport Limited (2021) Revised Business Plan Update – 5.3 H7 Capital plan updates
2 Heathrow Airport Limited (2021) Revised Business Plan Update – 5.4 H7 Operating Cost updates
Initiative Potential benefit
Changes to security
processes, including
algorithms and Centralised
Image Processing
Higher flow rates per security lane, as well as a faster
and more pleasant experience for passengers.
Automation of the airfield Airport and airline efficiencies from safely operating the
airfield while also increasing throughput and resilience
by eliminating human error.
Automation of baggage
systems
Opportunities to drive operational efficiencies in the safe
operation of the baggage systems, while also increasing
throughput and resilience by eliminating human error.
Changes to renewable
energy supply
Reduction in total utility costs of operating the airport as
well as enabling HAL to meaningfully decarbonise in H7.
Source: HAL

Opex benefits from capital investment: Our view
123
The ‘ afety nly’ capital plan delivers a portfolio of projects under the
banner Protect the Business with two objectives:
• Asset management and compliance (£2.138bn)
• Protect efficiency and revenue (£0.36bn)
Our view is that there are likely to operating cost benefits arising
from programmes in this plan – we disagree with HAL’s view that
opex benefits are only possible with the Optimal capital plan.
Having considered the additional detail provided on the rationale and
prioritisation of these programmes provided by the RBP Update, we
suggest that benefits are likely to be delivered by the following
programmes in the Safety Only capital plan:
• Asset replacement (£1.5bn)
• T2 Baggage (£0.18bn)
• Regulated Compliance (£0.42bn)
• Avoid material Opex increases (£0.1bn)
We understand that the primary objective of this part of the capital portfolio is to
deliver on mandatory requirements rather than enhance the asset base. In principle
however, the replacement of end-of-life assets with newer, modern equipment with
greater reliability would be expected to reduce the amount of time and resource
required for planned and corrective maintenance with a positive benefit on the
Facilities and Maintenance opex category.
Around 60% of the investment proposed in this plan is under the heading of Asset
Replacement (£1.5bn). In this section of the RBP Update1, HAL considers that a
further £400m could have been added to the Asset Replacement budget. However, as
a mitigation for not including this, it refers to the unsubstantiated potential need for,
“…a 10% uplift in maintenance opex to allow for increased maintenance regimes
across the airport (which) could extend the life of assets and help to mitigate against
assets being out of service…”.
As HAL considers the downside risk of increased opex due to lower capital
spend on asset replacement there is clearly a link between capex and opex. It is,
therefore, inconsistent that HAL does not consider the upside opportunity for
opex reduction arising from a considerable investment in new and more
resilient assets.
We therefore conclude that HAL must include opex benefits, for example in
Facilities and Maintenance costs, arising from other parts of the capex portfolio,
even in the Safety Only plan.1 Heathrow Airport Limited (2021) Revised Business Plan Update – 5.3 H7 Capital plan updates
We conclude that HAL should consider whether opex benefits, for example in Facilities and Maintenance costs, arise from other parts of the
capex portfolio, even in the Safety Only capital plan.

Section Three
J. Overall results
Opex forecasts
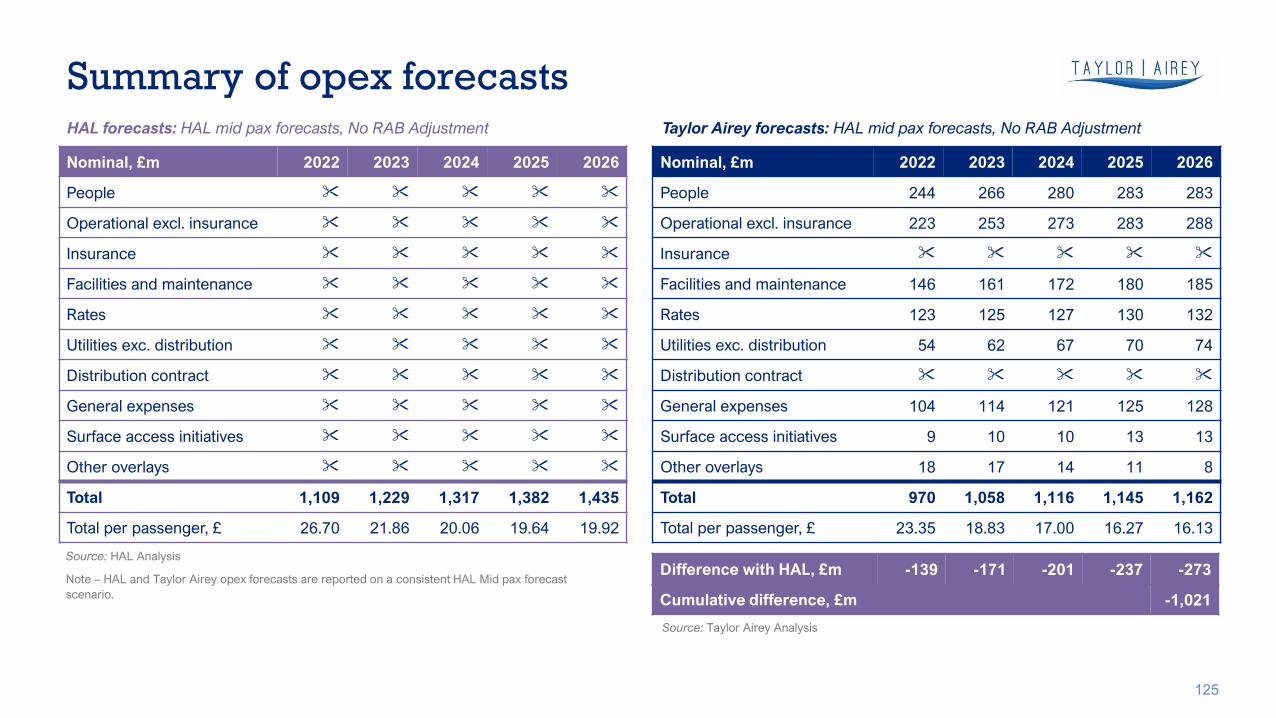
Summary of opex forecasts
125
HAL forecasts: HAL mid pax forecasts, No RAB Adjustment Taylor Airey forecasts: HAL mid pax forecasts, No RAB Adjustment
Nominal, £m 2022 2023 2024 2025 2026
People 244 266 280 283 283
Operational excl. insurance 223 253 273 283 288
Insurance
Facilities and maintenance 146 161 172 180 185
Rates 123 125 127 130 132
Utilities exc. distribution 54 62 67 70 74
Distribution contract
General expenses 104 114 121 125 128
Surface access initiatives 9 10 10 13 13
Other overlays 18 17 14 11 8
Total 970 1,058 1,116 1,145 1,162
Total per passenger, £ 23.35 18.83 17.00 16.27 16.13
Difference with HAL, £m -139 -171 -201 -237 -273
Cumulative difference, £m -1,021
Nominal, £m 2022 2023 2024 2025 2026
People
Operational excl. insurance
Insurance
Facilities and maintenance
Rates
Utilities exc. distribution
Distribution contract
General expenses
Surface access initiatives
Other overlays
Total 1,109 1,229 1,317 1,382 1,435
Total per passenger, £ 26.70 21.86 20.06 19.64 19.92
Source: HAL Analysis
Note – HAL and Taylor Airey opex forecasts are reported on a consistent HAL Mid pax forecast
scenario.
Source: Taylor Airey Analysis

Summary of opex forecasts
126
HAL forecasts: HAL mid pax forecasts, No RAB Adjustment Taylor Airey forecasts: HAL mid pax forecasts, No RAB Adjustment
2018 RPI, £m 2022 2023 2024 2025 2026
People 224 238 245 240 233
Operational excl. insurance 204 227 238 240 237
Insurance
Facilities and maintenance 134 145 151 152 152
Rates 113 112 111 110 109
Utilities exc. distribution 50 56 59 60 61
Distribution contract
General expenses 95 102 106 106 105
Surface access initiatives 8 9 9 11 10
Other overlays 17 15 12 10 7
Total 891 949 974 971 957
Total per passenger, £ 21.44 16.89 14.84 13.80 13.28
Difference with HAL, £m -121 -144 -163 -188 -211
Cumulative difference, £m -827
2018 RPI, £m 2022 2023 2024 2025 2026
People
Operational excl. insurance
Insurance
Facilities and maintenance
Rates
Utilities exc. distribution
Distribution contract
General expenses
Surface access initiatives
Other overlays
Total 1,012 1,093 1,137 1,159 1,168
Total per passenger, £ 24.36 19.44 17.32 16.46 16.21
Source: HAL Analysis
Note – HAL and Taylor Airey opex forecasts are reported on a consistent HAL Mid pax forecast
scenario.
Source: Taylor Airey Analysis

0
1,000
2,000
,000
,000
,000
,000
Comparison of HAL and TA opex forecasts by category
127
Waterfall chart of Taylor Airey initial forecasts vs. HAL Updated RBP, total for H7 (£m, 2018 RPI)
Upwards adjustment
Downwards adjustment
Initial forecasts are a
cumulative difference of
£827m or 15% gap to
the HAL Updated RBP
Source: Taylor Airey analysis
Note: HAL and Taylor Airey opex forecasts are reported on a consistent HAL Mid pax forecast scenario except for the final waterfall step which uses the CAA Mid pax forecast scenario.
When we use CAA’s
Mid pax forecasts, the
cumulative difference
falls to £693m or 12%.
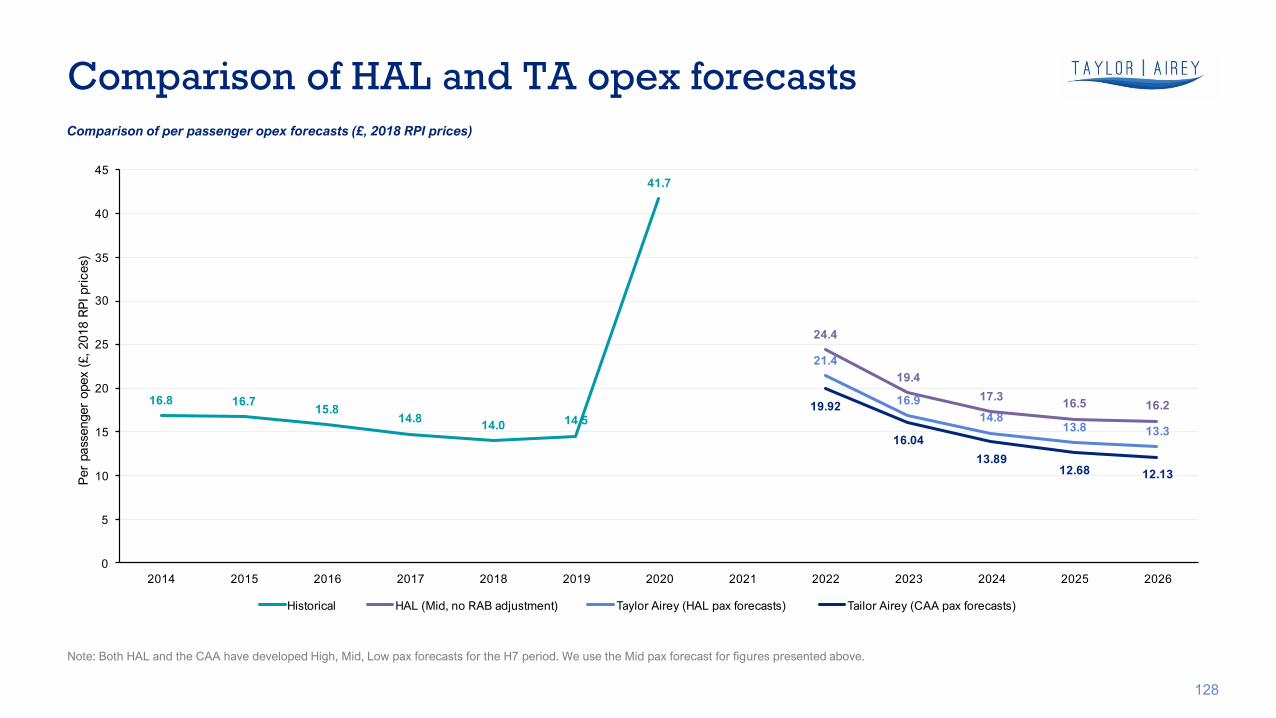
Comparison of HAL and TA opex forecasts
128
Comparison of per passenger opex forecasts (£, 2018 RPI prices)
Source: Taylor Airey analysis
Note: Both HAL and the CAA have developed High, Mid, Low pax forecasts for the H7 period. We use the Mid pax forecast for figures presented above.
. . .
. . .
.
.
.
. . .
.
.
. . .
.
.
. . .
0
10
1
20
2
0
0
201 201 201 2017 201 2019 2020 2021 2022 202 202 202 202
Per passenger opex ( , 201 RPI prices)
Historical HAL (Mid, no RAB adjustment) Taylor Airey (HAL pax forecasts) Tailor Airey (CAA pax forecasts)

Total opex: Scenario comparison
129
HAL’s opex forecasts under different scenarios Taylor Airey’s opex forecasts under different CAA passenger forecast
scenarios
2018 RPI, £m 2022 2023 2024 2025 2026 H7
High 946 1,005 1,033 1,033 1,019 5,036
Mid 909 966 1,000 1,006 995 4,876
Low 791 849 904 932 952 4,429
2018 RPI, £m 2022 2023 2024 2025 2026 H7
High, no RAB adjustment 1,046 1,126 1,168 1,187 1,194 5,721
Mid, no RAB adjustment 1,012 1,093 1,137 1,159 1,168 5,569
Low, no RAB adjustment 917 975 1,027 1,090 1,126 5,135
High, RAB adjustment 1,068 1,139 1,170 1,178 1,174 5,728
Mid, RAB adjustment 1,033 1,105 1,139 1,150 1,148 5,575
Low, RAB adjustment 912 964 1,009 1,064 1,092 5,040
Source: HAL analysis
Source: Taylor Airey analysis

Per passenger opex: Scenario comparison
130
2018 RPI, £ 2022 2023 2024 2025 2026
High, no RAB adjustment 20.57 17.28 15.94 15.36 15.22
Mid, no RAB adjustment 24.36 19.44 17.32 16.46 16.21
Low, no RAB adjustment 62.88 31.24 21.91 19.72 18.48
High, RAB adjustment 20.21 16.81 15.37 14.67 14.40
Mid, RAB adjustment 23.93 18.92 16.70 15.72 15.34
Low, RAB adjustment 60.18 29.72 20.72 18.53 17.24
HAL’s opex forecasts under different scenarios Taylor Airey’s revenue forecasts under different CAA passenger forecast
scenarios
2018 RPI, £ 2022 2023 2024 2025 2026
High 17.47 14.48 12.90 11.99 11.54
Mid 19.92 16.04 13.89 12.68 12.13
Low 42.25 23.42 16.40 14.68 13.44
Source: HAL analysis
Source: Taylor Airey analysis
A. Efficiency of 2019 figures as a baseline
B. Elasticities
C. Retail
D. Surface access
E. Property
F. Other non-aeronautical revenues
G. Cargo
H. Capital investment
I. Overall results
Section Four
Commercial revenue forecasts
Section Four
A. Efficiency of 2019 figures as a baseline
Commercial revenue forecasts

Views on HAL’s efficiency in 2019
133
HAL claims in their RBP that 2019 presents an efficient baseline from
which to project future commercial revenues.1 It commissioned two
consultancy studies to support their claim:
• KPMG undertook an econometric benchmarking study that concluded that
HAL was at the efficiency frontier in 2018.2
• A benchmarking study by Pragma came to similar conclusions.3
Taylor Airey (on behalf of airlines) found that HAL’s performance
exceeded CAA forecasts, and are higher than comparator airports, but
expresses some concern regarding HAL’s analysis:4
• There was a variation in performance between different categories of
revenue, which Taylor Airey argues needs to be explored further.
• It questioned the choice of comparators in Pragma’s analysis and
suggested that most of HAL’s outperformance could be explained by a more
favourable passenger mix.
• It also argued there was insufficient detail provided in KPMG’s analysis to
properly scrutinise its robustness. In particular, it noted that significant
variation is observed in the revenue time series, especially for property
revenues, which was unexplained.
SDG (on behalf of the CAA) reviewed HAL’s commercial revenues
performance in 2017.5 It found that:
• In 2015, HAL was ahead of UK and global peers for overall commercial
revenue generation.
• In retail, HAL was ahead of its peers though slightly behind Gatwick Airport
for catering.
• For car parking, HAL was ahead of its peers with the exception of the
Manchester Airport Group airports.
• For property, HAL was generally ahead of its peers.
1. Heathrow Airport Limited (2021) Revised Business Plan – Chapter 7: Commercial Revenues
2. KPMG (2019) Airport Commercial Revenue Efficiency Benchmarking Report for Heathrow Airport
Limited
3. Pragma (2019) Heathrow Airport Limited: Commercial Benchmarking 2019
4. Taylor Airey (2020) Heathrow H7 Commercial Revenues review Final Report – Executive Summary
5. Steer Davies Gleave (2017) Heathrow Airport – Review of Commercial Revenues
The general consensus view is that HAL has historically outperformed its competitors in relation to commercial revenue generation.
However, there is disagreement as to whether HAL’s performance in 2019 remains at the efficiency frontier for all subcategories of revenue.

Commercial revenues 2014 2015 2016 2017 2018 2019
Total (£m, nominal) 778.9 828.3 880.4 929.3 986.3 994.7
Total (£m, 2018 CPI) 824.8 877.2 925.8 951.8 986.3 977.1
Per passenger (nominal) 10.6 11.0 11.6 11.9 12.3 12.3
Per passenger (£, 2018 CPI) 11.2 11.7 12.2 12.2 12.3 12.1
HAL commercial revenues over Q6 (2014-2019)
CEPA’s views on HAL’s efficiency in 2019
134
As shown in the chart on the right, HAL’s per passenger revenues in
were broadly similar to what they were in 2015. The key question is whether
this stagnation in performance now means HAL is no longer at the efficiency
frontier for commercial revenue generation.
We have some concerns with the KPMG analysis commissioned by HAL:
• Our key concern, as aired previously in our work for the LACC, is that the
econometric benchmarking does not show (as is claimed by KPMG and HAL)
that HAL operated at the efficiency frontier by 2019. Instead it shows HAL’s
change in relative performance, over the period assessed. In other words,
it shows whether, over the period assessed, HAL has improved by more than
its peers or by less than its peers.
• We also share Taylor Airey’s concern about the lack of transparency around
the methodology. BUT, the KPMG analysis does find that HAL’s relative
performance improved over the period 2015-2018 for retail and car parking,
with property being the one exception.
This suggests that HAL’s overall commercial revenues are likely to have been
efficient in 2018, though there may have been scope for more revenue
generation in 2019 particularly in property. At this stage we have not
proposed any efficiency adjustments.
We accept the starting assumption that HAL’s performance in 201 was at the efficiency frontier, based on DG’s previous analysis for the
CAA. Beyond 201 , we see that HAL’s ability to grow revenue has stagnated but probably not enough for it to now be materially inefficient.
HAL commercial revenues over Q6 (2014-2019)
Source: CEPA analysis of HAL regulatory accounts, statutory accounts and RBP model
Source: CEPA analysis of HAL regulatory accounts, statutory accounts and RBP model
9
100
10
110
11
120
12
1 0
201 201 201 2017 201 2019
Index (201 100)
Total ( ominal) Total (201 CPI) Per passenger (201 CPI)

Section Four
B. Elasticities
Commercial revenue forecasts

Summary of HAL’s elasticity proposals
136
Area HAL1 KPMG2 Frontier3 Discussion
Retail revenue with respect to
passenger numbers
HAL refers to rontier Economics’ analysis showing a strong relationship between
passenger numbers and retail revenue. It also claims the elasticity estimate includes the
‘management challenge’, using the Pragma study4 to argue that HAL’s historic performance
is the best indicator of the size of the management challenge.
Property revenue with respect to
total utilised terminal space
The source of the elasticity estimate is not explained. HAL previously used passenger
numbers as a revenue driver but changed to using terminal space following the
constructive engagement process.
Car parking / rental revenue with
respect to car parking / rental
passengers
HAL refers to the KPMG benchmarking evidence of a ‘potential’ relationship between
passenger numbers and revenue. Frontier Economics warned of past experience being a
poor estimator of the future, and found less car parking revenue for each additional
percentage point of international passengers.
Heathrow Express (HEx)
revenue with respect to HEx
passengers
Neither benchmarking exercise found a robust relationship. HAL claims it would like to
maintain the yield per passenger throughout the period, though separate overlays have
been applied to account for reduction in yield and passenger volumes due to the pandemic
and Crossrail.
Other income (services) with
respect to passenger numbers
o evidence has been provided in support of HAL’s elasticity estimate.
1. HAL RBP Tables 3 and 10
2. KPMG (2019) Airport Commercial Revenue Efficiency Benchmarking Report for Heathrow Airport
Limited
3. Frontier Economics (2019) Developing opex and commercial revenue elasticities for H7
4. Pragma (2019) Heathrow Airport Limited: Commercial Benchmarking 2019
5. Frontier Economics estimated an elasticity of for total surface access revenue with respect to
passengers but notes “given the expected changes to these factors during H7, we would exercise
caution in producing a forecast using the elasticity estimate”
HAL has used a mixture of econometric analysis and judgement to inform its choice of revenue drivers and elasticities.
Revenue elasticities: HAL’s choice of key revenue drivers and associated elasticity estimates

Management challenge
137
The management challenge reflects the year-on-year improvement in Heathrow management’s ability to increase revenue over and
above passenger growth (or other revenue drivers).
• HAL claims that their elasticity estimate for retail revenue w.r.t passengers includes an estimate for the management challenge. It does not
explicitly make any claims regarding the management challenge for the other categories of revenue.
• There is no particular reason why a management challenge should not apply to other revenue categories (such as surface access), and as we
note later in this report, there are specific capex and other management initiatives aimed at increasing revenues in these areas.
• For retail specifically, it is not appropriate to bundle the management challenge and elasticity estimates together, as they are two distinct
concepts. Management ability to grow revenue per passenger is independent of changes in passenger volumes.
• The management challenge is to address a range of areas that the airport can strategically address regardless of passenger growth,
• For H7 in particular, passenger volumes are declining relative to 2019 and as such, the elasticity driven forecast is working in the opposite
direction to the management challenge. There is no logical reason to expect Heathrow management’s ability to drive revenue growth
(over and above volume-related drivers) would reverse when passenger volumes decline.
• As a result we recommend a management challenge of % per annum as recommended in our review of HAL’s proposals for iH :
• Between 200 and 2017, HAL’s per passenger commercial revenues increased by roughly per annum in real terms. or iH7, we
proposed a management challenge of 2 per annum as the mid point between HAL’s proposed 1 and the historic trend.
• We see this 2% estimate as capturing several factors:
▪ All the mitigations against the downside step changes assumed in our forecasts (e.g. the mitigation against the retail tax changes)
▪ Returns from recent capital investments aimed at increasing revenue generation
▪ Our switch from RPI indexation for future revenues to CPI indexation
HAL claims their retail elasticity estimate is inclusive of a management challenge and, therefore, no separate adjustment is required. It also
does not propose a management challenge allowance for any of the other revenue categories. We disagree with this and propose a
separate adjustment.
Management
challenge
137

Retail elasticity
138
• HAL has proposed an elasticity of for forecasting retail volumes with respect to passenger numbers, drawing on econometric analysis
undertaken by Frontier Economics.
• As discussed on the previous slide, we do not think it is appropriate to include an allowance for management challenge within the elasticity
estimate. There is a risk of an upward bias to HAL’s elasticity estimate if there is a positive correlation between growth in passenger volumes and
the management challenge.
• However, we note that Frontier Economics estimated the retail elasticity using month-on-
month changes in retail revenues and passenger volumes (as shown in the chart on the right).
And as passenger numbers do decline in this month-on-month series, the correlation with
management challenge (which we assume grows with time) is weaker.
• We conclude that there is a small risk of upward bias to the elasticity estimate of , but
have chosen not to make an adjustment for this in our initial forecasts.
• Nevertheless, we recommend that HAL re-estimates the elasticity while stripping out the
effect of the management challenge, either with the addition of a time variable, or through an
ex-ante adjustment to the retail revenue time series. We also consider it inappropriate to use
retail revenues expressed in 2018 RPI prices – and instead recommend deflating using CPI.
HAL’s inclusion of the management challenge within its retail elasticity figure creates an upward bias to the estimate of the pure retail
elasticity. We have not adjusted HAL’s retail elasticity estimate, but we expect this may need to be reviewed for our final forecasts.
Retail
elasticity
• HAL does not assume any elasticity for bureaux revenue with respect to any cost driver.
• We suspect this may be because historically, HAL’s concession income from Travelex has been on a fixed price basis.
• Nevertheless, we understand that this is unlikely to be the case going forwards. As a result, we consider not applying a passenger driven
elasticity to be counterintuitive, and propose extending the retail elasticity of to cover bureaux income as well.Bureaux
elasticity
138

Property elasticity
139
HAL has proposed an elasticity of for property revenue with
respect to utilised terminal space. But this is not supported by
any evidence.
• No evidence or rationale has been provided to support this figure
or to support the use of terminal space as a revenue driver.
• either of HAL’s consultant reports found a strong relationship
between property revenues and logical drivers such as
passengers, terminal space, etc.
• Therefore, we cannot conclude that the elasticity estimate is
valid or appropriate
We do not have access to enough information to develop a robust
alternative assumption. But based on the evidence we do have,
we assume an elasticity of 0.25 with respect to utilised terminal
space.
• Rather than using top-down elasticities unsupported by any
evidence, a more bottom-up approach would be more appropriate
(i.e. considering the property portfolio and estimating the extent to
which different building blocks of the portfolio are driven by
terminal space or passenger volumes).
• We propose an elasticity of 0.25 – this is to reflect that a certain
proportion of HAL’s property revenues may be driven by utilised
terminal space (such as airport lounges) but a large proportion is
likely to be unaffected (e.g. office space, hotels, ground handler
accommodation).
• The chart below (provided to Taylor Airey by HAL) shows a
breakdown of property contracts by segment. We assume
revenues by segment broadly match the number of contracts
in each segment.
• We also assume roughly half the airline contracts relate to
lounges.
Property
elasticity
Source: Taylor Airey analysis of HAL data

Other elasticities
140
HAL has proposed an elasticity of with respect to car parking/rental passengers. KPMG gave a range of with respect to total
passengers, while Frontier did not make a recommendation.
In the absence of robust econometric evidence, we are content with the proposal of – the implicit assumption being that the
marginal passenger yields as much revenue as the average passenger. We then separately consider the impact of COVID-19 on
average yields.
Car parking/rental
revenue
Heathrow Express
revenue
Other service revenue
HAL has proposed an elasticity of with respect to HEx passengers. Neither KPMG nor Frontier had suggested any values.
As the impact on yields as a result of COVID-19 and the introduction of Crossrail services is dealt with separately, an elasticity
estimate of is logical. As a result, we accept the elasticity estimate on that basis.
HAL has proposed an elasticity of with respect to passenger numbers. Neither KPMG nor Frontier had suggested any values. This
revenue category is defined by HAL as including “commercial revenue from activities not captured by the other categories such as
advertising revenue, Fast Track Income, VIP Charges or aviation fuel.”1
An elasticity of is likely to be an overestimate:
• Advertising revenue is unlikely to be affected on a one-for-one basis by passenger volumes.
• As ATM volumes have not declined as much as passenger volumes, sales of aviation fuel are also unlikely to have a direct one-for-
one relationship with passenger volumes.
As a result, we propose an elasticity of 0.8 – as we had assumed in iH7. For comparison, HAL had proposed an elasticity of for this
category of revenue in their iH7 proposals.
1. HAL RBP Page 51 – However, we note that in subsequent engagement with HAL, we have had confirmation that advertising is captured within the Retail revenue category

Section Four
C. Retail
Commercial revenue forecasts

Summary of HAL’s narrative supporting their retail forecasts
142
Retail tax changes
HAL assumes the impact of the various tax changes will reduce retail revenues by
in 2022 relative to 2019, falling to in 2026 (previously a uniform reduction in
the December 2020 RBP). The tax changes can be broadly split into three categories:
• The loss of airside tax free pricing, which will lead to:
• A reduction in retail concession income from store closures (mostly luxury and fashion,
technology and duty-free);
• Less retail concession income from retailers who choose to absorb the additional VAT in
return for lower concession rates;
• Lost sales due to the passenger response to price increases, leading to a loss in
concession income.
• The removal of the VAT RES scheme, which will lead to:
• Lost concession income from Travelex who process VAT Refunds; and
• An indirect loss in revenue from retail sales that are made by passengers using the cash
they receive from VAT refunds
• The extension of excise duty relief on alcohol and tobacco to EU passengers, which will lead
to higher duty free income.
Bureaux
HAL assumes
a decline
in bureaux income
relative to 2019.
This is based on a
decline in currency
exchange transactions
affecting the
renegotiation of the
Travelex contract.
HAL has presented retail as being an area subject to a series of headwinds – an unfavourable passenger mix due to pandemic-related
restrictions, a general move towards online shopping, the removal of airside tax-free shopping, the removal of the VAT retail-export scheme,
and the continued decline of the currency exchange business. Of these, three specific overlays have been applied to the forecasts.
Retail impacts from
COVID-19
HAL assumes that
changes in the passenger mix
will lead to a decline in
revenue (relative to 2019) in
2022 and a decline in
2023, before returning to
normal.
This is based on their forecast
of the passenger mix, with
fewer higher-spending
Asia/Pacific passengers, and
more lower spending
domestic and European
passengers.

Retail: Summary of HAL’s proposals – real
143
2018 RPI prices 2022 2023 2024 2025 2026
Baseline, £m
Volume adjustment, £m
(%)
Volume adj. forecast, £m
Overlay, £m
(%)
Final forecast, £m
Retail: Catering, Duty Free, Specialist Shops, Advertising, VAT refunds Bureaux
2018 RPI prices 2022 2023 2024 2025 2026
Baseline, £m
Volume adjustment, £m
(%)
Volume adj. forecast, £m
Overlay, £m
(%)
Final forecast, £m
• HAL’s volume adjustment is linked to reduced passenger numbers, which
HAL expects will reduce the income it receives from retail concessions.
• The overlay relates to two effects:
• A change in passenger mix implying a reduction in revenues
relative to the baseline.
• The loss of the VAT Retail Export Scheme / airside tax free and VAT
refund concession income, which is assumed to reduce revenues by
relative to the baseline.
• HAL assumes their bureaux income is not linked to any volumes.
• The overlay is linked to the long-term decline in the currency exchange
business:
• Assume a reduction to Bureaux revenues
Source: CEPA analysis of HAL RBP model
Note: The Retail forecasts in the Commercial revenues chapter differ from those in the model. Over
the H7 period, the Retail revenue forecasts are approximately higher in the model (see below).
Source: CEPA analysis of HAL RBP model
Final forecast (chapter), £m
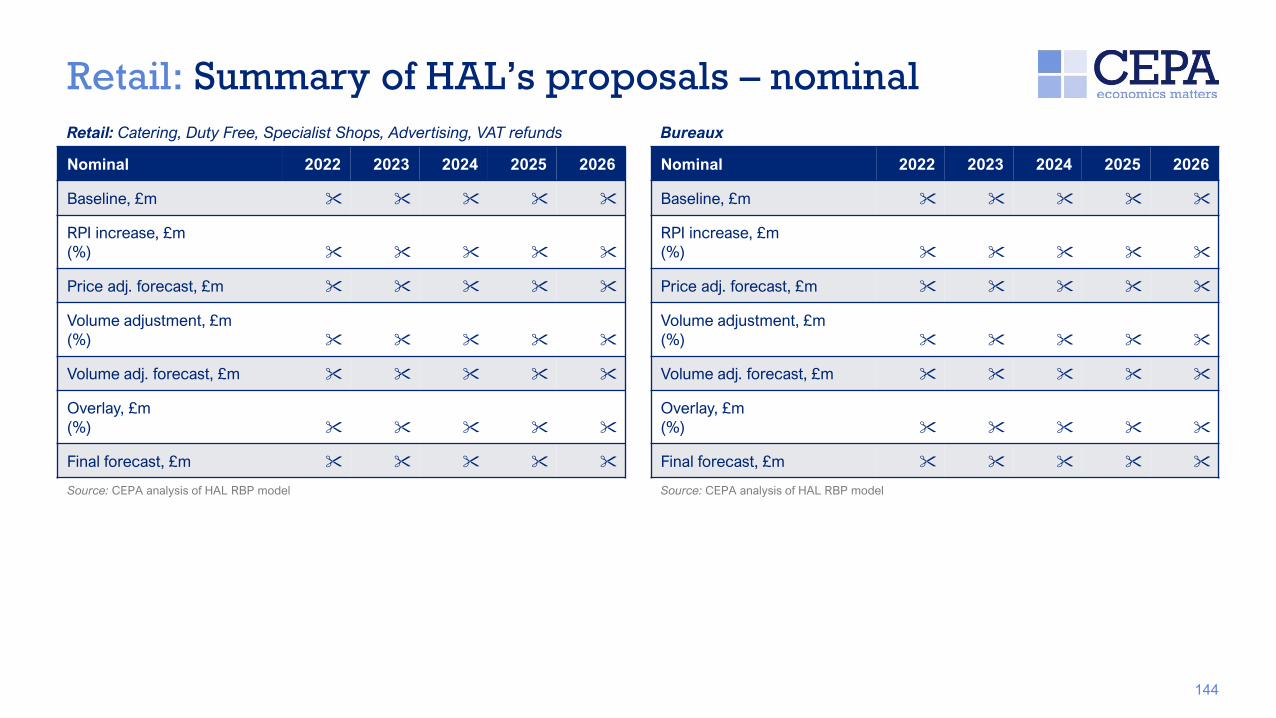
Retail: Summary of HAL’s proposals – nominal
144
Nominal 2022 2023 2024 2025 2026
Baseline, £m
RPI increase, £m
(%)
Price adj. forecast, £m
Volume adjustment, £m
(%)
Volume adj. forecast, £m
Overlay, £m
(%)
Final forecast, £m
Retail: Catering, Duty Free, Specialist Shops, Advertising, VAT refunds Bureaux
Nominal 2022 2023 2024 2025 2026
Baseline, £m
RPI increase, £m
(%)
Price adj. forecast, £m
Volume adjustment, £m
(%)
Volume adj. forecast, £m
Overlay, £m
(%)
Final forecast, £m
Source: CEPA analysis of HAL RBP model Source: CEPA analysis of HAL RBP model
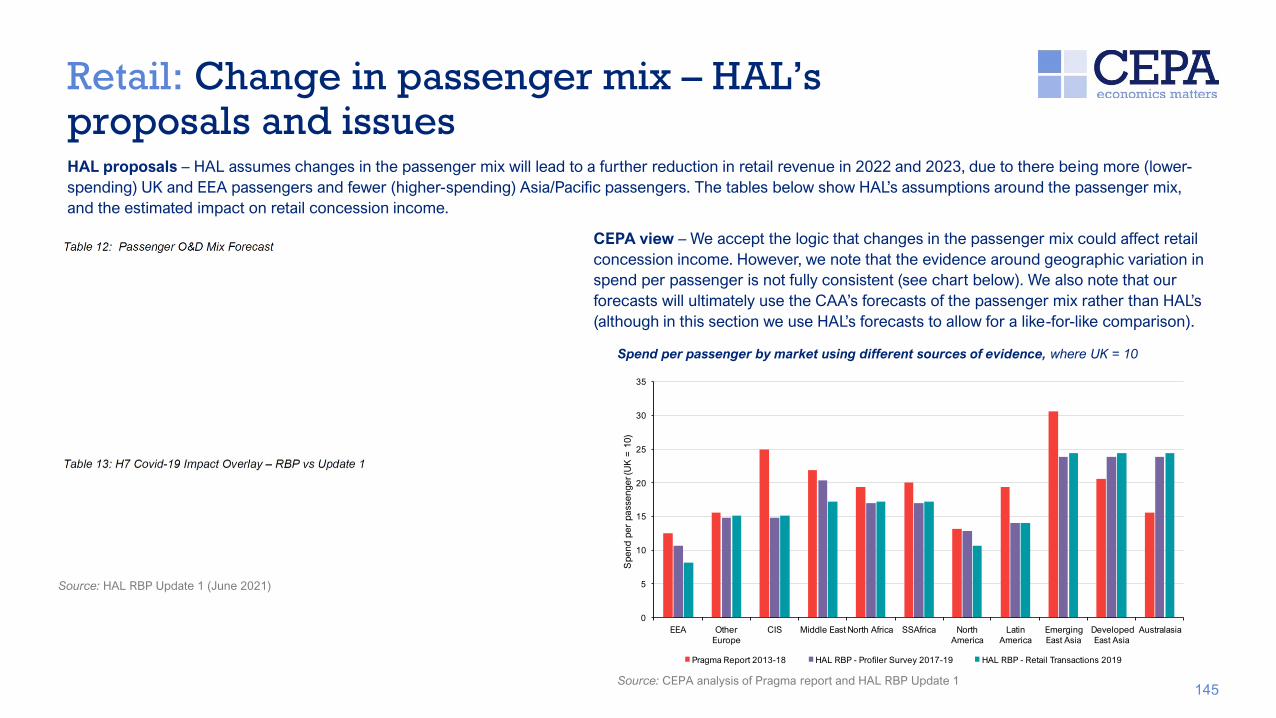
Retail: Change in passenger mix – HAL’s proposals and issues
145
HAL proposals – HAL assumes changes in the passenger mix will lead to a further reduction in retail revenue in 2022 and 2023, due to there being more (lower-
spending) UK and EEA passengers and fewer (higher-spending) Asia/Pacific passengers. The tables below show HAL’s assumptions around the passenger mix,
and the estimated impact on retail concession income.
0
10
1
20
2
0
EEA therEurope
CI Middle East orth Africa Africa orthAmerica
LatinAmerica
EmergingEast Asia
DevelopedEast Asia
Australasia pend per passenger (U
K 10)
Pragma Report 201 1 HAL RBP Pro ler urvey 2017 19 HAL RBP Retail Transactions 2019
Source: HAL RBP Update 1 (June 2021)
Source: CEPA analysis of Pragma report and HAL RBP Update 1
Spend per passenger by market using different sources of evidence, where UK = 10
CEPA view – We accept the logic that changes in the passenger mix could affect retail
concession income. However, we note that the evidence around geographic variation in
spend per passenger is not fully consistent (see chart below). We also note that our
forecasts will ultimately use the CAA’s forecasts of the passenger mix rather than HAL’s
(although in this section we use HAL’s forecasts to allow for a like-for-like comparison).

Retail: Change in passenger mix – CEPA proposal
146
Rather than applying an overlay, we have chosen to separately forecast retail revenue by market. This has two key advantages over HAL’s approach - it provides a
more transparent approach to assessing the impact of changes in the passenger mix on retail revenues, and it allows our model (and the forecasts) to
automatically adjust to changes in passenger mix assumptions. To do this, we have broken retail revenue to a more granular level than is available within HAL’s
forecasts, triangulating accounts data from different HAL sources:
£m, nominal HAL RBP Model HAL stat accounts HAL reg accounts CEPA proposal
Retail excl. Bureaux - - -
Bureaux - - 40.1
Retail concessions 1 - 342.0 339.0 342.0
Catering - 64.0 64.0 64.0
Other retail 2 - 113.0 113.0 72.9
Total 519.0 516.0 519.0
Source: HAL RBP model, HAL statutory accounts, HAL regulatory accounts, CEPA analysis
1. These can be broken down further into Duty Free and specialist shops
2. Includes other retail services such as vending, left luggage, and possibly advertising.
Retail concession revenue in 2019 by OD market
Market
Revenues (£m,
nominal)
Total retail
concessions
342.0
Retail revenue in 2019 by sub-category
Source: CEPA analysis of spend per passenger data from
HAL RBP Update 1 and passenger numbers data from
HAL’s regulatory accounts
ur modelling approach leads to slightly different results than HAL’s overlay. The table below shows HAL’s
proposed overlay compared with CEPA’s estimate of the impact of changes in the passenger mix, both using
HAL’s passenger mix assumptions and using CAA’s passenger mix assumptions:
2022 2023 2024 2025 2026
HAL RBP Update 1
CEPA using HAL passenger forecasts -6.4% -1.6% 0.8% 1.8% 2.8%
CEPA using CAA passenger forecasts -7.8% -3.4% -1.0% -0.9% -0.9%
Source: CEPA analysis, HAL RBP
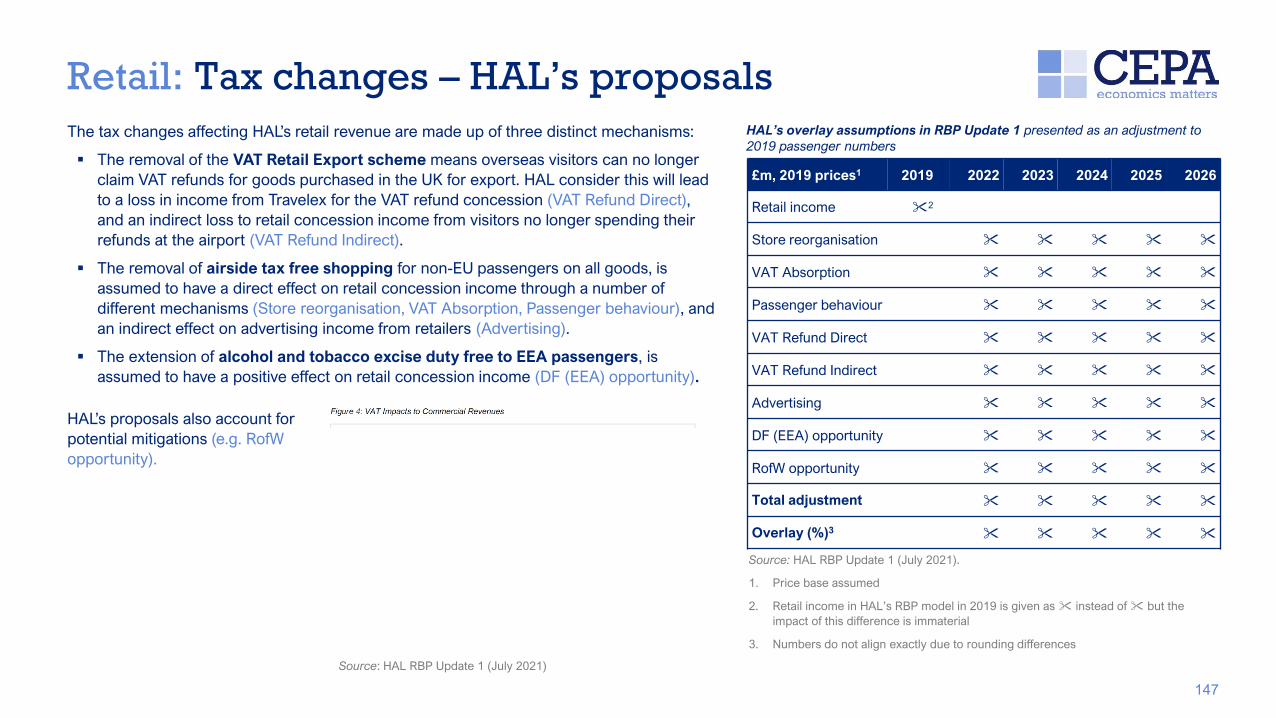
Retail: Tax changes – HAL’s proposals
147
£m, 2019 prices1 2019 2022 2023 2024 2025 2026
Retail income 2
Store reorganisation
VAT Absorption
Passenger behaviour
VAT Refund Direct
VAT Refund Indirect
Advertising
DF (EEA) opportunity
RofW opportunity
Total adjustment
Overlay (%)3
Source: HAL RBP Update 1 (July 2021).
1. Price base assumed
2. Retail income in HAL’s RBP model in 2019 is given as instead of but the
impact of this difference is immaterial
3. Numbers do not align exactly due to rounding differences
Source: HAL RBP Update 1 (July 2021)
The tax changes affecting HAL’s retail revenue are made up of three distinct mechanisms:
▪ The removal of the VAT Retail Export scheme means overseas visitors can no longer
claim VAT refunds for goods purchased in the UK for export. HAL consider this will lead
to a loss in income from Travelex for the VAT refund concession (VAT Refund Direct),
and an indirect loss to retail concession income from visitors no longer spending their
refunds at the airport (VAT Refund Indirect).
▪ The removal of airside tax free shopping for non-EU passengers on all goods, is
assumed to have a direct effect on retail concession income through a number of
different mechanisms (Store reorganisation, VAT Absorption, Passenger behaviour), and
an indirect effect on advertising income from retailers (Advertising).
▪ The extension of alcohol and tobacco excise duty free to EEA passengers, is
assumed to have a positive effect on retail concession income (DF (EEA) opportunity).
HAL’s overlay assumptions in RBP Update 1 presented as an adjustment to
2019 passenger numbers
HAL’s proposals also account for
potential mitigations (e.g. RofW
opportunity).

Retail: Tax changes – Issues
148
The figures presented suggest HAL has attempted to do bottom-up modelling to support their percentage overlay assumptions, and the level of detail
provided in the Update 1 to the RBP is a substantial improvement on the original RBP. Nevertheless, there is still a lack of clarity around some of the
figures presented and how the assumptions driving those figures have been derived:
• No detail has been provided around the loss due to changes in passenger behaviour, and how it interacts with the store reorganisation and VAT absorption
impacts. The multiple overlays applied to account for the direct effect on removing airside tax free shopping on retail concession income, creates a material risk
of double counting.
• It is not clear where the assumption around the loss in VAT refund income comes from – this should be a relatively simple observation from HAL’s accounting
system, but in the material presented over the past year, we have been provided three different estimates ().
• No detail has been provided around how the duty free opportunities have been estimated. We are particularly interested in how HAL has estimated the impact of
extended excise duty free to EEA passengers, which will have a material effect on alcohol and tobacco sales.
In the original RBP and subsequent presentations to the CAA, HAL presented an alternate methodology to support its percentage overlay assumptions
(presented in the table below). Our analysis of the previous
approach showed that HAL relied on some implausible
assumptions to produce the overlay assumptions.
Although HAL used an alternate approach to estimating the
overlay assumptions in its RBP Update 1, our findings are
likely to still apply, given the percentage overlays are similar:
• The implied elasticities are very high, at more than -2
• We can not see a rationale for why F&B or Bookshops
would be affected by changes to VAT rules given the tax
treatment of food and books remains unchanged.
% of
revenues
non-EU
Revenue
impact from
price increases
Revenue
impact from
store closures
Overall
revenue
impact
Implied elasticities
Price
increase
Overall
impact
World Duty Free -2.47 -2.47
Specialist shops -2.36 -2.80
Food & Beverage -1.00
Bookshops -1.00
Total Concessions -2.17 -2.61
Source: Post-RBP CAA Engagement Commercial Revenues (1 March 2021) Source: CEPA analysis
HAL’s overlay assumptions in the original RBP and CEPA estimates of the implied price elasticities
Previous overlay
assumption

Retail: Tax changes – CEPA findings
149
The impact of removing airside tax free on revenues, even when accounting for the duty free extension on alcohol
and tobacco sales, remains material and needs to be considered as a separate overlay.
Similarly, the removal the VAT RES scheme will lead to a loss in income from the Travelex VAT refund concession,
which also needs to be covered as an overlay.
However, the indirect loss of sales due to the removal of the VAT RES scheme does not meet the needs test. No
compelling evidence has been provided to support the assumption that the refunds received by passengers are
then spent at the departure lounge. As a result, we recommend not making an adjustment to account for this
component of the overlay.
Need
Additionality
Efficiency
We consider the impact of tax changes to be a genuine step change that is not accounted for elsewhere.
We can not conclude that the size of the overlay proposed by HAL reflects an efficient adjustment to HAL’s retail
revenue forecasts. Key assumptions that drive the size of the adjustment have not been explained or supported by
any evidence. As such, we propose an alternative approach as described in subsequent slides.

Retail: Tax changes – CEPA approach
150
We propose using a top-down elasticity-based approach to estimate the
impact on retail concession income from: (1) removing airside tax free
and (2) extending excise duty free for alcohol and tobacco to EU/EEA
passengers. We use the same elasticity for both tax changes.
Our elasticity-based approach provides a broad approximation of the loss
to the full value chain from the tax changes, capturing any loss in sales from
price increases, any loss in concession income from retailers absorbing the
rise in VAT, any impact on store closures, and any reduction in advertising
revenues.
The OBR used price elasticity of demand estimates ranging from -0.5 and
-2 when estimating the impact of the tax changes.1 This estimate accounted
for both changes in the number of tourists travelling to the UK following the tax
change, and any changes in their spending patterns. We propose using the
mid-way estimate of -1.25 to only account for the second of these impacts
(as the former is considered separately through the passenger forecasts).
However, we recognise this is a key area of uncertainty and would welcome
any evidence from HAL that supports a different elasticity assumption.
We also separately estimate the loss in VAT refund concession income,
using HAL’s most recent estimate of (nominal) in 2019.
This assumption will need validating for our final forecasts, preferably through
confirmation from HAL around the historic value of the VAT refund concession
contract.
The top-down approach to estimating the impact of tax changes on retail
concession income, does not capture certain nuances and details that
would be captured through a more detailed bottom-up analysis. But the
overall effect of these details are likely to be neutral:
• We assume all of the cost of tax changes will be borne by HAL in the form
of lower concession income from retailers. In reality, some of the cost may
be borne by the retailers.
• We have not accounted for any ‘frictions’ where stores remain empty for a
period when being vacated by one retailer and replaced by another.
• We have not explicitly considered any mitigations that HAL or retailers could
implement to reduce the effect on revenues (though this is captured
implicitly within our management stretch assumption).
• Our elasticity estimate, in theory, accounts for both the volume effect (the
reduction in transactions due to fewer passengers) and the price effect (the
reduction in spending per passenger). This risks double counting the
volume effect, as it is also captured within the passenger forecasts.
• We have not separated out revenue from landside sales or bookshops,
where taxes remain unchanged.
1. See CEBR (2020) The Impact of Ending Tax Free Shopping in the UK, p.13 and OBR (2020) Economic and Fiscal Outlook: November 2020, p.183. For the upper bound, we round up from -1.9.

Retail: Tax changes – CEPA proposal
151
In the table below, we present the results of our elasticity based approach to the tax changes, assuming a 2019 passenger mix. However, as mentioned previously,
our actual modelling breaks down retail income into catering, retail concessions (duty free and specialist shops), and other retail revenue, and further breaks down
retail concession income by geography. We have applied our elasticity based approach to the individual categories rather than applying a single percentage
overlay. This allows us to estimate the impact of tax changes while accounting for any future changes in the passenger mix.
% of retail revenue affected 1 Implied price change 2 Impact on revenues 3
Airside tax free Non-UK and non-EEA sales 70.6% 20% -25%
ExciseEEA alcohol sales 2.8% -60% 75%
EEA tobacco sales 1.8% -75% 94%
VAT refunds Other retail revenue 4.4% N/A -100%
Weighted average impact on all retail revenues (excl. Bureaux) -13.5%
1. Proportion of retail revenue.
▪ Non-UK and non-EEA sales are estimated using average spend per passenger data in HAL’s
most recent RBP update, and passenger number breakdowns in the regulatory accounts.
▪ Using information from the Pragma report and from HAL’s presentation to the CAA, we
estimate that 6% of retail concession income came from EEA alcohol and tobacco sales. We
then use 2018 data from Statista.com on duty free sales worldwide in 2018 to estimate the
relative proportions of alcohol and tobacco.
2. Estimated change in prices from tax changes.
Data from OECD Library Excise duties in OECD countries (tobacco), WSTA Facts and Figures
(alcohol) provides estimates of the proportion of retail price that consists of taxes (56% for wine,
77% for spirits and 79% for tobacco). After removing effect of VAT, we can estimate the implied
price reduction once excise duty is removed.
3. Impact of price change on revenues. We use an elasticity of 1.25 to estimate impact of revenues
(see previous slide).
Comparable to HAL’s to
overlay estimates
2022 2023 2024 2025 2026
HAL RBP Update 1
CEPA -12.0% -12.7% -13.2% -13.3% -13.2%
Comparison HAL’s overlay with implied CEPA overlay to all retail revenues (excl. Bureaux) after accounting for changes to passenger mix.
Source: CEPA analysis
Source: CEPA analysis, HAL RBP
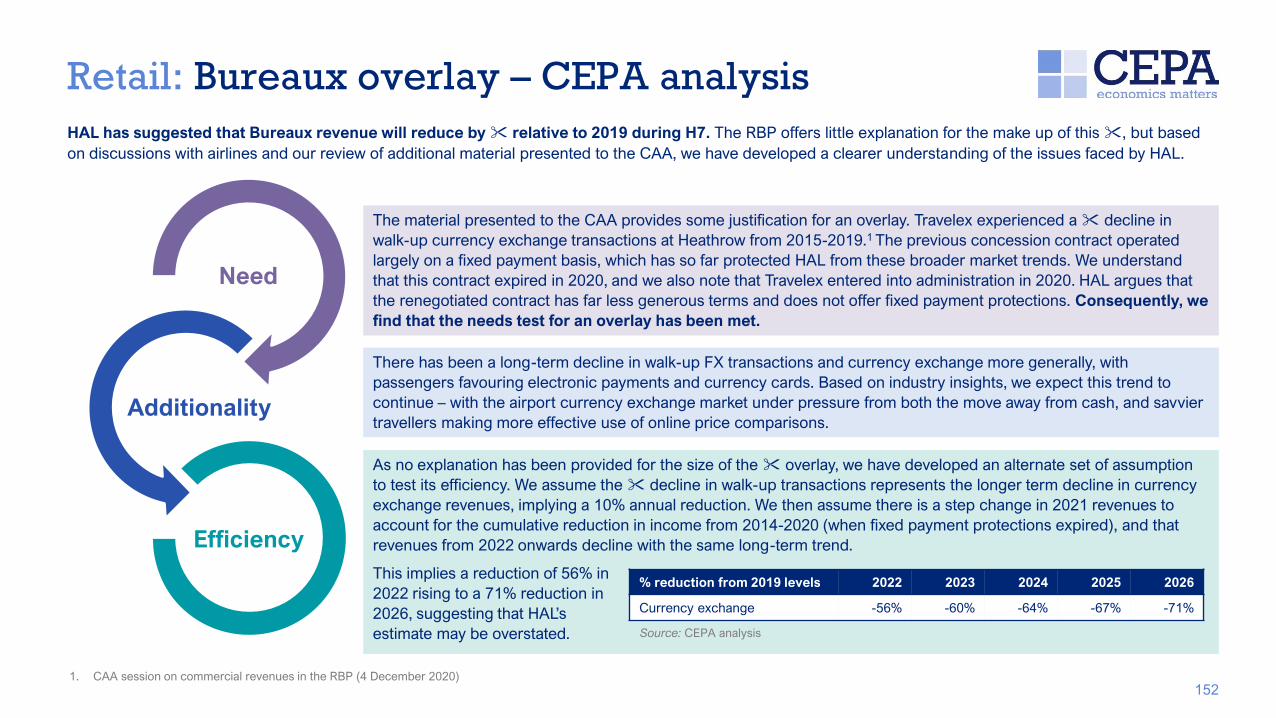
HAL has suggested that Bureaux revenue will reduce by relative to 2019 during H7. The RBP offers little explanation for the make up of this , but based
on discussions with airlines and our review of additional material presented to the CAA, we have developed a clearer understanding of the issues faced by HAL.
The material presented to the CAA provides some justification for an overlay. Travelex experienced a decline in
walk-up currency exchange transactions at Heathrow from 2015-2019.1 The previous concession contract operated
largely on a fixed payment basis, which has so far protected HAL from these broader market trends. We understand
that this contract expired in 2020, and we also note that Travelex entered into administration in 2020. HAL argues that
the renegotiated contract has far less generous terms and does not offer fixed payment protections. Consequently, we
find that the needs test for an overlay has been met.
Retail: Bureaux overlay – CEPA analysis
152
There has been a long-term decline in walk-up FX transactions and currency exchange more generally, with
passengers favouring electronic payments and currency cards. Based on industry insights, we expect this trend to
continue – with the airport currency exchange market under pressure from both the move away from cash, and savvier
travellers making more effective use of online price comparisons.
As no explanation has been provided for the size of the overlay, we have developed an alternate set of assumption
to test its efficiency. We assume the decline in walk-up transactions represents the longer term decline in currency
exchange revenues, implying a 10% annual reduction. We then assume there is a step change in 2021 revenues to
account for the cumulative reduction in income from 2014-2020 (when fixed payment protections expired), and that
revenues from 2022 onwards decline with the same long-term trend.
This implies a reduction of 56% in
2022 rising to a 71% reduction in
202 , suggesting that HAL’s
estimate may be overstated.
1. CAA session on commercial revenues in the RBP (4 December 2020)
Need
Additionality
Efficiency
% reduction from 2019 levels 2022 2023 2024 2025 2026
Currency exchange -56% -60% -64% -67% -71%
Source: CEPA analysis

Retail: CEPA Proposals - nominal
153
Nominal 2022 2023 2024 2025 2026
Baseline, £m 478.9 478.9 478.9 478.9 478.9
CPI increase, £m
(%)
20.3
(4%)
29.7
(6%)
39.5
(8%)
49.9
(10%)
60.5
(13%)
Price adj. forecast, £m 499.2 508.6 518.4 528.8 539.4
Volume adjustment, £m
(%)
-247.9
(-50%)
-155.5
(-31%)
-93.3
(-18%)
-61.8
(-12%)
-48.8
(-9%)
Volume adj. forecast, £m 251.2 353.1 425.1 467.0 490.6
Overlay, £m
(%)
-30.9
(-12%)
-46.3
(-13%)
-57.8
(-14%)
-64.4
(-14%)
-68.5
(-14%)
Management stretch, £m
(%)
13.5
(6%)
25.3
(8%)
38.2
(10%)
50.8
(13%)
62.8
(15%)
Final forecast, £m 233.8 332.1 405.5 453.4 484.8
Retail: Catering, Duty Free, Specialist Shops (HAL mid pax forecasts) Bureaux (HAL mid pax forecasts)
HAL forecast, £m
Difference with CEPA, £m
Cumulative difference, £m
HAL forecast, £m
Difference with CEPA, £m
Cumulative difference, £m
Nominal 2022 2023 2024 2025 2026
Baseline, £m 40.1 40.1 40.1 40.1 40.1
CPI increase, £m
(%)
1.7
(4%)
2.5
(6%)
3.3
(8%)
4.2
(10%)
5.1
(13%)
Price adj. forecast, £m 41.8 42.6 43.4 44.3 45.2
Volume adjustment, £m
(%)
-19.7
(-47%)
-12.6
(-30%)
-7.9
(-18%)
-5.6
(-13%)
-4.8
(-11%)
Volume adj. forecast, £m 22.1 30.0 35.5 38.7 40.4
Overlay, £m
(%)
-12.3
(-56%)
-18.0
(-60%)
-22.7
(-64%)
-26.1
(-67%)
-28.5
(-71%)
Management stretch, £m
(%)
0.6
(6%)
1.0
(8%)
1.3
(10%)
1.6
(13%)
1.8
(15%)
Final forecast, £m 10.4 12.9 14.1 14.2 13.6
Source: CEPA analysis Source: CEPA analysis
Section Four
D. Surface access
Commercial revenue forecasts

Surface Access: Summary of HAL’s proposals –Narrative around forecasts
155
In their RBP and subsequent presentations, HAL has presented a series of headwinds and opportunities related to surface access. These
broadly sit in three categories – the impact of the COVID-19 pandemic, the introduction of Crossrail services, and management initiatives to
increase revenues.
The pandemic is expected to lead to some short-term structural
shifts in how passengers travel to/from the airport and the types
of passengers that use different surface access services.
▪ Change in passenger mix, with more leisure and short-haul
passengers and fewer business and long-haul passengers:
• This is assumed to lead to lower average transaction values (ATV) for
HAL’s car rental and car parking services
• Less revenue from Heathrow Express
▪ Fewer passengers:
• Less revenue from all surface access services
▪ A shift from public transport to private transport modes:
• Less Heathrow Express revenue
• More transactions from car rental and car parking
The introduction of Crossrail services is expected to
lead to a step change in how passengers travel to the
airport, with a shift from other transport modes to
Crossrail.
▪ Transfer of passengers from Heathrow Express to Crossrail
• Less rail revenue
HAL is considering several management initiatives
that may lead to a step increase in surface access
revenues.
▪ Using closed car parks for alternate purposes until
demand returns:
• Mitigating impact of lower volumes
▪ Terminal drop-off charge:
• New revenue stream

Surface Access: Summary of HAL’s proposals –real
156
Surface access: Car parking and car rental Rail: Heathrow Express and track access charges
• Volume adjustment linked to car park and car rental mode shares:
• Unclear precise rationale for overlay, but assumed it relates to the
narrative around average transaction values
• Volume adjustment linked Heathrow Express mode share:
Terminal drop off charge increases mode share by and Crossrail
services reduce mode share by
• Overlay accounts for impact on rail yields:
• COVID-19 related
• Crossrail related
2018 RPI prices 2022 2023 2024 2025 2026
Baseline, £m
Volume adjustment, £m
(%)
Volume adj. forecast, £m
Overlay, £m
(%)
Final forecast, £m
2018 RPI prices 2022 2023 2024 2025 2026
Baseline, £m
Volume adjustment, £m
(%)
Volume adj. forecast, £m
Overlay, £m
(%)
Final forecast, £m
2019 2020 2021 2022 2023 2024 2025 2026
Car parking
Car rental
2019 2020 2021 2022 2023 2024 2025 2026
HEx
Source: CEPA analysis of HAL RBP model Source: CEPA analysis of HAL RBP model

Surface Access: Summary of HAL’s proposals –nominal
157
Surface access: Car parking and car rental Rail: Heathrow Express and track access charges
Nominal 2022 2023 2024 2025 2026
Baseline, £m
RPI increase, £m
(%)
Price adj. forecast, £m
Volume adjustment, £m
(%)
Volume adj. forecast, £m
Overlay, £m
(%)
Final forecast, £m
Nominal 2022 2023 2024 2025 2026
Baseline, £m
RPI increase, £m
(%)
Price adj. forecast, £m
Volume adjustment, £m
(%)
Volume adj. forecast, £m
Overlay, £m
(%)
Final forecast, £m
Source: CEPA analysis of HAL RBP model Source: CEPA analysis of HAL RBP model

Surface Access: Impact of mode share assumptions
158
HAL’s description of its methodology for producing the mode share forecasts has not been fully spelled out and as a result we have had to make some
inferences about the approach taken. The chart below shows HAL’s mode share assumptions in the original RBP. We understand the mode share assumptions
have been developed using outputs from HAL’s LA AM model and a set of off-model assumptions and adjustments, separately capturing (1) pandemic related
effects, (2) the impact of the terminal drop-off charge (previously called the Forecourt Access Charge), and (3) the impact of Crossrail services being introduced.
We believe the main driver of HAL’s forecasts are the off-model assumptions used to estimate structural shifts in mode share as a result of the COVID-19 pandemic
- (1) above. We believe these are assumptions-based as opposed to being derived from the LASAM model, as the model is not set up to evaluate structural shifts in
demand or passenger preferences. The LASAM model estimates the mode share of passengers travelling to and from the airport, given travel distances, journey
times, travel cost, and observed (historical) preferences for certain modes. It assumes preferences, price elasticities and time elasticities, all remain fixed.
We believe HAL’s 2020 mode share assumptions reflect its view of ‘peak’ pandemic related effects on mode share, with mode shares eventually returning to 2019
levels by 202 . We also understand actual data from 2020 has been used to inform HAL’s estimates of 2020 mode share, but it is unclear how this information has
been incorporated. We know HAL’s original RBP had access to two months of actual mode share data (July and August 2020), but it is not clear whether more
mode share data has been captured since then.
Source: HAL presentation to CAA
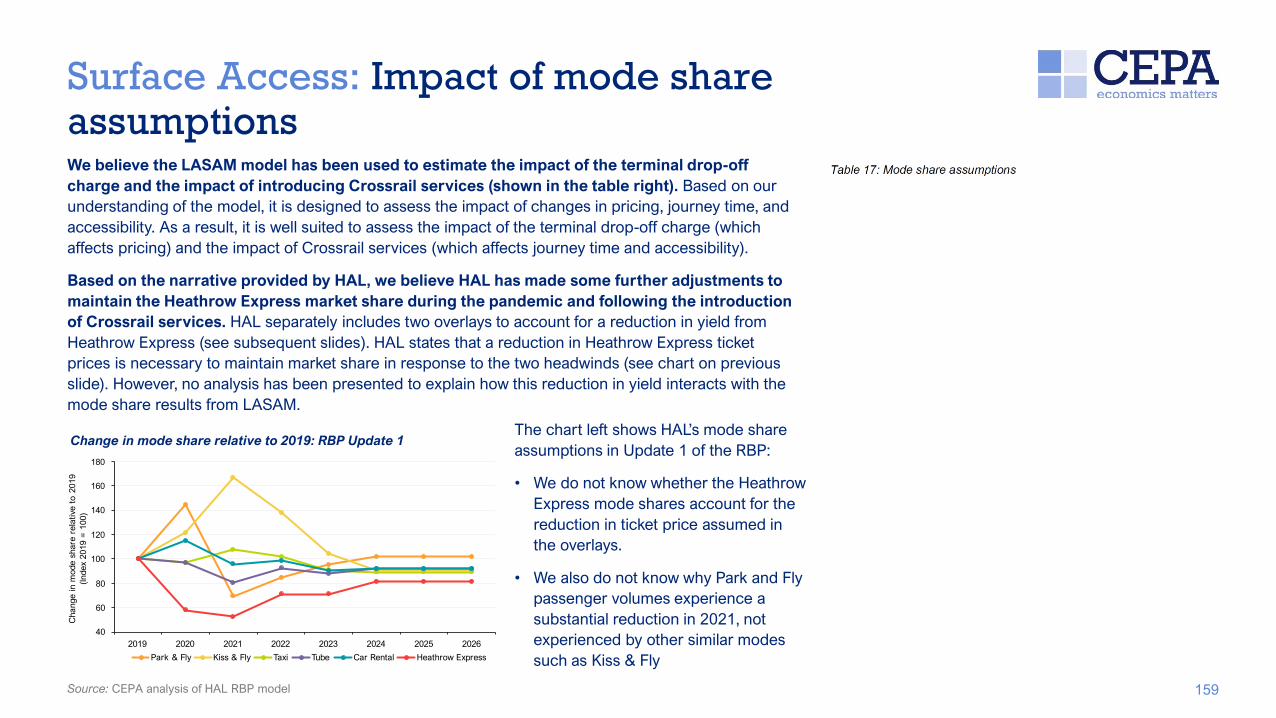
Surface Access: Impact of mode share assumptions
159
We believe the LASAM model has been used to estimate the impact of the terminal drop-off
charge and the impact of introducing Crossrail services (shown in the table right). Based on our
understanding of the model, it is designed to assess the impact of changes in pricing, journey time, and
accessibility. As a result, it is well suited to assess the impact of the terminal drop-off charge (which
affects pricing) and the impact of Crossrail services (which affects journey time and accessibility).
Based on the narrative provided by HAL, we believe HAL has made some further adjustments to
maintain the Heathrow Express market share during the pandemic and following the introduction
of Crossrail services. HAL separately includes two overlays to account for a reduction in yield from
Heathrow Express (see subsequent slides). HAL states that a reduction in Heathrow Express ticket
prices is necessary to maintain market share in response to the two headwinds (see chart on previous
slide). However, no analysis has been presented to explain how this reduction in yield interacts with the
mode share results from LASAM.
0
0
0
100
120
1 0
1 0
1 0
2019 2020 2021 2022 202 202 202 202
Change in m
ode share relative
to 2019
(Index 2019 100)
Park & ly Kiss & ly Taxi Tube Car Rental Heathrow Express
Change in mode share relative to 2019: RBP Update 1The chart left shows HAL’s mode share
assumptions in Update 1 of the RBP:
• We do not know whether the Heathrow
Express mode shares account for the
reduction in ticket price assumed in
the overlays.
• We also do not know why Park and Fly
passenger volumes experience a
substantial reduction in 2021, not
experienced by other similar modes
such as Kiss & Fly
Source: CEPA analysis of HAL RBP model

Surface Access: Impact of mode share assumptions – CEPA proposals
160
ur approach to developing mode share estimates broadly matches HAL’s methodology. However, we have attempted to replicate it as transparently as possible to
allow HAL to challenge any specific assumptions they disagree with.
• We assume that HAL’s 2020 mode share assumptions are largely based on actual survey data (while recognising that passengers were not surveyed in April to
June 2020). We also assume the changes in mode share between 2019 and 2020 is reflective of the impact of the COVID-19 pandemic. Ideally, our ‘peak
pandemic effect’ assumption would be based on survey data from just the pandemic months (i.e. July 2020 onwards) but we do not have access to such data.
• In line with HAL’s assumptions, we assume mode shares return to normal (2019 levels) by 202 . This is before we account for other changes such as the
terminal drop-off charge.
• Finally, we apply as overlays, the impact of the terminal drop-off charge and the introduction of Crossrail services on mode shares, as per HAL’s assumptions on
the previous slide.
• Below we present a comparison of our mode share assumptions with HAL’s
2019 2020
Park & Fly
Kiss & Fly
Taxi
Bus / Coach
Tube
Car Rental
Heathrow Express
TfL Rail / Crossrail
Other
2022 2023 2024 2025 2026
2022 2023 2024 2025 2026
9.2% 8.2% 7.2% 7.3% 7.3%
18.9% 17.5% 16.0% 15.9% 15.9%
29.2% 28.3% 27.4% 27.2% 27.2%
11.1% 11.3% 11.5% 11.5% 11.5%
20.0% 19.1% 18.3% 18.4% 18.4%
2.2% 2.0% 1.9% 1.9% 1.9%
6.9% 7.0% 7.0% 7.1% 7.1%
1.2% 5.5% 9.8% 9.8% 9.8%
1.2% 1.1% 1.1% 1.1% 1.1%
HAL mode share assumptions CEPA mode share assumptions
Source: HAL RBP model Source: CEPA analysisSource: HAL RBP model

HAL state that the pandemic will affect the average revenue they receive from a typical car parking or car rental transaction. They apply an overlay of
in 2022 and in 2023 to reflect the impact on revenues.
Surface Access: Covid-overlay to parking and rental income
161
HAL do not precisely state the rationale for the overlay to car parking and car rental income, though we infer it
relates to a change in the passenger mix. In other words, changes to the passenger mix mean that HAL are not
able to extract as much revenue from an average car parking or car rental customer. There is a logic to average
transaction values (ATV) reducing as a result of changes in the ratio of business to leisure passengers. However,
HAL has not provided any elaboration of the size of the reduction in ATVs.
Need
Additionality
Efficiency
HAL assume that the car parking and car rental mode share will be lower in 2022 and 2023 relative to 2019
(implying fewer transactions) and that the ATV will also reduce. We are not convinced that these two effects are
genuinely additional. It is not clear why the two effects would happen simultaneously, especially when we would
expect the pandemic and terminal drop-off charge to lead to higher demand for car parking and car rental
products.
We can not determine the efficiency of HAL’s proposed adjustment as there are key gaps in the logic and evidence
underpinning the overlay assumptions. However, as we have already adjusted our mode share assumptions, we do
not also make an efficiency adjustment to the COVID-19 overlay.

Surface Access: Covid-19 overlay to rail
162
HAL has proposed two separate adjustments related to the COVID-19 pandemic. The first is the reduction in Heathrow Express (HEx) mode share (a
‘volume’ effect) which we discuss earlier. The second is the reduction in yield required to maintain market share (a ‘price’ effect), which has been
incorporated into HAL’s forecasts as a separate overlay.
• HAL assumes a reduction in yield from 2021 onwards (which we assume comes from a reduction in price) as a reaction to the pandemic.
• The source of this assumption has not been explained, nor has its impact on the HEx mode share been transparently presented.
• This overlay is applied for the whole H7 period, though we would expect the overlay to reduce over time as the effect of the pandemic fades (as assumed
in HAL’s mode share analysis).
We do not think the needs case has been met in this instance. The impact of the reduction in average ticket prices on HEx’s
mode share, assuming this is the reason for the yield reduction, is not clearly presented – and as such, we do not have access to
any evidence to suggest that such a reduction in price is either necessary or efficient. This is also consistent with our mode
share assumptions, where we do not assume any reduction in the HEx ticket price. We would like HAL to provide evidence
showing how it determined a reduction in yields/ticket prices is the most appropriate response to pandemic-induced changes
to demand, and what the mode share impacts are expected to be. Most importantly, we would like to see evidence that reducing
ticket prices is the revenue maximising response to a reduction in mode share.
Need

Surface Access: Crossrail-overlay to rail
163
HAL has also proposed two separate adjustments related to Crossrail. The first is the reduction in Heathrow Express (HEx) mode share (a ‘volume’
effect) and the second is the reduction in yield required to maintain market share (a ‘price’ effect).
Need
Additionality
Efficiency
Crossrail services will inevitably abstract passengers and associated revenues from other transport modes. And we
would expect HEx services to be more affected than other transport modes given the overlap in routes.
We understand the logic underpinning a yield / price reduction in addition to a mode share / volume reduction, given a
reduction in price may be a revenue maximising strategy in response to the introduction of Crossrail services. As such,
we consider the needs test has been met for this overlay.
It is not clear whether the effect of reducing ticket prices on mode share has been factored into HAL’s forecasts. HAL’s
mode share assumptions imply there would be a much larger impact on passenger volumes in the absence of any
price reduction. As such, we can not confirm that the overlay is genuinely additional to the volume-based effects.
Nevertheless, we understand that the volume and price effects are two distinct impacts.
HAL assumes a reduction in yield (which we assume comes from a reduction in price) as a reaction to Crossrail.
The source of this assumption has not been explained, but compares favourably to HAL’s assumption from iH7 where
there was an assumed reduction in yield.
The combined effect of the volume-effect and price effect assumptions is a reduction in rail revenue. This broadly
matches HAL’s assumption from iH7, which assumed a reduction in rail revenue (albeit with a different split between
volume reductions and price reductions).
However, we understand that roughly 20 of HAL’s rail income relates to track access charges – these are governed by
a different arrangement that is not linked to volumes. We are also not aware of higher track access income from
additional Crossrail services being captured as a mitigation. As a result, we use the same overlay as HAL, but apply
it only to the proportion of revenue that does not relate to track access.
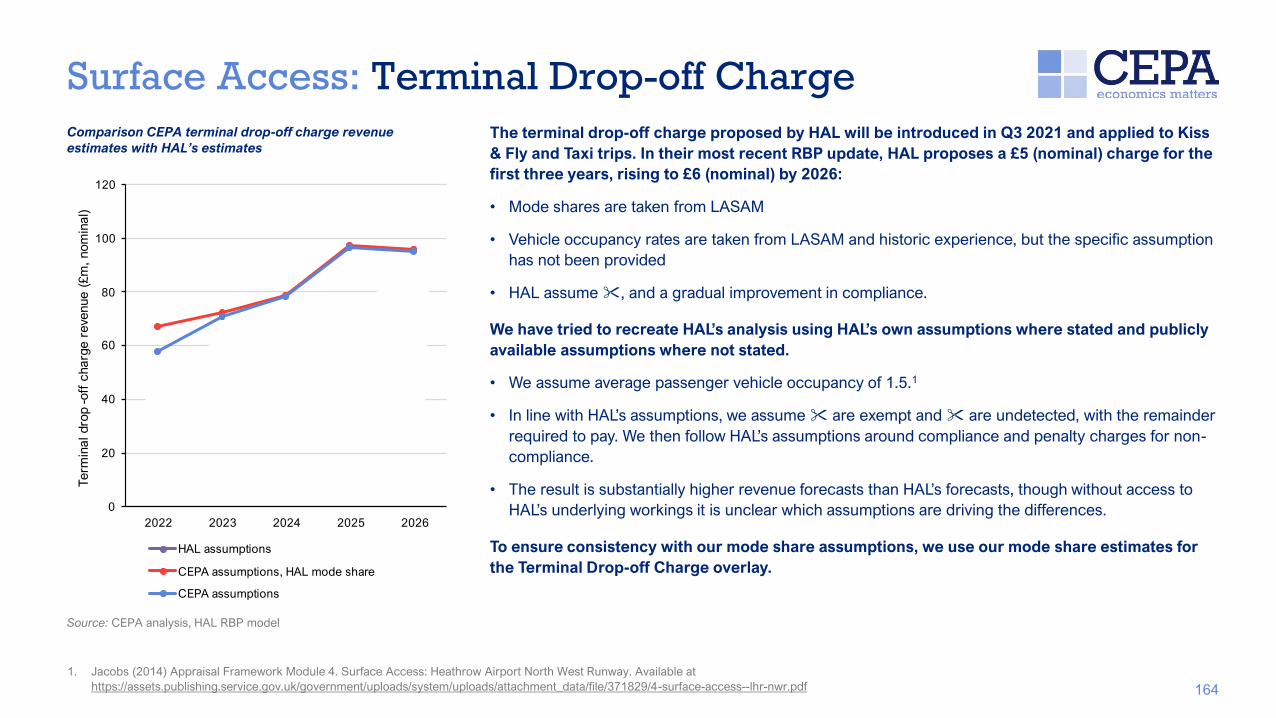
Surface Access: Terminal Drop-off Charge
164
The terminal drop-off charge proposed by HAL will be introduced in Q3 2021 and applied to Kiss
& Fly and Taxi trips. In their most recent RBP update, HAL proposes a £5 (nominal) charge for the
first three years, rising to £6 (nominal) by 2026:
• Mode shares are taken from LASAM
• Vehicle occupancy rates are taken from LASAM and historic experience, but the specific assumption
has not been provided
• HAL assume , and a gradual improvement in compliance.
We have tried to recreate HAL’s analysis using HAL’s own assumptions where stated and publicly
available assumptions where not stated.
• We assume average passenger vehicle occupancy of 1.5.1
• In line with HAL’s assumptions, we assume are exempt and are undetected, with the remainder
required to pay. We then follow HAL’s assumptions around compliance and penalty charges for non-
compliance.
• The result is substantially higher revenue forecasts than HAL’s forecasts, though without access to
HAL’s underlying workings it is unclear which assumptions are driving the differences.
To ensure consistency with our mode share assumptions, we use our mode share estimates for
the Terminal Drop-off Charge overlay.
1. Jacobs (2014) Appraisal Framework Module 4. Surface Access: Heathrow Airport North West Runway. Available at
https://assets.publishing.service.gov.uk/government/uploads/system/uploads/attachment_data/file/371829/4-surface-access--lhr-nwr.pdf
Comparison CEPA terminal drop-off charge revenue
estimates with HAL’s estimates
Source: CEPA analysis, HAL RBP model
0
20
0
0
0
100
120
2022 202 202 202 202
Term
inal drop off charge reve
nue ( m, nominal)
HAL assumptions
CEPA assumptions, HAL mode share
CEPA assumptions
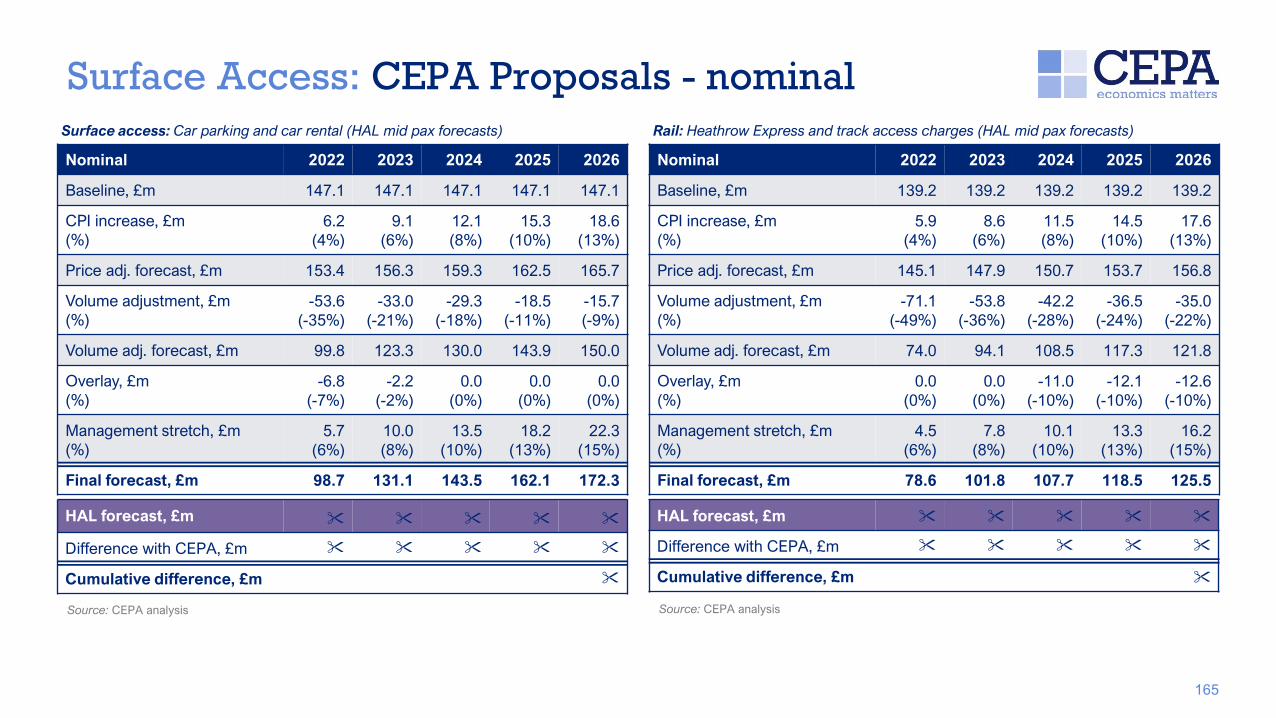
Surface Access: CEPA Proposals - nominal
165
Nominal 2022 2023 2024 2025 2026
Baseline, £m 147.1 147.1 147.1 147.1 147.1
CPI increase, £m
(%)
6.2
(4%)
9.1
(6%)
12.1
(8%)
15.3
(10%)
18.6
(13%)
Price adj. forecast, £m 153.4 156.3 159.3 162.5 165.7
Volume adjustment, £m
(%)
-53.6
(-35%)
-33.0
(-21%)
-29.3
(-18%)
-18.5
(-11%)
-15.7
(-9%)
Volume adj. forecast, £m 99.8 123.3 130.0 143.9 150.0
Overlay, £m
(%)
-6.8
(-7%)
-2.2
(-2%)
0.0
(0%)
0.0
(0%)
0.0
(0%)
Management stretch, £m
(%)
5.7
(6%)
10.0
(8%)
13.5
(10%)
18.2
(13%)
22.3
(15%)
Final forecast, £m 98.7 131.1 143.5 162.1 172.3
Surface access: Car parking and car rental (HAL mid pax forecasts) Rail: Heathrow Express and track access charges (HAL mid pax forecasts)
HAL forecast, £m
Difference with CEPA, £m
Cumulative difference, £m
HAL forecast, £m
Difference with CEPA, £m
Cumulative difference, £m
Nominal 2022 2023 2024 2025 2026
Baseline, £m 139.2 139.2 139.2 139.2 139.2
CPI increase, £m
(%)
5.9
(4%)
8.6
(6%)
11.5
(8%)
14.5
(10%)
17.6
(13%)
Price adj. forecast, £m 145.1 147.9 150.7 153.7 156.8
Volume adjustment, £m
(%)
-71.1
(-49%)
-53.8
(-36%)
-42.2
(-28%)
-36.5
(-24%)
-35.0
(-22%)
Volume adj. forecast, £m 74.0 94.1 108.5 117.3 121.8
Overlay, £m
(%)
0.0
(0%)
0.0
(0%)
-11.0
(-10%)
-12.1
(-10%)
-12.6
(-10%)
Management stretch, £m
(%)
4.5
(6%)
7.8
(8%)
10.1
(10%)
13.3
(13%)
16.2
(15%)
Final forecast, £m 78.6 101.8 107.7 118.5 125.5
Source: CEPA analysis Source: CEPA analysis

Section Four
E. Property
Commercial revenue forecasts

Property: Summary of HAL’s proposals –Narrative around forecasts
167
HAL expects that the COVID-19 pandemic leads to some long-term and
short-term effects in their ability to generate property revenues:
▪ In the short-term, HAL’s closure of certain terminals reduces the property
revenue they receive. HAL uses a revenue elasticity with respect to utilised
terminal space to account for this and assumes (in its mid scenario) that it
can re-open all terminal space by 2024.
▪ In the longer term, HAL assumes property revenues will be lower, due to
less demand for office space – from sector wide reductions, airline
consolidations, and new working practices (e.g. agile working).
▪ HAL applies a percentage overlay to account for the impact of
COVID-19 on longer term working practices and tenants’
requirements for infrastructure and office space.*
HAL’s percentage overlay also accounts for changes in guide prices for 2021
and 2022, which may cause a substantial reduction in rental income in
subsequent years.
*Note: HAL will be revising the COVID-19 adjustment factor for RBP updates in 2021
HAL has identified the following management initiatives to mitigate the effect
of COVID-19 on property revenues:
▪ Space Optimisation projects: the development of small-format retail units,
offering consumers complementary essentials products in a single unit
▪ Maximise occupancy and rental income: re-letting and targeting
investments for the refurbishment and creation of spaces suitable for
reletting
▪ Developing passenger focused facilities: property provides several
passenger facing products, for example terminal connected hotels,
independent lounges, and business centres
▪ Long Term Operational Facilities: HAL considers the purchase of essential
operational leased buildings where it drives a lower long-term facilities
cost
In their RBP and subsequent presentations, HAL has presented a series of headwinds and opportunities related to property revenues.

Property: Summary of HAL’s proposals
168
Nominal 2022 2023 2024 2025 2026
Baseline, £m
RPI increase, £m
(%)
Price adj. forecast, £m
Volume adjustment, £m
(%)
Volume adj. forecast, £m
Overlay, £m
(%)
Final forecast, £m
Property: office space, lounges, non-terminal properties and cargo
2018 RPI prices 2022 2023 2024 2025 2026
Baseline, £m
Volume adjustment, £m
(%)
Volume adj. forecast, £m
Overlay, £m
(%)
Final forecast, £m
Property: office space, lounges, non-terminal properties and cargo
• Volume adjustment linked to property revenues:
• HAL uses utilised terminal space as a driver for revenue forecast: for
every 1% increase in passengers, retail revenue will increase by
• Compared to 2019, utilised terminal space is assumed to be lower
in 2022 and lower in 2023
•
• Overlay for impact on property revenue accounts for:
• The impact of COVID-19
• The change in rental guide prices for 2021 and subsequent years
• Assumed to be for entire H7
Source: CEPA analysis of HAL RBP model
Source: CEPA analysis of HAL RBP model

Property: Efficient overlay adjustment
169
1. Heathrow (2021), Investor Report June 2021
There is a logic to allow for an overlay for the impact of COVID-19 and the rental price guide adjustment on property
revenues. We understand office space will be in lower demand and tenants’ requirements for infrastructure will change.
However, HAL has not provided any elaboration of the size of the overlay.Need
Additionality
Efficiency
The effect of COVID-19 and the change in rental price guidance on property revenues is not appropriately captured
when forecasting revenues using utilised terminal space elasticities. As a result, we agree there is need for an overlay to
adjust for the impacts of COVID-19.
Property 2021 outturn and forecast comparisonHAL has not provided any workings to explain the size of the
overlay. To test the efficiency of the assumption, we compare 2021
forecast property revenue with outturn revenue in Q1 2021. In its
investor report, HAL notes that property revenue has decreased by
18.4% due to targeted rental alleviation in Q1 2021 compared to Q1
2020 (which implies an 18.4% decrease compared to pre-COVID-19
levels). 1
If we use HAL’s elasticity of and the overlay to forecast 2021
revenues, there is a total reduction of 25% relative to 2019 levels,
which is greater than the Q1 2021 outturn. However, using CEPA’s
proposed elasticity of 0.25 implies a total reduction of 18.9%, which
is much closer to HAL’s outturn reduction in Q1 2021.
As such we conclude that HAL’s overlay assumption is broadly
appropriate when combined with our elasticity assumption.Source: CEPA analysis

Property: CEPA Proposals - nominal
170
Nominal 2022 2023 2024 2025 2026
Baseline, £m 133.8 133.8 133.8 133.8 133.8
CPI increase, £m
(%)
5.7
(4%)
8.3
(6%)
11.0
(8%)
13.9
(10%)
16.9
(13%)
Price adj. forecast, £m 139.5 142.1 144.9 147.8 150.7
Volume adjustment, £m
(%)
-6.5
(-5%)
-2.8
(-2%)
0.0
(0%)
0.0
(0%)
0.0
(0%)
Volume adj. forecast, £m 133.0 139.4 144.9 147.8 150.7
Overlay, £m
(%)
-17.3
(-13%)
-18.1
(-13%)
-18.8
(-13%)
-19.2
(-13%)
-19.6
(-13%)
Management stretch, £m
(%)
7.1
(6%)
10.0
(8%)
13.1
(10%)
16.2
(13%)
19.5
(15%)
Final forecast, £m 122.8 131.3 139.2 144.8 150.6
Property (HAL mid pax forecasts)
HAL forecast, £m
Difference with CEPA, £m
Cumulative difference, £m
Source: CEPA analysis

Section Four
F. Other non-aeronautical revenues
Commercial revenue forecasts

Service revenue
172
Service revenue includes commercial revenue from other areas, with HAL listing areas such as the Fast Track service, VIP charges, and aviation fuel.
The key differences between HAL’s forecasts and ours are as follows:
• As discussed in the elasticities section, we apply an elasticity of 0. with respect to passenger numbers rather than HAL’s proposal of .
• We also assume revenues increase by CPI rather than RPI.
• Finally, we apply a 2% management challenge adjustment each year from 2020.
2019 2022 2023 2024 2025 2026
HAL
forecasts
2018 RPI
prices
2019 baseline 52.8
Forecast
Nominal Forecast
CEPA
forecasts
Nominal Forecast36.6 47.1 55.0 60.4 64.0
HAL forecasts: Service revenue
Source: CEPA analysis, HAL RBP model

Section Four
G. Cargo revenues
Commercial revenue forecasts
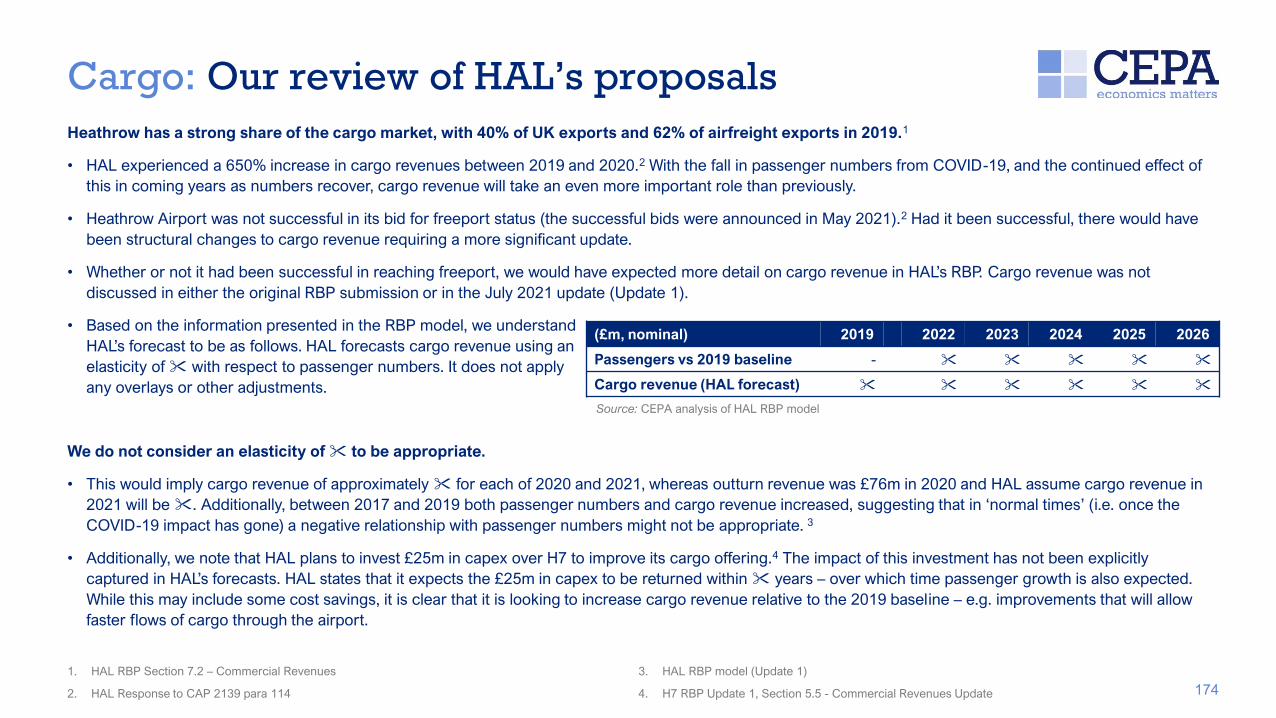
Cargo: Our review of HAL’s proposals
174
Heathrow has a strong share of the cargo market, with 40% of UK exports and 62% of airfreight exports in 2019.1
• HAL experienced a 650% increase in cargo revenues between 2019 and 2020.2 With the fall in passenger numbers from COVID-19, and the continued effect of
this in coming years as numbers recover, cargo revenue will take an even more important role than previously.
• Heathrow Airport was not successful in its bid for freeport status (the successful bids were announced in May 2021).2 Had it been successful, there would have
been structural changes to cargo revenue requiring a more significant update.
• Whether or not it had been successful in reaching freeport, we would have expected more detail on cargo revenue in HAL’s RBP. Cargo revenue was not
discussed in either the original RBP submission or in the July 2021 update (Update 1).
• Based on the information presented in the RBP model, we understand
HAL’s forecast to be as follows. HAL forecasts cargo revenue using an
elasticity of with respect to passenger numbers. It does not apply
any overlays or other adjustments.
1. HAL RBP Section 7.2 – Commercial Revenues
2. HAL Response to CAP 2139 para 114
3. HAL RBP model (Update 1)
4. H7 RBP Update 1, Section 5.5 - Commercial Revenues Update
(£m, nominal) 2019 2022 2023 2024 2025 2026
Passengers vs 2019 baseline -
Cargo revenue (HAL forecast)
We do not consider an elasticity of to be appropriate.
• This would imply cargo revenue of approximately for each of 2020 and 2021, whereas outturn revenue was £76m in 2020 and HAL assume cargo revenue in
2021 will be . Additionally, between 2017 and 2019 both passenger numbers and cargo revenue increased, suggesting that in ‘normal times’ (i.e. once the
COVID-19 impact has gone) a negative relationship with passenger numbers might not be appropriate. 3
• Additionally, we note that HAL plans to invest £25m in capex over H7 to improve its cargo offering.4 The impact of this investment has not been explicitly
captured in HAL’s forecasts. HAL states that it expects the 2 m in capex to be returned within years – over which time passenger growth is also expected.
While this may include some cost savings, it is clear that it is looking to increase cargo revenue relative to the 2019 baseline – e.g. improvements that will allow
faster flows of cargo through the airport.
Source: CEPA analysis of HAL RBP model

Cargo: CEPA proposal
175
Given the issues outlined in the previous slide, we present an alternate set of assumptions:
• HAL has provided us with actual cargo revenues for 2020 and their forecast for 2021. We use these figures to estimate an elasticity – working out the elasticity
required to match these figures given passenger volumes for these two years, and given our 2% management stretch estimate. This results in us applying an
elasticity of -8.50 with respect to passenger numbers. While not a long-term view of the relationship, this elasticity broadly matches the short-term relationship
between passenger volumes and cargo revenue in 2020 and 2021.
• We also note that HAL has proposed a £25.4m investment in its cargo offering, with a 14 year payback. Assuming an increase in revenue from year three (2024)
for twelve years, and using HAL’s proposed WACC to approximate the IRR, we estimate that there would be an additional . m cargo revenue per year. We
assume this impact would be captured within the management challenge estimate.
£m, nominal 2020 2021 2022 2023 2024 2025 2026
2019 value 10.6 10.6 10.6 10.6 10.6 10.6 10.6
Actuals 75.5
HAL forecast
CEPA forecast 80.6 84.2 62.0 45.1 33.9 28.6 27.3
Historical and forecast cargo revenues (HAL mid pax forecasts)
Source: HAL Updated RBP and CEPA analysis
0
10
20
0
0
0
0
70
0
90
2017 201 2019 2020 2021 2022 202 202 202 202
H7 orecast ( m, 2019 pricesl)
2019 value Actuals (and 2021 estimate)
HAL proposal CEPA proposal
Source: CEPA analysis, HAL RBP model

Section Four
H. Capital investment
Commercial revenue forecasts

Capital investment: Summary of HAL’s proposals
177
HAL’s Safety Only capital plan (£ m)
• CRM and loyalty systems
• Advertising screens and other media assets
• Car park payment machines
• HEx train replacements
• VIP suite assets
• Surface access assets, including car parks
HAL proposes two capital plans, a Safety Only plan (full RAB adjustment) and an Optimal plan (no RAB adjustment). HAL claims that,
absent of the optimal plan investments, there would be a reduction in commercial revenues of £192m (2018 RPI prices).
HAL’s Optimal capital plan (£ m + £ m)
• Property: opportunities to drive revenue through development of HAL’s
estate
• Surface Access (asset replacement): replace parking assets.
• Surface access (Electrification & development): Car park optimisation and
consolidation work, along with the provision of EV charging
• Retail & media: range of initiatives to develop retail space and digital media
• Digital transformation: range of investments to develop eCommerce
capability
• Cargo: HAL claims that this does not drive revenue directly, and so a long
payback period has been assumed
PlanH7 investment (£m, 2018 RPI prices)
Total H72022 2023 2024 2025 2026
Safety Only 10 25 25 20 20 100
Optimal 10 70 160 170 190 600
In the following slides, we consider the potential for commercial revenue benefits to arise from each element of the Capital Plan.
Source: HAL RBP
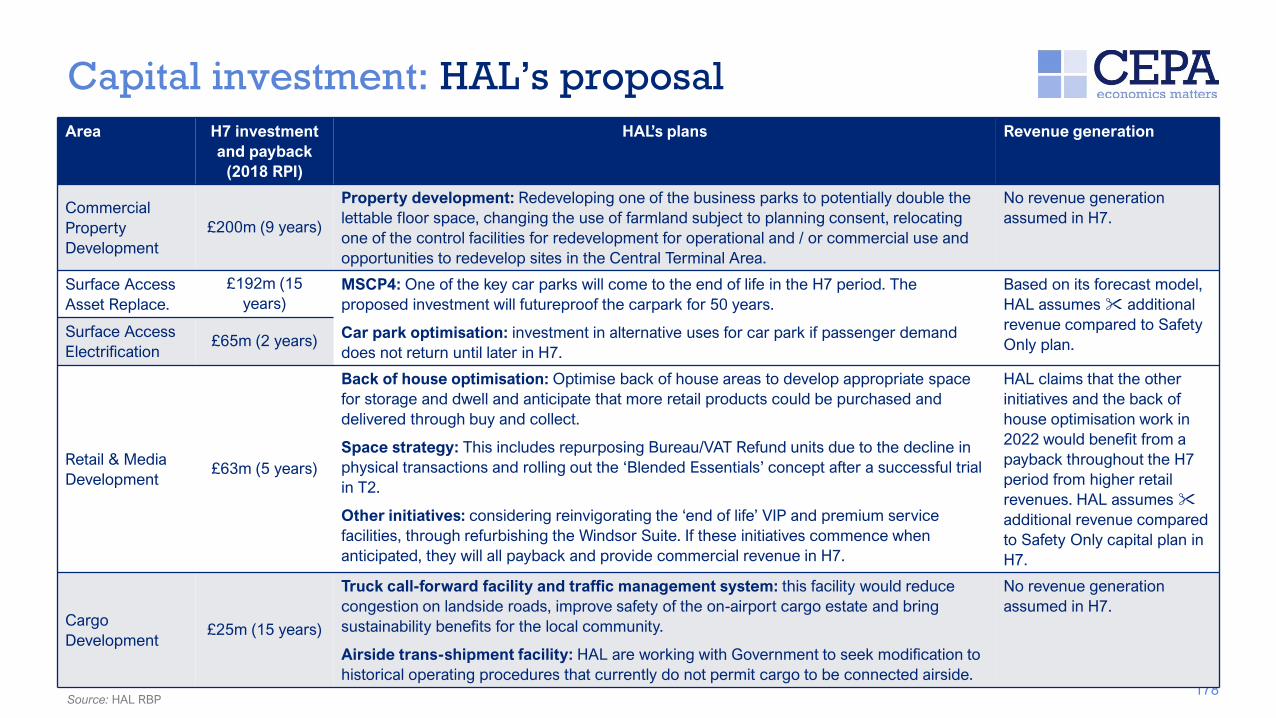
Capital investment: HAL’s proposal
178
Area H7 investment
and payback
(2018 RPI)
HAL’s plans Revenue generation
Commercial
Property
Development
£200m (9 years)
Property development: Redeveloping one of the business parks to potentially double the
lettable floor space, changing the use of farmland subject to planning consent, relocating
one of the control facilities for redevelopment for operational and / or commercial use and
opportunities to redevelop sites in the Central Terminal Area.
No revenue generation
assumed in H7.
Surface Access
Asset Replace.
£192m (15
years)
MSCP4: One of the key car parks will come to the end of life in the H7 period. The
proposed investment will futureproof the carpark for 50 years.
Car park optimisation: investment in alternative uses for car park if passenger demand
does not return until later in H7.
Based on its forecast model,
HAL assumes additional
revenue compared to Safety
Only plan.Surface Access
Electrification£65m (2 years)
Retail & Media
Development £63m (5 years)
Back of house optimisation: Optimise back of house areas to develop appropriate space
for storage and dwell and anticipate that more retail products could be purchased and
delivered through buy and collect.
Space strategy: This includes repurposing Bureau/VAT Refund units due to the decline in
physical transactions and rolling out the ‘Blended Essentials’ concept after a successful trial
in T2.
Other initiatives: considering reinvigorating the ‘end of life’ VIP and premium service
facilities, through refurbishing the Windsor Suite. If these initiatives commence when
anticipated, they will all payback and provide commercial revenue in H7.
HAL claims that the other
initiatives and the back of
house optimisation work in
2022 would benefit from a
payback throughout the H7
period from higher retail
revenues. HAL assumes
additional revenue compared
to Safety Only capital plan in
H7.
Cargo
Development£25m (15 years)
Truck call-forward facility and traffic management system: this facility would reduce
congestion on landside roads, improve safety of the on-airport cargo estate and bring
sustainability benefits for the local community.
Airside trans-shipment facility: HAL are working with Government to seek modification to
historical operating procedures that currently do not permit cargo to be connected airside.
No revenue generation
assumed in H7.
Source: HAL RBP

Capital investment: Our view
179
H7 (£m, 2018 RPI
prices) 2022 2023 2024 2025 2026 H7
HAL’s
assumption
Our view
Commercial Property
Development67 67 67 200
HAL assumes
generation in H7
We consider it likely that this investment will generate revenue
in the long run. However, as HAL propose to only make these
investments in the latter part of H7 (2024-26), we consider it
unlikely to generate significant revenue in H7.
Surface Access Asset
Replacement 52 64 76 192 HAL assumes
additional
revenue in H7
As investment in alternative uses for car parks, will protect
commercial revenue streams, it is likely that this will generate
additional revenue in H7.Surface Access
Electrification & dev.2 24 14 12 13 65
Retail & Media
Development 3 23 14 12 11 63
HAL assumes
additional
revenue in H7
We agree with HAL that the other initiatives and the back of
house optimisation work in 2022 would benefit from a payback
throughout the H7 period from higher retail revenues.
Cargo Development 2 13 3 3 5 25HAL assumes
generation in H7
This is likely to generate some revenue in H7. It is clear that
HAL is looking to increase cargo revenue relative to the 2019
baseline.
Based on HAL's commercial revenue forecasts, it claims that the optimal plan will generate additional revenue for retail, rail and surface access. Our view is that
Cargo investments are also likely to generate revenue in H7. We have assumed this effect is captured within our management challenge allowance.
Source: CEPA analysis, HAL RBP model

Section Four
I. Overall results
Commercial revenue forecasts

Commercial Revenues: Summary
181
Nominal, £m 2022 2023 2024 2025 2026
Retail excl. Bureaux
Bureaux
Surface access
Service excl. surface access
Property
Rail
Other
Terminal drop-off charge
Red terminal revenue (HMT)
Minimal capex overlay
Total 484 613 715 779 806
Total per passenger, £ 11.66 10.91 10.89 11.07 11.19
HAL forecasts: HAL mid pax forecasts, No RAB Adjustment CEPA forecasts: HAL mid pax forecasts, No RAB Adjustment
Nominal, £m 2022 2023 2024 2025 2026
Retail excl. Bureaux 234 332 405 453 485
Bureaux 10 13 14 14 14
Surface access 99 131 143 162 172
Service excl. surface access 37 47 55 60 64
Property 123 131 139 145 151
Rail 79 102 108 119 125
Other 1 1 1 1 1
Terminal drop-off charge 58 71 78 97 95
Red terminal revenue (HMT) 17 7 0 0 0
Minimal capex overlay 0 0 0 0 0
Total 657 835 944 1,051 1,108
Total per passenger, £ 15.80 14.86 14.39 14.94 15.38
Difference with HAL, £m 173 222 229 272 302
Cumulative difference, £m 1,197
Cumulative difference excl. capex overlay, £m 972
Cargo, £m Cargo, £m 62 45 34 29 27
Source: HAL Analysis Source: CEPA Analysis
Source: HAL Analysis
Notes:
- HAL and CEPA revenue forecasts are reported on a consistent HAL Mid pax forecast scenario.
- The Retail excl. Bureaux lines have been taken from HAL’s model rather than the RBP Update 1
Commercial revenues chapter. Over the H7 period, the Retail revenue forecasts are approximately
higher in the model than in the chapter.

Commercial Revenues: Summary
182
2018 RPI, £m 2022 2023 2024 2025 2026
Retail excl. Bureaux
Bureaux
Surface access
Service excl. surface access
Property
Rail
Other
Terminal drop-off charge
Red terminal revenue (HMT)
Minimal capex overlay
Total 442 546 618 653 656
Total per passenger, £ 10.63 9.71 9.41 9.28 9.11
HAL forecasts: HAL mid pax forecasts, No RAB Adjustment CEPA forecasts: HAL mid pax forecasts, No RAB Adjustment
2018 RPI, £m 2022 2023 2024 2025 2026
Retail excl. Bureaux 215 298 354 384 399
Bureaux 10 12 12 12 11
Surface access 91 118 125 137 142
Service excl. surface access 34 42 48 51 53
Property 113 118 121 123 124
Rail 72 91 94 100 103
Other 1 1 1 1 1
Terminal drop-off charge 53 63 68 82 78
Red terminal revenue (HMT) 16 6 0 0 0
Minimal capex overlay 0 0 0 0 0
Total 603 749 825 891 912
Total per passenger, £ 14.51 13.33 12.56 12.67 12.66
Difference with HAL, £m 161 204 207 238 256
Cumulative difference, £m 1,066
Cumulative difference excl. capex overlay, £m 875
Cargo, £m Cargo, £m 57 40 30 24 22
Source: HAL Analysis
Notes:
- HAL and CEPA revenue forecasts are reported on a consistent HAL Mid pax forecast scenario.
- The Retail excl. Bureaux lines have been taken from HAL’s model rather than the RBP Update 1
Commercial revenues chapter. Over the H7 period, the Retail revenue forecasts are approximately
higher in the model than in the chapter.
Source: HAL Analysis Source: CEPA Analysis
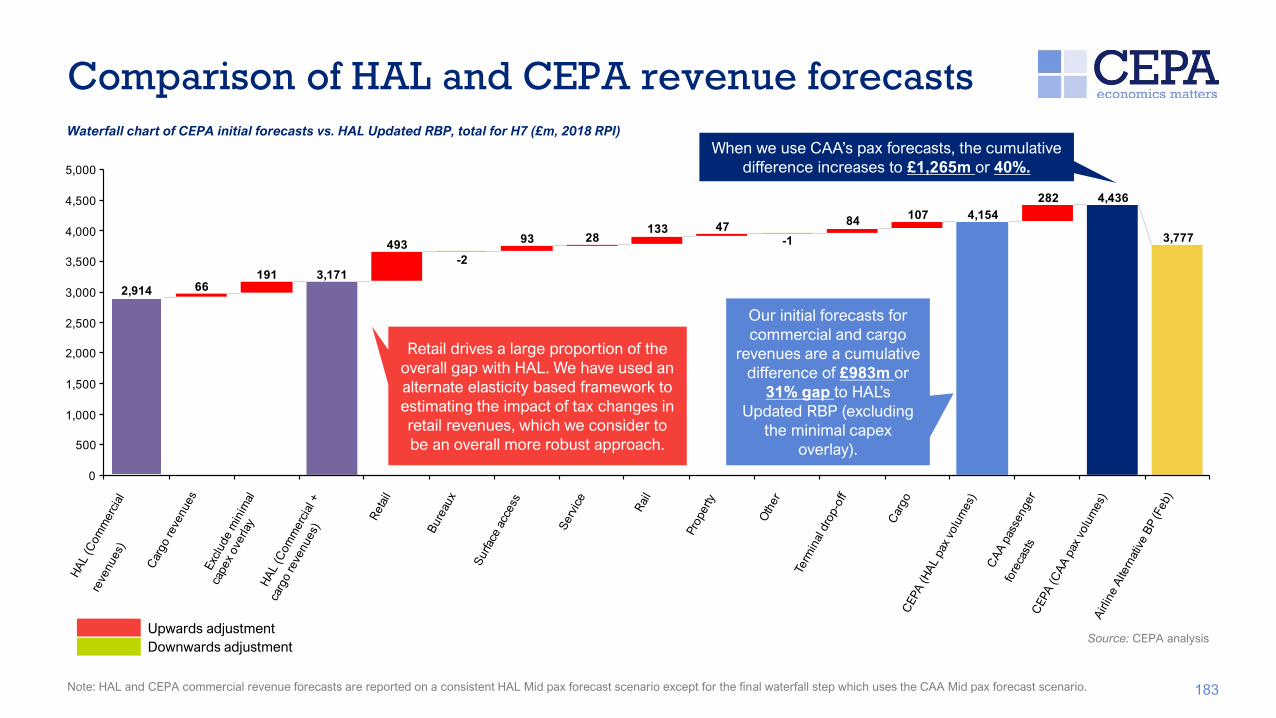
0
00
1,000
1, 00
2,000
2, 00
,000
, 00
,000
, 00
,000
When we use CAA’s pax forecasts, the cumulative
difference increases to £1,265m or 40%.
Comparison of HAL and CEPA revenue forecasts
183
Waterfall chart of CEPA initial forecasts vs. HAL Updated RBP, total for H7 (£m, 2018 RPI)
Upwards adjustment
Downwards adjustmentSource: CEPA analysis
Our initial forecasts for
commercial and cargo
revenues are a cumulative
difference of £983m or
31% gap to HAL’s
Updated RBP (excluding
the minimal capex
overlay).
Retail drives a large proportion of the
overall gap with HAL. We have used an
alternate elasticity based framework to
estimating the impact of tax changes in
retail revenues, which we consider to
be an overall more robust approach.
Note: HAL and CEPA commercial revenue forecasts are reported on a consistent HAL Mid pax forecast scenario except for the final waterfall step which uses the CAA Mid pax forecast scenario.

Comparison of HAL and CEPA revenue forecasts
184
Source: CEPA analysis
Note: Both HAL and the CAA have developed High, Mid, Low pax forecasts for the H7 period. We use the Mid pax forecast for figures presented above.
Comparison of per passenger commercial and cargo revenue forecasts
. .
. . . .
.
.
. . . .
.
.
. . . .
.
. . .
0
10
1
20
2
201 201 201 2017 201 2019 2020 2021 2022 202 202 202 202
Per passenger commercial and cargo reve
nues ( , 201 RPI
prices)
Historical HAL (Mid, no RAB adjustment) CEPA (HAL pax forecasts) CEPA (CAA pax forecasts)
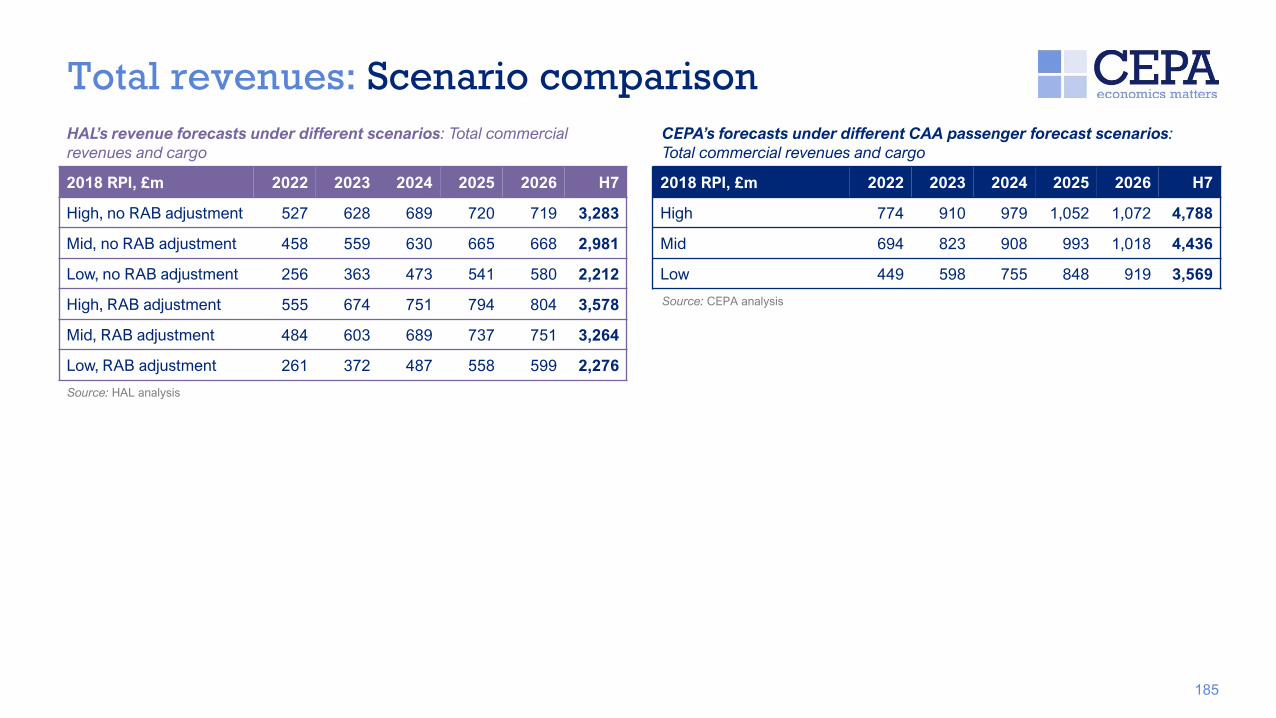
Total revenues: Scenario comparison
185
2018 RPI, £m 2022 2023 2024 2025 2026 H7
High, no RAB adjustment 527 628 689 720 719 3,283
Mid, no RAB adjustment 458 559 630 665 668 2,981
Low, no RAB adjustment 256 363 473 541 580 2,212
High, RAB adjustment 555 674 751 794 804 3,578
Mid, RAB adjustment 484 603 689 737 751 3,264
Low, RAB adjustment 261 372 487 558 599 2,276
HAL’s revenue forecasts under different scenarios: Total commercial
revenues and cargo
CEPA’s forecasts under different CAA passenger forecast scenarios:
Total commercial revenues and cargo
2018 RPI, £m 2022 2023 2024 2025 2026 H7
High 774 910 979 1,052 1,072 4,788
Mid 694 823 908 993 1,018 4,436
Low 449 598 755 848 919 3,569
Source: HAL analysis
Source: CEPA analysis
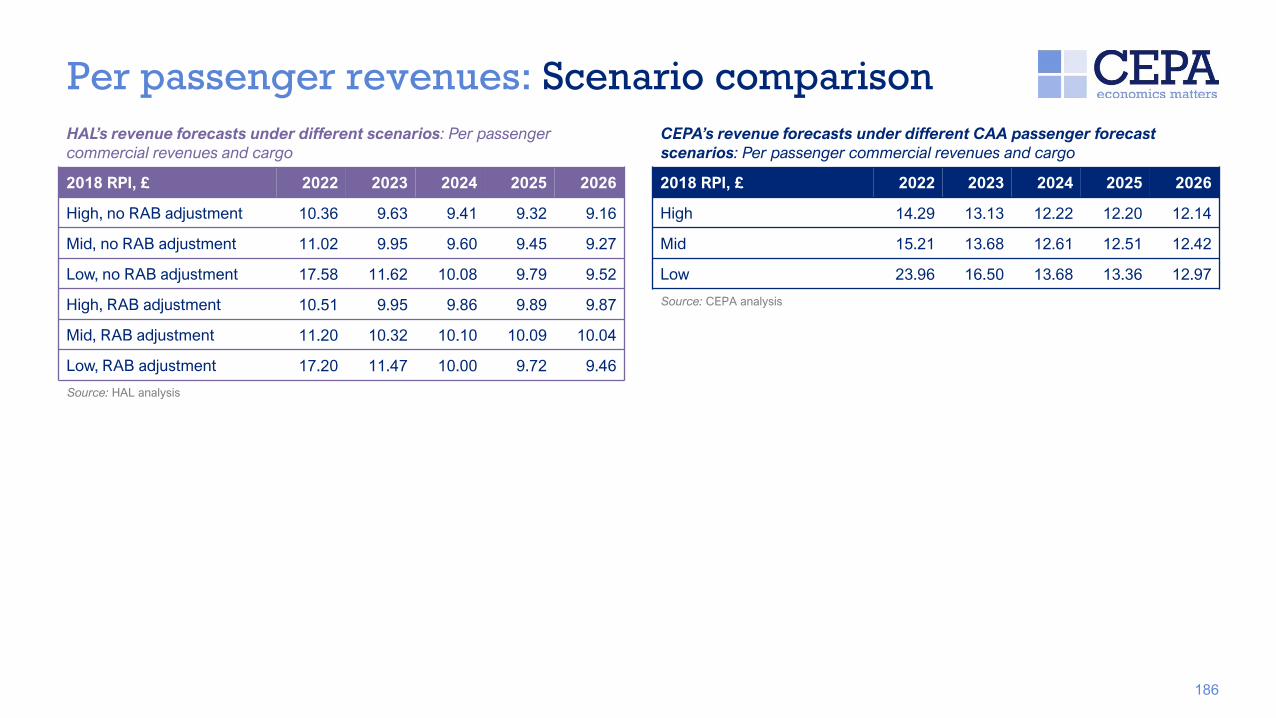
Per passenger revenues: Scenario comparison
186
2018 RPI, £ 2022 2023 2024 2025 2026
High, no RAB adjustment 10.36 9.63 9.41 9.32 9.16
Mid, no RAB adjustment 11.02 9.95 9.60 9.45 9.27
Low, no RAB adjustment 17.58 11.62 10.08 9.79 9.52
High, RAB adjustment 10.51 9.95 9.86 9.89 9.87
Mid, RAB adjustment 11.20 10.32 10.10 10.09 10.04
Low, RAB adjustment 17.20 11.47 10.00 9.72 9.46
HAL’s revenue forecasts under different scenarios: Per passenger
commercial revenues and cargo
CEPA’s revenue forecasts under different CAA passenger forecast
scenarios: Per passenger commercial revenues and cargo
2018 RPI, £ 2022 2023 2024 2025 2026
High 14.29 13.13 12.22 12.20 12.14
Mid 15.21 13.68 12.61 12.51 12.42
Low 23.96 16.50 13.68 13.36 12.97
Source: HAL analysis
Source: CEPA analysis

UK
Queens House
55-56 Lincoln’s Inn Fields
London WC2A 3LJ
T. +44 (0)20 7269 0210
www.cepa.co.uk
Australia
Level 20, Tower 2 Darling Park
201 Sussex Street
Sydney NSW 2000
T. +61 2 9006 1308
cepa-ltd @cepaltd
www.cepa.net.au