H1 2017 Analyst presentation - Gruppo Hera · Special waste Urban waste Waste from Mkt ... 238.9...
16
H1 2017 financial results
Transcript of H1 2017 Analyst presentation - Gruppo Hera · Special waste Urban waste Waste from Mkt ... 238.9...

H1 2017financial results

506
216141
Ebitda Pre tax Net Profit
01GRUPPOHERA
A robust set of results consistent with Q1
H1 main figures(M€)
Highlights on H1 results
+7.6%
+8.5%
+16.5%

6,5 7,0 6,8
7,3 8,2
9,6
H'12 Adj. H'13 H'14 H'15 H'16 H'17
02GRUPPOHERA
Good visibility
“More than” half the away to year end
H1 EPS growth of last 5 years(€c) +8.1%
CAGR
65%Of yearlyresults: 60% 60% 59% 58%

03GRUPPOHERA
Ebitda growth drivers(M€)
470,1
512,1
505,9+33,4
+8.6
(6.2)
H1 '16 Internal Growth M&A Subtot. Incentives H1 '17
Recurrent growth factors drive performance
H1 2017 EBITDA growth drivers
+7.6%
+8.9%

121,4116.5
+7,4 +7,6
(3.9)(6.2)
H1 '16 InternalGrowth
M&A WTE maint. Incentive H1 '17
WASTE: Benefitting positive market trends and M&A
Ebitda growth drivers(M€)
GRUPPOHERA 04
2017 acquisitions
Waste volumes from third parties(kton)
+82,1+76,3 +5,8
Special waste Urban waste Waste from Mkt
Good progression despite all
Booked contribution from 1 January 2017

212,4216,4
(6.4)
+2,4
H1 '16 Organic growth Efficiencies H1 '17
NETWORKS: tariffs and cost savings progressing
Ebitda growth drivers(M€)
05GRUPPOHERA
Ebitda breakdown by business(M€)
111,3
73,318,8
9,0 212,4
Water Gas distr. EE distr. D.H. H1 Ebitda
“Quality premium”

ENERGY: all market segments expanded
Safeguarded clients main growth driver
162.2
128.5+6.9
+23.4 +5.2
(1.8)
H1 '16 Gas Electr. Power Gen. Other H1 '17
Ebitda growth drivers(M€)
06GRUPPOHERA
IndustrialDevelopment
DevelopmentWaste
DevelopmentNetworks
DevelopmentEnergy
Customer base growth(‘000)
2.195
2.317
+47
+75
H1 '16 Gas Electricity H1 '17
+122k customers
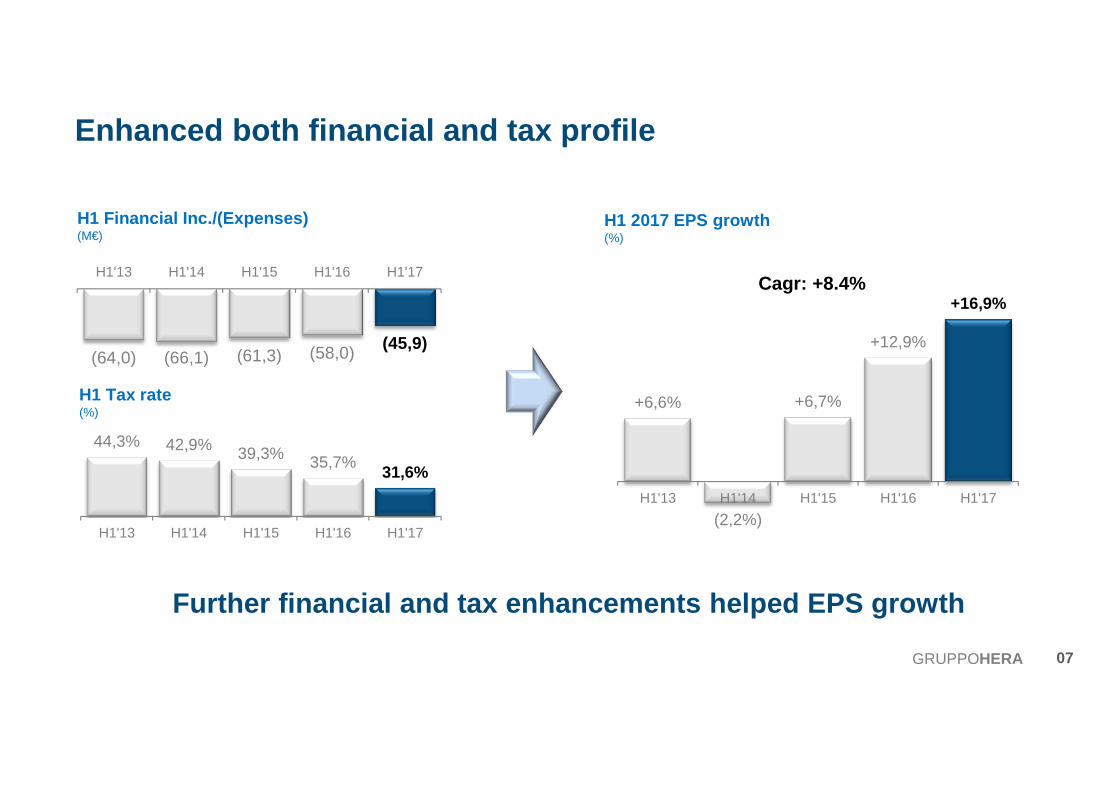
Enhanced both financial and tax profile
Further financial and tax enhancements helped EPS g rowth
H1 Financial Inc./(Expenses)(M€)
H1 Tax rate(%)
(64,0) (66,1) (61,3) (58,0) (45,9)
H1'13 H1'14 H1'15 H1'16 H1'17
44,3% 42,9% 39,3% 35,7%31,6%
H1'13 H1'14 H1'15 H1'16 H1'17
07GRUPPOHERA
DevelopmentWaste
H1 2017 EPS growth(%)
+16.9%
+6,6%
(2,2%)
+6,7%
+12,9%
+16,9%
H1'13 H1'14 H1'15 H1'16 H1'17
Cagr: +8.4%

Cash flows
08GRUPPOHERA
Once again: more with less
+358.1
+188.8
+87.7
(108.6)
(52.8)
(3.3) (15.2)
(150.8)
+7.5
(140.4)
Op. CF NWC Provisions Capex Free CF M&A Other FCF fordividends
Div. & Min. Debtchange
Free cash flows H1 2017(M€)

Closing remarks
09GRUPPOHERA
• Good performances, fully accounting M&A executed. Even though Q2 low seasonality, EPS up double digit and comfortable cash flows.
• DPS at 9 Eurocents paid as promised.
• H1 EPS at 9.6 Eurocents, already covering promised dividend of next June 2018 (of 9.5 Eurocent).
H1 2017 EPS growth(%)
H1 '17
+16.9%
Comfortable visibility on year end
9.6c€

Annex: P&L
10GRUPPOHERA
H1 ‘16 H1 ’17
REVENUES 2,664.8 2,956.3 +10.9%
EBITDA 470.1 505.9 +7.6%
Ebitda margin 17.6% 17.1%
Depreciation and provisions (212.7) (243.7)
EBIT 257.4 262.2 +1.9%
Cost of Debt (54.4) (43.5)
Figurative interests (IAS) (10.1) (10.6)
Income from Associates & J.V. 6.5 8.2
PRETAX PROFIT 199.4 216.3 +8.5%
Tax (71.2) (68.3)
Tax rate 35.7% 31.6%
Minorities (7.2) (7.0)
NET PROFIT POST MINORITIES 121.0 141.0 +16.5%
H1 Profit & Loss(M€)

(m€)
Revenues
Ebitda
Annex: Waste
Leveraging on market expansion
11GRUPPOHERA
Q1 2016 Q1 2017 Ch.
235.4 240.2 +4.8
62.4 64.0 +1.5
Q2 2016 Q2 2017 Ch.
256.0 306.2 +90.8
54.0 57.3 +2.4
H1 2016 H1 2017 Ch.
491.4 546.4 +55.0
116.5 121.3 +4.8
Data
Urban W. Volumes (Kton)
Special W. Volumes (Kton)
Waste from third partiesInternal W. Volumes (Kton)
Total Volumes Treated
Q1 2016 Q1 2017 Ch.
471.0 471.7 +0.7
581.0 627.0 +46.0
1,052.0 1,098.7 +46.7625.7 588.3 (37.4)
1,677.7 1,687.0 +9.3
Q2 2016 Q2 2017 Ch.
536.6 541.7 +5.1
597.1 627.4 +30.3
1,133.8 1,169.2 +35.4650.6 714.7 +64.0
1,784.4 1,883.8 +99.4
H1 2016 H1 2017 Ch.
1,007.6 1,013.4 +5.8
1,178.1 1,254.5 +76.3
2,185.8 2,267.9 +82.11,276.3 1,303.0 +26.7
3,462.1 3,570.8 +108.8

H1 2016 H1 2017 Ch.
374.1 406.9 +32.7
106.6 111.3 +4.7
Q2 2016 Q2 2017 Ch.
194.7 205.0 +10.2
56.8 58.1 +1.0
Q1 2016 Q1 2017 Ch.
179.4 201.8 +22.5
49.8 53.3 +3.4
(m€)
Revenues
Ebitda
Annex: Water
Growing results in Water
12GRUPPOHERA
Data
Aqueduct (mm3)Sewerage (mm3)
Purification (mm3)
Q1 2016 Q1 2017 Ch.
69.8 71.1 +1.3
57.3 54.8 (2.5)
56.8 54.6 (2.2)
Q2 2016 Q2 2017 Ch.
73.2 75.6 +2.4
60.8 67.0 +6.2
60.3 66.1 +5.8
H1 2016 H1 2017 Ch.
143.0 146.7 +3.7
118.1 121.8 +3.7
117.0 120.7 +3.6

Q2 2016 Q2 2017 Ch.
273.7 287.5 +28.1
35.0 36.2 +1.2
H1 2016 H1 2017 Ch.
834.7 937.9 +103.2
165.2 171.8 +6.6
Annex: Gas
Default gas underpinned margins
13GRUPPOHERA
Q1 2016 Q1 2017 Ch.
561.0 650.4 +89.4
130.3 135.6 +5.4
(m€)
Revenues
Ebitda
Data
Volumes distrib. (mm3)
Volumes sold (mm3)
of which trading (mm3)
District Heating (GWht)
Clients ('000 unit)
Q1 2016 Q1 2017 Ch.
1,313.3 1,367.1 +53.8
1,261.2 1,596.2 +335.0
324.0 585.8 +261.8
238.9 243.9 +5.0
1,327.1 1,383.2 +56.1
Q2 2016 Q2 2017 Ch.
361.6 368.2 +6.5
701.8 661.6 (40.2)
416.2 383.1 (33.1)
44.6 47.7 +3.2
H1 2016 H1 2017 Ch.
1,675.0 1,735.3 +60.3
1,963.0 2,257.7 +294.7
740.2 968.9 +228.7
283.5 291.7 +32.2
1,339.2 1,386.0 +46.8

H1 2016 H1 2017 Ch.
1,006.8 1,147.6 +140.8
73.1 91.6 +18.4
Q2 2016 Q2 2017 Ch.
647.0 513.4 +186.8
41.5 43.1 +22.8
Q1 2016 Q1 2017 Ch.
359.8 634.1 +274.4
31.6 48.4 +16.8
Safeguarded clients underpinned margins
Annex: Electricity
14GRUPPOHERA
(m€)
Revenues
Ebitda
Data
Volumes sold (GWh)
of which Salvaguardia (GWh)
Volumes distrib. (GWh)
Clients ('000 unit)
Q1 2016 Q1 2017 Ch.
2,524.2 2,478.9 (45.3)
656.5 507.1 (149.4)
747.6 751.2 +3.6
862.6 911.3 +48.6
Q2 2016 Q2 2017 Ch.
1,142.6 1,333.9 +191.3
520.3 486.0 (34.3)
699.4 716.5 +17.1
(7.0) 19.5 +26.5
H1 2016 H1 2017 Ch.
3,666.8 3,812.8 +146.0
1,176.8 993.1 (183.7)
1,447.0 1,467.7 +20.8
855.6 930.8 +75.2


![H1 - Financial Year 2016 - EDAGir.edag.com/download/companies/edag/Presentations/H12016... · Analyst Presentation – H1 2016 355.2 362.4 H1 2015 H1 2016 Core Revenue [m€] Revenues](https://static.fdocuments.in/doc/165x107/5f746af321bff008d84401b2/h1-financial-year-2016-analyst-presentation-a-h1-2016-3552-3624-h1-2015.jpg)