H The survey of disability, ageing and carers
24
THE SURVEY OF DISABILITY, AGEING AND CARERS H.1 H The survey of disability, ageing and carers One of the principal data sources about older Australians, their care needs and the people who care for them is the Australian Bureau of Statistics’ (ABS) Survey of Disability, Ageing and Carers (SDAC). This appendix provides a brief background to the survey (section H.1), explores the accuracy and applicability of the survey including some unexpected outcomes in relation to dementia (section H.2) and outlines the data the Commission has extracted from the SDAC to assist with undertaking this inquiry (section H.3). H.1 What is the SDAC? SDAC is an ABS survey that collects information on people who may need care and who provide care in Australia. The latest three survey periods were 1998, 2003 and 2009, with the results of the 2009 SDAC being progressively released since November 2010 — coinciding with the timing of this inquiry. The SDAC collects information on three subsets of the Australian population who: have a disability are aged 60 years or older provide assistance to older people or people with a disability. As such, the survey is a timely and relevant data source for this inquiry. It contains estimates of the prevalence of diseases, conditions and disabilities that affect older Australians; what needs older people and their carers have; and how well these needs are being met. Descriptive statistics on both those receiving care and those providing care are also provided by the SDAC. While the structure, and some variables, of the SDAC have changed over the survey periods, they are largely comparable which allows trends to be examined.
Transcript of H The survey of disability, ageing and carers

THE SURVEY OF DISABILITY, AGEING AND CARERS
H.1
H The survey of disability, ageing and carers
One of the principal data sources about older Australians, their care needs and the people who care for them is the Australian Bureau of Statistics’ (ABS) Survey of Disability, Ageing and Carers (SDAC). This appendix provides a brief background to the survey (section H.1), explores the accuracy and applicability of the survey including some unexpected outcomes in relation to dementia (section H.2) and outlines the data the Commission has extracted from the SDAC to assist with undertaking this inquiry (section H.3).
H.1 What is the SDAC?
SDAC is an ABS survey that collects information on people who may need care and who provide care in Australia. The latest three survey periods were 1998, 2003 and 2009, with the results of the 2009 SDAC being progressively released since November 2010 — coinciding with the timing of this inquiry.
The SDAC collects information on three subsets of the Australian population who:
have a disability
are aged 60 years or older
provide assistance to older people or people with a disability.
As such, the survey is a timely and relevant data source for this inquiry. It contains estimates of the prevalence of diseases, conditions and disabilities that affect older Australians; what needs older people and their carers have; and how well these needs are being met. Descriptive statistics on both those receiving care and those providing care are also provided by the SDAC.
While the structure, and some variables, of the SDAC have changed over the survey periods, they are largely comparable which allows trends to be examined.

H.2 CARING FOR OLDER AUSTRALIANS
H.2 Accuracy of the survey results
This section examines the SDAC survey and how its accuracy and reliability may have changed over time. This can guide the Commission in how best to use the survey results and identify where the survey results should be treated with caution. For example, this discussion of the reliability and applicability of the survey results has assisted the Commission in assessing the prevalence data on dementia — as those results appear to be inconsistent with other studies and did not conform to prior expectations.
As with any survey, the data contained in the SDAC are subject to sampling error. That is, the people chosen to participate in the survey may not be representative of the general population. The 2003 and 2009 SDACs have benefited from recent improvements in survey design techniques and tools to test the accuracy of surveys.
One way of indicating the accuracy of the survey is by the calculation of confidence intervals. Where used, the Commission has calculated what are referred to as 95 per cent confidence intervals. This indicates that if the survey methodology was repeated 100 times, the actual value of the variable in the general population would be expected to fall within the calculated confidence interval 95 times. The approach used by the ABS to develop standard errors (on which the confidence intervals are based) for the last three survey periods is different, but the changes should enhance the robustness of the confidence intervals in the 2003 and 2009 surveys (box H.1).
An important characteristic of the SDAC is that, apart from people living in cared accommodation1, it is self reported — that is, it relies on survey respondents to accurately provide information on the questions they are asked2. When a person provides inaccurate information (either accidently or deliberately) it is known as ‘self reporting bias’. One area where the effects of this is potentially quite significant is in the calculation of disease and disability prevalence rates. The reporting of diseases and disabilities in the SDAC could be inaccurate because of:
the methodology of the survey
undiagnosed conditions
misdiagnosed conditions
deliberately misreported conditions
accidently unreported conditions.
1 Cared accommodation includes hospitals, homes for the aged such residential aged care
facilities and aged care hostels, cared components of retirement villages, and other 'homes', such as children's homes.
2 This is a common method and is used in numerous other surveys around the world including the Australian Census of Population and Housing.
THE SURVEY OF DISABILITY, AGEING AND CARERS
H.3
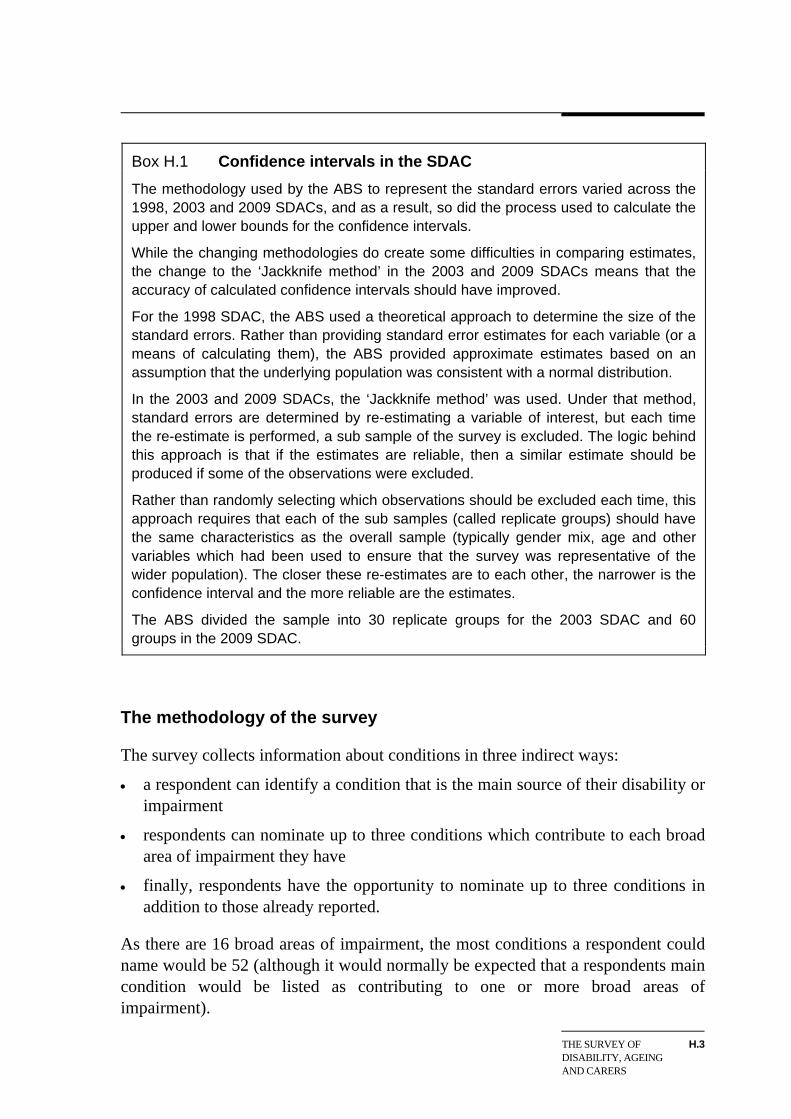
Box H.1 Confidence intervals in the SDAC
The methodology used by the ABS to represent the standard errors varied across the 1998, 2003 and 2009 SDACs, and as a result, so did the process used to calculate the upper and lower bounds for the confidence intervals.
While the changing methodologies do create some difficulties in comparing estimates, the change to the ‘Jackknife method’ in the 2003 and 2009 SDACs means that the accuracy of calculated confidence intervals should have improved.
For the 1998 SDAC, the ABS used a theoretical approach to determine the size of the standard errors. Rather than providing standard error estimates for each variable (or a means of calculating them), the ABS provided approximate estimates based on an assumption that the underlying population was consistent with a normal distribution.
In the 2003 and 2009 SDACs, the ‘Jackknife method’ was used. Under that method, standard errors are determined by re-estimating a variable of interest, but each time the re-estimate is performed, a sub sample of the survey is excluded. The logic behind this approach is that if the estimates are reliable, then a similar estimate should be produced if some of the observations were excluded.
Rather than randomly selecting which observations should be excluded each time, this approach requires that each of the sub samples (called replicate groups) should have the same characteristics as the overall sample (typically gender mix, age and other variables which had been used to ensure that the survey was representative of the wider population). The closer these re-estimates are to each other, the narrower is the confidence interval and the more reliable are the estimates.
The ABS divided the sample into 30 replicate groups for the 2003 SDAC and 60 roups in the 2009 SDAC. g
The methodology of the survey
The survey collects information about conditions in three indirect ways:
a respondent can identify a condition that is the main source of their disability or impairment
respondents can nominate up to three conditions which contribute to each broad area of impairment they have
finally, respondents have the opportunity to nominate up to three conditions in addition to those already reported.
As there are 16 broad areas of impairment, the most conditions a respondent could name would be 52 (although it would normally be expected that a respondents main condition would be listed as contributing to one or more broad areas of impairment).

H.4 CARING FOR OLDER AUSTRALIANS
This indirect method of identifying what conditions respondents might have effects on the reliability of prevalence rates based on the SDAC because:
the reporting of specific conditions is likely to be understated
while this underreporting will occur for specific conditions, the impact on broad indicators of impairment and disability are less likely to be affected
– However, a person with multiple conditions — some of which do not cause impairment — will still be identified so long as at least one of their conditions does cause impairment.
Undiagnosed conditions
A person may have a condition, but might not have been diagnosed as having it. This is likely to be another source of underreported conditions in the SDAC.
Such a person either has not sought medical treatment in relation to the condition or the condition was not diagnosed when they did sought medical treatment.
It is likely that over the three SDAC periods examined in this inquiry, the inaccuracies caused by undiagnosed conditions have declined because:
community awareness of many conditions has been increasing, encouraging people to seek formal medical testing and treatment
data on the average number of Medicare services provided each year indicates that the services per person have been increasing for every age group between 2003-04 and 2008-09 but in particular for those aged between 75 and 84 years (table H.1)
improvements in medical procedures, notably clinical tests and screens, should result in fewer instances of people who have a condition not being correctly diagnosed (for example, see Kemp et al. 2002, Gillespie et al. 2010).

THE SURVEY OF DISABILITY, AGEING AND CARERS
H.5
Table H.1 Average number of Medicare services per person per year By age group and gender
2003-04 2004-05 2005-06 2006-07 2007-08 2008-09
Males 5.3 5.4 5.5 5.5 6.0 6.3 0-14
Females 5.1 5.2 5.3 5.3 5.7 6.0
Males 5.6 5.7 5.8 5.9 6.1 6.3 15-44
Females 11.3 11.5 11.9 12.1 13.0 13.2
Males 12.1 12.5 12.8 13.2 13.8 14.2 45-64
Females 15.9 16.1 16.4 16.8 17.7 18.3
Males 24.1 25.1 25.7 26.0 27.4 28.2 65-74
Females 24.1 25.0 25.5 26.0 27.3 28.1
Males 24.3 26.8 29.1 31.3 34.4 37.0 75-84
Females 26.6 28.0 29.2 30.2 32.3 33.9
Males 23.2 22.7 23.1 23.1 23.6 23.6 85+
Females 26.9 27.1 27.8 28.1 29.1 29.5
Data sources: Medicare and Health Insurance Commission annual reports and ABS Cat. no. 3201.0
Misdiagnosed conditions
Despite improvements in medical tests and screens, there is an ongoing risk of a medical professional misdiagnosing a condition. This could result in false positive responses (where a person is diagnosed as having a condition he or she does not have) or false negatives (where a person is not diagnosed as having a condition that he or she does have), both of which will reduce the accuracy of SDAC data.
That said, such errors are more likely to occur in relation to a specific condition rather than whether an individual has any impairing condition. For example, a person may have sought medical treatment because of an impairment to their elbow. Even if the nature of the impairment has been misdiagnosed by a medical professional (resulting in a likely inaccurate reporting of the condition), the person is still likely to indicate that they he or she has an impairing condition.
Deliberately misreported conditions
Some respondents may elect not to report certain conditions because of a stigma or prejudice associated with the condition. As a result, these conditions are likely to be
H.6 CARING FOR OLDER AUSTRALIANS
underreported in the SDAC. Others may report having a condition which they do not have and have not been diagnosed with.
The stigma associated with many conditions has been falling in recent years. Dementia and HIV/AIDS provide two examples where public awareness and understanding about the condition has increased and the people affected may be more willing to disclose their condition.
Respondents to the survey might also elect not to report conditions if they are discouraged by the amount of time required to complete the associated questions. However, the structure of the SDAC questionnaire appears to be very similar over the last three surveys, and it is not apparent that respondents would have to answer more questions in the 2009 SDAC compared to the 2003 SDAC if they reported the same conditions. While there is no reason to believe that respondents have any greater incentive to correctly identify all their conditions, there is equally no reason to suggest that people have an incentive to identify fewer of their conditions in more recent surveys.
Accidently unreported conditions
It is possible that some SDAC respondents may have accidently not reported a condition they have. This could occur for a number of reasons, such as misinterpretation of the relevant questions or a respondent not remembering that they had been diagnosed with a certain condition. There are some conditions where people are more likely to have difficulty remembering that they have been diagnosed with a condition or accurately interpreting a question — for example, people with dementia or other brain damage.
The likelihood is low that a person who is unable to remember being diagnosed with one of these conditions would be a respondent to the SDAC (as opposed to a carer completing the survey). Not everyone with these conditions would have difficulty remembering key information, and for those that do, a number may either live in cared accommodation or with a carer.
Difficulties with interpreting questions can also be related to factors unrelated to any specific condition people have. For example, some survey respondents from an Indigenous or non-English speaking background might have difficulty interpreting and accurately answering questions — although survey participants were able to answer the questions in languages other than English — potentially mitigating this effect.

THE SURVEY OF DISABILITY, AGEING AND CARERS
H.7
Summing up
There are a wide range of factors that may influence the reliability of the SDAC results. When all these factors are taken together, the expectation is the SDAC would be more reliable for identifying the number of people with care needs rather than the prevalence of specific conditions (table H.2).
This inquiry explores the present and future care needs of older Australians. The fact that some conditions are underreported does not reduce the value of the SDAC as a basis for projecting care needs into the future.
Table H.2 Factors affecting the reliability of SDAC A small downward arrow indicates small scope for understatement, a large downward arrow indicates large scope for understatement and ? indicates an unclear impact
Variable Any condition or care need Specific condition
Survey methodology
Undiagnosed conditions Misdiagnosed conditions ? ? Deliberately misreported conditions Accidently unreported conditions
The second way that SDAC can be valuable is by highlighting trends. The improvements to the SDAC and the methodology used to derive estimates have improved the reliability of the data. These improvements should increase the chances that the recent estimates more accurately represent the general population (table H.3)
Table H.3 Changes in reliability of SDAC over time – Reliability of trends Upward arrow indicates improving reliability
Variable Any condition or care need Specific condition
Survey methodology No change No change
Undiagnosed conditions Misdiagnosed conditions Deliberately misreported conditions No change No change Accidently unreported conditions No change No change
This implies that if the underlying age–specific prevalence rates have not changed over the last three surveys, all surveys should still result in underestimated prevalence rates. However estimates from each survey should be moving towards the actual underlying rate, and such a move would affect the trend analysis.

H.8 CARING FOR OLDER AUSTRALIANS
Dementia including Alzheimer’s disease — an unexpected outcome
While dementia and related diseases are not a natural part of ageing, the probability of having dementia dramatically increases with age (AIHW 2007c). Jorm et al. (2005) argue that the number of cases of dementia in a population is largely determined by its age structure, and as a population ages, the number of people with dementia will increase disproportionately.
Based on this information, given Australia’s ageing population and the expectation that each subsequent SDAC should be less likely to understate the prevalence of these conditions, it was expected that the number of people with dementia would rise and that the age–specific prevalence rates would be stable or increase.
While the SDAC shows that there has been some growth in the number of people reported as having dementia (table H.4), the age–specific rates for people reported as suffering from dementia have fallen (table H.5). Chapter 3 notes the different implications for the future demand for aged care services for differing trends in dementia. The significant differences between the trends in SDAC prevalence rates compared to the other estimates of the prevalence rate of dementia that have been used to project future demand for aged care services underlines the need for further research in this area and in the area of misdiagnosis by the medical profession.
Table H.4 Number of people aged 70 years and over with dementia including Alzheimer’s disease Including 95 per cent confidence intervals
Survey years Estimate 95% Lower 95% Upper
1998 89 164 78 049 100 279
2003 96 174 81 377 110 972
2009 100 446 90 390 110 503
Data sources: 1998, 2003 and 2009 ABS Survey of Disability, Ageing and Carers CURF files.
Table H.5 Age–specific prevalence of dementia including Alzheimer’s disease Per cent of age–specific population
Age group 1998 2003 2009
70-74 1.7 1.1 1.2
75-79 3.2 3.0 2.6
80-84 6.8 6.5 6.0
85+ 22 18 14
Data sources: 1998, 2003 and 2009 ABS Survey of Disability, Ageing and Carers CURF files
THE SURVEY OF DISABILITY, AGEING AND CARERS
H.9
H.3 Selected findings from the SDAC
This section provides an overview of some of the key findings from the SDAC. The appendix provides greater detail of the SDAC statistics, but the main discussion of the relevance of these results to the inquiry is covered in chapters 2, 3, 11 and 13. The key findings focus on:
disability and disease levels among Australians
carers
unmet need.
Disability and disease levels among older Australians
The Commission has examined the three most recent SDACs to ascertain the extent of any change in age–specific disability rates in Australia. While there have been variations in the age–specific disability rates between the surveys, very little of the change has been statistically significant3 and there are no clear trends (figure H.1).
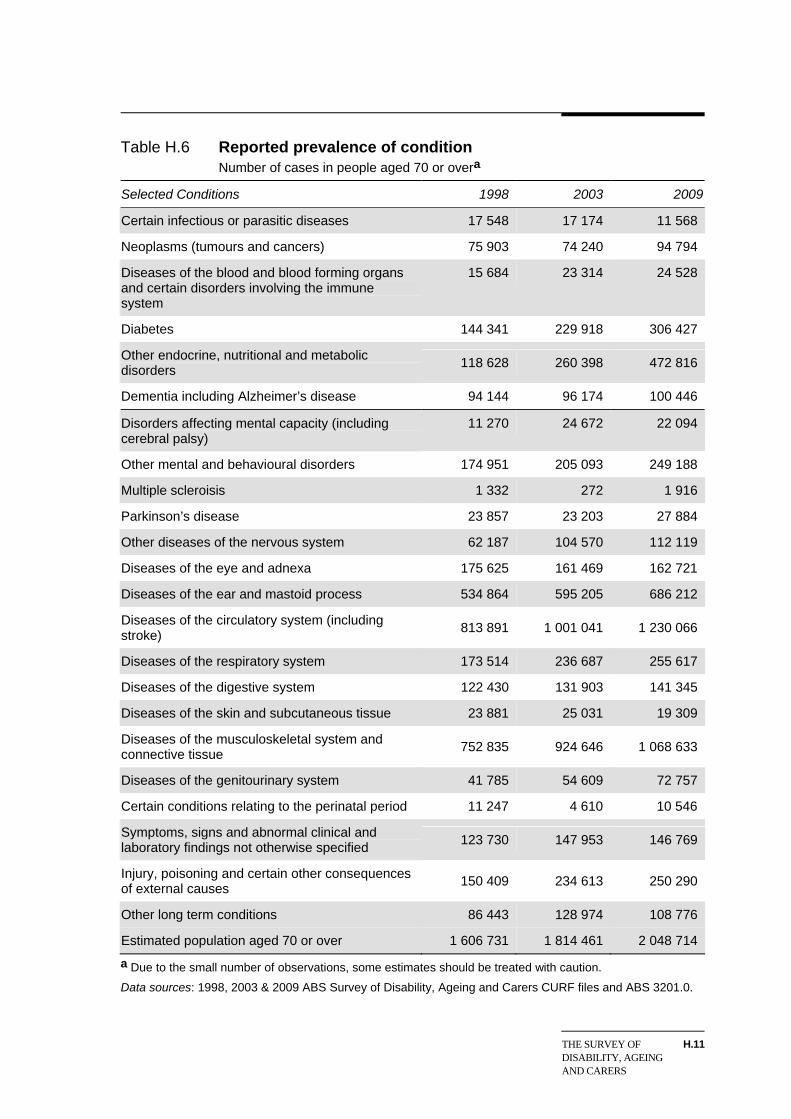
Along with overall disability rates, the Commission also examined specific conditions affecting older Australians. Sustained reductions in the prevalence of certain conditions among older Australians might suggest a reduction in their care needs. Tables H.6 and H.7 provide an indication of age–based disease prevalence over the three SDAC periods, both in terms of quantum and as a percentage of the relevant population.
Dementia is condition that is likely to have a pronounced effect on both the cost of Australia’s aged care system and the nature of the services that need to be provided. The reported prevalence of dementia in the SDAC appears to be falling across all age groups. The prevalence of eye and adnexa diseases also appear to be consistently falling in the three SDAC periods examined, while in contrast, the prevalence of diabetes and circulatory diseases in older Australians seems to be growing. Most other diseases show no apparent trend.
3 To be statistically significant, the new estimate needs to be outside of the 95% confidence
interval, indicated by the vertical black lines in figure H.1. The 95% confidence interval ranges from the estimated disability rate, plus and minus two standard errors. Because the upper end of some of these ranges exceeds 100% of the population, some of the ranges do not appear symmetrical.

Figure H.1 Age and sex specific disability rates Disability rates by age and sex groups for 1998, 2003 and 2009
Males
0
20
40
60
80
100
- 65–69 - - 85–89 -- 80–84 -- 75–79 -- 70–74 - -- 90+ --
a
bb%
Females
0
20
40
60
80
100
bb
- 65–69 - - 85–89 -- 80–84 -- 75–79 -- 70–74 - -- 90+ --
%
1998 2003 2009 95% confidence interval
aStatistically significant change from preceding survey. For men aged 80 to 84 years of age, the estimated higher disability rate for 2003 is statistically significantly different from the 1998. When the age–specific estimates for people are compared (that is, men and women combined) there are also significant declines in disability rates for the 75–79 and 80–84 year old groups between the 2003 and 2009 surveys. b The 1998 survey published results for the age group 85+, but the 2003 survey did quote results from 1998 for the 85–89 and 90+ age groups, but did not include information on the confidence intervals for that year.
Data sources: ABS Cat. no. 4430.0, Disability, Ageing and Carers, Australia, Summary of Findings, 1998, 2003 and 2009.
H.10 CARING FOR OLDER AUSTRALIANS
THE SURVEY OF DISABILITY, AGEING AND CARERS
H.11
Table H.6 Reported prevalence of condition Number of cases in people aged 70 or overa
Selected Conditions 1998 2003 2009
Certain infectious or parasitic diseases 17 548 17 174 11 568
Neoplasms (tumours and cancers) 75 903 74 240 94 794
Diseases of the blood and blood forming organs and certain disorders involving the immune system
15 684 23 314 24 528
Diabetes 144 341 229 918 306 427
Other endocrine, nutritional and metabolic disorders
118 628 260 398 472 816
Dementia including Alzheimer’s disease 94 144 96 174 100 446
Disorders affecting mental capacity (including cerebral palsy)
11 270 24 672 22 094
Other mental and behavioural disorders 174 951 205 093 249 188
Multiple scleroisis 1 332 272 1 916
Parkinson’s disease 23 857 23 203 27 884
Other diseases of the nervous system 62 187 104 570 112 119
Diseases of the eye and adnexa 175 625 161 469 162 721
Diseases of the ear and mastoid process 534 864 595 205 686 212
Diseases of the circulatory system (including stroke)
813 891 1 001 041 1 230 066
Diseases of the respiratory system 173 514 236 687 255 617
Diseases of the digestive system 122 430 131 903 141 345
Diseases of the skin and subcutaneous tissue 23 881 25 031 19 309
Diseases of the musculoskeletal system and connective tissue
752 835 924 646 1 068 633
Diseases of the genitourinary system 41 785 54 609 72 757
Certain conditions relating to the perinatal period 11 247 4 610 10 546
Symptoms, signs and abnormal clinical and laboratory findings not otherwise specified
123 730 147 953 146 769
Injury, poisoning and certain other consequences of external causes
150 409 234 613 250 290
Other long term conditions 86 443 128 974 108 776
Estimated population aged 70 or over 1 606 731 1 814 461 2 048 714
a Due to the small number of observations, some estimates should be treated with caution.
Data sources: 1998, 2003 & 2009 ABS Survey of Disability, Ageing and Carers CURF files and ABS 3201.0.

Table H.7 Age–specific prevalence of conditions Per cent of population by age group and year reporting conditiona
70-74 75-79 80-84 85+ Selected conditions
1998 2003 2009 1998 2003 2009 1998 2003 2009 1998 2003 2009
Certain infectious or parasitic diseases 0.7 0.9 0.5 1.9 0.9 0.4 0.9 1.3 0.7 0.6 0.6 0.8
Neoplasms (tumours and cancers) 4.1 3.6 4.3 5.2 3.6 5.1 4.1 4.6 5.1 6.3 5.4 4.0
Diseases of the blood and blood forming organs and certain disorders involving the immune system 0.7 0.9 0.9 1.1 1.0 0.9 1.1 1.5 1.4 1.2 2.3 2.0
Diabetes 7.7 15 16 9.6 12 16 11 13 16 9.5 8.1 12
Other endocrine, nutritional and metabolic disorders 8.6 16 22 8.6 16 22 5.5 13 22 4.2 9.1 19
Dementia including Alzheimer’s disease 1.7 1.1 1.2 3.2 3.0 2.6 6.8 6.5 6.0 22 18 14
Disorders affecting mental capacity (including cerebral palsy) 0.4 0.7 0.9 0.4 1.4 1.0 0.6 1.8 1.2 2.2 2.2 1.5
Other mental and behavioural disorders 8.6 8.1 11 11 10 11 12 13 12 17 19 17
Multiple sclerosis 0.1 - 0.2 - - - 0.2 - - - - -
Parkinson’s disease 0.8 1.1 0.9 1.3 1.2 1.4 2.1 1.3 2.0 3.2 1.9 1.3
Other diseases of the nervous system 6.9 5.0 4.6 5.7 4.5 4.9 10 7.1 7.3 13 8.1 5.9
(continued on next page).

Table H.7 Age–specific prevalence of conditions (continued) Per cent of population by age group and year of reporting conditiona
70-74 75-79 80-84 85+ Selected conditions
1998 2003 2009 1998 2003 2009 1998 2003 2009 1998 2003 2009
Diseases of the eye and adnexa 5.7 5.3 3.9 10 6.0 5.5 13 12 10 24 19 17
Diseases of the ear and mastoid process 27 22 25 32 28 28 35 42 39 51 54 52
Diseases of the circulatory system (including stroke) 47 49 56 51 54 59 53 63 65 58 63 64
Diseases of the respiratory system 12 13 13 11 12 12 8.6 17 12 9.7 10 13
Diseases of the digestive system 6.4 5.9 6.9 9.6 6.1 6.1 5.3 9.1 6.7 10 10 8.5
Diseases of the skin and subcutaneous tissue 1.1 1.2 0.5 1.4 1.1 0.8 1.8 1.7 1.3 2.2 1.9 1.5
Diseases of the musculoskeletal system and connective tissue 45 48 48 47 48 49 47 57 56 52 54 61
Diseases of the genitourinary system 2.3 2.2 2.1 2.8 2.0 3.2 2.6 4.7 4.2 2.8 4.5 6.1
Certain conditions relating to the perinatal period 0.5 0.2 0.4 0.8 0.5 0.5 0.8 0.1 0.5 0.8 0.1 0.7
Symptoms, signs and abnormal clinical and laboratory findings not otherwise specified 4.8 4.4 4.7 7.9 5.2 5.8 8.9 11 9.1 14 18 11
a Due to the small number of observations, some estimates should be treated with caution.
Data sources: 1998, 2003 & 2009 ABS Survey of Disability, Ageing and Carers CURF files and ABS 3201.0.

H.14 CARING FOR OLDER AUSTRALIANS
Carers
The SDAC is also a useful source of information on the characteristics of those who care for older Australians. Tables H.8 and H.9 shows the age of primary carers and the age of the people they care for from the 2009 SDAC. Older Australians both care for — and are cared for by — individuals across a wide range of ages.
Table H.10 shows the relationship of carers to the people they care for by the age of the care recipient and table H.11 by the age of the main care giver. As expected, of those receiving care the majority get it from their immediate family members — either a spouse or partner or son or daughter. While some older Australians are cared for by their parents, the estimated number of such care recipients aged 80 years or over in the SDAC is based on a handful of survey respondents and could be statistically unreliable.
Many older Australians care for individuals with profound or severe core activity restrictions, indicating the amount and range of care they require is likely to be high (table H.12).

Table H.8 Age of carer and caree Only primary carers who live in the same household as the person they care for — 2009a
Age of primary carer
Age of caree
Under 30
30-34 years
35-39 years
40-44 years
45-49 years
50-54 years
55-59 years
60-64 years
65-69 years
70-74 years
75-79 years
80-84 years
85+ years Total
0-14 years 12 257 17 460 27 328 21 533 10 588 3 519 861 833 - - 359 - - 94 737
15-19 years 958 1 496 3 473 5 173 9 381 3 379 2 574 - 428 - - - - 26 862
20-24 years 1 029 137 100 1 945 2 528 3 257 1 489 1 192 - - - - - 11 677
25-29 years 4 158 2 022 - 771 534 2 087 4 066 470 586 64 - - - 14 757
30-34 years - 4 104 1 686 941 199 1 135 2 127 1 144 679 - - - - 12 016
35-39 years 780 2 274 7 768 2 332 534 445 1 199 2 690 1 595 1 315 1 065 480 - 22 477
40-44 years 2 289 240 3 966 4 248 5 055 928 659 - 1 619 612 - 107 - 19 722
45-49 years 6 636 - 1 762 6 146 7 245 5 623 1 533 1 118 738 986 203 461 - 32 452
50-54 years 3 193 - - 1 345 6 854 9 151 9 288 2 415 1 199 252 895 - - 34 593
55-59 years 3 079 1 591 1 148 1 509 3 391 6 095 13 334 9 744 978 1 441 548 468 - 43 328
60-64 years 2 711 - 3 168 91 563 3 581 10 258 22 818 7 170 2 853 704 253 406 54 578
65-69 years - 1 088 2 207 1 791 1 836 1 330 4 113 11 406 11 440 9 023 2 389 - - 46 623
70-74 years 577 - 1 455 3 338 3 131 1 395 1 318 5 866 12 902 15 863 7 110 856 354 54 163
75-80 years - - 1 915 2 283 3 269 2 764 1 564 2 475 6 441 9 306 9 928 5 607 1 164 46 719
80-84 years 379 - - 1 075 2 474 8 634 2 530 2 269 859 5 171 6 760 12 169 3 638 45 958
85+ years 659 - 1 230 1 057 1 866 4 066 4 628 8 619 6 154 3 813 3 928 5 647 7 160 48 825
Total 38 704 30 413 57 206 55 577 59 446 57 388 61 541 73 062 52 789 50 700 33 889 26 047 12 722 609 486
a Due to the small number of observations, some estimates should be treated with caution.
Data source: 2009 ABS Survey of Disability, Ageing and Carers CURF file.

Table H.9 Age of carer and caree Only entries where primary carer and caree do not live together — 2009 a
Age of primary carer
Age of caree
Under 30
30-34 years
35-39 years
40-44 years
45-49 years
50-54 years
55-59 years
60-64 years
65-69 years
70-74 years
75-79 years
80-84 years
85+ years Total
Under 65 years 4 434 2 005 1 668 1 650 3 476 3 415 3 097 1 026 2 671 2 504 592 358 - 26 895
65–74 years 437 434 1 824 5 872 3 114 1 995 380 1 396 450 426 - - - 16 327
75–84 years 1 252 1 327 1 673 4 275 12 679 14 009 10 114 2 181 1 222 774 - - - 49 505
85+ years 651 720 991 1 072 2 772 5 835 12 217 10 688 6 060 2 159 352 473 139 44 129
Total 6 775 4 484 6 155 12 869 22 042 25 254 25 808 15 291 10 403 5 864 944 830 139 136 858
a Due to the small number of observations, some estimates should be treated with caution.
Data source: 2009 ABS Survey of Disability, Ageing and Carers CURF file.
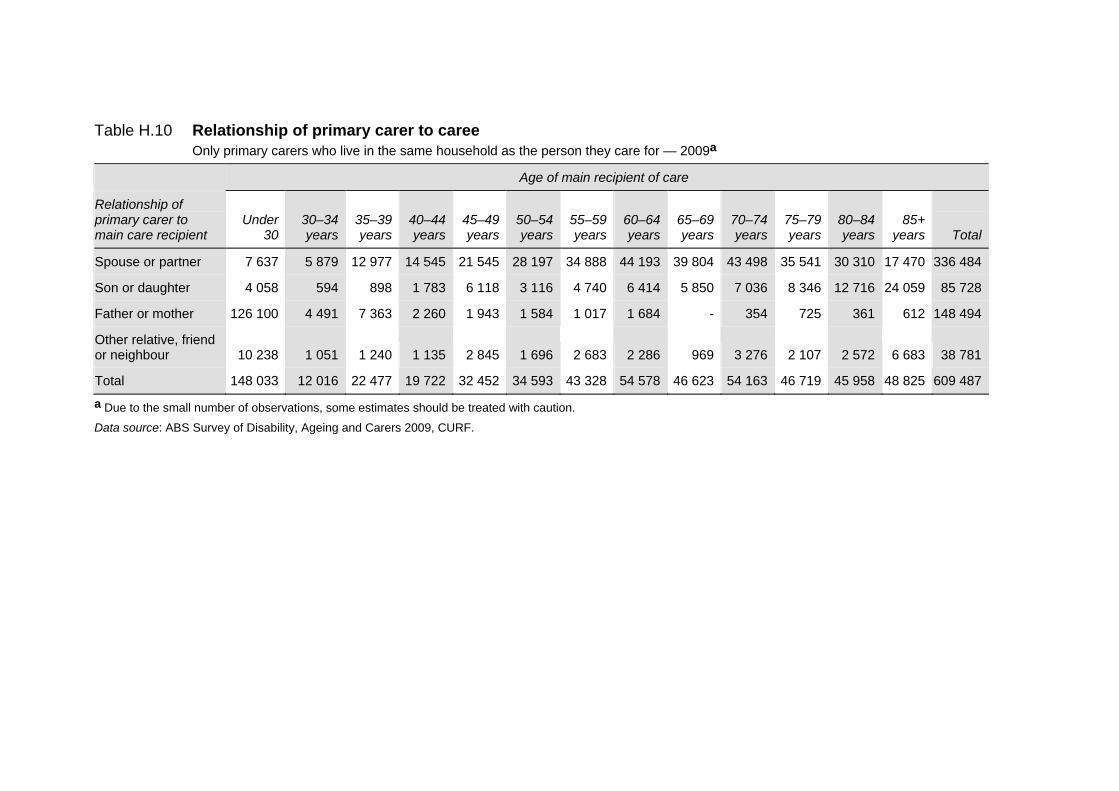
Table H.10 Relationship of primary carer to caree Only primary carers who live in the same household as the person they care for — 2009a
Age of main recipient of care
Relationship of primary carer to main care recipient
Under
30 30–34 years
35–39 years
40–44 years
45–49 years
50–54 years
55–59 years
60–64 years
65–69 years
70–74 years
75–79 years
80–84 years
85+ years
Total
Spouse or partner 7 637 5 879 12 977 14 545 21 545 28 197 34 888 44 193 39 804 43 498 35 541 30 310 17 470 336 484
Son or daughter 4 058 594 898 1 783 6 118 3 116 4 740 6 414 5 850 7 036 8 346 12 716 24 059 85 728
Father or mother 126 100 4 491 7 363 2 260 1 943 1 584 1 017 1 684 - 354 725 361 612 148 494
Other relative, friend or neighbour 10 238 1 051 1 240 1 135 2 845 1 696 2 683 2 286 969 3 276 2 107 2 572 6 683 38 781
Total 148 033 12 016 22 477 19 722 32 452 34 593 43 328 54 578 46 623 54 163 46 719 45 958 48 825 609 487
a Due to the small number of observations, some estimates should be treated with caution.
Data source: ABS Survey of Disability, Ageing and Carers 2009, CURF.

Table H.11 Relationship of primary carer to caree All primary carers caring for people living in private dwellings — 2009 a
Age of primary carer
The carer is the caree’s
Under 30
30-34 years
35-39 years
40-44 years
45-49 years
50-54 years
55-59 years
60-64 years
65-69 years
70-74 years
75-79 years
80-84 years
85+ years Total
Father or mother 12 808 18 060 29 669 28 512 24 344 16 526 14 714 6 431 5 474 4 892 3 095 2 127 760 167 412
Spouse/partner 6 969 6 362 15 922 15 238 25 744 25 806 37 929 54 405 41 023 43 708 29 423 23 875 11 962 338 365
Son or daughter 18 006 4 778 12 437 17 517 23 706 29 641 24 105 19 754 12 376 4 433 - - - 166 754
Other relative, friend or neighbour 7 696 5 697 5 334 7 180 7 694 10 669 10 601 7 763 4 318 3 531 2 316 876 139 73 813
Total 45 479 34 897 63 362 68 447 81 488 82 642 87 349 88 353 63 192 56 564 34 834 26 878 12 861 746 344
a Due to the small number of observations, some estimates should be treated with caution.
Data source: ABS Survey of Disability, Ageing and Carers 2009, CURF.

Table H.12 Age of carer by disability status of caree Only primary carers who live in the same household as the person they care for — 2009a
Age of primary carer
Disability status of caree
Under 30
30-34 years
35-39 years
40-44 years
45-49 years
50-54 years
55-59 years
60-64 years
65-69 years
70-74 years
75-79 years
80-84 years
85+ years Total
Has disability and profoundly restricted in core activities 15 299 16 132 29 163 31 787 30 171 28 643 30 678 33 021 28 282 29 028 17 332 15 445 7 673 312 653
Has disability and severely restricted in core activities 19 946 12 902 25 664 22 555 25 901 24 376 28 975 36 969 22 389 18 334 14 460 9 049 4 860 266 381
Has disability and moderately restricted in core activities - 281 968 - 1 094 997 357 1 135 690 1 567 585 955 189 8 818
Other 3 459 1 098 1 412 1 234 2 281 3 371 1 531 1 937 1 428 1 772 1 513 599 - 21 634
Totalb 38 704 30 413 57 206 55 577 59 446 57 388 61 541 73 062 52 789 50 700 33 889 26 047 12 722 609 486
a Due to the small number of observations, some estimates should be treated with caution. b Totals may not necessarily equal the sum of each column due to rounding.
Data source: 2009 ABS Survey of Disability, Ageing and Carers CURF file.

H.20 CARING FOR OLDER AUSTRALIANS
Unmet need for care
The SDAC asks respondents who have a disability or who are 60 years or over the extent to which they think their care needs are being met. The SDAC breaks needs into those related to people’s ‘core’ and ‘non–core’ restrictions (box H.2).
Box H.2 Core and non–core restrictions
The SDAC separates an individual’s need for care into ‘core’ and ‘non–core’ needs.
Core restrictions are defined as being related to communication, mobility and self care. They include, but are not limited to, restrictions in understanding and being understood by both strangers and family and friends, using public transport, moving around home, showering, eating, dressing and toileting.
Non–core restrictions affect an individual’s ability to participate in school or work. Examples of non–core restrictions include, but are not limited to, being permanently unable to find work, restrictions on the amount of work an individual can do or restrictions that require special equipment or a modified work environment.
Source: ABS (2009a).
Questions in the 2003 and 2009 SDACs were used to ascertain the proportion of people who were satisfied with the current level of care they were receiving, as well as to examine whether certain groups in the community had a greater level of unmet need relative to others.
Tables H.13 and H.14 show the percentage of respondents by age who had a care need that stated that their need was not being fully met. Generally speaking, people thought their core needs were being better met than their non–core needs and the proportion of respondents who thought their needs were not being met at all was low. In many cases, older Australians were either equally or more likely than younger Australians to indicate that their care needs were being fully met. That said, the number of older people with care needs who think that some of those care needs are unmet still warrants attention — nearly one in five Australians aged 85 years or over feel their core needs are not being fully met, while over one quarter feel that they have unmet needs relating to non–core activities.
For almost all age groups, the proportion of people reporting that their needs were not fully met fell between the 2003 and 2009 SDACs. For older Australians, the only reported increase was in the proportion of people aged 85 years or over whose core needs where not fully met. Even in this group, there was a decline in the proportion of people whose core needs where not met at all, but a large increase in

THE SURVEY OF DISABILITY, AGEING AND CARERS
H.21
those whose needs were only partially met. People aged 85 years or over are the most likely to be using aged care services (appendix E), and the most serious needs are related to peoples’ needs for assistance with core functions.
Table H.13 Unmet need by age — core care needs As a per cent of respondents who had a core care need
Needs not met at all Needs partially met
Age group 2003 2009
2003 2009
0-39 4 3 25 30
40-44 4 2 20 11
45-49 10 6 14 15
50-54 10 3 9 12
55-59 10 1 9 9
60-64 9 3 9 11
65-69 6 2 10 7
70-74 8 3 15 11
75-79 12 2 18 13
80-84 7 2 12 12
85+ 4 2 13 16
Data sources: 2003 and 2009 ABS Survey of Disability, Ageing and Carers CURF file.
Table H.14 Unmet need by age — non–core care needs As a per cent of respondents who had a non–core care need
Needs not met at all Needs partially met
Age group 2003 2009
2003 2009
0-39 4 3 38 38
40-44 4 3 38 33
45-49 4 3 38 37
50-54 5 2 33 37
55-59 5 3 27 32
60-64 9 3 25 25
65-69 8 4 25 27
70-74 5 4 27 26
75-79 5 3 29 24
80-84 5 2 28 25
85+ 3 1 30 25
Data sources: 2003 and 2009 ABS Survey of Disability, Ageing and Carers CURF file.

H.22 CARING FOR OLDER AUSTRALIANS
Tables H.15 and H.16 show the proportion of people who felt they have some unmet care need by gender and age in 2009. While, overall, the proportion of people who believed they had some unmet care need was relatively consistent across genders, the percentage of males under 65 who felt their core care needs were not being fully met was noticeably greater than females of the same age.
Table H.15 Unmet need by age and gender — core care needs As a per cent of respondents who had a core care need — 2009
Age Gender Needs not met at all Needs being partially met
Male 2 24 Under 65
Female 4 16
Male 2 12 65 years and over
Female 2 13
Data source: 2009 ABS Survey of Disability, Ageing and Carers CURF file.
Table H.16 Unmet need by age and gender — non–core care needs As a per cent of respondents who had a non–core care need — 2009
Age Gender Needs not met at all Needs being partially met
Male 3 34 Under 65
Female 3 34
Male 3 25 65 years and over
Female 3 26
Data source: 2009 ABS Survey of Disability, Ageing and Carers CURF file.
In tables H.17 and H.18, the unmet care need of people from different places of birth is displayed. For both core and non–core care needs, people aged 65 years or over were more likely to identify an unmet care need if they were born overseas rather than in Australia, with this being most pronounced for those of a non–English speaking background. The proportion of people who felt that their care needs (both core and non–core) were not being met at all remained low across all ages and places of birth.

THE SURVEY OF DISABILITY, AGEING AND CARERS
H.23
Table H.17 Unmet care needs by place of birth and age — core care needs As a per cent of respondents who had a core care need — 2009
Age Place of birth Needs not met at all Needs being partially met
Australia 3 21
English speaking overseas county 1 20 Under 65
Non–English speaking overseas county 2 12
Australia 2 10
English speaking overseas county 3 12
65 years and over
Non–English speaking overseas county 1 17
a This column may not necessarily equal to sum of the preceding two columns due to rounding errors.
Data source: 2009 ABS Survey of Disability, Ageing and Carers CURF file.
Table H.18 Unmet care needs by place of birth and age — non–core care needs As a per cent of respondents who had a non–core care need — 2009
Age Place of birth Needs not met at all Needs being partially met
Australia 3 35
English speaking overseas county 2 29 Under 65
Non–English speaking overseas county 1 31
Australia 3 24
English speaking overseas county 3 26
65 years and over
Non–English speaking overseas county 3 30
a This column may not necessarily equal to sum of the preceding two columns due to rounding errors.
Data source: 2009 ABS Survey of Disability, Ageing and Carers CURF file.