H Parity Violating Deep Inelastic Scattering at CEBAF 6 GeVxiaochao/pac27/113004/PR_pvdis2.pdf · H...
32
(A New Proposal to Jefferson Lab PAC-27) H Parity Violating Deep Inelastic Scattering at CEBAF 6 GeV November 30, 2004 J. Arrington, K. Hafidi, R.J. Holt, D. Potterveld, P.E. Reimer (co-spokesperson), X. Zheng 1 (co-spokesperson) Argonne National Laboratory, Argonne, IL 60439 D. J. Margaziotis California State University, Los Angeles, CA 90032 P. Markowitz Florida International University, Miami, FL 33199 A. Afanasev, P.E.Bosted, J.-P. Chen, A. Deur, R. Feuerbach, D.J. Mack, R. Michaels, B. Reitz Jefferson Lab, Newport News, VA 23606 W. Korsch University of Kentucky, Lexington, KY 40506 J.R. Calarco University of New Hampshire, Durham, NH 03824 S. ˇ Sirca University of Ljubljana, Slovenia E.J. Beise University of Maryland, College Park, MD 20742 K. Kumar, K. Paschke University of Massachusetts Amherst, Amherst, MA 01003 J. Erler Universidad Nacional Aut´ onoma de M´ exico, 01000 M´ exico D. F., M´ exico R. Gilman, C. Glashausser, X. Jiang, R. Ransome Rutgers, The State University of New Jersey, Piscataway, NJ 08855 P. Souder, R. Holmes Syracuse University, Syracuse, NY 13244 G.D.Cates, V. Nelyubin, J. Singh, R. Snyder, W.A. Tobias University of Virginia, Charlottesville, VA 22904 D.S. Armstrong, T.D. Averett, J.M. Finn, K.A. Griffioen, T. Holmstrom, V. Sulkosky College of William and Mary, Williamsburg, VA 23187 1 Email: [email protected] 1
Transcript of H Parity Violating Deep Inelastic Scattering at CEBAF 6 GeVxiaochao/pac27/113004/PR_pvdis2.pdf · H...
(A New Proposal to Jefferson Lab PAC-27)
������ H Parity Violating Deep Inelastic Scattering at CEBAF 6 GeV
November 30, 2004
J. Arrington, K. Hafidi, R.J. Holt, D. Potterveld, P.E. Reimer (co-spokesperson), X. Zheng1 (co-spokesperson)Argonne National Laboratory, Argonne, IL 60439
D. J. MargaziotisCalifornia State University, Los Angeles, CA 90032
P. MarkowitzFlorida International University, Miami, FL 33199
A. Afanasev, P.E. Bosted, J.-P. Chen, A. Deur, R. Feuerbach, D.J. Mack, R. Michaels, B. ReitzJefferson Lab, Newport News, VA 23606
W. KorschUniversity of Kentucky, Lexington, KY 40506
J.R. CalarcoUniversity of New Hampshire, Durham, NH 03824
S. SircaUniversity of Ljubljana, Slovenia
E.J. BeiseUniversity of Maryland, College Park, MD 20742
K. Kumar, K. PaschkeUniversity of Massachusetts Amherst, Amherst, MA 01003
J. ErlerUniversidad Nacional Autonoma de Mexico, 01000 Mexico D. F., Mexico
R. Gilman, C. Glashausser, X. Jiang, R. RansomeRutgers, The State University of New Jersey, Piscataway, NJ 08855
P. Souder, R. HolmesSyracuse University, Syracuse, NY 13244
G.D. Cates, V. Nelyubin, J. Singh, R. Snyder, W.A. TobiasUniversity of Virginia, Charlottesville, VA 22904
D.S. Armstrong, T.D. Averett, J.M. Finn, K.A. Griffioen, T. Holmstrom, V. SulkoskyCollege of William and Mary, Williamsburg, VA 23187
1Email: [email protected]
1

Abstract
We propose to measure the parity violating (PV) asymmetry ��� in ������ H deep inelasticscattering (DIS) at �� ������� and ������� (GeV/ � ) � at ��� ����� . The measurements will con-strain the poorly known effective coupling constant combination ( ��� ��� � � � � ). Assuming theStandard Model values of � ���"! � � � ! �$# , (tested separately by combining the Cs atomic par-ity violation (APV) experiments and the future Qweak experiment), the expected uncertainty is% � ��� ��� � � � �&# (')���*��� , a factor of eight improvement. The measurement also allows theextraction of couplings �,+.- from high energy / � C DIS data. Precision measurements of allphenomenological couplings are essential to comprehensively search for possible physics be-yond the Standard Model.
Comparison of the two measurements ( � 0������� (GeV/ � ) � and � 0������� (GeV/ � ) � ) willprovide the first significant constraint on higher-twist (HT) effects in PV DIS, at the level of� �214365 � . It will provide an important guide on the future DIS-parity program with the 12 GeVupgrade, for which the ultimate goal is to extract 798�: �<;�= from the asymmetry free from hadroniceffects. This could also have immediate impact on other DIS analyzes, such as the extraction of7>8�: � ;�= from ? �A@ DIS (NuTeV) and the extraction of the strong coupling constant BDC fromDIS data at low � .
We plan to use a �4E -cm liquid deuterium target in Hall A and a F4E - / A G �*� -GeV beam withF �H3 polarization. An upgrade is needed for the Compton polarimeter and a fast counting dataacquisition system will be developed for the proposed measurement. These enhancements to theexperimental capabilities will be essential for future parity-violation experiments at JLab. Thetotal beam time request is for IHG days, consisting of two phases: 13 days for phase I and 33 daysfor phase II.
Contents
1 Motivation 41.1 Phenomenological WNC Couplings at Low � . . . . . . . . . . . . . . . . . . 41.2 The Running of 7>8�: � ;&= and The NuTeV Anomaly . . . . . . . . . . . . . . . . 61.3 Parity Violating Deep Inelastic Scattering (DIS-parity) . . . . . . . . . . . . . . 71.4 Formalism for ��J� �LK Parity Violating DIS . . . . . . . . . . . . . . . . . . . . 81.5 Higher-Twist Effects . . . . . . . . . . . . . . . . . . . . . . . . . . . . . . . . 91.6 Exploring Physics Beyond the Standard Model . . . . . . . . . . . . . . . . . . 11
1.6.1 DIS-Parity and New Physics . . . . . . . . . . . . . . . . . . . . . . . . 111.6.2 MON Searches . . . . . . . . . . . . . . . . . . . . . . . . . . . . . . . . . 121.6.3 Compositeness and Leptoquark (LQ) . . . . . . . . . . . . . . . . . . . 12
2 Experimental Setup 132.1 Overview . . . . . . . . . . . . . . . . . . . . . . . . . . . . . . . . . . . . . . 132.2 Beam Line . . . . . . . . . . . . . . . . . . . . . . . . . . . . . . . . . . . . . . 142.3 Parity DAQ (Hall A) . . . . . . . . . . . . . . . . . . . . . . . . . . . . . . . . 142.4 The Liquid Deuterium Target . . . . . . . . . . . . . . . . . . . . . . . . . . . . 15
2.4.1 Boiling Effect . . . . . . . . . . . . . . . . . . . . . . . . . . . . . . . . 15
2
2.4.2 Helicity Dependent Density Fluctuation . . . . . . . . . . . . . . . . . . 152.5 Luminosity Monitor . . . . . . . . . . . . . . . . . . . . . . . . . . . . . . . . . 152.6 Spectrometers . . . . . . . . . . . . . . . . . . . . . . . . . . . . . . . . . . . . 162.7 Fast Counting DAQ . . . . . . . . . . . . . . . . . . . . . . . . . . . . . . . . . 162.8 Data Analysis . . . . . . . . . . . . . . . . . . . . . . . . . . . . . . . . . . . . 18
2.8.1 Extracting Asymmetry � � from Data . . . . . . . . . . . . . . . . . . . 182.8.2 Extracting ��� ��� � � � � from �"� . . . . . . . . . . . . . . . . . . . . . . 18
3 Expected Uncertainties and Rate Estimation 193.1 Deadtime Correction . . . . . . . . . . . . . . . . . . . . . . . . . . . . . . . . 193.2 Target Purity, Density Fluctuation and Other False Asymmetries . . . . . . . . . 193.3 Target End Cap Contamination . . . . . . . . . . . . . . . . . . . . . . . . . . . 193.4 Pion Background . . . . . . . . . . . . . . . . . . . . . . . . . . . . . . . . . . 203.5 Pair Production Background . . . . . . . . . . . . . . . . . . . . . . . . . . . . 213.6 Electromagnetic (EM) Radiative Correction . . . . . . . . . . . . . . . . . . . . 213.7 Electroweak Radiative Correction . . . . . . . . . . . . . . . . . . . . . . . . . 223.8 Experimental Uncertainties ( � and the acceptance) . . . . . . . . . . . . . . . . 223.9 Parton Distribution Functions and Ratio
�. . . . . . . . . . . . . . . . . . . . . 22
3.10 Charge Symmetry Violation (CSV) . . . . . . . . . . . . . . . . . . . . . . . . . 233.11 Rate Estimation and Kinematics Optimization . . . . . . . . . . . . . . . . . . . 243.12 Error Budget . . . . . . . . . . . . . . . . . . . . . . . . . . . . . . . . . . . . 26
4 Beam Time Request 264.1 Beam Time Request . . . . . . . . . . . . . . . . . . . . . . . . . . . . . . . . . 264.2 Beam Time Allocation for Running in Two Phases . . . . . . . . . . . . . . . . 274.3 Overview of Instrumentation and Cost Estimate . . . . . . . . . . . . . . . . . . 28
5 Summary 28
3

1 Motivation
1.1 Phenomenological WNC Couplings at Low � �An important way to test the Standard Model (SM) is to measure weak neutral current (WNC)interactions at ����� �� . Pseudoscalar observables can be constructed from a product of vector-and axial-vector couplings. In electron-quark scattering with two active quark flavors, there are6 possible phenomenological couplings � !�� � � + �� �� . In the SM, there are definite predictions forthese couplings in terms of the weak mixing angle ; = . Any deviation from the SM could indicatepossible new physics, and that the SM could be a piece of some larger framework [1]. We willbriefly describe some possible new physics scenarios in section 1.6.
We will summarize ;�= measurements at � ��� �� in the next section. Here we will focuson �� - as they are relevant to the main goal of the proposed measurements. Coefficients �� - areproducts of weak charges given at tree level by
��! � ���� � �� � ��� I � 798�: � � ;&= #�� (1)
� ! � � �� � �� ��
� �� 7>8 : � � ; = #�� (2)
� ��� � �� � �� � ��� � 7>8 : � � ; = #�� (3)
� � � � �� � �� ��
� � 7>8 : � � ;�= #�� (4)
�D+ � � �� � �� � � 5 ���4:�� (5)
� + � � �� � �� � � 5 � � (6)
� ! �� �� represents the axial M -electron coupling � �� times the vector M - � ( � ) quark coupling� �� ��� , and the � ���� �� is the vector M -electron coupling � �� times the axial M - � ( � ) quark coupling� �� ��� . Similarly, the �,+.- are the products of axial-vector electron and quark couplings, and aretherefore � -violating and parity conserving. Each of the �� - terms might be sensitive to physicsbeyond the SM in different ways.
Among experiments (finished or planned) which will test the Standard Model and the searchfor new physics, some are purely leptonic (E158) and are not sensitive to new interactions in-volving quarks, some are semi-leptonic (APV, Qweak) but can only access the weak couplings��! - . In contrast to �O! - , the weak coupling � � - and � +.- are poorly known.
Table 1 summarizes the current knowledge of �� - [2]. From existing data, ��� ��� � � � � �J���*� F ' ��� �&I [3]. This constraint is poor and must be improved in order to enhance sensitivityto many possible extensions of the SM, such as quark compositeness and new gauge bosons.���J� H PV DIS can provide precise data on ��� ��� � � � � which are not accessible through otherprocesses. We expect to improve the uncertainty on ��� ��� � � � � by a factor of eight.
The eD DIS experiment proposed here will also impact our knowledge of the �)+.- . The onlyavailable measurement sensitive to these is the CERN /! C DIS experiment [6] (see Table 1).The combination ��� + � � � + � is only known to about 50% precision, which is partly due to a largeglobal correlation coefficient of ��� F4� with the � ! - and � � - . The experiment proposed here wouldreduce this correlation to " G 3 , essentially decoupling the CERN combination, ��� + � � � + � , andreducing its uncertainty by more than 40%.
4
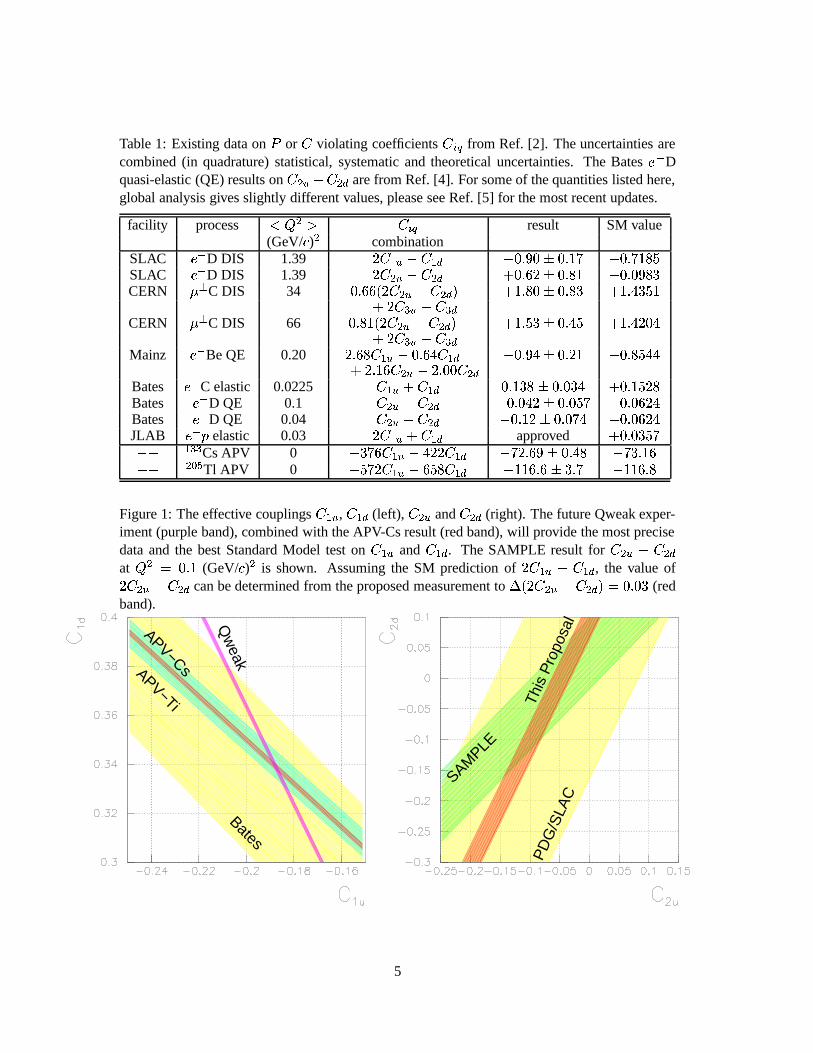
Table 1: Existing data on � or � violating coefficients �� - from Ref. [2]. The uncertainties arecombined (in quadrature) statistical, systematic and theoretical uncertainties. The Bates ��� Dquasi-elastic (QE) results on � ��� � � � � are from Ref. [4]. For some of the quantities listed here,global analysis gives slightly different values, please see Ref. [5] for the most recent updates.
facility process " ��� � - result SM value(GeV/ � ) � combination
SLAC � � D DIS 1.39 ���O! � � � ! � ���������O'A����� 1 �J���21 � F4ESLAC ��� D DIS 1.39 ��� ��� � � � � � ��� G4� 'A��� F � �J���*��� F �CERN / C DIS 34 ��� G4G � ��� ��� � � � �$# � ��� F �O'A��� F � � ��� I � E �
� ���D+ � � � + �CERN / C DIS 66 ��� F � � ��� ��� � � � �$# � ��� E ��'A��� IHE � ��� IH� � I� ���D+ � � � + �Mainz ��� Be QE 0.20 � � G4F���! � ����� G&I � ! � ������� I 'A��� � � �J��� F4E&I4I� � ��� G�� ��� � � �*�4� � � �Bates ��� C elastic 0.0225 �"! � � � ! � ����� � F 'A���*��� I � ����� E4�4FBates � � D QE 0.1 � ��� � � � � �J���*� IH� 'A���*� E 1 �J���*� G4�&IBates ��� D QE 0.04 � ��� � � � � �J����� � 'A���*�H1 I �J���*� G4�&IJLAB � ��� elastic 0.03 ���O! � � � ! � approved
� ���*��� E 1� � ! +.+ Cs APV 0 ����1 G���! � � IH�4��� ! � �O1 � � G �O' ��� IHF �"1�� ��� G� � �� Tl APV 0 � E 1 ����! � � G4E4F�� ! � � �4� G � G 'A� �21 � �4� G � F
Figure 1: The effective couplings �)! � , � ! � (left), � ��� and � � � (right). The future Qweak exper-iment (purple band), combined with the APV-Cs result (red band), will provide the most precisedata and the best Standard Model test on � ! � and � ! � . The SAMPLE result for � ��� � � � �at � ����� (GeV/ � ) � is shown. Assuming the SM prediction of ���)! � � � ! � , the value of��� ��� � � � � can be determined from the proposed measurement to
% � ��� ��� � � � �&# ���*��� (redband).
APV−Ti
APV−Cs
Bates
Qw
eak
PD
G/S
LAC
This
Pro
posa
l
SAMPLE
5

1.2 The Running of � ��� ��� = and The NuTeV Anomaly
The weak mixing angle, ;�= , is one of the fundamental parameters of the Standard Model. Elec-troweak radiative corrections induce a variation of the effective value of 7>8�: � � ;�= # with momen-tum transfer � , with a minimum near the M -pole � � �� . This variation, referred to as the“running of 798�: � ;&= ”, can be calculated within the Standard Model (SM) framework [7]. Testingthis prediction requires a set of precision measurements at � � � �� with sufficiently smalland well understood theoretical and experimental uncertainties associated with the extraction of7>8�: � ;�= , such that one can interpret the results with confidence.
At the M -pole, the value of 7>8�: � � ;�= # has been well established from a number of measure-ments [14, 15]. Combined with measurements of the � and � quark masses from the Tevatron,the average of all existing measurements gives the remarkably precise value 7>8�: � ; = � � � # � ��� � ��� � � ' ���*�4�4� � E [5] in the Modified Minimal Subtraction ( ��� ) scheme. However, carefulcomparison of measurements involving lepton and hadron electroweak couplings at the M -polehas recently revealed a three standard deviation inconsistency, which strongly hints at physicsbeyond the Standard Model or a significant systematic error underestimate in one or more exper-
Figure 2: The running of 798�: � ;&= shown as a function of � [8]. Shown are the existing AtomicParity Violation (APV) cesium measurement [9], the existing neutrino DIS (NuTeV) [10] mea-surements and M� ����� decay asymmetry measurement ( M -pole) [11], along with expected un-certainty of the approved JLAB �������� [12] and the recently completed SLAC M � ller (E158) [13]experiments.
0.001 0.01 0.1 1 10 100 1000
Q [GeV]
0.225
0.23
0.235
0.24
0.245
0.25
sin2 θ W
APV
QW
(e) ν-DISA
FB
Z-pole
measurements
SM
Weak Mixing AngleScale dependence in MS scheme including higher orders
6

iments [11].
Away from the M -pole, there exist three precision measurements 2. The first measurement isthe atomic parity violation (APV) on the cesium (Cs). While an earlier analysis claimed a twostandard deviation from the SM prediction [17], the atomic theory corrections associated withthe extraction of 7>8 : � ;�= from Cs APV have changed significantly, changing the result to be inreasonably good agreement with the SM [9].
The second measurement away from the M -pole was performed by the NuTeV collabora-tion [10]. The value of 798�: � ; = extracted from the ratios of neutral current to charged current? and �? DIS cross sections on an iron target at � � � � (GeV/ � ) � is found to be ��� above theSM prediction. The NuTeV result triggered significant theoretical interest. However, before allpossible hadronic effects are excluded, it is too early to say that this result indicates the exis-tence of physics beyond the SM. Possible hadronic effects include charge symmetry violation(CSV) [18], higher-twist effects, nuclear effects of the iron target, and asymmetry in the averagemomentum carried by the stange sea:
� ����� � �<# � �� � �<#�� �H� � .The third measurement is the recently completed M � ller experiment (E158) at SLAC [13].
The value of 798�: � ;&= was extracted from the asymmetry ���� of M � ller scattering at � ���*� �4G (GeV/ � ) � . Their preliminary result is about one standard deviation above the SM value [19].In additional to APV, NuTeV and E158, the Qweak experiment planned at JLAB Hall C willmeasure 7>8�: �<;�= at � � ���*��� (GeV/ � ) � using ��O� � elastic scattering.
1.3 Parity Violating Deep Inelastic Scattering (DIS-parity)
Historically, the observation of a parity violating asymmetry in DIS played a key role in estab-lishing the validity of the Standard Model. In the 1970’s, DIS-Parity at SLAC confirmed the SMprediction for the structure of weak neutral current interactions [20]. These results were consis-tent with a 7>8�: � ;�= � � 5 I , implying a tiny � (electron) � � (quark) neutral current interaction.Subsequent measurements performed at both very low energy scales (APV) as well as at the Z-pole have been remarkably consistent with the results of this early DIS-parity measurement. Wenow briefly review the principle of the PV mechanism for �)� @ DIS. The detailed formalismfor ������ H PV DIS will be given in the next section.
We consider electron scattering on a fixed nuclear target. We denote by � the electron mass,� ��� � �� # and� N ��� N � �� N # the initial and final electron four-momenta; the target has a mass��� and its initial four-momentum is � ������� ���# ; the final state of the target is not detected.
For a fixed target, one has � � � � � �� # in the laboratory frame. Electrons can scatter off anuclear target by exchanging either a virtual photon ( ��� ) or a virtual M , as shown in Fig. 3.Until 1977, electrons had been used solely as an electromagnetic probe of the nucleon becausethe amplitude of weak neutral-current scattering at low energy is small. A number of facilities(JLAB, SLAC, MIT-Bates, Mainz) now can provide high enough luminosity to make feasiblestudies of the nucleon via its weak neutral current coupling. The weak neutral current can beaccessed by measuring a parity-violating asymmetry that is proportional to the interference termbetween weak and electromagnetic scattering amplitudes [21].
2Also note that the latest analysis on the muon ����� gives a "! #%$ deviation from the SM value, see p. 119 ofRef. [16].
7
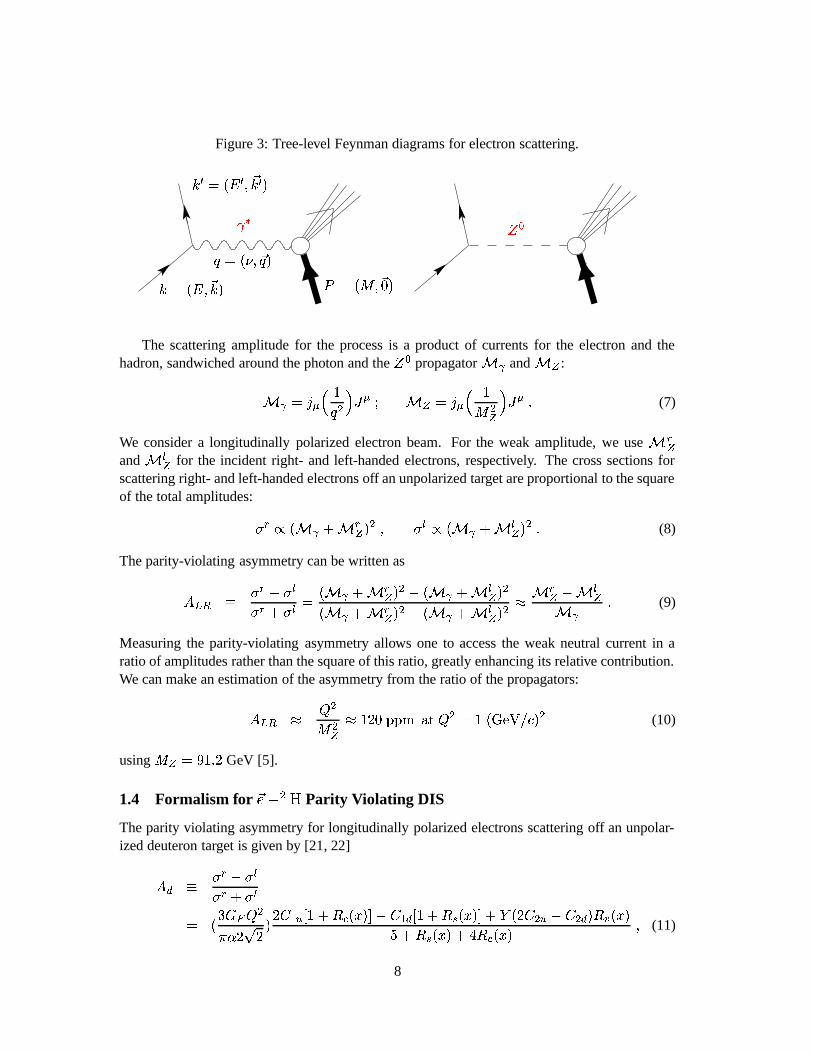
Figure 3: Tree-level Feynman diagrams for electron scattering.
������������
�� ������� ���� ����� ������� � � � ������� � �
���
The scattering amplitude for the process is a product of currents for the electron and thehadron, sandwiched around the photon and the
� �propagator "! and $# :
%! �'&)(+*-,�/.�021 (-3 4# �'&5(6*7,� .# 0�1 (-8 (7)
We consider a longitudinally polarized electron beam. For the weak amplitude, we use :9#and $;# for the incident right- and left-handed electrons, respectively. The cross sections forscattering right- and left-handed electrons off an unpolarized target are proportional to the squareof the total amplitudes: < 9>= � %!@?A 9# � . � < ; = � %!@?A ;# � . 8 (8)
The parity-violating asymmetry can be written asBDC�E F < 9HG < ;< 9 ? < ; � � ! ?' %9# � . G � ! ?A ;# � .� ! ?' 9# � . ? � ! ?A 4;# � .JI "9# GK ;# %! 8(9)
Measuring the parity-violating asymmetry allows one to access the weak neutral current in aratio of amplitudes rather than the square of this ratio, greatly enhancing its relative contribution.We can make an estimation of the asymmetry from the ratio of the propagators:B>C�E I L .� .# I ,)M �DNONQPSR/T L . � , �VU>W5XZY\[]� . (10)
using� # �_^ , 8 M GeV [5].
1.4 Formalism for `acb .ed Parity Violating DIS
The parity violating asymmetry for longitudinally polarized electrons scattering off an unpolar-ized deuteron target is given by [21, 22]BDfgF < 9 G < ;< 9 ? < ;� �5hjiDk L .lnm Mjo M �pMjqsrut�vw, ?Ax@y �{z��u| G q r f vw, ?Ax~} �{zn�u| ?A� � Mjq . t G q . f � xD� �{zn�� ?Ax~} �{z�� ?���x@y �{zn� �
(11)
8

Here, the lightest isoscaler target, deuterium, is used in order to minimize the uncertainty due toparton distribution ratio � � � # 5 � � � # while keeping the uncertainty due to nuclear effect small. InEq. (11), the coefficients � !�� ���� �� are given by Eq. (1-4), ��� ����� G4G � ��� ��� (GeV) � � is theFermi weak interaction coupling constant, and
� �,� � �J��� # �� � � �J��� # � ��� � � 5 � � � � # (12)
with��� � � 5 � � , �6 ? 5 � and ? � � � N the energy loss of the incident electron.
The ratios�
,� C and
���are given by the quark distribution functions:
� � �<# � � � �4� �<# � ���� � #.#� � �<# � �� � � # � � � � # � �� � �<# �
� C � �<# � � � � � �<# � ��H� �<#.#� � �<# � �� � � # � � � � # � �� � �<#
�4:�� ��� � �<# � � � � �<# � � � � � #� � �<# � �� � � # � � � � # � �� � �<# � (13)
with � � � �<# and � � � �<# the valence quark distributions, � � �<# � � � �<# � �<C �� � � # � ��L� �<# , � � �<# � � � � # � � C �� � �<# � �� � � # , � � � # � C �� � �<# � ��H� � # and �4� �<# � C �� � �<# � ��4� �<# .
At high � one has�� � � ,
� C � � and��� � � , thus the uncertainty in � ��� ��� � � � �&# due to
the error in �)� is � � ��� ��� � � � � #� ��� ��� � � � � # �
� �"��"�
� �J� �� ��� ! � � � ! ���� ��� � � � ��� � (14)
Therefore measurements at larger�
are more sensitive to � ��� ��� � � � � # . This can also be seenby an inspection of Eq. (11).
1.5 Higher-Twist Effects
Among all hadronic effects that could contribute to PV electron scattering observables, thehigher-twist (HT) effect is expected to be the most probable for kinematics at Jefferson Lab.Here higher-twist effects refer to the fact that the color interactions between the quarks becomestronger at low � and the process cannot be described by the leading twist diagram of Fig. 3.For electro-magnetic scattering processes, these interactions introduce a scaling violation to thestructure functions in the low � region below � (GeV/ � ) � that is stronger than the ��: � � # -dependence of the DGLAP equations of pQCD. For PV ���� � H scattering, HT effects start fromtwist-four terms which diminish as � 5 � .
The theory for HT effects is not well established. Most of the knowledge for HT is fromexperimental data. When determining the HT effects from DIS structure functions � ! and � � ,the leading twist contribution often cannot be subtracted cleanly because of the uncertainty dueto the cutoff in summing the BLC series, and the uncertainty in B C itself in the low � region.The first parameterization of the HT coefficient ��� � showed sizable effect for all � values thatincreases dramatically at higher � [23]. In this calculation the pQCD � -evolution was removedup to Next-Leading-Order (NLO). The latest fit to the HT coefficient, however, shows that the
9
effect for ����� " � " ��� I diminishes quickly to " � 365 � as higher order terms (NNLO andNNNLO) are included when evaluating the leading-twist term [24].
There is almost no information from data on how HT effects PV observables. Theoretically,estimates of the twist-four corrections to the asymmetry in ��H� � H scattering have been carriedout in various models. In a work by Castorina and Mulders [25], the expansion of the productof electromagnetic and weak currents within the MIT bag model was used. The twist-four cor-rection to the measured �� �O� H asymmetry is given by
� 7>8�: � ;&= �J��� �4� � I�� B �� # 5 � � � � # ,where
� !���� ����� IHE GeV is the bag pressure and � �����4� F GeV is the nucleon mass.The bag-model parameter B (or the effective color coupling constant) is within the range of� " B " ���*� . Using B (��� E and 7>8�: � ;�= � ��� � � G , one obtains a ������3 correction to theasymmetry at � ���*� (GeV/ � ) � . In a similar work by Fajfer and Oakes where in additionthe deuteron matrix element of the operators was used, it was found that the higher-twist effectsdecrease the value of 7>8�: � ; = by less than � 3 [26]. This corresponds to " � 3 contribution tothe asymmetry.
The second approach to estimate HT correction to PV DIS is based on experimental data on� � � and the assumption that the HT effects partly cancel in the numerator and the denominatorof the asymmetry. Presumably, the higher twist dynamics is the same for the � � and M exchangeprocesses in PV DIS as that for � � , hence cancel in the asymmetry. One possible effect that doesnot cancel comes from the different coupling strength of the EM and weak interactions in theinterference term, which is proportional to the EM and weak charges, respectively. Quantitativecalculations for the HT correction to � � were performed in the QCD LO, NLO and NNLOframework [27]. Parameterization of ��� � by Virchaux and Milsztajn [23] was used as an input.The results show the HT correction to � � is at level of � 365 � for ����� " � " ����� in NLO orhigher order analysis.
One interesting remark is that, it has been shown that although the NuTeV measurementwas performed at � � � � (GeV/ � ) � , the HT contribution to the typically measured Paschos-Wolfenstein (P-W) ratio could be of the same magnitude as that to the PV DIS observable at � � � (GeV/ � ) � [28]. A � � E 3 HT effect to this ratio will remove a large part of the ���anomaly (the P-W ratio measured by NuTeV is � � E 3 lower than the SM value). Note that a� � E 3 contribution at � � (GeV/ � ) � implies the same magnitude HT contribution to our high � measurement and a E 3 contribution to our low � measurement. Since we will measure theasymmetry to � �*� F 3 at the low � point, we will be able to observe it if the HT is indeed thereason of the NuTeV anomaly.
Overall, most theories predict that the HT contribution to ��� is at the � 365 � level. If so, theeffect at our high � point will be about � 5 E of the statistical error and will not be significant.However, there has been no experimental proof of these theories and thus if a large deviationfrom the SM is observed, HT will be the most probable reason. Therefore we will measure�O� at �� ������� (GeV/ � ) � . If the HT contribution is statistically significant at the high �measurement, it will show up at this low � . This first observation of the HT effect in PVasymmetries will also provide crucial input to the future DIS-parity program at 12 GeV, and mayhelp to explain the NuTeV anomaly.
10
1.6 Exploring Physics Beyond the Standard Model
Although there exists a large amount of data confirming the electroweak sector of the SM at alevel of a few 0.1%, there also exist strong conceptual reasons (e.g., the so-called high-energydesert from ��� �� � � �4E � GeV up to the reduced Planck scale ��� � � � I � ��� !�� GeV, andthe unexplained origins of mass and violation of discrete symmetries) to believe that the SM isonly a piece of some larger framework [1]. While this framework should provide answers to theconceptual puzzles of the SM, it should not spoil the successful predictions of the SM for mostexisting electroweak data. Phenomenologically, the observations of neutrino oscillations alreadyprovide the first discovery of a type of effect that cannot be understood in the confines of the SM.Hence there is intense interest in the search for new physics. In this section we first describe howDIS-parity can explore new physics in a somewhat different way than Qweak, E158 and NuTeV.We then give a few possible models for new physics that might be explored via measurement of�O� and � � - ’s for the precision proposed here, namely the search for extra neutral gauge bosonM N , compositeness and leptoquark.
1.6.1 DIS-Parity and New Physics
If free from nuclear and QCD higher-twist effects, the DIS-parity measurement will explore pos-sible new physics beyond the Standard Model. DIS-parity involves exchange of M betweenelectrons and quarks and thus is sensitive to physics that might not be seen in purely leptonicobservables, such as the precision � �� at SLC and � ��� at LEP. There is currently a ��� dis-agreement [11] in 798�: �<;�= between purely leptonic and semi-leptonic observables at the M -polefrom SLC and LEP. The recent NuTeV [10] result on 7>8�: �<;&= at low � involves a particularset of semi-leptonic charged and neutral current reactions and is ��� from the SM prediction.A precision measurement of DIS-parity will add a clean semi-leptonic observable to the worlddata below the M -pole and may provide essential clues as to the source of the latter of thesediscrepancies.
A precision DIS-parity measurement would also examine the M coupling to electrons andquarks at low � far below the M -pole. This is important because DIS-parity is sensitive to aparticular combination of couplings and has completely different sensitivities to new physics thanother semi-leptonic processes (e.g., Qweak). For example, the quark and lepton compositenessis accessible only through � � - but not �O! - if a particular symmetry [SU(12)] is respected. DIS-parity will significantly strengthen the constraints on these possible new physics.
The mass limit to which the proposed measurement is sensitive to can be estimated using thefollowing model independent analysis. Analogous to Eq. (25-27) of Ref. [29], the low energyeffective electron-quark Lagrangian of the form � � � #�� � ���# is given by� �� ����� � �� ������� (15)
where
� ����� � ��� � �� ��� ���
- � ! - � � � � � (16)
� ������� � �I�� � �� � � � � �"! -� � � � � � (17)
11

and � , � and ! -� are, respectively, the coupling constant, the mass scale, and effective coefficientsassociated with the new physics. The mass limit in our case is therefore
� 5 ��� �� � � % � ��� ��� � � � � # � � ���21������ (18)
1.6.2 M�N Searches
Neutral gauge structures beyond the photon and the M boson have long been considered as one ofthe best motivated extensions of the SM [30]. They are predicted in most Grand Unified Theories(GUT) and appear in superstring theories. Such a gauge boson is called a M N . There may be amultitude of such states at or just below the Planck scale, and there exist many models in whichthe M N is necessarily located at or near the weak scale. Only the light M N is of interest here.
Since a M N which couples to M will strongly affect the observables around the M -pole, whichhave been measured to a remarkable precision, we only consider a M N which does not mix withM . Direct searches at FNAL have ruled out any M N with � � " G ��� GeV but a heavier M N ispossible. Such a M"N can arise in ��� [31], a rank- G group and a possible candidate for the GUT.This � � breaks down at the Planck scale and becomes the SU(3) � SU(2) � � U(1) � symmetryof the familiar SM. The breaking of ��� to the SM will lead to extra M ’s and it is possible that atleast one of these is light enough to be observed. The effect of a M N in ��� might be observed inneutrino DIS, PV e-N scattering, PV M � ller scattering and APV.
The mass limit on M N can be obtained from Eq. (18). From simple models based on GUTone expects � � ��� IHE [29], giving � � � ���2141 TeV. Moreover, for M N models and also forthe SM itself, there is a fortuitous effect, which is that ��� ��� � � � � (� � ����! � � � ! �$# . Thusinstead of a M�N search of ��� E TeV, one is instead sensitive to a limit higher by
� � , giving about� � � ����� � TeV.
1.6.3 Compositeness and Leptoquark (LQ)
If quarks and leptons have intrinsic structure (compositeness), then there may be an interchangeof fermion constituents at very short distances [1]. The lowest dimension contact interactions arethe four-fermion contact interactions between quarks and leptons, described by 8 relevant terms
�� � � � ��� � � �� where � ��� �� � �and � � � [34]. They lead to a shift in couplings [35]
% ��! - �� � � ��J��� � - � � � � - � � � -��� � � � -�� # (19)
% � � - �� � � � � � � � � - � � � � - � � � -��� � � � -�� # (20)
In theories that predict quark and lepton compositeness, there are new strong confining dynam-ics at a scale � . Any contact terms produced by the strong dynamics will respect its globalsymmetries, and it is not difficult to find such global symmetry (other than parity) which ensurecancellations in the change in �)! - ’s. For instance, an approximate global SU(12) acting on allleft handed first generation quark states will cause no effect on � ! - ’s while still allow a non-zerocontribution to � � - ’s ( ����(��� � � � � (� � �
) [33]. Therefore, measurement of � � - ’s will
12

provide a unique opportunity to explore quark and lepton compositeness. Using the formalismof Ref. [32], a four-fermion contact interaction of form ' ������ � �� � � � � � � � � � � � � will change � � - ’s
by '�� �� �� � � where � gives the scale of the interaction. Thus the measurement on � � - ’s proposed
here will set a limit of �O! � � � E4G TeV. Although this is somewhat lower than the mass limitsgiven in Ref. [35, 36] where the most recent HERA data [37] are included, the limits there wereobtained by allowing one contact term at a time, and setting all others to zero. Ultimately weneed information on all parameters simultaneously and results from the proposed measurementwill provide important inputs to such a fit.
Leptoquarks are vector or scalar particles carrying both lepton and baryon numbers. For DIS-parity, the presence of LQ will change the observed asymmetry by an amount proportional to� � 5 I � ��� where � �� is the mass of LQ and
�is its coupling to electron and quarks. Assuming
for simplicity creation of a scalar leptoquark from interactions with � quarks but not � quarks,one can use Eq. (18) but need to multiple the r.h.s. by factor of
� � for the scalar LQ case. Themeasurement on ��� ��� � � � � proposed here will thus set a limit of
� C�� ����� I � � �� 5 ���4��� ��� # ,comparable to the current limit from the Cs APV experiment.
2 Experimental Setup
2.1 Overview
The floor plan for Hall A is shown in Fig 4. We use an F4E6/ A polarized beam and a �4E cmliquid deuterium target. The scattered electrons are detected by the two standard Hall A HighResolution Spectrometers (HRS). A fast Data Acquisition (DAQ) system will be built to ac-commodate a rate as high as � MHz from each HRS. A Luminosity Monitor (Lumi) is locateddownstream on the beam-line to monitor the helicity-dependent target boiling effect and possiblefalse asymmetries to a ��� ��� level. We will describe the instrumentation in the next few sections.
Figure 4: Hall A floor plan for the proposed measurement.
Right HRS
Left HRS
LD TargetPolarimeterCompton
MollerPolarimeter
Raster
BCM BPMARC eP
2
LuminosityMonitor
13
2.2 Beam Line
We propose to use G �*� GeV polarized beam with a F �H3 polarization and F4E,/ A beam current. Toreduce the heat impact on the target, the beam is circularly rastered such that the beam spot sizeat the target is � I mm in diameter. The beam energy can be measured to a
% � 5 � � � ��� � �level using either ARC or eP devices [39]. We need � 3 precision in the beam polarization mea-surement in order to achieve an acceptable systematic uncertainty on the final results. We planto upgrade the Hall A Compton polarimeter (see next paragraph) to provide this � 3 precision.We will also use additional information from the M � ller polarimeter (with an upgrade alreadyproposed by the approved experiment E00-003 [40]) to cross-check the Compton results.
The current systematic uncertainty of the Compton polarimeter is about ������3 for IR laser,6 GeV beam and electron detection mode ( ��� F 3 from calibration, ��� �4E 3 from beam propertiesand ��� E 3 from laser polarization). An upgrade to a green laser is already planned [41] and willreduce the uncertainty due to calibrations to 0.9%. If the current G �4� / m micro-strips used inthe electron detector can be upgraded to ���4� / m [41], the uncertainty due to calibrations will beimproved further by a factor of two ( � ��� E 3 ), giving a total systematic uncertainty of ���21 E 3 .The cost estimate for upgrading the electron detector proposed here is ��� ��� K 3 for the partsand � E calendar days facility development time (beam can be on during the last 2 days).
For the Compton polarimeter one can also use the photon analysis method based on either theresponse function type (currently being used) or on the integration of the photon signal (currentlybeing tested). The preliminary results from the photon integration are promising and this methodis believed to be accurate at the 1% level for 6 GeV beam. Thus it will provide a check of theelectron analysis result with independent detector and analysis. The photon integration methodwill be used in the 2005 running of HAPPEX II. Overall, we will use � 3 in the analysis ofsystematic uncertainties.
Currently the M � ller polarimeter in Hall A can provide ��3 precision. Upgrades have beenproposed by an approved experiment (E03-003, Pb-parity) for the M � ller to reach a precision of� � 3 [40]. We will use M � ller as a cross check for the Compton polarimeter.
2.3 Parity DAQ (Hall A)
The parity DAQ in Hall A [42] and the beam helicity feedback system have been successfullyused to control the beam helicity-dependent asymmetry for the Hall A parity experiments in thepast. The asymmetry in the integrated beam current measured by the parity DAQ is sent to thepolarized electron source where the Pockel cell voltage is adjusted accordingly to minimize thebeam intensity asymmetry. The beam helicity asymmetry can be controlled to the ��� ��� level.The false asymmetry caused by the beam helicity asymmetry should be much smaller than thisnumber (since it is a second order effect). This is sufficient for the proposed measurement.
3This number only includes the cost of new strip planes, 5 strip planes (4 to use + 1 spare) are needed. The costof a 600 � m plane is $2.35K in year 2003. An extra $16K is needed for a new mask to produce the new 300 � m stripsize. Cost for manpower is not included here.
14

2.4 The Liquid Deuterium Target
We plan to use a �4E -cm long cryogenic liquid deuterium (LD � ) target at its highest cooling power,limiting the beam current to F4E - / A. The target density is ����� G 1 g/cm � . The end-caps of the cellare made of 3 mil Be. The end-cap contamination will be measured using two empty targets withdifferent end-cap thicknesses.
2.4.1 Boiling Effect
The target boiling effect has two meanings. The first one is the “local boiling effect”, which is thereal phase change of the liquid target. We require zero local boiling for the proposed measure-ment. The second meaning is usually used for parity experiments. In this case, “target boiling” isa terminology for (1) the change in target density due to heating of the target, for example, changein density due to deviation in beam parameters, mostly spot size; and (2) pulse-to-pulse targetdensity fluctuation. The latter may cause a false asymmetry and will affect the measurement. Wewill discuss it in the next subsection. The first one will generate a noise (“boiling noise”) in thesignal which is equivalent to an additional statistical fluctuation, as described below.
The rate for the proposed measurement is around � � E � � E �4� # kHz (see section 3.11). Thestatistical uncertainty per beam pulse pair ( �4� ms H+ and �4� ms H-, hence total is G4G ms) is on theorder of ')���*� � . If the noise from target boiling effect is controlled at the same level as previousHAPPEX I ( � �4� ppm in 1998) and HAPPEX II ( ���4� ppm in 2004) experiments, then the effecton the statistical width of the measured asymmetry will be negligible. The control of the targetboiling noise can be monitored by the luminosity monitor, as will be described in section 2.5.
2.4.2 Helicity Dependent Density Fluctuation
The measured parity-violating asymmetry of �� - � H scattering is expected to be � ���4� ppm. Thehelicity dependent density fluctuation should be controlled to under ���*� E 3 of this value, i.e.,���*� E ppm. The Luminosity Monitor in Hall A will monitor this quantity. Taking advantage ofthe high rate at small angle, it is possible to monitor the false asymmetry to a 100 ppb levelwithin each beam helicity pulse, and hence guarantee the control of the density fluctuation toan acceptable level. The luminosity monitor will be described in the next section. The targetcooling system and the boiling effects will be tested during commissioning runs.
2.5 Luminosity Monitor
Luminosity Monitors (Lumi) were successfully used for the SAMPLE experiment at MIT-BATES,the A4 experiment at MAINZ [43], the E158 experiment at SLAC [44] and the G0 experimentin Hall C. In Hall A, a luminosity monitor built by the MIT group [45] was used in the 2004running period of HAPPEX II [46] and will be used by the 2005 run of HAPPEX II and the Pbparity experiment [40]. The main purpose of Lumi is to measure an essentially zero asymmetryduring normal running of the experiment, to a very high precision. The main effect that Lumi issupposed to monitor is the target boiling effect. Lumi is also used to monitor all other generalfalse asymmetries (for example, the possible beam energy asymmetry).
The Hall A Lumi consists of F pieces of quartz at ��� E�� . Each piece has � � E cm � effectivearea at 1 m from target. The rate for G -GeV beam is � ��� !.! Hz per piece [47]. With this high
15
rate, the false asymmetry and the target boiling effect has been monitored to a level of ���4� ppmper pulse during the 2004 running of HAPPEX II for a 1&� / A current and a E � E mm raster.With a F4E"/ A current and a � � � mm raster being proposed here, the noise level is expected tobe controlled below the ��� + ppm level, thus will add negligible effect to the statistical width ofthe measured asymmetry (0.01 per pulse).
Most of the events in Lumi are elastic. The asymmetry is in general proportional to � , hencethe physics asymmetry detected by Lumi is very small, of the order of " ���4� ppb. Thereforethe false asymmetry can be monitored to � ���4� ppb. This will cause a " ����� 3 systematicuncertainty to the measured asymmetry which is sufficient for the proposed measurement.
2.6 Spectrometers
We use the standard Hall A High Resolution Spectrometer (HRS) to detect the scattered elec-trons. For each HRS the effective solid angle acceptance for an extended target is E � I msr and themomentum bite is ' I � E 3 . The central momentum of the HRS can be calculated from the dipolefield magnitude and the HRS constant to the E � ����� � level [48]. The HRS central angle can bedetermined to ')��� � mrad using H � � � � N � # elastic scattering data, with careful analysis[49].
Partical identification (PID) in each HRS will be done with a CO � ��erenkov detector and a
double-layered lead glass shower detector. Based on data from the past experiments, the com-bined pion rejection factor of the detectors was found to be � ��� � [50], provided that the elec-tron efficiency of each one to be � �4��3 . At high rate, a practical estimate of the PID efficiencyshould also take into account the effect of event pileup, detector readout deadtime and electronicnoise. We simulated these effects and find that the pion rejection with the fast counting DAQshould be better than ��� + . We will use this value in the analysis of systematics uncertainties (seesection 3.4).
2.7 Fast Counting DAQ
Because of the need to separate the pion background we must use a counting method. Thecounting method has been used successfully at 100 MHz by the Mainz A4 parity violation exper-iment [43][51]. Also relevant is the experience of the G0 collaboration in deploying a countingmethod [52]. Normally an integrating DAQ, in which one integrates the detected flux over thehelicity pulse, is preferred for parity violation experiments because it avoids dangerous deadtimecorrections. However, we believe we can control this correction as further discussed below.
The detector signals we will use include the ten signals from the gas��
erenkov detector andthe approximately 180 signals from two layers of leadglass detectors. In addition, the 24 signalsfrom scintillators might be useful for crude directional information. To process this informationwe are considering a modified version of the Flash ADC (FADC) which is presently being de-signed by the Fast Electronics Group at JLab. A schematic diagram is given in Fig. 5. This FADCdesign will allow for the possibility of counting experiments at approximately 1 MHz with lowand precisely measurable deadtime, e.g. � 3 deadtime measured to ������3 absolute accuary. TheFADC fills an on-board memory at 250 MHz with � I / sec latency (buffer size). The informa-tion provides both amplitude and timing information about the signal. An on-board processor(FPGA) will analyze the digitized data, with intermediate results sent to an external trigger pro-cessor to form a trigger based on on multiple FADC boards. Assuming the processing is fast
16

Figure 5: Schematic diagram for the fast DAQ system (a possible 2 �� generation of JLab in-
house design).
Flexiblelogic & arithmetic
FPGA
Possiblesorting ofdata (PID)
FPGA
Memory
Digitization & memory
signals
VMECPU
Trigger
decisionMulti−ADC
trigger
12−bit out
readout
FADC
250 MHz, 2 usec latency, 1 MHz on−board analysis, 0.1% DT measurement
enough there is practically no deadtime in the system, although there will be pileup effects, asdiscussed below. The scheme will be flexible enough to accommodate a variety of experiments.The FADCs are being built for the Hall A 12 GeV upgrade and this proposal capitalizes on thisdevelopment. A first version of the FADC should be ready by 2007.
The on-board algorithm shall permit an online identification of electrons, pions, and associ-ated pileups, and counts these in local memory on the FADC. The data which is read out fromthe FADCs by the VME cpu is the number of counts of these particles integrated over the helicitypulse, usually at 30 Hz, and possibly at a higher sampling rate, say 600 Hz. In a test mode theentire FADC data may be read (at the price of some deadtime) to check the reliability of thealgorithm.
Electrons are identified as events which pass above the��
erenkov cut and which deposit asufficient total energy in the leadglass, while pions leave no signal in the
��erenkov and small
average signals in the leadglass. The efficiency of the cuts and the cross contamination of theparticle samples can be checked at very low beam current. From experience in Hall A, theseefficiencies and contaminations are already known under running conditions similar to the pro-posal. Pileup of two particles will occur in approximately G 3 of events if we make no changesto the existing phototubes which have a 60 nsec resolving time. Although these effects are not
17
easy to study directly at high rates, we can indirectly study them by an analysis in which the dataof independent events are added. The pileup effects include: 1) � � – � � ; 2) � � – � ; 3) � –� . Since electrons must only pass a threshold, electrons accompanied by a secondary particlewill still be counted as electrons; however, a correction must be applied for 2 electron pileup.These can be measured using a higher threshold cut on the leadglass and counting the events thatpass this higher threshold. At a total rate of 1 MHz (500kHz � � and 500kHz � � ), the pileupsinvolving pions will result in a � ��� E � � �*� # 3 loss of the pion count rate, since they tend to bemoved away from the one-pion cut window. A fraction � ��� E � � # 3 of two pion events will becounted erroneously as electrons. These effects from pions can be corrected with sufficient ac-curacy and the uncertainty is practically negligible (since the � 5�� ratio and the pion asymmetrywill be measured precisely).
If the processing of the FADC is fast enough we can maintain a deadtime which is verysmall, probably � 10 nsec. However, the system may have a deadtime of order � 3 which couldbe different for different physical processes. Our goal is to measure the deadtime correction tothe physics asymmetry with an absolute accuracy ')������3 . To ensure reliability it is importantto measure the deadtime with at least two independent methods as follows. A first method isto pulse the detector channels with a light sources whose amplitude and pulse shape is similarto those of real particles, and count how many of these signals are subsequently identified bythe electronics. A second method is to introduce a deliberate programmed deadtime into thefrontend, thus making it predictable and understood.
2.8 Data Analysis
2.8.1 Extracting Asymmetry � � from Data
The parity violating asymmetry of �� � � H scattering is extracted from the measured raw asym-metry as
�"� ��� ���� �� �� � % � � � (21)
where ��� � �� � F �H30' ��� F )% is the beam polarization. We will discuss in more details theelectromagnetic radiative correction
% � � � in section 3.6.
2.8.2 Extracting ��� ��� � � � � from �"�From Eq. (11), one can extract ��� ��� � � � � from the leading twist asymmetry � � � � � as
��� ��� � � � � � � �"� � � � � � � (22)
where � � and � � , if the electroweak radiative corrections are not included, are given by
� � � � E � � C � I �� � � � (23)
� � � ����! � � � � � # � � ! �H� � � � C #� ��� � (24)
18
with � + ��� � � � E �4� � E ppm/GeV � and
� ,
� C and� �
are defined by Eq. (13). For � ! -we use the Standard Model values Eq. (1-2) and 798�: � ;&= ��� � � E . With electroweak radia-tive corrections, Eq. (27-28) (see section 3.7) need to be used for � ! - ’s in Eq. (24). We usedMRST2002 [53] and CTEQ6M [54] PDF fits to evaluate
� ,
� C and��
and their uncertainties.The uncertainty in ��� ��� � � � � due to the error in PDF fits, kinematic variables, and various othereffects will be given in section 3.
3 Expected Uncertainties and Rate Estimation
In this section we first estimate the systematic uncertainties for ��� and theoretical uncertaintiesfor extracting � ��� ��� � � � � # . Then we give the rate estimate, calculate the statistical uncertaintyand in the end give the beam time request for the proposed measurements.
3.1 Deadtime Correction
The uncertainty of the deadtime correction will ������3 as described in section 2.7.
3.2 Target Purity, Density Fluctuation and Other False Asymmetries
The liquid deuterium usually used contains [55] � F4F � ppm HD, " ���4� ppm H � , I � I ppm N � ,���21 ppm O � , ��� E ppm CO (carbon monoxide), " � ppm methane and ����� ppm CO � (carbondioxide). Compared to the statistical accuracy of the measurement ( � ����� 3 in � � ), the onlynon-negligible contamination to the measured asymmetry is from the proton in HD. Since theasymmetry of the proton is given by [22]
��� �� � � �� B � � � # ��� ! � � � � # � � ! � � � � �<# � � � � #�� � � � ��� ��� � � � � # � � � � � � � �<#��
I� � � # � � � � # � � � �<# (25)
which is within ' ���H3 of the asymmetry of the deuteron, the proton in HD contributes� � � 5 �"� "���*� � 3 uncertainty to the measured asymmetry. The Luminosity Monitor can make sure that the
target density fluctuation is less than ����� ppm. This is " ����� 3 uncertainty in the measuredasymmetry.
3.3 Target End Cap Contamination
The target cell endcaps are made of 1 mil aluminum with � mil Be in the central region which thebeam goes through. Be has density 1.848 g/cm � , the ratio of yield from endcaps to that from LD �is estimated to be � � � 5 � ��� � ��� � � 5 ����� � � � G&I 3 for each endcap. This ratio can be measuredquickly using an empty target with the same end caps as the LD � cell. Since Be has M I ,@ E , the asymmetry of ��O� � � scattering is not very different from ��� and can be measuredusing an empty target with thick
� � endcaps. To keep the rate of empty cell runs in each HRSbelow 500 KHz while minimizing the beam time, we will use an empty cell with F � times thickerBe endcaps than that of the LD � cell for the measurement at �O ������� (GeV/ � ) � and the beamtime needed is � � E 3 of the electron production time. For measurement at � ������� (GeV/ � ) �we will use an empty cell with ���4� times thicker endcaps and the beam time is � � � 3 of theelectron runs. The uncertainty in the extracted asymmetry is � ������3 .
19

3.4 Pion Background
Pion rate
The rate of pion photo-production was estimated by Wiser’s fit [56]. Wiser’s fit is expected tobe good within a factor of 2. We also used previous DIS data within a very similar kinematicregion, and found the real � � 5���� ratio is very close to half of the value given by Wiser’s fit [57].Nevertheless, we will double the pion rate from Wiser’s fit as a conservative estimate for the pro-posed measurement. The electron rate is calculated using a world fit to
�[58] and the deuteron
structure function � �� [59]. The pion to electron ratio is expected to be � ��� F for the low � and� E ��� for the high � measurement.
PID efficiencies for Hall A detectors
A CO � ��erenkov counter and a double-layered lead glass counter will be used for particle iden-
tification (PID). The PID efficiencies for the Hall A detectors are well understood. With carefuldetector calibration and off-line analysis, the combined pion rejection factor was found to bebetter than ��� � for both spectrometers [50] in the regular counting DAQ mode. With the fastcounting mode, signals from the
��erenkov detector, lead glass counters and scintillators are sent
to the fast counting system which accumulates the electron and pion events separately. See sec-tion 2.7 for the design of fast counting DAQ. Test runs are necessary to check the PID efficiencieswith fast counting DAQ. The threshold for the PID units of the DAQ system will be set before theproduction running based on the test-run results. We expect the combined pion rejection factorwith fast counting DAQ to be better than � ��� + .
Pion asymmetry
The asymmetry of pion production in the DIS region is expected to be small. We first discussthe possible effect from single spin asymmetries. The single beam-spin azimuthal asymmetry(beam SSA) reported recently by the HERMES collaboration [60] is consistent with zero, butwith large uncertainties. The data from JLAB Hall B [61] show an azimuthal beam SSA for
��� electro-production, � ���������� � � E 3 . However, since this is an inclusive measurement thatintegrates over the out-of-plane angle, � , we do not expect any background from SSA.
The only possible background to the proposed measurement comes from weak interactionsbetween partons. Compared to the measured asymmetry, which comes from the interferenceterm between electromagnetic and weak interactions, this background is suppressed by a factorof ���4� �����4�4� . Since the measured asymmetry is about ���4� ppm, the maximum background onecan have is less than ��� � � , or ����� 3 of �"� .
Experimentally, in the original SLAC experiment [20] the pion asymmetry was found to besmaller than the electron asymmetry. Overall, we expect the pion asymmetry to be well below��� � � . The combined pion rejection factor is expected to be better than ��� + . Hence the asym-metry from the pion background will be less than 0.1 ppm. Compared to the measured electronasymmetry � ���4� ppm, and considering that the � 5�� ratio is less than E for both kinematics, thisis a negligible effect. We will use ����� 3 for the � � uncertainty due to pion background in theanalysis.
Furthermore, the pion asymmetry will be measured using the fast pion counters. And thepion to electron ratio will be determined easily using the regular counting mode DAQ at a lower
20

beam current and a � � hour run. One will achieve an uncertainty in the pion asymmetry of� � ��� �� @ � � �
� �� � � � � � @ � �
�� �
� ��� � � �� �"�O�
�� �
� ��� � � � � �3 �"�$# (26)
where�
is the � � 5���� ratio, � � � � � � is the pion detection efficiency using the fast counting DAQ. Toensure the purity of the pion events, we will use tight PID cuts to select pions hence � � � E �H3 .This gives an uncertainty of
� � � � � ��� ppm for the low � and� � � � � ��� ppm for the high
� measurement. Considering the pion rejection factor of ��� + , the effect in �)� from the pionbackground will be ensured to be below � � ����� � and ��� � � for the low and high � measurement,respectively.
3.5 Pair Production Background
Part of the background of the proposed measurement comes from the pair production � � � � � ,where � is coming from the decay of the electro- and photo-produced � ’s. The pair productionfrom Bremsstrahlung photons is highly forward-peaked and is not significant for the kinematicsproposed here. The estimated positron to electron ratio is B � ���*� F 143 for � ������� and����� �4��3 for ������� (GeV/ � ) � . (We used Wiser’s fit [56] to calculate the � � and � � rates andtake the average as the value for � , then multiplied by two to give a conservative estimate.)Usually the � � ��� pairs are assumed to be symmetric and the asymmetry of the � � of the pairproduction background is the same as the positron asymmetry. Because the pion asymmetry forthe proposed measurement is below 1 ppm as discussed in the last section, the asymmetry ofpositrons (or electrons from � � � � pairs) will be at the same level. Because the � � 5�� � ratio isbelow � 3 , the effect on � � from the pair production background will be well below ����� ppm,or ����� 3 of �"� . We will use ����� 3 in the uncertainty analysis. We will measure the real positronrate using the regular counting DAQ. The requested beam time for positron runs is I �*� hours foreach � measurement.
3.6 Electromagnetic (EM) Radiative Correction
Figure 3 describes the scattering process at tree level. In reality both the incident and the scat-tered electrons can emit photons. Consequently when we extract cross sections and asymmetriesfrom the measured values there are electromagnetic radiative corrections to be made. The theoryfor the EM radiative correction is well developed [62]. The correction can be calculated and theuncertainty in the correction is mainly due to the uncertainty of the structure functions ( � � and
�for an unpolarized target) that are used in the calculation. The ratio of the radiated (observed)
cross section and asymmetry to the un-radiated (Born) ones has been calculated [63] and the un-certainty in the asymmetry correction was found to be at the ��� I 3 (relative) level, correspondingto an uncertainty of ���*�4�H1 E for � ��� ��� � � � �&# at �O ������� and ���*�4� I � at �O ������� (GeV/ � ) � ,respectively.
21
3.7 Electroweak Radiative Correction
The products of weak charges � !�� ���� �� given by Eq. (1-4) are valid only for the case in whichthere is no electroweak radiative correction. With this correction they are given by
��! � � N � ���� I ��� N 7>8�: � � ;�= #�� � � ! � (27)
� ! � � N ���
� ���� N 7>8�: � � ;�= #�� � � ! � (28)
� ��� � � ���� � � 7>8�: � � ;�= #�� � � ��� (29)
� � � � ���
� � � 798�: � � ; = #�� � � ! � (30)
The electroweak radiative correction is well determined in the Standard Model, though otherHiggs scenarios and/or new physics at the TeV scale will affect the electroweak correction, of-fering the opportunity for new physics. Standard Model electroweak radiative corrections to� !�� ���� �� have been calculated [64] and are relatively small. The corrections modify the � , � , and�
parameters from their tree level values � � � N �
� N � and
� ! � � ! � � ��� � � � � .A recent evaluation [3, 5] gives ��N ����� F4F � , � N ���*�4� � 1 , � ���*�4� �4� , �
���*�����4� ,� ! �
� � � ! � � �21 � ��� ��� , � ��� �����*� � � � ,� � � 0���*�4� �4G , changing the asymmetry by � � � � 3 at
�" ������� and � � � G 3 at �" ������� (GeV/ � ) � . The error in the SM prediction is dominated byour knowledge of the 798�: � ;�= at the proposed energies, which in turn is dominated by the Z-polevalue. This uncertainty (about ��� G � ��� � � from Z-pole asymmetries or ��� E � ��� � � from theglobal fit [5]) would introduce a " ������3 error in the asymmetry. The top quark and Higgs bosonmasses adjust themselves (at least in the SM) to reproduce the measured value of the mixing an-gle. The uncertainty from BD� � # is at the ����� � level. The running of 7>8�: � ;�= can be calculatedin perturbation theory because the proposed � is above hadronic scale and the uncertainty isnegligible. Overall, the uncertainty on the corrected asymmetry is less than ��� � 3 , correspondingto an uncertainty of ���*�4����1 for � ��� ��� � � � �&# at � ������� and ���*�4� �&I at � ������� (GeV/ � ) � ,respectively.
3.8 Experimental Uncertainties ( � � and the acceptance)
The largest systematic uncertainty related to the asymmetry is the � 3 uncertainty in the beampolarization. Other sources that will contribute when extracting � ��� ��� � � � �$# from �"� includethat from the uncertainty in beam energy
% � 5 � � � ����� � [39], the spectrometer centralmomentum
% � N 5 � N E � ��� � � [48], and the scattering angle% ; ��� � mrad [49]. The �
for each kinematic setting will be determined using low beam current and regular counting modeDAQ. The uncertainty in � is thus given by the uncertainties in � , � N and ; . It contributes a% � ��� ��� � � � �$# ���*�4���4� and ���*�4� � � uncertainty to the low and high � point, respectively.From experience of previous polarized experiments in Hall A [65], the acceptance of the HRScan be well simulated and the helicity-dependence of the acceptance is negligible.
3.9 Parton Distribution Functions and Ratio�
The uncertainty in�
is estimated using a world fit [58]. The uncertainty in � ��� ��� � � � �$# dueto
�is about ���*�4� � � for both � measurements. We used two PDF sets MRST2002 [53] and
22
CTEQ6M [54] to calculate the quark distribution ratios�
,� C and
� �and the asymmetry �)� .
The uncertainties of each PDF set as well as the difference between two sets are used to estimatethe uncertainty in the extracted � ��� ��� � � � �$# . The effects are found to be
% � ��� ��� � � � �$# ���*�4� � � and ���*�4� �4E uncertainty to the low and high � point, respectively.
3.10 Charge Symmetry Violation (CSV)
Charge symmetry implies the equivalence between � ( � ) quark distributions in the proton and� ( � ) quarks in the neutron. Most low energy tests of charge symmetry find it is good to atleast � 3 level [66] so it is usually assumed to be justified in discussions of strong interactions.However, charge symmetry is not strictly true since the constituent mass of the � quark is heavierthan the � quark.
The charge symmetry violating (CSV) distributions are defined as [67]� � � � # � � � �<# � � � � � #!� (31)� � � � # � � � �<# � � � � � #!� (32)
where the superscripts � and � refer to the proton and neutron, respectively. Eq. (31) is usuallyreferred to as the “majority” CSV term and Eq. (32) is the “minority” CSV term. The relationsfor CSV in anti-quark distributions are analogous. Taking into account the CSV effect, Eq. (11)becomes
�"� �� � �L �� B � � � # (33)
� ��������� ������������������� ������!�"�� �#�%$&�'�(�)���%���*�+�%�!$!�,��-.� ���0/��1�2�0/��3� � �%45���(���7698;:=<> � / 698;?@<> �A �#� $ �'�(�B��C"� � ���(�D�+� ��� �ECF� ��� ��� ��$where
�HG - and�HG -�I are defined as
�HG � � � � � # � � �� � � #� � �<# � �� � � # � � � � # � �� � �<# �
�JG � � � � �<# � � �� � � #� � �<# � �� � � # � � � � # � �� � �<# �
�HG � I � � � � � #� � �<# � �� � � # � � � � # � �� � �<#
�4:�� �HG � I � � � � �<#� � �<# � �� � � # � � � � # � �� � �<#
� (34)
CSV distributions for the valence quarks can be calculated using phenomenological parton dis-tributions based on [68] � � � � �<# � � �� �
� � � � �� � �<#�� � � �
��� � �
� � �<#� � � � �<# � ��
K � �� � � � �
� � �<#�� � �� � �
� � �<#�L (35)
23

where� � �
�� � � ����� MeV is the mass difference between the neutron and proton,� � � � � � � I ��� MeV is the mass difference between the �����*� and � � quarks (value
taken from Ref.[68]) and � is the average nucleon mass.
We first used Eq. (35) to calculate the CSV for valence quarks. The valence quark PDF arefrom MRST2001 [53] and CTEQ6M [54]. For the sea quarks we used a meson cloud MIT-bagmodel [68]. We find the CSV effect
� 5 is " � 3 for � � , � and �� , � �"�A� # 3 for � � and �� and� � � I # 3 for �� , respectively.
We also studied a recent parameterizations (MRST2003 with theoretical uncertainties) [24]which gave fits for the CSV term in both the valence and the sea quarks. While at the proposedkinematics the new MRST fits give smaller CSV for the valence quarks than Eq. (35), they givean F 3 CSV for sea quarks, much larger than the MIT-bag model prediction. Here we take themaximum of the MRST fit and the value from Eq. (35) as an estimate for the valence quark CSV,and take the average of the MRST fit and the MIT-bag model prediction for the sea quark CSV.Overall, the uncertainty from CSV is
% � ��� ��� � � � �$# ���*�4�H1 I and ���*�4� G4F at the low and high � point, respectively.
3.11 Rate Estimation and Kinematics Optimization
We used the NMC95 unpolarized DIS fit [59] to calculate the � � rate. Pion and positron (pairproduction) backgrounds are estimated using Wiser’s [56] fit (with � � rate multiplied by 2 basedon previous data). The optimized kinematics is given in Table 2.
Table 2: Kinematics for the Proposed Measurements. Rates are for each HRS and � � 5�� � ratiosare two times results from Wiser’s fit. The low � measurement will take place on the left HRSand the high � measurement will be shared by the two HRSs.
Kinematics I II� �� ��� �4E ������� � (GeV/ � ) � ������� �������� (GeV) G �*� G �*�� N (GeV) � � G4G � � G �; � � ��� � � ���*� �� � (GeV) � I ��� F E ������ ��� I 1 � ���21 � 1
� " ���*�4� � ���*�4� �� C ���*� IHG ���*� I4I��� ��� F 1 E ����������"� (measured, ppm) ������� E � � G ��� G��� rate (KHz) �4F&I � G �4G �21� � 5���� ratio ��� F E ���� � 5�� � ratio ���*� F 143 ����� �4��3total rate (KHz) E � ��� G � G4F ������ production time (days) � �*� � � �*�endcap runs ��� � ���21� � runs ��� � ��� �
24
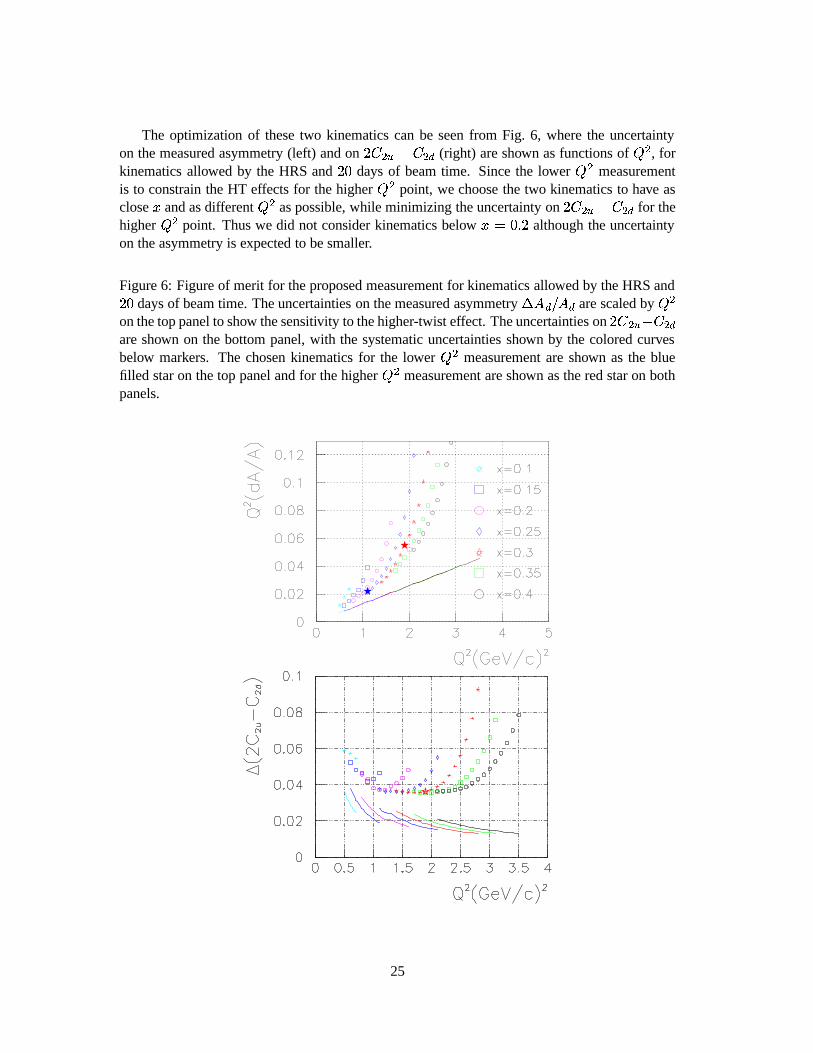
The optimization of these two kinematics can be seen from Fig. 6, where the uncertaintyon the measured asymmetry (left) and on ��� ��� � � � � (right) are shown as functions of � , forkinematics allowed by the HRS and � � days of beam time. Since the lower � measurementis to constrain the HT effects for the higher � point, we choose the two kinematics to have asclose � and as different � as possible, while minimizing the uncertainty on ��� ��� � � � � for thehigher � point. Thus we did not consider kinematics below � ��� � although the uncertaintyon the asymmetry is expected to be smaller.
Figure 6: Figure of merit for the proposed measurement for kinematics allowed by the HRS and� � days of beam time. The uncertainties on the measured asymmetry
% ��� 5 �"� are scaled by �on the top panel to show the sensitivity to the higher-twist effect. The uncertainties on ��� ��� � � � �are shown on the bottom panel, with the systematic uncertainties shown by the colored curvesbelow markers. The chosen kinematics for the lower � measurement are shown as the bluefilled star on the top panel and for the higher � measurement are shown as the red star on bothpanels.
25

3.12 Error Budget
Table 3: Expected uncertainties on the asymmetry � � . The systematic uncertainties are the samefor both � points.
Source/� ���� � �� ������� (GeV/ � ) � �� ������� (GeV/ � ) �%
� � �� �� 5 � � �� �� � 3 � 3 � 3Deadtime correction � ������3 � ������3Target endcap contamination ������3 ������3Target purity " ���*� � 3 " ���*� � 3Pion background " ��� � 3 " ��� � 3Pair production background " ��� � 3 " ��� � 3systematics �������H3 �������H3statistical � �*� F 3 � �*� � 3stat.+syst. � � IHE 3 � � I � 3
Table 4: Expected uncertainty on ��� ��� � � � � .
Source/% � ��� ��� � � � �$# � ������� (GeV/ � ) � � ������� (GeV/ � ) �
Statistical ���*��� F4F ���*� �&IHGSystematics (from �)� ) ���*� �&I � ���*� � E4FExperimental ( � ) ���*�4���4� ���*�4� � �% ��� � � 5 � � ���*�4� � � ���*�4� � 1Parton Distributions ���*�4� � � ���*�4� �4ECharge Symmetry Violation ���*�4�H1 I ���*�4� G4FElectro-magnetic Radiative Correction ���*�4�H1 E ���*�4� I �Electro-weak Radiative Correction ���*�4����1 ���*�4� �&Itotal uncertainty ���*� I 1�� ���*�����H1
4 Beam Time Request
4.1 Beam Time Request
We request IHG days of beam time for a measurement of% � ��� ��� � � � �$# ���*��� . Within these
IHG days, IH� ��� days are for production running, including I ���*� for � � runs, F �*� hours for � � runsand ����� days for measuring the asymmetry of target Be end-caps. We need four days commis-sioning for commissioning of the fast counting DAQ system and the Compton polarimeter, andmeasuring � and checking PID performance with the regular counting DAQ as well as the fastcounting DAQ. Table 5 summarizes the details of the proposed measurements. Beam times are
26
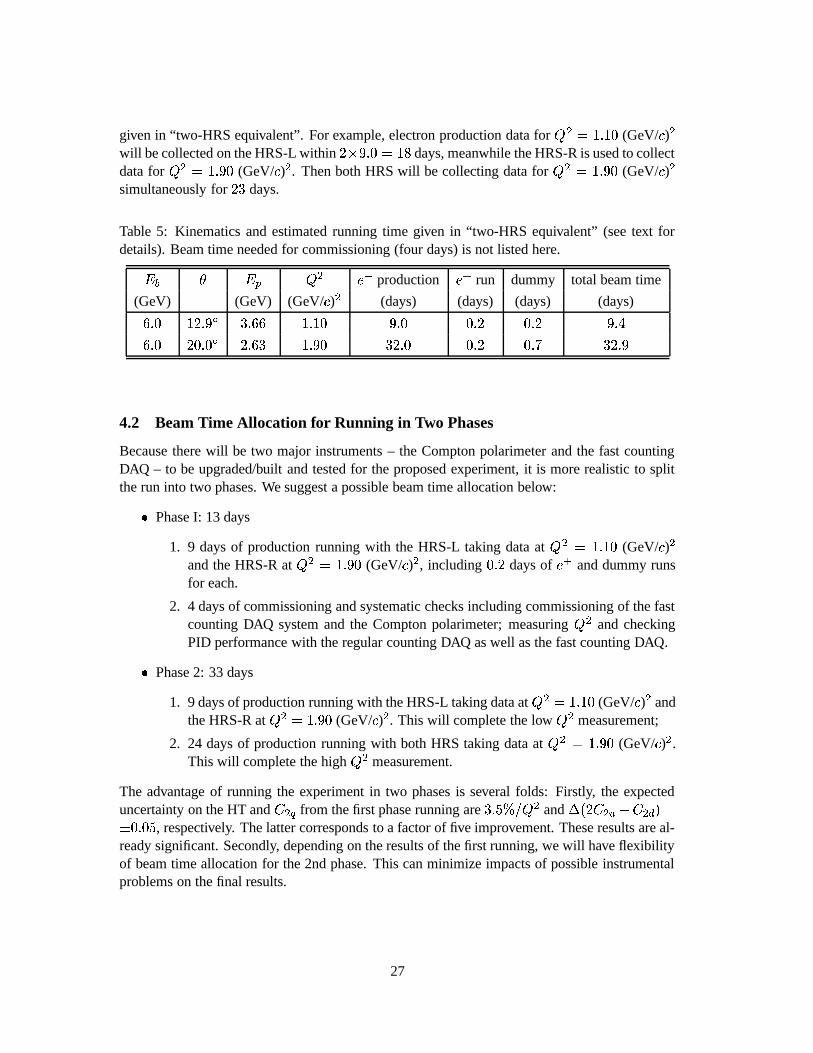
given in “two-HRS equivalent”. For example, electron production data for �O ������� (GeV/ � ) �will be collected on the HRS-L within ��� � �*�� � F days, meanwhile the HRS-R is used to collectdata for �� ������� (GeV/ � ) � . Then both HRS will be collecting data for �� ������� (GeV/ � ) �simultaneously for � � days.
Table 5: Kinematics and estimated running time given in “two-HRS equivalent” (see text fordetails). Beam time needed for commissioning (four days) is not listed here.
� � ; � � � ��� production � � run dummy total beam time
(GeV) (GeV) (GeV/ � ) � (days) (days) (days) (days)
G �*� � � ��� � � � G4G ������� � �*� ��� � ��� � � � IG �*� � ���*� � � � G � ������� � � �*� ��� � ���21 � � ���
4.2 Beam Time Allocation for Running in Two Phases
Because there will be two major instruments – the Compton polarimeter and the fast countingDAQ – to be upgraded/built and tested for the proposed experiment, it is more realistic to splitthe run into two phases. We suggest a possible beam time allocation below:
� Phase I: 13 days
1. 9 days of production running with the HRS-L taking data at � ������� (GeV/ � ) �and the HRS-R at � ������� (GeV/ � ) � , including ��� � days of � � and dummy runsfor each.
2. 4 days of commissioning and systematic checks including commissioning of the fastcounting DAQ system and the Compton polarimeter; measuring � and checkingPID performance with the regular counting DAQ as well as the fast counting DAQ.
� Phase 2: 33 days
1. 9 days of production running with the HRS-L taking data at � ������� (GeV/ � ) � andthe HRS-R at �� ������� (GeV/ � ) � . This will complete the low � measurement;
2. 24 days of production running with both HRS taking data at � ������� (GeV/ � ) � .This will complete the high � measurement.
The advantage of running the experiment in two phases is several folds: Firstly, the expecteduncertainty on the HT and � � - from the first phase running are � � E 365 � and
% � ��� ��� � � � �$# ')���*� E , respectively. The latter corresponds to a factor of five improvement. These results are al-ready significant. Secondly, depending on the results of the first running, we will have flexibilityof beam time allocation for the 2nd phase. This can minimize impacts of possible instrumentalproblems on the final results.
27
4.3 Overview of Instrumentation and Cost Estimate
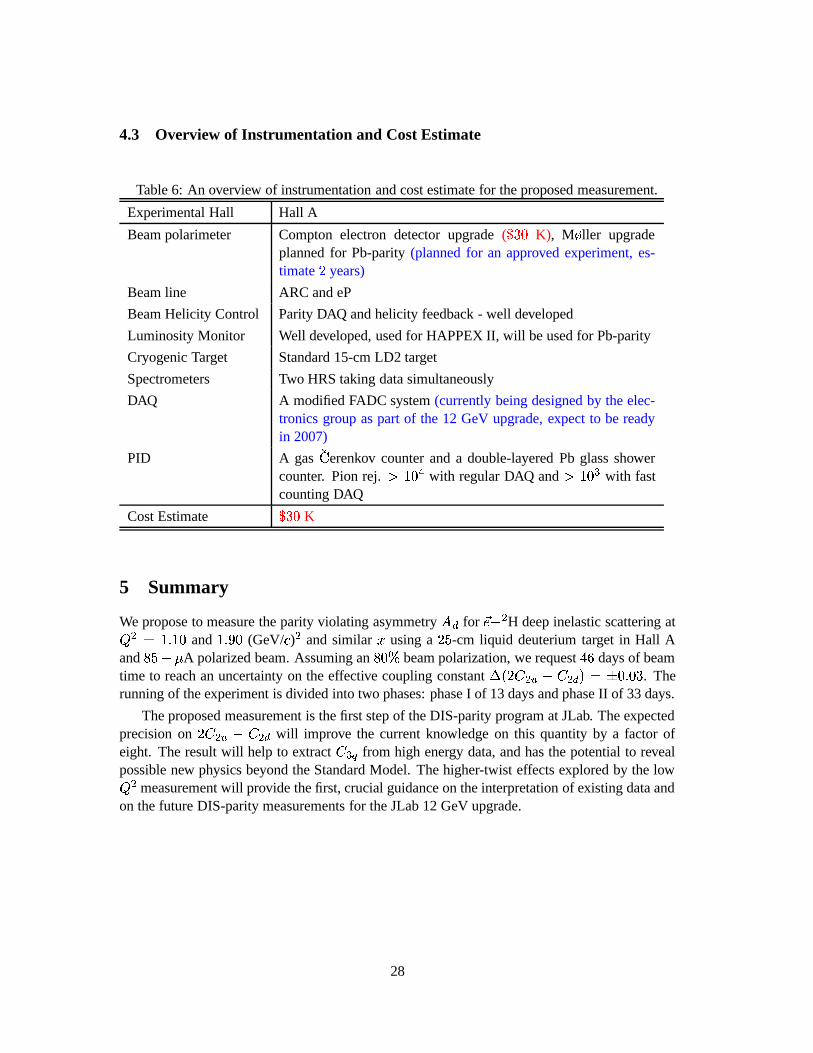
Table 6: An overview of instrumentation and cost estimate for the proposed measurement.
Experimental Hall Hall A
Beam polarimeter Compton electron detector upgrade ( � ��� K), M � ller upgradeplanned for Pb-parity (planned for an approved experiment, es-timate � years)
Beam line ARC and eP
Beam Helicity Control Parity DAQ and helicity feedback - well developed
Luminosity Monitor Well developed, used for HAPPEX II, will be used for Pb-parity
Cryogenic Target Standard 15-cm LD2 target
Spectrometers Two HRS taking data simultaneously
DAQ A modified FADC system (currently being designed by the elec-tronics group as part of the 12 GeV upgrade, expect to be readyin 2007)
PID A gas��
erenkov counter and a double-layered Pb glass showercounter. Pion rej. � ��� � with regular DAQ and � ��� + with fastcounting DAQ
Cost Estimate � ��� K
5 Summary
We propose to measure the parity violating asymmetry ��� for �� � � H deep inelastic scattering at � ������� and ������� (GeV/ � ) � and similar � using a �4E -cm liquid deuterium target in Hall Aand F4E � / A polarized beam. Assuming an F �H3 beam polarization, we request IHG days of beamtime to reach an uncertainty on the effective coupling constant
% � ��� ��� � � � �$# 0')���*��� . Therunning of the experiment is divided into two phases: phase I of 13 days and phase II of 33 days.
The proposed measurement is the first step of the DIS-parity program at JLab. The expectedprecision on ��� ��� � � � � will improve the current knowledge on this quantity by a factor ofeight. The result will help to extract � +.- from high energy data, and has the potential to revealpossible new physics beyond the Standard Model. The higher-twist effects explored by the low � measurement will provide the first, crucial guidance on the interpretation of existing data andon the future DIS-parity measurements for the JLab 12 GeV upgrade.
28
Acknowledgment
We would like to thank Stanley Brodsky, Wally Melnitchouk, Piet Mulders, Willy van Neer-ven and Fabian Zomer for useful discussions and David Lhuillier for helping with technicalissues.
References
[1] M.J. Ramsey-Musolf, Phys. Rev. C60, 015501 (1999).
[2] J. Erler and M.J. Ramsey-Musolf, arXiv: hep-ph/0404291.
[3] Particle Data Group, Phys. Rev. D 66, 010001 (2002); http://pdg.lbl.gov.
[4] E.J. Beise, M.L. Pitt and D.T. Spayde, Prog. Part Nucl. Phys. 54, 289 (2005) (available onwww.sciencedirect.com).
[5] Review of Particle Physics, S. Eidelman et al. Phys. Lett. B 592, 1 (2004);http://pdg.lbl.gov.
[6] A. Argento et al. Phys. Lett. B 120, 245 (1983).
[7] A. Czarnecki and W.J. Marciano, arXiv: hep-ph/0003049.
[8] J. Erler, Contribution to the Fermilab Workshop on ”QCD and Weak Boson Physics” at theTevatron Run II; arXiv: hep-ph/0005084.
[9] A.I. Milstein, O.P. Sushkov, I.S. Terekhov, hep-ph/0212072 (2002); Phys. Rev. Lett. 89,283003 (2002); V.A. Dzuba, V.V. Flambaum, J.S.M. Ginges, Phys. Rev. D66, 076013(2002).
[10] G.P. Zeller et al. (NuTeV Collaboration), Phys. Rev. Lett. 88, 091802 (2002).
[11] M. Chanowitz, Phys. Rev. Lett. 87, 231802 (2001); Phys. Rev. D66, 073002 (2002).
[12] R. Carlini et al. ( ������� Collaboration) “The ������� Experiment: A Search for New Physicsat the TeV Scale Via a Measurement of the Proton’s Weak Charge”, (2001).
[13] K.S. Kumar et al., (SLAC E-158-M � ller Collaboration) “A Precision Measurement of theWeak Mixing Angle in M � ller Scattering”, SLAC Proposal E-158.
[14] P.C. Rowson, D. Su and S. Willocq, Highlights of the SLD physics program at SLAC, Ann.Rev. Nucl. Part. Sci., 51, 345 (2001).
[15] A Combination of Preliminary Electroweak Measurements and Constraints on the StandardModel. Technical Report CERN-EP/2001-98, (2001), arXiv: hep-ex/0112021.
[16] G.W. Bennett et al. (Muon g-2 Collaboration), Phys. Rev. Lett. 92, 161802 (2004); G.W.Bennett et al. (Muon g-2 Collaboration), Phys. Rev. Lett. 89, 101804 (2002); H.N. Brownet al. (Muon g-2 Collaboration), Phys. Rev. Lett.86, 2227 (2001).
29

[17] C.S. Wood et al., Science, 275, 1759 (1997); S.C. Bennet and C .E. Wieman, Phys. Rev.Lett. 82, 2484 (1999);
[18] J.T. Londergan, A.W. Thomas, Phys. Lett. B 558, 132 (2003).
[19] Preliminary results of E158 Run I-III, seehttp://www.slac.stanford.edu/exp/e158/plots/results.html
[20] C.Y. Prescott, et al., Phys. Lett. B 77,347 (1978).
[21] R.N. Cahn and F.J. Gilman, Phys. Rev. D 17, 1313 (1978).
[22] P.E. Bosted et al. (SLAC E-149 Collaboration), “DIS-Parity: Parity Violation in Deep In-elastic Electron Scattering”, SLAC Proposal E-149 (1993).
[23] M.!Virchaux and A. Milsztajn, Phys. Lett. B 274, 221 (1992).
[24] A.D. Martin, R.G. Roberts, W.J. Stirling and R.S. Thorne, Eur. Phys. J. C35, 325 (2004).
[25] P. Castorina and P.J. Mulders, Phys. Rev. D 31, 2760 (1985).
[26] S. Fajfer and R. J. Oakes, Phys. Rev. D 30, 1585 (1984).
[27] W.L. van Neerven, priv. comm.; X. Zheng et al., JLab LOI 03-106, June 2003.
[28] M. Gluck and E. Reya, Phys. Rev. Lett. 47,1104 (1981).
[29] J. Erler, A. Kurylov and M.J. Ramsey-Musolf, Phys. Rev. D 68, 016006 (2003).
[30] Section by K.S. Babu and C. Kolda, The M N Searches, in K. Hagiwara et al. (Particle DataGroup), Phys. Rev. D 66, 010001 (2002); http://pdg.lbl.gov.
[31] D. London and J.L. Rosner, Phys. Rev. D 24, 1530 (1986).
[32] P. Langacker, M. Luo and A.K. Mann, Rev. Mod. Phys. 64, 87 (1992).
[33] A.E. Nelson, Phys. Rev. Lett. 78, 4159 (1997).
[34] E. Eichten, K.D. Lane, M.E. Peskin, Phys. Rev. Lett. 50, 811 (1983).
[35] D. Zeppenfeld and K. Cheung, arXiv: hep-ph/9810277.
[36] K. Cheung, Phys. Lett. B 517, 167 (2001).
[37] C. Adloff et al., (H1 Collaboration), Z. Phys. C, 74, 191 (1997); J. Breitweg et al. (ZEUSCollaboration), Z. Phys. C 74, 207 (1997).
[38] E. Leader and E. Predazzi, An Introduction to Gauge Theories and Modern ParticlePhysics, Vol. 2, Cambridge University Press (1996).
[39] J. Alcorn et al., Nucl. Instrum. Meth. A 522, 294 (2004).
30

[40] R. Michaels et al., Neutron skin of � � Pb Through Parity Violating Electron Scattering, Anupdate of E00-003, PAC 23 proposal, accepted, � rating.http://www.jlab.org/ rom/pbupdate.ps
[41] D. Lhuillier, priv. comm.
[42] B. Humensky, General exam advanced project, Princeton University (1999); B. Humensky,Ph.D. Thesis, Princeton University (2003).
[43] D. von Harrach, F.E. Maas et al.; http://www.kph.uni-mainz.de/A4/
[44] G.M. Jones, Luminosity Monitor, E158 Technical Note, updated 9/11/01 (2001).
[45] R. Suleiman, A Conceptual Design of Hall A Luminosity Monitor, presentation on Hall Aparity collaboration meeting, September 2002.
[46] K. Kumar and D. Lhuillier, JLAB experiment E99-115,http://www.jlab.org/exp prog/CEBAF EXP/E99115.html.
[47] R. Suleiman, priv. comm.
[48] N. Liyanage, Spectrometer constant determination for the Hall-A High Resolution Spec-trometer Pair, Jefferson Lab Hall A technote, JLAB-TN-01-049.
[49] H. Ibrahim, P. Ulmer, N. Liyanage, JLAB Hall A Technical Notes JLAB-TN-02-032,(2002).
[50] X. Zheng, JLAB Hall A detector PID efficiency analysis using high electron and high pionrate data, see E99-117 website http://hallaweb.jlab.org/physics/experiments/he3/A1n/
[51] S. Koebis, P. Achenbach, et.al., Nucl. Phys. B (Proc. Suppl.) 61B, 625 (1998).
[52] G. Batigne, et.al., “Deadtime Corrections for the French Electronics”, G0 Internal Memo.
[53] A.D. Martin, R.G. Roberts, W.J. Stirling and R.S. Thorne, arXiv: hep-ph/0211080.
[54] CTEQ: The Coordinated Theoretical-Experimental Project on QCD; J. Pumplin,D.R. Stump, J. Huston et al., J. High Energy Phys. 07, 012 (2002).
[55] M. Seely, Gas Chromatograph Analysis for Deuterium Sample, July 26, 2002.
[56] D.E. Wiser, Ph.D. thesis, Univ. of Wisconsin, (1977);
[57] Here is a comparison of Wiser’s fit to data. Data are from E97-103 in Hall A using a + Hetarget (K. Kramer priv. comm.), the calculated � � 5�� � ratio has taken into account the piondecay.
��� ; � N � � 5�� � (data) � � 5�� � (Wiser)
3.46579 18.592 1.600 1.635 3.430
4.59825 18.592 1.990 2.255 4.051
4.59825 15.798 2.290 1.010 1.897
5.7269 15.798 2.630 1.459 2.506
5.7269 18.585 2.270 3.252 5.258
31
[58] K. Abe et al., Phys. Lett. B 452, 194 (1999).
[59] M. Arneodo et al., Phys. Lett. B 364, 107 (1995).
[60] A. Airapetyan et al., Phys. Rev. Lett. 84, 4047 (2000).
[61] H. Avakian et al., Phys. Rev. D 69, 112004, (2004).
[62] L. Mo, Y.S. Tsai, Rev. Mod. Phys. 41, 205 (1969).
[63] R. Arnold, P.E. Bosted, S.E. Rock et al., DIS-parity – Search for New Physics ThroughParity Violation in Deep Inelastic Electron Scattering, SLAC-LOI-2003-1 (2003)
[64] W.J. Marciano and A. Sirlin, Phys. Rev. D 29, 75 (1984).
[65] X. Zheng, Ph.D. Thesis, Massachusetts Institute of Technology, (2002).
[66] G.A. Miller, B.M.K. Nefkens and I. Salus, Phys. Rep. 194, 1 (1990).
[67] J.T. Londergan, A.W. Thomas, Phys. Lett. B558, 132 (2003); C. Boros, J.T. Londergan andA.W. Thomas, Phys. Rev. Lett, 81, 4075 (1998).
[68] E. Sather, Phy. Lett. B 274, 433 (1992).
32
![Lab Update Rolf Ent - Home | Jefferson Lab · 2015. 1. 16. · Measurement of the Parity-Violating Asymmetry in eD Deep Inelastic Scattering (a [2C1u – C 1d] + [2C 2u – C 2d])](https://static.fdocuments.in/doc/165x107/60f84198ccf1a5285712a5e7/lab-update-rolf-ent-home-jefferson-lab-2015-1-16-measurement-of-the-parity-violating.jpg)