GY/GEO 461 Flooding Damage Modeling Exercise · GY/GEO 461 Flooding Damage Modeling Exercise Page 1...
15
GY/GEO 461 Flooding Damage Modeling Exercise Page 1 of 15 Introduction In this exercise you will calculate the potential flood damage in a local subdivision caused by various hurricane storm intensities. The raw data provided will include: 1. A polygon topology coverage in ArcGIS® geodatabase format containing the subdivision property parcels and tagged with the current market value. The ArcGIS system keeps track of the area of each parcel automatically. The parcel map coordinate system is UTM grid zone 16, NAD27 map datum. 2. A DEM in ASCII format for the Springhill 7.5 minute quadrangle in NAD27 format. 3. The Springhill 7.5 minute topographic quadrangle in NAD27 DRG format (GeoTIFF). This file is used for reference only. Concept You will use the polygon “intersect” feature of the ArcGIS to tabulate where rising flood levels would affect the property parcels. Because the GIS can keep track of the amount of flooding on each parcel, a very accurate assessment of property loss is possible. You will be given a complete polygon topology of the affected subdivision (Figure 1) derived from the Mobile County Tax Assessor’s Office. Each parcel will have several data items on the object data fields, including market value of the property, and whether the property is residential or commercial. You will generate a 2 nd polygon topology of the flood levels affecting the subdivision area based on historical flood records. Weather experts have calculated that a category 1 hurricane that moved slowly over Mobile county could potentially cause a flood event 15 feet above the Langham Park Lake north of 12 Mile Creek. Assuming that the mean lake elevation is 85 feet elevation, the 100 foot topographic contour line should indicate the extent of flooding during the category 1 flood event. You will also consider the effects of category 2 and 3 storms that generate flood levels up to 110 and 120 respectively. The generated flood levels polygon topology should each polygon containing attribute data field that stores the category level (Field name = Category [Integer]). To create this topology you need only trace the 100, 110, and 120 foot contour lines as “cutting edges” of a polygon feature that covers the same extent as the tax parcels. You will then “intersect” the two polygon topologies to form a 3 rd polygon topology that would contain the storm category along with the market value of the flooded portion of the parcel. This data will then be exported in “report” format so that you can import the results into Excel. Excel will be used to calculate the property damage caused by each storm category. Step 1: Download Data Files
Transcript of GY/GEO 461 Flooding Damage Modeling Exercise · GY/GEO 461 Flooding Damage Modeling Exercise Page 1...

GY/GEO 461 Flooding Damage Modeling Exercise
Page 1 of 15
Introduction
In this exercise you will calculate the potential flood damage in a local subdivision caused byvarious hurricane storm intensities. The raw data provided will include:
1. A polygon topology coverage in ArcGIS® geodatabase format containing the subdivisionproperty parcels and tagged with the current market value. The ArcGIS system keeps track of thearea of each parcel automatically. The parcel map coordinate system is UTM grid zone 16,NAD27 map datum.
2. A DEM in ASCII format for the Springhill 7.5 minute quadrangle in NAD27 format.
3. The Springhill 7.5 minute topographic quadrangle in NAD27 DRG format (GeoTIFF). Thisfile is used for reference only.
Concept
You will use the polygon “intersect” feature of the ArcGIS to tabulate where rising flood levelswould affect the property parcels. Because the GIS can keep track of the amount of flooding oneach parcel, a very accurate assessment of property loss is possible. You will be given acomplete polygon topology of the affected subdivision (Figure 1) derived from the MobileCounty Tax Assessor’s Office. Each parcel will have several data items on the object data fields,including market value of the property, and whether the property is residential or commercial.You will generate a 2nd polygon topology of the flood levels affecting the subdivision area basedon historical flood records. Weather experts have calculated that a category 1 hurricane thatmoved slowly over Mobile county could potentially cause a flood event 15 feet above theLangham Park Lake north of 12 Mile Creek. Assuming that the mean lake elevation is 85 feetelevation, the 100 foot topographic contour line should indicate the extent of flooding during thecategory 1 flood event. You will also consider the effects of category 2 and 3 storms thatgenerate flood levels up to 110 and 120 respectively.
The generated flood levels polygon topology should each polygon containing attribute data fieldthat stores the category level (Field name = Category [Integer]). To create this topology you needonly trace the 100, 110, and 120 foot contour lines as “cutting edges” of a polygon feature thatcovers the same extent as the tax parcels. You will then “intersect” the two polygon topologies toform a 3rd polygon topology that would contain the storm category along with the market valueof the flooded portion of the parcel. This data will then be exported in “report” format so thatyou can import the results into Excel. Excel will be used to calculate the property damage causedby each storm category.
Step 1: Download Data Files
GY/GEO 461 Flooding Damage Modeling Exercise
Page 2 of 15
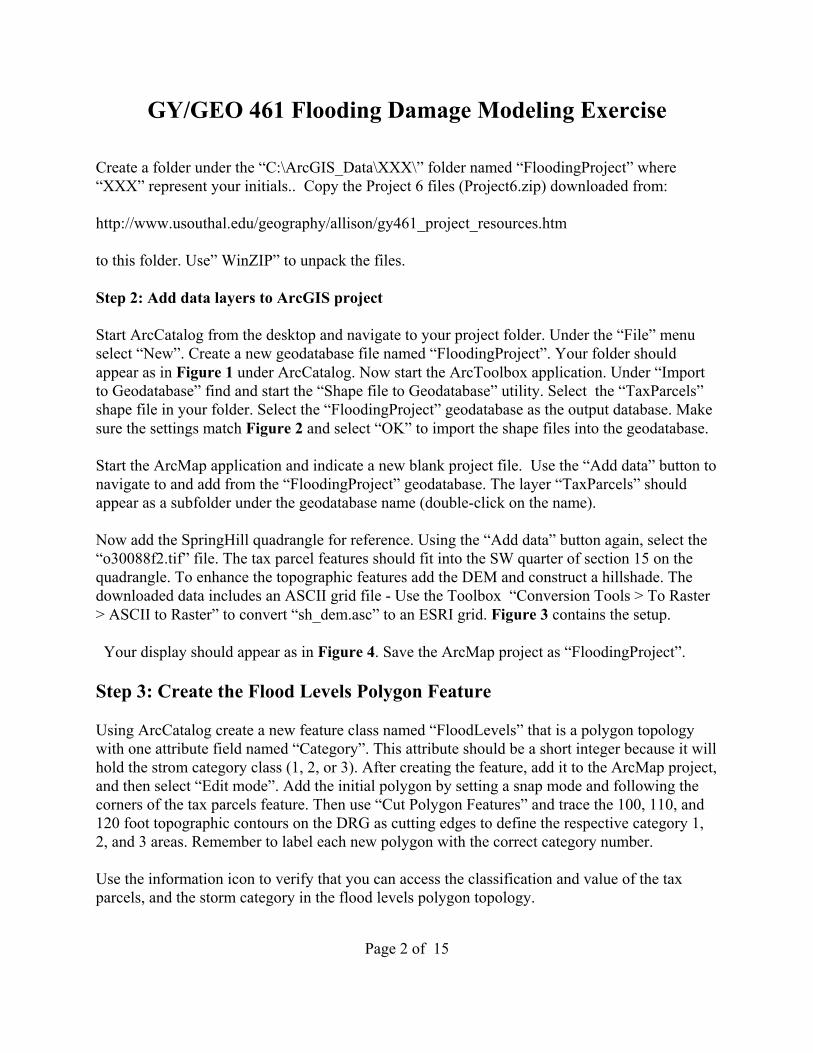
Create a folder under the “C:\ArcGIS_Data\XXX\” folder named “FloodingProject” where“XXX” represent your initials.. Copy the Project 6 files (Project6.zip) downloaded from:
http://www.usouthal.edu/geography/allison/gy461_project_resources.htm
to this folder. Use” WinZIP” to unpack the files.
Step 2: Add data layers to ArcGIS project
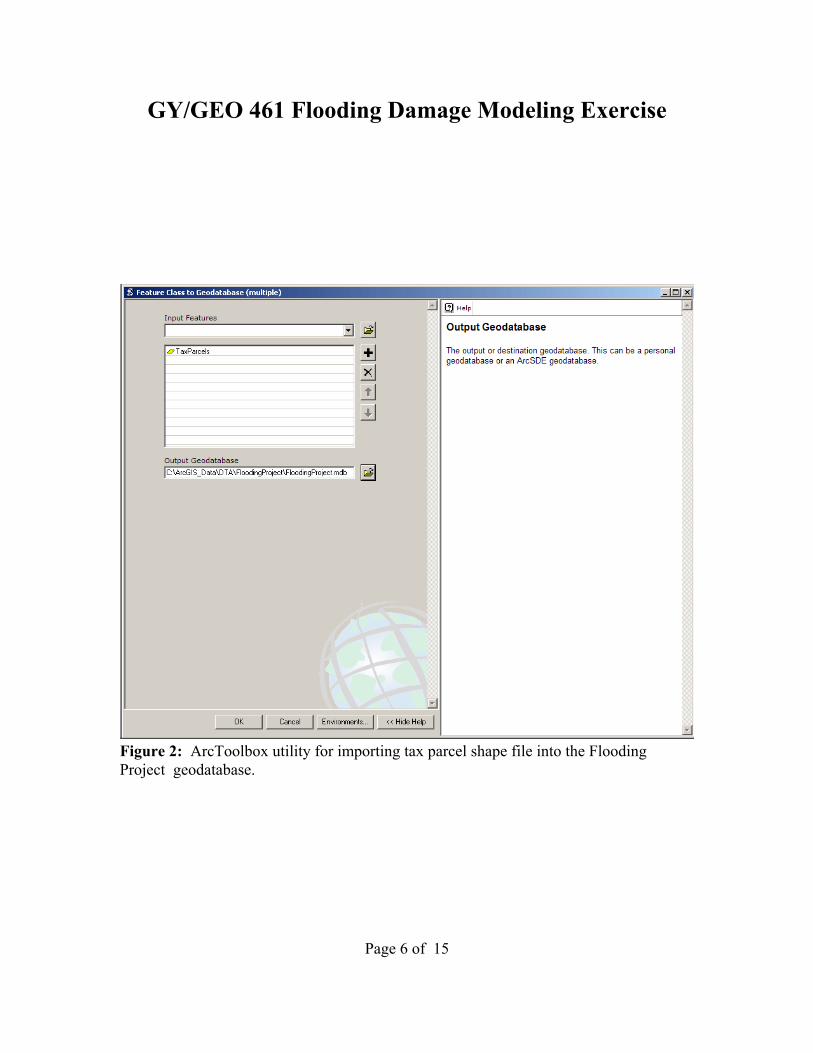
Start ArcCatalog from the desktop and navigate to your project folder. Under the “File” menuselect “New”. Create a new geodatabase file named “FloodingProject”. Your folder shouldappear as in Figure 1 under ArcCatalog. Now start the ArcToolbox application. Under “Importto Geodatabase” find and start the “Shape file to Geodatabase” utility. Select the “TaxParcels” shape file in your folder. Select the “FloodingProject” geodatabase as the output database. Makesure the settings match Figure 2 and select “OK” to import the shape files into the geodatabase.
Start the ArcMap application and indicate a new blank project file. Use the “Add data” button tonavigate to and add from the “FloodingProject” geodatabase. The layer “TaxParcels” shouldappear as a subfolder under the geodatabase name (double-click on the name).
Now add the SpringHill quadrangle for reference. Using the “Add data” button again, select the“o30088f2.tif” file. The tax parcel features should fit into the SW quarter of section 15 on thequadrangle. To enhance the topographic features add the DEM and construct a hillshade. Thedownloaded data includes an ASCII grid file - Use the Toolbox “Conversion Tools > To Raster> ASCII to Raster” to convert “sh_dem.asc” to an ESRI grid. Figure 3 contains the setup.
Your display should appear as in Figure 4. Save the ArcMap project as “FloodingProject”.
Step 3: Create the Flood Levels Polygon Feature
Using ArcCatalog create a new feature class named “FloodLevels” that is a polygon topologywith one attribute field named “Category”. This attribute should be a short integer because it willhold the strom category class (1, 2, or 3). After creating the feature, add it to the ArcMap project,and then select “Edit mode”. Add the initial polygon by setting a snap mode and following thecorners of the tax parcels feature. Then use “Cut Polygon Features” and trace the 100, 110, and120 foot topographic contours on the DRG as cutting edges to define the respective category 1,2, and 3 areas. Remember to label each new polygon with the correct category number.
Use the information icon to verify that you can access the classification and value of the taxparcels, and the storm category in the flood levels polygon topology.

GY/GEO 461 Flooding Damage Modeling Exercise
Page 3 of 15
The proper processing of later calculations requires that the original area of each flooded taxparcel be preserved so a new field named “Orig_Area” will be created and filled with the area inthe “TaxParcels” layer. Right-click on the “TaxParcels” layer name and then select “OpenAttribute Table”. Next, select the “Options” button in the lower left part of the dialog, and then“Add Field”. Create a new field named “Orig_Area” with a precision of 12 and a scale of 2. Younow need to fill in this new field with the area value in “Shape_Area” with a calculation. Fromthe editor button bar select “Start Editing” to put ArcMap in edit mode. Right-click on the“Orig_Area” field name in the attribute table, and then select “Calculate Values”. Fill in thedialog as indicated in Figure 5. Select the “OK” button- this will copy the area values in“Shape_Area” to “Orig_Area”. Verify that this is the case by browsing the attribute table. If allappears well, select “Stop Editing” and then “Save Edits” from the Editor button bar.
Step 4: Creating the “Intersect” Polygon Topology
The next step will “intersect” the two polygon topologies created so far to produce a thirdtopology that contains the data of the initial two topologies. In this manner we can determinehow much of a given tax parcel is covered by a specific flood level.
Make sure that your project file is loaded into the ArcMap application. Select the “Toolbox”icon and then expand the folder “Analysis Tools > Overlay” from the toolbox window. Selectthe “Intersect” option and continue to the next dialog. Use “TaxParcels” as the first layer andthen “FloodLevels”. Before selecting the “OK” button make sure the dialog is setup as inFigure 6. Name the resulting polygon topology as “StormCat” in your project folder. With theidentity tool verify that this new topology contains the storm category and value attributes.
Step 5: Composing the Hard Copy Map
In this step you will design a map layout to better display the relationship between flood levelsand the affected property parcels. In ArcMap right-click on the “StormCat” layer. Select“properties” and then the “Symbology” tab. Setup the dialog as in Figure 7.
Now setup the page layout with “File” and then “Page Setup” from the main menu in ArcMap.Set the options to match Figure 8, and then select the “OK” button. Next select “View” and then“Layout View” from the main menu. When the display adjusts to this new setting you should seea map data frame containing the map elements on top of a rectangle that represents the mediamargins. Right-click on the map data frame and select “properties”. Then choose the “DataFrame” tab, and set an fixed scale of 1:6000. This will set the scale of the printed map. Re-sizethe data frame window to approximately match the layout of Figure 9.
To complete the map you need to add:
1. Scale bar and relational fraction (scale text)

GY/GEO 461 Flooding Damage Modeling Exercise
Page 4 of 15
2. North arrow3. Title4. Legend
Choose the “Insert” and then “Scale bar” option from the main menu. Select the “Alternatingscale bar 1" type, and place it centered and below the map frame. Use the same menu to insertthe relational fraction (“scale text”), north arrow and title.
Next choose the “Insert” and then “Legend” option. Allow only the “Tax Parcels” and “StormFlooding Potential” layers to be added to the legend. Select an outline for the legend butotherwise let the defaults control the format of the legend frame. Your final layout should appearas in Figure 10. Print a hard copy of the map to the printer specified by your instructor.
Step 6: Calculating Property Damage
In this step you will use Excel to determine the amount of property damage caused by a category1,2, or 3 hurricane.First you need to export the “StormCat” table to Excel format. Start theAccess database application and load the “FloodingProject.mdb” file. In the “tables” tabhighlight the “StormCat” table. Select “File” and then “Export”. Change to export file type to“Excel 97-2002 (xls)” and save to your folder “\ArcGIS_Data\XXX\FloodingProject”. CloseAccess and then start Excel and load this new file. The file name will be “StormCat.xls”.
With the Excel spreadsheet sort the data based on “Category” and property “Type”. Calculate theproperty damage in the right-most column under the heading “Property_Damage”. Use theequation:
Damage = Shape_Area/Orig_Area*Prop_Value
You will have to re-cast the above equation in terms of the cell addresses. Copy the values downthe column. Subtotal the damages whenever the category or property type changes. Accumulatethe values in a table below the main spreadsheet data arranged as below:
Storm Category Residential Damage Commercial Damage1 $ $2 $ $3 $ $
Print the spreadsheet report to turn in with your map. The spreadsheet should appear similar toFigure 11.

GY/GEO 461 Flooding Damage Modeling Exercise
Page 5 of 15
Figure 1: ArcCatalog view during creation of geodatabase file.
GY/GEO 461 Flooding Damage Modeling Exercise
Page 6 of 15
Figure 2: ArcToolbox utility for importing tax parcel shape file into the FloodingProject geodatabase.

GY/GEO 461 Flooding Damage Modeling Exercise
Page 7 of 15
Figure 3: Conversion of ASCII Springhill Quadrangle DEM file to ESRI grid.

GY/GEO 461 Flooding Damage Modeling Exercise
Page 8 of 15
Figure 4: View of feature layers after adding DRG in ArcMap project file.

GY/GEO 461 Flooding Damage Modeling Exercise
Page 9 of 15
Figure 5: Calculation to copy polygon area to “Orig_Area”..

GY/GEO 461 Flooding Damage Modeling Exercise
Page 10 of 15
Figure 6: Creating “StromCat” layer using “Intersection ” of polygon topologies“Taxparcels” and “FloodLevels”.

GY/GEO 461 Flooding Damage Modeling Exercise
Page 11 of 15
Figure 7: Symbology setup for the “StormCat” polygon topology.

GY/GEO 461 Flooding Damage Modeling Exercise
Page 12 of 15
Figure 8: Page setup to prepare for layout view.

GY/GEO 461 Flooding Damage Modeling Exercise
Page 13 of 15
Figure 9: Layout view of project with scale set to 1:6,000.

GY/GEO 461 Flooding Damage Modeling Exercise
Page 14 of 15
Figure 10: Final layout view of hard copy project map.

GY/GEO 461 Flooding Damage Modeling Exercise
Page 15 of 15
Figure 11: Spreadsheet layout for report.