
GWINNETT TRENDS · Bryan Lackey Todd Cleaver Kathy Holland ... ATLANTA REGIONAL COMMISSION ......
43
GWINNETT COUNTY UNIFIED PLAN UPDATE 2015 GWINNETT TRENDS: KEY FINDINGS & SUPPORTING DATA
Transcript of GWINNETT TRENDS · Bryan Lackey Todd Cleaver Kathy Holland ... ATLANTA REGIONAL COMMISSION ......
GWINNETT COUNTYUNIFIED PLAN UPDATE 2015
G W I N N E T T T R E N D S :
K E Y F I N D I N G S&
SUPPORTING DATA

this page intentionally left blankthis report has been formatted to be printed double-sided in an effort to conserve paper
Acknowledgments
GWINNETT COUNTY BOARD OF COMMISSIONERS
Charlotte Nash – Chair
Jace Brooks – District 1
Lynnette Howard – District 2
Tommy Hunter – District 3
John Heard – District 4
GWINNETT COUNTY STAFF
Bryan Lackey
Todd Cleaver
Kathy Holland
Vince Edwards
Jeff West
Adena Fullard
Robert Long
James Pugsley
Shannon Candler
Matthew Elder
Christine Callaway
Robert Long
PARTNERSHIP GWINNETT
ATLANTA REGIONAL COMMISSION
POND & COMPANY
Michelle Alexander
Eric Lusher
Graham Malone
Niwana Ray

this page intentionally left blankthis report has been formatted to be printed double-sided in an effort to conserve paper
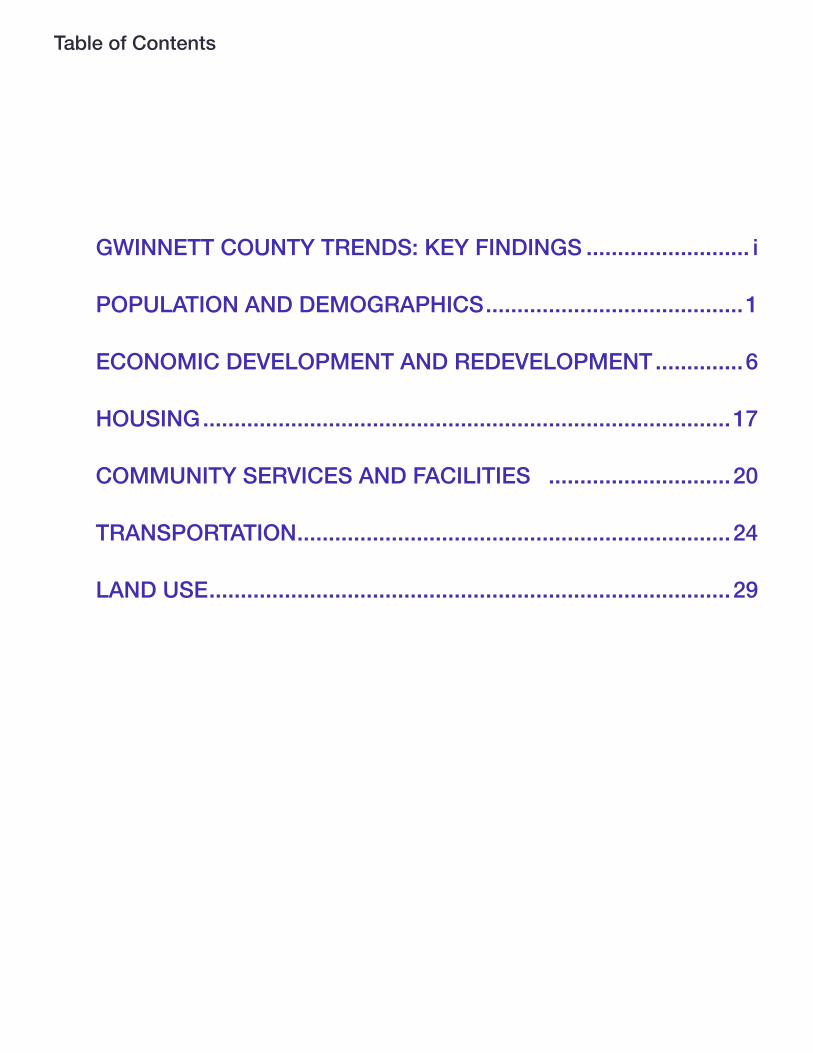
Table of Contents
GWINNETT COUNTY TRENDS: KEY FINDINGS �������������������������� i
POPULATION AND DEMOGRAPHICS �����������������������������������������1
ECONOMIC DEVELOPMENT AND REDEVELOPMENT ��������������6
HOUSING ������������������������������������������������������������������������������������17
COMMUNITY SERVICES AND FACILITIES �����������������������������20
TRANSPORTATION ���������������������������������������������������������������������24
LAND USE �����������������������������������������������������������������������������������29
List of Figures
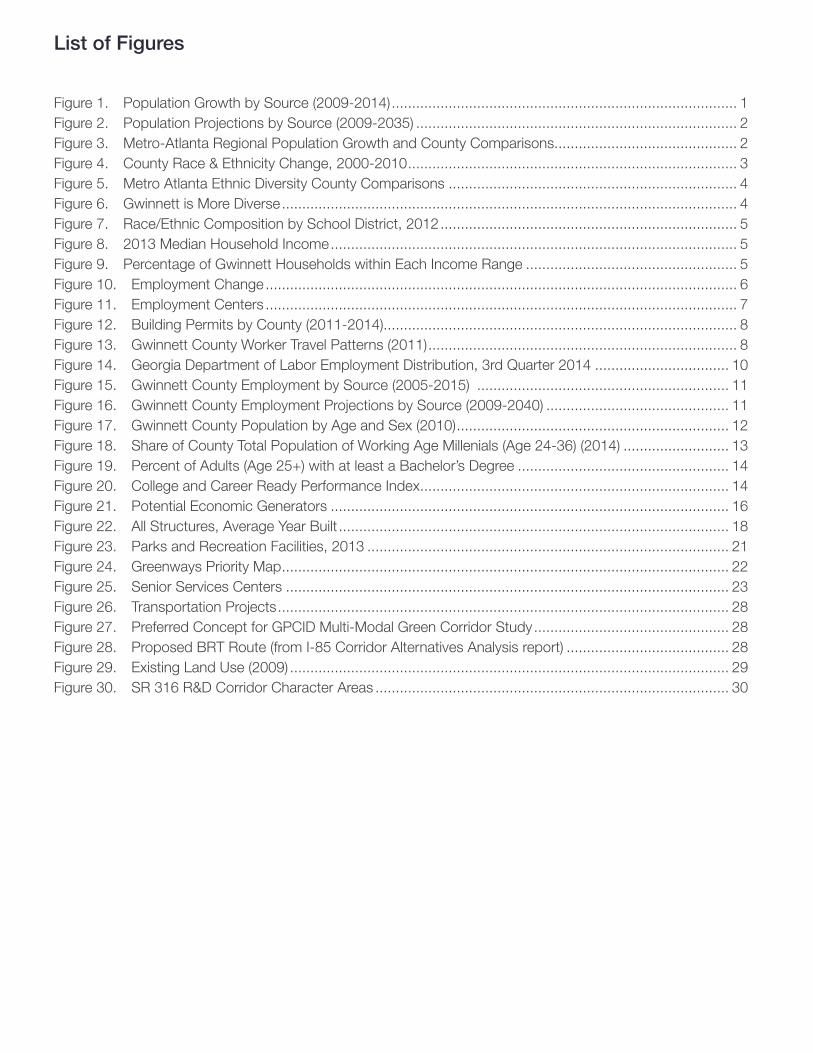
Figure 1. Population Growth by Source (2009-2014) ..................................................................................... 1Figure 2. Population Projections by Source (2009-2035) ............................................................................... 2Figure 3. Metro-Atlanta Regional Population Growth and County Comparisons............................................. 2Figure 4. County Race & Ethnicity Change, 2000-2010 ................................................................................. 3Figure 5. Metro Atlanta Ethnic Diversity County Comparisons ....................................................................... 4Figure 6. Gwinnett is More Diverse ................................................................................................................ 4Figure 7. Race/Ethnic Composition by School District, 2012 ......................................................................... 5Figure 8. 2013 Median Household Income .................................................................................................... 5Figure 9. Percentage of Gwinnett Households within Each Income Range .................................................... 5Figure 10. Employment Change .................................................................................................................... 6Figure 11. Employment Centers .................................................................................................................... 7Figure 12. Building Permits by County (2011-2014)....................................................................................... 8Figure 13. Gwinnett County Worker Travel Patterns (2011) ............................................................................ 8Figure 14. Georgia Department of Labor Employment Distribution, 3rd Quarter 2014 ................................. 10Figure 15. Gwinnett County Employment by Source (2005-2015) .............................................................. 11Figure 16. Gwinnett County Employment Projections by Source (2009-2040) ............................................. 11Figure 17. Gwinnett County Population by Age and Sex (2010) ................................................................... 12Figure 18. Share of County Total Population of Working Age Millenials (Age 24-36) (2014) .......................... 13Figure 19. Percent of Adults (Age 25+) with at least a Bachelor’s Degree .................................................... 14Figure 20. College and Career Ready Performance Index ............................................................................ 14Figure 21. Potential Economic Generators .................................................................................................. 16Figure 22. All Structures, Average Year Built ................................................................................................ 18Figure 23. Parks and Recreation Facilities, 2013 ......................................................................................... 21Figure 24. Greenways Priority Map .............................................................................................................. 22Figure 25. Senior Services Centers ............................................................................................................. 23Figure 26. Transportation Projects ............................................................................................................... 28Figure 27. Preferred Concept for GPCID Multi-Modal Green Corridor Study ................................................ 28Figure 28. Proposed BRT Route (from I-85 Corridor Alternatives Analysis report) ........................................ 28Figure 29. Existing Land Use (2009) ............................................................................................................ 29Figure 30. SR 316 R&D Corridor Character Areas ....................................................................................... 30
Gwinnett More Diverse
89.30%
77.80%
67.60%
54.80%
44.90% 42.30% 40.70% 39.00% 37.10% 34.90% 32.70%
5.10%
9.90%
13.50%
19.20%
23.50%23.00%
23.00%23.00%
22.90%22.70%
22.30%
3.10%
5.50%
7.90%
9.90%
11.30%12.70%
12.90%13.10%
13.40%13.70%
13.90%
6.80%11.10%
16.10%20.20% 22.00% 23.50% 24.90% 26.60% 28.70% 31.00%
0%
10%
20%
30%
40%
50%
60%
70%
80%
90%
100%
1990 1995 2000 2005 2010 2015 2020 2025 2030 2035 2040
Percent White-NonHispanic Percent Black-NonHispanic Percent-Other Percent Hispanic
Source: DRAFT Plan 2040 (TU) Forecast
KEY FINDINGS & SUPPORTING DATA REPORT i
GWINNETT COUNTY TRENDS: KEY FINDINGS
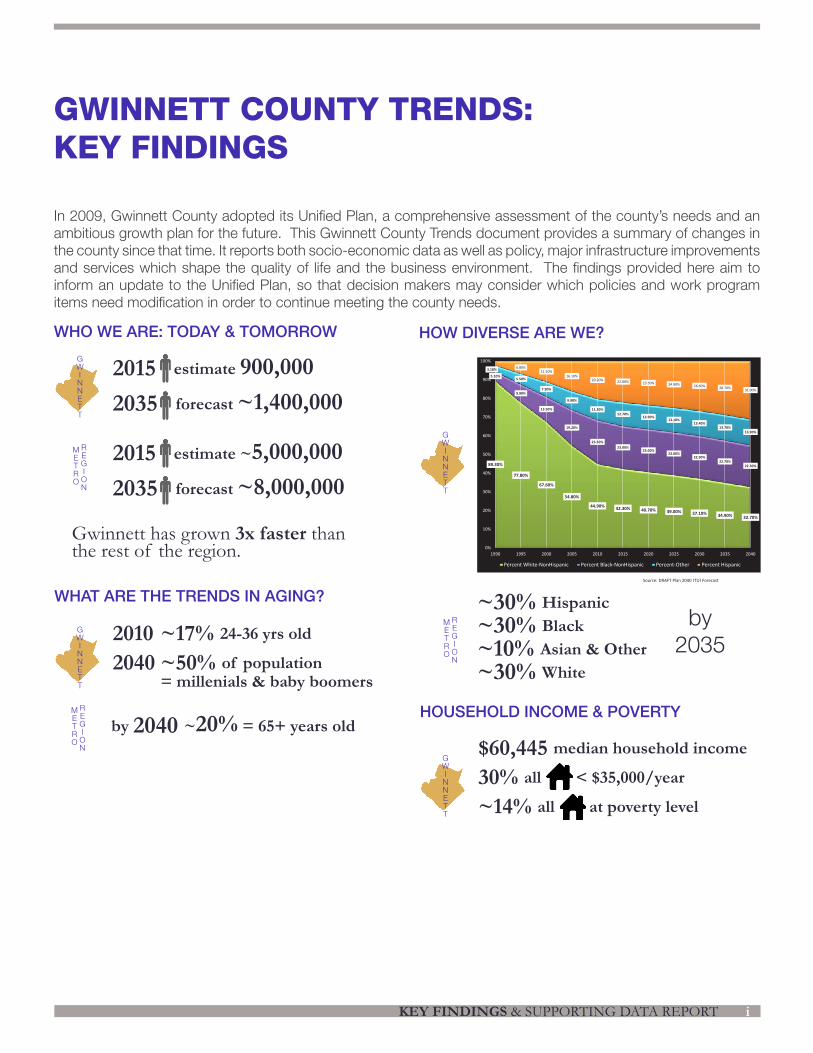
In 2009, Gwinnett County adopted its Unified Plan, a comprehensive assessment of the county’s needs and an ambitious growth plan for the future. This Gwinnett County Trends document provides a summary of changes in the county since that time. It reports both socio-economic data as well as policy, major infrastructure improvements and services which shape the quality of life and the business environment. The findings provided here aim to inform an update to the Unified Plan, so that decision makers may consider which policies and work program items need modification in order to continue meeting the county needs.
WHO WE ARE: TODAY & TOMORROW
2015 estimate 900,0002035 forecast ~1,400,000
2010 ~17% 24-36 yrs old
2040 ~50% of population = millenials & baby boomers
$60,445 median household income
30% all < $35,000/year
~14% all at poverty level
2015 estimate ~5,000,0002035 forecast ~8,000,000
by 2040 ~20% = 65+ years old
~30% Hispanic ~30% Black~10% Asian & Other~30% White
Gwinnett has grown 3x faster than the rest of the region.
HOW DIVERSE ARE WE?
WHAT ARE THE TRENDS IN AGING?
HOUSEHOLD INCOME & POVERTY
GWINNETT
GWINNETT
GWINNETT
METRO
REGION
METRO
REGION
METRO
REGION
GWINNETT
by 2035
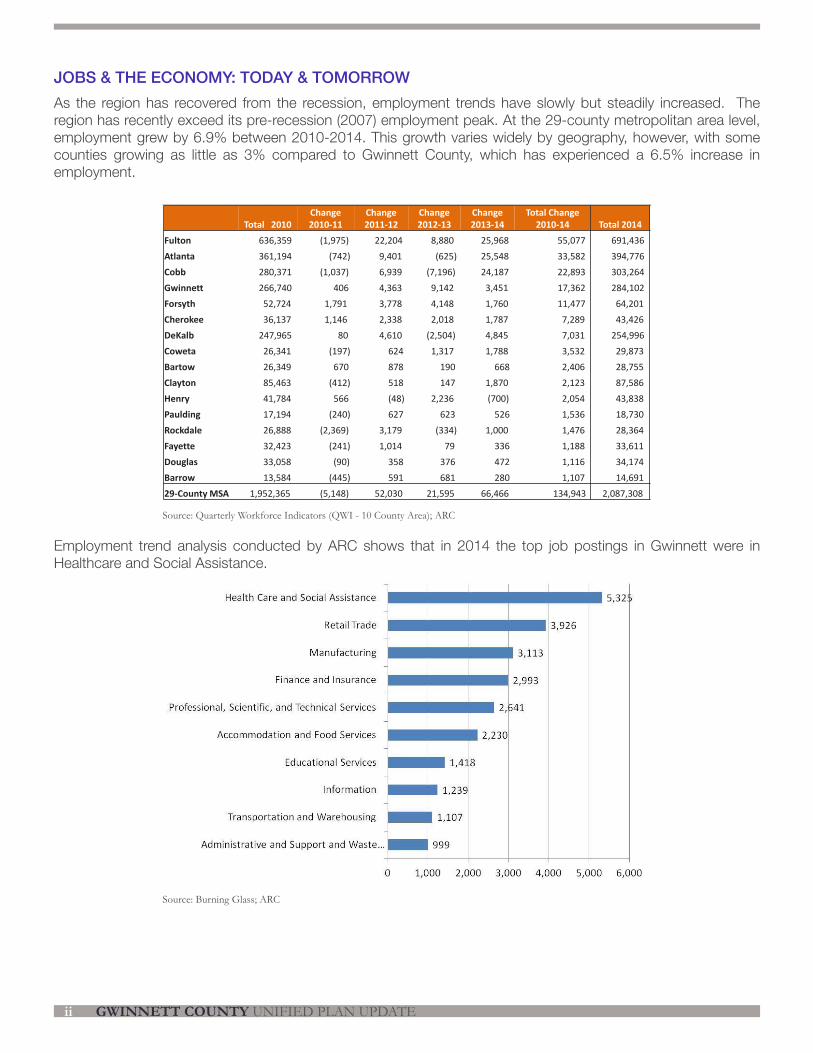
As the region has recovered from the recession, employment trends have slowly but steadily increased. The region has recently exceed its pre-recession (2007) employment peak. At the 29-county metropolitan area level, employment grew by 6.9% between 2010-2014. This growth varies widely by geography, however, with some counties growing as little as 3% compared to Gwinnett County, which has experienced a 6.5% increase in employment.
Employment trend analysis conducted by ARC shows that in 2014 the top job postings in Gwinnett were in Healthcare and Social Assistance.
GWINNETT COUNTY UNIFIED PLAN UPDATEii
JOBS & THE ECONOMY: TODAY & TOMORROW
Employment Change
Source: Quarterly Workforce Indicators (QWI - 10-county Area)
Total 2010Change 2010-11
Change 2011-12
Change 2012-13
Change 2013-14
Total Change 2010-14 Total 2014
Fulton 636,359 (1,975) 22,204 8,880 25,968 55,077 691,436 Atlanta 361,194 (742) 9,401 (625) 25,548 33,582 394,776 Cobb 280,371 (1,037) 6,939 (7,196) 24,187 22,893 303,264 Gwinnett 266,740 406 4,363 9,142 3,451 17,362 284,102 Forsyth 52,724 1,791 3,778 4,148 1,760 11,477 64,201 Cherokee 36,137 1,146 2,338 2,018 1,787 7,289 43,426 DeKalb 247,965 80 4,610 (2,504) 4,845 7,031 254,996 Coweta 26,341 (197) 624 1,317 1,788 3,532 29,873 Bartow 26,349 670 878 190 668 2,406 28,755 Clayton 85,463 (412) 518 147 1,870 2,123 87,586 Henry 41,784 566 (48) 2,236 (700) 2,054 43,838 Paulding 17,194 (240) 627 623 526 1,536 18,730 Rockdale 26,888 (2,369) 3,179 (334) 1,000 1,476 28,364 Fayette 32,423 (241) 1,014 79 336 1,188 33,611 Douglas 33,058 (90) 358 376 472 1,116 34,174 Barrow 13,584 (445) 591 681 280 1,107 14,691 29-County MSA 1,952,365 (5,148) 52,030 21,595 66,466 134,943 2,087,308
Source: Quarterly Workforce Indicators (QWI - 10 County Area); ARC
Source: Burning Glass; ARC
KEY FINDINGS & SUPPORTING DATA REPORT iii
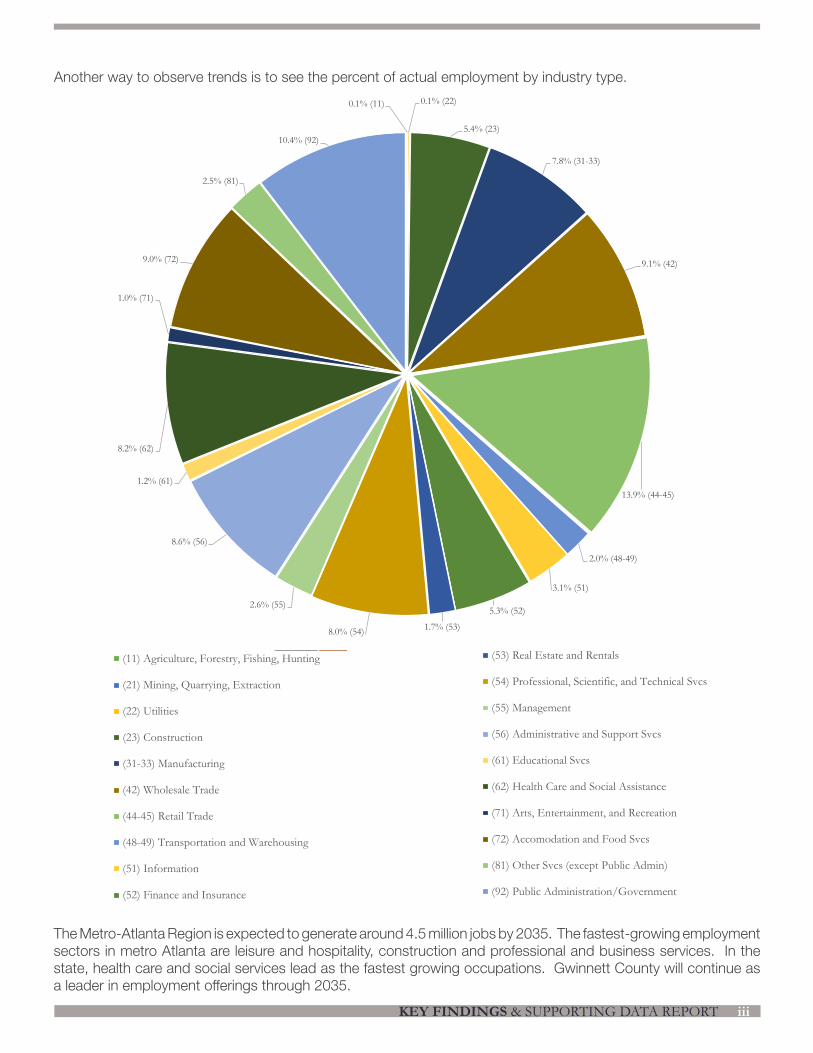
Another way to observe trends is to see the percent of actual employment by industry type.
6.4%9.1%0.1% (11) 0.1% (22)
5.4% (23)
7.8% (31-33)
9.1% (42)
13.9% (44-45)
2.0% (48-49)
3.1% (51)
5.3% (52)
1.7% (53)8.0% (54)
2.6% (55)
8.6% (56)
1.2% (61)
8.2% (62)
1.0% (71)
9.0% (72)
2.5% (81)
10.4% (92)
(11) Agriculture, Forestry, Fishing, Hunting
(21) Mining, Quarrying, Extraction
(22) Utilities
(23) Construction
(31-33) Manufacturing
(42) Wholesale Trade
(44-45) Retail Trade
(48-49) Transportation and Warehousing
(51) Information
(52) Finance and Insurance
(53) Real Estate and Rentals
(54) Professional, Scientific, and Technical Svcs
(55) Management
(56) Administrative and Support Svcs
(61) Educational Svcs
(62) Health Care and Social Assistance
(71) Arts, Entertainment, and Recreation
(72) Accomodation and Food Svcs
(81) Other Svcs (except Public Admin)
(92) Public Administration/Government6.4%9.1%0.1% (11) 0.1% (22)
5.4% (23)
7.8% (31-33)
9.1% (42)
13.9% (44-45)
2.0% (48-49)
3.1% (51)
5.3% (52)
1.7% (53)8.0% (54)
2.6% (55)
8.6% (56)
1.2% (61)
8.2% (62)
1.0% (71)
9.0% (72)
2.5% (81)
10.4% (92)
(11) Agriculture, Forestry, Fishing, Hunting
(21) Mining, Quarrying, Extraction
(22) Utilities
(23) Construction
(31-33) Manufacturing
(42) Wholesale Trade
(44-45) Retail Trade
(48-49) Transportation and Warehousing
(51) Information
(52) Finance and Insurance
(53) Real Estate and Rentals
(54) Professional, Scientific, and Technical Svcs
(55) Management
(56) Administrative and Support Svcs
(61) Educational Svcs
(62) Health Care and Social Assistance
(71) Arts, Entertainment, and Recreation
(72) Accomodation and Food Svcs
(81) Other Svcs (except Public Admin)
(92) Public Administration/Government
The Metro-Atlanta Region is expected to generate around 4.5 million jobs by 2035. The fastest-growing employment sectors in metro Atlanta are leisure and hospitality, construction and professional and business services. In the state, health care and social services lead as the fastest growing occupations. Gwinnett County will continue as a leader in employment offerings through 2035.
6.4%9.1%0.1% (11) 0.1% (22)
5.4% (23)
7.8% (31-33)
9.1% (42)
13.9% (44-45)
2.0% (48-49)
3.1% (51)
5.3% (52)
1.7% (53)8.0% (54)
2.6% (55)
8.6% (56)
1.2% (61)
8.2% (62)
1.0% (71)
9.0% (72)
2.5% (81)
10.4% (92)
(11) Agriculture, Forestry, Fishing, Hunting
(21) Mining, Quarrying, Extraction
(22) Utilities
(23) Construction
(31-33) Manufacturing
(42) Wholesale Trade
(44-45) Retail Trade
(48-49) Transportation and Warehousing
(51) Information
(52) Finance and Insurance
(53) Real Estate and Rentals
(54) Professional, Scientific, and Technical Svcs
(55) Management
(56) Administrative and Support Svcs
(61) Educational Svcs
(62) Health Care and Social Assistance
(71) Arts, Entertainment, and Recreation
(72) Accomodation and Food Svcs
(81) Other Svcs (except Public Admin)
(92) Public Administration/Government

GWINNETT COUNTY UNIFIED PLAN UPDATEiv
The County has nationally competitive high schools and an increasing presence in higher education offerings. Compared to adjacent counties, the level of education in its general population remains competitive but will need attention to increase work force training.
US: 30.9%
10Source: American Community Survey 2007-2011
Percent of Adults (Age 25+) with at Least a Bachelor’s Degree
HOUSING
In spring 2015, Gwinnett County submitted the 5 year update of its Consolidated Housing Plan to HUD for review and approval. The update to the Housing Plan resulted in the following statistics:
291,813 housing units
70% Owner Occupied
30% Renter Occupied
80% dwellings are single-family
METRO ATLANTA % WITH AT LEAST BACHELOR’S DEGREE:
Between 2000 and 2012:Home values increased nearly 30%Rental costs increased nearly 40%
KEY FINDINGS & SUPPORTING DATA REPORT v
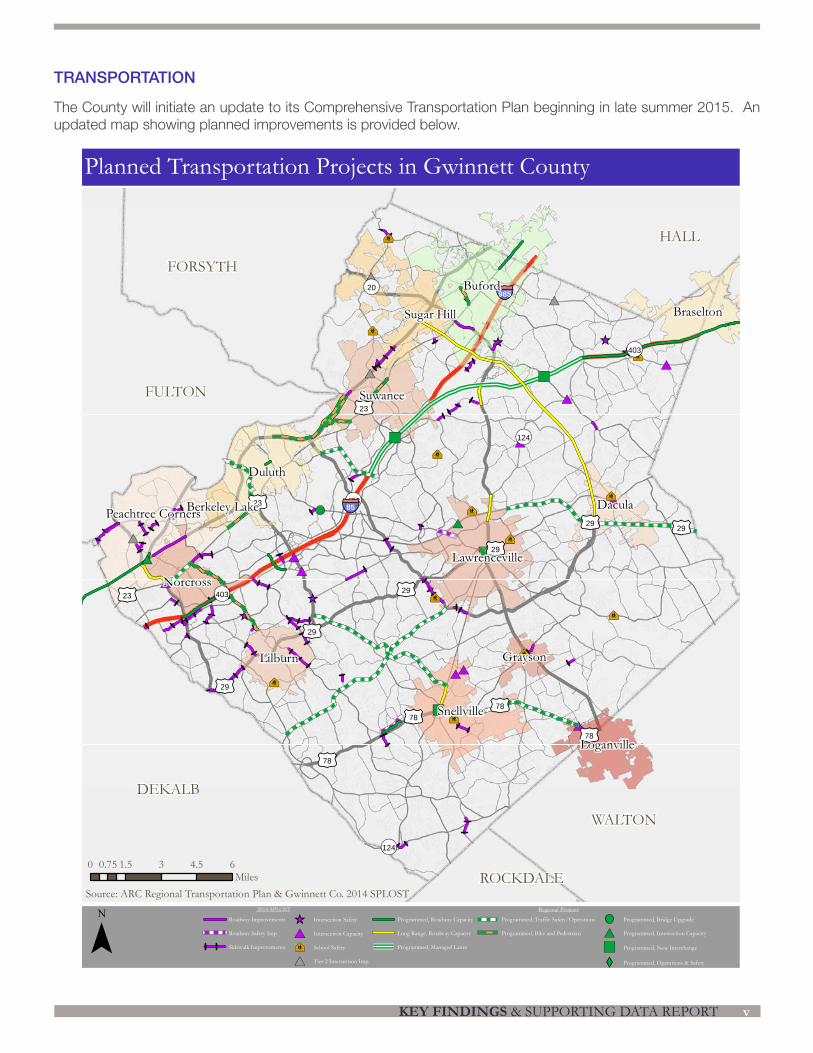
TRANSPORTATION
The County will initiate an update to its Comprehensive Transportation Plan beginning in late summer 2015. An updated map showing planned improvements is provided below.
#*
#*
#*
#*
#*
#*#*
#*
#*
#*
#*
#*
#*
#*
_̂
_̂
_̂
_̂_̂
ÅÆÇ
ÅÆÇÅÆÇ
ÅÆÇ
ÅÆÇ
ÅÆÇ
ÅÆÇ
ÅÆÇ
ÅÆÇ
ÅÆÇ
ÅÆÇ
ÅÆÇ
")
#*
")
")
XW
#*
§̈¦985
£¤29
£¤23
£¤78
£¤29
£¤29
£¤78
£¤23
£¤29
£¤29
£¤23
£¤29
£¤78
£¤78
¬«403
¬«124
¬«20
¬«403
¬«124
¬«403
DEKALB
HALL
WALTON
FULTON
FORSYTH
ROCKDALE
§̈¦85
Buford
Duluth
Suwanee
Snellville
Lawrenceville
Peachtree Corners
Lilburn
Braselton
Loganville
Sugar Hill
Dacula
Norcross
Grayson
Berkeley Lake
Planned Transportation Projects in Gwinnett County
¯ Roadway Improvements
Roadway Safety Imp.
Sidewalk Improvements
_̂ Intersection Safety
#* Intersection Capacity
ÅÆÇ School Safety
#* Tier 2 Intersection Imp.
Programmed, Roadway Capacity
Long Range, Roadway Capacity
Programmed, Managed Lanes
Programmed, Traffic Safety/Operations
Programmed, Bike and Pedestrian
Programmed, Bridge Upgrade
#* Programmed, Intersection Capacity
") Programmed, New Interchange
XW Programmed, Operations & Safety
0 1.5 3 4.5 60.75Miles
Source: ARC Regional Transportation Plan & Gwinnett Co. 2014 SPLOST2014 SPLOST Regional Projects
GWINNETT COUNTY UNIFIED PLAN UPDATEvi
LAND USE
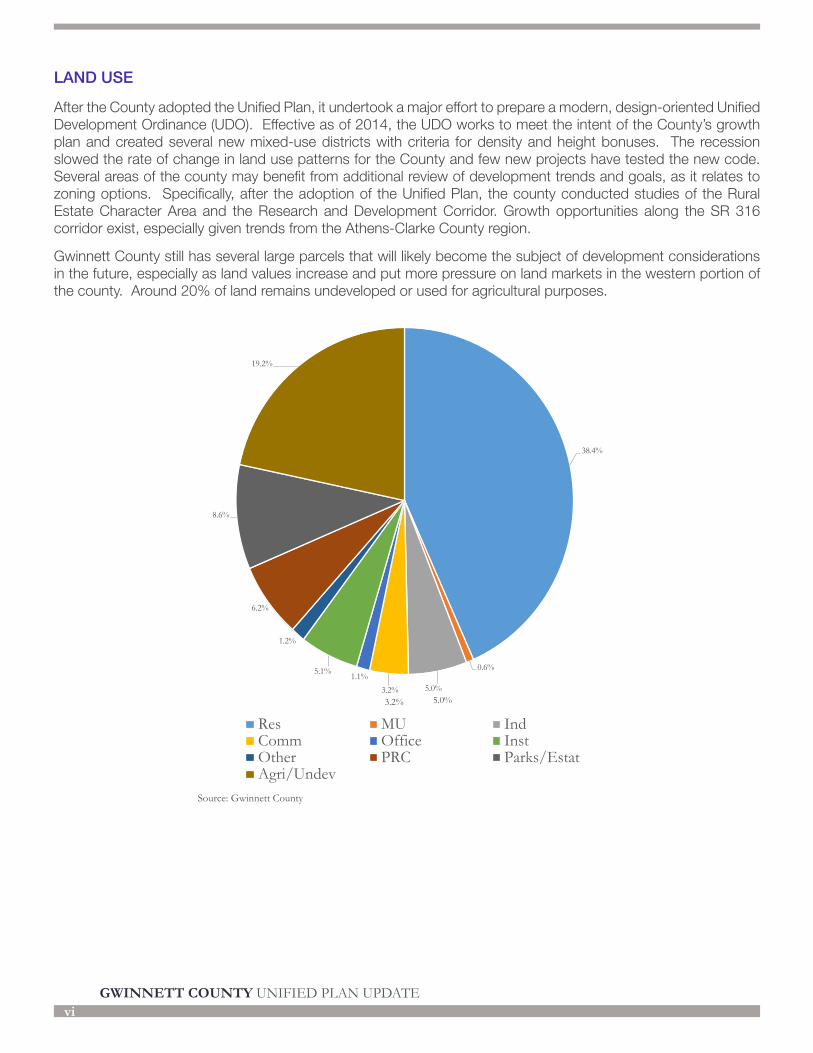
After the County adopted the Unified Plan, it undertook a major effort to prepare a modern, design-oriented Unified Development Ordinance (UDO). Effective as of 2014, the UDO works to meet the intent of the County’s growth plan and created several new mixed-use districts with criteria for density and height bonuses. The recession slowed the rate of change in land use patterns for the County and few new projects have tested the new code. Several areas of the county may benefit from additional review of development trends and goals, as it relates to zoning options. Specifically, after the adoption of the Unified Plan, the county conducted studies of the Rural Estate Character Area and the Research and Development Corridor. Growth opportunities along the SR 316 corridor exist, especially given trends from the Athens-Clarke County region.
Gwinnett County still has several large parcels that will likely become the subject of development considerations in the future, especially as land values increase and put more pressure on land markets in the western portion of the county. Around 20% of land remains undeveloped or used for agricultural purposes.
Source: Gwinnett County
38.4%
0.6%
5.0%3.2%1.1%5.1%
1.2%
6.2%
8.6%
19.2%
Gwinnett County Existing Land Use (2009)
Res MU IndComm Office InstOther PRC Parks/EstateAgri/Undev
38.4%
0.6%
5.0%3.2%1.1%5.1%
1.2%
6.2%
8.6%
19.2%
Gwinnett County Existing Land Use (2009)
Res MU IndComm Office InstOther PRC Parks/EstateAgri/Undev
KEY FINDINGS & SUPPORTING DATA REPORT 1
POPULATION AND DEMOGRAPHICS
Figure 1. Population Growth by Source (2009-2014)
500,000
550,000
600,000
650,000
700,000
750,000
800,000
850,000
900,000
950,000
1,000,000
2008 2009 2010 2011 2012 2013 2014 2015
Coun
ty P
opul
atio
n
Year
Gwinnett County Population Growth by Source (2009-2014)
2030 Unified Plan - International Gateway 2030 Unified Plan - Middle of the Pack
US Census Bureau Population Estimates ARC Population Estimates
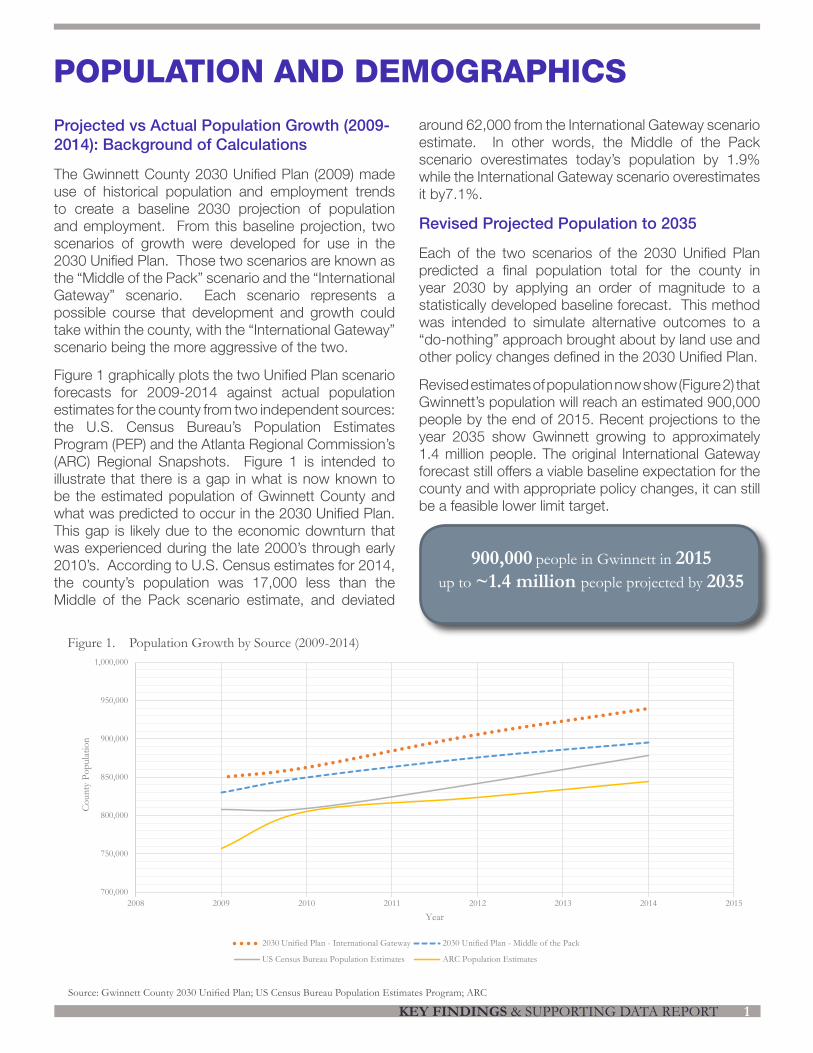
Projected vs Actual Population Growth (2009-2014): Background of Calculations
The Gwinnett County 2030 Unified Plan (2009) made use of historical population and employment trends to create a baseline 2030 projection of population and employment. From this baseline projection, two scenarios of growth were developed for use in the 2030 Unified Plan. Those two scenarios are known as the “Middle of the Pack” scenario and the “International Gateway” scenario. Each scenario represents a possible course that development and growth could take within the county, with the “International Gateway” scenario being the more aggressive of the two.
Figure 1 graphically plots the two Unified Plan scenario forecasts for 2009-2014 against actual population estimates for the county from two independent sources: the U.S. Census Bureau’s Population Estimates Program (PEP) and the Atlanta Regional Commission’s (ARC) Regional Snapshots. Figure 1 is intended to illustrate that there is a gap in what is now known to be the estimated population of Gwinnett County and what was predicted to occur in the 2030 Unified Plan. This gap is likely due to the economic downturn that was experienced during the late 2000’s through early 2010’s. According to U.S. Census estimates for 2014, the county’s population was 17,000 less than the Middle of the Pack scenario estimate, and deviated
around 62,000 from the International Gateway scenario estimate. In other words, the Middle of the Pack scenario overestimates today’s population by 1.9% while the International Gateway scenario overestimates it by7.1%.
Revised Projected Population to 2035
Each of the two scenarios of the 2030 Unified Plan predicted a final population total for the county in year 2030 by applying an order of magnitude to a statistically developed baseline forecast. This method was intended to simulate alternative outcomes to a “do-nothing” approach brought about by land use and other policy changes defined in the 2030 Unified Plan.
Revised estimates of population now show (Figure 2) that Gwinnett’s population will reach an estimated 900,000 people by the end of 2015. Recent projections to the year 2035 show Gwinnett growing to approximately 1.4 million people. The original International Gateway forecast still offers a viable baseline expectation for the county and with appropriate policy changes, it can still be a feasible lower limit target.
Source: Gwinnett County 2030 Unified Plan; US Census Bureau Population Estimates Program; ARC
900,000 people in Gwinnett in 2015 up to ~1.4 million people projected by 2035
GWINNETT COUNTY UNIFIED PLAN UPDATE2
Figure 2. Population Projections by Source (2009-2035)
Figure 3. Metro-Atlanta Regional Population Growth and County Comparisons
Gwinnett has grown 3 times faster than the metro Atlanta
region
Source: ARC Population Estimates
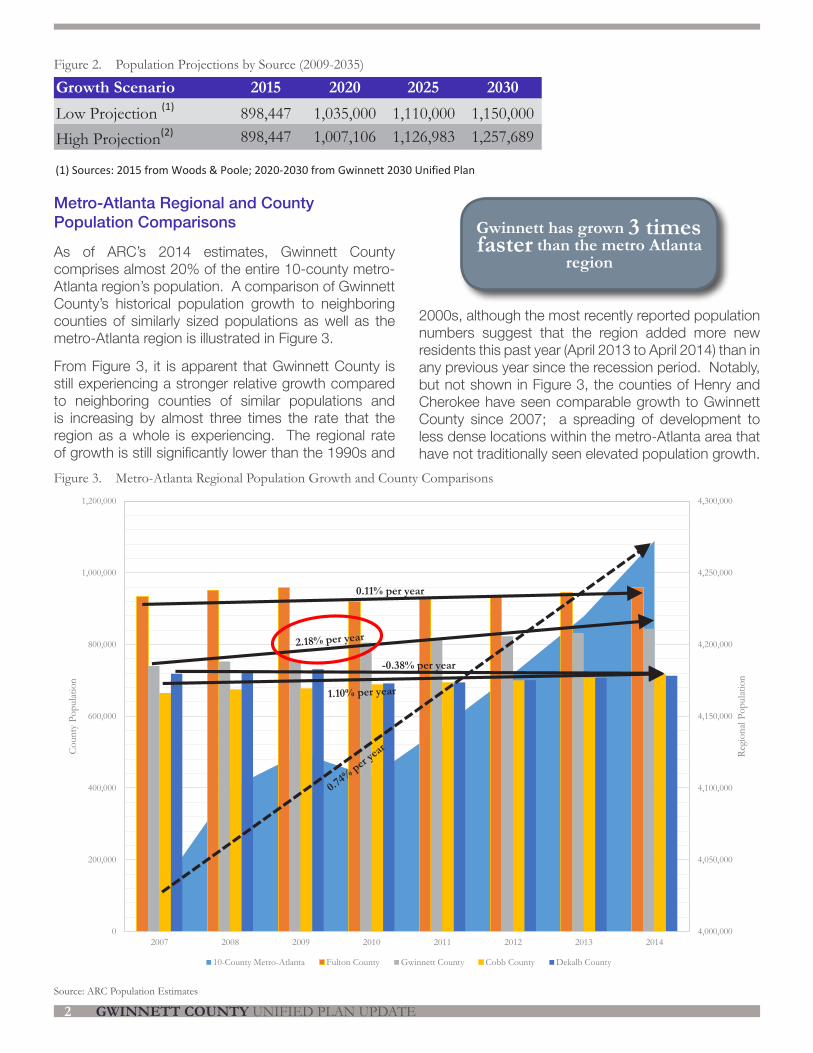
Metro-Atlanta Regional and County Population Comparisons
As of ARC’s 2014 estimates, Gwinnett County comprises almost 20% of the entire 10-county metro-Atlanta region’s population. A comparison of Gwinnett County’s historical population growth to neighboring counties of similarly sized populations as well as the metro-Atlanta region is illustrated in Figure 3.
From Figure 3, it is apparent that Gwinnett County is still experiencing a stronger relative growth compared to neighboring counties of similar populations and is increasing by almost three times the rate that the region as a whole is experiencing. The regional rate of growth is still significantly lower than the 1990s and
4,000,000
4,050,000
4,100,000
4,150,000
4,200,000
4,250,000
4,300,000
0
200,000
400,000
600,000
800,000
1,000,000
1,200,000
2007 2008 2009 2010 2011 2012 2013 2014
Regi
onal
Popu
latio
n
Coun
ty P
opul
atio
n
Metro-Atlanta Regional Population Growth and County Comparisons (2007-2014)
10-County Metro-Atlanta Fulton County Gwinnett County Cobb County Dekalb County
0.11% per year
-0.38% per year
Growth Scenario 2015 2020 2025 2030Low Projection (1) 898,447 1,035,000 1,110,000 1,150,000High Projection(2) 898,447 1,007,106 1,126,983 1,257,689
(1) Sources: 2015 from Woods & Poole; 2020-2030 from Gwinnett 2030 Unified Plan
(2) Source: Woods & Poole 2014 Projection
2000s, although the most recently reported population numbers suggest that the region added more new residents this past year (April 2013 to April 2014) than in any previous year since the recession period. Notably, but not shown in Figure 3, the counties of Henry and Cherokee have seen comparable growth to Gwinnett County since 2007; a spreading of development to less dense locations within the metro-Atlanta area that have not traditionally seen elevated population growth.
KEY FINDINGS & SUPPORTING DATA REPORT 3
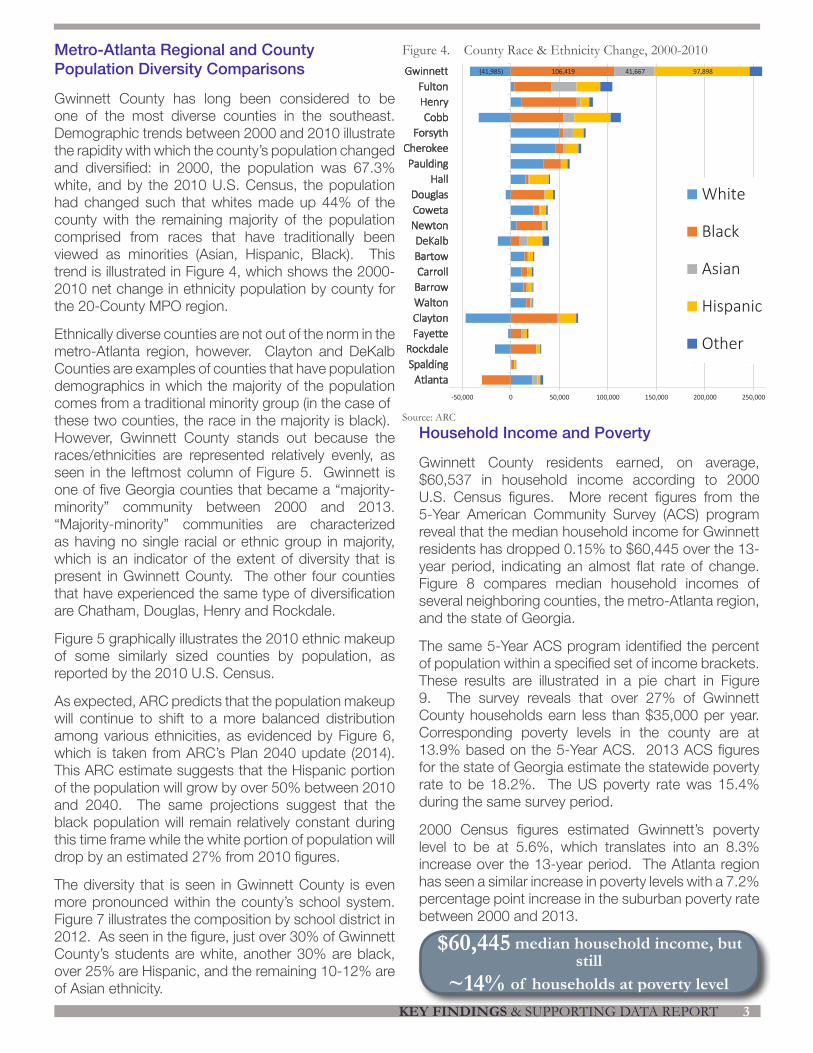
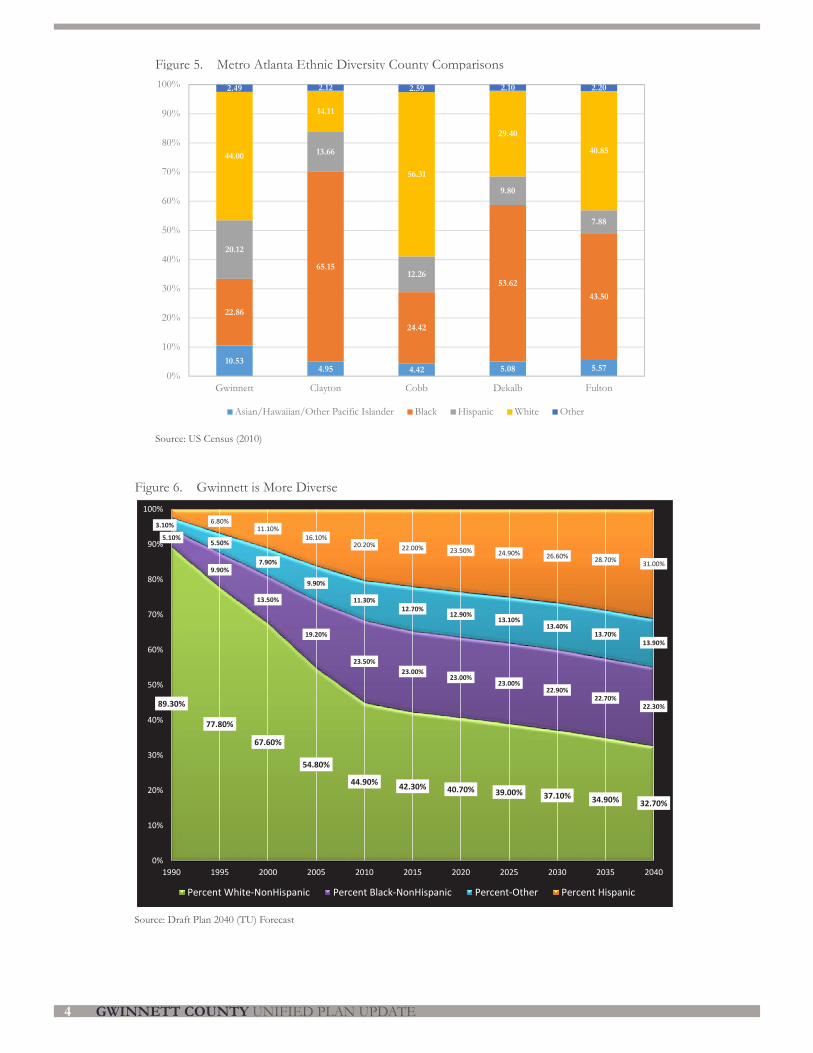
Metro-Atlanta Regional and County Population Diversity Comparisons
Gwinnett County has long been considered to be one of the most diverse counties in the southeast. Demographic trends between 2000 and 2010 illustrate the rapidity with which the county’s population changed and diversified: in 2000, the population was 67.3% white, and by the 2010 U.S. Census, the population had changed such that whites made up 44% of the county with the remaining majority of the population comprised from races that have traditionally been viewed as minorities (Asian, Hispanic, Black). This trend is illustrated in Figure 4, which shows the 2000-2010 net change in ethnicity population by county for the 20-County MPO region.
Ethnically diverse counties are not out of the norm in the metro-Atlanta region, however. Clayton and DeKalb Counties are examples of counties that have population demographics in which the majority of the population comes from a traditional minority group (in the case of these two counties, the race in the majority is black). However, Gwinnett County stands out because the races/ethnicities are represented relatively evenly, as seen in the leftmost column of Figure 5. Gwinnett is one of five Georgia counties that became a “majority-minority” community between 2000 and 2013. “Majority-minority” communities are characterized as having no single racial or ethnic group in majority, which is an indicator of the extent of diversity that is present in Gwinnett County. The other four counties that have experienced the same type of diversification are Chatham, Douglas, Henry and Rockdale.
Figure 5 graphically illustrates the 2010 ethnic makeup of some similarly sized counties by population, as reported by the 2010 U.S. Census.
As expected, ARC predicts that the population makeup will continue to shift to a more balanced distribution among various ethnicities, as evidenced by Figure 6, which is taken from ARC’s Plan 2040 update (2014). This ARC estimate suggests that the Hispanic portion of the population will grow by over 50% between 2010 and 2040. The same projections suggest that the black population will remain relatively constant during this time frame while the white portion of population will drop by an estimated 27% from 2010 figures.
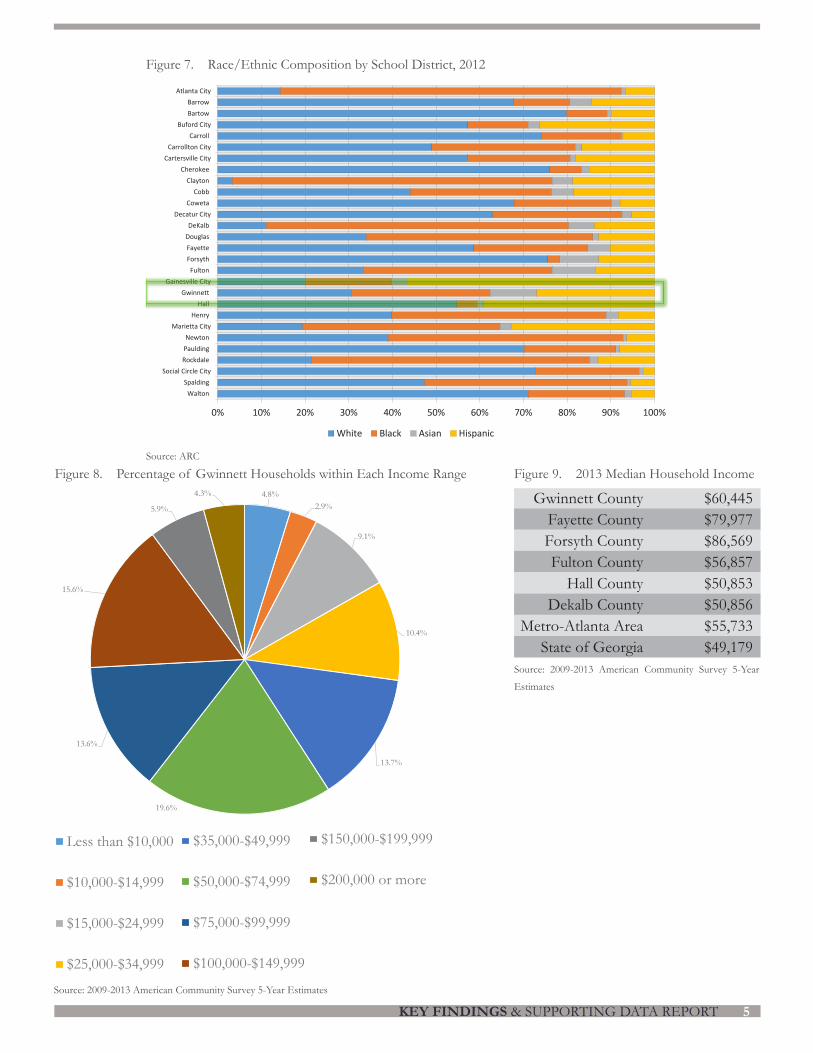
The diversity that is seen in Gwinnett County is even more pronounced within the county’s school system. Figure 7 illustrates the composition by school district in 2012. As seen in the figure, just over 30% of Gwinnett County’s students are white, another 30% are black, over 25% are Hispanic, and the remaining 10-12% are of Asian ethnicity.
Figure 4. County Race & Ethnicity Change, 2000-2010(41,985) 106,419 41,667 97,898
-100,000 -50,000 0 50,000 100,000 150,000 200,000 250,000 300,000
AtlantaSpalding
RockdaleFayetteClaytonWaltonBarrowCarroll
BartowDeKalb
NewtonCowetaDouglas
HallPaulding
CherokeeForsyth
CobbHenryFulton
Gwinnett
White
Black
Asian
Hispanic
Other
County Race & Ethnicity Change, 2000 – 2010
Source: ARC
(41,985) 106,419 41,667 97,898
-100,000 -50,000 0 50,000 100,000 150,000 200,000 250,000 300,000
AtlantaSpalding
RockdaleFayetteClaytonWaltonBarrowCarroll
BartowDeKalb
NewtonCowetaDouglas
HallPaulding
CherokeeForsyth
CobbHenryFulton
Gwinnett
White
Black
Asian
Hispanic
Other
County Race & Ethnicity Change, 2000 – 2010(41,985) 106,419 41,667 97,898
-100,000 -50,000 0 50,000 100,000 150,000 200,000 250,000 300,000
AtlantaSpalding
RockdaleFayetteClaytonWaltonBarrowCarroll
BartowDeKalb
NewtonCowetaDouglas
HallPaulding
CherokeeForsyth
CobbHenryFulton
Gwinnett
White
Black
Asian
Hispanic
Other
County Race & Ethnicity Change, 2000 – 2010
Household Income and Poverty
Gwinnett County residents earned, on average, $60,537 in household income according to 2000 U.S. Census figures. More recent figures from the 5-Year American Community Survey (ACS) program reveal that the median household income for Gwinnett residents has dropped 0.15% to $60,445 over the 13-year period, indicating an almost flat rate of change. Figure 8 compares median household incomes of several neighboring counties, the metro-Atlanta region, and the state of Georgia.
The same 5-Year ACS program identified the percent of population within a specified set of income brackets. These results are illustrated in a pie chart in Figure 9. The survey reveals that over 27% of Gwinnett County households earn less than $35,000 per year. Corresponding poverty levels in the county are at 13.9% based on the 5-Year ACS. 2013 ACS figures for the state of Georgia estimate the statewide poverty rate to be 18.2%. The US poverty rate was 15.4% during the same survey period.
2000 Census figures estimated Gwinnett’s poverty level to be at 5.6%, which translates into an 8.3% increase over the 13-year period. The Atlanta region has seen a similar increase in poverty levels with a 7.2% percentage point increase in the suburban poverty rate between 2000 and 2013.
$60,445 median household income, but still
~14% of households at poverty level
GWINNETT COUNTY UNIFIED PLAN UPDATE4
Figure 6. Gwinnett is More DiverseGwinnett More Diverse
89.30%
77.80%
67.60%
54.80%
44.90% 42.30% 40.70% 39.00% 37.10% 34.90% 32.70%
5.10%
9.90%
13.50%
19.20%
23.50%23.00%
23.00%23.00%
22.90%22.70%
22.30%
3.10%
5.50%
7.90%
9.90%
11.30%12.70%
12.90%13.10%
13.40%13.70%
13.90%
6.80%11.10%
16.10%20.20% 22.00% 23.50% 24.90% 26.60% 28.70% 31.00%
0%
10%
20%
30%
40%
50%
60%
70%
80%
90%
100%
1990 1995 2000 2005 2010 2015 2020 2025 2030 2035 2040
Percent White-NonHispanic Percent Black-NonHispanic Percent-Other Percent Hispanic
Source: DRAFT Plan 2040 (TU) ForecastSource: Draft Plan 2040 (TU) Forecast
Figure 5. Metro Atlanta Ethnic Diversity County Comparisons
Source: US Census (2010)
10.534.95 4.42 5.08 5.57
22.86
65.15
24.42
53.6243.50
20.12
13.66
12.26
9.80
7.88
44.00
14.11
56.31
29.40
40.85
2.49 2.12 2.59 2.10 2.20
0%
10%
20%
30%
40%
50%
60%
70%
80%
90%
100%
Gwinnett Clayton Cobb Dekalb Fulton
Asian/Hawaiian/Other Pacific Islander Black Hispanic White Other
KEY FINDINGS & SUPPORTING DATA REPORT 5
0% 10% 20% 30% 40% 50% 60% 70% 80% 90% 100%
WaltonSpalding
Social Circle CityRockdalePauldingNewton
Marietta CityHenry
HallGwinnett
Gainesville CityFulton
ForsythFayetteDouglasDeKalb
Decatur CityCoweta
CobbClayton
CherokeeCartersville City
Carrollton CityCarroll
Buford CityBartowBarrow
Atlanta City
Race/Ethnic Composition by School District, 2012
White Black Asian Hispanic
Figure 7. Race/Ethnic Composition by School District, 2012
Source: ARC
4.8%2.9%
9.1%
10.4%
13.7%
19.6%
13.6%
15.6%
5.9%
4.3%
% of Gwinnett Households Within Each Income Range
Less than $10,000
$10,000-$14,999
$15,000-$24,999
$25,000-$34,999
$35,000-$49,999
$50,000-$74,999
$75,000-$99,999
$100,000-$149,999
$150,000-$199,999
$200,000 or more
Figure 8. Percentage of Gwinnett Households within Each Income Range2013 Median
Household IncomeGwinnett County $60,445
Fayette County $79,977Forsyth County $86,569Fulton County $56,857
Hall County $50,853Dekalb County $50,856
Metro-Atlanta Area $55,733State of Georgia $49,179
Figure 9. 2013 Median Household Income
Source: 2009-2013 American Community Survey 5-Year
Estimates
4.8%2.9%
9.1%
10.4%
13.7%
19.6%
13.6%
15.6%
5.9%
4.3%
% of Gwinnett Households Within Each Income Range
Less than $10,000
$10,000-$14,999
$15,000-$24,999
$25,000-$34,999
$35,000-$49,999
$50,000-$74,999
$75,000-$99,999
$100,000-$149,999
$150,000-$199,999
$200,000 or more
Source: 2009-2013 American Community Survey 5-Year Estimates
4.8%2.9%
9.1%
10.4%
13.7%
19.6%
13.6%
15.6%
5.9%
4.3%
% of Gwinnett Households Within Each Income Range
Less than $10,000
$10,000-$14,999
$15,000-$24,999
$25,000-$34,999
$35,000-$49,999
$50,000-$74,999
$75,000-$99,999
$100,000-$149,999
$150,000-$199,999
$200,000 or more
4.8%2.9%
9.1%
10.4%
13.7%
19.6%
13.6%
15.6%
5.9%
4.3%
% of Gwinnett Households Within Each Income Range
Less than $10,000
$10,000-$14,999
$15,000-$24,999
$25,000-$34,999
$35,000-$49,999
$50,000-$74,999
$75,000-$99,999
$100,000-$149,999
$150,000-$199,999
$200,000 or more
GWINNETT COUNTY UNIFIED PLAN UPDATE6
ECONOMIC DEVELOPMENT AND REDEVELOPMENT
Figure 10. Employment Change
Economic Conditions in Gwinnett County
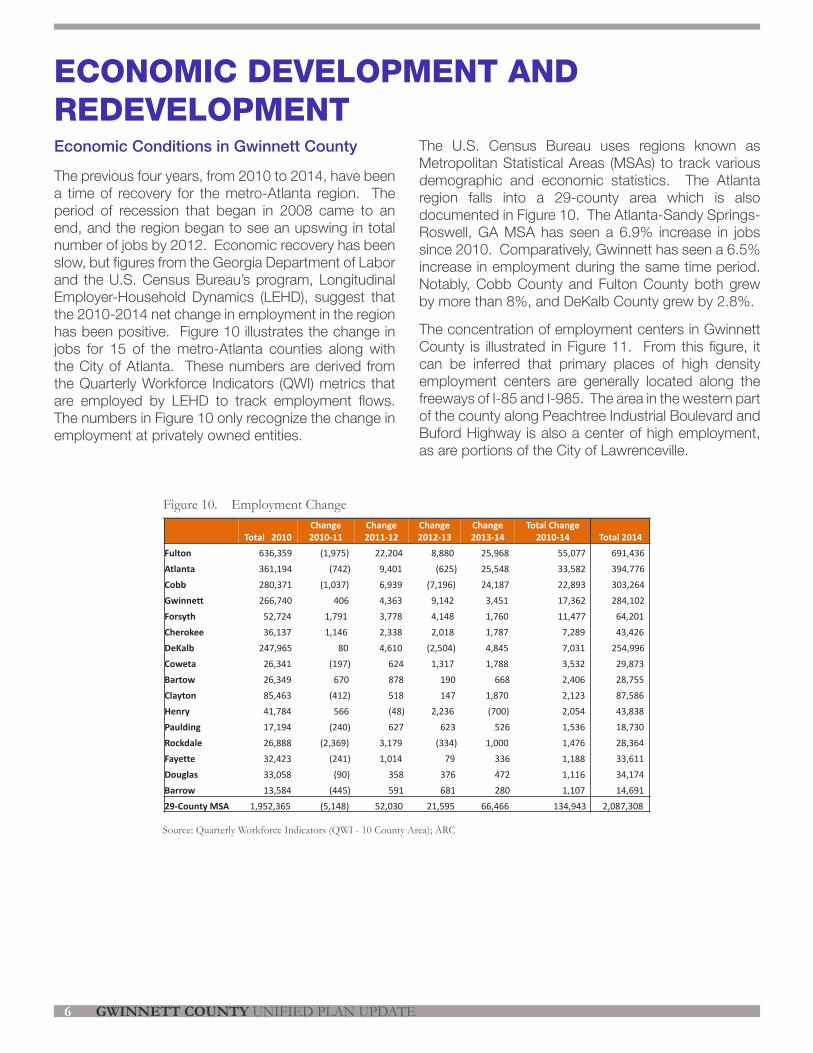
The previous four years, from 2010 to 2014, have been a time of recovery for the metro-Atlanta region. The period of recession that began in 2008 came to an end, and the region began to see an upswing in total number of jobs by 2012. Economic recovery has been slow, but figures from the Georgia Department of Labor and the U.S. Census Bureau’s program, Longitudinal Employer-Household Dynamics (LEHD), suggest that the 2010-2014 net change in employment in the region has been positive. Figure 10 illustrates the change in jobs for 15 of the metro-Atlanta counties along with the City of Atlanta. These numbers are derived from the Quarterly Workforce Indicators (QWI) metrics that are employed by LEHD to track employment flows. The numbers in Figure 10 only recognize the change in employment at privately owned entities.
Employment Change
Source: Quarterly Workforce Indicators (QWI - 10-county Area)
Total 2010Change 2010-11
Change 2011-12
Change 2012-13
Change 2013-14
Total Change 2010-14 Total 2014
Fulton 636,359 (1,975) 22,204 8,880 25,968 55,077 691,436 Atlanta 361,194 (742) 9,401 (625) 25,548 33,582 394,776 Cobb 280,371 (1,037) 6,939 (7,196) 24,187 22,893 303,264 Gwinnett 266,740 406 4,363 9,142 3,451 17,362 284,102 Forsyth 52,724 1,791 3,778 4,148 1,760 11,477 64,201 Cherokee 36,137 1,146 2,338 2,018 1,787 7,289 43,426 DeKalb 247,965 80 4,610 (2,504) 4,845 7,031 254,996 Coweta 26,341 (197) 624 1,317 1,788 3,532 29,873 Bartow 26,349 670 878 190 668 2,406 28,755 Clayton 85,463 (412) 518 147 1,870 2,123 87,586 Henry 41,784 566 (48) 2,236 (700) 2,054 43,838 Paulding 17,194 (240) 627 623 526 1,536 18,730 Rockdale 26,888 (2,369) 3,179 (334) 1,000 1,476 28,364 Fayette 32,423 (241) 1,014 79 336 1,188 33,611 Douglas 33,058 (90) 358 376 472 1,116 34,174 Barrow 13,584 (445) 591 681 280 1,107 14,691 29-County MSA 1,952,365 (5,148) 52,030 21,595 66,466 134,943 2,087,308
Source: Quarterly Workforce Indicators (QWI - 10 County Area); ARC
The U.S. Census Bureau uses regions known as Metropolitan Statistical Areas (MSAs) to track various demographic and economic statistics. The Atlanta region falls into a 29-county area which is also documented in Figure 10. The Atlanta-Sandy Springs-Roswell, GA MSA has seen a 6.9% increase in jobs since 2010. Comparatively, Gwinnett has seen a 6.5% increase in employment during the same time period. Notably, Cobb County and Fulton County both grew by more than 8%, and DeKalb County grew by 2.8%.
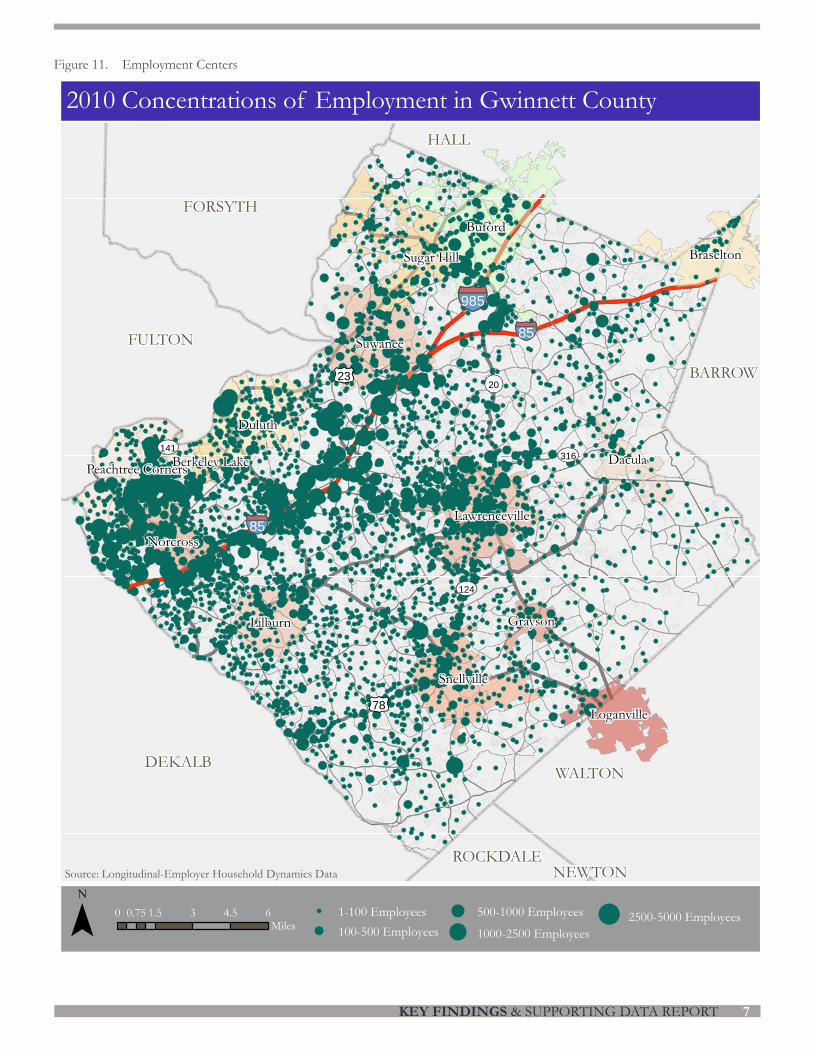
The concentration of employment centers in Gwinnett County is illustrated in Figure 11. From this figure, it can be inferred that primary places of high density employment centers are generally located along the freeways of I-85 and I-985. The area in the western part of the county along Peachtree Industrial Boulevard and Buford Highway is also a center of high employment, as are portions of the City of Lawrenceville.
KEY FINDINGS & SUPPORTING DATA REPORT 7
Figure 11. Employment Centers
DEKALB
HALL
WALTON
FULTON
FORSYTH
BARROW
ROCKDALENEWTON
Buford
Duluth
Suwanee
Snellville
Lawrenceville
Peachtree Corners
Lilburn
Braselton
Loganville
Sugar Hill
Dacula
Norcross
Grayson
Berkeley Lake
§̈¦85§̈¦985
§̈¦85
£¤23
£¤78
UV124
UV316
¬«20
UV141
2010 Concentrations of Employment in Gwinnett County
¯ 1-100 Employees100-500 Employees
500-1000 Employees
1000-2500 Employees2500-5000 Employees0 1.5 3 4.5 60.75
Miles
Source: Longitudinal-Employer Household Dynamics Data
GWINNETT COUNTY UNIFIED PLAN UPDATE8
0 2000 4000 6000 8000 10000 12000 14000
1174
1758
873
737
1308
2273
2245
2469
2123
2715
2775
2676
3347
5543
3386
3194
3103
3341
4505
Building Permits by County (2011-2014)
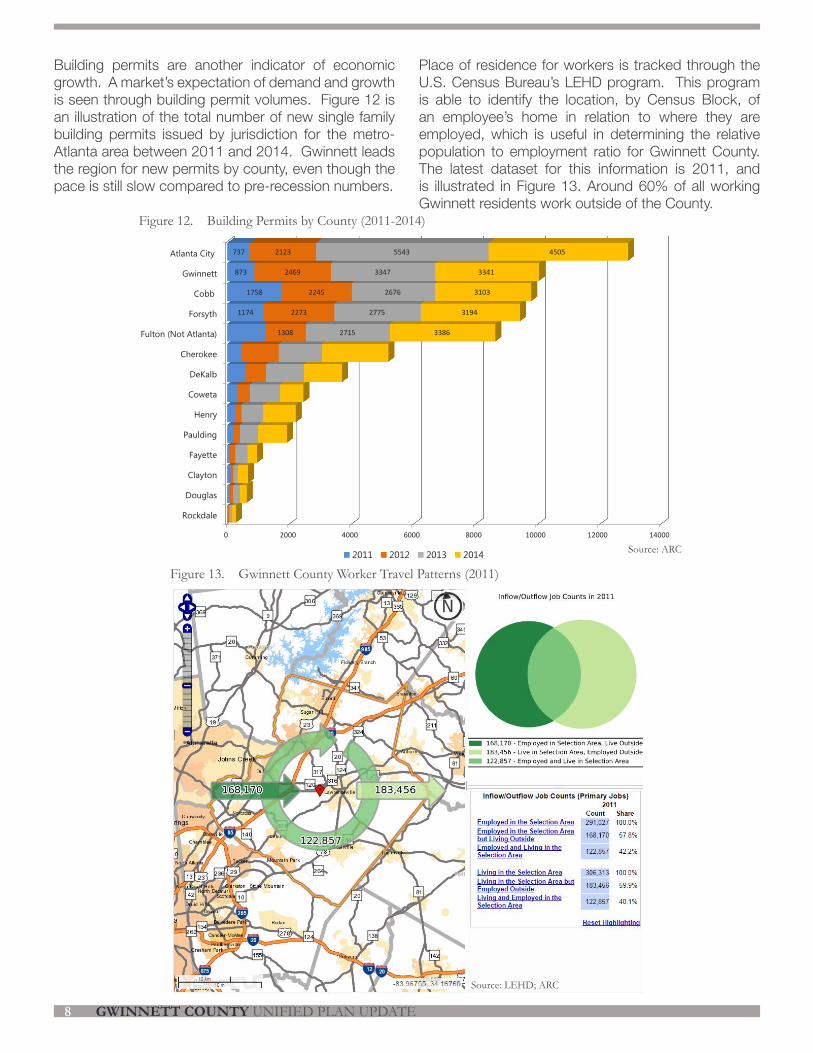
Building permits are another indicator of economic growth. A market’s expectation of demand and growth is seen through building permit volumes. Figure 12 is an illustration of the total number of new single family building permits issued by jurisdiction for the metro-Atlanta area between 2011 and 2014. Gwinnett leads the region for new permits by county, even though the pace is still slow compared to pre-recession numbers.
Figure 12. Building Permits by County (2011-2014)
Figure 13. Gwinnett County Worker Travel Patterns (2011)
Place of residence for workers is tracked through the U.S. Census Bureau’s LEHD program. This program is able to identify the location, by Census Block, of an employee’s home in relation to where they are employed, which is useful in determining the relative population to employment ratio for Gwinnett County. The latest dataset for this information is 2011, and is illustrated in Figure 13. Around 60% of all working Gwinnett residents work outside of the County.
Gwinnett County Worker Travel Patterns (2011)Source: ARC
Source: LEHD; ARC
KEY FINDINGS & SUPPORTING DATA REPORT 9
Gwinnett County had an active workforce in 2011 of 306,313 people, based on the LEHD findings. Of those 306,313 people, 122,857 worked and lived in Gwinnett County while the remaining 183,456 lived in Gwinnett County but were employed elsewhere. Additionally, 168,170 people commuted into Gwinnett County for work and resided elsewhere. Therefore, the total estimated number of jobs within Gwinnett County, as reported by LEHD, was 291,027. This indicates that in 2011, the number of available jobs in Gwinnett County was very closely related to the total number of employed individuals residing in the county. The workforce loss was equivalent to approximately 5% of the total workforce due to the commuting patterns of people who worked outside of the county.
Employment by Industry
Labor profiles are broken down into a nationally-used schema known as the North American Industry Classification System (NAICS) that allows for consistent comparisons across various regions and municipalities. This classification system identifies a total of 20 industry categories based on the characteristics such as degree of specialization, product and service type, and professional level of workforce. Several methods serve to estimate actual countywide employment figures. Two independent sources were used to provide employment estimates for both the baseline year of 2005 and the second, comparative year of 2010. This comparative year is used to determine the magnitude of accuracy of the initial employment forecasts. The two sources that were used as part of this update are the Longitudinal Employer-Household Dynamics (LEHD) program that is part of the Center for Economic Studies at the U.S. Census Bureau and the Georgia Labor Market Explorer system that is maintained by the Georgia Department of Labor (DOL).
As previously mentioned, population and employment forecasts in Gwinnett County’s Unified Plan (2009) established a baseline year of 2005 with which to begin the forecast. The 2009 plan also examined the distribution of jobs between industries, however the industry definitions that were used in the plan do not directly correspond to the NAICS categories that are currently in use. In some sections of the forecasting methodology, the 2009 plan presents employment figures by Standard Industrial Classification (SIC) categories, while at other times figures are presented using a modification of the NAICS structure. For the purposes of this study, the NAICS structure will be used whenever possible.
A review of both the LEHD and the Georgia DOL
revealed that both sources were within 1% of the total number of jobs in Gwinnett in 2005. There are some significant differences in employment totals for services within the Education profession and the Public Admin/Government field. For instance, LEHD reported a total of 24,454 education jobs and 7,773 public admin/government jobs in Gwinnett in 2005 while the DOL reported only 2,821 education jobs and 31,308 public admin/government jobs in the same year. This is most likely due to the method that each source used when categorizing job types by industry. More clearly, a public school teacher or professor at a state-funded college or university could either be counted as a state employee or an educator, and either categorization would technically be correct. Overall, however, after a review of the 2005 and 2010 employment distribution by sector, it was determined that the GDOL more accurately represented both the baseline industry make-up and the 2010 forecasted industry make-up from the 2009 plan.
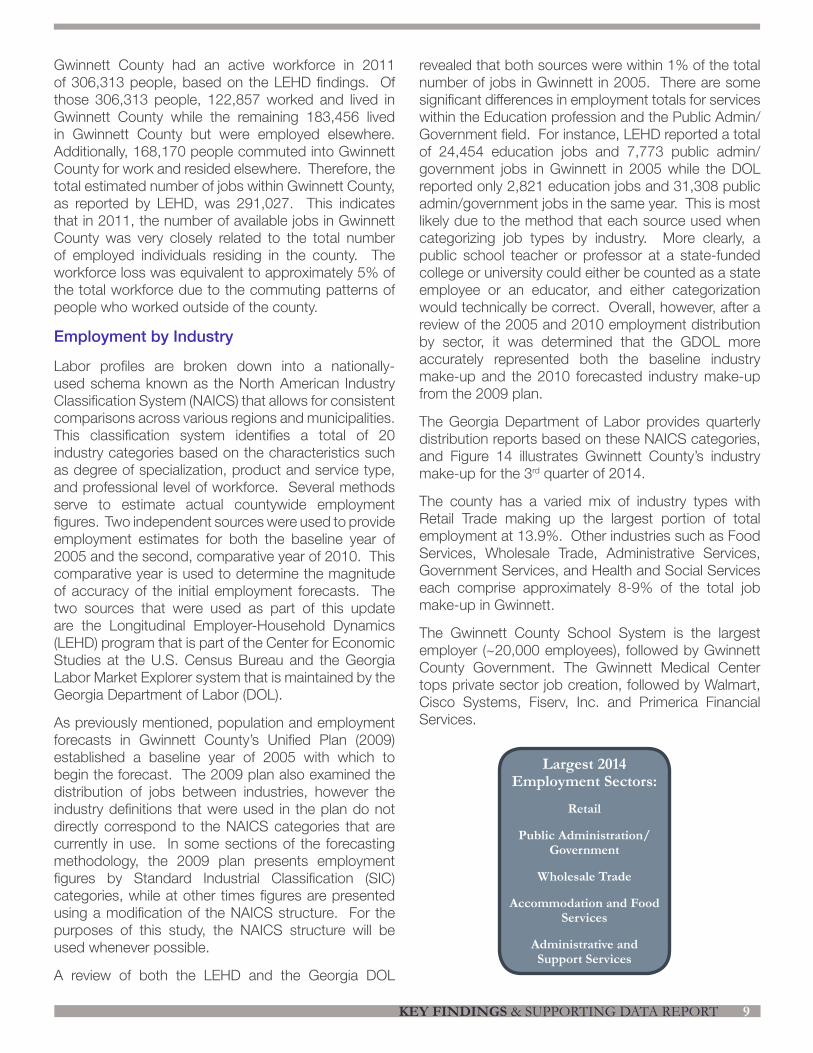
The Georgia Department of Labor provides quarterly distribution reports based on these NAICS categories, and Figure 14 illustrates Gwinnett County’s industry make-up for the 3rd quarter of 2014.
The county has a varied mix of industry types with Retail Trade making up the largest portion of total employment at 13.9%. Other industries such as Food Services, Wholesale Trade, Administrative Services, Government Services, and Health and Social Services each comprise approximately 8-9% of the total job make-up in Gwinnett.
The Gwinnett County School System is the largest employer (~20,000 employees), followed by Gwinnett County Government. The Gwinnett Medical Center tops private sector job creation, followed by Walmart, Cisco Systems, Fiserv, Inc. and Primerica Financial Services.
Largest 2014 Employment Sectors:
Retail
Public Administration/Government
Wholesale Trade
Accommodation and Food Services
Administrative and Support Services
GWINNETT COUNTY UNIFIED PLAN UPDATE10
6.4%9.1%0.1% (11) 0.1% (22)
5.4% (23)
7.8% (31-33)
9.1% (42)
13.9% (44-45)
2.0% (48-49)
3.1% (51)
5.3% (52)
1.7% (53)8.0% (54)
2.6% (55)
8.6% (56)
1.2% (61)
8.2% (62)
1.0% (71)
9.0% (72)
2.5% (81)
10.4% (92)
(11) Agriculture, Forestry, Fishing, Hunting
(21) Mining, Quarrying, Extraction
(22) Utilities
(23) Construction
(31-33) Manufacturing
(42) Wholesale Trade
(44-45) Retail Trade
(48-49) Transportation and Warehousing
(51) Information
(52) Finance and Insurance
(53) Real Estate and Rentals
(54) Professional, Scientific, and Technical Svcs
(55) Management
(56) Administrative and Support Svcs
(61) Educational Svcs
(62) Health Care and Social Assistance
(71) Arts, Entertainment, and Recreation
(72) Accomodation and Food Svcs
(81) Other Svcs (except Public Admin)
(92) Public Administration/Government
Figure 14. Georgia Department of Labor Employment Distribution, 3rd Quarter 2014
Source: Georgia Department of Labor
6.4%9.1%0.1% (11) 0.1% (22)
5.4% (23)
7.8% (31-33)
9.1% (42)
13.9% (44-45)
2.0% (48-49)
3.1% (51)
5.3% (52)
1.7% (53)8.0% (54)
2.6% (55)
8.6% (56)
1.2% (61)
8.2% (62)
1.0% (71)
9.0% (72)
2.5% (81)
10.4% (92)
(11) Agriculture, Forestry, Fishing, Hunting
(21) Mining, Quarrying, Extraction
(22) Utilities
(23) Construction
(31-33) Manufacturing
(42) Wholesale Trade
(44-45) Retail Trade
(48-49) Transportation and Warehousing
(51) Information
(52) Finance and Insurance
(53) Real Estate and Rentals
(54) Professional, Scientific, and Technical Svcs
(55) Management
(56) Administrative and Support Svcs
(61) Educational Svcs
(62) Health Care and Social Assistance
(71) Arts, Entertainment, and Recreation
(72) Accomodation and Food Svcs
(81) Other Svcs (except Public Admin)
(92) Public Administration/Government
KEY FINDINGS & SUPPORTING DATA REPORT 11
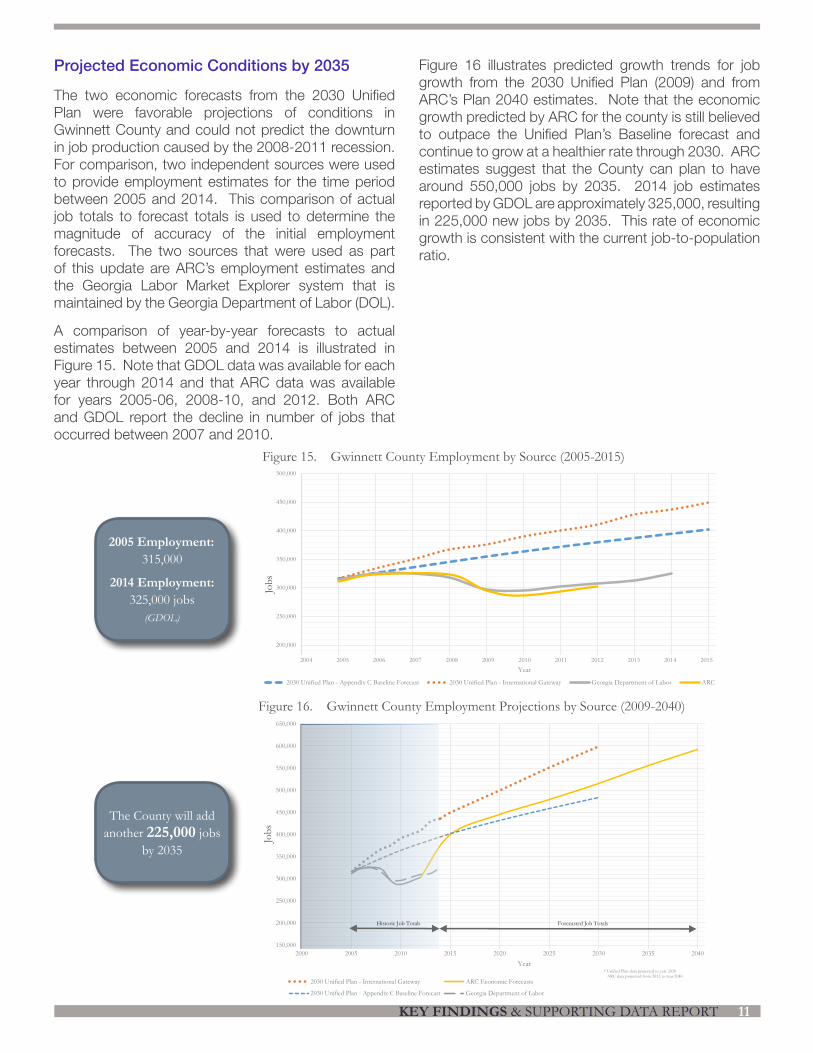
Projected Economic Conditions by 2035
The two economic forecasts from the 2030 Unified Plan were favorable projections of conditions in Gwinnett County and could not predict the downturn in job production caused by the 2008-2011 recession. For comparison, two independent sources were used to provide employment estimates for the time period between 2005 and 2014. This comparison of actual job totals to forecast totals is used to determine the magnitude of accuracy of the initial employment forecasts. The two sources that were used as part of this update are ARC’s employment estimates and the Georgia Labor Market Explorer system that is maintained by the Georgia Department of Labor (DOL).
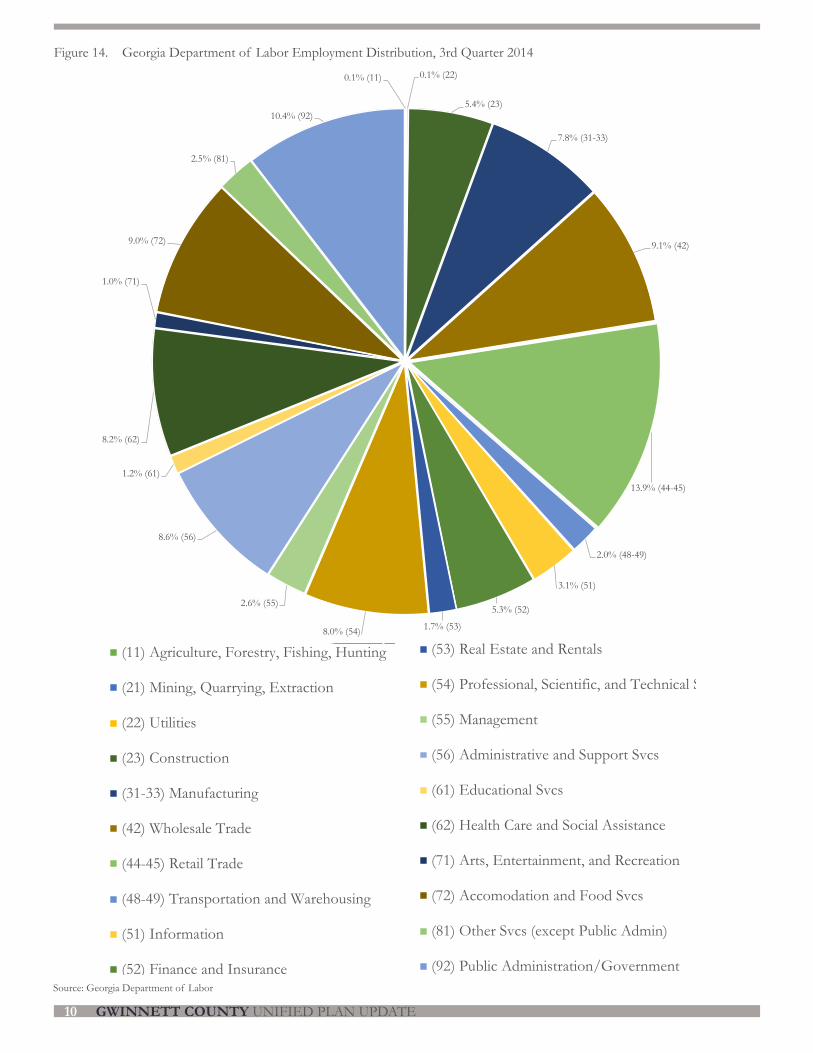
A comparison of year-by-year forecasts to actual estimates between 2005 and 2014 is illustrated in Figure 15. Note that GDOL data was available for each year through 2014 and that ARC data was available for years 2005-06, 2008-10, and 2012. Both ARC and GDOL report the decline in number of jobs that occurred between 2007 and 2010.
Figure 15. Gwinnett County Employment by Source (2005-2015)
Figure 16. Gwinnett County Employment Projections by Source (2009-2040)
0
50,000
100,000
150,000
200,000
250,000
300,000
350,000
400,000
450,000
500,000
2004 2005 2006 2007 2008 2009 2010 2011 2012 2013 2014 2015 2016
Jobs
Year
Gwinnett County Economic Growth by Source (2005-2015)
2030 Unified Plan - Appendix C Baseline Forecast 2030 Unified Plan - International Gateway Georgia Department of Labor ARC
Figure 16 illustrates predicted growth trends for job growth from the 2030 Unified Plan (2009) and from ARC’s Plan 2040 estimates. Note that the economic growth predicted by ARC for the county is still believed to outpace the Unified Plan’s Baseline forecast and continue to grow at a healthier rate through 2030. ARC estimates suggest that the County can plan to have around 550,000 jobs by 2035. 2014 job estimates reported by GDOL are approximately 325,000, resulting in 225,000 new jobs by 2035. This rate of economic growth is consistent with the current job-to-population ratio.
2005 Employment: 315,000
2014 Employment: 325,000 jobs
(GDOL)
The County will add another 225,000 jobs
by 2035
0
50,000
100,000
150,000
200,000
250,000
300,000
350,000
400,000
450,000
500,000
550,000
600,000
650,000
2000 2005 2010 2015 2020 2025 2030 2035 2040 2045
Cou
nty
Popu
latio
n
Year
Gwinnett County Economic Projections by Source (2009-2040*)
2030 Unified Plan - International Gateway ARC Economic Forecasts
2030 Unified Plan - Appendix C Baseline Forecast Georgia Department of Labor
Historic Job Totals Forecasted Job Totals
* Unified Plan data projected to year 2030ARC data projected from 2012 to year 2040
Jobs
Jobs
GWINNETT COUNTY UNIFIED PLAN UPDATE12
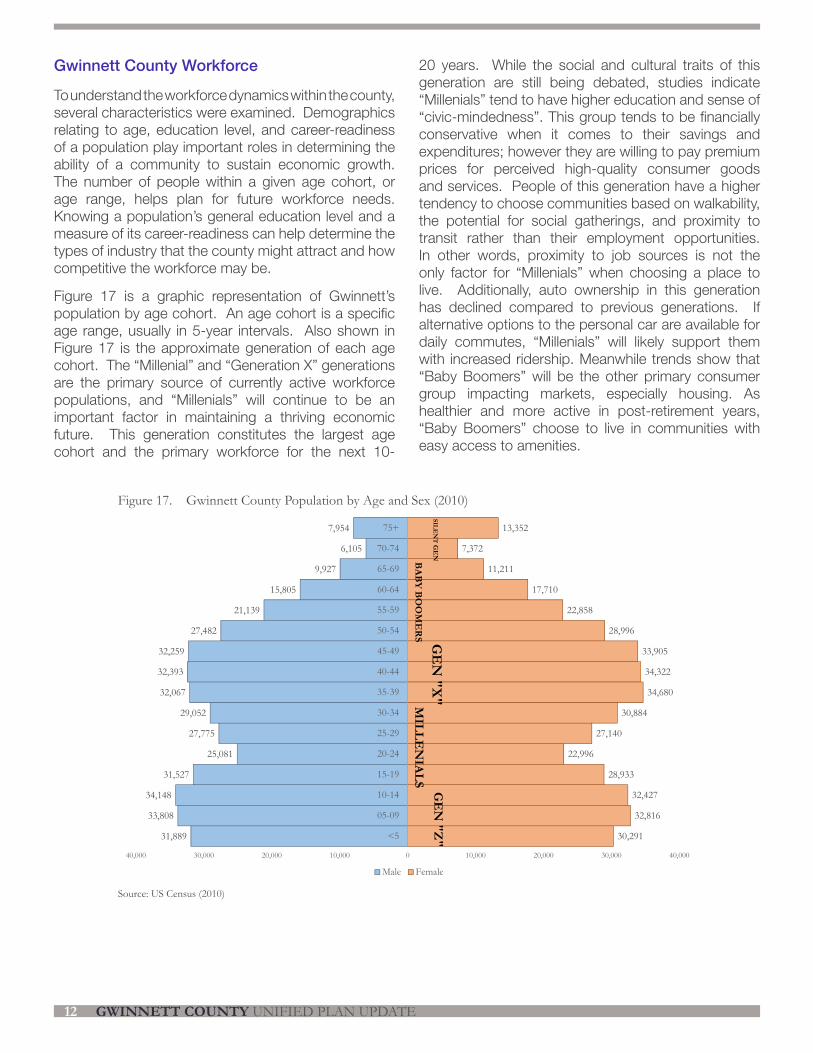
Figure 17. Gwinnett County Population by Age and Sex (2010)
Gwinnett County Workforce
To understand the workforce dynamics within the county, several characteristics were examined. Demographics relating to age, education level, and career-readiness of a population play important roles in determining the ability of a community to sustain economic growth. The number of people within a given age cohort, or age range, helps plan for future workforce needs. Knowing a population’s general education level and a measure of its career-readiness can help determine the types of industry that the county might attract and how competitive the workforce may be.
Figure 17 is a graphic representation of Gwinnett’s population by age cohort. An age cohort is a specific age range, usually in 5-year intervals. Also shown in Figure 17 is the approximate generation of each age cohort. The “Millenial” and “Generation X” generations are the primary source of currently active workforce populations, and “Millenials” will continue to be an important factor in maintaining a thriving economic future. This generation constitutes the largest age cohort and the primary workforce for the next 10-
20 years. While the social and cultural traits of this generation are still being debated, studies indicate “Millenials” tend to have higher education and sense of “civic-mindedness”. This group tends to be financially conservative when it comes to their savings and expenditures; however they are willing to pay premium prices for perceived high-quality consumer goods and services. People of this generation have a higher tendency to choose communities based on walkability, the potential for social gatherings, and proximity to transit rather than their employment opportunities. In other words, proximity to job sources is not the only factor for “Millenials” when choosing a place to live. Additionally, auto ownership in this generation has declined compared to previous generations. If alternative options to the personal car are available for daily commutes, “Millenials” will likely support them with increased ridership. Meanwhile trends show that “Baby Boomers” will be the other primary consumer group impacting markets, especially housing. As healthier and more active in post-retirement years, “Baby Boomers” choose to live in communities with easy access to amenities.
30,291
32,816
32,427
28,933
22,996
27,140
30,884
34,680
34,322
33,905
28,996
22,858
17,710
11,211
7,372
13,352
31,889
33,808
34,148
31,527
25,081
27,775
29,052
32,067
32,393
32,259
27,482
21,139
15,805
9,927
6,105
7,954
40,000 30,000 20,000 10,000 0 10,000 20,000 30,000 40,000
<5
05-09
10-14
15-19
20-24
25-29
30-34
35-39
40-44
45-49
50-54
55-59
60-64
65-69
70-74
75+
2010 Gwinnett County Population by Age and Sex
Male Female
MILLE
NIALS
GE
N "Z
"B
ABY B
OO
ME
RS G
EN
"X"
SILEN
TG
EN
Source: US Census (2010)
KEY FINDINGS & SUPPORTING DATA REPORT 13
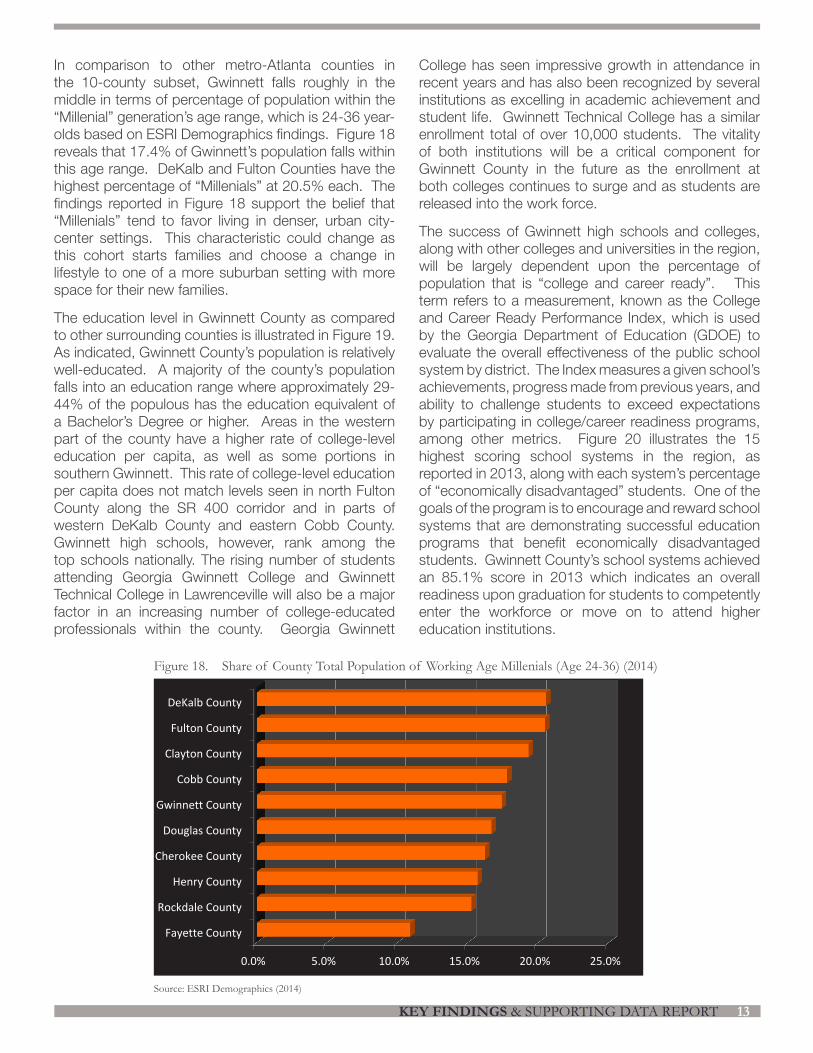
Figure 18. Share of County Total Population of Working Age Millenials (Age 24-36) (2014)
0.0% 5.0% 10.0% 15.0% 20.0% 25.0%
Fayette County
Rockdale County
Henry County
Cherokee County
Douglas County
Gwinnett County
Cobb County
Clayton County
Fulton County
DeKalb County
2014
Share of County Total Population of Working Age Millennials (Age 24-36)
Source: ESRI Demographics 2014
In comparison to other metro-Atlanta counties in the 10-county subset, Gwinnett falls roughly in the middle in terms of percentage of population within the “Millenial” generation’s age range, which is 24-36 year-olds based on ESRI Demographics findings. Figure 18 reveals that 17.4% of Gwinnett’s population falls within this age range. DeKalb and Fulton Counties have the highest percentage of “Millenials” at 20.5% each. The findings reported in Figure 18 support the belief that “Millenials” tend to favor living in denser, urban city-center settings. This characteristic could change as this cohort starts families and choose a change in lifestyle to one of a more suburban setting with more space for their new families.
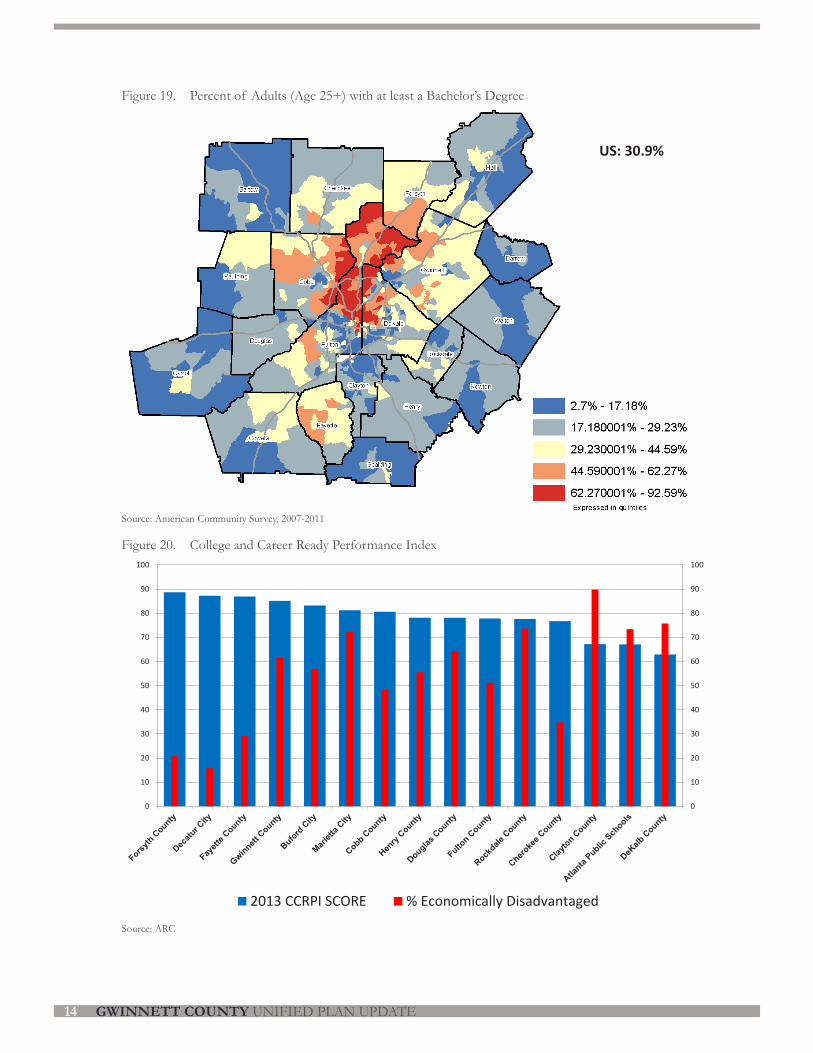
The education level in Gwinnett County as compared to other surrounding counties is illustrated in Figure 19. As indicated, Gwinnett County’s population is relatively well-educated. A majority of the county’s population falls into an education range where approximately 29-44% of the populous has the education equivalent of a Bachelor’s Degree or higher. Areas in the western part of the county have a higher rate of college-level education per capita, as well as some portions in southern Gwinnett. This rate of college-level education per capita does not match levels seen in north Fulton County along the SR 400 corridor and in parts of western DeKalb County and eastern Cobb County. Gwinnett high schools, however, rank among the top schools nationally. The rising number of students attending Georgia Gwinnett College and Gwinnett Technical College in Lawrenceville will also be a major factor in an increasing number of college-educated professionals within the county. Georgia Gwinnett
College has seen impressive growth in attendance in recent years and has also been recognized by several institutions as excelling in academic achievement and student life. Gwinnett Technical College has a similar enrollment total of over 10,000 students. The vitality of both institutions will be a critical component for Gwinnett County in the future as the enrollment at both colleges continues to surge and as students are released into the work force.
The success of Gwinnett high schools and colleges, along with other colleges and universities in the region, will be largely dependent upon the percentage of population that is “college and career ready”. This term refers to a measurement, known as the College and Career Ready Performance Index, which is used by the Georgia Department of Education (GDOE) to evaluate the overall effectiveness of the public school system by district. The Index measures a given school’s achievements, progress made from previous years, and ability to challenge students to exceed expectations by participating in college/career readiness programs, among other metrics. Figure 20 illustrates the 15 highest scoring school systems in the region, as reported in 2013, along with each system’s percentage of “economically disadvantaged” students. One of the goals of the program is to encourage and reward school systems that are demonstrating successful education programs that benefit economically disadvantaged students. Gwinnett County’s school systems achieved an 85.1% score in 2013 which indicates an overall readiness upon graduation for students to competently enter the workforce or move on to attend higher education institutions.
Source: ESRI Demographics (2014)
GWINNETT COUNTY UNIFIED PLAN UPDATE14
Figure 19. Percent of Adults (Age 25+) with at least a Bachelor’s Degree
Figure 20. College and Career Ready Performance Index
US: 30.9%
10Source: American Community Survey 2007-2011
Percent of Adults (Age 25+) with at Least a Bachelor’s Degree
College and Career Ready Performance Index
0
10
20
30
40
50
60
70
80
90
100
0
10
20
30
40
50
60
70
80
90
100
2013 CCRPI SCORE % Economically Disadvantaged
Source: ARC
Source: American Community Survey, 2007-2011
KEY FINDINGS & SUPPORTING DATA REPORT 15
Current Economic Goals
The County’s Economic Development strategy document was developed jointly with the County Economic Development Department and Partnership Gwinnett, a public-private organization dedicated to bringing new jobs and investment. It is hereby incorporated into the Unified Plan. Last updated in 2011 as “Partnership Gwinnett 2.0”, the strategy identifies these three overarching goals:
Goal 1: Comprehensive Economic Development
Goal 2: World-Class Talent
Goal 3: Community and Leadership Development (infrastructure, open space, culture, intellectual centers and the arts, and communities in need)
Each goal has a set of actions and actors responsible for executing those actions. Partnership Gwinnett conducted a review of achievements in its 2012-2016 “Report Card”, providing a status report on each area of activity (November 2014). Activities included work related to pursuing infrastructure improvements and other amenities. New initiatives that Partnership Gwinnett committed to included preparation of a Gwinnett Sustainability plan and coordinating with some of the cities to develop a bicycle and pedestrian plan. The organization also initiated efforts to develop a Diversity Plan through the Diversity Leadership Group. Partnership Gwinnett conducts international business mission trips to target countries like China, Japan, Korea, Germany and other European countries, and sponsors Global Business Council meetings.
In addition to traditional activities related to recruitment, expansion and retaining of businesses, economic development efforts will include:
• efforts to provide resources to those suffering from the mortgage crisis;
• efforts to link workplace with students and advanced training programs;
• strengthening working relationship with Gwinnett Coalition for Health & Human Services (GCHHS).
Future Growth and Redevelopment
Partnership Gwinnett and the County Chamber also provide resources regarding workforce development, small business support, and redevelopment. Partnership Gwinnett sponsors an annual Redevelopment Forum, bringing national thought-leaders and development experts together with Gwinnett’s public and private sector leaders to stimulate new ideas and action. It also co-hosts with the Chamber to organize the Redevelopment Task Force, which develops strategies for promoting catalyst sites and other actions, including the Revitalization Web page which serves as a guide to redevelopment. The site hosts documents that market incentives, strategic Gwinnett communities which are “[Re]Development Ready,” and the advantages of select available sites.
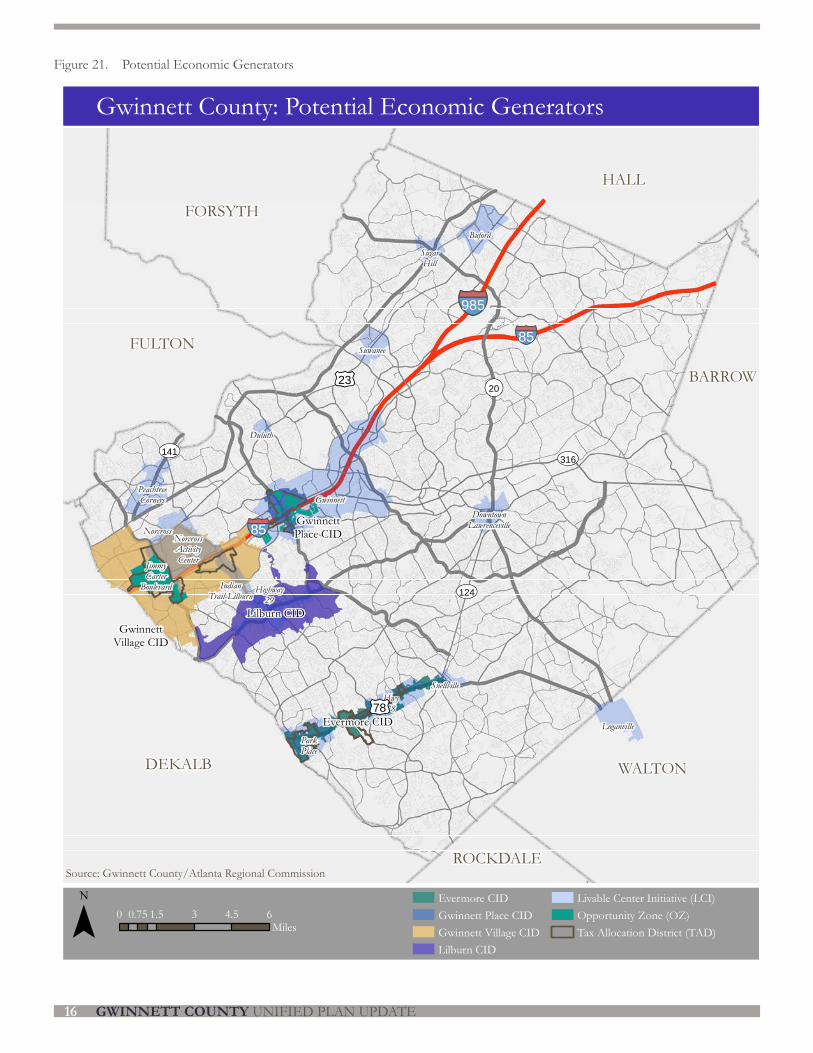
Since the Unified Plan (2009), the County has undertaken numerous, additional steps toward promoting redevelopment. Building on several Livable Community Initiatives (LCI) Master Plans in strategic locations, the County and its private sector partners implemented dozens of capital improvements and activities to promote investment. (LCI Master Plans are sponsored by ARC and integrate transportation investment, urban design, and redevelopment strategies to transform areas into vibrant, walkable communities.) Several of these LCI efforts are located within the five Community Improvement Districts (CIDs) within the County: Gwinnett Place, Gwinnett Village, Lilburn, Braselton and Evermore. These CIDs have generated millions of dollars to fund community improvements, safety and aesthetic enhancements that stimulate new investment and help promote existing businesses.
Figure 21 identifies the LCI areas, TAD boundaries, the location of the Opportunity Zone, and the four CIDs where the County focuses its redevelopment efforts.
The County counts five Tax Allocation Districts: Gwinnett Place, Jimmy Carter Boulevard, Indian Trail, Park Place and Lake Lucerne.
The County also established two Opportunity Zones – one at Gwinnett Place and one at Gwinnett Village. Designated by the Georgia Department of Community Affairs, Opportunity Zones offer tax credits based on job creation. To qualify, local governments undertake redevelopment and revitalization efforts in certain older commercial and industrial areas. Several business recruitment efforts succeeded by using these credits, along with other incentives. An additional tax credit program was recently established for targeted industries through DCA as “Less Developed Census Tracts.”
GWINNETT COUNTY UNIFIED PLAN UPDATE16
GwinnettVillage CID
Lilburn CID
Evermore CID
GwinnettPlace CID
Gwinnett
Hwy78
Buford
ParkPlace
NorcrossActivityCenter
Loganville
PeachtreeCorners
Highway29
Suwanee
SugarHill
Norcross
JimmyCarter
Boulevard
Snellville
DowntownLawrenceville
IndianTrail-Lilburn
Duluth
DEKALB
HALL
WALTON
FULTON
FORSYTH
BARROW
ROCKDALE
§̈¦85§̈¦985
§̈¦85
£¤23
£¤78
UV124
UV316
¬«20
UV141
Gwinnett County: Potential Economic Generators
¯Evermore CIDGwinnett Place CIDGwinnett Village CIDLilburn CID
Livable Center Initiative (LCI)Opportunity Zone (OZ)Tax Allocation District (TAD)
0 1.5 3 4.5 60.75Miles
Source: Gwinnett County/Atlanta Regional Commission
Figure 21. Potential Economic Generators
KEY FINDINGS & SUPPORTING DATA REPORT 17
HOUSINGIn spring 2015, Gwinnett County submitted the 5-year update of its Consolidated Housing Plan to HUD for review and approval. The County’s Department of Financial Services holds responsibility for the administration of all HUD grants and programs associated with housing. Nearly 100 stakeholders were identified and contacted in the preparation of the Plan update, including representatives of all 16 municipalities. The update report is hereby included as an appendix to the Technical Back-Up.
Gwinnett County anticipates utilizing over $28 million in federal funds over the 5-year planning period of the updated plan. The plan’s Goals Summary (Gwinnett County Proposed Consolidated Plan 2015-2019 and Action Plan 2015, p. 129) identifies homebuyer financial assistance, rehabilitation, housing counseling, homeless services, facilities and other improvements as areas receiving funding. The top housing related priorities approved by the Board of Commissioners include:
1. Increase Access to Affordable Housing
2. Increase Housing Options for Homeless and At Risk of Homelessness
3. Reduce Substandard Housing
4. Increase Housing and Supportive Services for Targeted Populations
5. Increase the Capacity of Public Facilities and Public Services to Improve the Social, Economic, and Physical Environment by:
• Acquiring, Constructing, or Rehabilitating Public Facilities,
• Revitalizing Older Areas of the County,
• Providing Equipment and Operating Support Through Public Service Activities, and
• Providing Overall Program Administration and Management.
6. Affirmatively Further Fair Housing Choice
Housing Problems
Overall, a total of 101,950 households have one or more of the four housing problems: (1) lack of kitchen facilities; (2) lack of complete plumbing; (3) overcrowding; and (4) cost burden, which is the primary
concern in Gwinnett. The Consolidated Housing Plan reports that this figure’s source is the 2007-2011 Comprehensive Housing Affordability Strategy (CHAS). The Consolidated Housing Plan found that 76.8% (78,330 households) of those with at least one of the HUD-identified housing problems were also below the Area Median Income (AMI). Among these households 39.4% were White, 26.7% were Black/African American, 22.6% were Hispanic, and 9.6% were Asian (2007‐2011 CHAS Data). The 2007-2011 CHAS data also
reported a total household count of 262,170, which means that 38.8% of households in Gwinnett are facing housing problems with housing cost being their biggest problem. Of the 101,950 households with problems, 95.4% are housing cost related (Gwinnett County Proposed Consolidated Plan 2015-2019 and Action Plan 2015, p. 38). This is indicative of a lack of affordable housing opportunities at each income level. This is not a low-income only problem: households earning 80 - 100% of the AMI as well as those earning more than the AMI also experience at least one of the four housing problems. Also noted are that 36,558 households spend half or more of their income on housing (Gwinnett County Proposed Consolidated Plan 2015-2019 and Action Plan 2015, p. 55).
Housing Conditions
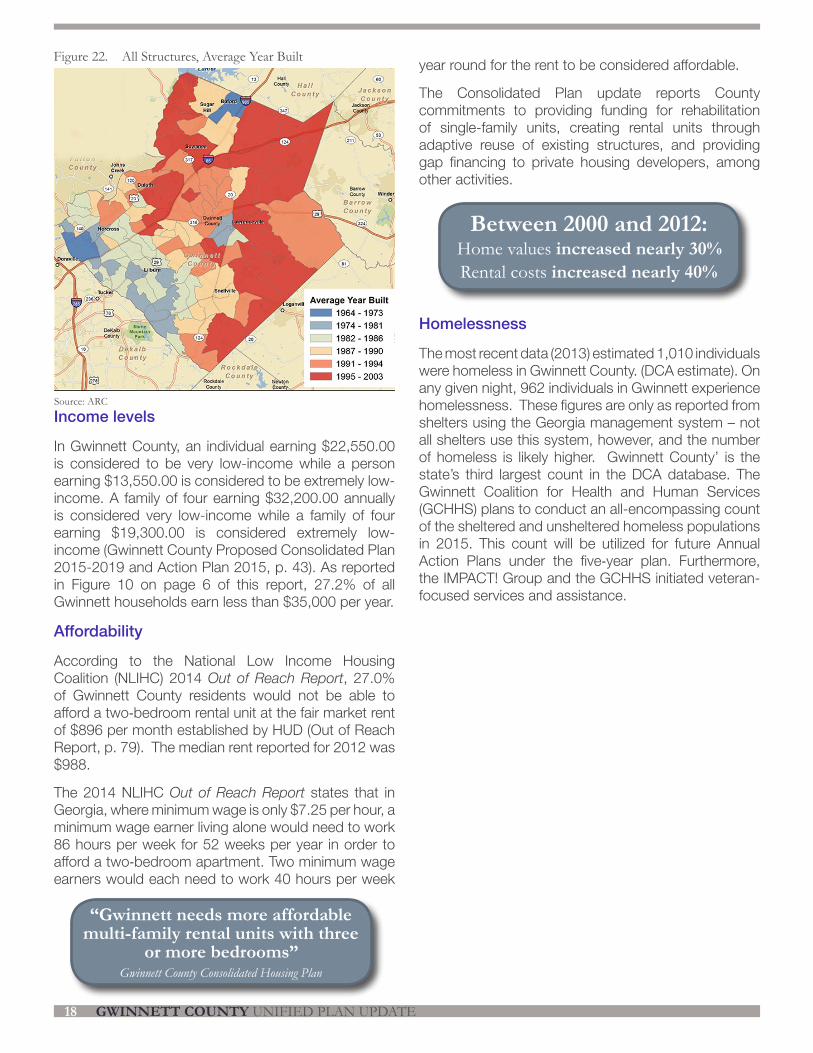
Housing conditions in the county are illustrated in Figure 22, which identifies the average year that homes within a given Census block group were constructed. The southwestern portion of the county is made up of the oldest homes, and as development expands to the north and east, the homes are newer in age. This is indicative of the expansion of suburban residential areas in the 1990s and early 2000s. Of the homes in Gwinnett County, 47,651, or 16%, were identified as being constructed prior to 1980.
1 out of 5 Gwinnett household are single-person (approx, 2012)
291,813 housing units
70% Owner Occupied
30% Renter Occupied
80% dwellings are single-family
Units built before 1980Owner: 33%Renter: 35%
GWINNETT COUNTY UNIFIED PLAN UPDATE18
Figure 22. All Structures, Average Year Built
Source: ARC
Income levels
In Gwinnett County, an individual earning $22,550.00 is considered to be very low-income while a person earning $13,550.00 is considered to be extremely low-income. A family of four earning $32,200.00 annually is considered very low-income while a family of four earning $19,300.00 is considered extremely low-income (Gwinnett County Proposed Consolidated Plan 2015-2019 and Action Plan 2015, p. 43). As reported in Figure 10 on page 6 of this report, 27.2% of all Gwinnett households earn less than $35,000 per year.
Affordability
According to the National Low Income Housing Coalition (NLIHC) 2014 Out of Reach Report, 27.0% of Gwinnett County residents would not be able to afford a two‐bedroom rental unit at the fair market rent of $896 per month established by HUD (Out of Reach Report, p. 79). The median rent reported for 2012 was $988.
The 2014 NLIHC Out of Reach Report states that in Georgia, where minimum wage is only $7.25 per hour, a minimum wage earner living alone would need to work 86 hours per week for 52 weeks per year in order to afford a two‐bedroom apartment. Two minimum wage earners would each need to work 40 hours per week
year round for the rent to be considered affordable.
The Consolidated Plan update reports County commitments to providing funding for rehabilitation of single-family units, creating rental units through adaptive reuse of existing structures, and providing gap financing to private housing developers, among other activities.
Homelessness
The most recent data (2013) estimated 1,010 individuals were homeless in Gwinnett County. (DCA estimate). On any given night, 962 individuals in Gwinnett experience homelessness. These figures are only as reported from shelters using the Georgia management system – not all shelters use this system, however, and the number of homeless is likely higher. Gwinnett County’ is the state’s third largest count in the DCA database. The Gwinnett Coalition for Health and Human Services (GCHHS) plans to conduct an all-encompassing count of the sheltered and unsheltered homeless populations in 2015. This count will be utilized for future Annual Action Plans under the five‐year plan. Furthermore, the IMPACT! Group and the GCHHS initiated veteran-focused services and assistance.
Between 2000 and 2012:Home values increased nearly 30%Rental costs increased nearly 40%
“Gwinnett needs more affordable multi-family rental units with three
or more bedrooms”Gwinnett County Consolidated Housing Plan
KEY FINDINGS & SUPPORTING DATA REPORT 19
Non-housing Related Community Development Needs
Needs for public facilities that were identified by the Plan update process include:
• Recreation centers• Parks• Community centers• Senior centers• Building redevelopment• Homeless facilities• Youth centers• Domestic Violence Shelters
The public service needs identified by the Plan update process include:
• Transportation Services• Domestic Violence Shelter Operating Costs• Developmental Disability Services• Transitional Housing Services• Housing Counseling• Healthcare Systems• Homelessness Solutions• Fair Housing Education• Mental Health Services
In addition, senior housing and housing with disability accommodations are both needed in Gwinnett County. The 2008‐2012 ACS reported that there were at least 92,411 residents age 60 or older (11.4%). Almost 3% of households (234,018) in Gwinnett County have at least one child living with a disability and 65,110 of these households (28%) have only one parent present to provide extra care to the child.
GWINNETT COUNTY UNIFIED PLAN UPDATE20
COMMUNITY SERVICES AND FACILITIES
The Community Services Department carries responsibility for many of the amenities that help “keep Gwinnett a preferred community”, one of the five driving themes of the Unified Plan. The Department’s vision states that:
“The DCS provides high quality recreational, educational, electoral, human services and other services…We envision a diverse, vibrant and safe Gwinnett community where residents are healthy and successful. We will partner with others to enhance the quality of life of families and individuals residing in Gwinnett County”
With over 42,000 individual volunteers and nearly 1,000 different organizations offering services, manpower and/or funding – the department works to stretch public dollars and resources through civic partnerships and networks.
The Cooperative Extension offers just over 1,000 youth and adult programs, and the award winning Environmental and Heritage Center also offers hundreds of education programs and hosted 75,000 visitors in 2013. The Health and Human Services program manages a massive amount of resources including over 450,000 health and senior services, including meals, transportation, parenting classes, and respite and other care.
Unless otherwise indicated, all data presented in this section compiled from: Community Services Annual Report (2013) and the Community Facilities & Transportation Capital Improvements (CIP) 2014-2019)
Public Safety
The Gwinnett County Police Department operates 12 facilities, including headquarters, precincts, animal welfare facilities, and the Quality of Life Unit offices among others. General crime calls have steadily decreased from a peak in 2009 of around 530,000 to 440,000 dispatch calls in 2013 (Police Annual Report). Robberies and burglaries have also declined since the 2008-09 years, the height of the great recession. The CIP includes $188.2 million for public safety; highlights of planned improvements include:
• Police Services’ projects: improvements to the Animal Welfare and Enforcement Center and major repairs and renovations at Police Headquarters. There will be two new projects to include an upgrade to one of the police helicopters and a five-year replacement program for police firearms.
• Future plans for the Department of Fire and Emergency Services include: the addition of Fire Station 31 located at the Georgia Gwinnett College campus, which is expected to be a 12,800-square-foot facility; relocation of Fire Station 10 near Coolray Field, which is also expected to be a 12,800-square-foot facility; improvements at the Fire Academy; identifying plans and locations for the construction of Stations 33 and 34 for future County growth; adding additional medic units; the upgrading of the department’s self-contained breathing apparatus; and the replacement of older HVAC systems.
Another public safety project is the development of a new permanent facility to house the Georgia State Patrol Post.
KEY FINDINGS & SUPPORTING DATA REPORT 21
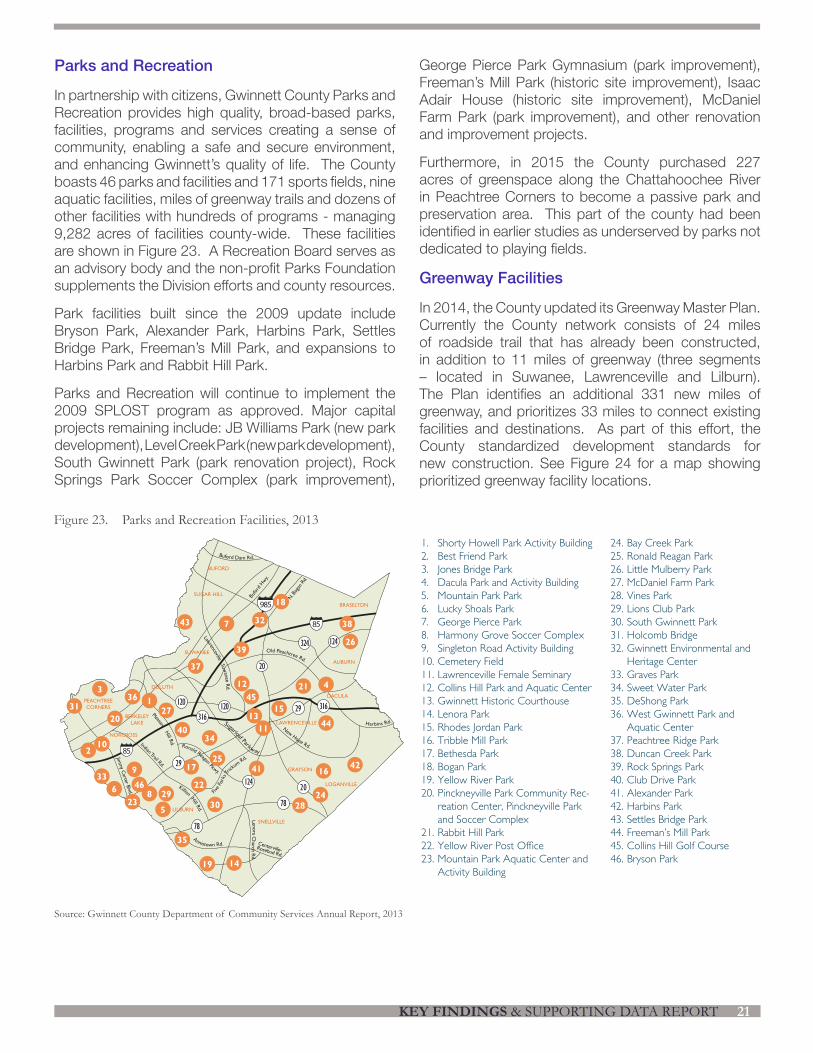
Figure 23. Parks and Recreation Facilities, 2013
page | V.11
2013 Park Inventory
With 46 parks, residents are just minutes away from enjoying a day at the park and the many activities offered by Gwinnett County Parks and Recreation.
1. Shorty Howell Park Activity Building2. Best Friend Park3. Jones Bridge Park4. Dacula Park and Activity Building5. Mountain Park Park6. Lucky Shoals Park7. George Pierce Park8. Harmony Grove Soccer Complex9. Singleton Road Activity Building10. Cemetery Field11. Lawrenceville Female Seminary12. Collins Hill Park and Aquatic Center13. Gwinnett Historic Courthouse14. Lenora Park15. Rhodes Jordan Park16. Tribble Mill Park17. Bethesda Park18. Bogan Park19. Yellow River Park20. Pinckneyville Park Community Rec-
reation Center, Pinckneyville Park and Soccer Complex
21. Rabbit Hill Park22. Yellow River Post Office23. Mountain Park Aquatic Center and
Activity Building
24. Bay Creek Park25. Ronald Reagan Park26. Little Mulberry Park27. McDaniel Farm Park28. Vines Park29. Lions Club Park30. South Gwinnett Park31. Holcomb Bridge32. Gwinnett Environmental and
Heritage Center33. Graves Park34. Sweet Water Park35. DeShong Park36. West Gwinnett Park and
Aquatic Center37. Peachtree Ridge Park38. Duncan Creek Park39. Rock Springs Park40. Club Drive Park41. Alexander Park42. Harbins Park43. Settles Bridge Park44. Freeman’s Mill Park45. Collins Hill Golf Course46. Bryson Park
124
20
124
Bufo
rd H
wy.
N. B
ogan
Rd.
Centerville-Rosebud Rd.
78
20
78
316
120120 31629
324
New Hope Rd.
Harbins Rd.
Indian Trail Rd.
Jimm
y Carter B
lvd.
Pleasant Hill R
d.
29
Ronald Reagan Pkwy.
Old Peachtree Rd.
Annistown Rd.
Killian Hill R
d.
Five
Fork
s Tric
kum R
d.
Lenora C
hurch
Rd.
Buford Dam Rd.
Lawrenceville Suw
anee R
d.
Sugarloaf Parkway
985
85
85
NORCROSS
PEACHTREE
CORNERS
BERKELEY
LAKE
LOGANVILLE
SNELLVILLE
LILBURN
GRAYSON
LAWRENCEVILLE
AUBURN
DACULA
DULUTH
SUWANEE
SUGAR HILL
BUFORD
BRASELTON
43 7
18
32
39
37
38
26
12 21 4
45
1513
1144
3
3136 1
2720
210
4034
2517
22
41
30
933
6
235
8 2946
35
19 14
2824
1642
Parks and Recreation
In partnership with citizens, Gwinnett County Parks and Recreation provides high quality, broad-based parks, facilities, programs and services creating a sense of community, enabling a safe and secure environment, and enhancing Gwinnett’s quality of life. The County boasts 46 parks and facilities and 171 sports fields, nine aquatic facilities, miles of greenway trails and dozens of other facilities with hundreds of programs - managing 9,282 acres of facilities county-wide. These facilities are shown in Figure 23. A Recreation Board serves as an advisory body and the non-profit Parks Foundation supplements the Division efforts and county resources.
Park facilities built since the 2009 update include Bryson Park, Alexander Park, Harbins Park, Settles Bridge Park, Freeman’s Mill Park, and expansions to Harbins Park and Rabbit Hill Park.
Parks and Recreation will continue to implement the 2009 SPLOST program as approved. Major capital projects remaining include: JB Williams Park (new park development), Level Creek Park (new park development), South Gwinnett Park (park renovation project), Rock Springs Park Soccer Complex (park improvement),
George Pierce Park Gymnasium (park improvement), Freeman’s Mill Park (historic site improvement), Isaac Adair House (historic site improvement), McDaniel Farm Park (park improvement), and other renovation and improvement projects.
Furthermore, in 2015 the County purchased 227 acres of greenspace along the Chattahoochee River in Peachtree Corners to become a passive park and preservation area. This part of the county had been identified in earlier studies as underserved by parks not dedicated to playing fields.
Greenway Facilities
In 2014, the County updated its Greenway Master Plan. Currently the County network consists of 24 miles of roadside trail that has already been constructed, in addition to 11 miles of greenway (three segments – located in Suwanee, Lawrenceville and Lilburn). The Plan identifies an additional 331 new miles of greenway, and prioritizes 33 miles to connect existing facilities and destinations. As part of this effort, the County standardized development standards for new construction. See Figure 24 for a map showing prioritized greenway facility locations.
Source: Gwinnett County Department of Community Services Annual Report, 2013
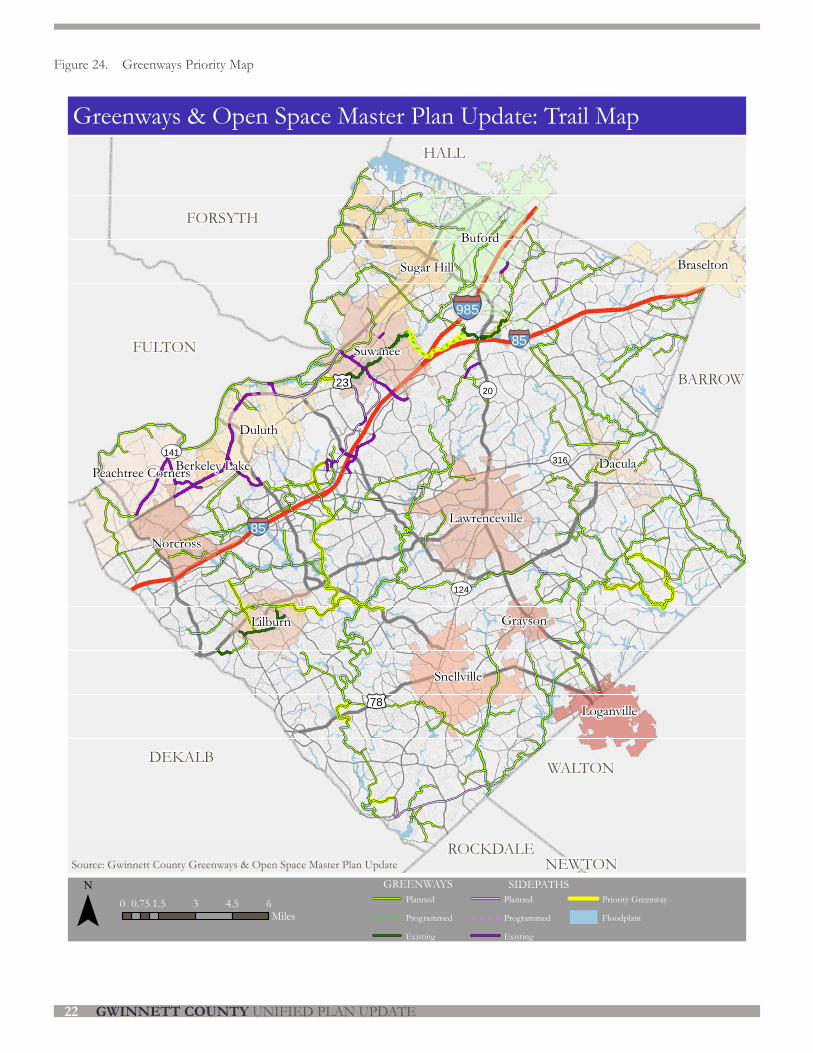
GWINNETT COUNTY UNIFIED PLAN UPDATE22
Figure 24. Greenways Priority Map
DEKALB
HALL
WALTON
FULTON
FORSYTH
BARROW
ROCKDALENEWTON
§̈¦85§̈¦985
§̈¦85
£¤23
£¤78
UV124
UV316
¬«20
UV141
Buford
Duluth
Suwanee
Snellville
Lawrenceville
Peachtree Corners
Lilburn
Braselton
Loganville
Sugar Hill
Dacula
Norcross
Grayson
Berkeley Lake
Greenways & Open Space Master Plan Update: Trail Map
¯ Planned
Programmed
Existing
Planned
Programmed
Existing
Priority Greenway
Floodplain0 1.5 3 4.5 60.75
Miles
Source: Gwinnett County Greenways & Open Space Master Plan Update
GREENWAYS SIDEPATHS
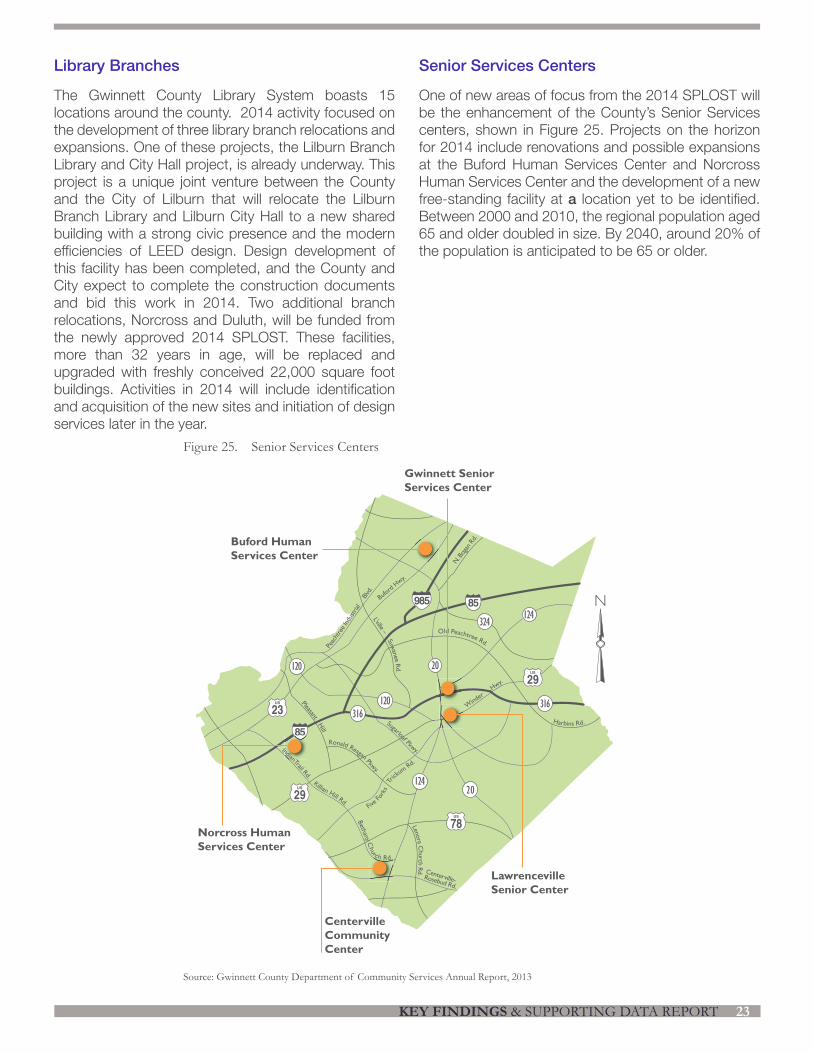
KEY FINDINGS & SUPPORTING DATA REPORT 23
Figure 25. Senior Services Centers
Library Branches
The Gwinnett County Library System boasts 15 locations around the county. 2014 activity focused on the development of three library branch relocations and expansions. One of these projects, the Lilburn Branch Library and City Hall project, is already underway. This project is a unique joint venture between the County and the City of Lilburn that will relocate the Lilburn Branch Library and Lilburn City Hall to a new shared building with a strong civic presence and the modern efficiencies of LEED design. Design development of this facility has been completed, and the County and City expect to complete the construction documents and bid this work in 2014. Two additional branch relocations, Norcross and Duluth, will be funded from the newly approved 2014 SPLOST. These facilities, more than 32 years in age, will be replaced and upgraded with freshly conceived 22,000 square foot buildings. Activities in 2014 will include identification and acquisition of the new sites and initiation of design services later in the year.
Senior Services Centers
One of new areas of focus from the 2014 SPLOST will be the enhancement of the County’s Senior Services centers, shown in Figure 25. Projects on the horizon for 2014 include renovations and possible expansions at the Buford Human Services Center and Norcross Human Services Center and the development of a new free-standing facility at a location yet to be identified. Between 2000 and 2010, the regional population aged 65 and older doubled in size. By 2040, around 20% of the population is anticipated to be 65 or older.
page | IV.5
Centers
Buford Human Services Center
770.614. 2526www.gwinnettbhsc.com
Buford Senior Center: 770.614.25502755 Sawnee Avenue
Buford, GA 30518www.gwinnettseniorservices.com
Centerville Community Center
770.985.4713www.centervillecommunitycenter.com
Centerville Satellite Senior Center: 770.978.45323025 Bethany Church Road
Snellville, GA 30039
Gwinnett Senior Services Center
678.377.4150567 Swanson Drive
Lawrenceville, GA 30043www.gwinnettseniorservices.com
Lawrenceville Senior Center
678.277.0970225 Benson Street
Lawrenceville, GA 30046www.gwinnettseniorservices.com
Norcross Human Services Center
678.225.5400www.gwinnettnhsc.com
Norcross Senior Center: 678.225.54305030 Georgia Belle Court
Norcross, GA 30093www.gwinnettseniorservices.com
Buford
Hwy.
N. B
ogan
Rd.
Centerville-Rosebud Rd.
Harbins Rd.
IndianTrail Rd. Killian Hill Rd. Bethany C
hu
rch Rd.
Pleasant Hill
Ronald Reagan Pkwy.
Old Peachtree Rd.
Five
For
ks Tric
kum R
d.
Lenora C
hurch
Rd.
L’ville – Suwanee R
d.
Sugarloaf Pkwy.
Buford Human
Services Center
Lawrenceville
Senior Center
Norcross Human
Services Center
Centerville
Community
Center
W
inder
H
wy.
Gwinnett Senior
Services Center
Source: Gwinnett County Department of Community Services Annual Report, 2013
GWINNETT COUNTY UNIFIED PLAN UPDATE24
TRANSPORTATIONSince the adoption of the Unified Plan in 2009, several transportation studies and hundreds of projects have been completed. The County has initiated its Comprehensive Transportation Plan update in 2015, which will be incorporated herein upon completion.
Since 1988, Gwinnett County’s SPLOST program has generated billions of transportation dollars. The 2009 SPLOST will generate an estimated $302.5 million in transportation revenue and the 2014 SPLOST an estimated $250 million. Further, the Georgia State Legislature approved new funding sources for transportation improvements during its 2015 session, which will help bridge the gap in recent reductions of Federal funding.
Figure 26 identifies planned and programmed transportation projects sponsored by both SPLOST and the regional Transportation Improvement Program (TIP), managed by the Atlanta Regional Commission (ARC).
Road Improvement Program
The County’s Road Improvement Program consists of the following:
• Major Roadway Improvements include new road construction, new alignments, and increasing the capacity of existing roads.
• Intersections/Traffic Operation Improvements include the addition of turn lanes, improvements of alignments of cross streets, improving sight distances, and signalizations as well as Advanced Traffic Management System (ATMS) improvements.
• Bridges/Roadway Drainage Improvements consist of new construction or reconstruction of existing bridges and culverts up to sufficiency standards.
• Road Safety and Alignment projects correct safety deficiencies such as sight distances, horizontal and vertical alignments, and at-grade railroad crossings.
• School Safety projects improve traffic safety near schools with the installation of turn lanes at school entrances, installation of sidewalks, and signalization improvements.
• Sidewalks and Multi-Use Trails include projects to link existing sidewalk segments or link residential
areas to nearby activity centers.
• The Unpaved Road Category funds the paving of gravel and dirt roads throughout the county.
• The Rehabilitation and Resurfacing Category renovates, rehabilitates, and resurfaces existing County roads to prolong the life of the road.
Since the Unified Plan in 2009, the County has completed numerous projects – the 2009 SPLOST program covers over 150 projects. Completed signature projects, however, include:
• Jimmy Carter Boulevard: Diverging Diamond Interchange – in partnership with the Gwinnett Village CID
• Pleasant Hill Road: Diverging Diamond Interchange – in partnership with the Gwinnett Place CID
• Widening of SR 20/Loganville Highway from 2 lanes to 4 lanes
• Interchange improvements to SR 316, including two new bridges
• Sugarloaf Parkway extension and intersection improvements
Another “big impact” project in Gwinnett County was initiated by Georgia DOT (GDOT). In 2011 GDOT implemented High Occupancy Toll (HOT) lanes to improve trip times for transit, high occupancy vehicles, and those solo drivers willing to pay a toll along critical segments of I-85, north of I-285. These HOT lanes comprise part of the statewide initiative toward a Managed Lanes network. Revenue generated from the tolls will help fund an additional 36 new passenger coach buses and expanded park-n-ride capacity. HOT lane users continue to increase, with program surveys indicating high levels of satisfaction with the system.
The County Airport Improvements consist of various improvements to Gwinnett County’s Briscoe Field, the fourth busiest airport in the state. Projects in the Transit Category consist of the acquisition/replacement of buses and equipment and the construction of various transit facilities.
The 2014– 2019 costs for the Transportation totals approximately $448.4 million. Some of the major projects are as follows:
• Continue delivery of the 2009 SPLOST Program
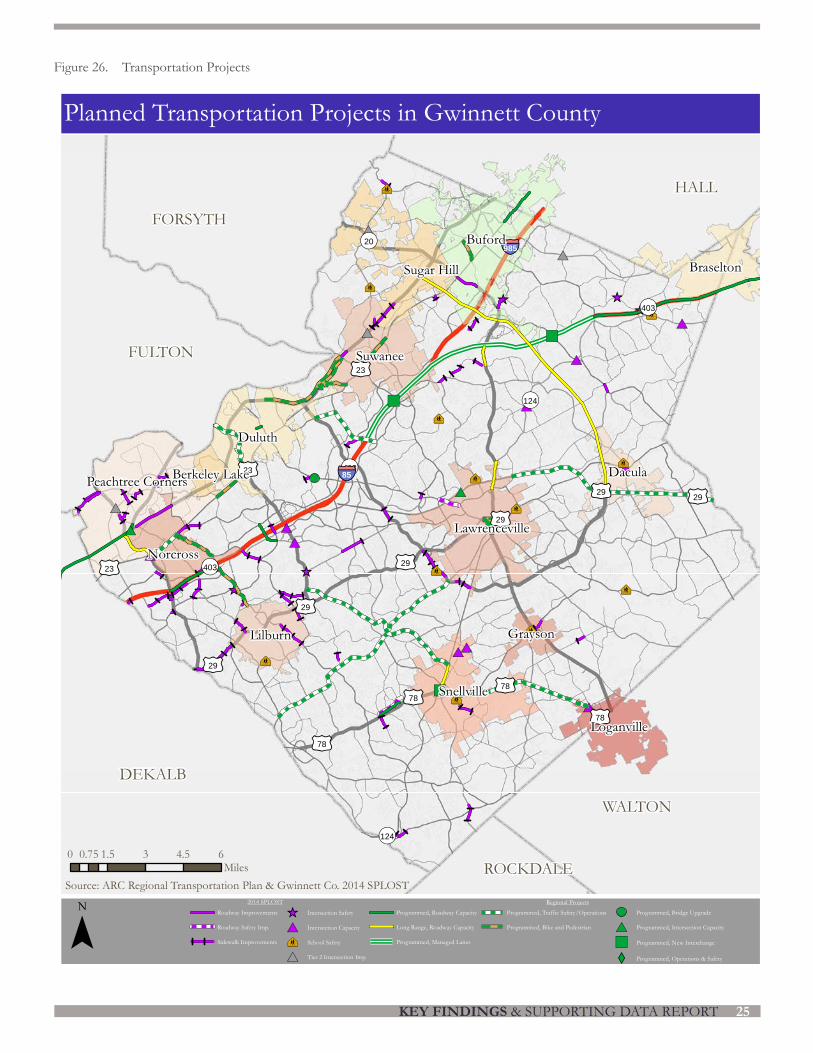
KEY FINDINGS & SUPPORTING DATA REPORT 25
Figure 26. Transportation Projects
#*
#*
#*
#*
#*
#*#*
#*
#*
#*
#*
#*
#*
#*
_̂
_̂
_̂
_̂_̂
ÅÆÇ
ÅÆÇÅÆÇ
ÅÆÇ
ÅÆÇ
ÅÆÇ
ÅÆÇ
ÅÆÇ
ÅÆÇ
ÅÆÇ
ÅÆÇ
ÅÆÇ
")
#*
")
")
XW
#*
§̈¦985
£¤29
£¤23
£¤78
£¤29
£¤29
£¤78
£¤23
£¤29
£¤29
£¤23
£¤29
£¤78
£¤78
¬«403
¬«124
¬«20
¬«403
¬«124
¬«403
DEKALB
HALL
WALTON
FULTON
FORSYTH
ROCKDALE
§̈¦85
Buford
Duluth
Suwanee
Snellville
Lawrenceville
Peachtree Corners
Lilburn
Braselton
Loganville
Sugar Hill
Dacula
Norcross
Grayson
Berkeley Lake
Planned Transportation Projects in Gwinnett County
¯ Roadway Improvements
Roadway Safety Imp.
Sidewalk Improvements
_̂ Intersection Safety
#* Intersection Capacity
ÅÆÇ School Safety
#* Tier 2 Intersection Imp.
Programmed, Roadway Capacity
Long Range, Roadway Capacity
Programmed, Managed Lanes
Programmed, Traffic Safety/Operations
Programmed, Bike and Pedestrian
Programmed, Bridge Upgrade
#* Programmed, Intersection Capacity
") Programmed, New Interchange
XW Programmed, Operations & Safety
0 1.5 3 4.5 60.75Miles
Source: ARC Regional Transportation Plan & Gwinnett Co. 2014 SPLOST2014 SPLOST Regional Projects
GWINNETT COUNTY UNIFIED PLAN UPDATE26
• Implementation of the 2014 SPLOST Program
• Fully implement the CAD/AVL for Transit with real-time vehicle location
• Complete the construction on the Jimmy Carter Boulevard Diverging Diamond Interchange (DDI)
• Continue construction on the SR 20 widening from Peachtree Industrial Boulevard to Burnette Trail and widening/bridge project over Chattahoochee River
• Complete the development of the recommended prioritized project lists with the CPSC and prepare recommendation for consideration by the Board of Commissioners
• Complete the procurement of the new Transportation Consultant Demand Professional Services contract
• Complete engineering and land acquisition for the Five Forks Trickum Road widening project from Oak Road to Killian Hill Road
• Initiate an update to the Comprehensive Transportation Plan (CTP)
• Continue the expansion of the Advanced Traffic Management System (ATMS)/Intelligent Transportation Systems (ITS) network, growth of the Advanced Traveler Information System (ATIS) and GCSmartCommute website, coordination with public safety, and usage of the Traffic Control Center
Gwinnett County Department of Transportation Staff prepared several applications in pursuit of additional state and federal funding for improvements.
I-85 Corridor Study
Completed in 2014, this Alternative Analysis (AA) considered a variety of transit alignments and technologies to serve the highly congested corridor. It built on prior studies, including a 2010 feasibility study of light transit sponsored by the Gwinnett Place and Gwinnett Village CIDs. Federal funding for transit requires an AA as the first step in becoming eligible for support. In the next phase of study, impacts, right-of-way needs, costs and additional trade-offs will need to be understood, in addition to coordinating investment dollars.
Evidence of transit supporting development in Gwinnett found along the I-85 corridor:
• The population along the corridor grew nearly 20% between 2000 and 2010, and Gwinnett employment continues to concentrate along it.
• Since 2005, 19 Developments of Regional Impact (DRI’s) completed along I-85.
• Jacoby Development has proposed and secured tenant deals for the largest film and media complex outside of California. The Atlanta Media Campus and Studios project will sit on 107 acres and include a movie studio, film school, a hotel, 1,000 residential units, up to 2 million square feet of office, and 200,000 square feet retail and other commercial.
The study screened a variety of options and evaluated three scenarios: no-build (do nothing); streetcar, and; bus-rapid-transit (BRT). BRT means a transit system based on high-quality, enhanced (fast) bus system that interfaces with rail. The qualities of the two new technologies examined include:
• BRT Alternative: introduce a new premium transit service, including modern 60-foot articulated BRT vehicles, significantly upgraded passenger facilities, and curb-to-curb roadway reconstruction to facilitate bus movement and to promote traffic and pedestrian safety along the corridor. The corridor would also include a signal priority system, which would give transit vehicles (either bus or rail) better timed, longer green phases at traffic signals. The service span for the BRT Alternative is 10 minutes weekday peak periods; 15 minutes the rest of the service day, except 30 minute headways from 8:30 p.m. to 11:30 p.m.; 30 minute headways Saturdays and Sundays. The background bus system would be significantly modified to support the new BRT service. The proposed BRT route from the AA study is seen in Figure 28.
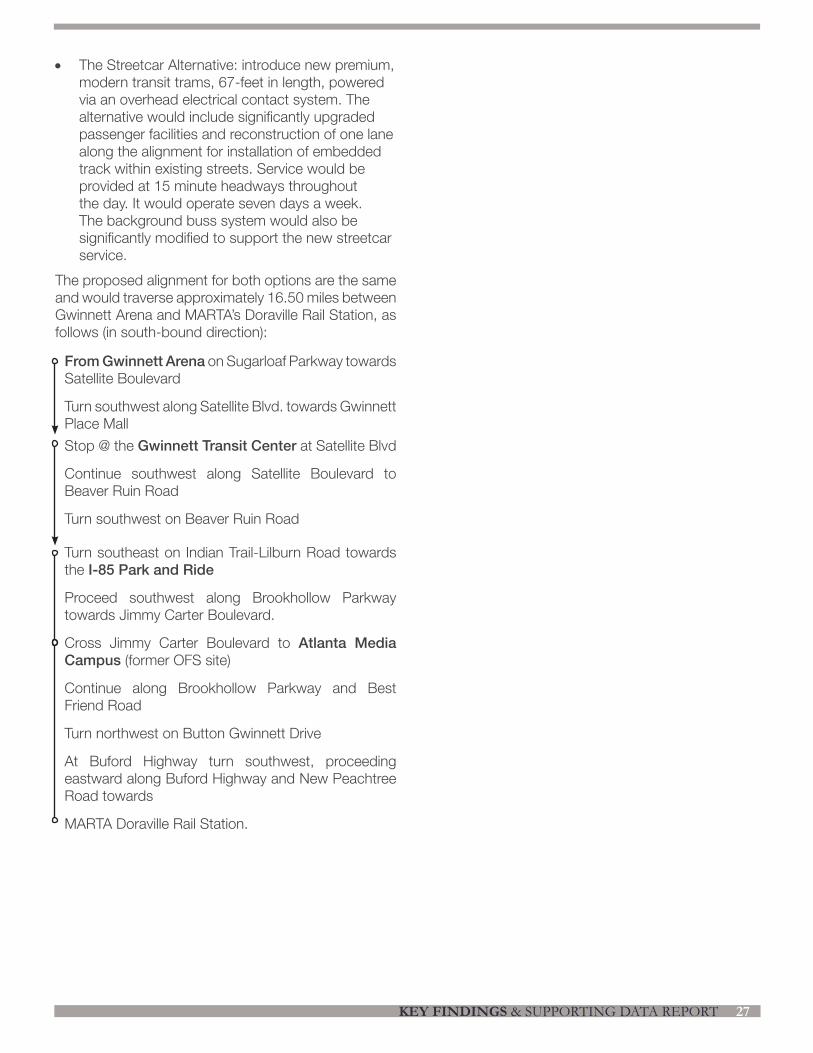
KEY FINDINGS & SUPPORTING DATA REPORT 27
The proposed alignment for both options are the same and would traverse approximately 16.50 miles between Gwinnett Arena and MARTA’s Doraville Rail Station, as follows (in south-bound direction):
• The Streetcar Alternative: introduce new premium, modern transit trams, 67-feet in length, powered via an overhead electrical contact system. The alternative would include significantly upgraded passenger facilities and reconstruction of one lane along the alignment for installation of embedded track within existing streets. Service would be provided at 15 minute headways throughout the day. It would operate seven days a week. The background buss system would also be significantly modified to support the new streetcar service.
From Gwinnett Arena on Sugarloaf Parkway towards Satellite Boulevard
Turn southwest along Satellite Blvd. towards Gwinnett Place Mall
Stop @ the Gwinnett Transit Center at Satellite Blvd
Continue southwest along Satellite Boulevard to Beaver Ruin Road
Turn southwest on Beaver Ruin Road
Turn southeast on Indian Trail-Lilburn Road towards the I-85 Park and Ride
Proceed southwest along Brookhollow Parkway towards Jimmy Carter Boulevard.
Cross Jimmy Carter Boulevard to Atlanta Media Campus (former OFS site)
Continue along Brookhollow Parkway and Best Friend Road
Turn northwest on Button Gwinnett Drive
At Buford Highway turn southwest, proceeding eastward along Buford Highway and New Peachtree Road towards
MARTA Doraville Rail Station.
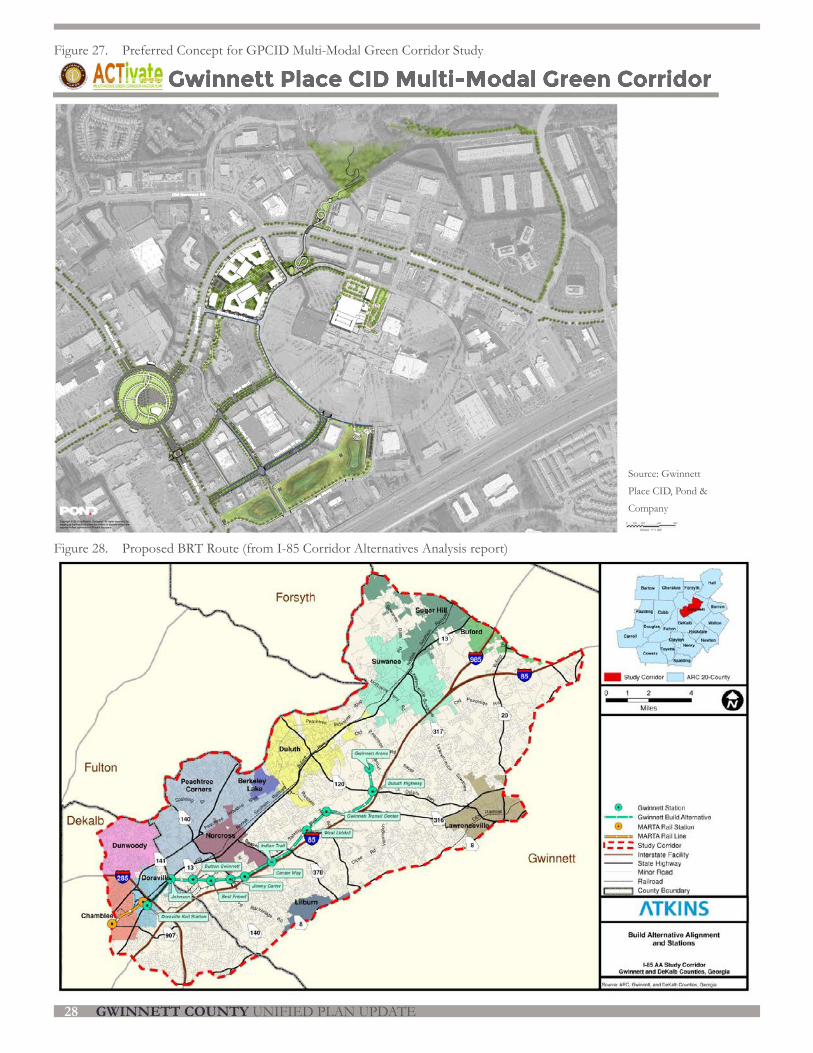
GWINNETT COUNTY UNIFIED PLAN UPDATE28
Gwinnett Place CID Multi-Modal Green Corridor
Satellite Blvd
Pleasant Hill R
d.
Pleasant Hill R
d.
Market Street
Mall Blvd.
Gwinnett Pl D
r.
Venture Pkwy
Merchants Way
Sat
elli
te B
lvd
Ring Rd.
Ring Rd.
Old Norcross Rd.
Source: Gwinnett
Place CID, Pond &
Company
Figure 27. Preferred Concept for GPCID Multi-Modal Green Corridor Study
Figure 28. Proposed BRT Route (from I-85 Corridor Alternatives Analysis report)
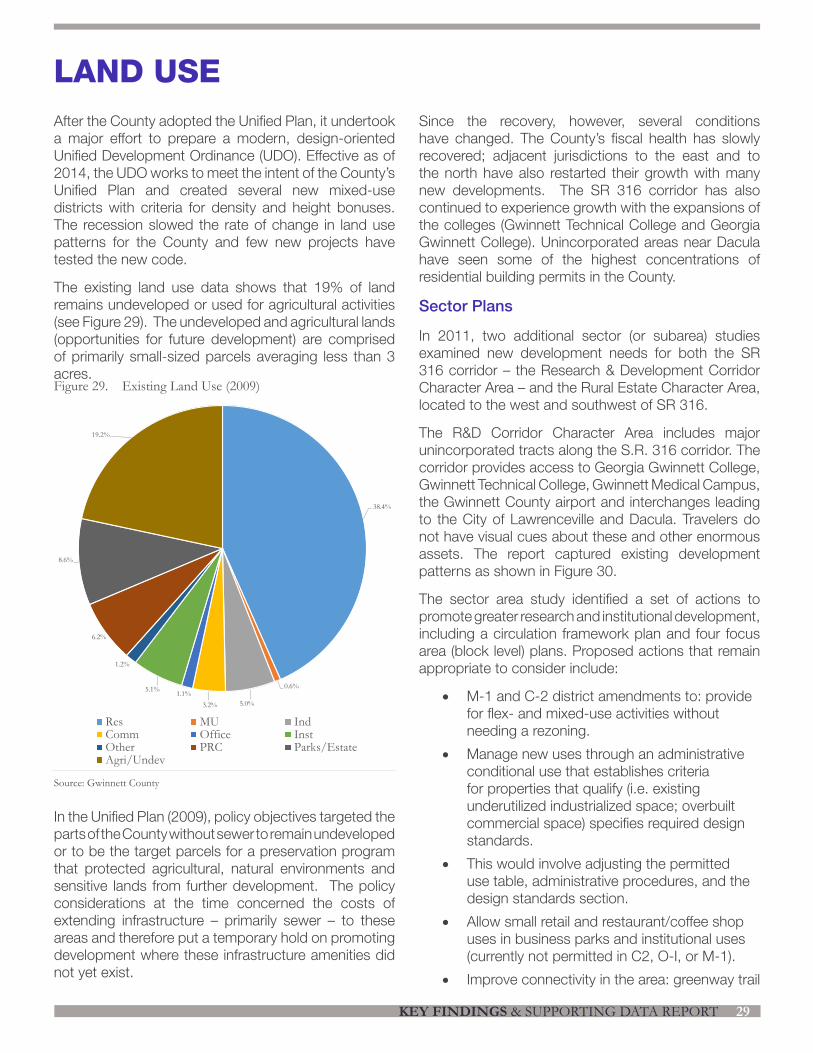
KEY FINDINGS & SUPPORTING DATA REPORT 29
After the County adopted the Unified Plan, it undertook a major effort to prepare a modern, design-oriented Unified Development Ordinance (UDO). Effective as of 2014, the UDO works to meet the intent of the County’s Unified Plan and created several new mixed-use districts with criteria for density and height bonuses. The recession slowed the rate of change in land use patterns for the County and few new projects have tested the new code.
The existing land use data shows that 19% of land remains undeveloped or used for agricultural activities (see Figure 29). The undeveloped and agricultural lands (opportunities for future development) are comprised of primarily small-sized parcels averaging less than 3 acres.
In the Unified Plan (2009), policy objectives targeted the parts of the County without sewer to remain undeveloped or to be the target parcels for a preservation program that protected agricultural, natural environments and sensitive lands from further development. The policy considerations at the time concerned the costs of extending infrastructure – primarily sewer – to these areas and therefore put a temporary hold on promoting development where these infrastructure amenities did not yet exist.
Since the recovery, however, several conditions have changed. The County’s fiscal health has slowly recovered; adjacent jurisdictions to the east and to the north have also restarted their growth with many new developments. The SR 316 corridor has also continued to experience growth with the expansions of the colleges (Gwinnett Technical College and Georgia Gwinnett College). Unincorporated areas near Dacula have seen some of the highest concentrations of residential building permits in the County.
Sector Plans
In 2011, two additional sector (or subarea) studies examined new development needs for both the SR 316 corridor – the Research & Development Corridor Character Area – and the Rural Estate Character Area, located to the west and southwest of SR 316.
The R&D Corridor Character Area includes major unincorporated tracts along the S.R. 316 corridor. The corridor provides access to Georgia Gwinnett College, Gwinnett Technical College, Gwinnett Medical Campus, the Gwinnett County airport and interchanges leading to the City of Lawrenceville and Dacula. Travelers do not have visual cues about these and other enormous assets. The report captured existing development patterns as shown in Figure 30.
The sector area study identified a set of actions to promote greater research and institutional development, including a circulation framework plan and four focus area (block level) plans. Proposed actions that remain appropriate to consider include:
• M-1 and C-2 district amendments to: provide for flex- and mixed-use activities without needing a rezoning.
• Manage new uses through an administrative conditional use that establishes criteria for properties that qualify (i.e. existing underutilized industrialized space; overbuilt commercial space) specifies required design standards.
• This would involve adjusting the permitted use table, administrative procedures, and the design standards section.
• Allow small retail and restaurant/coffee shop uses in business parks and institutional uses (currently not permitted in C2, O-I, or M-1).
• Improve connectivity in the area: greenway trail
LAND USE
Figure 29. Existing Land Use (2009)
Source: Gwinnett County
38.4%
0.6%
5.0%3.2%1.1%5.1%
1.2%
6.2%
8.6%
19.2%
Gwinnett County Existing Land Use (2009)
Res MU IndComm Office InstOther PRC Parks/EstateAgri/Undev
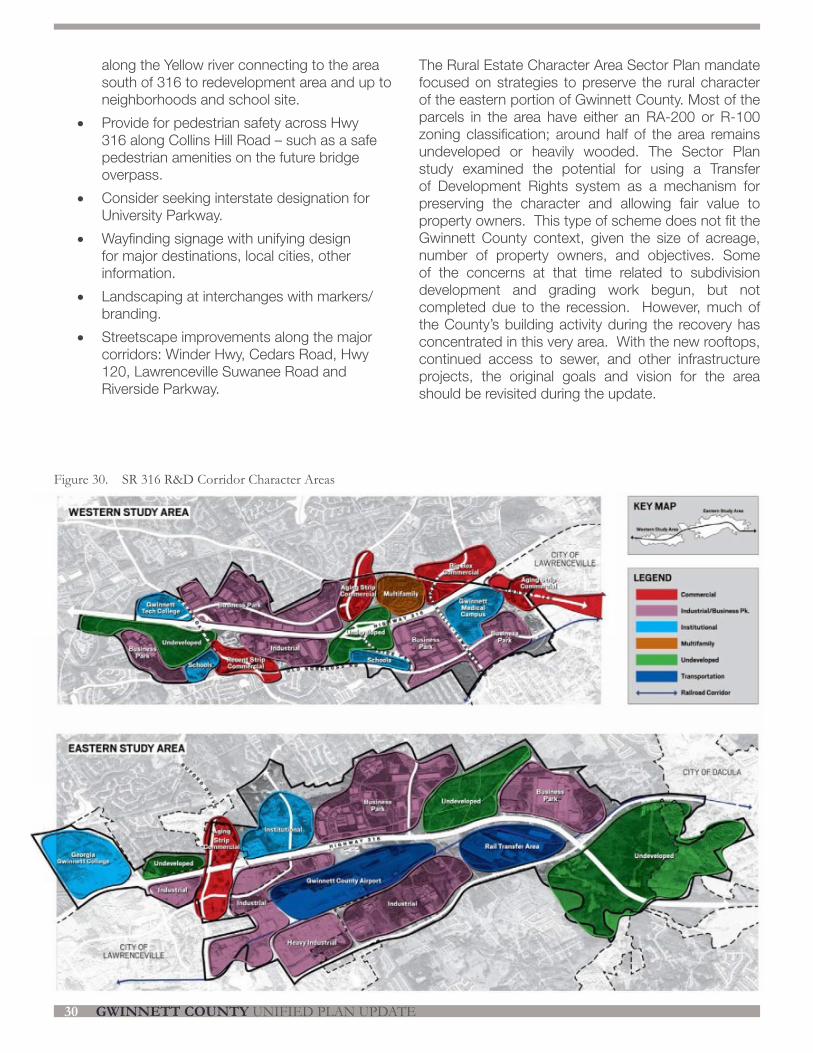
GWINNETT COUNTY UNIFIED PLAN UPDATE30
along the Yellow river connecting to the area south of 316 to redevelopment area and up to neighborhoods and school site.
• Provide for pedestrian safety across Hwy 316 along Collins Hill Road – such as a safe pedestrian amenities on the future bridge overpass.
• Consider seeking interstate designation for University Parkway.
• Wayfinding signage with unifying design for major destinations, local cities, other information.
• Landscaping at interchanges with markers/branding.
• Streetscape improvements along the major corridors: Winder Hwy, Cedars Road, Hwy 120, Lawrenceville Suwanee Road and Riverside Parkway.
The Rural Estate Character Area Sector Plan mandate focused on strategies to preserve the rural character of the eastern portion of Gwinnett County. Most of the parcels in the area have either an RA-200 or R-100 zoning classification; around half of the area remains undeveloped or heavily wooded. The Sector Plan study examined the potential for using a Transfer of Development Rights system as a mechanism for preserving the character and allowing fair value to property owners. This type of scheme does not fit the Gwinnett County context, given the size of acreage, number of property owners, and objectives. Some of the concerns at that time related to subdivision development and grading work begun, but not completed due to the recession. However, much of the County’s building activity during the recovery has concentrated in this very area. With the new rooftops, continued access to sewer, and other infrastructure projects, the original goals and vision for the area should be revisited during the update.
Figure 30. SR 316 R&D Corridor Character Areas
KEY FINDINGS & SUPPORTING DATA REPORT 31
Land Development Changes
The Unified Plan (2009) also identified the I-85 Corridor as an engine for continued growth in the County.
Significant transportation investments have been made along the I-85 Corridor, including the two major interchange bridge improvements at Jimmy Carter Boulevard and further north at Pleasant Hill, both utilizing the diverging diamond design. The major vacant site known as the “OFS” moves closer to redevelopment with the plans for the Atlanta Media Campus & Studios. This 107 acre, mixed-use development will host the largest film and television media complex outside of California. The Campus includes a 460,000-square-foot movie studio, a large hotel, and 2.2-million square feet of office space, 298,870 square feet for a film school, a 310-room hotel and more than 1,000 multifamily units, up to 2.2 million square feet of office space and almost 200,000 square feet of stores and restaurants. It could transform the area and impact surrounding land use, property values and transportation.
The GPCID, in collaboration with Gwinnett County, the Atlanta Regional Commission and the National Association of Realtors, undertook a master plan effort to further specify the vision from the Greater Gwinnett Place LCI. The master plan identifies three “big moves” to improve connectivity, transit, and pedestrian and bicycle traffic through the area. The GPCID has moved forward with the next stage of feasibility analysis required for the proposed alignment of a new trail and pedestrian crossing to link with McDaniel Farm and a bold intersection improvement that can transform the area into a distinctive destination.