GVSOS: A NEW CLIENT FOR OGC® SOS INTERFACE STANDARD
81
i GVSOS: A NEW CLIENT FOR OGC® SOS INTERFACE STANDARD Alain Tamayo Fong
Transcript of GVSOS: A NEW CLIENT FOR OGC® SOS INTERFACE STANDARD

i
GVSOS: A NEW CLIENT FOR OGC® SOS INTERFACESTANDARD
Alain Tamayo Fong

ii
GVSOS: A NEW CLIENT FOR OGC® SOS INTERFACE
STANDARD
Dissertation supervised by
PhD Joaquín Huerta
PhD Fernando Bacao
Laura Díaz
March, 2009

iii
ACKNOWLEDGEMENTS
I would like to thank to professors Joaquin Huerta and Michael Gould for their support
during every step of the Master Degree Program. I would also like to thanks the Erasmus
Mundus Scholarship program for giving me the chance to be part of this wonderful
experience. Last, to all my colleagues and friends, thank you for making this time together so
pleasant.

iv
GVSOS: A NEW CLIENT FOR OGC® SOS INTERFACE
STANDARD
ABSTRACT
The popularity of sensor networks has increased very fast recently. A major problem with
these networks is achieving interoperability between different networks which are
potentially built using different platforms. OGC’s specifications allow clients to access
geospatial data without knowing the details about how this data is gathered or stored.
Currently OGC is working on an initiative called Sensor Web Enablement (SWE), for
specifying interoperability interfaces and metadata encodings that enable real‐time
integration of heterogeneous sensor webs into the information infrastructure. In this work
we present the implementation of gvSOS, a new module for the GIS gvSIG to connect to
Sensor Observation Services (SOS). The SOS client module allows gvSIG users to interact
with SOS servers, displaying the information gathered by sensors in a layer composed by
features. We present the detailed software engineering development process followed to
build the module. For each step of the process we specify the main obstacles found during
the development such as, restrictions of the gvSIG architecture, inaccuracies in the OGC’s
specifications, and a set of common problems found in current SOS servers implementations
available on the Internet.

v
KEYWORDS
GIS Applications
Sensor Web Enablement
OGC SOS specification
gvSIG extensions
Software Engineering

vi
ACRONYMS
OGC – Open Geospatial Consortium
SOA ‐ Service‐Oriented Architecture
GIS – Geographic Information System
WMS ‐ Web Map Service
WCS ‐ Web Coverage Service
WFS ‐ Web Feature Service
SWE ‐ Sensor Web Enablement
O&M ‐ Observation & Measurement
SOS ‐ Sensor Observations Service
SPS ‐ Sensor Planning Service
SAS ‐ Sensor Alert Service
WNS ‐ Web Notification Service
ADC ‐ Analog to Digital Converter
SIVAM ‐ System for the Vigilance of the Amazon
XML ‐ Extensible Markup Language
GML – Geography Markup Language
GPL ‐ GNU General Public License
MDI ‐ Multiple Documents Interface
JTS – Java Topology Suite
OWS – OGC Web Services
UML‐ Unified Modelling Language

vii
INDEX
Index of Figures __________________________________________________ ix
1. Introduction____________________________________________________ 1
2. State of the Art__________________________________________________ 5
2.1 Sensor Networks __________________________________________________________5 2.1.1 Sensor Nodes __________________________________________________________7 2.1.2 Applications___________________________________________________________8
2.2 Sensor Web Enablement __________________________________________________11 2.2.1 Services and Encodings _________________________________________________12 2.2.2 Typical workflows_____________________________________________________14 2.2.2 SWE Common________________________________________________________17 2.2.3 O&M implementation specification _______________________________________17 2.2.4 SensorML implementation Specification ___________________________________20 2.2.5 SOS implementation Specification ________________________________________22
2.3 Known SWE implementations______________________________________________23 2.3.1 52° North’s SWE implementation _________________________________________24 2.3.2 UAH VAST’s SWE implementation_______________________________________24
2.4 Some projects using SWE _________________________________________________25
2.5 Summary _______________________________________________________________26
3. gvSIG ________________________________________________________ 27
3.1. Architecture ____________________________________________________________27 3.1.1 The gvSIG Subsystem __________________________________________________29 3.1.2 The Fmap Subsystem___________________________________________________30 3.1.3 The Subdriver Subsystem _______________________________________________32 3.1.4 Andami _____________________________________________________________33

viii
3.2. Plug-in and Extensions ___________________________________________________35 3.2.1 Extensions ___________________________________________________________35
3.3. gvSIG Mobile ___________________________________________________________37
3.4. Supporting Libraries _____________________________________________________37
3.5. Summary_______________________________________________________________39
4. Analysis ______________________________________________________ 40
4.1 Plug-in Requirements _____________________________________________________40
4.1 Use case model___________________________________________________________41
4.2 High Level Architecture ___________________________________________________42
4.3 Summary _______________________________________________________________43
5. Design and Implementation______________________________________ 44
5.1 gvSIG layer _____________________________________________________________44
5.2 Fmap layer______________________________________________________________46
5.3 SubDriver layer__________________________________________________________48
5.4 Initialize extension _______________________________________________________51
5.5 Add SOS Layer __________________________________________________________52 5.5.1 gvSIG layer __________________________________________________________53 5.5.2 Fmap and Remote Services layers_________________________________________54
5.6 Showing sensors and observations data ______________________________________57
5.7 Tests and Preliminary Results ______________________________________________59
5.8 Summary _______________________________________________________________61
6. Conclusions ___________________________________________________ 62
References ______________________________________________________ 63

ix
INDEX OF FIGURES
Figure 1: Generic architecture of sensor networks (Akyildiz et al., 2002) 5
Figure 2: Components of a sensor node. Adapted form (Akyildiz et al., 2002) 8
Figure 3: SWE framework context (OGC, 2008) 13
Figure 4: SOS client requesting observation’s data from a server (OGC, 2008) 15
Figure 5: SOS client accessing streaming data from the source (OGC, 2008) 16
Figure 6: SOS client accessing sensor’s data from a server (OGC, 2008) 16
Figure 7: Basic Observation Model (OGC, 2007) 18
Figure 8: Conceptual model for Processes (OGC, 2007b) 21
Figure 9: Functional components of gvSIG. 28
Figure 10: Component diagram of the gvSIG subsystem (gvSIG, 2008a) 29
Figure 11: Component diagram of the Fmap subsystem (gvSIG, 2008a) 31
Figure 12: Component diagram of the SubDriver subsystem(gvSIG, 2008a) 32
Figure 13: ANDAMI functional blocks (gvSIG, 2008a) 33
Figure 14: IExtension relationships (gvSIG, 2008a) 36
Figure 15: Use case diagram for gvSOS. 41
Figure 16: Package diagram showing the gvSOS architecture. 43
Figure 17: gvSIG‐SOS package diagram. 45
Figure 18: Class diagram showing SOSWizard and its relationships 46
Figure 19: Fmap‐SOS package diagram. 47
Figure 20: Fmap‐SOS class diagram. 47
Figure 21: Remote Services package diagram. 49
Figure 22: Class diagram of the RemoteServices‐SOS package. ________ 50
Figure 23: gvSOS configuration file (config.xml). 52
Figure 24: Diagram showing how connection is established at the user interface level. 53
Figure 25: Sequence diagram showing the layer creation process. _______54
Figure 26: Sequence diag. showing how connection is established at the driver level. 55

x
Figure 27: Sequence diag. showing how information regarding procedures is read. 56
Figure 28: Sensor systems located in four Mediterranean harbours. 56
Figure 29: Table containing the information about the sensors included in the view. 57
Figure 30: Sequence diagram showing how observations are read from the server. 58
Figure 31: Table showing observation times and values. 58
Figure 32: Displaying observations on a graph. 59

1
1
INTRODUCTION
The popularity of sensor networks has increased very quickly. The production of sensors
that become cheaper every day is possible due to continuous advances in semiconductor
technology. At present, a low‐cost processor, a group of sensors and a radio transmitter, can
be easily combined in a single and inexpensive unit. These devices, although useful
individually, offer maximum effectiveness when used together for sensing complex physical
phenomena. Sensor nodes can be distributed inside a particular phenomenon or in its
neighbourhood to measure its main properties. Sensor networks can be used in a wide
variety of applications. Examples include environmental monitoring (Martinez et al., 2004),
habitat monitoring (Mainwaring et al., 2002)(Szewczyk et al., 2004), structural health
monitoring (Paek et al.,2005)(Chintalapudi et al., 2006), seismic detection (Werner‐Allen et
al., 2005) (Werner‐Allen et al., 2006) and military surveillance.
Sensor networks can be implemented using a large range of technologies regarding
sensors and communication devices. Many design aspects must be considered such as fault
tolerance, scalability, production costs, operating environment, network topology, hardware
constraints, transmission media and power consumption (Akyildiz et al., 2002). For these
reasons, building such networks is not a trivial task. Apart from dealing with the inherent
complexity of a single network, another problem is achieving interoperability between
different networks that are potentially built using different software and hardware
technologies. Consider the problem of different government agencies trying to integrate
their data sources to build a unified model of the environment. Each agency might gather
their data using sensors that cannot interoperate with devices from other agencies because
they were deployed by different companies using their own communication protocols. The

CHAPTER 1. INTRODUCTION 2
gathered data might also be stored using different formats because interoperability was not
a primary goal when the system was built.
Over the last few years, a lot of work has been devoted to standardise the components
and interfaces, including hardware and software interfaces, composing sensor networks.
This standardisation simplifies the interoperability between the components inside a specific
network, which we call internal interoperability, and the interoperability of different clients
with different networks, which we call external interoperability. The latter is frequently
achieved using a Service‐Oriented Architecture (SOA). This architecture presents an
approach for building distributed systems that deliver application functionality as services
to either end‐user applications or other services (Endrei et al, 2004). Some of the benefits of
SOS are the reuse of existing software assets just by wrapping them up as services, the
minimization of the impact of future changes because they focus on an interface and not in
the implementation, and the possibility of composing existing services to build new ones
(Endrei et al, 2004).
This architecture is widely used in the GIS field to access geospatial data through
implementation specifications like: Web Map Service Implementation Specification (WMS)
(OGC, 2006a), Web Coverage Service Interface Implementation Specification (WCS) (OGC,
2006) and Web Feature Service Implementation Specification (WFS) (OGC, 2005). These
specifications maintained by the Open Geospatial Consortium (OGC) allow GIS clients to
access geospatial data without knowing details about how this data is gathered or stored.
The use of standard specifications addresses the following needs of the GIS community
(OGC, 2005b):
• To share and reuse data in order to decrease costs (avoid redundant data
collection), get more or better information, and increase the value of data
holdings.
• To choose the best tool for the job, and the related need of reducing technology
and procurement risk (i.e., the need to avoid being locked‐in to one vendor).
• To allow people with less training to benefit from using geospatial data in more
applications: That is, the need to leverage investments in software and data.

CHAPTER 1. INTRODUCTION 3
At present, OGC is working on an initiative called Sensor Web Enablement (SWE), for
“specifying interoperability interfaces and metadata encodings that enable real time
integration of heterogeneous sensor webs into the information infrastructure. Developers
will use these specifications to create applications, platforms, and products involving Web‐
connected devices such as flood gauges, air pollution monitors, stress gauges on bridges,
mobile heart monitors, Webcams, and robots as well as space and airborne earth imaging
devices” (OGC, 2008b). This framework should allow sensor nodes and their corresponding
sensor networks to be monitored and controlled through web interfaces using GIS clients.
SWE includes several implementation specifications and best practices papers. Each one
of them addresses a specific area within the topic. They can be divided in two groups:
specifications dealing with schemata of data and processes, and specifications of services. In
the first category we can find the following specifications (OGC, 2008): Observation &
Measurement (O&M) Schema (OGC, 2007), Sensor Model Language (SensorML) (OGC,
2007b) and Transducer Markup Language (TransducerML or TML) (OGC, 2007d). In the
second category we can find four different services: Sensor Observations Service (SOS)
(OGC, 2007g), Sensor Planning Service (SPS) (OGC, 2007c), Sensor Alert Service (SAS) (OGC,
2007a) and Web Notification Services (WNS) (OGC, 2007e).
The goal of this project is to implement an extension for the GIS client gvSIG (gvSIG, 2008)
to connect to Sensor Observation Services providers. gvSIG is an open source GIS designed
for managing geographic information. This tool provides support for common data formats,
including vector and raster spatial data, remote spatial databases, and standard OGC web
services. gvSIG allows the combination in a single view of geospatial data with different
formats and coming from different sources. Its name is an abbreviation of ”Generalitat
Valenciana, Sistema dʹInformació Geográfica”.
A gvSIG extension is a software component that can be installed to a client to add new
functionality. In this case, the SOS client extension allows gvSIG users to interact with SOS
servers displaying the information gathered by sensors in a layer composed by features.
With this extension, the community of gvSIG users is able to access these networks without
depending on any proprietary software or any specific internal protocols used by the
underlying networks. The project is a joint effort between the University Jaume I, the

CHAPTER 1. INTRODUCTION 4
software company Prodevelop, and independent developers. Our role in the project is
implementing the communication and user interface layers, although the whole extension
architecture is presented here.
The rest of this document is structured as follows: Chapter 2 presents an introduction to
the sensor networks topic. The chapter presents basic concepts and some general
information about these networks, but it focuses mainly in the current OGC standards
related with SWE. Chapter 3 introduces gvSIG, presenting its architecture and extension
mechanisms. Chapters 4 and 5, present the analysis, design and implementation of the SOS
client. Finally, Chapter 6 presents conclusions of our work.

5
2
STATE OF THE ART
In this chapter, we present a general introduction to the topic of sensor networks. First,
the main concepts of the subject are presented. After that, a set of applications examples is
shown. Last, an extensive introduction to the SWE framework is presented, especially to the
Sensor Observation Service implementation specification.
2.1 Sensor Networks
Sensors are devices for the measurement of physical quantities (OGC, 2007b). A sensor
network can be described as a collection of sensor nodes that coordinate to perform some
specific action. The sensors nodes form a computer accessible network of many, spatially
distributed, devices to monitor conditions at different locations (OGC, 2007g). Figure 1
shows a generic architecture of such networks taken from (Akyildiz et al., 2002).
Fig. 1: Generic architecture of sensor networks

CHAPTER 2. STATE OF THE ART 6
Sensor nodes are located in the sensor field. These nodes collect and route data about the
field to the sink, which make the data available to the end user over the communication
network (e.g. Internet).
Sensor networks provide several advantages when compared with traditional sensor
platforms (Akyildiz et al., 2002) (Rentala et al, 2001):
• Sensors can be easily deployed “within” the actual phenomenon in an ad‐hoc
manner.
• Sensors have (limited) processing capabilities to pre‐process the gathered data.
Traditional models usually performed all the processing on central nodes in
charge of gathering the raw data from the sensors.
• Greater fault tolerance is provided through redundancy.
• Coverage of large areas is provided through the union of individual nodes
coverage area
• Sensors can be deployed in areas without energy infrastructure.
Sensor networks present different operational and technical characteristics than ad‐hoc
and cellular networks, in which the main goal is to optimize Quality of Service (QoS) and
high bandwidth efficiency. On the other hand, the main goal in a sensor network is to
maximize the network lifetime focusing mostly on power conservation. Next, we mention
some of the differences between these networks (Akyildiz et al., 2002)(Rentala et al, 2001):
• The network is composed by hundreds to thousands of nodes that are densely
deployed.
• The position of sensor nodes need not be engineered or pre‐determined implying
that the network must present self‐organizing capabilities.
• The network topology may change frequently because of mobile nodes, defective
nodes, new added nodes, or changes in the environment.
• Designed for unattended operation; the network must work without human
intervention maybe because it might be located in inaccessible or hostile areas.
• The sensor nodes are not usually connected to an energy source, so energy must
be used optimally.

CHAPTER 2. STATE OF THE ART 7
• Sensors are prone to failure. The network must be fault tolerant; its overall
functioning should not be compromised by the failure of individual nodes.
• Sensor nodes use mainly broadcast communication
• Sensors have limited computational capacities and memory. However, they
partially process raw data to minimize communication which is the most energy
consuming operation (Culler et al, 2004).
2.1.1 Sensor Nodes
A sensor node must satisfy the following requirements (Vieira et al., 2003):
• Energy‐efficiency: Energy is the major resource. It determines the node lifetime.
• Low‐cost: A node must be low‐cost to keep a network with hundreds or thousand
cost‐effective.
• Wireless: usually an installed communication infrastructure is not available.
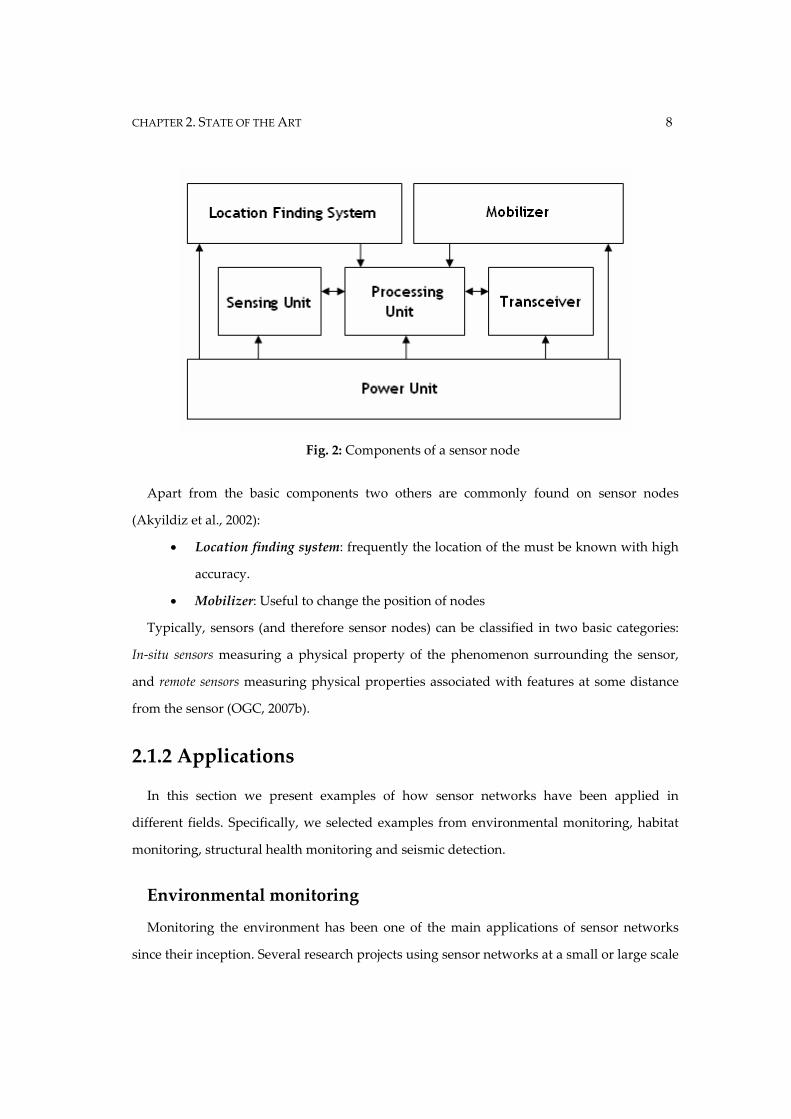
It is composed of the following main components (Akyildiz et al., 2002) (Vieira et al.,
2003):
• Sensing unit: usually formed by sensors and analog to digital converters (ADC).
Sensors estimate the values of observed properties and produce analog signals.
These analog signals are converted to a digital one by the ADCs and sent to the
processing unit.
• Processing Unit: it is composed of a microcontroller and memory to store data
and applications programs. The processing unit executes procedures for
gathering the data read by sensors and in some cases it pre‐processes the data
before sending it to the sink.
• Transceiver unit: connects the node to the network. Possible choices of
transmission technologies are optical, infrared and radio frequency
communication. Most of the platforms use short‐range radio.
• Power unit: usually rechargeable or non‐rechargeable batteries.
CHAPTER 2. STATE OF THE ART 8
Fig. 2: Components of a sensor node
Apart from the basic components two others are commonly found on sensor nodes
(Akyildiz et al., 2002):
• Location finding system: frequently the location of the must be known with high
accuracy.
• Mobilizer: Useful to change the position of nodes
Typically, sensors (and therefore sensor nodes) can be classified in two basic categories:
In‐situ sensors measuring a physical property of the phenomenon surrounding the sensor,
and remote sensors measuring physical properties associated with features at some distance
from the sensor (OGC, 2007b).
2.1.2 Applications
In this section we present examples of how sensor networks have been applied in
different fields. Specifically, we selected examples from environmental monitoring, habitat
monitoring, structural health monitoring and seismic detection.
Environmental monitoring
Monitoring the environment has been one of the main applications of sensor networks
since their inception. Several research projects using sensor networks at a small or large scale

CHAPTER 2. STATE OF THE ART 9
have been developed. In (Martinez et al., 2004) a system for monitoring a glacial
environment is presented. The system’s aim was to record the behaviour of ice caps and
glaciers over a reasonable geographic area and over a relatively long time in an autonomous
way. (Tolle et al.,2005) presents a study of complex spatial variations and temporal
dynamics of the microclimate surrounding a coastal redwood tree. A sensor network was
deployed where each sensor was able to measure air temperature, relative humidity, and
photosynthetically active solar radiation.
The FLOODNET project (Envisense, 2008) uses sensor network for flood warning. The
network nodes adapts dynamically in presence of environmental or infrastructural
circumstances. The SECOAS project uses smart sensors to measure sea bed movement. The
sensors are capable of dynamic self‐configuration and use decentralized algorithms that
enable automated adaptation to failures, upgrades and requirement changes (Envisense,
2008b).
As an example of a large scale network for environmental monitoring we can mention the
System for the Vigilance of the Amazon (SIVAM). SIVAM is a project including a network of
surveillance radars, environmental sensors, communications systems, an air traffic control
centre, and coordination centres scattered throughout a the Brazilian Amazon region
(Jensen, 2002).
Habitat Monitoring
Another field with many sensor networks applications is habitat monitoring. The
characteristics of sensor networks make them specially well‐suited for this kind of
application. They can be inserted into the observed habitat without altering the parameters
to be measured. Thanks to the wireless technology used commonly in these networks the
behaviour of subjects can be studied without intrusions by observers. Last, the health and
status of the instrumentation can be monitored remotely (Szewczyk et al., 2004). Maybe the
best known example in this field is the study of sea birds at Great Duck Island, Maine
(Szewczyk et al., 2004)(Mainwaring et al., 2002)(Szewczyk et al., 2004a). In this project, the
occupancy of small, underground nesting burrows and the role of micro‐climatic factors in
their habitat selection were measured. Another example in this field is presented in (Zhang

CHAPTER 2. STATE OF THE ART 10
et al., 2004) where a wireless sensor network is used for studying how the number of
location of microorganisms is correlated with chemical and physical parameters in the
marine environment.
Seismic detection
Volcanoes are studied for predicting possible eruptions, measuring the level of volcano
unrest or just to understand physical processes occurring inside the volcano (Werner‐Allen
et al., 2006a). The seismometer is the most commonly used instrument when studying
volcanoes. It measures round‐propagating elastic radiation from both sources internal to the
volcano (e.g., fracture induced by pressurization) and on the surface (e.g., expansion of gases
during an eruption) (McNutt, 1996).
In (Werner‐Allen et al., 2006) a wireless network for monitoring volcanic eruptions at the
Tungurahua volcano in Ecuador is presented. This network was built using low frequency
acoustic sensor for collecting infrasonic signal that were transmitted to a remote base station.
In (Werner‐Allen et al., 2006a) a sensor network was deployed at the Reventador volcano in
Ecuador. Network nodes used an event‐detection algorithm to trigger on interesting
volcanic activity and initiate reliable data transfer to the base station.
A large scale project in this field is being carried out by Jet Propulsion Laboratory,
California Institute of Technology. The Sensor Web Project uses a network of sensors linked
by software and the internet to an autonomous satellite observation response facility. This
system has been used to implement a global surveillance program to study volcanoes. Tests
to study flooding, cryosphere events, and atmospheric phenomena have been also executed
(NASA, 2008) (Chien at al., 2007) (Sherwood&Chien, 2007).
Structure Health Monitoring
Structure Health monitoring (SHM) is focused in assessing integrity in a variety of
structure such as buildings or bridges. Different techniques are used to detect and locate
damages in the structures. These techniques rely on measuring structural response to
ambient vibrations or forced excitation. Ambient vibrations can be caused by earthquakes,
wind, or passing vehicles, and forced vibrations can be delivered by hydraulic or

CHAPTER 2. STATE OF THE ART 11
piezoelectric shakers. The existence and location of damage can be inferred by detecting
differences in local or global structural response before and after damage (Chintalapudi et
al., 2006). According to (Paek et al.,2005) most existing implementations use wired data
acquisition systems to collect structural vibration data from various locations in the
structure. The installation of a large scale system of this kind can be a very time consuming
and expensive task. For these reasons, the use of sensor networks is considered a more
appropriate solution.
In (Chintalapudi et al., 2006) the design of NETSHM is described. NETSHM is a
programmable, re‐usable and evolvable sensor network system that can be used to
implement a variety of structural monitoring techniques. The system implements
programming abstractions that allow structural engineers to use it without knowing low
level details about the network details. (Paek et al.,2005) presents Wisdem, a system
consisting of wireless nodes, placed at various locations on a large structure, to collect and
transmit time‐synchronized structural vibration data to a base‐station. Each Wisden node
measures structural vibrations with the help of a vibration card specifically designed for
high quality low‐power vibration sensing
2.2 Sensor Web Enablement
Despite the large number of existing sensor networks deployed, most of them remained
traditionally close to certain sensor communities offering limited mechanisms for
interoperability. Sensors within these communities are not easily discovered, accessed or
tasked. Each type of sensor usually uses its own metadata, its own data format and its own
software. Hence, the extension and modification of networks containing them is restricted at
a serious degree (OGC, 2008). The OGC’s1 Sensor Web Enablement (SWE) initiative is a
framework that specifies interfaces and metadata encodings to enable real time integration
1 The Open Geospatial Consortium, Inc (OGC) is an international industry consortium of
368 companies, government agencies and universities participating in a consensus process to
develop publicly available interface specifications (OGC, 2009).

CHAPTER 2. STATE OF THE ART 12
of heterogeneous sensor webs into the information infrastructure. It provides services and
encodings to enable the creation of web‐accessible sensor assets (OGC, 2008b). According to
(OGC, 2007g) the models, encodings, and services of the SWE architecture enable
implementation of interoperable and scalable service‐oriented networks of heterogeneous
sensor systems and client applications. The functionality implemented in SWE must allow
the implementation of solutions capable of:
• Discovery of sensor systems, observations, and observation processes that meet
an application’s or user’s immediate needs;
• Determination of a sensor’s capabilities and quality of measurements;
• Access to sensor parameters that automatically allow software to process and geo‐
locate observations;
• Retrieval of real‐time or time‐series observations and coverages in standard
encodings
• Tasking of sensors to acquire observations of interest;
• Subscription to and publishing of alerts to be issued by sensors or sensor services
based upon certain criteria.
Figure 3 shows the role of SWE in an information infrastructure. SWE acts like a
middleware between the physical sensor networks and the software clients operated by final
users. It can also be seen in this figure that the term “sensor” is not only applied to physical
sensors but can be also applied to observation archives, simulations, and observation
processing algorithms (OGC, 2008).
2.2.1 Services and Encodings
SWE includes several implementation specifications and best practices papers defining
services and encodings. Implementation specifications for encodings are (OGC, 2007g):
• Observation & Measurement Schema (O&M): It defines standard models and XML
schemata for encoding observations and measurements from a sensor, both archived
and real‐time. (OGC, 2007).

CHAPTER 2. STATE OF THE ART 13
Fig. 3: SWE framework context (OGC, 2008)
• Sensor Model Language (SensorML): It defines standard models and XML schemata
for describing sensors systems and processes; provides information needed for
discovery of sensors, location of sensor observations, processing of low‐level sensor
observations, and listing of taskable properties (OGC, 2007b).
• Transducer Markup Language (TransducerML or TML): It defines the conceptual
model and XML schemata for describing transducers and supporting real‐time
streaming of data to and from sensor systems (OGC, 2007d).
Implementation specifications for services are (OGC, 2007g):
• Sensor Observations Service (SOS): Standard web service interface for requesting,
filtering, and retrieving observations and sensor system information. This is the
intermediary between a client and an observation repository or near real‐time sensor
channel. (OGC, 2007g).

CHAPTER 2. STATE OF THE ART 14
• Sensor Planning Service (SPS): Standard web service interface for requesting user‐
driven acquisitions and observations. This is the intermediary between a client and a
sensor collection management environment (OGC, 2007c).
Best practices papers specifying services are (OGC, 2007g):
• Sensor Alert Service (SAS): Standard web service interface for publishing and
subscribing to alerts from sensors (OGC, 2007a).
• Web Notification Services (WNS): Standard web service interface for asynchronous
delivery of messages or alerts from SAS and SPS web services and other elements of
service workflows (OGC, 2007e).
All these services and encodings working together enable Internet‐accessible sensors to be
accessed and possibly controlled via Web. The vision is the construction of the “Sensor
Web”, a collaborative, coherent, consistent, and consolidated sensor data collection, fusion,
and distribution system for monitoring spatio‐temporal phenomena appearing in the
physical environment in real time (OGC, 2008). XML encodings provides standard formats
for exchanging information regarding sensors. This information can be interpreted and used
by any client implementing the specification without knowing low‐level details of the actual
sensor network. The service specifications provide standard interfaces for exchanging the
aforementioned information, giving the users a broad set of tools for building sophisticated
systems.
From all the specifications only O&M, SensorML, and SOS are relevant for the work we
are presenting here. In subsequent sections they are explained in further detail.
2.2.2 Typical workflows
In this section we present some of the SWE typical workflows. A subset of the workflows
introduced in (OGC, 2008) is discussed below to illustrate the general functioning of the
SWE building blocks relevant to our work.

CHAPTER 2. STATE OF THE ART 15
Request of discrete observation data
Requesting discrete observation data is one of the most used functionalities provided by
SWE framework. Data about sensor observations is published by some data producer in a
SOS server. Then, SOS client connects to the server and reads some of this data. Figure 4
shows a sequence diagram illustrating this workflow. First, the client must send a
GetCapabilities request to the server to know for sure which data is published on it. After
that, the client sends a GetObservation request specifying the specific information to be
retrieved. The response to this request is a XML file in O&M format.
Fig. 4: SOS client requesting observation’s data from a server (OGC, 2008)
Request of streaming (out of band) observation data
Streaming data can be accessed through an SOS server in two ways: using the GetResult
SOS operation or by connecting directly to the real source using a hyperlink returned from
the server. In neither case the observation data is returned inline within the GetObservation
operation’s response. Figure 5 shows how this works when the information is read from the
source. First, the client must send a GetCapabilities request to the server. Next, the client
sends a GetObservation request specifying the specific information to be retrieved. The
response to this request includes a hyperlink to the data source, which is then accessed
directly from the client. In the other case for this scenario, after performing the GetCapabilities

CHAPTER 2. STATE OF THE ART 16
request, the client reads the information from the SOS server sending GetResult request in a
continuous way until all the data has been read.
Fig. 5: SOS client accessing streaming data from the source (OGC, 2008)
Access to Sensor Descriptions
Sensor descriptions in SensorML format can be accessed from the client in a similar way
as the observations (Figure 6). After doing the GetCapabilities request, a DescribeSensor
request is sent to the server specifying an identifier for the sensor we want information
about. The SensorML descriptions of every sensor were previously stored in some kind of
data storage associated to the SOS server.
Fig. 6: SOS client accessing sensor’s data from a server (OGC, 2008)

CHAPTER 2. STATE OF THE ART 17
2.2.2 SWE Common
All SWE schemata and services share common data types and data encodings defined in a
single namespace are called SWE Common. SWE Common provides data types and related
components that fall in the following categories (OGC, 2007b):
• Primitive data types, complementing those implemented in GML
• General purpose aggregate data types, including records, arrays, vectors and
matrices
• Aggregate data types with specialized semantics, including position, curve, and
time‐aggregates
• Standard encodings to add semantics, quality indication and constraints to both
primitive and aggregate types
• Specialized components to support semantic definitions, as required above
• A notation for the description of XML and non‐XML array encodings.
2.2.3 O&M implementation specification
As mentioned before O&M defines standard models and XML schemata for encoding
observations and measurements from a sensor, both archived and real‐time. Most of the
concepts included in this specification are defined in the following paragraph taken from
(OGC, 2007):
“An observation is an act associated with a discrete time instant or period through which a
number, term or other symbol is assigned to a phenomenon [FOW1998]. The phenomenon is
a property of an identifiable object, which is the feature of interest of the observation. The
observation uses a procedure, which is often an instrument or sensor [NRC1995] but may be a
process chain, human observer, an algorithm, a computation or simulator. The key idea is
that the observation result is an estimate of the value of some property of the feature of
interest, and the other observation properties provide context or metadata to support
evaluation, interpretation and use of the result.”2
2 The references included in the paragraph are the ones included in the original document.

CHAPTER 2. STATE OF THE ART 18
Fig. 7: Basic Observation Model (OGC, 2007)
In this paragraph the definitions for observation, property, feature of interest, procedure and
result in which the Observation Model is based are clearly stated. These definitions and their
relationships are shown in an UML diagram in Figure 7. As can be seen in the figure, an
Observation is related with:
• A feature of interest: feature of any type representing the real world object which
is the observation target. Note that as an Observation object can be related with a
single feature of interest, a feature of interest can be related to, or be the real
world object associated with, several Observation objects (OGC, 2007).
• An Observed property: identifies or describes the phenomenon for which a value
is measured or estimated. It must be a property associated with the type of the
feature of interest (OGC, 2007).

CHAPTER 2. STATE OF THE ART 19
• A procedure: description of a process used to generate the result. It must be
suitable for the observed property (OGC, 2007).
• A result: contains the value generated by the procedure. The type of the
observation result must be consistent with the observed property, and the scale
or scope for the value must be consistent with the quantity or category type
(OGC, 2007).
O&M defines several specializations of the generic observation. For single‐value
properties, the corresponding observation result is a scalar, or a record whose components
correspond to a thematic decomposition of the observed property. These properties ca be
modelled as (OGC, 2008) (OGC, 2007):
• CountObservation, if the result is an integer representing the count of the
observed property
• CategoryObservation, if the result is a textual value from a controlled vocabulary
• TruthObservation, if the result is a boolean value representing the truth value
(usually existence) of the observed property
• GeometryObservation, if the result is a geometry
• TemporalObservation, if the result is a temporal object
• ComplexObservation, if the result is a record representing a multi‐component
phenomenon
• Measurement, if the result is a Measure, i.e. the result is a value described using a
numeric amount with a scale or using a scalar reference system
If the values of the property vary over time and/or space, then the observation‐type is
modeled as discrete coverages of the following types (OGC, 2008) (OGC, 2007):
• PointCoverageObservation, if the result is a point coverage which samples prop‐
erties at points in the feature of interest,
• DiscreteCoverageObservation, if the result is a generalized discrete coverage
• TimeSeriesObservation, if the result is a time‐instant coverage which samples a
property of the feature of interest at different times

CHAPTER 2. STATE OF THE ART 20
• ElementCoverageObservation, if the result is a coverage whose domain elements
contain references to objects encoded elsewhere, which provide the sampling
geometry of the feature of interest
Finally, observations can be aggregated into Observation collections when certain
conditions of homogeneity for a group of observations exist, such as: having the same
feature of interest, the same sampling time and different observed properties; or having the
same feature of interest, the same observed property and different sampling time.
2.2.4 SensorML implementation Specification
SensorML defines standard models and XML schemata for describing sensors systems
and processes; provides information needed for discovery of sensors, location of sensor
observations, processing of low‐level sensor observations, and listing of taskable properties
(OGC, 2007b). This language, although an important component of SWE can be used
independently to describe any sensor system, as well as the processes that might be
associated with it. According to (OGC, 2007b), the purposes of SensorML are to:
• Provide descriptions of sensors and sensor systems for inventory management
• Provide sensor and process information in support of resource and observation
discovery
• Support the processing and analysis of the sensor observations
• Support the geolocation of observed values (measured data)
• Provide performance characteristics (e.g., accuracy, threshold, etc.)
• Provide an explicit description of the process by which an observation was
obtained (i.e., it’s lineage)
• Provide an executable process chain for deriving new data products on demand
(i.e., derivable observation)
• Archive fundamental properties and assumptions regarding sensor systems
One of the main concepts in SensorML is process, which defines inputs, outputs,
parameters, and a method for that process, as well as a collection of metadata useful for
discovery and user assistance. In SensorML, all elements are modelled as processes. This
includes components normally viewed as hardware such as transducers, actuators,

CHAPTER 2. STATE OF THE ART 21
processors, sensors and sensor platforms (OGC, 2007b). Sensor systems are modelled as a
collection of physical and non‐physical processes. The first category applied to physical
processes such as detectors, actuators and sensor systems. These processes have some
relationship with space and time. The second category includes processes that can be
modelled by mathematical operations.
Figure 8 is a class diagram showing the main type relationships between the main
SensorML concepts. All processes are derived from the AbstractProcess class which have
among its fields the input and output “ports” for exchanging data with exterior entities. The
subclasses of AbstractProcess are (OGC, 2007b):
Fig. 8: Conceptual model for Processes (OGC, 2007b)
• ProcessModel: it defines non‐physical processes used to build more complex
processes.
• ProcessChain: a collection of processes that executed sequentially produce a
result. A process chain may contain zero or more physical of non‐physical
processes. It is built using the Composite design pattern (Gamma et al., 1995);
therefore it can be included inside other process chains.
• Component: Physical process that cannot be subdivided into smaller sub‐
processes or that wants to be treated as such.

CHAPTER 2. STATE OF THE ART 22
• System: physical equivalent of a ProcessChain. It is also implemented using the
Composite design pattern.
The metadata describing processes includes identifiers, classifiers, constraints (time, legal,
and security), capabilities, characteristics, contacts, and references, in addition to inputs,
outputs, parameters, and system location (OGC, 2008) (OGC, 2007b).
2.2.5 SOS implementation Specification
The SOS specification provide access to observations from sensors and sensor systems in a
standard way that is consistent for all sensor systems, including remote, in‐situ, fixed and
mobile sensors (OGC, 2007g). The information exchanged between SOS clients and servers
follows the O&M specification for observations and the SensorML specification for sensors
or system of sensors descriptions.
The main goal of SOS is to provide access to observations, which are grouped into
Observation offerings. An observation offering is a set of related observations that follow
some criteria. Unfortunately, the specification does not provide a more precise definition or
any clear guidance on this grouping. The only clue provided is that classifiers must be
factored into offerings in such a way that in response to a GetObservation request the
likelihood of getting an empty response for a valid query should be minimized (OGC,
2007g).
The offerings are constrained by the following parameters (OGC, 2007g):
• Specific sensor systems that report the observations,
• Time period(s) for which observations may be requested (supports historical
data),
• Phenomena that are being sensed,
• Geographical region that contains the sensors, and
• Geographical region that contains the features that are the subject of the sensor
observations (may differ from the sensor region for remote sensors)
The SOS implementation specification defines three operation profiles: core profile
(mandatory), transactional profile (optional) and enhanced profile. The core profile contains
three operations: GetCapabilities, DescribeSensor, and GetObservation. These are the basic

CHAPTER 2. STATE OF THE ART 23
operations needed for any data consumer to access sensor observations stored in an SOS
server. GetCapabilities is an operation that is common for all the OGC’s web services, and as
such is defined in (OGC, 2007f). The operation allows clients to access metadata about the
capabilities provided by the server. The DescribeSensor operation allows SOS clients to
retrieve SensorML or TML description of a given sensor specified as parameter of the
operation. The GetObservation operation is used to retrieve observation data from the server.
Several parameters for filtering the observations must be supplied.
The transactional profile offers support for data producer. Using the supplied operations
RegisterSensor and InsertObservation, a data producer can register its sensor systems and
insert the observations produced by them into the server. Later, clients can read this
information using the core profile operations.
The third and last profile is the enhanced profile, which provides clients with a richer
interface for interacting with the server. The operations are GetResult, and allows clients to
obtain sensor data repeatedly without having to send and receive requests and responses
that largely contain the same data except for a new timestamp; GetFeatureOfInterest returns a
featureOfInterest that was advertised in one of the observation offerings of the SOS
capabilities document; GetFeatureOfInterestTime returns the time periods for which the SOS
will return data for a given advertised feature of interest; DescribeFeatureOfInterest returns
the XML schema for a given feature; DescribeObservationType returns the XML schema that
describes the Observation type that is returned for a particular phenomenon; and
DescribeResultModel returns the schema for the result element that will be returned when the
client asks for the given result model by the given ResultName.
2.3 Known SWE implementations
The fact that SWE specifications are so recent is reflected in the relatively few known
implementations of the framework. OGC keeps a list of products compliant or implementing
its specifications (OGC, 2009a). In this list only a handful of products are listed that
implement any of the SWE specifications, in either client or server versions of them. The
most prominent implementations listed are the ones from: 52°North/University of Muenster
CHAPTER 2. STATE OF THE ART 24
(52North, 2009) and University of Alabama in Huntsville (UAH VAST, 2009). More details
about these implementations are provided in the following sections. Another popular server
implementation of the SOS 1.0.0 specification is included in MapServer (Mapserver, 2008), a
very popular open source platform for publishing spatial data and interactive mapping
applications to the web.
2.3.1 52° North’s SWE implementation
52°North Initiative is an international research and development company for developing
open source geo‐software for research, education, training and practical use (52North, 2009).
One of its core communities is the Sensor Web Community. This community is focused on
development of SWE services and encodings. They have developed implementations of all
the services and encodings specifications within SWE. In addition to this, they have
developed the OX‐Framework, providing a client architecture where the information of all
kind of OGC Services can be accessed, visualized and integrated.
2.3.2 UAH VAST’s SWE implementation
The VisAnalysis Systems Technologies (VAST) Team, from The University of Alabama in
Huntsville (UAH), works on research and development on visualization and analysis,
as well as standard web‐based technologies (UAH VAST, 2009). This team has developed
multiple tools related with SWE specifications, most of them specialized in working with
SensorML. In our opinion the most relevant ones are the SensorML Processing Engine,
which allows for the execution of process chains obtained from SensorML documents; and
the Space Time Toolkit (STT), which provides capabilities for integrating spatially and
temporally‐disparate data in a highly interactive 3D display environment (UAH VAST,
2009a). Data retrieved from different OGC services including SOS can be handled and
visualized using this tool.

CHAPTER 2. STATE OF THE ART 25
2.4 Some projects using SWE
At present, several projects using SWE related technologies exist in different parts of the
world. Some of these projects are listed below:
• Marine Metadata Interoperability (MMI) project and OOSTethys: The MMI is a
project for promoting the exchange, integration and use of marine data through
enhanced data publishing, discovery, documentation and accessibility (Marine
Metadata Interoperability, 2009). Within this project OOSTethys (OOSThetys,
2008) is a provider‐to‐user data system framework, using interoperable standards,
enabling discovery and use of data. OOSTethys allows a data provider to setup an
OGC Sensor Observation Service with minimal effort.
• OSIRIS (Open architecture for Smart and Interoperable networks in Risk
management based on In‐situ Sensors): is one of the GMES’ supporting projects.
GMES (Global Monitoring for Environment and Security) is a European initiative
which will provide us with the tools to improve our environment and will help us
keep our planet safe and healthy (GMES, 2008). OSIRIS provides a Service
Oriented Architecture based on standards and delivers functions ranging from in‐
situ earth observation to user services (OSIRIS, 2009).
• SANY IP (Sensors Anywhere Integrated Project): This project focuses on
interoperability of in‐situ sensors and sensor networks. The project’s aim is to
deliver a standard SOA for environmental sensor networks, reference
implementations of re‐usable sensor‐ and domain‐agnostic services, and three risk
management applications covering the areas of air pollution, marine risks and geo
hazards (SANY, 2009).
• Advanced Fire Information Service: is a near real‐time operational satellite fire
monitoring system. Its main goal is assisting in the prediction, detection and
assessment of fires using Remote Sensing and GIS technology. It is part of the
Wide Area Monitoring Information Service (WAMIS) which delivers relevant
sensor based information for supporting decision‐making in the monitoring of the
Southern African environment (CSIR, 2008) .

CHAPTER 2. STATE OF THE ART 26
2.5 Summary
In this chapter, we presented a general introduction to the topic of sensor networks. We
introduced the main concepts such as sensors networks and their advantages over
traditional sensor platforms; sensor nodes and their components; and examples of fields
where these networks have been applied. We also introduced the Sensor Web Enablement
initiative and presented an introduction to the specifications that are relevant to our work.
Finally, we mentioned some known implementations and projects applying SWE.

27
3
GVSIG
gvSIG3 is an open source tool designed for managing geographic information. This tool
provides support for common data formats, including vector and raster spatial data, remote
spatial databases, and standard OGC web services. gvSIG allows for the combination of
geospatial data with different formats and from different sources in a single view. gvSIG is
developed using Java under the GNU General Public License (GPL). In this chapter we
present a general description of the gvSIG architecture and the plug‐in model used to add
new functionality in the form of extensions. Its name is an abbreviation of ”Generalitat
Valenciana, Sistema dʹInformació Geográfica” (gvSIG, 2008).
3.1. Architecture
gvSIG is built using a plug‐in model where functionality can be added to a generic
framework called ANDAMI. ANDAMI is an extensible framework for building Multiple
Documents Interface (MDI) applications, which can be customized for different kinds of
applications. ANDAMI starts the application and then loads a group of previously
registered plug‐ins, which provides the domain‐specific behaviour. ANDAMI also assists
plug‐ins with a set of services such as user interface initialization, windows management
and internalization support.
The GIS‐specific behaviour is added to the application by the three main subsystems
(gvSIG, 2008a):
3 All the information presented here is related to the last stable version of gvSIG: 1.1.2

CHAPTER 3. GVSIG 28
• gvSIG: The gvSIG subsystem is the equivalent of the Presentation layer in an
enterprise layered architecture (Fowler, 2002). It handles, with the help of
ANDAMI, the interaction between the system and the user. It provides the user
with the graphic representation of geographical data and the tools to interact with
this data. It takes the form of a plug‐in, which is loaded by ANDAMI when
execution starts.
• FMAP: This library includes all that is needed to handle GIS objects. It includes
classes that can draw layers, assign legends, execute queries, make spatial
analysis, etc. It is the equivalent of the Domain Layer in an enteprise layered
architecture.
• SubDriver: Contains classes to access the different data formats. It handles the
communication with real data sources isolating other layers from the specific
details of this interaction. It is the equivalent of a Data Source Layer in an
enterprise layered architecture.
Fig. 9: Functional components of gvSIG.

CHAPTER 3. GVSIG 29
Figure 9 shows all these components and their interconnections. The general functioning
of the system can be explained in a few words: the drivers are responsible for accessing the
data sources, reading and/or writing spatial data stored in different formats. Vectorial
drivers transforms GIS entities retrieved from the data source to objects of the internal data
model. The FMAP module performs operations using this data such as: drawing layers,
executing alphanumeric and graphic queries, making spatial analysis or transforming
coordinates between the different reference systems. Finally, the GUI module handles the
user interaction through user interface elements. (gvSIG, 2008a)
In the following sections we provide a more detailed explanation of the four main
components of gvSIG: the gvSIG subsystem4, FMAP, SubDriver and ANDAMI.
3.1.1 The gvSIG Subsystem
As mentioned before, the gvSIG subsystem handles the interaction between the system and
the user. It provides the user with the graphic representation of geographical data and the
tools to interact with this data.
Fig. 10: Component diagram of the gvSIG subsystem (gvSIG, 2008a)
4 Note that the main subsystem has the same name as the application; this may sometimes
cause some confusion.

CHAPTER 3. GVSIG 30
Figure 10 shows the main components of this subsystem, which we explain next: (gvSIG,
2008a):
• Project: Container of the document structure opened at a given time. It may
contain several documents of different types in addition to general information
such as project name, location or date.
• Documents: Different document types supported by the application. Current
supported document types are: Views, Tables and Layouts. It also provides
extension points for new document types.
• Views: Contains the graphical representation of geospatial information and its
corresponding legend (TOC5).
• Tables: Tabulated representation of alphanumeric data related with the geospatial
information contained on the project
• Layouts: Representation of a view in a printer friendly format.
• Layers: User interface elements utilized to add a new layer to the current view.
Although we do not consider ANDAMI as part of this subsystem, it is shown in the figure to
illustrate its relationships with the rest of the components.
3.1.2 The Fmap Subsystem
Fmap is the GIS engine of the gvSIG application. It provides the internal model used to
represent geospatial data and it provides the main operations to process and display such
data. It is implemented as an independent library that can be reused in other projects. The
main component in this library is MapControl, in charge of storing, handling and displaying
the geospatial information.
Figure 11 shows the main components contained in Fmap. A short description of the
components is provided next (gvSIG, 2008a):
5 TOC: Table of Contents.

CHAPTER 3. GVSIG 31
• MapControl: It is a user interface Java component used by views to draw and handle
the geospatial information distributed between several layers.
• MapContext: It contains all the information needed by MapControl to display
graphical information, including references to the layers contained in a single view.
Fig. 11: Component diagram of the Fmap subsystem (gvSIG, 2008a)
• Behaviours: Represent the behaviour of different tools associated with MapControl
objects. It controls how this tool is displayed and how it fires events. It allows the
implementation of complex behaviours such as the selection of rectangular, circular
or polygonal areas with the mouse.
• Listeners: Represent the entities in charge of processing the events generated by
behaviours. This means that, for each behaviour supported in a layer, a
corresponding listener must be specified to respond to the event generated by it and
update the state of the MapControl object. An ample set of behaviour and listeners is
supported by default in gvSIG.

CHAPTER 3. GVSIG 32
• Layers: Set of layers contained within a view each one containing the representation
of some geospatial information.
• Geometries: all the types of graphic elements that can be represented within a layer.
• DataSources and Drivers: It contains the necessary logic to access and manage
graphical and alphanumeric data. They do not interact directly with the final data
source, but use the SubDriver subsystem to access the data.
3.1.3 The Subdriver Subsystem
SubDriver handles the communication with real data sources isolating other layers from
the specific details of this interaction. It contains the classes for accessing data stored using
data format on the file systems, databases or remote servers.
Fig. 12: Component diagram of the SubDriver subsystem (gvSIG, 2008a)
Figure 12 shows the components of the SubDriver subsystem. Next, we present a short
description of each component (gvSIG, 2008a):
• DriverManager: It provides driver loading and access support to the drivers available
in the application.
• Drivers: Manage the different data formats supported by gvSIG.
• WriteManager: It provides loading and access support to the writers available in the
application.

CHAPTER 3. GVSIG 33
• Writers: It allows writing operations to different data formats.
• Vectorial Sources: It provides access to vectorial data.
• RasterSources: It provides access to raster data.
• DataSources: It provides access to alphanumeric data.
• Remote Services: This component contains the logic to communicate with remote data
sources such as WFS, WMS, or WCS.
3.1.4 Andami
ANDAMI is a framework which can be extended adding plug‐ins. Apart from managing
plug‐ins; it provides the basic functionality to implement the user interface such as window
and event management. The gvSIG subsystem itself is a plug‐in which adds GIS‐specific
behaviour to the Andami framework. Figure 13 shows the functional block composing
Andami. A more detailed description of these components and their functionality is
provided next (gvSIG, 2008a):
Fig. 13: ANDAMI functional blocks (gvSIG, 2008a)

CHAPTER 3. GVSIG 34
• Windows management: It provides support for creating windows, modifying its
properties, etc. When a plug‐in wants to show a window it must only supply a panel
with the window content. The window frame, the Window menu, and the window’s
basic operations (minimize, maximize, etc.) are handled by Andami.
• User interface initialization from XML files: It provides support for using toolbars,
menus and the status bar whose properties and initial state are stored in a XML file.
It also provides the basic tools for handling events generated by these user interface
elements.
• Plug‐in Management: At start‐up, Andami loads and initializes the plug‐ins
registered with the system. Every plug‐in specifies a set of user interface elements
associated to it and the extension that should handle the events generated by them.
• Plug‐in Services: Apart from the general services mentioned there are a set of services
that plug‐ins can use programmatically:
o Data persistence: It allows data to be stored at the local file system between
different executions of the application. The information persisted by a plug‐
in cannot be accessed by any other plug‐in. The use of this service is only
recommended for small‐sized data.
o Internationalization support: Every plug‐in defines different files containing
translation keys and a translation associated with it in different languages.
Then a plug‐in can ask for strings from these files and the one matching the
language selected by the user in the language configuration settings, is
returned.
o Background task execution: it allows the creation and handling of background
tasks.
o Logging support: It provides a log to keep a history of significant errors or
events. The events may belong to different categories: Info, Warning, Error
or Debug.
o Clipboard support: Andami provides support for copying to or retrieving
information from the clipboard. Only information in text format is
supported so far.

CHAPTER 3. GVSIG 35
o Temporal files: Temporal files that last only until the current session is closed
can be created.
o Access to plug‐in resources: It allows plug‐ins resources such as images or
XML files to be accessed using paths which are relative to the plug‐in
directory. This eases source code portability.
3.2. Plug‐in and Extensions
A gvSIG plug‐in is a module containing a set of extensions to add new functionality. An
extension is a Java class implementing the IExtension interface that bridges new functionality
with the existing one (gvSIG, 2008a). An extension receives notifications of user actions
related with it, and responds accordingly. All of the installed plug‐ins are located in a single
directory called gvSIG\extensions and they are loaded by Andami while starting execution. A
plug‐in must contain a configuration file named config.xml. This file contains information
about the plug‐in such as name, library path, dependencies, translation files, and extensions
contained in the plug‐in and user interface components configuration.
3.2.1 Extensions
As mentioned before, an extension must implement the IEXtension interface, which
contains the following methods (gvSIG, 2008a):
• public void initialize(): This method is called to initialize the extension at loading
time.
• public void postInitialize(): This methods is called for every extension after all of
them have been initialized.
• public void terminate(): Called for every extension when the application ends. They
are invoked in reverse order than they were called at loading time.
• public void execute(String actionCommand): This method is executed to respond to
user interface generated events. The parameter can be used to identify the source
of the event.

CHAPTER 3. GVSIG 36
• public Boolean isEnabled(): This method is used to determine if the user interface
elements associated to the extension are enabled or not.
• public boolean isVisible(): Determines if the user interface elements associated with
the extension are visible or not.
Fig. 14: IExtension relationships (gvSIG, 2008a)
In Figure 14 we can see a class diagram showing how IExtension is related with other
classes and interfaces. Every extension is related to an ExtensionDecorator object
implementing the HiddableExtension interface. An ExtensionDecorator allows the visibility of
an extension to be modified by others extensions at execution time. The Extension abstract
class provides default implementations for the IExtension interface methods, easing the job of
extension developers.

CHAPTER 3. GVSIG 37
3.3. gvSIG Mobile
gvSIG Mobile is a version of gvSIG that can be executed in mobile devices with Windows
Mobile 5.0 and 6.0 platforms (gvSIG, 2008b). As gvSIG, the mobile version is a GIS that can
also act as a Spatial Data Infrastructure (SDI) client, supporting communication with
providers of some OGC’s compliant services. According to the gvSIG Portal, it is the first
registered free software system with such attributes.
This software provides support for (gvSIG, 2008b):
• Several vectors and raster formats such as SHP, ECW, JPEG, PNG, GIF, KML,
GML, etc.
• Connection to WMS Services.
• Layer manipulation with operations like adding vector, raster or WMS layer,
exporting layer content, etc.
• Map navigation (zoom in, zoom out, pan, etc.)
• Operations for measuring distances and areas, selecting features, querying
attributes properties.
• GPS Support: Real‐time navigation, and waypoints and tracklogs captures are
supported.
3.4. Supporting Libraries
gvSIG is not implemented from scratch. It uses a set of existing libraries to provide some
of the supported functionality. Some of these libraries, followed by a brief description are
listed next:
• Geotools2 (GeoTools, 2008): GeoTools is an open source library, which provides
standard compliant methods to manipulate geospatial data. GeoTools provides
support for several vectorial and raster data formats such as Shapefiles, GML,
WFS, PostGIS, Oracle Spatial, ArcSDE, MapInfo, ArcGrid, Image, GeoTIFF and
WMS. It represents basic geographic elements in a vector system, using Java
Topology Suite (JTS) as the current geometry model. It implements grid coverages

CHAPTER 3. GVSIG 38
providing support for data management, presentation, image data format access,
tiling support, and a framework for raster data processing. It implements a subset
of the OGCʹs Coordinate Transformation Services specification providing an
implementation for general positioning, coordinate reference systems, and
coordinate transformations.
• JTS (Java Topology Suite) (Vivid Solutions Inc., 2008): The JTS Topology Suite is a
Java API that implements a core set of spatial data operations using an explicit
precision model and robust geometric algorithms. It provides a complete model
for specifying 2‐D linear Geometry. JTS is intended to be used in the development
of applications that support the validation, cleaning, integration and querying of
spatial datasets (Vivid Solutions Inc., 2008a). JTS attempts to implement the
OpenGIS Simple Features Specification (SFS) as accurately as possible.
• Batik: Batik (Batik, 2008) is a Java‐based toolkit for applications or applets that
want to use images in the Scalable Vector Graphics (SVG). The Batik modules can
be used to generate, manipulate and transcode SVG images in your applications
or applets. Using Batik a Java application or applet can very easily export
graphics into the SVG format. SVG viewing and interaction capabilities can be
easily added using the SVG viewing component. Conversion of SVG images to
other formats such as JPGE, PNG, TIFF, EPS or PDF is also supported.
• Castor (Castor Project, 2005): Castor is an Open Source data binding framework
for Java. It provides Java‐to‐XML binding, Java‐to‐SQL persistence, and more. The
main components of the Castor framework are Castor XML and Castor JDO.
Castor XML is an XML data‐binding framework. Castor enables access to data
defined in an XML document through an object model representing that data.
Castor XML can marshall almost any ʺbean‐likeʺ Java Object to and from XML.
Castor JDO is an Object‐Relational Mapping and Data‐Binding Framework which
frees the programmer from dealing directly with databases. Castor supports the
following relational databases: DB2, Derby, Generic DBMS, Hypersonic SQL,
Informix, InstantDB, Interbase, MySQL, Oracle, PostgreSQL, Progress, SAP DB /
MaxDB, SQLServer and Sysbase.

CHAPTER 3. GVSIG 39
• Ermapper (ERDAS, 2008): Library to work with free ECW. Only available for
Windows‐based systems. ERMapper Image Compression SDK provides support
for JPEG 2000 and ECW image formats. Some of the features supported in this
SDK are lossless and lossy compression, 64 bit file support handles TB+ size
images, fast viewing at any resolution for any region, 64 bit OS support, low
memory footprint even on TB size images, geolocation data preserved as
embedded metadata, etc.
• GDAL (OSGEO, 2008): GDAL is a translator library for raster geospatial data
formats. It presents a single abstract data model to the calling application for all
supported formats. It also comes with a variety of useful command‐line utilities
for data translation and processing. The GDAL data model contains the types of
information that a GDAL data store can contain, and their semantics. The main
types of the model are Datasets, Raster Bands and Overviews.
• Lizardtech GeoSDK (Lizardtech, 2008): The GeoExpress SDK provides a
framework for creating image pipelines that enable developers to efficiently read,
write and manipulate data in a variety of formats, including MrSID, JPEG 2000,
and other common geospatial formats.
3.5. Summary
gvSIG is an open source GIS structured in three layers: gvSIG, handling the interaction
between the system and the user; FMAP with the business logic to handle GIS objects; and
SubDriver, containing classes to access different data formats. gvSIG is built using a plug‐in
model where functionality is added to a generic framework in charge of managing the basic
interaction with the user interface. A gvSIG plug‐in is a module containing a set of
extensions to add new functionality. A version of gvSIG called gvSIG Mobile also exists.
gvSIG Mobile provides support for several data and raster formats, WMS services, real‐time
navigation with a GPS, etc.

40
4
ANALYSIS
In this chapter we present the analysis phase of the SOS client plug‐in for gvSIG, which is
called gvSOS. The plug‐in requirements, the use case model, and the high‐level architecture
are exposed.
4.1 Plug‐in Requirements
The SOS plug‐in must satisfy a set of requirements listed and explained next:
• It must implement the Core profile of the SOS 1.0.0 specification including the
operations: GetCapabilities, DescribeSensor and GetObservation.
• Other supporting specifications used by SOS 1.0.0 must be also implemented. In this
case, SensorML 1.0.1 and O&M 1.0.0 are implemented to represent sensors and
observations descriptions.
• A user interface must be provided to connect to the server and select the information
to be displayed. At this step the user must be able to select an observation offering
and set filters that will be used to retrieve information about sensor observations.
• Only one observation offering must be visualized in a layer, although this restriction
can be modified in the near future. Each sensor contained in the selected offering
must be displayed as a point in a layer. Here, we are assuming that all sensors are
geolocated.
• Users must be able to interact with the sensors, so that they can request information
about one or more sensors previously selected. In a similar way, observations
gathered by the selected sensors can be requested. This information must be
displayed graphically and a tabular representation must also be available.

CHAPTER 4. ANALYSIS 41
• The SOS plug‐in must follow an internal (architecture) and external (GUI) design
similar to other OGC Web Services (OWS) plug‐ins (WMS, WFS, etc.) already
implemented in gvSIG.
• Complete redesign and reimplementation should be avoided. The maximum
amount of design and source code must be reused to speed up development.
• High standards of code organization must be followed, including Javadoc comments
in every class and every public method, comments in the source code to help
understand its purpose and the use of gvSIG naming conventions when applicable.
Fig. 15: Use case diagram for gvSOS.
4.1 Use case model
The use case model for gvSOS is very simple containing only four use cases and two
actors (Figure 15). The use cases are:
• Initialize Extension: This includes the initialization of the extension carried out at
start‐up. Andami is in charge of loading and initializing all the plug‐ins. At this
point user interface elements related with the extension are registered (toolbar
buttons, menu items, connection wizards, etc.)
• Add SOS Layer: In this use case the user adds a new SOS layer to a gvSIG view.
This process includes the connection to the SOS server, the selection of the

CHAPTER 4. ANALYSIS 42
offering whose information will be displayed in the layer and the addition of
filters that will be used to request observations.
• Display Sensors Information: Once displayed in a view, sensors can be selected by
the user to ask for further details about them. This information will be displayed
in a table inserted in a different window.
• Display Sensors Observations: The sensors can also be selected to request
observations gathered by them. This information can be filtered using temporal or
spatial filters, depending on the server’s capabilities.
The actors are:
• gvSIG: This actor is used to represent the special case when execution of some
functionality is started automatically. In this case, plug‐in initialization is
executed at start‐up.
• User: End users of gvSIG using gvSOS. This actor fires the main use cases of the
plug‐in related with retrieving and displaying information about sensors and
their observations.
4.2 High Level Architecture
The plug‐in architecture derives from the gvSIG architecture. It is arranged as a variation
of the layer pattern (Buschman et al., 1996), containing the same main gvSIG layers as can be
seen in Figure 166:
• gvSIG‐SOS: It contains the user interface of the plug‐in, providing the wizard
utilized by the user to connect to the SOS server and dialog boxes to request
information about sensors and observations. This package is an extension of the
gvSIG layer.
• FMap‐SOS: This package contains the code for integrating the information received
from the server with the rest of the information in the system. It contains the code to
6 In this figure packages refers to analysis packages, do not confuse with Java packages.

CHAPTER 4. ANALYSIS 43
create and draw layers, drivers for interacting with the remote clients, etc. It is an
extension of the FMap layer.
• RemoteServices‐SOS: It implements the low‐level communication with the remote
SOS web service, isolating the rest of the system from the details of this interaction.
This package is an extension of the SubDriver layer.
It also relies on Andami for initialization and internationalization issues, use of temporal
files, etc.
Fig. 16: Package diagram showing the gvSOS architecture.
4.3 Summary
gvSOS must implement the Core profile of the SOS 1.0.0 specification and other related
encodings. It must also provide users with tools to connect to the servers and select the
information to be displayed. This information must be displayed graphically and through
tables. gvSOS architecture is arranged in three layers: gvSIG‐SOS, containing user interface
elements; FMap‐SOS, containing the code to integrate the sensor and observation data into
gvSIG; and RemoteServices‐SOS, implementing the communication with the servers.
44
5
DESIGN AND IMPLEMENTATION
This chapter provides details about the design and implementation phases of gvSOS. For
every layer mentioned in the analysis phase we provide a design and implementation
oriented view including class diagrams and a detailed explanation of how they implement
the functionality of every use case.
5.1 gvSIG layer
The gvSIG layer is divided in a set of implementation packages listed next: (Figure 17):
• com.iver.cit.gvsig.sos: It contains the SOSClientExtesion class, which is the entry point
for our extension functionality.
• com.iver.cit.gvsig.gui.wizards: This package contains the implementation of the
Connection Wizard used to establish connection with the server and to select the
observation offering to be displayed (SOSWizard).
• com.iver.cit.gvsig.gui.dialogs: The package contains the implementation of all the
dialog boxes used by the plug‐in.
• com.iver.cit.gvsig.gui.panels:It contains the panels used to implement the user
interface of the wizard and the dialog boxes.
• com.iver.cit.gvsig.gui.toc: This package contains the implementation of the behaviour
of the popup menu entry added to the TOC (SOSPropsTocMenuEntry).
As can be seen, the content of all packages is related with user interface elements. The
initialize method of the SOSClientExtension class is executed at start‐up to initialize the
extension. SOSWizard is executed when an SOS layer wants to be added to the current view.
Different dialog boxes are invoked to show and to modify layer properties, to request

CHAPTER 5. DESIGN AND IMPLEMENTATION 45
information about sensors and to request information about observation.
SOSPropsTocMenuEntry is used to add and manage menu items to the view’s TOC.
Fig. 17: gvSIG‐SOS package diagram.
Figure 18 shows a simplified class diagrams representing the main classes and relationships
within the gvSIG layer. The centre of our diagram is the SOSWizard class which:
• inherits from the WizardPanel class, the base class for all the wizards used to add
layers.
• contains SOSWizardData, which acts as data source for the wizard and the panels
contained in it. SOSWizardData pre‐process data obtained using a driver
implemented in lower layers (see next section)
• contains several Swing components to implement the connection page of the
wizard.
• contains the SOSParamsPanel class, encapsulating the rest of the pages of the
wizard to show information about the server and the selected offering (InfoPanel),
to select the offering (SOSSelectOfferingPanel), and to specify filters
(SOSFilterPanel).
To simplify the diagram, classes representing individual Java Swing components are not
shown and for each class only the main methods are listed.

CHAPTER 5. DESIGN AND IMPLEMENTATION 46
Fig. 18: Class diagram showing SOSWizard and its relationships
5.2 Fmap layer
The Fmap layer contains the following packages (Figure 19):
• com.iver.cit.fmap.core: This package contains the feature types used by layers
composed of sensor and sensor observations.
• com.iver.cit.fmap.drivers: It contains the declaration of the interface of the driver that
must be implemented by the plug‐in. It also includes the definition of the exceptions
that can be thrown by this driver.
• com.iver.cit.fmap.drivers.sos: The package contains the implementation of the driver
used to access information located in an SOS server.
• com.iver.cit.fmap.layers: It contains the implementation of the layer contained the
information retrieved from an SOS server.
The internal functioning of the Fmap package is a rather complex one. In order to
simplify things a bit, we can say that SOSFeature represents the features that are
represented in a layer of type FLyrSOS. FlyrSOS inherits from class FLyrVect, a base class
used to implement layers composed of vector data. FlyrSOS uses an instance of

CHAPTER 5. DESIGN AND IMPLEMENTATION 47
FMapSOSDriver to recover all the data from the server. Once the data is retrieved,
SOSAdapter processes this information. It uses an object implementing the GPEParser
interface to parse the XML files. Depending if the XML file is an O&M document or a
SensorML document it creates a GPEOMv10Parser or a GPESensorMLv101Parser object.
These classes are implemented in a different project called libGPE‐Sensor7.
Fig. 19: Fmap‐SOS package diagram.
Fig. 20: Fmap‐SOS class diagram.
7 This library was implemented by the Prodevelop staff; in this document we do not
provide too many details about how it works.
CHAPTER 5. DESIGN AND IMPLEMENTATION 48
FMapSOSDriver inherits from ConcreteMemoryDriver, which allows data to be kept in
memory and also provides cache capabilities. FMapSOSDriver recovers data from the SOS
server using functionalities provided by lower layers. A class diagram showing these
relationships is presented in Figure 20.
At this point a major design challenge was found: the gvSIG architecture provides
support for adding and caching features in ConcreteMemoryDriver, but only information
about geometries and simple attributes values can be included in such features. There is no
support for complex data structures like sensors containing information about observations,
with the added complexity that observations intrinsically hold a temporal component. To
solve this problem the sensors descriptions are kept as features following the gvSIG model,
but observations are stored in two nested hash tables. The first table uses the sensor
identifier as a key to link the sensor with an internal table containing the observation data.
This data uses the observed property as a key to access pair values including the time instant
and the measured value for an observation.
5.3 SubDriver layer
In this layer, the analysis package RemoteClient‐SOS is implemented. The
RemoteServices‐SOS package implements the communication with the SOS Server and it
resembles most of the structure of the rest of the OWS extensions already included in gvSIG.
The package is composed of 8 sub‐packages within the org.gvsig.remoteClient namespace
(Figure 21):
• ows.capabilities: This package implements objects representing the information
contained in the server capabilities document.
• sos: It contains the SOSClient class and a group of classes to support its behaviour.
This class provides the main functionality offered to upper layer, which is
connecting and retrieving data from servers implementing the SOS specification.
The classes included in this layer are version‐independent; this means that some
of them must be specialized to work with specific versions of the specification.

CHAPTER 5. DESIGN AND IMPLEMENTATION 49
• sos.exceptions: The package includes one class representing the exception that can
be thrown from this layer.
• sos.filters: It implements classes representing filters that can be applied to
GetObservation requests. It initially includes only some temporal and spatial
filters.
• sos.requests: This package includes the common mechanism used to send different
request types to the server.
• sos.sos1_0_0: It contains the specialization of the class SOSProtocolHandler,
included in the sos package, for version 1.0.0.
• sos.sos1_0_0.requests: It contains specializations of classes contained in the
sos.request package for version 1.0.0
Fig. 21: Remote Services package diagram.

CHAPTER 5. DESIGN AND IMPLEMENTATION 50
Fig. 22: Class diagram of the RemoteServices‐SOS package.
The main classes in this package are SOSClient and SOSProtocolHandler (Figure 22).
SOSClient represents the SOS client end‐point, encapsulating the logic for connecting to and
requesting operations from the SOS server. The class is a subclass of
org.gvsig.remoteClient.RemoteClient. SOSProtocolHandler is in charge of sending the requests
from a SOS client to the corresponding server. Only the SOS specification core profile is
supported so far. SOSProtocolHandler is a subclass of the abstract class
org.gvsig.remoteClient.OGCProtocolHandler, which implements the common behaviour for all
OGC services. SOSProtocolHandler is also abstract and it must be specialized for every
version of the SOS specification. Other important classes in this package are:
• OWSMetadata: It contains all the information returned by the server in its
capabilities document.
• SOSRequest: This class encapsulates the common structure and behavior of an
SOS client request. It must be specialized for specific requests. In this case, one
child class for the DescribeSensor operation and another for the GetObservation
operation are added.

CHAPTER 5. DESIGN AND IMPLEMENTATION 51
• SOSStatus: This class contains the parameters passed to an SOS request
operations.
• SOSFilterOperation: It encapsulates a filter operation used for filtering the output
from a SOS server. It is meant to be specialized by subsequent classes. At present,
specialization for several temporal filters and spatial filters exists.
• SOSException: This class represents any exception generated during the SOS
request execution cycle. It may represent a SOS server‐side exception or another
exception generated during the client‐side processing.
To implement the 1.0.0 version of the SOS specification at least three more classes must be
added. The first one is SOSProtocolHandler1_0_0 inheriting from SOSProtocolHandler and
including all the version‐specific logic. The two others are SOSDescribeSensorRequest1_0_0
and SOSGetObservationRequest1_0_0, specializing the corresponding requests classes.
5.4 Initialize extension
Starting from this section we proceed to explain in further detail each one of the use cases.
We start with the extension initialization use case, which is executed at start‐up. At this time,
basic user interface elements and extension classes are loaded using the information
contained in the configuration file (Figure 23). In our case we register the extension class
com.iver.cit.gvsig.sos.SOSClientExtension containing gvSOS. We also specify the dependencies
of the gvSIG and GPE plug‐ins, and the toolbar buttons used to query sensors and
observations information.
<?xml version="1.0" encoding="UTF-8"?>
<plugin-config>
<depends plugin-name="com.iver.cit.gvsig" />
<depends plugin-name="org.gvsig.gpe" />
<libraries library-dir="./lib"/>
<resourceBundle name="text"/>
<extensions>
<extension class-name="com.iver.cit.gvsig.sos.SOSClientExtension"
description="Support to access SOS"
active="true"
priority="1">

CHAPTER 5. DESIGN AND IMPLEMENTATION 52
</extension>
<extension class-name="org.gvsig.sos.SingleObservationExtension"
description="My first extension."
active="true">
<tool-bar name="SOS" position="1">
<selectable-tool icon="images/information.png"
tooltip="getObservation"
action-command="GET_OBSERVATION" position="1"/>
</tool-bar>
</extension>
</extensions>
</plugin-config>
Fig. 23: gvSOS configuration file (config.xml).
Once these elements are loaded, a method of our extension class is executed. This method
is very simple; it must only add some other user interface elements such as the wizard used
to connect to the SOS servers and a menu entry to the popup menu associated to the TOC.
The wizard class SOSWizard is added to the class AddLayer from the gvSIG layer. This class
handles the dialog box shown to the users when they request a new layer. The dialog box
contains wizards for all possible formats supported by the system. A popup menu entry for
requesting and modifying the properties of an SOS layer is added to class FPopMenu, which
is in charge of displaying the popup menu associated with the TOC corresponding to the
selected view.
5.5 Add SOS Layer
The use case Add SOS Layer is much more complex than the previous one. The use case is
started by the users when after creating a view they want to add a new layer. By selecting
the option Layer\Add Layer from the menu or pressing the “Add Layer” toolbar button the
Add Layer dialog box is shown. Within this dialog box we select the “SOS” tab to specify the
parameters to connect to the SOS server and retrieve the data describing a given observation
offering. In the following sections we explain how this behaviour is implemented layer by
layer.

CHAPTER 5. DESIGN AND IMPLEMENTATION 53
5.5.1 gvSIG layer
The gvSIG layer contains the classes handling the interaction with the user to establish the
connection with the server and to select the observation offering to be displayed. It also
allows the specification of filters that will be used for retrieving observations. The class
implementing this user interface is SOSWizard. After establishing connection with the server
and setting the required parameters SOSWizard must return the layer that contains all the
sensors within the selected offering represented as points. This layer is used by gvSIG to
create the view that shows the selected information to the user.
Figure 24 contains a sequence diagram illustrating the flow of messages to connect to the
server. The diagram below shows how the SOSWizard obtains its data from SOSWizardData,
which in turn get it from FMapSOSDriver. After establishing connection and retrieving the
service capabilities the information displayed in the rest of the panels is updated. Internal
details about how FMapSOSDriver obtains the data is provided in the following section.
Fig. 24: Diagram showing how connection is established at the user interface level.

CHAPTER 5. DESIGN AND IMPLEMENTATION 54
Fig. 25: Sequence diagram showing the layer creation process
In Figure 25 we present a sequence diagram showing the layer creation process. After
selecting the required parameters all the necessary data to create the layer is retrieved by
SOSWizard from SOSWizardData and SOSParamsPanel. This data is passed to the layer
constructor which read the features using the FMapSOSDriver class.
5.5.2 Fmap and Remote Services layers
In the Fmap layer the main class to explain is FMapSOSDriver which intermediates
between the classes in the FMap and gvSIG layers and the classes in the RemoteServices layer.
We also include in this section the inner workings of the RemoteServices layer. The main
scenarios at this point are how FMapSOSDriver implements the connection with the SOS
server and how it implements the reading of features composing a layer.
To connect to the server, FMapSOSDriver issues a request to SOSClient, which uses
SOSProtocolHandler to connect to the SOS Server (Figure 26). In this case, the version‐specific
specialization of SOSProtocolHandler is not used because getCapabilities requests are
implemented in gvSIG in a unique way. Direct communication with the server is
accomplished through the static method downloadFile included in the Utilities class.

CHAPTER 5. DESIGN AND IMPLEMENTATION 55
Fig. 26: Sequence diagram showing how connection is established at the driver level.
To read the features composing a layer, a call to setOffering must be executed upon the
FMapSOSDriver class to set the offering selected by the user. This call must be followed by a
call to readFeatures which read from the SOS server the information of every procedure
associated with the previously selected offering using a SOSClient class instance. SOSClient
use the SOSProtocolHandler1_0_0 class to accomplish its task (Figure 27). The information
from the procedures is retrieved from the server in SensorML format. These files are
processed using a GPESensorMLv101Parser instance not included in Figure 27 to keep it as
simple as possible. The parser converts the information contained in the files to SOSFeature
objects whose content is added to the internal gvSIG data model using the addGeometries
method. addGeometries is declared in the ConcreteMemoryDriver class, which keeps the
features information in both spatial and tabular format.
An example of the final result of these operations is shown in Figure 28. In the view four
layers are included; the first one starting from the bottom contains an ECW image of the
Iberian Peninsula. The second and third layers contain boundaries from Spanish
autonomous communities and provinces respectively. The layer at the top contains sensor

CHAPTER 5. DESIGN AND IMPLEMENTATION 56
systems located in harbours of four Spanish cities retrieved from a local files used for testing
purposes. Sensors systems are represented as yellow points.
Fig. 27: Sequence diagram showing how information regarding procedures is read
Fig. 28: Sensor systems located in four Mediterranean harbours.

CHAPTER 5. DESIGN AND IMPLEMENTATION 57
5.6 Showing sensors and observations data
Once the layer with sensors is displayed in a view, the user may issue requests for
information about sensors and observations. The information about sensors can be requested
easily by clicking the “See table attributes” button. The table containing the sensors
descriptions looks like the one in Figure 29. It includes the input list, output list and
identifier for every sensor included in the layer. To implement this behaviour, interaction
with the remote server is not necessary because metadata about sensors was already read
when the layer was loaded. At this point, we only have to show this information in a
tabulated form. The Fmap subsystem implements this behaviour in class FlyrVect, the direct
ancestor of FlyrSOS. FlyrVect keeps an internal table model, updated every time the layer
content changes, which is used by gvSIG to create a table at the user’s request.
Fig. 29: Table containing the information about the sensors included in the view.
To display information about observations gathered by sensors the user must select them
first and then press the GetObservation toolbar button. This action displays a dialog box,
implemented by the DlgGetObservation class. This class allows the user to specify the
parameters for a GetObservation request. Some of the parameters are already set, such as the
offering which was set when the layer was created, and others, like filters, may be modified
by the user at this step. Using the data entered in this dialog box, GetObservation requests are
generated and sent to the server. This process is similar to the above mentioned process for
reading sensors information. Now, instead of executing getSensors in FMapSOSDriver,
getObservations is executed. getObservations delegates the processing of this call to the
SOSClient object (Figure 30).

CHAPTER 5. DESIGN AND IMPLEMENTATION 58
After the observations are read from the server a dialog box showing them in a table is
presented to the users (Figure 31). This dialog box is implemented in the class
DlgObservations. In the left side of the dialog box the user has a list with the requested
sensors. Depending on the selected sensor, a table containing observations related with this
sensor is displayed on the right side. This table includes the time in which every observation
was made (if available) and the value of the observation. The example used shows the value
of the WaterLevel property in a four days period, sampling the property every twelve hours.
The test was accomplished using a local server filled with test data.
Fig. 30: Sequence diagram showing how observations are read from the server.
Fig. 31: Table showing observation times and values.

CHAPTER 5. DESIGN AND IMPLEMENTATION 59
The user can also display this information as a graph, being this in most of the cases a
more convenient solution than just looking into the bare numbers. A graph displaying the
values shown in Figure 31 is shown in Figure 32. Graphs are implemented using the
JFreeChart library (JFreeChart, 2009).
Fig. 32: Displaying observations on a graph.
5.7 Tests and Preliminary Results
Although the module implementation is not complete yet, tests have been executed to
validate the functioning of some of its components. These tests have revealed some details
in the SOS specification that complicates the implementation of clients and servers:
• In the server capabilities document there is no information about how procedures
and observed properties of an offering are related. The only way to know which
observed property is related with a given sensor is by executing a DescribeSensor
operation.
• The time attribute for offerings permits specifying a temporal reference system
through the frame attribute. Default ISO 8601 and the Gregorian calendar with UTC

CHAPTER 5. DESIGN AND IMPLEMENTATION 60
are used. Having only this information does not seem to be enough. ISO 8601 allows
several variations in the dates and times representation with basic and extended
formats. After running some tests with SOS servers available on the Internet, we
have observed that they do not support all possible variations in the data and time
formats. Usually only one or a few variations are supported. This situation can
provoke that a client sending valid ISO 8601 time values to the server may receive
“Invalid Time Format” responses. To solve this problem gvSOS remembers how
servers represent time values and convert any time value sent to it to this format.
This problem could be avoided if the capabilities document included more detailed
information about the time format supported by the server.
• Some examined server implementations do not use the parameter name sensorId to
identify the sensor or sensor systems to be described using the DescribeSensor
operation. Instead the parameter named procedure is used. This implies that a client
issuing a correct request to a server may receive an error message.
• Practically no information about temporal filters is included in any of the OGC
specifications. Maybe this is the reason why usually service implementations omit
the FilterCapabilities section from the capabilities document. To complicate matters,
filters specified in a GetObservation request are scattered all around since request
temporal filters are included in the sos:eventTime tag, Id and spatial filters are
included in the sos:featureOfInterest tag, and scalar filters are included in the
sos:result tag.
• The SOS specification states that zero or many temporal filters (eventTime tags) may
be specified in a GetObservation request. There is no mechanism for a SOS client to
know the number of filters supported for a specific server. As a result a client might
send a correct request containing more filters than the supported by the server,
without any warranties about what the server will response.

CHAPTER 5. DESIGN AND IMPLEMENTATION 61
5.8 Summary
In this chapter we presented the gvSOS design and implementation phases. For every
layer in the module, the main packages and classes have been explained. We also provided
details about how each one of the use cases were implemented, including sequence
diagrams and screenshots. Finally, some preliminary results have been exposed.

62
6
CONCLUSIONS We presented details of the development process for a new module for gvSIG to connect
to Sensor Observation Services. The SOS client module allows gvSIG users to interact with
SOS servers, displaying information about sensors and observations in a set of layers
composed by features. Sensors are shown as features in the map and their information can
be inspected also in tabular form. Observations can be inspected through tables or graphs,
being the latter a more convenient choice for users.
For each step of the development process we specify the main obstacles found during the
development such as, restrictions of the gvSIG architecture, inaccuracies in the OGC’s
specifications, and a set of common problems found in current SOS servers implementations
available on the Internet. However, the OGC SWE specifications are a first attempt to make
sensor resources broadly available to isolated communities to foster the integration of sensor
data in Spatial Data Infrastructures.
Finally, future research should try to align with ongoing sensor experiments as in the context
of GEOSS and the interoperability experiments within the OWS phase‐6, which pursue
among others, open issues to create geospatial processing workflows combining sensor data
with mainstream GI data.

63
REFERENCES
(52North, 2009) 52° North, Homepage. http://52north.org/. Accessed 04‐01‐2009.
(Akyildiz et al., 2002) I.F. Akyildiz, W. Su, Y. Sankarasubramaniam, E. Cayirci, “Wireless
sensor networks: a survey”, Computer Networks 38, 393–422., 2002.
(Batik, 2008) Batik Official Homepage (http://xmlgraphics.apache.org/batik/) Accesed 27‐
01‐2008.
(Buschman et al., 1996) F. Buschmann, R. Meunier, H. Rohnert, P. Sommerlad, M. Stal
Pattern‐Oriented Software Architecture Volume 1: A System of Patterns. Wiley, 1996.
(Castor Project, 2005) Castor Project, Homepage (http://castor.codehaus.org) Accesed 27‐
01‐2008.
(Chien at al., 2007) S. Chien, D. Tran, A. Davies, M. Johnston, J. Doubleday, R. Castano, L.
Scharenbroich, G. Rabideau, B. Cichy, S. Kedar, D. Mandl, S. Frye, W. Song, P. Kyle, R.
LaHusen, P. Cappaelare. Lights Out Autonomous Operation of an Earth Observing Sensorweb.
International Symposium on Reducing the Cost of Spacecraft Ground Systems and Operations.
Moscow, Russia, 2007.
(Chintalapudi et al., 2006) K. Chintalapudi, J. Paek, O. Gnawali, T. S. Fu, K. Dantu, J.
Caffrey, R. Govindan, E. Johnson, S. Masri. Structural damage detection and localization using
NETSHM. In Proceedings of the 5th international conference on Information processing in
sensor Networks (IPSN) Nashville, Tennessee, USA. 2006
(CSIR, 2008) CSIR Advanced Fire Information Service.
http://divenos.meraka.csir.co.za/afis/afis.html. Accesed 04‐01‐2008.

REFERENCES 64
(Culler et al, 2004)D. Culler, D. Estrin, M. Srivastava. Overview of Sensor Networks.
Computer, August 2004, IEEE.
(Endrei et al, 2004) M. Endrei, J. Ang, A. Arsanjani, S. Chua, P. Comte, P. Krogdahl, M.
Luo, T. Newling. Patterns: Service‐Oriented Architecture and Web Services. IBM Red Books, 2004
(ERDAS, 2008) ERDAS, ERDAS ER Mapper ,
http://www.erdas.com/Products/ERDASProductInformation/tabid/84/CurrentID/1052/Defau
lt.aspx, Accesed 27‐12‐2008.
(Envisense, 2008) Envisense, FLOODNET project.
http://envisense.org/floodnet/floodnet.htm. Accessed 31‐12‐2008.
(Envisense, 2008b) Envisense, SECOAS project. http://envisense.org/secoas.htm .
Accessed 31‐12‐2008.
(Fowler, 2002 ) Fowler M., Patterns of Enterprise Application Architecture, Addison‐Wesley
Professional (2002).
(Gamma et al., 1995) Gamma, E., Helm, R., Johnson, R., Vlissides, J. Design Patterns:
Elements of Reusable Object‐Oriented Software. Addison Wesley, 1995.
(GeoTools, 2008) GeoTools, Homepage. (http://geotools.codehaus.org/) Accesed 27‐12‐
2008.
(GMES, 2008) GMES, Homepage. http://www.gmes.info/.Accesed 04‐12‐2008.
(gvSIG, 2008) gvSIG, Homepage. http://www.gvsig.gva.es. Accessed 29‐12‐2008
(gvSIG, 2008a) gvSIG Portal, Guía de referencia para gvSIG 1.1.
http://www.gvsig.org/web/docdev/reference. Accesed 27‐12‐2008.
(gvSIG, 2008b) gvSIG Portal, gvSIG Mobile, http://www.gvsig.org/web/projects/gvsig‐
mobile. Accesed 27‐01‐2008.
(Jensen, 2002) D. Jensen. SIVAM: Communication, navigation and surveillance for the Amazon.
Avionics Magazine. [Online]

REFERENCES 65
http://www.aviationtoday.com/av/categories/military/12730.html. 2002. Accessed 31‐12‐
2008.
(JFreeChart, 2009). JFreeChart, Homepage, http://www.jfree.org/jfreechart/, Accessed 03‐
02‐2009.
(Lizardtech, 2008) Lizardtech, GeoSDK Page. (http://www.lizardtech.com/developer/)8
Accesed 27‐01‐2008.
(Mainwaring et al., 2002) A. Mainwaring, D. Culler, J. Polastre, R. Szewczyk, J. Anderson.
Wireless sensor networks for habitat monitoring. International Workshop on Wireless Sensor
Networks and Applications . Proceedings of the 1st ACM international workshop on Wireless
sensor networks and applications. Pages: 88 ‐ 97. 2002
(Mapserver, 2008) MapServer homepage. http://mapserver.org/ .Accessed 04‐01‐2008.
(Marine Metadata Interoperability, 2009) Marine Metadata Interoperability Homepage
.http://marinemetadata.org/node. Accesed 04‐01‐2009.
(Martinez et al., 2004) K. Martinez, J. K. Hart, R. Ong. Environmental sensor networks. IEEE
computer Aug. 2004, Volume: 37, Issue: 8, On page(s): 50‐ 56 (2004) .
(McNutt, 1996) S. McNutt. Seismic monitoring and eruption forecasting of volcanoes: A review
of the state of the art and case histories. In Scarpa and Tilling, editors, Monitoring and
Mitigation of Volcano Hazards, pages 99–146. Springer‐Verlag Berlin Heidelberg, 1996.
(OGC, 2009) OGC, Homepage. http://www.opengeospatial.org. Accessed 02‐01‐2009.
(OGC, 2009a) OGC, Implementations by Specification,
http://www.opengeospatial.org/resource/products/byspec. Accessed 04‐01‐2009.
(OGC, 2007) OGC. Observations and Measurements – Part 1 ‐ Observation schema. Version.
1.0.0. OGC Document Number 07‐022r1. 2007.
(OGC, 2007a) OGC. OGC® Sensor Alert Service Implementation Specification. 0.9.0. OGC
Document Number 06‐028r5. 2007.
8 To access this page, the user must follow a registration process.

REFERENCES 66
(OGC, 2007b) OGC. OpenGIS® Sensor Model Language (SensorML) Implementation
Specification. Version. 1.0.0. OGC Document Number 07‐000. 2007.
(OGC, 2007c) OGC. OpenGIS® Sensor Planning ServiceImplementation Specification. Version.
1.0.0. OGC Document Number 07‐014r3. 2007.
(OGC, 2008) OGC, OGC® Sensor Web Enablement Architecture. Version 0.4.0. OGC
Document Number 06‐021r4. 2008.
(OGC, 2007d) OGC. OpenGIS® Transducer Markup Language (TML)Implementation
Specification. Version. 1.0.0. OGC Document Number 06‐010r6. 2007.
(OGC, 2006) OGC. OpenGIS® Web Coverage Service (WCS) Implementation Specification.
Version. 1.1.0. OGC Document Number 06‐083r8. 2006.
(OGC, 2005) OGC. OpenGIS® Web Feature Service Implementation Specification. Version.
1.1.0. OGC Document Number 04‐094. 2005.
(OGC, 2006a) OGC. OpenGIS® Web Map Server Implementation Specification. Version. 1.3.0.
OGC Document Number 06‐042. 2006.
(OGC, 2007e) OGC. OpenGIS® Web Notification Service Implementation Specification. 0.0.9.
OGC Document Number 06‐095. 2007.
(OGC, 2007f) OGC. OGC Web Services Common Specification . OGC Document Number 06‐
121r3, Version 1.1.0 , 2007.
(OGC, 2007g) OGC. Sensor Observation Service. 1.0.0. OGC Document Number 06‐009r6.
2007.
(OGC, 2008a) OGC, “OGC® Sensor Web Enablement: Overview And High Level Architecture”.
OGC Whitepaper, 2006. http://portal.opengeospatial.org/files/?artifact_id=25562. Accessed
20‐04‐2008.
(OGC, 2008b) OGC, “Sensor Web Enablement WG”, http://www.opengeospatial.org/
projects/groups/sensorweb. Accessed 29‐12‐2008.
REFERENCES 67
(OGC, 2005b) OGC. “The Importance of Going Open”. OGC Whitepaper, 2005.
http://portal.opengeospatial.org/files/?artifact_id=6211&version=2&format=pdf . Accessed
29‐12‐2008.
(OOSThetys, 2008) OOSThetys, Homepage. http://www.oostethys.org/. Accesed 04‐01‐
2008.
(OSGEO, 2008) Open Source Geospatial Foundation, GDAL ‐ Geospatial Data Abstraction
Library. (http://www.gdal.org/) Accesed 27‐01‐2008.
(OSIRIS, 2009) OSIRIS, Homepage,.http://www.osiris‐fp6.eu/.Accesed 04‐01‐2009.
(Paek et al.,2005) J. Paek, K. Chintalapudi, R. Govindan, J. Caffrey, S. Masri. A wireless
sensor network for structural health monitoring: performance and experience. In Proceedings of the
2nd IEEE workshop on Embedded Networked Sensors. 2005.
(Rentala et al, 2001) P. Rentala, R. Musunuri, S. Gandham, and U. Sexena, “Survey onsensor
networks,” in Proceedings of International Conf. on Mobile Computing and Networking, 2001.
(SANY, 2009) .SANY Sensors Anywhere, Homepage. http://sany‐ip.eu/ Accesed 25‐02‐
2009.
(Sherwood&Chien, 2007) R. Sherwood, S. Chien. Sensor Web Technologies: A New Paradigm
for Operations. International Symposium on Reducing the Cost of Spacecraft Ground Systems and
Operations (RCSGSO 2007). Moscow, Russia. June 2007
(Szewczyk et al., 2004) R. Szewczyk, A. Mainwaring, J. Polastre, J. Anderson, D. Culler. An
analysis of a large scale habitat monitoring application. In Proceedings of the Second ACM
Conference on Embedded Networked Sensor Systems (SenSys) 2004
(Szewczyk et al., 2004a) R. Szewczyk, J. Polastre, A. Mainwaring, and D. Culler. Lessons
from a sensor network expedition. In Proceedings of the First European Workshop on Sensor
Networks (EWSN), Berlin, Germany, Jan. 2004.
(Tolle et al.,2005) G. Tolle, J. Polastre, R. Szewczyk, N. Turner, K. Tu, P. Buonadonna, S.
Burgess, D. Gay, W. Hong, T. Dawson, D. Culler. A macroscope in the redwoods. In

REFERENCES 68
Proceedings of the Third ACM Conference on Embedded Networked Sensor Systems (SenSys),
2005.
(UAH VAST, 2009) UAH VAST, Homepage,
http://vast.uah.edu/index.php?option=com_content&view=frontpage&Itemid=1. Accessed
04‐01‐2009.
(UAH VAST, 2009a) UAH VAST, Space Time Toolkit Overview,
http://vast.uah.edu/index.php?option=com_content&view=article&id=16&Itemid=55.
Accessed 04‐01‐2009.
(Vieira et al., 2003) M.A.M. Vieira, C.N. Coelho Jr., D.C. da Silva Jr, J.M. da Mata. Survey
on wireless sensor network devices. Emerging Technologies and Factory Automation, 2003.
Proceedings. ETFA ʹ03. IEEE Conference. Publication Date: 16‐19 Sept. 2003. Volume: 1, On
page(s): 537‐ 544 vol.1
(Vivid Solutions Inc., 2008) Vivid Solutions Inc. , JTS Topology Suite Official Homepage.
(http://www.vividsolutions.com/jts/JTSHome.htm) Accesed 27‐01‐2008.
(Vivid Solutions Inc., 2008a) Vivid Solutions Inc., JTS Developer Guide (draft), Version 1.4,
2003. (http://www.vividsolutions.com/jts/bin/JTS%20Developer%20Guide.pdf) Accesed 27‐
12‐2008.
(NASA, 2008) NASA, Volcano Sensorweb website. http://sensorwebs.jpl.nasa.gov/. Accessed
31‐12‐2008.
(Werner‐Allen et al., 2005) G. Werner‐Allen, J. Johnson, M. Ruiz, J. Lees, and M. Welsh.
Monitoring volcanic eruptions with a wireless sensor network. In Proceedings of the Second
European Workshop on Wireless Sensor Networks (EWSN’05), January 2005.
(Werner‐Allen et al., 2006) G. Werner‐Allen, K. Lorincz, M. Ruiz, O. Marcillo, J. Johnson, J.
Lees, and M. Welsh. Deploying a wireless sensor network on an active volcano. IEEE Internet
Computing, Special Issue on Data‐Driven Applications in Sensor Networks, March/April 2006.
(Werner‐Allen et al., 2006a) G. Werner‐Allen, K. Lorincz, J. Johnson, J. Lees, M. Welsh.
Fidelity and yield in a volcano monitoring sensor network. In USENIX’06: Proceedings of the 7th

REFERENCES 69
conference on USENIX Symposium on Operating Systems Design and Implementation.
USENIX Association, Berkeley, CA, USA, 27–27.
(Zhang et al., 2004) B. Zhang, G.S. Sukhatme, A.A. Requicha. Adaptive sampling for marine
microorganism monitorin., In: IEEE/RSJ International Conference on Intelligent Robots and
Systems, 2004.

GVSOS: A NEW CLIENT FOR OGC® SOS INTERFACE STANDARD
2008
Alain Tamayo Fong