Gut Microbiota of Healthy Canadian Infants-profiles by Mode of Delivery and Infant Diet at 4...
10
T he human body harbours trillions of microbes, known collectively as the “human microbiome.” By far the highest density of commensal bacteria is found in the digestive tract, where resident microbes outnumber host cells by at least 10 to 1. Gut bacteria play a fundamental role in human health by promoting intestinal homeostasis, stimulating development of the immune system, providing protection against pathogens, and contributing to the processing of nutrients and harvesting of energy. 1,2 The disruption of the gut microbiota has been linked to an increas- ing number of diseases, including inflammatory bowel disease, necrotizing enterocolitis, diabetes, obesity, cancer, allergies and asthma. 1 Despite this evidence and a growing appreciation for the inte- gral role of the gut microbiota in lifelong health, relatively little is known about the acquisition and development of this complex microbial commu- nity during infancy. 3 Two of the best-studied determinants of the gut microbiota during infancy are mode of deliv- ery and exposure to breast milk. 4,5 Cesarean deliv- ery perturbs normal colonization of the infant gut by preventing exposure to maternal microbes, whereas breastfeeding promotes a “healthy” gut microbiota by providing selective metabolic sub- strates for beneficial bacteria. 3,5 Despite recom- mendations from the World Health Organization, 6 the rate of cesarean delivery has continued to rise in developed countries and rates of breastfeeding decrease substantially within the first few months of life. 7,8 In Canada, more than 1 in 4 newborns are born by cesarean delivery, and less than 15% of infants are exclusively breastfed for the recom- mended duration of 6 months. 9,10 In some parts of the world, elective cesarean deliveries are per- formed by maternal request, often because of apprehension about pain during childbirth, and sometimes for patient– physician convenience. 11 Gut microbiota of healthy Canadian infants: profiles by mode of delivery and infant diet at 4 months Meghan B. Azad PhD, Theodore Konya MPH, Heather Maughan PhD, David S. Guttman PhD, Catherine J. Field PhD, Radha S. Chari MD, Malcolm R. Sears MB, Allan B. Becker MD, James A. Scott PhD, Anita L. Kozyrskyj PhD, on behalf of the CHILD Study Investigators Competing interests: Allan Becker is an advisory board member for Merck, Novartis and AstraZeneca; his institution has received research grants from Merck and AstraZeneca. No competing interests were declared by the other authors. This article has been peer reviewed. Additional CHILD Study Investigators are listed at the end of the article. Correspondence to: Anita Kozyrskyj, [email protected] CMAJ 2013. DOI:10.1503 /cmaj.121189 Research CMAJ Background: The gut microbiota is essential to human health throughout life, yet the acquisition and development of this microbial community during infancy remains poorly understood. Meanwhile, there is increasing concern over rising rates of cesarean delivery and insufficient exclusive breastfeeding of infants in developed countries. In this article, we characterize the gut microbiota of healthy Canadian infants and describe the influence of cesarean delivery and formula feeding. Methods: We included a subset of 24 term infants from the Canadian Healthy Infant Longitudinal Development (CHILD) birth cohort. Mode of delivery was obtained from medical records, and mothers were asked to report on infant diet and medication use. Fecal samples were collected at 4 months of age, and we characterized the microbiota composi- tion using high-throughput DNA sequencing. Results: We observed high variability in the profiles of fecal microbiota among the in- fants. The profiles were generally dominated by Actinobacteria (mainly the genus Bifi- dobacterium) and Firmicutes (with diverse representation from numerous genera). Com- pared with breastfed infants, formula-fed infants had increased richness of species, with overrepresentation of Clostridium difficile. Escherichia–Shigella and Bacteroides species were underrepresented in infants born by cesarean delivery. Infants born by elective cesarean delivery had particularly low bacter- ial richness and diversity. Interpretation: These findings advance our understanding of the gut microbiota in healthy infants. They also provide new evi- dence for the effects of delivery mode and infant diet as determinants of this essential microbial community in early life. Abstract © 2013 Canadian Medical Association or its licensors CMAJ, March 19, 2013, 185(5) 385 See related commentary by Song and colleagues on page 373 and at www.cmaj.ca/lookup/doi/10.1503/cmaj.130147
-
Upload
karen-rojas -
Category
Documents
-
view
13 -
download
1
Transcript of Gut Microbiota of Healthy Canadian Infants-profiles by Mode of Delivery and Infant Diet at 4...

The human body harbours trillions ofmicrobes, known collectively as the“human microbiome.” By far the highest
density of commensal bacteria is found in thedigestive tract, where resident microbes outnumberhost cells by at least 10 to 1. Gut bacteria play afundamental role in human health by promotingintestinal homeostasis, stimulating development ofthe immune system, providing protection againstpathogens, and contributing to the processing ofnutrients and harvesting of energy.1,2 The disruptionof the gut microbiota has been linked to an increas-ing number of diseases, including inflammatorybowel disease, necrotizing enterocolitis, diabetes,obesity, cancer, allergies and asthma.1 Despite thisevidence and a growing appreciation for the inte-gral role of the gut microbiota in lifelong health,relatively little is known about the acquisition anddevelopment of this complex microbial commu-nity during infancy.3
Two of the best-studied determinants of thegut microbiota during infancy are mode of deliv-ery and exposure to breast milk.4,5 Cesarean deliv-ery perturbs normal colonization of the infant gutby preventing exposure to maternal microbes,whereas breastfeeding promotes a “healthy” gutmicrobiota by providing selective metabolic sub-strates for beneficial bacteria.3,5 Despite recom-mendations from the World Health Organization,6
the rate of cesarean delivery has continued to risein developed countries and rates of breastfeedingdecrease substantially within the first few monthsof life.7,8 In Canada, more than 1 in 4 newbornsare born by cesarean delivery, and less than 15%of infants are exclusively breastfed for the recom-mended duration of 6 months.9,10 In some parts ofthe world, elective cesarean deliveries are per-formed by maternal request, often because ofapprehension about pain during childbirth, andsometimes for patient– physician convenience.11
Gut microbiota of healthy Canadian infants:profiles by mode of delivery and infant diet at 4 months
Meghan B. Azad PhD, Theodore Konya MPH, Heather Maughan PhD, David S. Guttman PhD,Catherine J. Field PhD, Radha S. Chari MD, Malcolm R. Sears MB, Allan B. Becker MD, James A. Scott PhD,Anita L. Kozyrskyj PhD, on behalf of the CHILD Study Investigators
Competing interests: AllanBecker is an advisory boardmember for Merck,Novartis and AstraZeneca;his institution has receivedresearch grants from Merckand AstraZeneca. Nocompeting interests weredeclared by the otherauthors.
This article has been peerreviewed.
Additional CHILD StudyInvestigators are listed atthe end of the article.
Correspondence to: Anita Kozyrskyj,[email protected]
CMAJ 2013. DOI:10.1503/cmaj.121189
ResearchCMAJ
Background: The gut microbiota is essentialto human health throughout life, yet theacquisition and development of this microbialcommunity during infancy remains poorlyunderstood. Meanwhile, there is increasingconcern over rising rates of cesarean deliveryand insufficient exclusive breastfeeding ofinfants in developed countries. In this article,we characterize the gut microbiota of healthyCanadian infants and describe the influenceof cesarean delivery and formula feeding.
Methods: We included a subset of 24 terminfants from the Canadian Healthy InfantLong itudinal Development (CHILD) birthcohort. Mode of delivery was obtained frommedical records, and mothers were asked toreport on infant diet and medication use. Fecalsamples were collected at 4 months of age,and we characterized the microbiota composi-tion using high-throughput DNA sequencing.
Results: We observed high variability in theprofiles of fecal microbiota among the in -fants. The profiles were generally dominatedby Actinobacteria (mainly the genus Bifi-dobacterium) and Firmicutes (with diverserepresentation from numerous genera). Com-pared with breastfed infants, formula-fedinfants had increased richness of species, withoverrepresentation of Clostridium difficile.Escherichia– Shigella and Bacteroides specieswere underrepresented in infants born bycesarean delivery. Infants born by electivecesarean delivery had particularly low bacter-ial richness and diversity.
Interpretation: These findings advance ourunderstanding of the gut microbiota inhealthy infants. They also provide new evi-dence for the effects of delivery mode andinfant diet as determinants of this essentialmicrobial community in early life.
Abstract
© 2013 Canadian Medical Association or its licensors CMAJ, March 19, 2013, 185(5) 385
See related commentary by Song and colleagues on page 373 and at www.cmaj.ca/lookup/doi/10.1503/cmaj.130147

The potential long-term consequences ofdecisions regarding mode of delivery and infantdiet are not to be underestimated. Infants born bycesarean delivery are at increased risk of asthma,obesity and type 1 diabetes,12 whereas breast-feeding is variably protective against these andother disorders.13 These long-term health conse-quences may be partially attributable to disrup-tion of the gut microbiota.12,14
Historically, the gut microbiota has beenstudied with the use of culture-based method-ologies to examine individual organisms. How-ever, up to 80% of intestinal microbes cannotbe grown in culture.3,15 New technology using
culture- independent DNA sequencing enablescomprehensive detection of intestinal microbesand permits simultaneous characterization ofentire microbial communities. Multinationalconsortia have been established to characterizethe “normal” adult microbiome using theseexciting new methods;16 however, these meth-ods have been underused in infant studies.Because early colonization may have long- lasting effects on health, infant studies arevital.3,4 Among the few studies of infant gutmicrobiota using DNA sequencing, most wereconducted in restricted populations, such asinfants delivered vaginally,17 infants born by
Research
386 CMAJ, March 19, 2013, 185(5)
Table 1: Characteristics of term infants in study population
Infant Age, wk Sex
Mode of delivery
Premature rupture of membranes
> 24 h
Group B streptococcal
culture
Breastfeeding at time of
fecal sampling
Use of antibiotics
Mother (timing) Infant (age)
Vaginal delivery, not breastfeeding
A 23 F Vaginal No No None Cephalexin (31 WG) Mother could not recall
B 18 F Vaginal No Yes None Penicillin G (labour) None
C 22 F Vaginal No No None None Mother could not recall
D 15 F Vaginal Yes No None None Ampicillin and gentamicin (2 d)
E 13 M Vaginal No Yes None Azithromycin (20 WG); Penicillin G (labour)
None
F 23 M Vaginal No Unknown None Unknown None
G 16 M Vaginal No Yes None Penicillin G (labour) None
Vaginal delivery, breastfeeding
H 14 F Vaginal No No Exclusive None None
I 17 F Vaginal Yes No Partial None None
J 15 M Vaginal No Unknown Exclusive Ampicillin (after delivery) None
K 18 M Vaginal No No Exclusive None None
L 15 M Vaginal No No Exclusive None None
M 21 F Vaginal No Yes Partial None None
N 11 F Vaginal No No Partial None None
O 20 F Vaginal No No Exclusive None None
P 19 F Vaginal No No Exclusive None None
Q 21 F Vaginal Yes No Exclusive None None
R 20 M Vaginal No No Exclusive None None
Cesarean delivery, not breastfeeding
S 17 F Cesarean, EM No No None Cefazolin (preop); cefazolin and metronidazole (postop)
None
T 14 M Cesarean, EM No No None Cefazolin (postop) None
Cesarean delivery, breastfeeding
U 15 M Cesarean, EL No Unknown Partial Cefazolin (preop) Amoxicillin (6 wk)
V 18 M Cesarean, EL No Unknown Exclusive Cephalexin (postop) None
W 18 M Cesarean, EM No Yes Partial Penicillin G (labour) None
X 16 M Cesarean, EL No No Exclusive Clindamycin (preop) Amoxicillin (12 wk)
Note: EL = elective, EM = emergency, preop = preoperatively, postop = postoperatively, WG = weeks gestation.

cesarean delivery who were formula-fed18 orpreterm infants with necrotizing enterocolitis.19
Thus, the gut microbiota is essential to humanhealth, yet the acquisition and development of thismicrobial community during infancy remainspoorly understood.3 In the current study, weaddress this gap in knowledge using new sequenc-ing technology and detailed exposure assess-ments20 of healthy Can adian infants selected froma national birth cohort to provide representative,comprehensive profiles of gut microbiota accord-ing to mode of delivery and infant diet.
Methods
Study designThis descriptive study included 24 term (37–41weeks’ gestation) infants whose mothers were re -cruited at the Winnipeg, Manitoba, site of theCanadian Healthy Infant Longitudinal Develop-ment (CHILD) population-based birth cohort(www.canadianchildstudy.ca). Pregnant womenwere enrolled between November 2008 andAugust 2009. We selected the first 24 infants forwhom fecal samples were available for analysis.
Research
CMAJ, March 19, 2013, 185(5) 387
Rel
ativ
e ab
un
dan
ce, %
100
80
60
40
20
Rel
ativ
e ab
un
dan
ce, %
100
80
60
40
20
Phylum:
Actinobacteria
Bacteroidetes
Proteobacteria
Firmicutes
ActinobacteriaBacteroidetesProteobacteriaFirmicutes
Other
Antibiotics
* * *
* * *
*
Antibiotics*
G X A B C D E F H I J K L M N O P Q R S T U V W
BF – BF – BF +
BF +Vaginal(n = 11)
BF –Vaginal(n = 7)
BF +Cesarean
(n = 4)
BF –Cesarean
(n = 2)
BF +Vaginal(n = 11)
BF –Vaginal(n = 7)
BF +Cesarean
(n = 4)
BF –Cesarean
(n = 2)
BF +
Vaginal delivery Cesarean
G X A B C D E F H I J K L M N O P Q R S T U V W
BF – BF – BF +BF +
Vaginal delivery Cesarean
Bi!dobacteriaceae
Bacteroidaceae
Enterobacteriaceae
Lachnospiraceae
Streptococcaceae
Erysipelotrichaceae
Veillonellaceae
Clostridiaceae
Other
A
B
Figure 1: Composition of fecal microbiota in 24 healthy infants (mean age 4 mo), at the phylum (A) and family (B) level, by mode ofdelivery and diet. Each column represents 1 infant, as described in Table 1. BF – = no breastfeeding, BF + = exclusive or partial breast-feeding from birth until fecal sampling.

Mode of delivery, timing of membrane rupture,use of maternal antibiotics and group B strepto-coccus status were obtained from hospital rec -ords. Stool samples were collected from theinfants at age 3–4 months. Mothers were asked tocomplete a questionnaire for information aboutinfant diet (categorized as exclusive, partial or nobreastfeeding) and medication use. Informed con-sent was obtained from parents at enrolment. Thisstudy was approved by the University of Mani-toba Health Research Ethics Board.
Analysis of fecal samplesComplete protocols are included in Appendix 1(available at www.cmaj.ca/lookup/suppl /doi:10.1503/cmaj.121189/-/DC1). In brief, bacterial
DNA was extracted from stool samples using theFastPrep DNA for Soil Kit (MP Biomedicals,Solon, Ohio), followed by high-throughput signa-ture gene sequencing to identify individual organ-isms. The signature gene used was 16S rRNA,which is ubiquitous among bacteria and containsvariable regions that can be used to identify indi-vidual species. The variable regions V5, V6 andV7 were amplified, sequenced and classifiedaccording to SILVA taxonomy (www.arb-silva.de),as described previously.21 We used quantitativepolymerase chain reaction as described by Pendersand colleagues5 for targeted analysis of Clostrid-ium difficile because of the organism’s associationwith atopic allergic disease in a previous study.25
Statistical analysisIn this descriptive study, we report fecal micro-biome biodiversity and relative abundance ofbacterial taxa according to mode of delivery andinfant diet. Biodiversity measures — the Chao1score and the Shannon diversity index — werecalculated using the open-source software pack-age QIIME (Quantitative Insights into MicrobialEcology, http://qiime.org/) with rarefied data(10 000 sequences per sample). The Chao1 scoreestimates the number of different species presentand the Shannon diversity index evaluates boththe number of species and the evenness of theirdistribution. Taking advantage of our sample size(larger than many in sequencing-based studies ofinfant gut microbiota), we performed statisticalcomparisons using analysis of variance, thet test, Spearman rank-order correlation or theCochrane–Armitage χ2 test for trend, as indi-cated. We assessed differential abundance ofbacterial taxa at the family and genus levelsusing Metastats (http://metastats.cbcb.umd.edu).Meta stats is a statistically rigorous methoddesigned specifically to compare microbial com-munities on the basis of 16S rRNA abundancedata. To account for multiple testing, Metastatscomputes q values, which may be interpreted asp values adjusted for multiple comparisons.
Results
Study populationFecal samples were collected from 24 healthyterm infants (mean age ± standard deviation 17.4± 3.2 weeks). The study population comprisedequal numbers of boys and girls; 6 infants (25%)were born by cesarean delivery (Table 1). At thetime of sampling, 10 (42%) of the infants wereexclusively breastfed, 5 (21%) were partiallybreastfed (supplemented with formula), and 9(38%) were not breastfed. Exclusive breastfeedingwas more common among infants born vaginally
Research
388 CMAJ, March 19, 2013, 185(5)
Table 2: Relative abundance and frequency of dominant phyla, families and genera in fecal samples obtained at 4 months from 24 healthy Canadian infants
Taxon* Relative abundance,†
%, median (IQR) Frequency,
no. (%) of infants
Actinobacteria 36.4 (10.9–69.5) 19 (79.2)
Bifidobacteriaceae 35.2 (0.3–68.3) 18 (75.0)
Bifidobacterium 35.2 (0.3–68.3) 18 (75.0)
Coriobacteriaceae 0.0 (0.0–0.6) 11 (45.8)
Eggerthella 0.0 (0.0–0.4) 8 (33.3)
Bacteroidetes 0.0 (0.0–0.8) 9 (37.5)
Bacteroidaceae 0.0 (0.0–0.8) 9 (37.5)
Bacteroides 0.0 (0.0–0.8) 9 (37.5)
Proteobacteria 7.4 (2.8–21.5) 24 (100.0)
Enterobacteriaceae 7.4 (2.8–20.9) 24 (100.0)
Escherichia–Shigella 5.3 (2.4–14.6) 20 (83.3)
Firmicutes 43.8 (15.3–74.9) 24 (100.0)
Clostridiaceae 0.1 (0.0–2.0) 12 (50.0)
Clostridium 0.1 (0.0–2.0) 12 (50.0)
Enterococcaceae 0.4 (0.0–1.9) 15 (62.5)
Enterococcus 0.4 (0.0–1.9) 15 (62.5)
Erysipelotrichaceae 0.8 (0.0–6.8) 14 (58.3)
Lachnospiraceae 14.2 (5.7–35.8) 22 (91.7)
Blautia 0.0 (0.0–0.6) 6 (25.0)
Peptostreptococcaceae 0.0 (0.0–1.5) 11 (45.8)
Ruminococcaceae 0.0 (0.0–0.6) 8 (33.3)
Streptococcaceae 1.1 (0.3–5.3) 20 (83.3)
Streptococcus 1.1 (0.3–5.3) 20 (83.3)
Veillonellaceae 0.9 (0.0–7.5) 17 (70.8)
Veillonella 0.9 (0.0–7.5) 16 (66.7)
Note: IQR = interquartile range. *Unclassified genera are not listed but are included within their respective family and phylum counts. Taxa present in only 1 infant or that had an interquartile range of 0.0–0.0 are omitted. †Values represent the percentages of all 16S gene sequences analyzed, after quality processing as described in Appendix 1 (available at www.cmaj.ca/lookup/suppl/doi:10.1503 /cmaj.121189/-/DC1).

than among those born by cesarean delivery (44%v. 33%). Of the mothers, 11 (46%) received anti -biotics during pregnancy or at delivery, including5 (28%) of the mothers who had a vaginal deliv-ery and all of those who had cesarean delivery.Three infants received antibiotics directly.
Profiles of gut microbiotaThe relative abundance of dominant bacterialphyla, families and genera for each infant is
shown in Figure 1, with median values presentedin Table 2. Fecal microbiota profiles were gener-ally dominated by the phylum Actinobacteria(median 36.4%, with representation mainly bythe genus Bifidobacterium) and Firmicutes(median 43.8%, with diverse representation fromnumerous genera). A strong negative correlationwas observed between these dominant phyla (r =−0.92, p < 0.001). Bacteria in the phylum Pro-teobacteria were less abundant (median 7.4%)
Research
CMAJ, March 19, 2013, 185(5) 389
Table 3: Relative abundance of dominant phyla, families and genera in fecal samples, by mode of delivery and infant diet*
Taxon†
Relative abundance,‡ %, mean ± SE
p value
Relative abundance,‡ %, mean ± SE
p value Vaginal delivery
n = 18 Cesarean delivery
n = 6 Not breastfed
n = 9 Breastfed
n = 15
Actinobacteria
Bifidobacteriaceae 36.6 ± 7.8 48.6 ± 14.8 > 0.1 34.4 ± 9.8 42.8 ± 9.4 > 0.1
Bifidobacterium 36.6 ± 7.8 48.6 ± 14.8 > 0.1 34.4 ± 9.8 42.8 ± 9.4 > 0.1
Coriobacteriaceae 1.8 ± 0.9 0.3 ± 0.1 > 0.1 1.6 ± 1.0 1.3 ± 0.9 > 0.1
Eggerthella 0.5 ± 0.3 0.3 ± 0.2 > 0.1 0.6 ± 0.4 0.4 ± 0.2 > 0.1
Bacteroidetes
Bacteroidaceae 1.0 ± 0.4 0.0 ± 0.0 0.03 0.7 ± 0.4 0.8 ± 0.4 > 0.1
Bacteroides 1.0 ± 0.4 0.0 ± 0.0 0.02§ 0.7 ± 0.4 0.8 ± 0.4 > 0.1
Proteobacteria
Enterobacteriaceae 13.7 ± 2.7 6.2 ± 3.1 > 0.1 9.5 ± 2.6 13.2 ± 3.3 > 0.1
Escherichia–Shigella 13.6 ± 2.7 1.0 ± 0.7 < 0.001§ 8.3 ± 2.9 11.8 ± 3.4 > 0.1
Pasteurellaceae 0.1 ± 0.1 0.6 ± 0.6 > 0.1 0.0 ± 0.0 0.4 ± 0.3 0.04
Haemophilus 0.1 ± 0.1 0.6 ± 0.6 > 0.1 0.0 ± 0.0 0.4 ± 0.3 0.06
Firmicutes
Clostridiaceae 2.8 ± 2.0 2.1 ± 1.0 > 0.1 1.4 ± 0.5 3.4 ± 2.3 > 0.1
Clostridium 2.8 ± 2.0 2.1 ± 1.0 > 0.1 1.4 ± 0.5 3.4 ± 2.3 > 0.1
Enterococcaceae 1.6 ± 0.6 0.9 ± 0.8 > 0.1 1.8 ± 0.9 1.3 ± 0.5 > 0.1
Enterococcus 1.6 ± 0.6 0.9 ± 0.8 > 0.1 1.8 ± 0.9 1.3 ± 0.5 > 0.1
Erysipelotrichaceae 4.6 ± 2.0 7.1 ± 3.8 > 0.1 3.0 ± 1.1 6.6 ± 2.8 > 0.1
Lachnospiraceae 22.8 ± 5.7 19.5 ± 6.3 > 0.1 33.1 ± 8.9 15.3 ± 4.2 > 0.1
Blautia 2.2 ± 1.4 5.4 ± 4.9 > 0.1 4.3 ± 2.6 2.1 ± 2.0 > 0.1
Coprococcus 0.9 ± 0.7 0.6 ± 0.6 > 0.1 0.9 ± 0.5 0.8 ± 0.8 > 0.1
Peptostreptococcaceae 1.2 ± 0.5 1.2 ± 0.7 > 0.1 2.9 ± 0.8 0.2 ± 0.1 0.002§
Ruminococcaceae 0.7 ± 0.3 0.4 ± 0.3 > 0.1 1.2 ± 0.5 0.2 ± 0.2 0.08
Streptococcaceae 4.7 ± 2.4 8.7 ± 6.8 > 0.1 3.0 ± 1.1 7.3 ± 3.8 > 0.1
Streptococcus 4.6 ± 2.4 8.7 ± 6.8 > 0.1 3.0 ± 1.1 7.3 ± 3.8 > 0.1
Veillonellaceae 5.0 ± 1.8 3.6 ± 2.0 > 0.1 3.6 ± 2.2 5.4 ± 1.9 > 0.1
Veillonella 5.0 ± 1.8 3.6 ± 2.0 > 0.1 3.5 ± 2.2 5.3 ± 1.9 > 0.1
Verrucomicrobia
Verrucomicrobiaceae 0.6 ± 0.6 0.6 ± 0.6 > 0.1 1.6 ± 1.2 0.0 ± 0.0 0.001§
Akkermansia 0.6 ± 0.6 0.6 ± 0.6 > 0.1 1.6 ± 1.2 0.0 ± 0.0 0.001§
Note: SE = standard error. *We assessed differential abundance of bacterial taxa using Metastats. †Taxa were excluded from this analysis if they did not exceed 1% relative abundance in at least 1 sample or were not present in at least 3 infants. ‡Values represent the percentages of all 16S gene sequences analyzed, after quality processing as described in Appendix 1 (available at www.cmaj.ca/lookup /suppl/doi:10.1503/cmaj.121189/-/DC1). §p < 0.05 after correction for multiple testing.
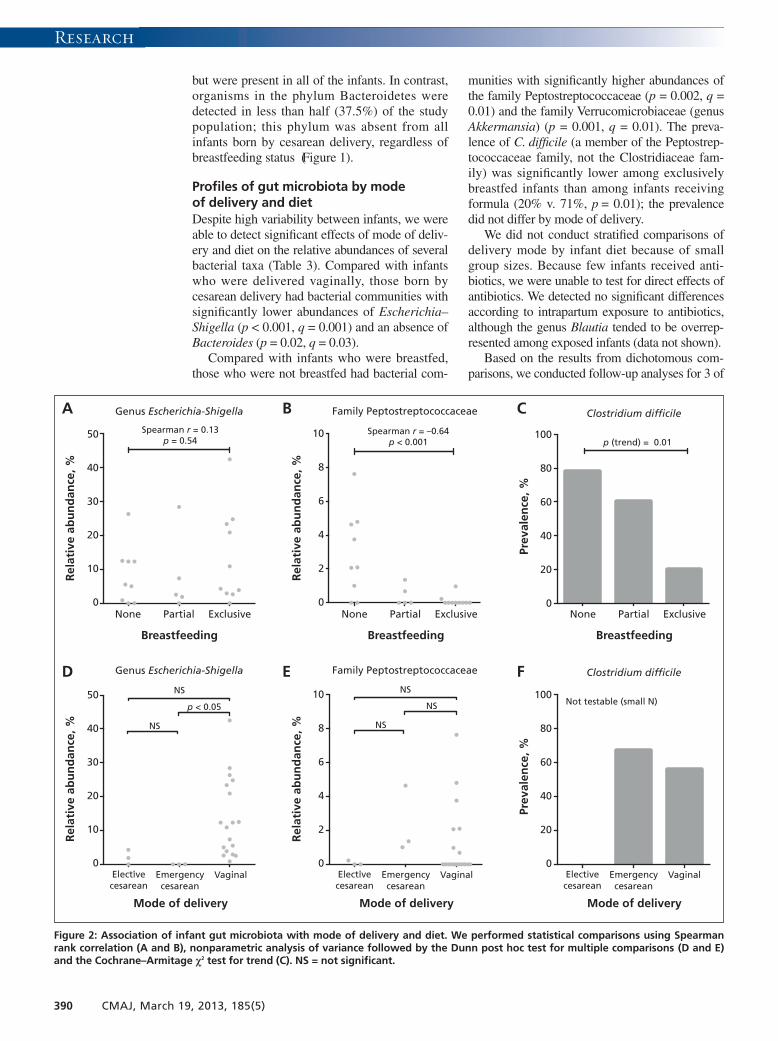
but were present in all of the infants. In contrast,organisms in the phylum Bacteroidetes weredetected in less than half (37.5%) of the studypopulation; this phylum was absent from allinfants born by cesarean delivery, regardless ofbreastfeeding status (Figure 1).
Profiles of gut microbiota by modeof delivery and dietDespite high variability between infants, we wereable to detect significant effects of mode of deliv-ery and diet on the relative abundances of severalbacterial taxa (Table 3). Compared with infantswho were delivered vaginally, those born bycesarean delivery had bacterial communities withsignificantly lower abundances of Escherichia–Shigella (p < 0.001, q = 0.001) and an absence ofBacteroides (p = 0.02, q = 0.03).
Compared with infants who were breastfed,those who were not breastfed had bacterial com-
munities with significantly higher abundances ofthe family Peptostreptococcaceae (p = 0.002, q =0.01) and the family Verrucomicrobiaceae (genusAkkermansia) (p = 0.001, q = 0.01). The preva-lence of C. difficile (a member of the Peptostrep-tococcaceae family, not the Clostridiaceae fam-ily) was significantly lower among exclusivelybreastfed infants than among infants receivingformula (20% v. 71%, p = 0.01); the prevalencedid not differ by mode of delivery.
We did not conduct stratified comparisons ofdelivery mode by infant diet because of smallgroup sizes. Because few infants received anti -biotics, we were unable to test for direct effects ofantibiotics. We detected no significant differencesaccording to intrapartum exposure to antibiotics,although the genus Blautia tended to be overrep-resented among exposed infants (data not shown).
Based on the results from dichotomous com-parisons, we conducted follow-up analyses for 3 of
Research
390 CMAJ, March 19, 2013, 185(5)
A B C
D E F
Rel
ativ
e ab
un
dan
ce, %
Genus Escherichia-Shigella
Spearman r = 0.13p = 0.54
None ExclusivePartial
Breastfeeding
None ExclusivePartial
Breastfeeding
None ExclusivePartial
Breastfeeding
50
40
30
20
10
0
Rel
ativ
e ab
un
dan
ce, %
50
40
30
20
10
0
Family Peptostreptococcaceae
Spearman r = –0.64p < 0.001
Rel
ativ
e ab
un
dan
ce, %
10
8
6
4
2
0
Rel
ativ
e ab
un
dan
ce, %
10
8
6
4
2
0
Clostridium dif!cile
Genus Escherichia-Shigella Family Peptostreptococcaceae Clostridium dif!cile
p (trend) = 0.01
Prev
alen
ce, %
100
80
60
40
20
0
Prev
alen
ce, %
100
80
60
40
20
0
NS
NS
p < 0.05
Mode of delivery
Electivecesarean
Emergencycesarean
Vaginal
Mode of delivery
Electivecesarean
Emergencycesarean
Vaginal
Mode of delivery
Electivecesarean
Emergencycesarean
Vaginal
NS
NS
NS Not testable (small N)
Figure 2: Association of infant gut microbiota with mode of delivery and diet. We performed statistical comparisons using Spearmanrank correlation (A and B), nonparametric analysis of variance followed by the Dunn post hoc test for multiple comparisons (D and E)and the Cochrane–Armitage χ2 test for trend (C). NS = not significant.

Research
the most differentially abundant taxa: Pepto -streptococcaceae, Escherichia–Shigella and C. dif-ficile (Figure 2). Exposure groups were subcateg -or ized, with diet classified as partial, exclusive orno breastfeeding, and mode of delivery classifiedas vaginal, emergency cesarean or electivecesarean. Trend testing indicated that exclusivity ofbreastfeeding was negatively correlated with therelative abundance of Peptostreptococcaceae(Spearman r = −0.64, p < 0.001) and prevalence ofC. difficile (p for trend = 0.01). Three-group com-parisons revealed that the Escherichia–Shigellalineage was underrepresented in the elective andemergency cesarean groups, attaining statisticalsignificance in the latter compared with vaginaldelivery (p < 0.05). Consistent with the dichoto-mous comparisons, there was no diet-associatedtrend in the relative abundance of Escherichia–Shigella and no differences associated with modeof delivery for Peptostreptococcaceae.
Richness and diversityOverall, the mean rarefied Chao1 score forspecies richness was 12.0 (range 3–22). Themean Shannon diversity index was 1.38, rangingfrom 0.17 to 2.36 (Table 4). Formula-fed infants
had increased richness compared with breastfedinfants (p = 0.006) and tended to have higherdiversity. When classified by mode of delivery,infants born by elective cesarean delivery had thelowest richness and diversity.
Certain taxa were correlated with bacterialrichness and diversity. The relative abundance ofPeptostreptococcaceae was positively correlatedwith both richness (r = 0.52, p = 0.01) and diver-sity (r = 0.50, p = 0.01). The Escherichia–Shigella abundance was negatively correlatedwith richness (r = −0.41, p < 0.05), and thegenus Bifidobacterium was negatively correlatedwith diversity (r = −0.57, p = 0.004). These andother correlations are shown in Table 5.
Interpretation
Using new high-throughput gene sequencingtechnology, we have characterized the gut micro-biota of healthy term infants and reported differ-ences according to mode of delivery and infantdiet. The infants included in our study were partof the CHILD national birth cohort. With its pop-ulation-based sample and detailed exposureassessments, this cohort is an ideal platform from
CMAJ, March 19, 2013, 185(5) 391
Table 4: Richness and diversity of fecal microbiota in infants, by early-life exposures
Exposure No. of infants
Richness score,* mean ± SD p value†
Diversity index,* mean ± SD p value†
Overall 24 12.0 ± 5.0 1.38 ± 0.53
Sex
Female 12 12.1 ± 5.0 0.9 1.37 ± 0.53 0.9
Male 12 11.9 ± 5.1 1.40 ± 0.56
Mode of delivery
Vaginal 18 11.2 ± 4.4 0.007 1.33 ± 0.49 0.06
Emergency cesarean 3 19.7 ± 3.2 2.02 ± 0.48
Elective cesarean 3 9.3 ± 1.5 1.09 ± 0.47
Receipt of antibiotics
No 19 11.5 ± 4.9 0.8 1.34 ± 0.55 0.6
Yes 3 10.7 ± 3.8 1.52 ± 0.53
At 2 d (infant D) 1 15 1.99
At 6 wk (infant U) 1 9 0.95
At 3 mo (infant X) 1 8 1.62
Diet at 4 mo
Exclusively breastfed 10 9.0 ± 4.1 0.006 1.19 ± 0.51 0.1
Partially breastfed 5 12.6 ± 5.3 1.42 ± 0.64
Not breastfed 9 15.0 ± 4.0 1.58 ± 0.47
Note: SD = standard deviation. *Richness was measured with the Chao1 score, which estimates the number of different species present. Diversity was measured with the Shannon diversity index, which evaluates both the number of species and the evenness of their distribution. †Two-tailed Student t-test or analysis of variance, with trend test for diet groups.

which to study the early-life development of thegut microbiota. Our study addresses an importantknowledge gap, since the infant gut microbiotahas rarely been characterized with sequencingmethods that provide sufficient coverage of theentire bacterial community.3 Our findings are par-ticularly timely given the recent affirmation of thegut microbiota as a “super organ” with diverseroles in health and disease,1 and the increasingconcern over rising rates of cesarean delivery andinsufficient exclusive breastfeeding in Canada.9,10
Influenced by a variety of early-life exposures,the infant gut microbiota plays a crucial role inlifelong health (Figure 3). Our current findingsillustrate how this essential microbial communityis modified by mode of delivery and infant diet.
We identified several groups of intestinal bac-teria that were differentially represented in infants
born by cesarean delivery. Most striking, theEscherichia–Shigella lineage was underrepre-sented, which is consistent with a previous cul-ture-based study that reported delayed coloniza-tion by E. coli.24 Also consistent with that report,we found that the phylum Bacteroidetes wasundetectable in infants born by cesarean delivery.However, contrary to previous studies,5,24 we didnot observe strong differences by mode of deliv-ery in the prevalence of C. difficile or the relativeabundances of Bifidobacterium or Clostridium.
Bacterial richness and diversity were lowestamong infants born by elective cesarean deliveryand highest among those born by emergencycesarean delivery. Although based on a smallnumber of infants, these findings suggest that col-onization of the infant gut may be affected differ-ently by elective versus emergency cesarean de -livery. Further research is warranted to determinewhether these differences are related to feeding,antibiotics or perhaps “partial” microbial expo-sure during emergency cesarean delivery follow-ing membrane rupture.
Consistent with previous studies,22 our studydetected lower bacterial richness and diversity ininfants who were breastfed. This association isgenerally attributed to unique oligosaccharidesfound in breast milk, which serve as selectivemetabolic substrates for a limited number of gutmicrobes.28 We identified 2 bacterial families thatwere significantly overrepresented in the infantsnot receiving breast milk: Peptostreptococcaceaeand Verrucomicrobiaceae. The family Peptostrep-tococcaceae includes C. difficile, a pathogen asso-ciated with enteric and atopic disease.25 Thispathogen is more commonly detected in formula-fed than in breastfed infants,5 as was confirmed byour findings. We did not detect differential repre-sentation of the genus Bifidobacterium accordingto infant diet, as others have reported.22,23
It has been debated whether microbiota rich-ness and diversity are clinically significant mea-sures, or whether the prevalence of specific “bene-ficial” organisms is more important. We found therelative abundances of certain bacteria to be corre-lated with overall microbiota richness and diver-sity. These correlations were positive in somecases and negative in others, illustrating the com-plexity of this microbial ecosystem and reflectingpossible symbiosis or competition between spe -cies. Further research is required to disentanglethe biological relevance of individual organismsfrom that of more global diversity index measures.
Finally, similar to other sequencing-basedstudies,18,26 we observed high variability of gutmicrobiota between infants. This finding concurswith previous reports in which gut microbiotaprofiles varied widely in the first year of life,
Research
392 CMAJ, March 19, 2013, 185(5)
Table 5: Correlation of richness and diversity of fecal microbiota with relative abundance of dominant phyla, families and genera
Taxon*
Richness† Diversity†
Spearman r p value Spearman r p value
Actinobacteria 0.04 > 0.1 –0.56 0.005
Bifidobacteriaceae 0.07 > 0.1 –0.57 0.004
Bifidobacterium 0.07 > 0.1 –0.57 0.004
Coriobacteriaceae 0.32 > 0.1 0.06 > 0.1
Eggerthella 0.44 0.03 0.11 > 0.1
Bacteroidetes 0.98 > 0.1 –0.03 > 0.1
Bacteroidaceae 0.10 > 0.1 –0.03 > 0.1
Bacteroides 0.10 > 0.1 –0.03 > 0.1
Proteobacteria –0.43 0.03 –0.12 > 0.1
Enterobacteriaceae –0.43 0.03 –0.12 > 0.1
Escherichia–Shigella –0.41 0.05 –0.25 > 0.1
Firmicutes 0.19 > 0.1 0.60 0.002
Clostridiaceae 0.14 > 0.1 0.51 0.01
Clostridium 0.14 > 0.1 0.51 0.01
Enterococcaceae –0.08 > 0.1 0.11 > 0.1
Enterococcus –0.08 > 0.1 0.11 > 0.1
Erysipelotrichaceae 0.37 0.07 0.39 0.06
Lachnospiraceae 0.41 0.05 0.50 0.01
Blautia 0.44 0.03 0.32 > 0.1
Peptostreptococcaceae 0.52 0.01 0.50 0.01
Ruminococcaceae 0.59 0.002 0.55 0.01
Streptococcaceae –0.01 > 0.1 0.25 > 0.1
Streptococcus –0.01 > 0.1 0.25 > 0.1
Veillonellaceae 0.04 > 0.1 0.61 0.002
Veillonella –0.01 > 0.1 0.55 0.01
*Taxa present in only 1 infant or that had an interquartile range for relative abundance of 0.0–0.0 are omitted. †Richness was measured with the Chao1 score, which estimates the number of different species present. Diversity was measured with the Shannon Diversity Index, which evaluates both the number of species and the evenness of their distribution.

before eventually converging toward a more sta-ble and adult-like microbiota.23 As others havereported,29 we detected a predominance of thegenus Bifidobacterium in the gut microbiota ofmany infants. However, in our cohort, some pro-files were dominated by Firmicutes, and severalcontained no Bifidobacterium species at all.
Strengths and limitationsThe major strength of our study is the applica-tion of new high-throughput gene sequencingtechnology to characterize the gut microbiota ofhealthy infants. Our sample is representative ofthe Canadian infant population, with 25% bornby cesarean delivery and 42% fed by exclusivebreastfeeding at 4 months of age (national aver-ages are 27% and 43%, respectively).10,30
The study was limited by a lack of longitudinaldata and insufficient power for detecting differ-ences according to antibiotic use, type of cesareandelivery or brand of infant formula. Also, we couldnot assess interactions between exposure variables,which are frequently inter-related (cesarean deliv-ery is typically accompanied by prophylactic useof antibiotics and can affect breastfeeding suc-cess). In the years ahead, these deficiencies will beaddressed by our ongoing analysis within theCHILD cohort, where longitudinal sampling ofmore than 2000 infants is anticipated and multi-variable analyses will be possible. In the mean-time, our subsample of 24 infants is relatively largeamong studies of infant gut microbiota, many ofwhich have included fewer than 15 infants.18,22,23,29
ConclusionThe findings of this study advance our under-standing of the gut microbiata of healthy infants
and illustrate how this essential microbial com-munity can be influenced by parent and physi-cian decisions regarding mode of delivery andinfant diet.
Still, much needs to be learned about thedeterminants of the infant gut microbiota andassociated health outcomes. First, what consti-tutes a healthy or “ideal” microbiota? Are bacter-ial richness and diversity fundamentally impor-tant, or is it more critical to acquire specificbacteria in a particular combination? Second,what additional factors drive the colonization ofthe infant gut? Existing studies have rarelyaddressed the role of family structure, maternaldiet, infections during infancy or the physicalenvironment (e.g., pets and household chemi-cals). Finally, how does early establishment ofthe gut microbiota influence health and diseaselater in childhood? Recent reports have linkedinfant gut microbiota with subsequent develop-ment of atopic disease and obesity.24–27 We ulti-mately plan to explore all of these associationsby leveraging the comprehensive exposureassessments and clinical outcome measurementsin the CHILD national birth cohort. Our currentresults will inform these and other investigationsof the infant gut microbiota, which together holdimmense potential for advancing our knowledgeof the human microbiome and its role in healthand disease.
References1. Young VB. The intestinal microbiota in health and disease. Curr
Opin Gastroenterol 2012;28:63-9.2. Maynard CL, Elson CO, Hatton RD, et al. Reciprocal interac-
tions of the intestinal microbiota and immune system. Nature2012; 489:231-41.
3. Fouhy F, Ross RP, Fitzgerald G, et al. Composition of the earlyintestinal microbiota: knowledge, knowledge gaps and the use of
Research
CMAJ, March 19, 2013, 185(5) 393
Symbiosis
Dysbiosis
Early-life exposures • Mode of delivery (maternal
microbes) • Infant diet (selective
substrates) • Antibiotics (selective killing) • Probiotics (selective
enrichment) • Physical environment
(environmental microbes)
Gut microbiota • Immune disease
(e.g., atopy, asthma, multiple sclerosis)
• Intestinal disease (e.g., inflammatory bowel disease, necrotizing enterocolitis, colon cancer)
• Metabolic disease (e.g., diabetes, obesity)
• Immune tolerance • Intestinal homeostasis • Healthy metabolism
Figure 3: Exposures in early life, infant gut microbiota and future health. Colonization of the infant intes-tine is influenced by various factors.4,5,14,22,23 The resulting gut microbiota contributes to the development ofthe immune system, intestinal homeostasis and host metabolism.1,2 Disruption of the gut microbiota isassociated with a growing number of diseases.1,4,17–19,24–27

high-throughput sequencing to address these gaps. Gut Microbes2012; 3:203-20.
4. Madan JC, Farzan SF, Hibberd PL, et al. Normal neonatalmicrobiome variation in relation to environmental factors, infec-tion and allergy. Curr Opin Pediatr 2012;24:753-9.
5. Penders J, Thijs C, Vink C, et al. Factors influencing the compo-sition of the intestinal microbiota in early infancy. Pediatrics2006; 118:511-21.
6. The World Health Organization. Global strategy for infant andyoung child feeding: the optimal duration of exclusive breast-feeding. Geneva (Switzerland): The Organization; 2001. Avail-able: http://apps.who.int/gb /archive/pdf_files /WHA54 /ea54id4.pdf (ac cessed 2012 June 6).
7. Declercq E, Young R, Cabral H, et al. Is a rising cesarean deliv-ery rate inevitable? Trends in industrialized countries, 1987 to2007. Birth 2011;38:99-104.
8. Kelly YJ, Watt RG. Breast-feeding initiation and exclusive dura-tion at 6 months by social class — results from the MillenniumCohort Study. Public Health Nutr 2005;8:417-21.
9. Chalmers B, Levitt C, Heaman M, et al. Breastfeeding rates andhospital breastfeeding practices in Canada: a national survey ofwomen. Birth 2009;36:122-32.
10. Canadian Institute for Health Information. Giving birth inCanada: regional trends from 2001–2002 to 2005–2006. Ottawa(ON): The Institute; 2007. Available: https://secure.cihi.ca /free_products/childbirth_aib_070725_e.pdf (accessed 2012 June 6).
11. Miesnik SR, Reale BJ. A review of issues surrounding medicallyelective cesarean delivery. J Obstet Gynecol Neonatal Nurs2007; 36:605-15.
12. Neu J, Rushing J. Cesarean versus vaginal delivery: long-terminfant outcomes and the hygiene hypothesis. Clin Perinatol2011; 38:321-31.
13. Schack-Nielsen L, Michaelsen KF. Breast feeding and futurehealth. Curr Opin Clin Nutr Metab Care 2006;9:289-96.
14. Azad MB, Kozyrskyj AL. Perinatal programming of asthma: therole of gut microbiota. Clin Dev Immunol 2012;2012:932072.
15. Fraher MH, O’Toole PW, Quigley EM. Techniques used to char-acterize the gut microbiota: a guide for the clinician. Nat RevGastroenterol Hepatol 2012;9:312-22.
16. Peterson J, Garges S, Giovanni M, et al. The NIH HumanMicrobiome Project. Genome Res 2009;19:2317-23.
17. Nakayama J, Kobayashi T, Tanaka S, et al. Aberrant structuresof fecal bacterial community in allergic infants profiled by16S rRNA gene pyrosequencing. FEMS Immunol Med Micro-biol 2011;63:397-406.
18. Hong PY, Lee BW, Aw M, et al. Comparative analysis of fecalmicrobiota in infants with and without eczema. PLoS ONE2010; 5:e9964.
19. Mai V, Young CM, Ukhanova M, et al. Fecal microbiota in pre-mature infants prior to necrotizing enterocolitis. PLoS ONE2011; 6:e20647.
20. Arrandale VH, Brauer M, Brook JR, et al. Exposure assessmentin cohort studies of childhood asthma. Environ Health Perspect2011; 119:591-7.
21. Maughan H, Wang PW, Diaz CJ, et al. Analysis of the cysticfibrosis lung microbiota via serial illumina sequencing of bacter-ial 16S rRNA hypervariable regions. PLoS ONE 2012;7:e45791.
22. Bezirtzoglou E, Tsiotsias A, Welling GW. Microbiota profile infeces of breast- and formula-fed newborns by using fluorescencein situ hybridization (FISH). Anaerobe 2011;17:478-82.
23. Roger LC, Costabile A, Holland DT, et al. Examination of faecalBifidobacterium populations in breast- and formula-fed infants dur-ing the first 18 months of life. Microbiology 2010;156:3329-41.
24. Adlerberth I, Strachan DP, Matricardi PM, et al. Gut microbiotaand development of atopic eczema in 3 European birth cohorts.J Allergy Clin Immunol 2007;120:343-50.
25. Penders J, Thijs C, van den Brandt PA, et al. Gut microbiotacomposition and development of atopic manifestations ininfancy: the KOALA Birth Cohort Study. Gut 2007;56:661-7.
26. Abrahamsson TR, Jakobsson HE, Andersson AF, et al. Lowdiversity of the gut microbiota in infants with atopic eczema.J Allergy Clin Immunol 2012;129:434-40.
27. Luoto R, Kalliomaki M, Laitinen K, et al. Initial dietary andmicrobiological environments deviate in normal-weight com-pared to overweight children at 10 years of age. J Pediatr Gas-troenterol Nutr 2011;52:90-5.
28. Marcobal A, Barboza M, Froehlich JW, et al. Consumption ofhuman milk oligosaccharides by gut-related microbes. J AgricFood Chem 2010;58:5334-40.
29. Turroni F, Peano C, Pass DA, et al. Diversity of bifidobacteriawithin the infant gut microbiota. PLoS ONE 2012;7:e36957.
30. Canadian Community Health Survey: trends in breastfeedingpractices in Canada2001 to 2009–2010. Ottawa (ON): StatisticsCanada; 2008. Available: www.hc-sc.gc.ca/fn-an/surveill/nutrition /commun /prenatal/trends-tendances-eng.php (accessed2012 June 6).
Affiliations: From the Departments of Pediatrics (Azad,Kozyrskyj), Agricultural, Food and Nutritional Sciences(Field), and Obstetrics and Gynecology (Chari), Universityof Alberta, Edmonton, Alta.; the Dalla Lana School of PublicHealth (Konya, Scott) and the Centre for the Analysis ofGenome Evolution and Function (Maughan, Guttman), Uni-versity of Toronto, Toronto, Ont.; the Department of Medi-cine (Sears), McMaster University, Hamilton, Ont.; theDepartment of Pediatrics and Child Health (Becker), Univer-sity of Manitoba, Winnipeg, Man.; and the Manitoba Instituteof Child Health (Becker, Kozyrskyj), Winnipeg, Man.
Contributors: David Guttman, James Scott and AnitaKozyrskyj conceptualized and designed the study. MalcolmSears and the CHILD Study Investigators contributed to thedesign and execution of the CHILD Study. Meghan Azadanalyzed data and drafted the manuscript. Theodore Konyaprocessed samples. Heather Maughan processed sequencedata. Allan Becker coordinated the recruitment of partici-pants and the collection of samples and data. All of theauthors contributed to the interpretation of data, criticallyreviewed the manuscript for important intellectual contentand approved the final version submitted for publication.
Funding: This research was funded by the Canadian Insti-tutes of Health Research (grant nos. 85761 and 227312), andwas supported by AllerGen NCE, the Killam Trusts andAlberta Innovates — Health Solutions.
Acknowledgements: The authors extend sincere apprecia-tion to all of the study families and the CHILD researchteams. They also thank Yiye Zeng for help with the statisticalanalysis and Brenda Koster for bioinformatics support.
Additional CHILD Study investigators: Ryan Allen(Simon Fraser University), Dean Befus (University ofAlberta), Michael Brauer (University of British Columbia),Jeff Brook (Environment Canada), Michael Cyr (McMasterUniversity), Edith Chen (University of British Columbia),Denise Daley (James Hogg iCAPTURE Centre), Sharon Dell(Hospital for Sick Children), Judah Denburg (McMaster Uni-versity), Susan Elliott (University of Waterloo), HartmutGrasemann (Hospital for Sick Children), Kent HayGlass(University of Manitoba), Richard Hegele (University ofToronto), Linn Holness (St. Michael’s Hospital), MichaelKobor (University of British Columbia), Tobias Kollmann(University of British Columbia), Catherine Laprise (Chicou -timi University Hospital), Mark Larché (McMaster Univer-sity), Wen-Yi Wendy Lou (University of Toronto), JosephMacri (McMaster University), Piush Mandhane (Universityof Alberta), Gregory Miller (Northwestern University), Red-wan Moqbel (University of Manitoba), Theo Moraes (Hospi-tal for Sick Children), Peter Paré (University of BritishColumbia), Clare Ramsey (University of Manitoba), FelixRatjen (Hospital for Sick Children), Bruce Ritchie (Univer-sity of Alberta), Andrew Sandford (James Hogg iCAPTURECentre), Jeremy Scott (University of Toronto), Frances Sil-verman (University of Toronto), Padmaja Subbarao (Hospitalfor Sick Children), Scott Tebbutt (James Hogg iCAPTURECentre), Tim Takaro (Simon Fraser University), Patrick Tang(University of British Columbia), Teresa To (Hospital forSick Children) and Stuart Turvey (University of BritishColumbia)
Research
394 CMAJ, March 19, 2013, 185(5)