Gusset Plate Connections Brandon Kotulka Thesis (HSS12-HSS17)
386
Analysis for a Design Guide on Gusset Plates used in Special Concentrically Braced Frames Brandon A. Kotulka A thesis submitted in partial fulfillment of the requirements for the degree of Master of Science in Engineering University of Washington 2007 Program Authorized to Offer Degree: Department of Civil and Environmental Engineering
-
Upload
johnpetterohman -
Category
Documents
-
view
66 -
download
11
description
Gusset Plate Connections Brandon Kotulka Thesis (HSS12-HSS17)
Transcript of Gusset Plate Connections Brandon Kotulka Thesis (HSS12-HSS17)

Analysis for a Design Guide on Gusset Plates
used in Special Concentrically Braced Frames
Brandon A. Kotulka
A thesis
submitted in partial fulfillment of the
requirements for the degree of
Master of Science in Engineering
University of Washington
2007
Program Authorized to Offer Degree:
Department of Civil and Environmental Engineering

University of Washington Graduate School
This is to certify that I have examined this copy of a master's thesis by
Brandon A. Kotulka
and have found that it is complete and satisfactory in all respects,
and that any and all revisions required by the final
examining committee have been made.
Committee Members:
_______________________________________________
Charles W. Roeder
_______________________________________________
Dawn E. Lehman
_______________________________________________
Jeffrey W. Berman
Date: ____________________________

In presenting this thesis in partial fulfillment of the requirements for a master’s degree at the University of Washington, I agree that the Library shall make its copies freely available for inspection. I further agree that extensive copying of this thesis is allowable only for scholarly purposes, consistent with “fair use” as prescribed in the U.S. Copyright Law. Any other reproduction for any purposes or by any means shall not be allowed without my written permission.
Signature ________________________
Date ____________________________
University of Washington
Abstract
Analysis for a Design Guide on Gusset Plates used in Special Concentrically Braced Frames
Brandon A. Kotulka
Chair of Supervisory Committee: Professor Charles W. Roeder
Department of Civil and Environmental Engineering
After recent earthquakes in Northridge, CA and Kobe, Japan caused considerable
damage to steel moment frames, significant interest has been generated in the use of
steel braced frames to resist seismic induced forces and displacements. A Special
Concentrically Braced Frame (SCBF) resists large displacements due to seismic
ground motion through brace elongation when the brace is subjected to tensile loads
and through brace buckling when the brace is subjected to compressive loads. Gusset
plates provide a load path from the brace to the frame and are extremely influential in
regard to the post buckling hysteretic response of the brace. Current design
provisions create a very large, stiff, and strong gusset plate which actually limits the
ductility of the brace. Instead, a smaller, less stiff, less strong gusset plate will
increase the ductility of the brace and therefore increase the seismic performance of
the system as a whole. The analysis presented within this report will show how the
gusset plate should be designed to increase the seismic performance of SCBFs.

i
Table of Contents
Page
List of Figures.................................................................................................................. vi List of Tables................................................................................................................. xiii Chapter 1: Introduction and Background ......................................................................... 1
1.0 Introduction ...................................................................................................... 1 1.1 Theory of Design.............................................................................................. 1
1.1.1 Connection Design ................................................................................... 2 1.1.2 Overall Geometric Design........................................................................ 5 1.1.3 Performance Based Design....................................................................... 6
1.2 Research Objectives ......................................................................................... 7 1.3 Overview of Report .......................................................................................... 8
Chapter 2: Literature Review ........................................................................................... 9 2.0 Introduction ...................................................................................................... 9 2.1 Brace Experiments............................................................................................ 9 2.2 Gusset Plate Experiments ............................................................................... 10 2.3 System Experiments ....................................................................................... 13 2.4 Previous Tests within Test Program............................................................... 15 2.5 Summary of Research..................................................................................... 16
Chapter 3: Specimen Design .......................................................................................... 17 3.0 Introduction .................................................................................................... 17 3.1 HSS-12 – Reference Specimen with CJP Welds............................................ 22 3.2 HSS-13 – Tapered Plate with CJP Welds....................................................... 24 3.3 HSS-14 – Unreinforced Net Section .............................................................. 27 3.4 HSS-15 – Reduced Splice Length .................................................................. 30 3.5 HSS-16 – Bolted Splice Connection .............................................................. 33 3.6 HSS-17 – 3/8” Tapered Plate ......................................................................... 36 3.7 Material........................................................................................................... 38
Chapter 4: Experiment Setup.......................................................................................... 39 4.0 Introduction .................................................................................................... 39 4.1 Test Components ............................................................................................ 39
4.1.1 Actuator and Reaction Block.................................................................. 43 4.1.2 Load Beam.............................................................................................. 44 4.1.3 Gravity Load System.............................................................................. 45 4.1.4 Out-of-Plane Restraints .......................................................................... 46 4.1.5 Boundary Conditions.............................................................................. 48 4.1.6 Strong Wall and Strong Floor................................................................. 50
4.2 Loading Protocol ............................................................................................ 50 4.3 Instrumentation............................................................................................... 52
4.3.1 Strain Gauges.......................................................................................... 52
ii
4.3.2 Potentiometers ........................................................................................ 54 4.3.3 Other Instrumentation............................................................................. 57
4.4 Data Acquisition System ................................................................................ 58 4.5 Testing Preparation......................................................................................... 59
Chapter 5: Experimental Results .................................................................................... 60 5.0 Introduction .................................................................................................... 60 5.1 Yield Mechanisms and Failure Modes ........................................................... 62
5.1.1 Yielding .................................................................................................. 63 5.1.2 Brace Buckling ....................................................................................... 66 5.1.3 Plate Buckling and Local Buckling........................................................ 67 5.1.4 Tearing and Fracture............................................................................... 68 5.1.5 Loss of Resistance at Bolted Connections.............................................. 69
5.2 Nomenclature of Specimen and Specimen Response .................................... 70 5.3 HSS-12 – Reference Specimen with CJP Welds............................................ 73
5.3.1 Specimen Overview................................................................................ 73 5.3.2 Initial Drift Range (Max/Min Range from 0% to 1.25%) ...................... 74 5.3.3 Moderate Drift Range (Max/Min Range from 1.25% to 2.75%) ........... 76 5.3.4 Severe Drift Range (Max/Min Range > 2.75%)..................................... 79 5.3.5 Specimen Summary................................................................................ 82
5.4 HSS-13 – Tapered Plate with CJP Welds....................................................... 84 5.4.1 Specimen Overview................................................................................ 84 5.4.2 Initial Drift Range (Max/Min Range from 0% to 1.25%) ...................... 85 5.4.3 Moderate Drift Range (Max/Min Range from 1.25% to 2.75%) ........... 86 5.4.4 Severe Drift Range (Max/Min Range > 2.75%)..................................... 87 5.4.5 Specimen Summary................................................................................ 91
5.5 HSS-14 – Unreinforced Net Section .............................................................. 93 5.5.1 Specimen Overview................................................................................ 93 5.5.2 Initial Drift Range (Max/Min Range from 0% to 1.25%) ...................... 95 5.5.3 Moderate Drift Range (Max/Min Range from 1.25% to 2.75%) ........... 96 5.5.4 Severe Drift Range (Max/Min Range > 2.75%)..................................... 98 5.5.5 Specimen Summary.............................................................................. 105
5.6 HSS-15 – Reduced Splice Length ................................................................ 108 5.6.1 Specimen Overview.............................................................................. 108 5.6.2 Initial Drift Range (Max/Min Range from 0% to 1.25%) .................... 110 5.6.3 Moderate Drift Range (Max/Min Range from 1.25% to 2.75%) ......... 111 5.6.4 Severe Drift Range (Max/Min Range > 2.75%)................................... 112 5.6.5 Specimen Summary.............................................................................. 117
5.7 HSS-16 – Bolted Splice Connection ............................................................ 118 5.7.1 Specimen Overview.............................................................................. 118 5.7.2 Initial Drift Range (Max/Min Range from 0% to 1.25%) .................... 121 5.7.3 Moderate Drift Range (Max/Min Range from 1.25% to 2.75%) ......... 125 5.7.4 Severe Drift Range (Max/Min Range > 2.75%)................................... 126 5.7.5 Specimen Summary.............................................................................. 131
5.8 HSS-17 – 3/8” Tapered Plate ....................................................................... 132

iii
5.8.1 Specimen Overview.............................................................................. 132 5.8.2 Initial Drift Range (Max/Min Range from 0% to 1.25%) .................... 134 5.8.3 Moderate Drift Range (Max/Min Range from 1.25% to 2.75%) ......... 136 5.8.4 Severe Drift Range (Max/Min Range > 2.75%)................................... 137 5.8.5 Specimen Summary.............................................................................. 142
5.9 Hysteretic Envelope Comparison ................................................................. 143 Chapter 6: Analysis of Results ..................................................................................... 145
6.0 Introduction .................................................................................................. 145 6.1 Ultimate Drift Capacity ................................................................................ 146
6.1.1 Introduction .......................................................................................... 146 6.1.2 Brace Behavior ..................................................................................... 146 6.1.3 Buckled Shape and Curvature .............................................................. 149 6.1.4 Axial Stiffness of the Gusset Plates...................................................... 165 6.1.5 Weld/Base Metal Damage.................................................................... 171 6.1.6 HSS-16 ................................................................................................. 174 6.1.7 Summary............................................................................................... 174
6.2 Performance State Comparison .................................................................... 175 6.2.0 Introduction .......................................................................................... 175 6.2.1 Performance State Comparison of Brace ............................................. 177 6.2.2 Performance State Comparison of Gusset Plates ................................. 179 6.2.3 Performance State Comparison of Welds and Base Metal................... 182 6.2.4 Performance State Comparison of Framing Elements ......................... 186 6.2.5 Summary for Performance State Comparisons .................................... 196
6.3 Load Capacity............................................................................................... 198 6.4 Energy Dissipation ....................................................................................... 201 6.5 Constructability ............................................................................................ 204
6.5.1 Net Section Reinforcement................................................................... 204 6.5.2 Gusset Plate Size and Geometry........................................................... 205
6.6 Conclusions .................................................................................................. 206 Chapter 7: Analysis of Test Program Results............................................................... 209
7.0 Introduction .................................................................................................. 209 7.1 Overall Comparison...................................................................................... 209 7.2 Weld/Base Metal Damage............................................................................ 210
7.2.2 Weld Damage of Tapered Plates .......................................................... 213 7.2.3 Weld Damage of Rectangular Plates with 2t Line Clearance .............. 215 7.2.4 Weld Damage of Rectangular Plates with Elliptical Clearance ........... 216 7.2.5 Tapered Plate vs. Rectangular Plate with Cracked Welds ................... 218 7.2.6 Conclusions .......................................................................................... 220
7.3 Displacement History Comparison............................................................... 222 7.3.1 Displacement History of HSS-05 and HSS-06 vs. HSS-14 ................. 222 7.3.2 Displacement History of HSS-02 vs. HSS-03...................................... 225 7.3.3 Conclusion............................................................................................ 225
7.4 Actual Seismic Loading ............................................................................... 228 7.5 Gusset Plate Strength and Stiffness .............................................................. 230

iv
7.5.1 Rotational Strength and Stiffness ......................................................... 230 7.5.2 Strength of HSS-01 and HSS-12 vs. HSS-10 and HSS-13 .................. 233 7.5.3 Axial Strength and Stiffness................................................................. 235
7.6 Performance of Framing Elements ............................................................... 238 7.7 Conclusions .................................................................................................. 242
Chapter 8: Design Guide .............................................................................................. 244 8.0 Introduction .................................................................................................. 244 8.1 Gusset Plate Strength Design and Analysis.................................................. 245
8.1.1 Net Section Fracture ............................................................................. 246 8.1.2 Whitmore Yielding............................................................................... 247 8.1.3 Block Shear .......................................................................................... 248 8.1.4 Gusset Plate Buckling........................................................................... 249 8.1.5 Conclusion............................................................................................ 249
8.2 Design of Gusset Plate Geometry Using Elliptical Clearance ..................... 250 8.2.1 Rectangular Gusset Plate Geometry Design......................................... 251 8.2.2 Tapered Gusset Plate Geometry Design............................................... 254
8.3 Gusset Plate Weld Design ............................................................................ 256 8.4 Design of Net Section Reinforcement .......................................................... 257 8.5 Design of Beam-to-Column Connection ...................................................... 258
Chapter 9: Conclusions and Recommendations ........................................................... 259 9.0 Introduction .................................................................................................. 259 9.1 Summary....................................................................................................... 259 9.2 Conclusions .................................................................................................. 262
9.2.1 Conclusions on Analysis of SCBFs...................................................... 262 9.2.2 Conclusions on Design of Gusset Plates in SCBFs.............................. 265 9.2.3 Design Recommendations .................................................................... 270
9.3 Recommendations for Future Research........................................................ 270 9.3.1 Reduced Depth Brace ........................................................................... 270 9.3.2 Net Section ........................................................................................... 273 9.3.3 More Accurate Gravity Load Application............................................ 273 9.3.4 Shake Table .......................................................................................... 273 9.3.5 Slab ....................................................................................................... 274 9.3.6 Size of Brace......................................................................................... 274 9.3.7 Type of Brace ....................................................................................... 274 9.3.8 Applied Displacement History ............................................................. 274 9.3.9 Strength Evaluation of FEM Models.................................................... 275 9.3.10 Gusset Plate Buckling Provisions......................................................... 275 9.3.11 New Method for Determining Clearance ............................................. 275 9.3.12 Tapered Plate with Higher Clearance................................................... 276 9.3.13 Whitmore Section................................................................................. 277 9.3.14 Quarter Inch Plate................................................................................. 277 9.3.15 Beam-to-Column Connection............................................................... 277 9.3.16 Additional Testing ................................................................................ 278
References .................................................................................................................... 279

v
Appendix A: Specimen Design .................................................................................... 286
A.1 General ......................................................................................................... 286 A.2 Example 1 (Specimen HSS-12).................................................................... 286
A.2.1 Member Selection................................................................................. 286 A.2.2 Brace-to-Gusset Plate Connection........................................................ 289 A.2.3 Gusset Plate Design.............................................................................. 291 A.2.4 Gusset Plate-to-Frame Connection Design .......................................... 297 A.2.5 Beam-to-Column Connection – CJP .................................................... 300 A.2.6 Beam-to-Column Connection – Simple Shear ..................................... 301
A.3 Example 2 (Specimen HSS-14).................................................................... 305 A.3.1 Gusset Plate Design.............................................................................. 305 A.3.2 Gusset Plate-to-Framing Element Welds ............................................. 308
Appendix B: Specimen Drawings ................................................................................ 310 B.1 General ......................................................................................................... 310
Appendix C: Finite Element Analyses ......................................................................... 345 C.1 General ......................................................................................................... 345 C.2 Model Description ........................................................................................ 345 C.3 Loads ............................................................................................................ 346 C.4 Results .......................................................................................................... 348 C.5 Specimen HSS-01 (same as HSS-12)........................................................... 349 C.6 Specimen HSS-02 (same as HSS-03 and HSS-09) ...................................... 350 C.7 Specimen HSS-04......................................................................................... 350 C.8 Specimen HSS-05 and HSS-06 .................................................................... 351 C.9 Specimen HSS-07 (same as HSS-11)........................................................... 351 C.10 Specimen HSS-08......................................................................................... 352 C.11 Specimen HSS-10 (same as HSS-13 and HSS-17) ...................................... 352 C.12 Specimen HSS-14......................................................................................... 353 C.13 Specimen HSS-15......................................................................................... 354
Appendix D: Data Analysis Calculations..................................................................... 355 D.1 General ......................................................................................................... 355 D.2 Brace Calculations........................................................................................ 355
D.2.1 Brace Force Calculation ....................................................................... 355 D.2.2 Brace Out-of-Plane Displacement Calculation .................................... 357 D.2.3 Brace Elongation .................................................................................. 359 D.2.3 Gusset Plate Elongation........................................................................ 361 D.2.4 Brace Yielding...................................................................................... 361
D.3 Gusset Plate Rotations.................................................................................. 362 D.4 Beam and Column Forces ............................................................................ 363 D.5 Shear Tab Rotations ..................................................................................... 363 D.6 Energy Dissipation Calculation.................................................................... 364 D.7 Drift Calculation........................................................................................... 365

vi
List of Figures
Figure Number Page
Figure 1.1.1 – Example of Gusset Plate Connection........................................................ 2 Figure 1.1.2 – Yield Mechanisms and Failure Modes of SCBF (Johnson 2005)............. 4 Figure 1.1.3 - Force-Drift Response for Single Brace (Johnson 2005)............................ 5 Figure 2.2.1 – Whitmore Width ..................................................................................... 11 Figure 2.2.2 – 2t Clearance............................................................................................. 12 Figure 2.2.3 – Test Schematic of Astaneh-Asl, Goel, and Hanson (1982) .................... 13 Figure 2.3.1 – Test Schematic of Uriz (2005) ................................................................ 14 Figure 3.0.1 – Prototype Specimen (Johnson 2005)....................................................... 17 Figure 3.1.1 – 2t Clearance............................................................................................. 22 Figure 3.1.2 – HSS-12 Gusset Plate Detail .................................................................... 23 Figure 3.2.1 – Gusset Plate with Elliptical Clearance .................................................... 25 Figure 3.2.2 – HSS-13 Gusset Plate Detail .................................................................... 26 Figure 3.3.1 – HSS-14 Gusset Plate Detail .................................................................... 27 Figure 3.3.2 –Slot Detail of Brace HSS-14 .................................................................... 28 Figure 3.4.1 –Gusset Plate Detail HSS-15 ..................................................................... 31 Figure 3.5.1 –Gusset Plate Detail HSS-16 ..................................................................... 34 Figure 3.5.2 –Section of Connection Detail HSS-16 ..................................................... 36 Figure 3.6.1 –Gusset Plate Detail HSS-17 ..................................................................... 37 Figure 4.1.1 – Test Setup Components (Johnson 2005)................................................. 41 Figure 4.1.2 – Test Setup Dimensions (Johnson 2005).................................................. 42 Figure 4.1.3 – Test Setup Photograph (Johnson 2005) .................................................. 43 Figure 4.1.4 – Actuator and Reaction Block Photograph (Johnson 2005) ..................... 44 Figure 4.1.5 – Actuator and Reaction Block Assembly (Johnson 2005) ....................... 44 Figure 4.1.6 – Load Beam Details.................................................................................. 45 Figure 4.1.7 - Axial Load System Schematic (Johnson 2005) ....................................... 46 Figure 4.1.8 - Axial Load System Photographs (Johnson 2005).................................... 46 Figure 4.1.9 – Out of Plane Restraints (Johnson 2005).................................................. 47 Figure 4.1.10 – Out of Plane Restraints (Johnson 2005)................................................ 48 Figure 4.1.11 - Channel Assembly Cross-Section (Johnson)......................................... 49 Figure 4.1.12 - Shear Transfer Connection (Johnson) ................................................... 49 Figure 4.2.1 - Loading History (Johnson 2005) ............................................................. 51 Figure 4.3.1 – Strain Gauge Diagram............................................................................. 53 Figure 4.3.2 – Potentiometer Diagram ........................................................................... 55 Figure 4.3.3 – Potentiometer Location Diagram at NE Gusset Plate............................. 57 Figure 5.1.1 – Initial/Mild Gusset Plate Yielding (Y1) for HSS-17 .............................. 64 Figure 5.1.2 – Moderate Gusset Plate Yielding (Y3) for HSS-17.................................. 65 Figure 5.1.3 – Significant Gusset Plate Yielding (Y5) for HSS-17 ............................... 65 Figure 5.1.4 – Example of Brace Buckling Progression (HSS-17) ................................ 67
vii
Figure 5.1.5 – Example of B1 of Beam Flange (HSS-13).............................................. 68 Figure 5.1.6 – Example of Tearing and Fracture of the Brace (BF) .............................. 69 Figure 5.1.7 – Example of Damage to the Base Metal (WDB)...................................... 70 Figure 5.2.1 - SCBF Component Notation (Johnson 2005) ........................................... 71 Figure 5.2.2 - SCBF Component Notation Profile (Johnson 2005) ............................... 71 Figure 5.3.1 – Specimen HSS-12 Force-Drift Response................................................ 74 Figure 5.3.2 – B2 Buckling of brace (-0.71% Drift) ...................................................... 75 Figure 5.3.3 – Yield Lines on NE Gusset Plate (0.26% Drift) ....................................... 75 Figure 5.3.4 – Yield Lines in Beam Web (0.48% Drift) ................................................ 76 Figure 5.3.5 – Yield Lines in NE Column Flange (0.68% Drift) ................................... 77 Figure 5.3.6 – Y3 at NE column next to gusset plate (-1.47% Drift)............................. 78 Figure 5.3.7 – Hinge Lines in NE Gusset (-1.47% Drift)............................................... 78 Figure 5.3.8 – B1 of NE column flange (-1.79% Drift) ................................................. 79 Figure 5.3.9 – Y3 of NE Beam Flange (-1.79% Drift)................................................... 80 Figure 5.3.10 – Y5 at Reentrant Beam Corners (-2.1% Drift) ....................................... 80 Figure 5.3.11 – BC of Brace (-1.79% Drift)................................................................... 81 Figure 5.3.12 – Crack in Brace (1.40% Drift) ................................................................ 81 Figure 5.3.13 – Fracture of Brace (1.67% Drift) ............................................................ 82 Figure 5.3.14 – NE Gusset Plate (End of Test) .............................................................. 83 Figure 5.3.15 – SW Column (End of Test) .................................................................... 83 Figure 5.4.1 – Specimen HSS-13 Force-Drift Response................................................ 85 Figure 5.4.2 –Visible Bending (-0.30% Drift) ............................................................... 85 Figure 5.4.3 –Y1 at gusset plates (0.35% Drift)............................................................. 86 Figure 5.4.4 –Y3 at NE Gusset Plate (0.82% Drift) ....................................................... 87 Figure 5.4.5 –Y5 at SW gusset plate (-1.38% Drift) ...................................................... 87 Figure 5.4.6 –Y3 at Columns 1.35% Drift) .................................................................... 88 Figure 5.4.7 –Y5 at SW Beam (-2.03% Drift) ............................................................... 88 Figure 5.4.8 – Local Buckling of SW Beam (2.05% Drift) ........................................... 89 Figure 5.4.9 – Significant Yielding in Gusset Plate (-2.03% Drift) ............................... 89 Figure 5.4.10 –BC at brace (-1.71% Drift)..................................................................... 90 Figure 5.4.11 –Brace Initial Tearing (2.05% Drift)........................................................ 90 Figure 5.4.12 – Downward Brace Buckling (-0.33% Drift)........................................... 91 Figure 5.4.13 – Yielding of NE Connection (End of Test) ............................................ 92 Figure 5.4.14 –Yielding on West Column (End of Test) ............................................... 92 Figure 5.4.15 –Local Buckling at South Beam (End of Test) ........................................ 93 Figure 5.5.1 – Specimen HSS-14 Force-Drift Response................................................ 94 Figure 5.5.2 – Buckling Stage of HSS-14 (-0.34%)....................................................... 95 Figure 5.5.3 – Y1 of NE Gusset Plate (0.28%) .............................................................. 96 Figure 5.5.4 – Y1 of NE Beam (0.37%)......................................................................... 96 Figure 5.5.5 – Y3 of NE Gusset (0.58%) ....................................................................... 97 Figure 5.5.6 – Y1 of NE Gusset at Beam (0.58%) ......................................................... 97 Figure 5.5.7 – Y1 of SW Gusset in Compression (-1.08%) ........................................... 98 Figure 5.5.8 – Y3 NE Column (1.61%).......................................................................... 98 Figure 5.5.9 – Y3 SW Column (1.89%)......................................................................... 99

viii
Figure 5.5.10 – Y5 NE Beam (1.89%) ........................................................................... 99 Figure 5.5.11 – Y5 SW Beam (1.89%) .......................................................................... 99 Figure 5.5.12 – Y3 of NE Gusset at Reentrant Corner (1.31%)................................... 100 Figure 5.5.13 – Y3 of SW Gusset at Reentrant Corner (1.31%) .................................. 100 Figure 5.5.14 – Crack at NE Gusset Plate Weld (-1.67%) ........................................... 101 Figure 5.5.15 – Crack at NE Gusset Plate Weld (-2.04%) ........................................... 101 Figure 5.5.16 – 6.5” Crack at NE Gusset Plate Weld at Column (-2.01%) ................. 102 Figure 5.5.17 – 3” Crack at NE Gusset Plate Weld at Beam (-2.01%) ........................ 102 Figure 5.5.18 – Cupping of Brace (-2.04%)................................................................. 103 Figure 5.5.19 – Bulging of Brace (-2.01%).................................................................. 104 Figure 5.5.20 – Bulging of Brace (-2.01%).................................................................. 104 Figure 5.5.21 – Fatigue Cracks in Brace (-2.01%)....................................................... 105 Figure 5.5.22 – Brace Fracture (2.48%) ....................................................................... 105 Figure 5.5.23 – Net Section Hole Undamaged (End of Test) ...................................... 106 Figure 5.5.24 – Net Section Hole Undamaged (End of Test) ...................................... 106 Figure 5.5.25 – Gusset Plate (End of Test) .................................................................. 107 Figure 5.6.1 – Specimen HSS-15 Force-Drift Response.............................................. 109 Figure 5.6.2 – Buckling Stages..................................................................................... 110 Figure 5.6.3 – Yielding on Gusset Next to Brace at 232 kips (0.43%) ........................ 111 Figure 5.6.4 – Yielding on NE Beam Web (0.96%) .................................................... 111 Figure 5.6.5 – Yielding on NE Beam Flange (-1.35%)................................................ 112 Figure 5.6.6 – Hinge Lines in Gusset Plates (-1.35%) ................................................. 112 Figure 5.6.7 – NE Column with Y3 Yielding (1.22%) ................................................ 113 Figure 5.6.8 – Yielding at NEB.................................................................................... 113 Figure 5.6.9 – 1 in Crack thru Base Metal of Gusset Plate at SWC (-1.97%) ............. 114 Figure 5.6.10 – 3” Crack thru Base Metal of Gusset Plate at NEC (-2.22%) .............. 114 Figure 5.6.11 – Brace Hole and Necking (1.74%) ....................................................... 115 Figure 5.6.12 – Brace Crack Halfway thru Member (1.87%) ...................................... 116 Figure 5.6.13 – Brace Buckling Down (-0.55%).......................................................... 116 Figure 5.6.14 – Southwest Gusset (End of Test).......................................................... 118 Figure 5.7.1 – Specimen HSS-16 Connection Detail ................................................... 119 Figure 5.7.2 – Specimen HSS-16 Force-Drift Response.............................................. 120 Figure 5.7.3 – Visual Bending of SW Gusset and Extension Plate (-0.16%) .............. 121 Figure 5.7.4 – Bending of SW Gusset and Extension Plate (-0.29%).......................... 122 Figure 5.7.5 – Bending of SW Gusset and Extension Plate (-0.37%).......................... 122 Figure 5.7.6 – Bending of Plates, Hinge Lines on Gusset (-0.45%) ............................ 122 Figure 5.7.7 – Bolt Slip (0.31%) .................................................................................. 123 Figure 5.7.8 – Base Metal Fracture (-0.49%)............................................................... 124 Figure 5.7.9 – Y3 of SW Gusset Plate (-0.49%) .......................................................... 124 Figure 5.7.10 – Y1 of SW Extension Plate (0.67%) .................................................... 125 Figure 5.7.11 – Y1 of NE Gusset Plate (0.81%) .......................................................... 126 Figure 5.7.12 – B1 of SW Gusset Plate (0.81%).......................................................... 126 Figure 5.7.13 – Bolt Slippage at NE Gusset (1.27%)................................................... 127 Figure 5.7.14 – Y5 of SW Gusset Plate (1.43%).......................................................... 127
ix
Figure 5.7.15 – Y3 of NE Framing Elements (1.67%)................................................. 128 Figure 5.7.16 – Complete Tear of Base Metal at SW Gusset (-2.00%) ....................... 128 Figure 5.7.17 – Crack Develops in Weld at Beam (2.28%) ......................................... 129 Figure 5.7.18 – Base Metal Crack at NE Column (-2.31%)......................................... 129 Figure 5.7.19 – Base Metal Complete Fracture at NE Column (-2.66%) .................... 130 Figure 5.7.20 – Crack in SW Extension Plate (-2.66%)............................................... 131 Figure 5.7.21 – Cracks in Extension Plate (-2.86%) .................................................... 131 Figure 5.8.1 – Specimen HSS-17 Force-Drift Response.............................................. 134 Figure 5.8.2 – Visible Buckling (-0.25%) .................................................................... 134 Figure 5.8.3 – Y1 Yielding due to Tension in Both Gussets (0.26%).......................... 135 Figure 5.8.4 – Y3 Yielding due to Tension in Both Gussets (0.32%).......................... 135 Figure 5.8.5 – Compression Yield Lines of SW Gusset Plate (-0.63%) ...................... 136 Figure 5.8.6 – Gusset Plates Condition at End of Moderate Drift Range (-1.34%)..... 136 Figure 5.8.7 – Yielding at SW Column (-1.14%)......................................................... 137 Figure 5.8.8 – Yielding at SW Beam and Gusset Reentrant Corner (-1.14%)............. 137 Figure 5.8.9 – Yielding at Beam Webs (1.31%) .......................................................... 138 Figure 5.8.10 – Y3 and B1 of SW Beam Web (2.15%) ............................................... 138 Figure 5.8.11 – 6” Base Metal Crack in Gusset at NE Column (-2.31%).................... 139 Figure 5.8.12 – 4” Base Metal Crack in Gusset at SW Column (-2.31%) ................... 139 Figure 5.8.13 – Y5 of Gusset Plates (-2.31%).............................................................. 139 Figure 5.8.14 – 15” Base Metal Fracture (-2.79%) ...................................................... 140 Figure 5.8.15 – Brace Cupping (-2.31%) ..................................................................... 141 Figure 5.8.16 – Fatigue Cracks in Brace (2.15%) ........................................................ 141 Figure 5.8.17 – Local Failure in Brace (-2.79%) ......................................................... 142 Figure 5.8.18 – NE Gusset Plate (End of Test) ............................................................ 142 Figure 5.9.1 – Positive Hysteretic Envelopes............................................................... 143 Figure 5.9.2 – Negative Hysteretic Envelopes ............................................................. 144 Figure 6.1.1 – Five Stages of Inelastic, Post-Buckling Response of Brace ................. 147 Figure 6.1.2 – Local Buckling During Stage 2 Leading to Fracture ............................ 148 Figure 6.1.3 – Cracks after Local Buckling Has Occurred .......................................... 149 Figure 6.1.4 – Buckled Shape Comparison at a Given In-Plane Displacement ........... 150 Figure 6.1.5 – 2t Clearance........................................................................................... 150 Figure 6.1.6 – Deflected Shape at -0.35% Drift ........................................................... 151 Figure 6.1.7 – Buckled Shape at –1.5% Drift............................................................... 152 Figure 6.1.8 – Buckled Shape at Brace Cupping (BC)................................................. 152 Figure 6.1.9 – Brace Out-of-Plane Displacement at Midspan vs. Frame Drift ............ 154 Figure 6.1.10 – Brace Out-of-Plane Displacement at Midspan vs. Drift Range .......... 155 Figure 6.1.11 – HSS-17 and HSS-14 Gusset Plate Detail Overlaid on Each other...... 157 Figure 6.1.12 – Hinge Lines for Rectangular Plate with Elliptical Clearance ............. 158 Figure 6.1.13 – Hinge Line for Tapered Plate.............................................................. 158 Figure 6.1.14 – HSS-14 Hinge Lines Including Bending for Compatibility................ 159 Figure 6.1.15 – Finite Element Mesh for HSS-14........................................................ 160 Figure 6.1.16 – Finite Element Mesh for HSS-17........................................................ 160 Figure 6.1.17 –Perspective Drawing of Hinging of HSS-14........................................ 161

x
Figure 6.1.18 – NE Gusset Plate Rotation vs. Story Drift............................................ 162 Figure 6.1.19 – SW Gusset Plate Rotation vs. Story Drift ........................................... 163 Figure 6.1.20 – Brace Elongation vs. Frame Drift ....................................................... 166 Figure 6.1.21 – Brace Elongation vs. Frame Drift (Tension only)............................... 166 Figure 6.1.22 – Brace Elongation (Compression only) vs. Total Frame Drift ............. 168 Figure 6.1.23 – Brace Elongation (Tension Only) vs. Total Frame Drift .................... 168 Figure 6.1.24 – Gusset Plate Elongation vs. Frame Drift (Tension Only) ................... 169 Figure 6.1.25 – Brace Force vs. Drift Ratio ................................................................. 170 Figure 6.1.26 – Total Drift Range vs. Total Weld/Base Metal Crack Length ............. 171 Figure 6.1.27 – Opening Moment Associated with Compression in Brace ................. 172 Figure 6.2.1 – Y3 Yielding on HSS-15 Gusset Plate (0.43%) ..................................... 181 Figure 6.2.2 – Y3 Yielding on HSS-17 NE Gusset Plate (0.32%)............................... 181 Figure 6.2.3 – Extended Yielding of HSS-17 NE Gusset Plate (0.53%) ..................... 182 Figure 6.2.4 – SW Gusset Plate Rotation vs. Story Drift ............................................. 184 Figure 6.2.5 – North Beam Moments at Strain Gauge Location.................................. 187 Figure 6.2.6 – South Beam Moments at Strain Gauge Location.................................. 189 Figure 6.2.7 – Local Beam Web and Beam Flange Buckling of HSS-14 .................... 190 Figure 6.2.8 – East Column Moments at Gusset Plate ................................................. 191 Figure 6.2.9 – West Column Moments at Gusset Plate................................................ 191 Figure 6.2.10 – East Column Shears ............................................................................ 192 Figure 6.2.11 – West Column Shears ........................................................................... 192 Figure 6.2.12 – Ratio of Shear Resistance from Columns (Negative Drift) ................ 194 Figure 6.2.13 – Ratio of Shear Resistance from Columns (Positive Drift) .................. 195 Figure 6.3.1 – Brace Force as a Function of Drift Ratio .............................................. 200 Figure 6.4.1 – Energy Dissipated by HSS-12............................................................... 202 Figure 6.4.2 – Energy Dissipated Comparison............................................................. 203 Figure 6.5.1 – Erection Issue of HSS-15...................................................................... 206 Figure 7.2.1 – Total Weld/Base Metal Crack Length vs. Drift Ratio .......................... 212 Figure 7.2.2 – NE Gusset Plate Rotation...................................................................... 214 Figure 7.2.3 – Weld/Base Metal Total Crack Length for Rectangular 3/8” Plates ...... 217 Figure 7.2.4 – Comparison of Rectangular Plate with Reduced Weld Length ............ 219 Figure 7.2.5 – Comparison of Rectangular Plate with Reduced Weld Length ............ 219 Figure 7.2.6 – Total Drift Range vs. Weld/Base Metal Tearing Length ...................... 221 Figure 7.3.1 – Drift History of HSS-05........................................................................ 223 Figure 7.3.2 – Drift History of HSS-06........................................................................ 223 Figure 7.3.3 – Drift History of HSS-14........................................................................ 224 Figure 7.3.4 – Ultimate Drift Range of HS-05, HSS-06 and HSS-14.......................... 224 Figure 7.3.5 – Ultimate Drift Range of HSS-02 and HSS-03 ...................................... 225 Figure 7.4.1 – Weld/Base Metal Damage vs. Negative Drift Ratio ............................. 229 Figure 7.5.1 – SW Gusset Plate Rotation vs. Total Drift Range .................................. 231 Figure 7.5.2 – HSS-01 and HSS-12 overlaid with HSS-10 and HSS-13 ..................... 233 Figure 7.5.3 – HSS-10 and HSS-12 SW Gusset Plate Rotation................................... 235 Figure 7.5.4 – Brace Elongation vs. Drift Ratio........................................................... 237 Figure 8.2.1 – Gusset Plate with Elliptical Clearance .................................................. 251
xi
Figure 9.2.1 – Opening Moment Associated with Compression in Brace ................... 263 Figure 9.3.1 – Reduced Depth Brace............................................................................ 271 Figure 9.3.2 – Clearance Lines for Rectangular Plate.................................................. 276 Figure 9.3.3 – Clearance Lines for Tapered Plate ........................................................ 276 Figure 9.3.4 – Connection with Only Outside Beam Flange Welded to Column ........ 278 Figure A.1 - Uniform Force Method (Johnson 2005) .................................................. 294 Figure A.2 - 2t Clearance Dimensions (Johnson 2005) ............................................... 295 Figure A.3 – Buckling Lengths l1, l2 and l3 ................................................................ 296 Figure B.1 – Speciman HSS-01.................................................................................... 311 Figure B.2 – HSS-01 Gusset Plate Detail.................................................................... 312 Figure B.3 – Speciman HSS-02.................................................................................... 313 Figure B.4 – HSS-02 Gusset Plate Detail.................................................................... 314 Figure B.5 – Speciman HSS-03.................................................................................... 315 Figure B.6 – HSS-03 Gusset Plate Detail.................................................................... 316 Figure B.7 – Speciman HSS-04.................................................................................... 317 Figure B.8 – HSS-04 Gusset Plate Detail.................................................................... 318 Figure B.9 – Speciman HSS-05.................................................................................... 319 Figure B.10 – HSS-05 Gusset Plate Detail.................................................................. 320 Figure B.11 – Speciman HSS-06.................................................................................. 321 Figure B.12 – HSS-06 Gusset Plate Detail.................................................................. 322 Figure B.13 – Speciman HSS-07.................................................................................. 323 Figure B.14 – HSS-07 Gusset Plate Detail.................................................................. 324 Figure B.5 – Speciman HSS-08.................................................................................... 325 Figure B.16 – HSS-08 Gusset Plate Detail.................................................................. 326 Figure B.17 – Speciman HSS-09.................................................................................. 327 Figure B.18 – HSS-09 Gusset Plate Detail.................................................................. 328 Figure B.19 – Speciman HSS-10.................................................................................. 329 Figure B.20 – HSS-10 Gusset Plate Detail.................................................................. 330 Figure B.21 – Speciman HSS-11.................................................................................. 331 Figure B.22 – HSS-11 Gusset Plate Detail.................................................................. 332 Figure B.23 – Speciman HSS-12.................................................................................. 333 Figure B.24 – HSS-12 Gusset Plate Detail.................................................................. 334 Figure B.25 – Speciman HSS-13.................................................................................. 335 Figure B.26 – HSS-13 Gusset Plate Detail.................................................................. 336 Figure B.27 – Speciman HSS-14.................................................................................. 337 Figure B.28 – HSS-14 Gusset Plate Detail.................................................................. 338 Figure B.29 – Speciman HSS-15.................................................................................. 339 Figure B.30 – HSS-15 Gusset Plate Detail.................................................................. 340 Figure B.31 – Speciman HSS-16.................................................................................. 341 Figure B.32 – HSS-16 Gusset Plate Detail.................................................................. 342 Figure B.33 – Speciman HSS-17.................................................................................. 343 Figure B.34 – HSS-17 Gusset Plate Detail.................................................................. 344 Figure C.1.1 – 3D View of Example FEM Model ....................................................... 346 Figure C.3.1 – Axial Load on Gusset Plates ................................................................ 347
xii
Figure C.3.2 – Moment on Gusset Plates ..................................................................... 347 Figure C.3.1 – Finite Element Mesh for HSS-01 and HSS-12..................................... 349 Figure C.6.1 – Finite Element Mesh for HSS-02 and HSS-03..................................... 350 Figure C.7.1 – Finite Element Mesh for HSS-04 ......................................................... 350 Figure C.8.1 – Finite Element Mesh for HSS-05 and HSS-06..................................... 351 Figure C.9.1 – Finite Element Mesh for HSS-07 ......................................................... 351 Figure C.10.1 – Finite Element Mesh for HSS-08 ....................................................... 352 Figure C.11.1 – Finite Element Mesh for HSS-10, HSS-13, and HSS-17 ................... 352 Figure C.12.1 – Finite Element Mesh for HSS-14 ....................................................... 353 Figure C.12.2 – FEM Mesh for HSS-14 with Weld Cracks......................................... 354 Figure C.13.1 – Finite Element Mesh for HSS-15 ....................................................... 354 Figure D.1 - Column Strain Gages (Johnson 2005) ..................................................... 356 Figure D.2 - Brace Out-of-Plane Measurement Schematic (Johnson 2005) ................ 357 Figure D.3 - Brace Out-of-Plane Measurement Variables ........................................... 358 Figure D.4 - Brace Elongation Measurement (Johnson 2005) ..................................... 359 Figure D.5 - Brace Elongation Measurement Schematic (Johnson 2005) ................... 360 Figure D.6 - Brace Elongation Measurement Variables (Johnson 2005)..................... 360 Figure D.7 - Gusset Plate Out-of-Plane Measurement (Johnson 2005) ....................... 362 Figure D.8 - Beam and Column Rotations (Johnson 2005) ......................................... 363 Figure D.9 - Energy Dissipation Calculation ............................................................... 364 Figure D.10 - Drift Correction Potentiometer Locations (Johnson 2005).................... 365 Figure D.11 - Rigid Body Frame Rotation (Christopulos 2005).................................. 366

xiii
List of Tables
Table Number Page
Table 1.1 – Performance Based Objectives for SCBFs (Johnson 2005).......................... 6 Table 3.0.1 – Thesis 1 Specimens (Johnson 2005) ........................................................ 19 Table 3.0.2 – Thesis 2 Specimens (Herman 2007)......................................................... 20 Table 3.0.3 – Thesis 3 Specimens .................................................................................. 21 Table 3.7.1 – Steel Properties from Material Tests ........................................................ 38 Table 4.3.1 – Dimensions for Figure 4.3.1..................................................................... 53 Table 4.3.2 – Type of Pot used at Respective Location ................................................. 56 Table 4.3.3 – Dimensions for Figure 4.3.3..................................................................... 57 Table 5.0.1 – Summary of Specimens............................................................................ 62 Table 5.1.1 – Performance State Notation...................................................................... 63 Table 5.3.1 - HSS-12 Peak Results ................................................................................ 73 Table 5.4.1 - HSS-13 Peak Results ................................................................................ 84 Table 5.5.1 - HSS-14 Peak Results ................................................................................ 94 Table 5.5.2 – HSS-14 Weld/Base Metal Damage Summary........................................ 103 Table 5.6.1 - HSS-15 Peak Results .............................................................................. 109 Table 5.6.2 – HSS-15 Weld/Base Metal Damage Summary........................................ 115 Table 5.7.1 - HSS-16 Peak Results .............................................................................. 120 Table 5.7.2 – HSS-16 Weld/Base Metal Damage Summary........................................ 130 Table 5.8.1 - HSS-17 Peak Results .............................................................................. 133 Table 5.8.2 – HSS-17 Weld/Base Metal Damage Summary........................................ 140 Table 6.1.1 – Summary of Ultimate Drift of Specimens.............................................. 146 Table 6.1.2 – Summary of Selected Gusset Plate Stiffnesses from FEM (in-k/rad) .... 165 Table 6.2.1 – Brace Performance State Comparison.................................................... 178 Table 6.2.2 – Gusset Plate Performance State Comparison ......................................... 180 Table 6.2.3 – Weld/Base Metal Performance State Comparison ................................. 183 Table 6.2.4 – Framing Elements Performance State Comparison................................ 186 Table 6.3.1 – Load Capacity Comparison .................................................................... 198 Table 6.6.1 – Overall Specimen Comparison............................................................... 207 Table 7.1.1 – Overall Comparison of All Specimens................................................... 210 Table 7.2.1 – Total Weld/Base Metal Crack Length at Given Drift Range ................. 211 Table 7.3.1 – Specimens Arranged From Largest Total Drift Range .......................... 226 Table 7.3.2 – Specimens Arranged From Highest Positive Drift Capacity.................. 227 Table 7.5.1 – Drift Capacity of Specimens Analyzed for Gusset Plate Rotation......... 232 Table 7.5.2 – Axial Strength of Specimens .................................................................. 236 Table 7.6.1 – Buckling of Framing Elements at Given Drift Range............................ 240 Table C.1 – Gusset Plate Stiffness as Determined by FEM Analysis .......................... 348

xiv
Acknowledgements
The author would like to give special thanks to the National Science Foundation for
funding the project and Nucor Yamoto Steel, Columbia Structural Tubing and
American Institute of Steel Construction for donating steel used in this project.
The author would also like to thank John Hooper and Cheryl Burwell of Magnusson
Klemencic Associates, Tim Fraser of Canron Western Constructors Ltd, Walterio Lopes
of Rutherford and Chekene, and Rafael Sabelli of Dasse Design Inc. for input in
developing the test matrix.
The author would like to acknowledge the faculty and staff at the Department of Civil
and Environmental Engineering for their hard work in providing an excellent program,
particularly Professors Charles Roeder and Dawn Lehman for their input and
knowledge. Professor Jeffrey Berman is also thanked for serving on the defense
committee reviewing this thesis.
Testing would not have been possible without the hard work from several graduate and
undergraduate students. Special thanks to all those involved that helped with
fabrication of the test setup and test specimens.

xv
Dedication
To Robin.

1
Chapter 1: Introduction and Background
1.0 Introduction
Special concentrically braced frames (SCBFs) are lateral force resisting structural
systems used for buildings to resist forces induced by seismic ground motion. These
structural steel frames are oriented so that the brace centerline intersects the column and
beam at their centerline intersection. These concentric braced frames (CBFs) are
designed to carry only axial forces, which is the most structurally efficient way to resist
any type of load. Therefore, CBFs are very strong and efficient systems. Because of
the large elastic force demands that an extreme earthquake is capable of exerting on a
structure, it is uneconomical to design most seismic resisting systems to resist these
forces elastically. Instead, most building structures are designed to absorb and dissipate
energy through the ductility of the structure during these rare seismic events.
Earthquake accelerations are relatively high frequency dynamic excitations that have a
short duration of loading. Hence, the use of inelastic deformation, energy dissipation
and reduced seismic forces are viable design concepts. However, the structural system
must be designed to tolerate these inelastic deformations. SCBFs are CBFs designed to
specific guidelines intended to ensure ductility during extreme earthquake loading and
meet these inelastic deformation demands.
1.1 Theory of Design
The ductility of an SCBF is extremely important to the seismic design and performance
of the structure. The system is designed so that the brace will yield when it is in tension
and buckle when it is in compression. This requires that the other structural members,
2
the steel connections, and the overall building geometry, allow this to happen. The
seismic design of these SCBF connections is the focus of this research.
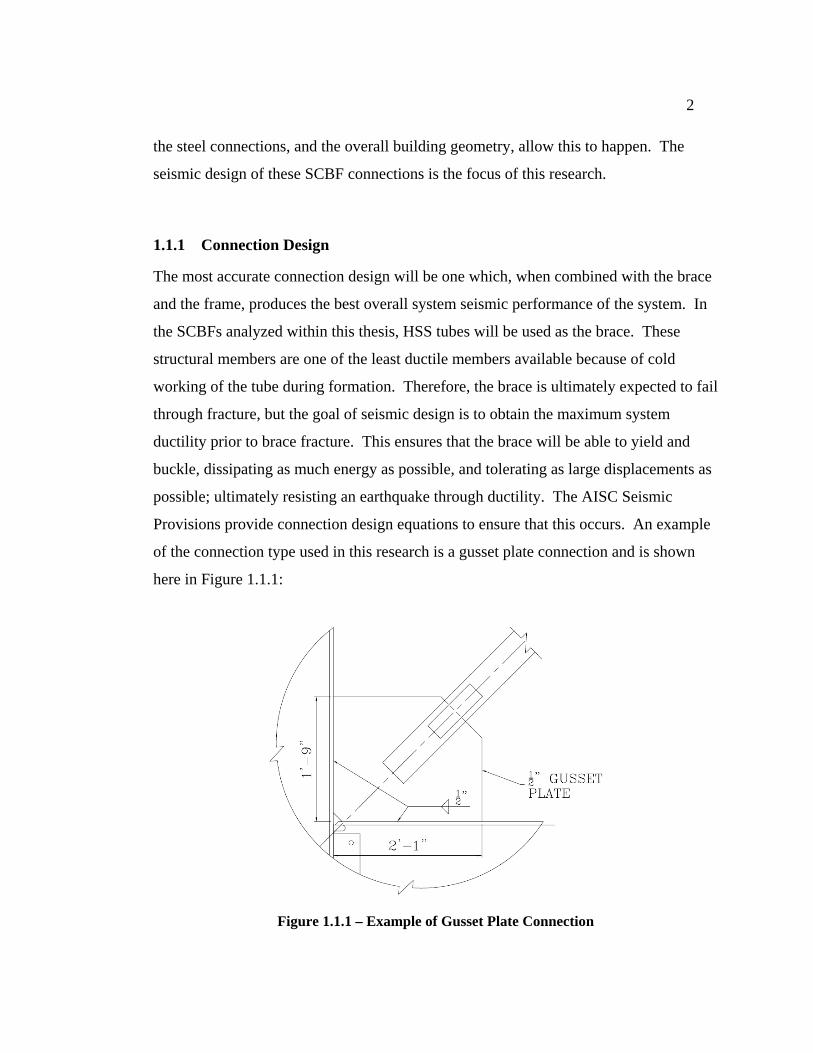
1.1.1 Connection Design
The most accurate connection design will be one which, when combined with the brace
and the frame, produces the best overall system seismic performance of the system. In
the SCBFs analyzed within this thesis, HSS tubes will be used as the brace. These
structural members are one of the least ductile members available because of cold
working of the tube during formation. Therefore, the brace is ultimately expected to fail
through fracture, but the goal of seismic design is to obtain the maximum system
ductility prior to brace fracture. This ensures that the brace will be able to yield and
buckle, dissipating as much energy as possible, and tolerating as large displacements as
possible; ultimately resisting an earthquake through ductility. The AISC Seismic
Provisions provide connection design equations to ensure that this occurs. An example
of the connection type used in this research is a gusset plate connection and is shown
here in Figure 1.1.1:
Figure 1.1.1 – Example of Gusset Plate Connection

3
AISC requires that each limit state resistance for the connection design is stronger than
the maximum expected force in the brace. The expected force in the brace has a
different value for tension and compression, and each connection design limit state is
evaluated by its appropriate expected resistance. Regardless of which value is used, the
expected strength of the brace depends on the expected yield stress of the material,
which depends on the grade of steel, the type of structural shape, and how it is formed.
This expected yield stress is higher than the minimum specified yield stress used in
design. Therefore, the expected strength of the brace in tension is equal to:
gyyt AFRP = (1.1)
and the expected strength of the brace in compression is equal to:
nyc PRP 1.1= (1.2)
Where Ry is the ratio of the expected yield stress to the specified minimum yield stress
determined from the AISC Seismic Design Provisions, Fy is the minimum specified or
nominal yield stress of the brace, Ag is the gross area of the section, and Pn is the
nominal compressive strength of the brace determined by the AISC specifications.
According to AISC, all bracing connections shall be required to resist the expected
strength of the brace. For limit states that are susceptible to tensile forces:
tn PR ≥φ (1.3)
And for limit states susceptible to compressive forces:
cn PR ≥φ (1.4)

4
However, some of the limit states which are required to be stronger than the strength of
the brace may actually increase the ductility of the frame if they are permitted to yield
by design. Figure 1.1.2a shows yield mechanisms that may be beneficial to the ultimate
drift capacity of the frame, while Figure 1.1.2b shows failure modes that will limit the
ultimate drift capacity of the frame if they occur before the brace fractures.
a) Yield Mechanisms b) Failure Modes
Figure 1.1.2 – Yield Mechanisms and Failure Modes of SCBF (Johnson 2005)
Since the seismic design of an SCBF relies on the ductility of the structure, yielding of
the gusset plate, yielding of the brace, yielding of the beams at the gusset plate edge,
and elongation of the bolt holes may all enhance the ductility of the frame. This
yielding should be permitted during high seismic loads to dissipate seismic energy and
develop inelastic deformation. However, failure modes shown above on the right in
Figure 1.1.2b: bolt fracture, net section fracture of the brace, net section fracture of the
gusset plate, buckling of the gusset plate, and block shear fracture should not occur
before the brace fractures so that the brace can achieve its maximum inelastic
5
deformation and energy dissipation, while supporting gravity loads and assuring the
integrity of the structure.
1.1.2 Overall Geometric Design
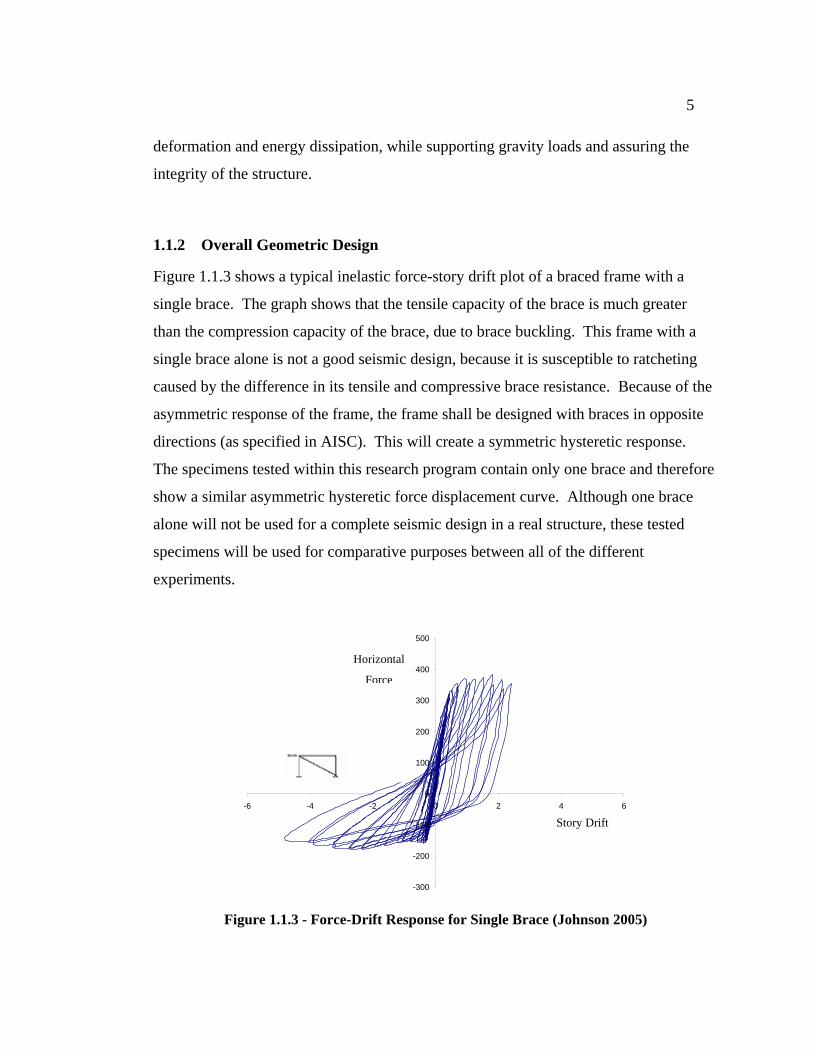
Figure 1.1.3 shows a typical inelastic force-story drift plot of a braced frame with a
single brace. The graph shows that the tensile capacity of the brace is much greater
than the compression capacity of the brace, due to brace buckling. This frame with a
single brace alone is not a good seismic design, because it is susceptible to ratcheting
caused by the difference in its tensile and compressive brace resistance. Because of the
asymmetric response of the frame, the frame shall be designed with braces in opposite
directions (as specified in AISC). This will create a symmetric hysteretic response.
The specimens tested within this research program contain only one brace and therefore
show a similar asymmetric hysteretic force displacement curve. Although one brace
alone will not be used for a complete seismic design in a real structure, these tested
specimens will be used for comparative purposes between all of the different
experiments.
-300
-200
-100
0
100
200
300
400
500
-6 -4 -2 0 2 4 6
Figure 1.1.3 - Force-Drift Response for Single Brace (Johnson 2005)
Horizontal
Force
Story Drift

6
1.1.3 Performance Based Design
Performance based design has been proposed as a method of assuring enhanced seismic
performance. Three performance levels are assigned to respective seismic hazard
levels, Immediate Occupancy, Life Safety, and Collapse Prevention as shown in Table
1.1. These performance based design concepts are employed in this connection design
research.
Table 1.1 – Performance Based Objectives for SCBFs (Johnson 2005)
At the performance level of Immediate Occupancy (IO), a minimal amount of damage
is tolerable. The exact amount of tolerable damage will be dependant on the use of the
building. In general however, the structure should sustain its original strength and
stiffness, and have minimal structural damage so that the building may be occupied
immediately. Allowing the brace connections to yield as stated earlier in Section 1.1.1
may negatively affect this performance level, but limited yielding may be permissible.
7
The performance level of Life Safety (LS) requires there should be little risk to life-
threatening injury. This includes damage to structural and non-structural building
components and predominantly deals with falling debris hazards.
For the performance level of Collapse Prevention (CP), essentially any damage to the
structure is acceptable aside from total or partial collapse. If the brace fractures, the
structure is much more likely to collapse. Therefore, to postpone collapse, it is
advantageous to the structure that the brace does not fracture. This research will
examine how the brace connection affects the performance based design capacity limit
states of the braced frame and the connection.
1.2 Research Objectives
The research presented in this thesis was funded in part by the National Science
Foundation (NSF) with the program CMS-0301792, “Performance-Based Design of
Concentrically Braced Frames” and by the American Institute of Steel Construction.
Funding from the NSF included research of SCBFs as well as buckling restrained
braced frames (BRBFs). Specifically, the objectives of this research involve:
1. Evaluation of current design and research models.
2. Experimentally developing improved design of SCBFs and BRBFs systems to meet
a balanced design approach.
3. Developing analytical, performance, and design models to support improved design
of both systems.
Gunnarson (2004) and Yoo (2006) performed analytical evaluations for this research
project. Christopulos (2005) performed the experimental research on BRBFs. The first
and second series of experimental SCBF tests, which this thesis builds upon, were
performed by Johnson (2005) and Herman (2007). The SCBF tests in this ongoing

8
research program have been focused primarily on how the gusset plate connection detail
influences the seismic performance of the frame. Johnson focused much of his analysis
on achieving a desirable yielding hierarchy, while Herman was concerned with
identified the effect of gusset plate connection design variables on the connection
stiffness and the system performance. This thesis will use the analysis, results, and
findings of these two previous sets of tests, and additional testing, to develop a
preliminary design guide for the gusset plate connection.
1.3 Overview of Report
This thesis will discuss the experiments carried out at UW testing full scale special
concentrically braced frames. It is first necessary to discuss the previous research and
existing literature regarding SCBFs, which will be located in Chapter 2. The design of
the specimens will be detailed in Chapter 3, including a brief summary of the gusset
plate designs for all of the specimens in the research program. Chapter 4 will discuss
the details of the experiment setup and details on how the experiments were carried out.
Chapter 5 will discuss the behavior and response of each of the six SCBFs detailed in
this thesis. Interpretation and analysis of the data of each of the tests will be made in
Chapter 6. A comparison of the performance of all 17 of the tests in this research
program will be made in Chapter 7. A preliminary design guide for the gusset plate
connection is presented in Chapter 8, based on the results of all of the program tests. A
summary and conclusion with recommendations for further research is included in
Chapter 9. Appendices are included with other relevant information.
9
Chapter 2: Literature Review
2.0 Introduction
A great deal of experimental research has been carried out on braced frames and their
components. This research can be divided into three main areas: experiments of the
brace (Section 2.1), experiments of the gusset plates (Section 2.2), and experiments of
the system (Section 2.3) which includes the brace, gusset plate and frame. Section 2.4
will discuss the findings of the two previous sets of tests within this research program.
2.1 Brace Experiments
The brace is the primary element in SCBFs. It should absorb most of the seismic
energy delivered by an earthquake, and if designed according to AISC, should be the
first element to fracture under extreme seismic loading. Therefore, the behavior of the
brace needs to be understood to maximize the seismic response of the frame.
There have been many tests that have researched brace behavior under cyclical loads.
These tests include Astaneh-Asl (1982), Aslani and Goel (1989), Tang and Goel (1987),
Gugerli and Goel (1982), Walpole (1996), Jain et al (1978), and Shaback and Brown
(2003).
One particular study completed by Jain et al (1978) showed that the slenderness ratio of
the brace has a large effect on the drift life of the brace. This research showed that the
higher the slenderness ratio of the brace, the higher the positive and negative drift
achieved by the brace.

10
These conclusions were also verified by research from Shaback and Brown (2003) and
by Tang and Goel (1987). The more slender specimens experienced less severe
buckling and therefore postponed brace fracture until higher drifts. Although according
to Shaback and Brown, who tested HSS sections, the slenderness ratio was not as
influential as the width thickness ratio of the tube walls on the fracture life of the brace.
As the width thickness ratio of the walls decreased, fracture was postponed. This was
because the fracture life of the brace followed closely after local buckling of the
compression flange in the plastic region, and because resistance to local buckling
increases as the width thickness ratio decreases according to elasticity theories.
Shaback and Brown also concluded that the hysteretic behavior and energy dissipation
are positively affected by a brace with a lower slenderness ratio. This shows that there
is a trade-off between energy dissipation and drift life of a brace that is subjected to
hysteretic loads. In general, a brace with a low slenderness ratio will have larger
hysteretic loops, dissipating more energy at a given stage in the applied displacement,
but fracture earlier, and a brace with a high slenderness ratio will have smaller
hysteretic loops dissipating less energy but have a longer fracture life.
2.2 Gusset Plate Experiments
Gusset plates provide the connection between the brace and the building frame. These
plates have been shown, with the past research, to greatly affect the response of the
brace. Experimental programs have been carried out by Bjorhovde and Chakrabarti
(1985), Nast et al (1999), Rabinovitch and Cheng (1993), Brown (1988), Grondin et al
(2000), Whitmore (1952), Astaneh-Asl et al (1982) and Aslani and Goel (1989). Listed
here are relevant examples of experiments for the better understanding of gusset plates
and there influence on SCBFs.

11
Whitmore (1952) proposed that the gusset plates be checked for strength using the
width based on the connection length as shown in Figure 2.2.1. This method assumes
that the load spreads out 30 degrees from the start of the connection and therefore the
gusset plate needs to resist the design load at the end of the connection based on the
width calculated from the two 30 degree angles and the width of the connection. Notice
that this geometry does not take into the account any gusset plate material that is outside
of the Whitmore width. Common practice has adopted this method and uses it for
welded and bolted connections even though it was originally intended for bolted
connections only.
Figure 2.2.1 – Whitmore Width
In multiple studies completed by Astaneh-Asl, Goel, and Hanson (1982, 1983, and
1985) at the University of Michigan, gusset plates were shown to have significant
impact on the performance of the brace. This is further discussed in the Steel TIPS
report by Astaneh-Asl, Cochran, and Sabelli (2006). The study parameters of this
research included plate size, brace-to-gusset plate connection type (welded vs. bolted),
connection length, brace size, and stitch spacing. This research showed that a higher
brace performance would be achieved if the gusset plate allowed free rotation. In order

12
to achieve this, they recommended that the free length between the end of the brace and
the assumed line of restraint for the gusset plate be a dimension of 2t (where t is the
thickness of the gusset plate) as shown in Figure 2.2.2. This research also showed that
the equations used for calculating the buckling capacity of the gusset plate accurately
predicted this limit state.
Figure 2.2.2 – 2t Clearance
The test setup for these tests is shown in Figure 2.2.3. The framing members were
attached as shown so that they could be used for multiple specimens. The brace
centerline does not intersect the framing member centerlines in this setup and the brace
is only connected to the beam, and not the column. Additionally, only tapered plates
were tested within this research.

13
Figure 2.2.3 – Test Schematic of Astaneh-Asl, Goel, and Hanson (1982)
This research was continued at the University of Michigan in 1989 using the same test
setup by Aslani and Goel. They examined the impact of stitch spacing, brace
configuration and end fixity of the brace. With regard to the end fixity, there was mixed
reviews. Specimens with fully restrained end connections increased the energy
dissipation and also the buckling load when compared to the flexible end connections.
However, in some of these tests, these specimens were more brittle than the specimens
with flexible connections.
2.3 System Experiments
There are not a large number of experiments that have included an accurate
representation of an entire system which includes the brace, gusset plate, and framing
members of an actual building structure. One such test that included all three of these
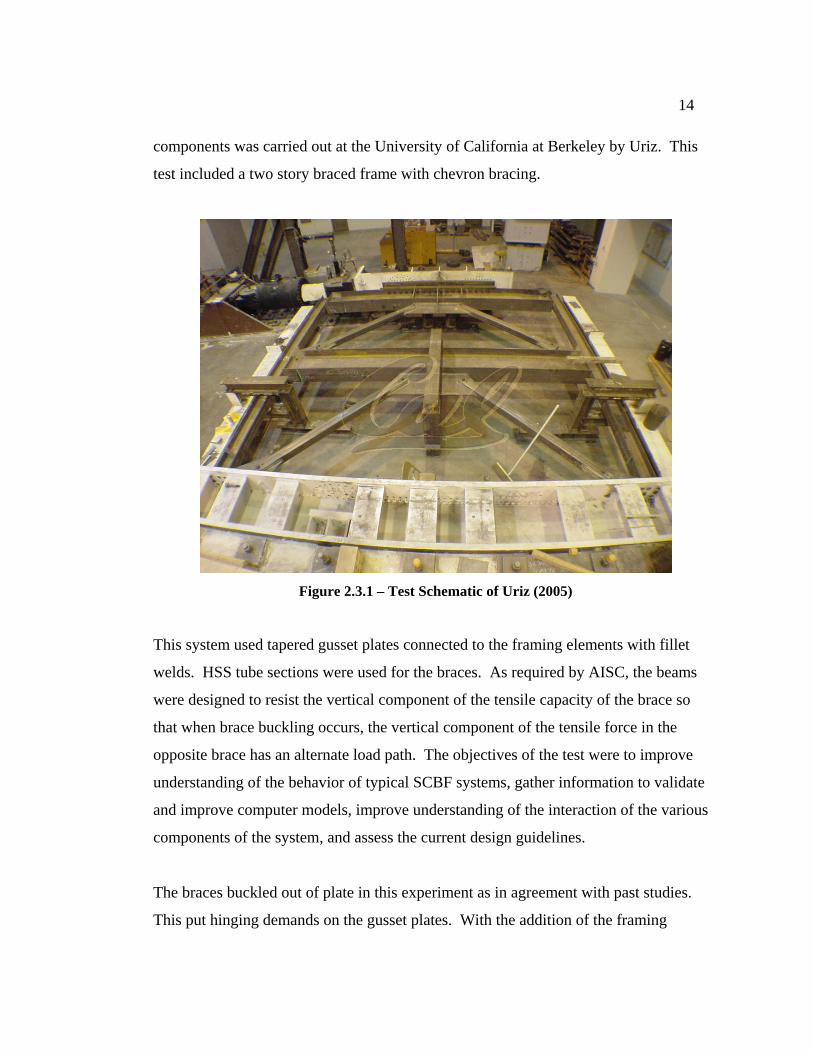
14
components was carried out at the University of California at Berkeley by Uriz. This
test included a two story braced frame with chevron bracing.
Figure 2.3.1 – Test Schematic of Uriz (2005)
This system used tapered gusset plates connected to the framing elements with fillet
welds. HSS tube sections were used for the braces. As required by AISC, the beams
were designed to resist the vertical component of the tensile capacity of the brace so
that when brace buckling occurs, the vertical component of the tensile force in the
opposite brace has an alternate load path. The objectives of the test were to improve
understanding of the behavior of typical SCBF systems, gather information to validate
and improve computer models, improve understanding of the interaction of the various
components of the system, and assess the current design guidelines.
The braces buckled out of plate in this experiment as in agreement with past studies.
This put hinging demands on the gusset plates. With the addition of the framing
15
members, considerable damage was noticed in these members. Since the beam was
designed for the point load at midspan, it was much larger than the column. Therefore
the column received the more critical damage in the form of fracture of the section next
to the beam-to-column connection.
An interesting thing to note with these experiments is that once one of the stories started
to buckle and yield, damage was concentrated in this story. Buckling and yielding did
not occur in the braces of the other story at this time in the experiment. Additionally,
when one of the brace buckled, the beam that was designed for the vertical component
of the tensile capacity of the brace deflected elastically toward the brace. This limited
the yielding in the tensile brace, and less energy was dissipated than expected.
2.4 Previous Tests within Test Program
Two researchers, Johnson (2005) and Herman (2007), have completed 11 total tests
which are built upon in this thesis. All three sets of tests use the same test setup and
similar test specimens which include a 12 foot by 12 foot one story singe bay structure,
complete with framing members connected to a diagonal brace with gusset plates.
These gusset plates were connected to both the beam and the column and used both
rectangular and tapered geometry.
Johnson concluded that the 2t straight line clearance provides too large of a plate, and
instead, a plate using an elliptical clearance will create a smaller plate which will
increase the drift capacity of the brace. The gusset plate thickness was recommended to
be minimized by using a β factor of 0.85 for the limit state of Whitmore yielding.
Additionally, the gusset plate welds should be designed to resist the plastic capacity of
the plate as the uniform force method did not design welds strong enough to cause brace
fracture before weld fracture.

16
Similar results were found by Herman. Additional conclusions included that tapered
plates more evenly distribute the inelastic action leading to improved system
performance. However, tapered plates increase the demands on the gusset plate welds.
Framing element stiffness was also found to influence the ductility of the system.
Higher beam stiffness led to reduced drift capacity of the brace.
2.5 Summary of Research
According to the research, there are many factors which affect the response of the
frame. The hysteretic response and drift life of the brace mainly depend on the
slenderness ratio and width thickness ratio of the brace. There appears to be a strong
agreement that gusset plates should allow for free rotation. However, allowing free
rotation appears to depend on the support conditions of the gusset plate.
Many of the experiments listed in this review have only researched individual
components of SCBFs. While these experiments have been valuable in determining the
basic response of the components, additional research is required that combines all of
the components of an actual building structure. This is so that the experiments will
imitate the response of a real building and so that the structural response that is only
associated with the collective system is not overlooked.
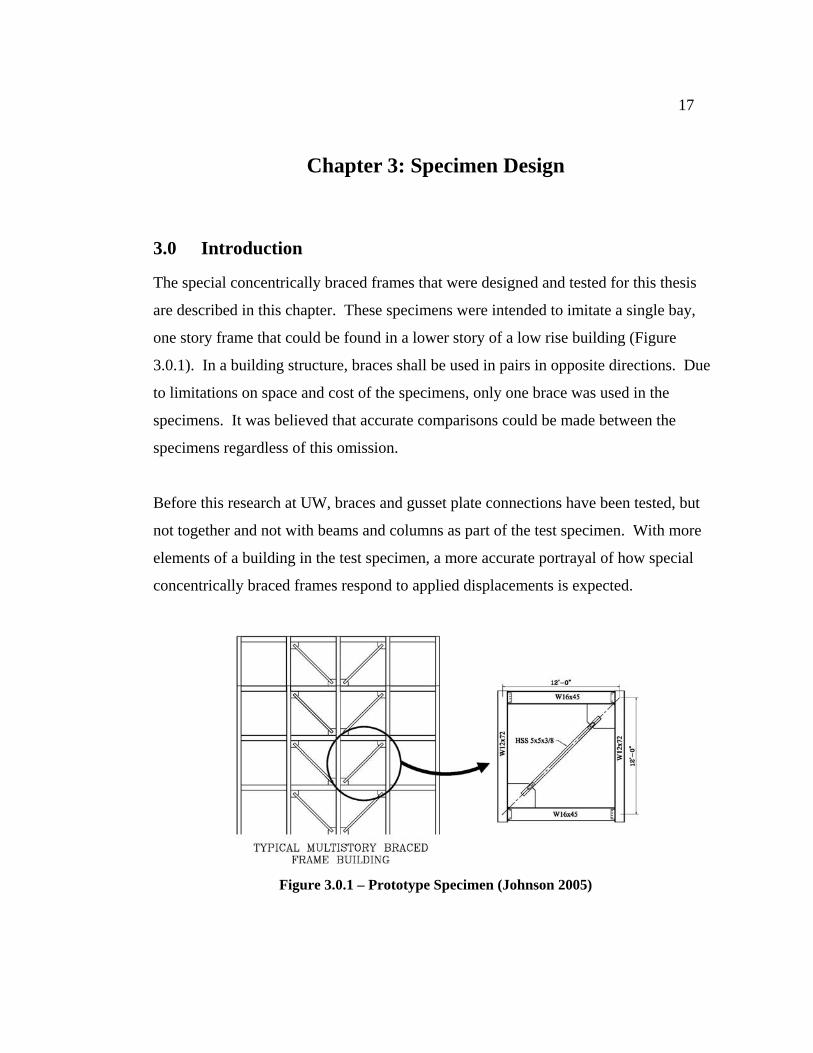
17
Chapter 3: Specimen Design
3.0 Introduction
The special concentrically braced frames that were designed and tested for this thesis
are described in this chapter. These specimens were intended to imitate a single bay,
one story frame that could be found in a lower story of a low rise building (Figure
3.0.1). In a building structure, braces shall be used in pairs in opposite directions. Due
to limitations on space and cost of the specimens, only one brace was used in the
specimens. It was believed that accurate comparisons could be made between the
specimens regardless of this omission.
Before this research at UW, braces and gusset plate connections have been tested, but
not together and not with beams and columns as part of the test specimen. With more
elements of a building in the test specimen, a more accurate portrayal of how special
concentrically braced frames respond to applied displacements is expected.
Figure 3.0.1 – Prototype Specimen (Johnson 2005)

18
The overall specimen was design by Shawn Johnson during his graduate work at UW
and is detailed in his thesis: Improved Seismic Performance of Concentrically Braced
Frames (Johnson 2005). For more information on the overall frame regarding the
design philosophy, design specifications, calculations, frame tolerances, and fabrication
of the frame, the reader is referred to this earlier work (Johnson 2005, Chapter 3).
Appendix A of this thesis shows detailed calculations for the connection design of two
of the specimens. The first section shows calculations for HSS-12. Many of these
calculations were similar if not exactly the same for the remaining specimens. For this
reason, only the different calculations for HSS-14 are shown in the second section of
Appendix A.
This thesis builds on the earlier work by Johnson (2005) and Herman (2007). The 11
previous specimens that have been tested prior to this research are discussed in detail,
including the test results, provided elsewhere (Johnson 2005, Herman 2007). Tables
3.1.1 and 3.1.2 show and describe the gusset plate details for these previous tests. Six
additional tests were completed, and Table 3.1.3 provides an overview of these tests.
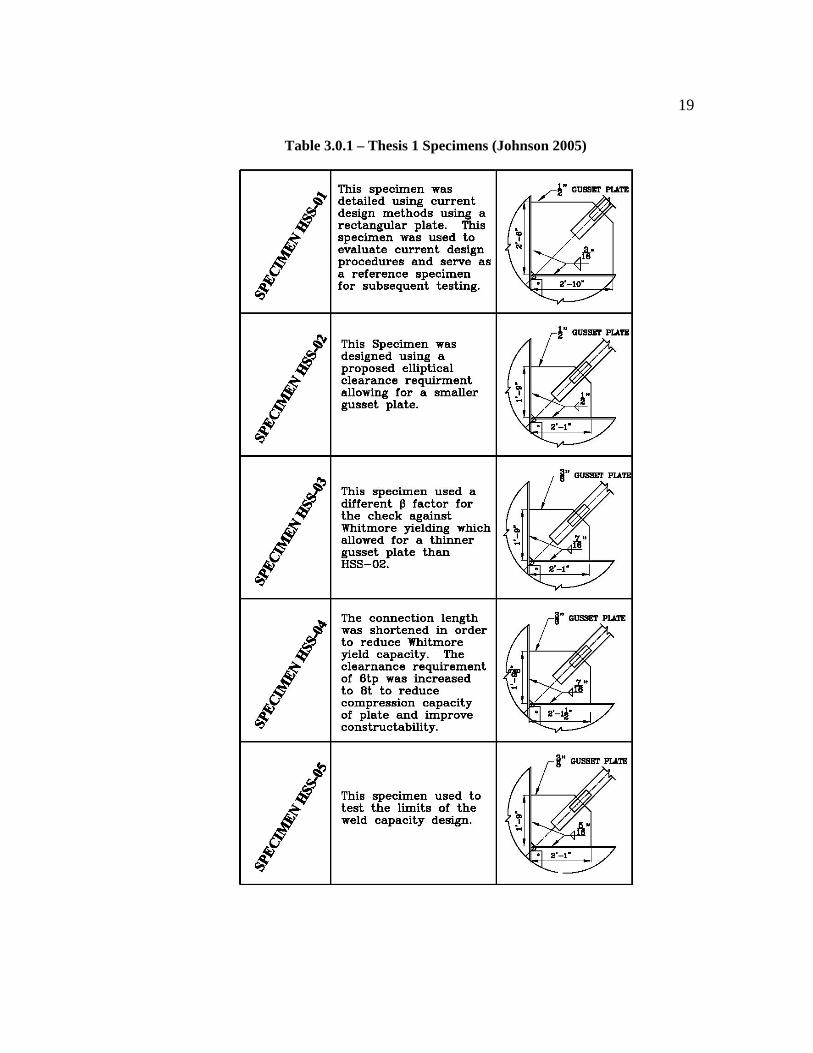
19
Table 3.0.1 – Thesis 1 Specimens (Johnson 2005)

20
Table 3.0.2 – Thesis 2 Specimens (Herman 2007)
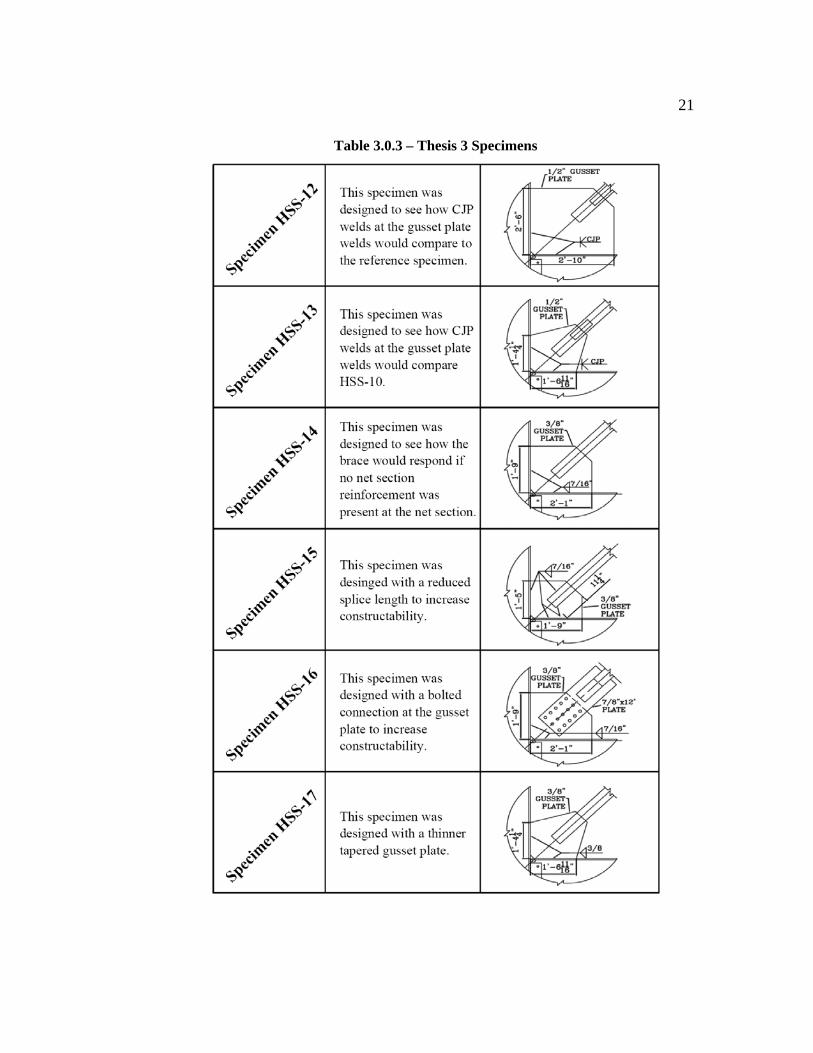
21
Table 3.0.3 – Thesis 3 Specimens

22
Table 3.0.3 shows the gusset plate details for the six specimens that were tested and that
are the topic for this thesis. Each of the next six sections discusses why each of these
specimens has been chosen to be tested.
3.1 HSS-12 – Reference Specimen with CJP Welds
Currently, AISC Seismic Provisions require a straight line 2t clearance as illustrated in
Figure 3.1.1. This requires that the brace be set away from the beam column
intersection a distance 2t from a line perpendicular to the longitudinal axis of the brace
which also intersects the corner of the gusset plate. The value of this requirement is
questionable as evident in the previous research. Therefore, in order to further
investigate the AISC recommendation, HSS-12 utilized the straight line 2t clearance.
Figure 3.1.1 – 2t Clearance
Figure 3.1.2 shows the gusset plate detail for specimen HSS-12. This gusset plate detail
was designed in accordance with the AISC Seismic Provisions. It was exactly the same
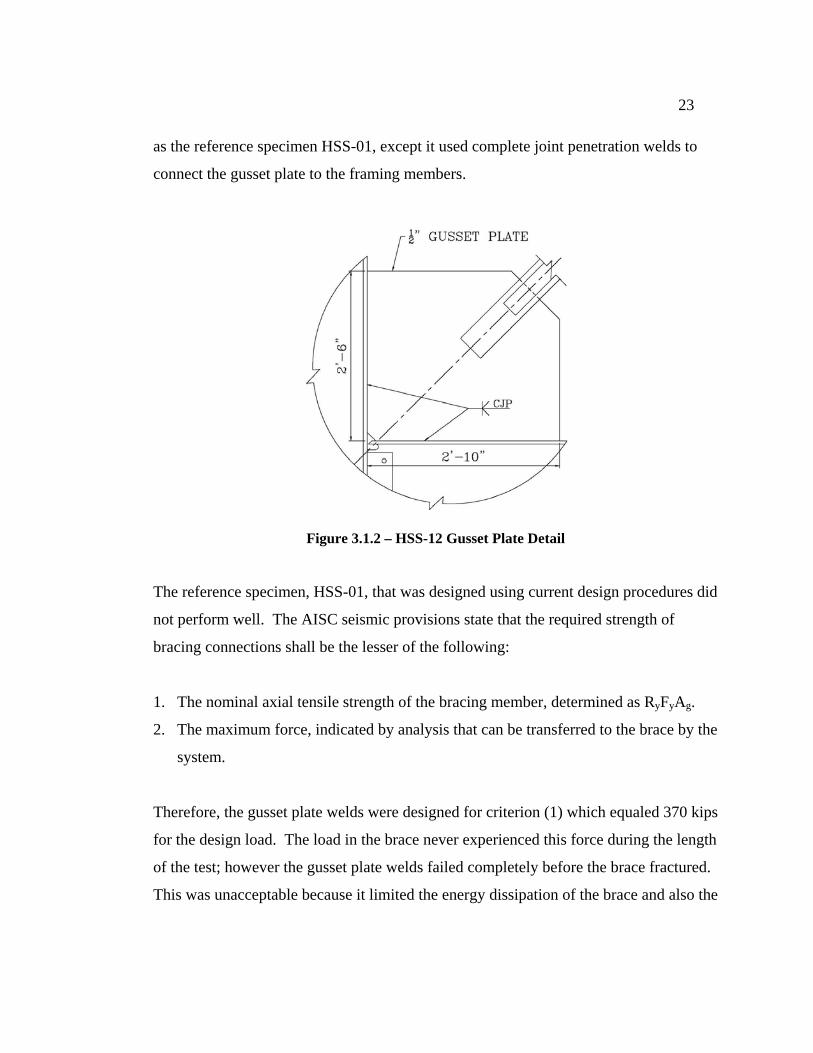
23
as the reference specimen HSS-01, except it used complete joint penetration welds to
connect the gusset plate to the framing members.
Figure 3.1.2 – HSS-12 Gusset Plate Detail
The reference specimen, HSS-01, that was designed using current design procedures did
not perform well. The AISC seismic provisions state that the required strength of
bracing connections shall be the lesser of the following:
1. The nominal axial tensile strength of the bracing member, determined as RyFyAg.
2. The maximum force, indicated by analysis that can be transferred to the brace by the
system.
Therefore, the gusset plate welds were designed for criterion (1) which equaled 370 kips
for the design load. The load in the brace never experienced this force during the length
of the test; however the gusset plate welds failed completely before the brace fractured.
This was unacceptable because it limited the energy dissipation of the brace and also the
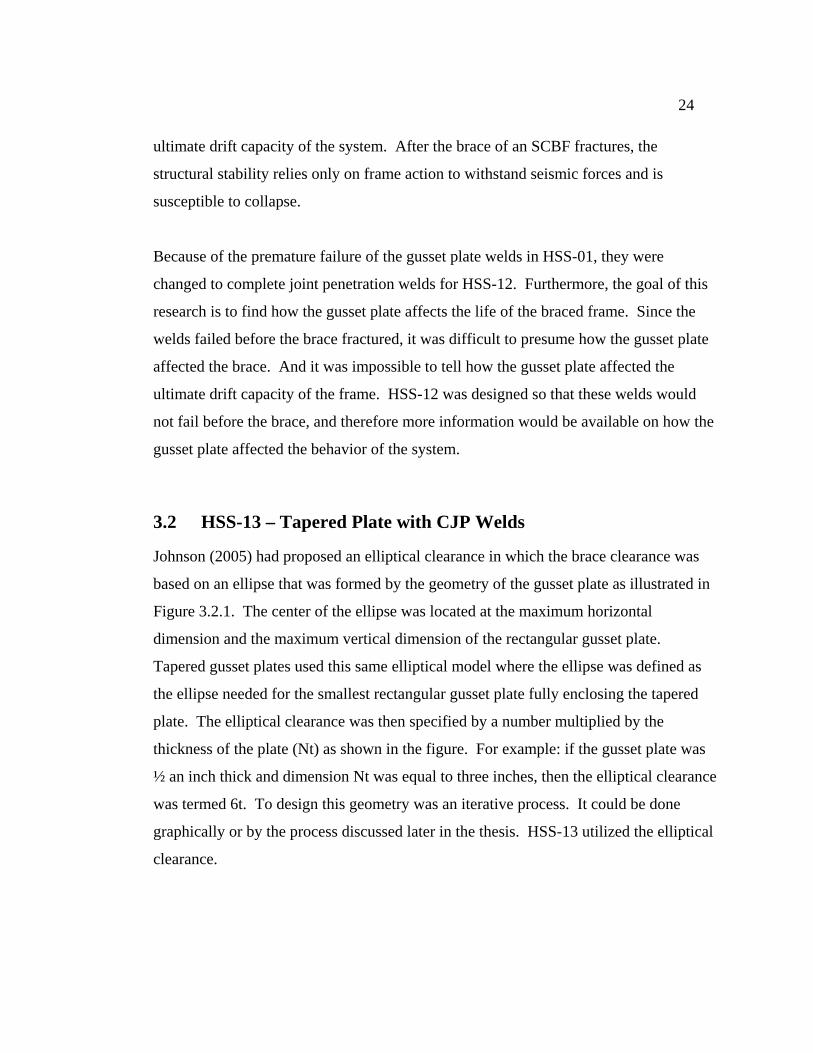
24
ultimate drift capacity of the system. After the brace of an SCBF fractures, the
structural stability relies only on frame action to withstand seismic forces and is
susceptible to collapse.
Because of the premature failure of the gusset plate welds in HSS-01, they were
changed to complete joint penetration welds for HSS-12. Furthermore, the goal of this
research is to find how the gusset plate affects the life of the braced frame. Since the
welds failed before the brace fractured, it was difficult to presume how the gusset plate
affected the brace. And it was impossible to tell how the gusset plate affected the
ultimate drift capacity of the frame. HSS-12 was designed so that these welds would
not fail before the brace, and therefore more information would be available on how the
gusset plate affected the behavior of the system.
3.2 HSS-13 – Tapered Plate with CJP Welds
Johnson (2005) had proposed an elliptical clearance in which the brace clearance was
based on an ellipse that was formed by the geometry of the gusset plate as illustrated in
Figure 3.2.1. The center of the ellipse was located at the maximum horizontal
dimension and the maximum vertical dimension of the rectangular gusset plate.
Tapered gusset plates used this same elliptical model where the ellipse was defined as
the ellipse needed for the smallest rectangular gusset plate fully enclosing the tapered
plate. The elliptical clearance was then specified by a number multiplied by the
thickness of the plate (Nt) as shown in the figure. For example: if the gusset plate was
½ an inch thick and dimension Nt was equal to three inches, then the elliptical clearance
was termed 6t. To design this geometry was an iterative process. It could be done
graphically or by the process discussed later in the thesis. HSS-13 utilized the elliptical
clearance.
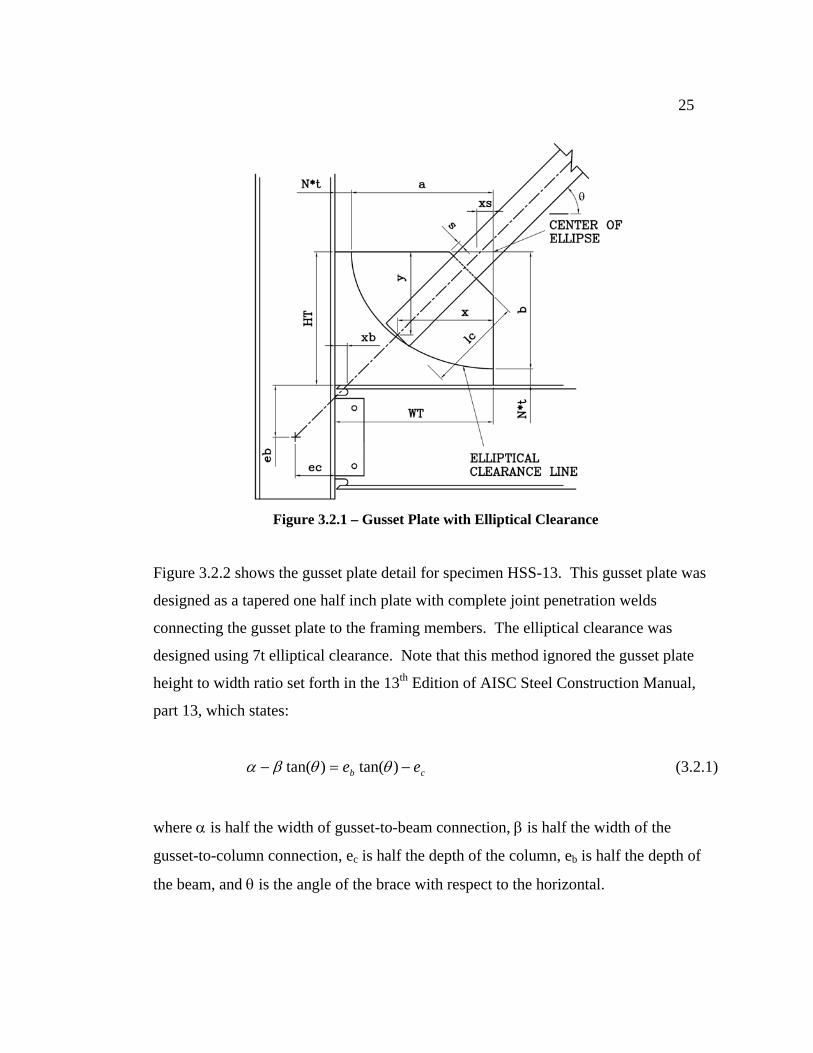
25
Figure 3.2.1 – Gusset Plate with Elliptical Clearance
Figure 3.2.2 shows the gusset plate detail for specimen HSS-13. This gusset plate was
designed as a tapered one half inch plate with complete joint penetration welds
connecting the gusset plate to the framing members. The elliptical clearance was
designed using 7t elliptical clearance. Note that this method ignored the gusset plate
height to width ratio set forth in the 13th Edition of AISC Steel Construction Manual,
part 13, which states:
cb ee −=− )tan()tan( θθβα (3.2.1)
where α is half the width of gusset-to-beam connection, β is half the width of the
gusset-to-column connection, ec is half the depth of the column, eb is half the depth of
the beam, and θ is the angle of the brace with respect to the horizontal.

26
Figure 3.2.2 – HSS-13 Gusset Plate Detail
This design was very similar to HSS-10. The only difference was the gusset plate
welds. HSS-10 used one half inch fillet welds while HSS-13 used complete joint
penetration welds. HSS-10 had an overall fine performance, however the north east
beam weld tore relatively early in the experiment: at a drift ratio of -1.35%. This crack
only propagated to two inches, but the small deformation of initiation of cracking
causes concern about some of the higher seismic performance goals. The north east
column weld began to fracture at a drift ratio of -2.21% and increased to a length of
seven inches by the end of the test. The south west beam weld developed a crack of
three inches by the end of the test. And the south west column weld developed a crack
of four inches by the end of the test. These cracks may cause concern for some
performance based design limit states. Therefore, the gusset plate for HSS-13 was
welded to the framing members using complete joint penetration welds to determine if
they would reduce or delay weld cracking.

27
3.3 HSS-14 – Unreinforced Net Section
Figure 3.3.1 shows the gusset plate detail for specimen HSS-14. This specimen was
designed specifically to examine the necessity of the reinforcement plate that is
typically welded to the brace at the critical net section of the brace (at the end of the
slot) as shown in Fig. 3.3.2. Specimens HSS-01 through HSS-13 all had the
reinforcement plate welded to the brace (see Tables 3.0.1, 3.0.2 and 3.0.3 for connection
details with the reinforcement plate).
Figure 3.3.1 – HSS-14 Gusset Plate Detail
In order to connect the brace to the gusset plate, a slot shown in Figure 3.3.2 was cut
into the brace in which the gusset plate slides into. The brace was then welded to the
gusset plate at the edges of the slot. One negative aspect of this connection detail was
the slot must continue beyond the edge of the gusset plate, and a critical net section
developed at this position as shown in Fig. 3.3.2. In tests ran at the University of
California at Berkeley, cracks occurred through the net section (Yang and Mahin,
2005). As a result, in all previous testes (HSS-01 to HSS-13) executed at UW, the net
section was reinforced by welding plates on the top and bottom flanges of the tube as
illustrated in column 3 of Tables 3.0.1 and 3.0.2 and Figures 3.1.2 and 3.2.2.

28
Figure 3.3.2 –Slot Detail of Brace HSS-14
Nonlinear analyses (Jung 2006) suggested that due to the test setup differences between
UCB and UW, the problem of net section might not be an issue for the UW specimens.
The main difference between the two setups was that the tests at UCB tested the brace
and gusset plates, with very rigid end supports at the gusset plates. However the test
setup at UW included framing members of a building that are connected to the brace
and gusset plate assembly. The connections for the UW tests were relatively flexible
compared to the Berkeley tests, and therefore the test setup at UW was more accurate
than the test setup at UCB. There were still some major simplifications with the setup
at UW, but it was one step more sophisticated than the UCB setup. It was proposed that
these differences may negate the need for the net section reinforcement. This was done
to inhibit crack initiation from this internal source.
The hole at the base of the slot was fabricated by drilling a hole larger than the slot
itself. This was done so that the hole would not obtain any scratches during further
fabrication, i.e. grinding of the slot to ensure fit up. The hole was then reamed to create
a smooth surface.
Below is an analysis of the net section using the AISC 2002 Seismic Provisions and the
AISC Manual of Steel Construction:
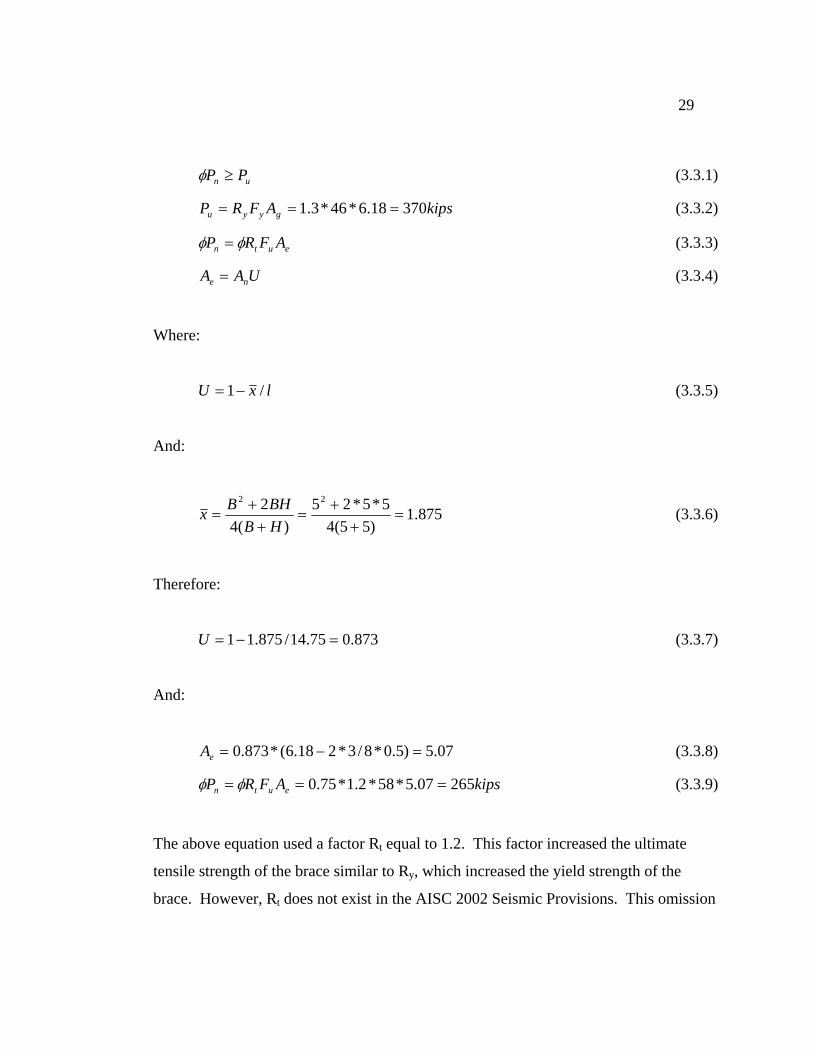
29
un PP ≥φ (3.3.1)
kipsAFRP gyyu 37018.6*46*3.1 === (3.3.2)
eutn AFRP φφ = (3.3.3)
UAA ne = (3.3.4)
Where:
lxU /1−= (3.3.5)
And:
875.1)55(4
5*5*25)(4
2 22
=+
+=
++
=HBBHBx (3.3.6)
Therefore:
873.075.14/875.11 =−=U (3.3.7)
And:
07.5)5.0*8/3*218.6(*873.0 =−=eA (3.3.8)
kipsAFRP eutn 26507.5*58*2.1*75.0 === φφ (3.3.9)
The above equation used a factor Rt equal to 1.2. This factor increased the ultimate
tensile strength of the brace similar to Ry, which increased the yield strength of the
brace. However, Rt does not exist in the AISC 2002 Seismic Provisions. This omission

30
was realized in the 2005 Seismic Provisions, when it was added into the code. In the
new code, Ry and Rt are 1.4 and 1.3 respectively. In order to maintain a similar
relationship between Ry and Rt for this analysis, a value of 1.2 was assumed for Rt,
compared to 1.3 for Ry.
Since un PP <φ , the code required the net section to be reinforced. However, to check
the accuracy of the provision, the net section was not reinforced.
The gusset plate of HSS-14 was designed using the elliptical clearance method with a
7.7t offset similar to HSS-05 and HSS-06. The gusset plate was 3/8 inch thick and
welded to the framing members with a 7/16 inch fillet weld. As previous research
(Johnson 2005) recommended, the weld was designed to have a larger tensile capacity
than the expected tensile capacity of the gusset plate.
3.4 HSS-15 – Reduced Splice Length
Figure 3.4.1 shows the gusset plate detail for specimen HSS-15. This specimen was
designed with the connection between the brace and the gusset plate to have a smaller
length. All earlier tests except HSS-04 used 14.75 inches as their splice length (HSS-04
had a splice length of 13.75 inches). This specimen used 11.25 inches as its splice
length, because this was the minimum length required for block shear of the gusset.
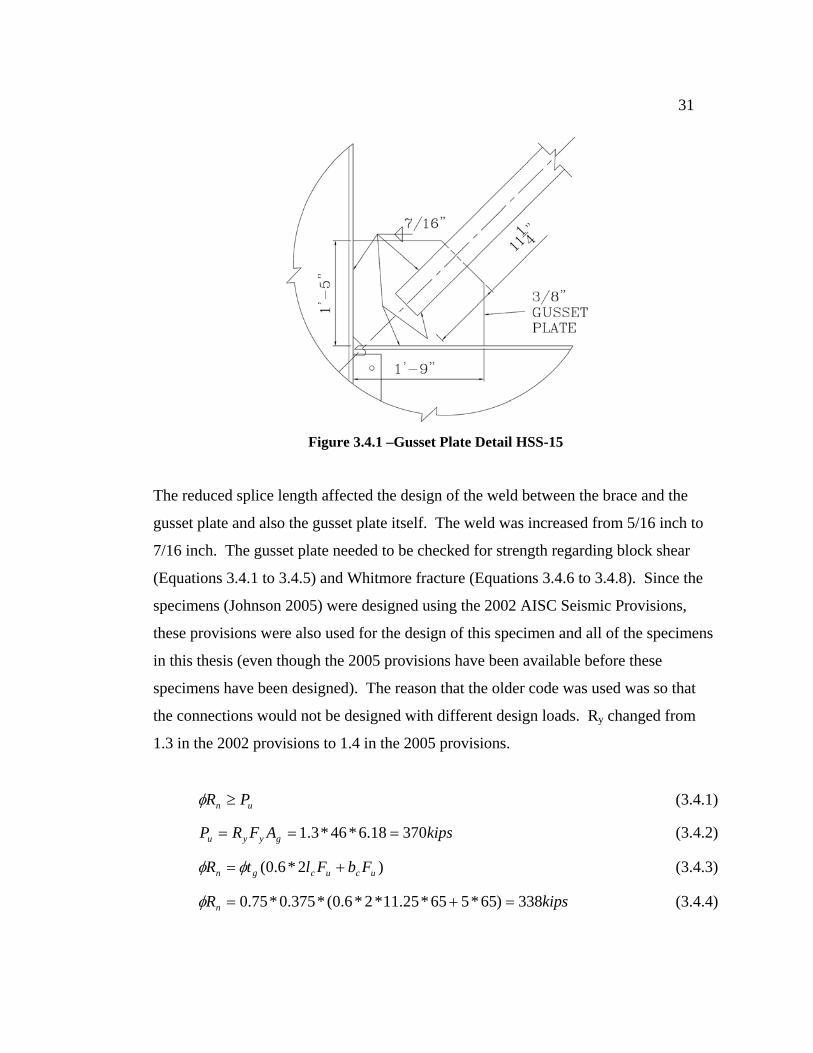
31
Figure 3.4.1 –Gusset Plate Detail HSS-15
The reduced splice length affected the design of the weld between the brace and the
gusset plate and also the gusset plate itself. The weld was increased from 5/16 inch to
7/16 inch. The gusset plate needed to be checked for strength regarding block shear
(Equations 3.4.1 to 3.4.5) and Whitmore fracture (Equations 3.4.6 to 3.4.8). Since the
specimens (Johnson 2005) were designed using the 2002 AISC Seismic Provisions,
these provisions were also used for the design of this specimen and all of the specimens
in this thesis (even though the 2005 provisions have been available before these
specimens have been designed). The reason that the older code was used was so that
the connections would not be designed with different design loads. Ry changed from
1.3 in the 2002 provisions to 1.4 in the 2005 provisions.
un PR ≥φ (3.4.1)
kipsAFRP gyyu 37018.6*46*3.1 === (3.4.2)
)2*6.0( ucucgn FbFltR += φφ (3.4.3)
kipsRn 338)65*565*25.11*2*6.0(*375.0*75.0 =+=φ (3.4.4)

32
Unfortunately, block shear was not satisfied by the strength of the gusset plate. In order
to satisfy this equation a β factor was used in place of φ. The β factor used was 0.85 to
make the limit state of block shear stronger than the applied load. The experiment
would help determine the accuracy of increasing the capacity of the gusset plate.
kipsRn 383)65*565*25.11*2*6.0(*375.0*85.0 =+=β (3.4.5)
Notice that in Equation J4-5 of the 13th Edition of the AISC Manuel of Steel
Construction, the strength of block shear has two requirements. One requirement
includes shear yielding in the plate, and the other includes shear fracture of the plate.
The requirement that includes shear yielding was ignored for the gusset plate design.
This is because a gusset plate that yields will create a more ductile connection which
will absorb more energy and positively affect the drift capacity of the brace.
Similar to block shear, Whitmore fracture did not have enough strength to resist the
design load as shown in Equation 3.4.6 and 3.4.7. Therefore, in place of φ, a β factor of
0.85 was used to increase the strength of this limit state as shown in Equation 3.4.8.
The accuracy of this alteration to the provisions will be verified with the test.
))30tan(2( ccugn blFtR += φφ (3.4.6)
kipsRn 328)5)30tan(25.11*2(65*375.0*75.0 =+=φ (3.4.7)
kipsRn 372)5)30tan(25.11*2(65*375.0*85.0 =+=β (3.4.8)
Whitmore yielding was omitted as a design check. This is because it was perceived as
desirable for the gusset plate to yield.
33
HSS-15 had a 3/8 inch gusset plate with a 6t elliptical offset. Recommended by
previous research (Johnson 2005), the gusset plate fillet welds were designed to have
greater tensile capacity than the tensile capacity of the gusset plate, and therefore, 7/16
inch thick. Because HSS-14 did not show any problems with the net section, HSS-15
also did not include net section reinforcement.
3.5 HSS-16 – Bolted Splice Connection
Figure 3.5.1 shows the connection detail for specimen HSS-16. This specimen is much
different than the other specimens. Instead of connecting the brace directly to the
gusset plate with a fillet weld (which would need to be field welded in an actual
building), the brace was connected to an extension plate which was bolted to the gusset
plate. The advantage to this was that the field connection between the extension plate
and the gusset plate was a bolted connection, which may have economic benefits. The
weld which connected the brace to the extension plate could be done in the shop to omit
the necessity of field welds. This extension plate was slotted for about one third of the
length of the splice, while the brace was slotted two thirds the length of the splice. This
is based on a net section concept proposed by Packer (2007) and it eliminated the need
for net section reinforcement. The extension plate was connected to the gusset plate
with 1-1/8 inch slip critical class A bolts with oversized holes in both the gusset plate
and the extension plate. The oversized holes were used to permit more rapid erection
and placement of the brace.

34
Figure 3.5.1 –Gusset Plate Detail HSS-16
The spacing of the bolts was four inches perpendicular to the longitudinal axis of the
brace. Three inch spacing was used in the parallel direction, which was the minimum
allowable spacing per Section J3.3 of AISC. The bolts were designed using the 2002
AISC Manual of Steel Construction, with slip being considered a serviceability limit
state (see Table 7-15, AISC):
un PR ≥φ (3.5.1)
kipsAFRP gyyu 37018.6*46*3.1 === (3.5.2)
kipsRn 4.25=φ (3.5.3)
6.14==n
u
RP
nφ
bolts (3.5.4)
The connection was also checked for bearing at the bolt holes as shown in Equation
3.5.3 and 3.5.4 (especially since the minimum allowable spacing was used for the
longitudinal spacing):
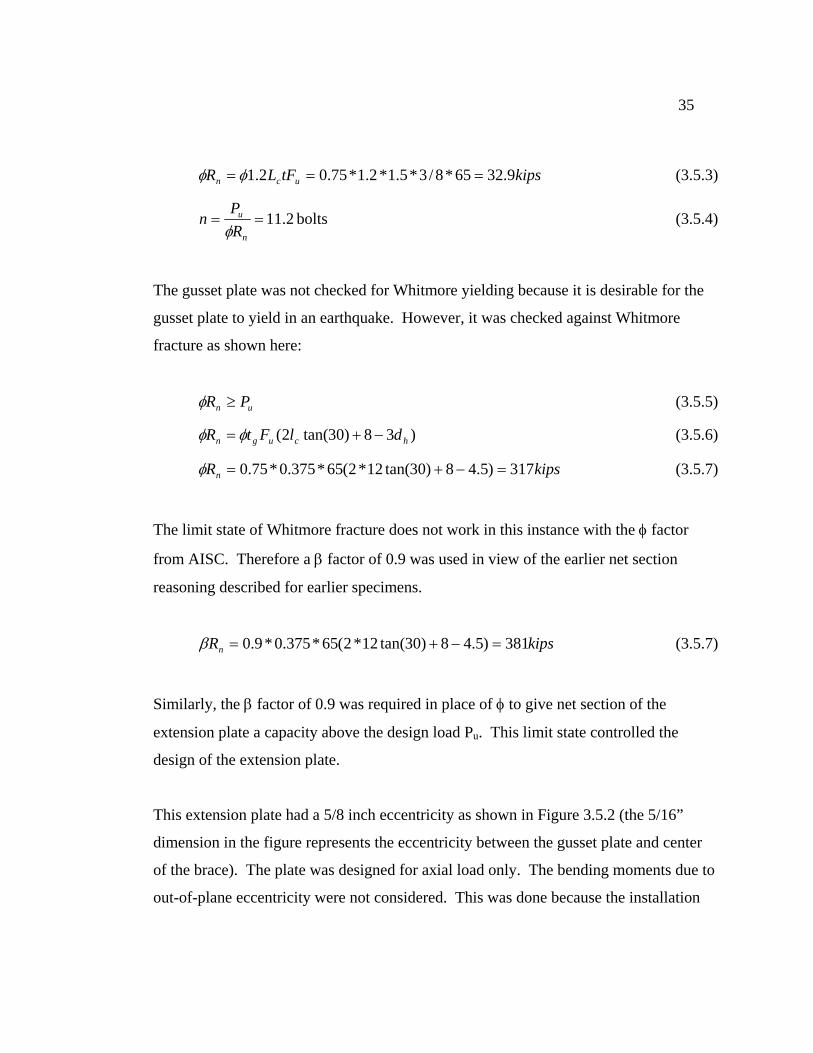
35
kipstFLR ucn 9.3265*8/3*5.1*2.1*75.02.1 === φφ (3.5.3)
2.11==n
u
RP
nφ
bolts (3.5.4)
The gusset plate was not checked for Whitmore yielding because it is desirable for the
gusset plate to yield in an earthquake. However, it was checked against Whitmore
fracture as shown here:
un PR ≥φ (3.5.5)
)38)30tan(2( hcugn dlFtR −+= φφ (3.5.6)
kipsRn 317)5.48)30tan(12*2(65*375.0*75.0 =−+=φ (3.5.7)
The limit state of Whitmore fracture does not work in this instance with the φ factor
from AISC. Therefore a β factor of 0.9 was used in view of the earlier net section
reasoning described for earlier specimens.
kipsRn 381)5.48)30tan(12*2(65*375.0*9.0 =−+=β (3.5.7)
Similarly, the β factor of 0.9 was required in place of φ to give net section of the
extension plate a capacity above the design load Pu. This limit state controlled the
design of the extension plate.
This extension plate had a 5/8 inch eccentricity as shown in Figure 3.5.2 (the 5/16”
dimension in the figure represents the eccentricity between the gusset plate and center
of the brace). The plate was designed for axial load only. The bending moments due to
out-of-plane eccentricity were not considered. This was done because the installation

36
and potential replacement of a brace with this eccentric plate is much easier than a
concentrically bolted connection, and all prior gussets handled large eccentricities (after
brace buckling) relatively well.
Figure 3.5.2 –Section of Connection Detail HSS-16
The clearance of the end of the brace more than met the 2t straight line clearance
required by the AISC Seismic Provisions. It should be noted however, that the
extension plate was very close to the beam-column intersection (see Figure 3.5.1).
3.6 HSS-17 – 3/8” Tapered Plate
Figure 3.6.1 shows the connection detail for specimen HSS-17. This specimen uses a
3/8 inch tapered gusset plate with 3/8 inch fillet welds connecting it to the framing
members. As previous research (Johnson 2005) recommended, the weld sized was
based on the design criterion that the weld should have a greater tensile capacity than
the gusset plate.
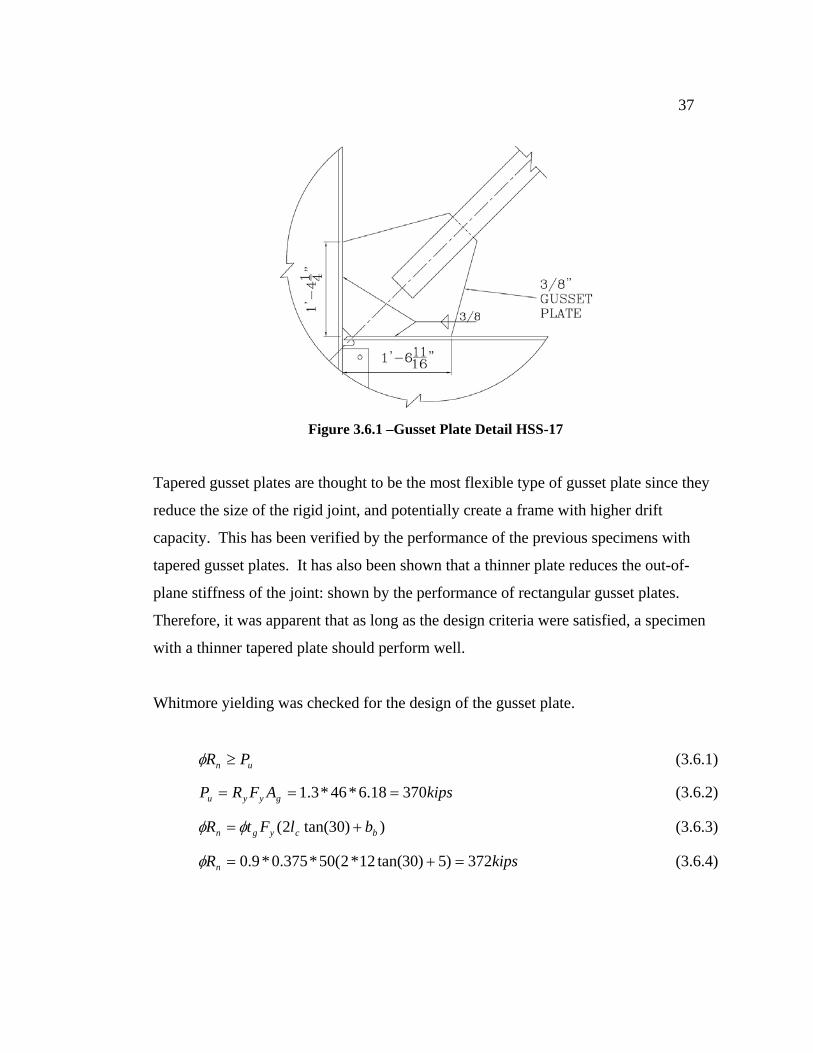
37
Figure 3.6.1 –Gusset Plate Detail HSS-17
Tapered gusset plates are thought to be the most flexible type of gusset plate since they
reduce the size of the rigid joint, and potentially create a frame with higher drift
capacity. This has been verified by the performance of the previous specimens with
tapered gusset plates. It has also been shown that a thinner plate reduces the out-of-
plane stiffness of the joint: shown by the performance of rectangular gusset plates.
Therefore, it was apparent that as long as the design criteria were satisfied, a specimen
with a thinner tapered plate should perform well.
Whitmore yielding was checked for the design of the gusset plate.
un PR ≥φ (3.6.1)
kipsAFRP gyyu 37018.6*46*3.1 === (3.6.2)
))30tan(2( bcygn blFtR += φφ (3.6.3)
kipsRn 372)5)30tan(12*2(50*375.0*9.0 =+=φ (3.6.4)

38
3.7 Material
The beams and columns were hot rolled sections of A992 steel. All plate material was
nominal A572 steel. The high strength steel tubes were A500B/C. All bolts were
A490, and all welds were made using 5/64 core shield 8 – E71T-8 flux core welds made
by pre-certified welders. The actual measured properties of the materials for these tests
are provided in Table 3.7.1. Properties for the braces and gusset plates were unable to
be attained.
Table 3.7.1 – Steel Properties from Material Tests

39
Chapter 4: Experiment Setup
4.0 Introduction
This chapter will discuss the experiment setup for the Special Concentrically Braced
Frame specimens tested in this research project. The original setup was designed by
Shawn Johnson and more detailed information can be found his thesis (Johnson 2005).
All of the specimens were laid horizontal, parallel to the lab floor. Quasi-static
displacement was applied to the specimen and observations were made to understand
how the steel specimens responded to applied drifts. Although there are certain
limitations within the laboratory, the experiment setup was designed to simulate an
actual building structure subjected to ground motion from an earthquake.
4.1 Test Components
For the specimen to experience large forces associated with an earthquake, test
components had to be designed to apply these forces to the specimen, and also to resist
the forces that resulted from the specimen response. An actuator (Section 4.4.1) applied
displacement to the structure through the load beam (Section 4.4.2) which was
connected to the north beam of the specimen. Axial load was applied to the columns to
simulate gravity loads through post-tensioned axial rods (Section 4.4.3). Large
compression forces existed in the framing members at different applied displacements
throughout the test. Therefore, to prevent the members from buckling globally, out-of-
plane restraints were applied to the specimen at certain locations (Section 4.4.4). The
lateral and gravity loads were resisted by a channel assembly which acted as the
boundary condition (Section 4.4.5). The channel assembly was connected to a concrete
strong wall which was connected to the concrete strong floor (Section 4.4.6).

40
The following figures show overall views of the test components. Figure 4.1.1 shows a
drawing with all the components used to test the specimens. Figure 4.1.2 shows the
dimensions of the test components. And Figure 4.1.3 shows a photograph of the
specimen in the testing position with the test components.
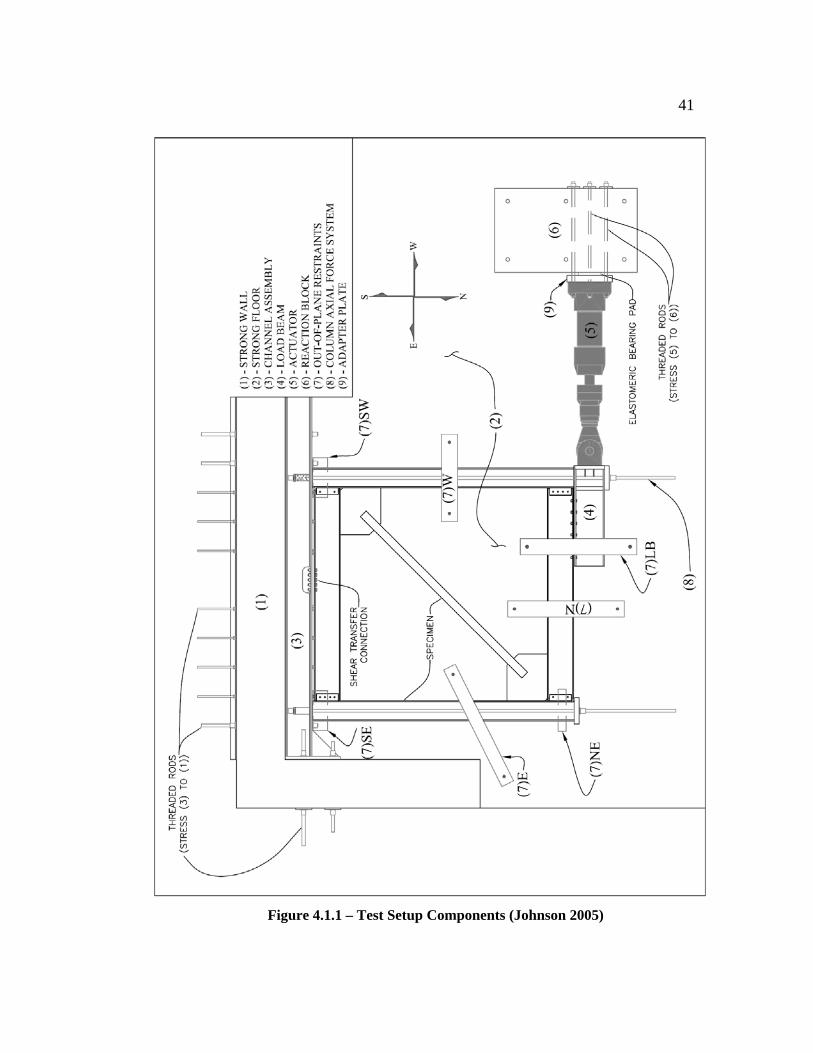
41
Figure 4.1.1 – Test Setup Components (Johnson 2005)

42
Figure 4.1.2 – Test Setup Dimensions (Johnson 2005)
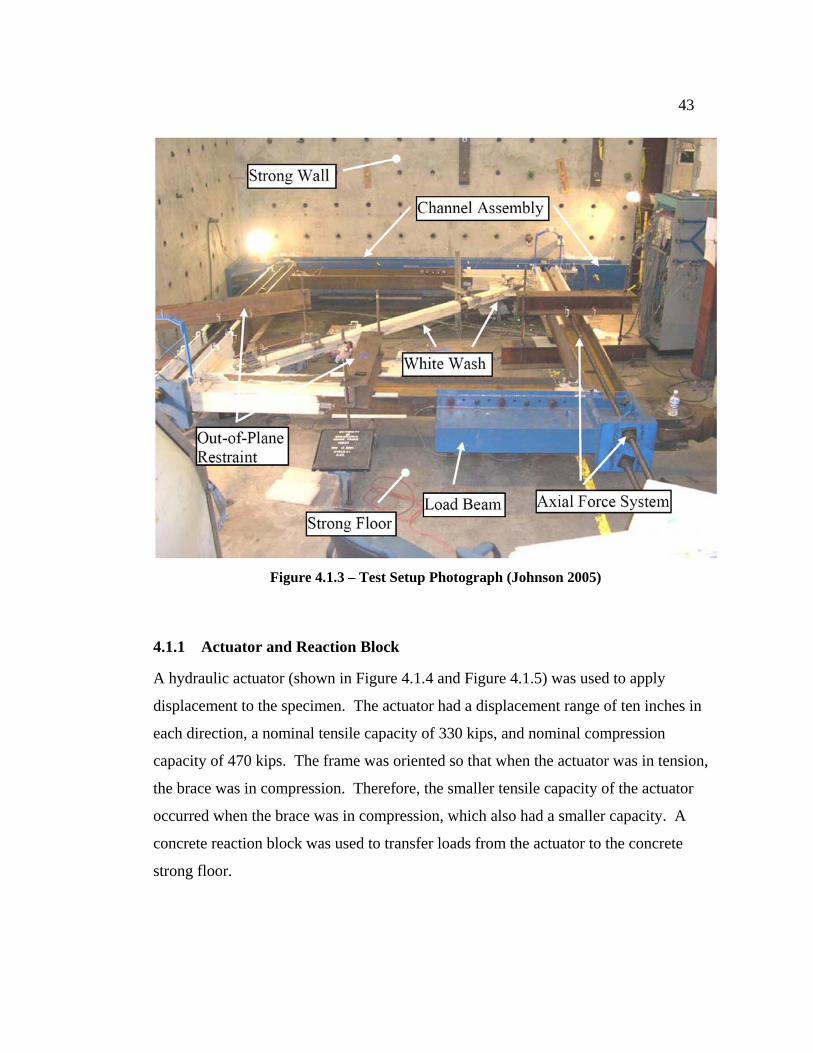
43
Figure 4.1.3 – Test Setup Photograph (Johnson 2005)
4.1.1 Actuator and Reaction Block
A hydraulic actuator (shown in Figure 4.1.4 and Figure 4.1.5) was used to apply
displacement to the specimen. The actuator had a displacement range of ten inches in
each direction, a nominal tensile capacity of 330 kips, and nominal compression
capacity of 470 kips. The frame was oriented so that when the actuator was in tension,
the brace was in compression. Therefore, the smaller tensile capacity of the actuator
occurred when the brace was in compression, which also had a smaller capacity. A
concrete reaction block was used to transfer loads from the actuator to the concrete
strong floor.

44
Figure 4.1.4 – Actuator and Reaction Block Photograph (Johnson 2005)
Figure 4.1.5 – Actuator and Reaction Block Assembly (Johnson 2005)
4.1.2 Load Beam
A steel W21x62 load beam was used to transfer loads from the actuator to the specimen
(Figure 4.1.6). The force from the load beam was transferred by 10 one inch diameter
A490 structural steel bolts which fastened the load beam flange to the north beam
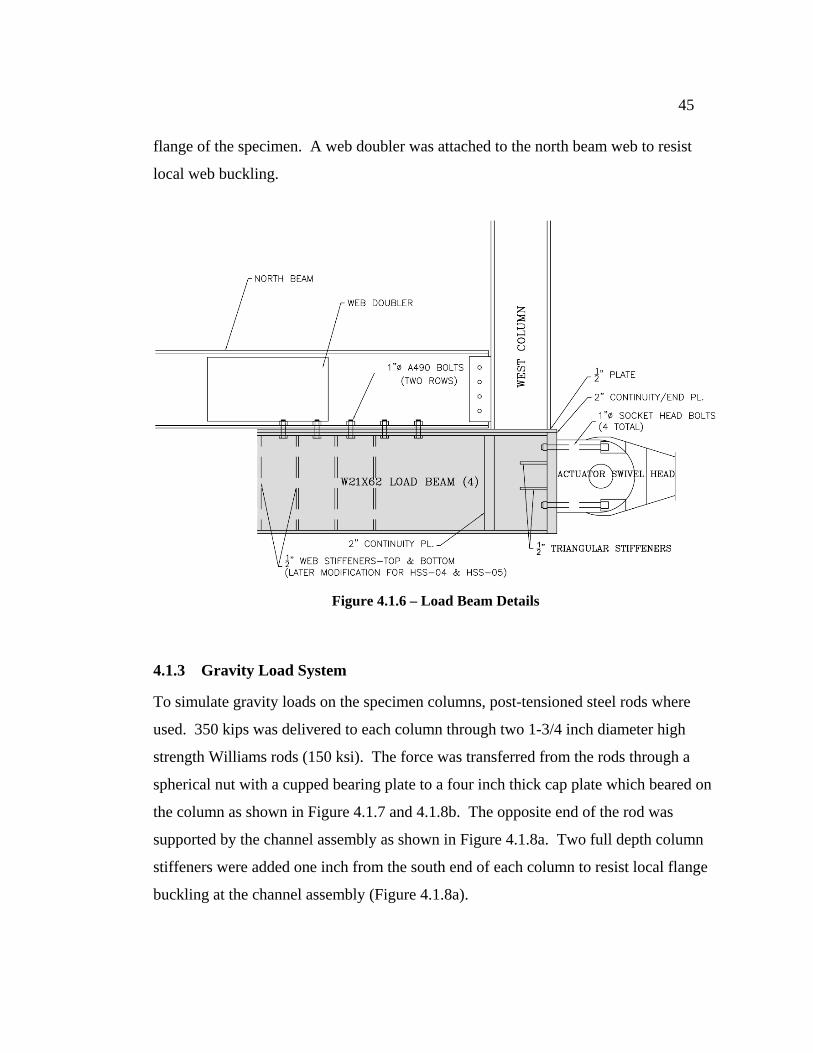
45
flange of the specimen. A web doubler was attached to the north beam web to resist
local web buckling.
Figure 4.1.6 – Load Beam Details
4.1.3 Gravity Load System
To simulate gravity loads on the specimen columns, post-tensioned steel rods where
used. 350 kips was delivered to each column through two 1-3/4 inch diameter high
strength Williams rods (150 ksi). The force was transferred from the rods through a
spherical nut with a cupped bearing plate to a four inch thick cap plate which beared on
the column as shown in Figure 4.1.7 and 4.1.8b. The opposite end of the rod was
supported by the channel assembly as shown in Figure 4.1.8a. Two full depth column
stiffeners were added one inch from the south end of each column to resist local flange
buckling at the channel assembly (Figure 4.1.8a).
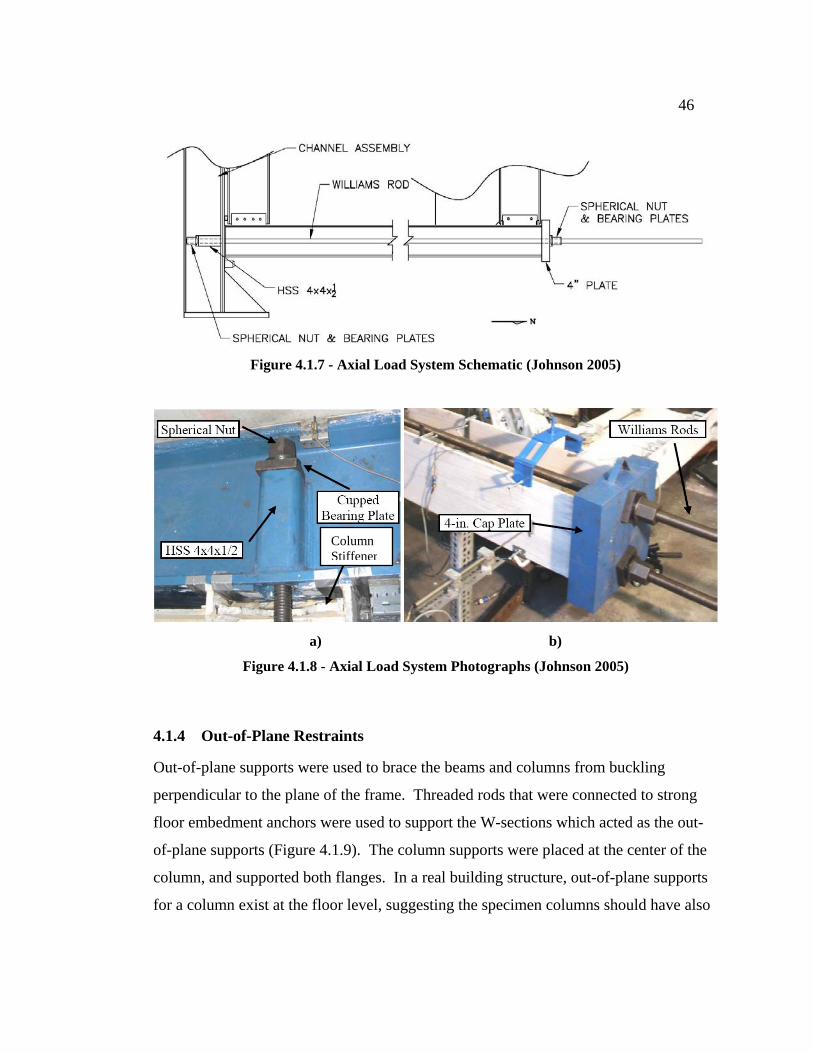
46
Figure 4.1.7 - Axial Load System Schematic (Johnson 2005)
a) b)
Figure 4.1.8 - Axial Load System Photographs (Johnson 2005)
4.1.4 Out-of-Plane Restraints
Out-of-plane supports were used to brace the beams and columns from buckling
perpendicular to the plane of the frame. Threaded rods that were connected to strong
floor embedment anchors were used to support the W-sections which acted as the out-
of-plane supports (Figure 4.1.9). The column supports were placed at the center of the
column, and supported both flanges. In a real building structure, out-of-plane supports
for a column exist at the floor level, suggesting the specimen columns should have also
Column Stiffener

47
been supported at this location. However, the out-of-plane supports accomplished
similar results as a real building structure by resisting global member buckling.
The two different out-of-plane restraint conditions for the specimen beams simulated
two different potential conditions in a real building structure. The north beam had both
flanges supported by the out-of-plane restraint. Significantly, the out-of-plane restraint
supported the flange that was connected to the gusset plate. This can be compared to a
condition in a building at the bottom of a one story brace where the slab braces the
beam flange that is connected to the gusset plate. These conditions are similar because
in both situations, the beam flange that is connected to the gusset plate is restrained
from out-of-plane motion: by the support in the experiment, and by the slab in a
building. The south beam was only braced from out-of-plane motion at the flange that
was opposite the gusset plate connection. This is similar to a condition in a building at
the top of a one story brace where nothing necessarily braces the bottom flange that is
connected to the gusset plate (although sometimes a perpendicular beam may be
designed to brace this flange).
Figure 4.1.9 – Out of Plane Restraints (Johnson 2005)

48
It was important that the out-of-plane supports did not resist any in-plane forces so that
accurate measurements of the load resistance of the frame were recorded. To ensure of
this, nylon cylinders were attached to the frame, and stainless steel plates were attached
to the out-of-plane supports. The interface between the stainless steel and the nylon
were then lubricated with silicon insulation gel to provide minimal shear transfer.
Figure 4.1.10 shows a photograph of this condition.
Figure 4.1.10 – Out of Plane Restraints (Johnson 2005)
4.1.5 Boundary Conditions
A channel assembly was used to resist loads applied by the specimen during the test.
The channel assembly was made up of two C15X50 channels between two steel plates
as shown in Figure 4.1.11. The assembly supported the lateral force in the south beam
of the frame with 10 one inch diameter A490 structural steel bolts which were fastened
to a 1-1/2 inch thick shear transfer plate that was welded to the assembly as shown in
Figure 4.1.12.

49
When the columns were in compression, the channel assembly supported the column
load through bearing at the end of the column. However, when this compression was
reduced to zero, the column lifted off the assembly. If this were to occur in a real
building structure, the axial load in the column would be in tension. Since there was
nothing at this connection to resist tension, the load was transferred into the axial rod at
the north end of the column which then carried the load down to the channel assembly
where it was restrained (see Figure 4.1.8).
Figure 4.1.11 - Channel Assembly Cross-Section (Johnson)
Figure 4.1.12 - Shear Transfer Connection (Johnson)

50
4.1.6 Strong Wall and Strong Floor
The strong floor supported the strong wall, and the strong wall supported the channel
assembly. The strong wall was a 2-1/2 foot thick concrete wall that was prestressed
with embedded conduits spaced at 18 inches on center. The strong floor was a four foot
thick concrete slab to support the loads from the strong wall. The floor had open
conduits with threaded anchors embedded at the bottom of the floor at three feet on
center. These anchors accepted the threaded rods which supported the out-of-plane
restraints.
4.2 Loading Protocol
The loading protocol was guided by the ATC-24 protocol (ATC) and the SAC Steel
Project and was based on the interstory drift angle of the frame at the onset of first
yielding or buckling, yθ , as illustrated in Figure 4.2.1. The controlling parameter, yθ ,
was estimated from the yield displacement obtained from an idealized computer
analysis. Upon completing of the first tests, the loading protocol was revised based on
the recorded drift level at which initial buckling occurred. The value of yθ was
determined to be 0.625 inches. Finally, as recommended in ATC, the load cycles were
run as follows:
For: yθθ 0.10 <≤ 60 second cycles
For: yy θθθ 0.20.1 <≤ 80 second cycles
For: yy θθθ 0.40.2 <≤ 120 second cycles
For: yθθ 0.4≤ 160 second cycles
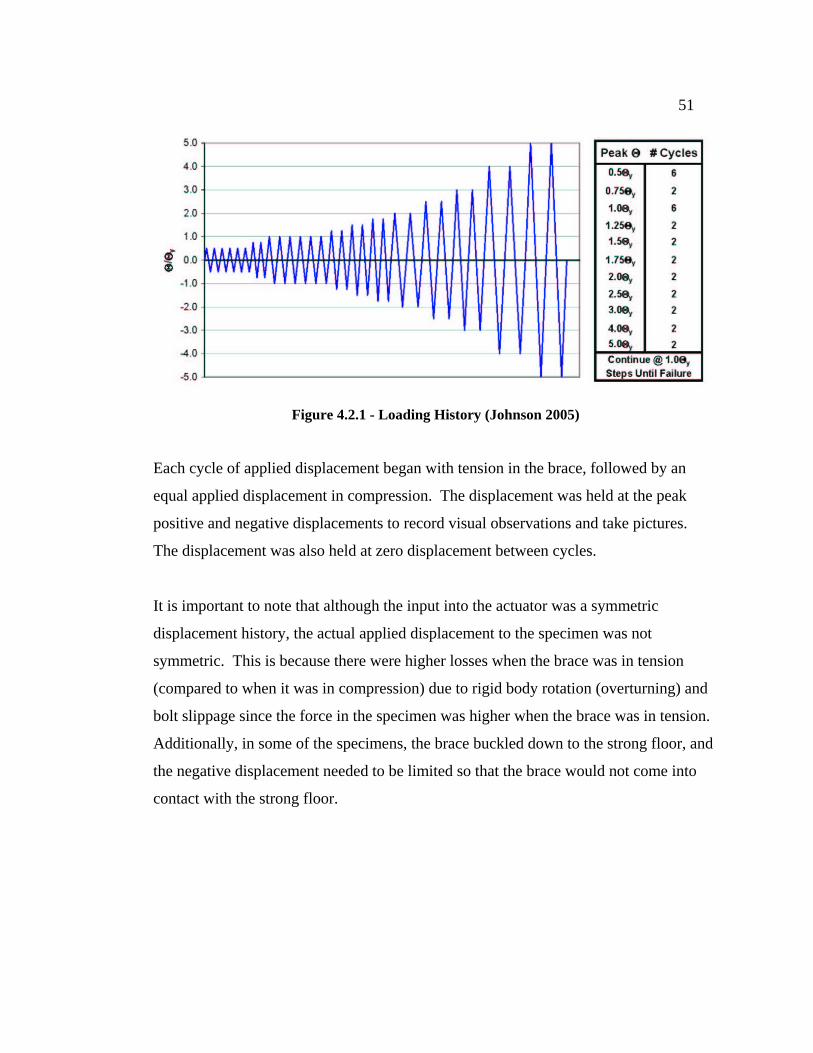
51
Figure 4.2.1 - Loading History (Johnson 2005)
Each cycle of applied displacement began with tension in the brace, followed by an
equal applied displacement in compression. The displacement was held at the peak
positive and negative displacements to record visual observations and take pictures.
The displacement was also held at zero displacement between cycles.
It is important to note that although the input into the actuator was a symmetric
displacement history, the actual applied displacement to the specimen was not
symmetric. This is because there were higher losses when the brace was in tension
(compared to when it was in compression) due to rigid body rotation (overturning) and
bolt slippage since the force in the specimen was higher when the brace was in tension.
Additionally, in some of the specimens, the brace buckled down to the strong floor, and
the negative displacement needed to be limited so that the brace would not come into
contact with the strong floor.

52
4.3 Instrumentation
Potentiometers, strain gauges, whitewash, cameras, video cameras, and the actuator
load cell were used to determine the response of the loaded specimens. The following
section will discuss details of this instrumentation.
4.3.1 Strain Gauges
Strain gauges were applied to the specimen to determine the strain at the applied
location. Pairs of gauges were located on opposite sides of the brace, beams and
columns, equidistant from the end of the member. From the strains measured by the
gauges, axial force and moment in each member was calculated as shown in Appendix
D. The strain gauges utilized in these experiments were FLA-6-11-5L manufactured by
Tokyo Sokki Kenkyuho Co. Ltd. The gauges had a nominal gauge factor of 2.12 and a
6 mm gauge length.
All of the gauges stopped measuring strain accurately when the steel that the gauge was
attached to, yielded. Additionally, a few of the gauges did not function during the entire
length of the test. Figure 4.3.1 shows the locations of the strain gauges, and Table 4.3.1
shows the values of the dimensions in the figure for each test.

53
Figure 4.3.1 – Strain Gauge Diagram
Table 4.3.1 – Dimensions for Figure 4.3.1

54
4.3.2 Potentiometers
Potentiometers (pots) were used to calculate displacements of the frame. Typically,
pots were connected to a relative stationary point (i.e. the ground, load beam or support
beam) and measured frame displacement relative to the stationary point. BEI Duncan
model 600 and 9600 pots were used to measure in-plane translation of the frame
(including overall deflection, slip, and uplift), rotation of beams and columns, and out-
of-plane displacement (i.e. at the south west gusset plate and the beam-column
intersections). UniMeasure model P510 string potentiometers were used to measure
displacements larger than five inches. Figure 4.3.2 shows pot locations on the frame,
and Table 4.3.2 designates which type of pot was used for each location. Figure 4.3.3
shows a detailed view of the pots used at the northeast gusset plate, and Table 4.3.3
shows the values for the dimensions in this figure.
Pots 53 and 54 (as shown in Figure 4.3.2) measured the out-of-plane displacement of
the brace. These string pots were connected to a pin that was screwed into a small
drilled hole at the bottom of the brace.

55
Figure 4.3.2 – Potentiometer Diagram
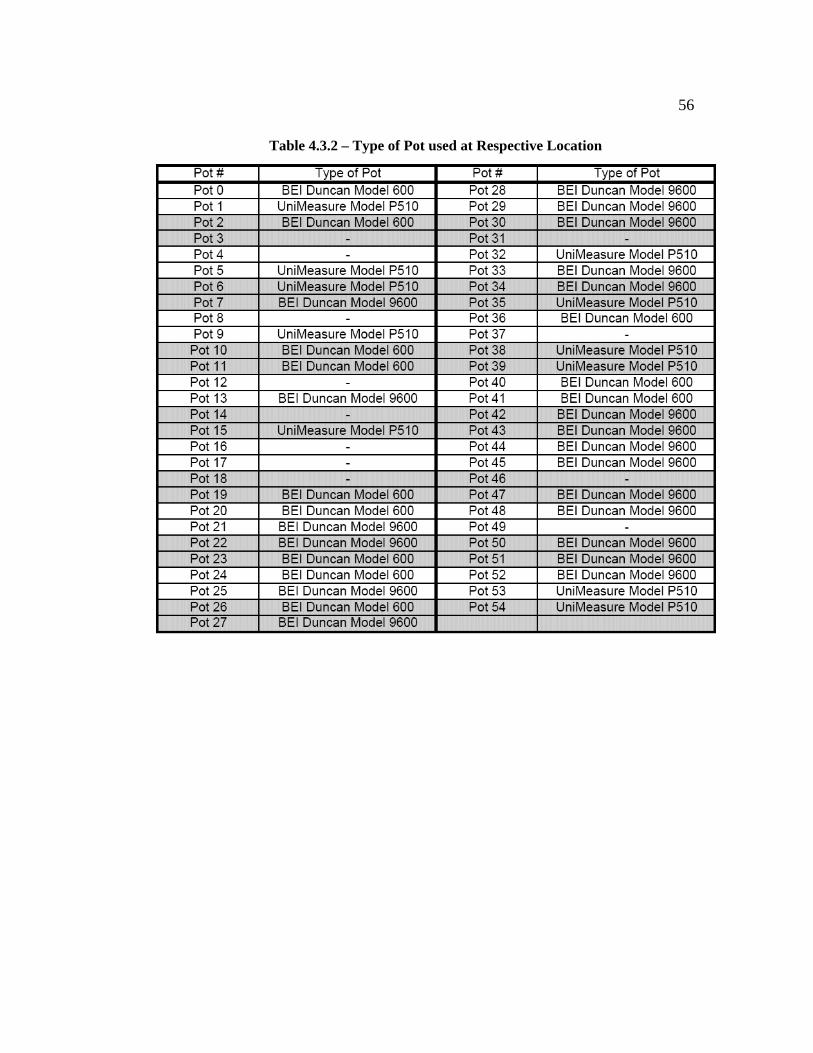
56
Table 4.3.2 – Type of Pot used at Respective Location
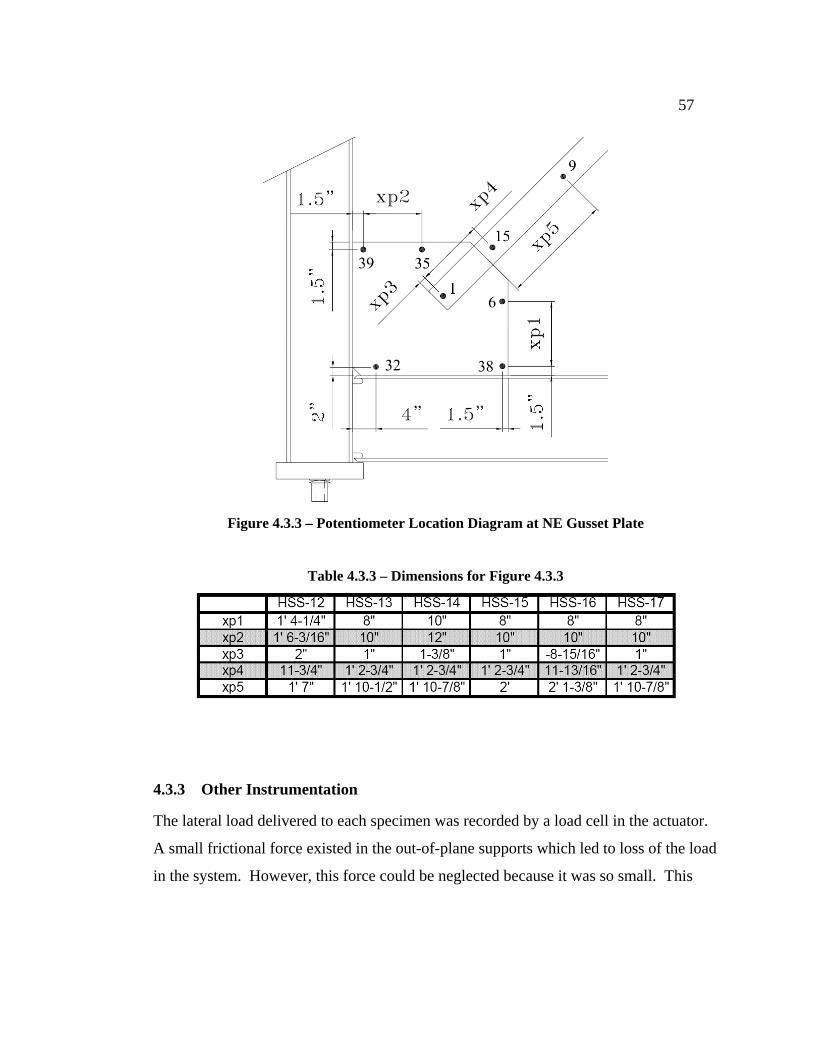
57
Figure 4.3.3 – Potentiometer Location Diagram at NE Gusset Plate
Table 4.3.3 – Dimensions for Figure 4.3.3
4.3.3 Other Instrumentation
The lateral load delivered to each specimen was recorded by a load cell in the actuator.
A small frictional force existed in the out-of-plane supports which led to loss of the load
in the system. However, this force could be neglected because it was so small. This

58
was known because there were no vertical drops in resistance at reversals on the
specimen hysteretic curves (Chapter 5).
The whitewash, a mixture of three parts DAP Plaster of Paris Dry Mix and one part
water, was applied to the hot rolled steel sections of the specimen to show where
yielding occurred. The whitewash bonded to the steel’s mill scale, and when the steel
yielded, the mill scale debonded from the steel, carrying the whitewash with it.
Whitewash was able to help determine yielding in the beams, columns, and gusset
plates.
Because the brace was cold formed, mill scale did not exist on the brace. Therefore,
whitewash was unable to help identify yielding in the brace.
Photographs were taken when the actuator was stopped at maximum displacements
wherever damage to the frame was evident. A digital video camera was also used to
document the response of the specimen. The camera was positioned on top of the
strong wall so that the entire test frame could be captured. The camera was turned on
once buckling and yielding in the frame was noticed.
4.4 Data Acquisition System
LabVIEW Version 7.1 on a Windows based personal computer system was used to
control the data acquisition system. LabVIEW was used to scan data channels and
convert readings to appropriate physical quantities before being recorded to the data
file. Measurements of voltage from potentiometers were converted to units of inches
using the potentiometer calibration factors. Strain gauge resistance was converted to
units of micro-strains using a built in function of LabVIEW. Data from the strain
gauges and pots was received every half second during the test by the data acquisition
system.
59
4.5 Testing Preparation
Structural steel shapes were delivered to the laboratory, and the specimen members
were fabricated in the lab. The frame was transported to the strong floor using existing
cranes in the laboratory. The frame was then leveled and placed accurately along the
channel assembly. A steel plate template that was used to drill the bolt holes in the
channel assembly was used again to drill the bolt holes in the south beam for each
specimen to ensure the alignment of bolt holes. A similar process was used to drill the
holes in the north beam. The frame was then bolted to the channel assembly and the
load beam. Steel shims were added where gaps existed in the fit up. Strain gauges,
potentiometers, and out-of-plane supports were then added to the specimen, and
whitewash was applied. The final step was to apply the gravity load to the columns.

60
Chapter 5: Experimental Results
5.0 Introduction
This chapter analyzes the results of experiments HSS-12 through HSS-17. These
experiments are a continuation of similar tests HSS-01 to HSS-11 previously carried out
by Shawn Johnson (2005) and Dave Herman (2007). All of the specimens were tested
in the structural lab of UW and used the same support and loading apparatus to apply
displacements to the specimen as the earlier specimens. A list of all tests up until this
point is shown in Table 5.0.1 with the study parameters in bold.
This chapter will describe each test in a different section and first discuss why the
specimen was tested. Each section will describe the damage that occurred and the loads
and drift ratios at which the damage occurred. Each section will also discuss the
maximum and minimum drift ratios for that specimen and loads that the frame resisted
(the specified load is the actuator force unless otherwise noted). At the end of each
section, a summary of each specimen, which highlights the important characteristics of
the experiment, is provided. The specimens described in this chapter and the study
parameters include:
4. HSS-12 – 2t straight line clearance requirement with a ½” gusset plate using CJP
welds connecting the gusset plate to the framing members.
5. HSS-13 – 6t elliptical clearance requirement with a ½” tapered gusset plate using
complete joint penetration welds connecting the gusset plate to the framing
members.

61
6. HSS-14 – 6t elliptical clearance requirement with 3/8” rectangular gusset plate
without using net section reinforcement to the brace and 7/16” fillet welds joining
the plate to the beam and column.
7. HSS-15 – 6t elliptical clearance with a reduced splice length for the brace to gusset
plate connection, no net section reinforcement for the tube, and 7/16” fillet welds
joining the plate to the beam and column.
8. HSS-16 – Bolted brace connection which has an extension plate bolted to the gusset
plate, with the extension plate welded to the brace.
9. HSS-17 – 6t elliptical clearance requirement with a 3/8” tapered gusset plate using
3/8” fillet welds connecting the gusset plate to the framing members.

62
Table 5.0.1 – Summary of Specimens
5.1 Yield Mechanisms and Failure Modes
This section describes the yield mechanisms and failure modes noted in these
experiments. Table 5.1.1 lists and defines these modes and mechanisms and provides
identifying symbols used for each behavior level in this research.
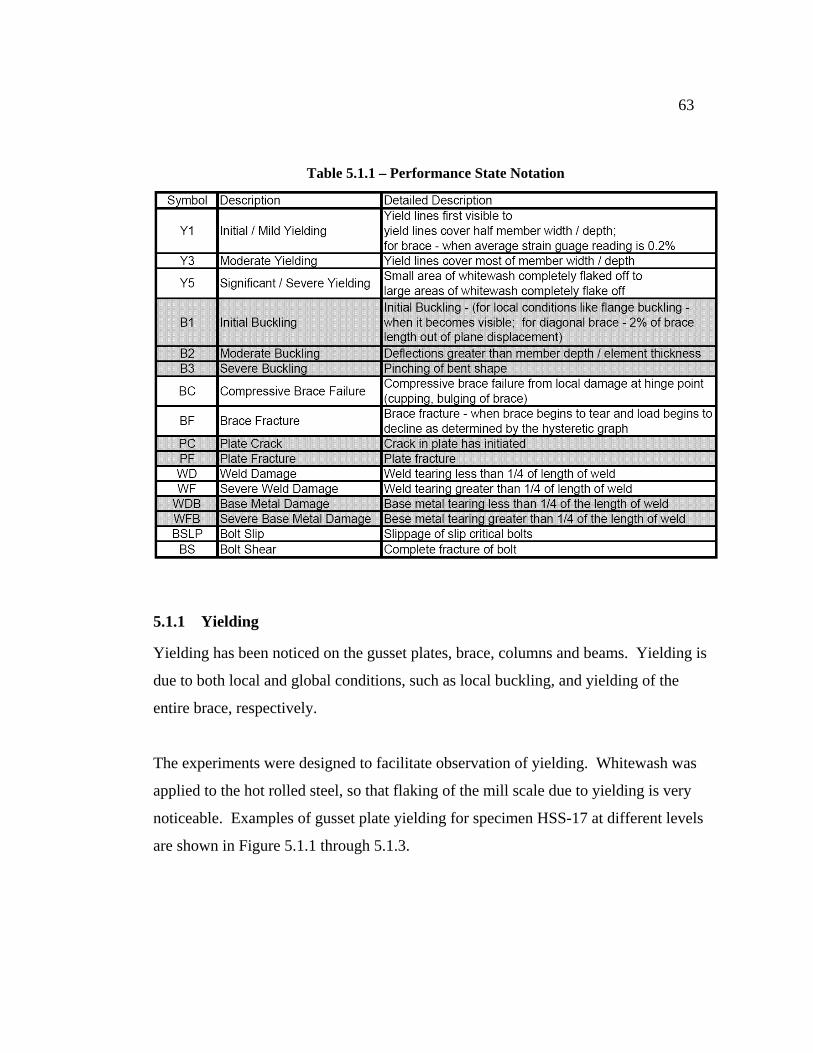
63
Table 5.1.1 – Performance State Notation
5.1.1 Yielding
Yielding has been noticed on the gusset plates, brace, columns and beams. Yielding is
due to both local and global conditions, such as local buckling, and yielding of the
entire brace, respectively.
The experiments were designed to facilitate observation of yielding. Whitewash was
applied to the hot rolled steel, so that flaking of the mill scale due to yielding is very
noticeable. Examples of gusset plate yielding for specimen HSS-17 at different levels
are shown in Figure 5.1.1 through 5.1.3.

64
Yielding of the gusset plates is of particular interest to the experiment. When the gusset
plate yields in tension (Y1), it develops yield lines on the plate that are parallel to the
beam and column and typically start to form where the brace stops (Figure 5.1.1).
Moderate yielding, Y3, of the gusset plate is defined to have occurred when the yield
lines are greater than half the width of the gusset plate as shown in Figure 5.1.2. When
the brace buckles, the gusset plate starts to hinge, and hinge lines form in the same
location on the gusset plate but are perpendicular to the brace.
Figure 5.1.1 – Initial/Mild Gusset Plate Yielding (Y1) for HSS-17
Length of
yield lines

65
Figure 5.1.2 – Moderate Gusset Plate Yielding (Y3) for HSS-17
Figure 5.1.3 – Significant Gusset Plate Yielding (Y5) for HSS-17
Yielding is also recorded through analysis of the strain gauge and potentiometer data.
Typically, strain gauges will stop working accurately when yielding occurs. However,
it can be inferred that yielding has occurred at a location when the stain gauge reads an
assumed yield strain of 0.2%. This assumed yield strain is based on the ratio Fy/E. It is
used only for calculating when yielding of the brace occurs in tension and uni-axial
stress is assumed. Similarly, potentiometers will measure a displacement and through
Length of
yield lines

66
analysis, it can be determined when a member yields by calculating when the member
length has increased by 0.2%.
5.1.2 Brace Buckling
Brace buckling is a primary yield mechanism of the system, and Figure 5.1.4 shows the
progression of this behavior. The drift values shown in the figure are for HSS-17, and
while all of the tests (except HSS-16) experienced this type of behavior, the values of
drift at which the frame experiences these displacements varied for each test. Stages
B1, B2 and BC are specifically noted in this figure. B1 is defined as initial buckling
and is noted when the brace deflects 2% of its original length out of plane. B2 is noted
when the brace deflects five inches (equal to its depth) out of plane. BC is the damage
state where localization of buckling damage occurs as illustrated in Figures 5.1.4e and
5.1.4f. B3 is not defined as a performance state for the brace (it is only used for plates
and local buckling of elements of framing members such as webs and flanges).
a) -0.55% Drift (B1) b) -0.63% Drift (B2)

67
c) -1.14% Drift d) -1.84% Drift
e) -2.79% Drift (BC) f) -2.79% Drift (BC)
Figure 5.1.4 – Example of Brace Buckling Progression (HSS-17)
5.1.3 Plate Buckling and Local Buckling
Stages B1, B2 and B3 are used to define buckling of elements such as flanges, webs and
plates. B1 for local conditions is noted when the element has visibly moved out of its
plane. An example of B1 is shown in Figure 5.1.5. B2 for local conditions is said to
have occurred when the buckled displacement is greater than the thickness of the
element, similar to B2 for brace buckling.
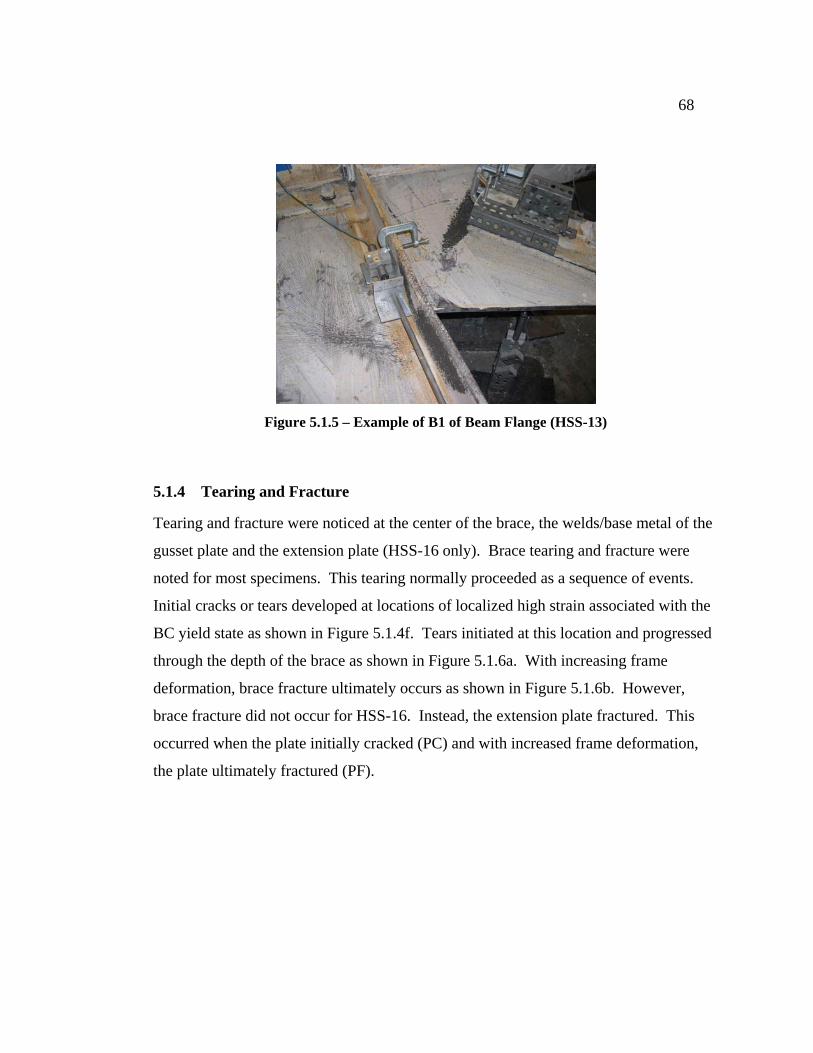
68
Figure 5.1.5 – Example of B1 of Beam Flange (HSS-13)
5.1.4 Tearing and Fracture
Tearing and fracture were noticed at the center of the brace, the welds/base metal of the
gusset plate and the extension plate (HSS-16 only). Brace tearing and fracture were
noted for most specimens. This tearing normally proceeded as a sequence of events.
Initial cracks or tears developed at locations of localized high strain associated with the
BC yield state as shown in Figure 5.1.4f. Tears initiated at this location and progressed
through the depth of the brace as shown in Figure 5.1.6a. With increasing frame
deformation, brace fracture ultimately occurs as shown in Figure 5.1.6b. However,
brace fracture did not occur for HSS-16. Instead, the extension plate fractured. This
occurred when the plate initially cracked (PC) and with increased frame deformation,
the plate ultimately fractured (PF).

69
a) b)
Figure 5.1.6 – Example of Tearing and Fracture of the Brace (BF)
Crack initiation and growth was also commonly noted in the base metal or welds
joining the gusset plate to the beam or column. In tests HSS-15 to HSS-17, it was more
common to see the crack in the base metal at the welds, but in earlier tests it was more
common to see the crack in the weld itself. This probably is due to the fact that a
different welder was used in the later specimens. Initial weld cracking was defined as
visible cracking of one half inch length (WD). Severe weld cracking was defined as
when more than one quarter of the length was torn (WF). An example of damage to the
base metal (WDB) is shown in Figure 5.1.7. When the damage to the base metal was
greater than one quarter of the length of the weld, is was defined as severe base metal
cracking (WFB).
5.1.5 Loss of Resistance at Bolted Connections
Bolted connections were used in the NW and SE connection of the specimen, and
HSS-16 used a bolted connection between the brace and the gusset plate. Although the
bolted brace-to-gusset connection was designed to resist slipping, the bolts did slip
throughout the test and is denoted by BSLP. None of the bolts fractured (BS) during
the experiments in this set of tests.

70
Figure 5.1.7 – Example of Damage to the Base Metal (WDB)
5.2 Nomenclature of Specimen and Specimen Response
Summary tables of yield and damage states are provided at the beginning of each test
description. These tables summarize the damage incurred to the frame under
consideration. In order to reduce the amount of text for the tables in this chapter,
certain abbreviations have been made to identify locations on the frame. Figure 5.2.1
and 5.2.2 show details of the frame and what the abbreviations are for these locations.

71
Figure 5.2.1 - SCBF Component Notation (Johnson 2005)
Figure 5.2.2 - SCBF Component Notation Profile (Johnson 2005)
Occasionally, the location may require more definition. For example, the abbreviation
for the west side of the south beam, SWB, may not be enough information if only the
web is being referred to. In this case, a W is added for the web, and an F is added for
the flange. The SW beam web would be denoted SWBW.
72
The gusset plates are attached to the beam and column of the frame using welds. These
welds are referred to as gusset plate welds in the text.
For describing the test results, each test is divided into three sections, the initial drift
range, the moderate drift range, and the severe drift range. These ranges are based on
the range of the drift ratio that the frame has experienced. This drift range is effectively
the difference between the maximum tensile drift of the frame and the minimum
compressive drift. The initial drift range has a drift ratio range from zero to 1.25%.
The moderate drift range has a drift ratio range from 1.25% to 2.75%. The severe drift
range has a drift ratio range above 2.75%. This drift ratio range is also referred to as
Max/Min Range in the discussion that follows. The Max/Min Range is referred to in
the peak results tables at the beginning of each chapter, and in the section headings
which denote which range is being discussed.
In each specimen that experienced weld or base metal cracking, a summary of the
length and type of crack is summarized in a table. In the table, ‘W’ denotes that the
weld cracked as opposed to the base metal (denoted by ‘BM’). And ‘T’ denotes that the
crack occurred in the top weld as opposed to the bottom weld (denoted by “B”).
The out-of-plane stiffness of the gusset plate is often referred to throughout this thesis.
This stiffness refers to the rotational stiffness of the gusset plate in which the direction
is defined with a vector that is normal to the axis of the brace, in the plane of the frame.
This rotational stiffness is talked about when the brace buckles and the gusset plate
bends from its initial shape in the plane of the frame and into the “out-of-plane”
direction.

73
5.3 HSS-12 – Reference Specimen with CJP Welds
5.3.1 Specimen Overview
AISC Seismic Provisions and the uniform force method were used to design the gusset
plate for this specimen. HSS-01 was designed by current design practice, and failed by
sudden weld fracture. This specimen is similar to HSS-01 except that complete joint
penetration welds were used to examine their effect on connection performance.
HSS-12 ultimately failed through brace fracture. The gusset plate welds did not initiate
cracking. The maximum load was 373 kips and the minimum load was -180 kips. The
displacement ranged from -2.1% to 1.4% (includes only the completed cycles). Table
5.3.1 shows the performance states noted during the experiment and the story drift at
which they were noted. Figure 5.3.1 shows the lateral force-story drift hysteretic curve,
for the test.
Table 5.3.1 - HSS-12 Peak Results
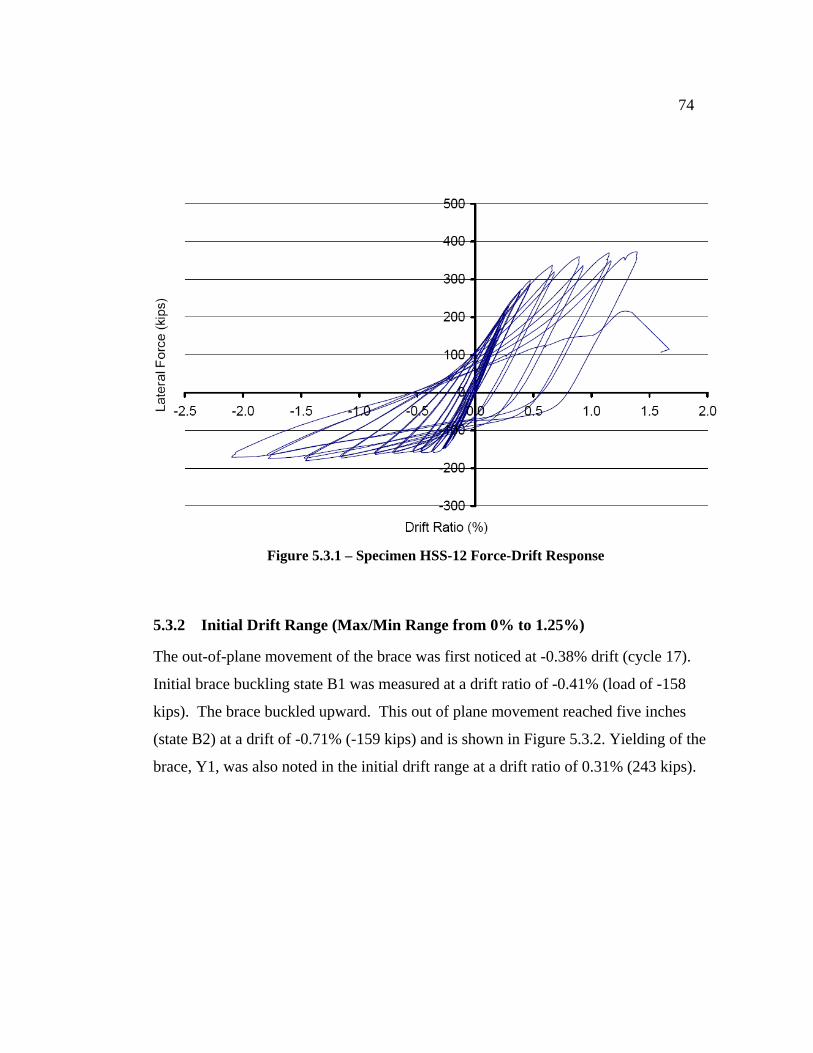
74
Figure 5.3.1 – Specimen HSS-12 Force-Drift Response
5.3.2 Initial Drift Range (Max/Min Range from 0% to 1.25%)
The out-of-plane movement of the brace was first noticed at -0.38% drift (cycle 17).
Initial brace buckling state B1 was measured at a drift ratio of -0.41% (load of -158
kips). The brace buckled upward. This out of plane movement reached five inches
(state B2) at a drift of -0.71% (-159 kips) and is shown in Figure 5.3.2. Yielding of the
brace, Y1, was also noted in the initial drift range at a drift ratio of 0.31% (243 kips).

75
Figure 5.3.2 – B2 Buckling of brace (-0.71% Drift)
At 0.26% drift, a small amount of yielding (Y1) occurred in the NE gusset plate (Figure
5.3.3) as shown by diagonal (relative to the longitudinal direction of the brace) yield
lines. These yield lines extended from the end of the brace when the brace was in
tension.
Figure 5.3.3 – Yield Lines on NE Gusset Plate (0.26% Drift)

76
Yielding in the SW gusset plate was not as noticeable as in the NE gusset. The support
conditions are slightly different at these two corners of the specimen as described in
Chapter 4.
5.3.3 Moderate Drift Range (Max/Min Range from 1.25% to 2.75%)
Yielding of the beam web at 0.48% drift is shown in Figure 5.3.4. Yielding has also
spread to other regions during this drift range. Locations experiencing Y1 include: 1)
the NE column at the inside flange (Figure 5.3.5), 2) both beams at a drift ratio of
-0.87% and 3) the SW column at a drift ratio of -1.47%.
Figure 5.3.4 – Yield Lines in Beam Web (0.48% Drift)
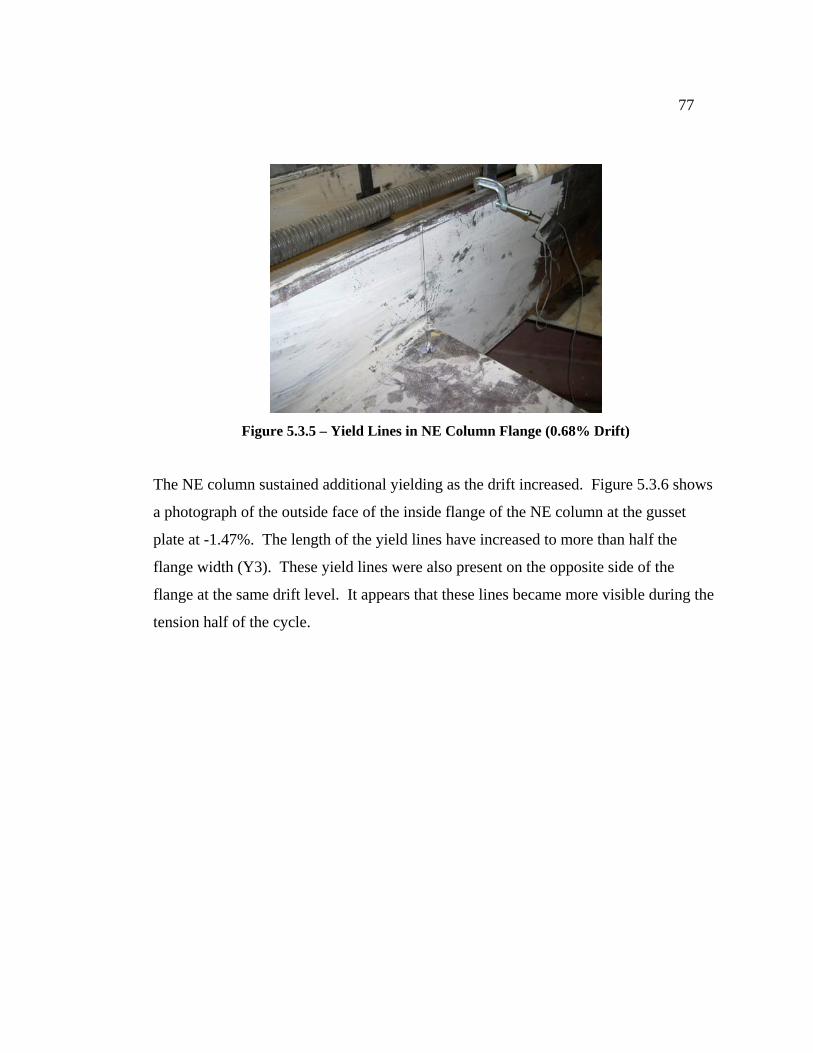
77
Figure 5.3.5 – Yield Lines in NE Column Flange (0.68% Drift)
The NE column sustained additional yielding as the drift increased. Figure 5.3.6 shows
a photograph of the outside face of the inside flange of the NE column at the gusset
plate at -1.47%. The length of the yield lines have increased to more than half the
flange width (Y3). These yield lines were also present on the opposite side of the
flange at the same drift level. It appears that these lines became more visible during the
tension half of the cycle.

78
Figure 5.3.6 – Y3 at NE column next to gusset plate (-1.47% Drift)
The NE gusset plate started to develop hinge lines (yield lines perpendicular to the axis
of the brace) at a drift range of -1.47% shown in Figure 5.3.7. However, the SW gusset
plate did not develop these yield lines until later.
Figure 5.3.7 – Hinge Lines in NE Gusset (-1.47% Drift)
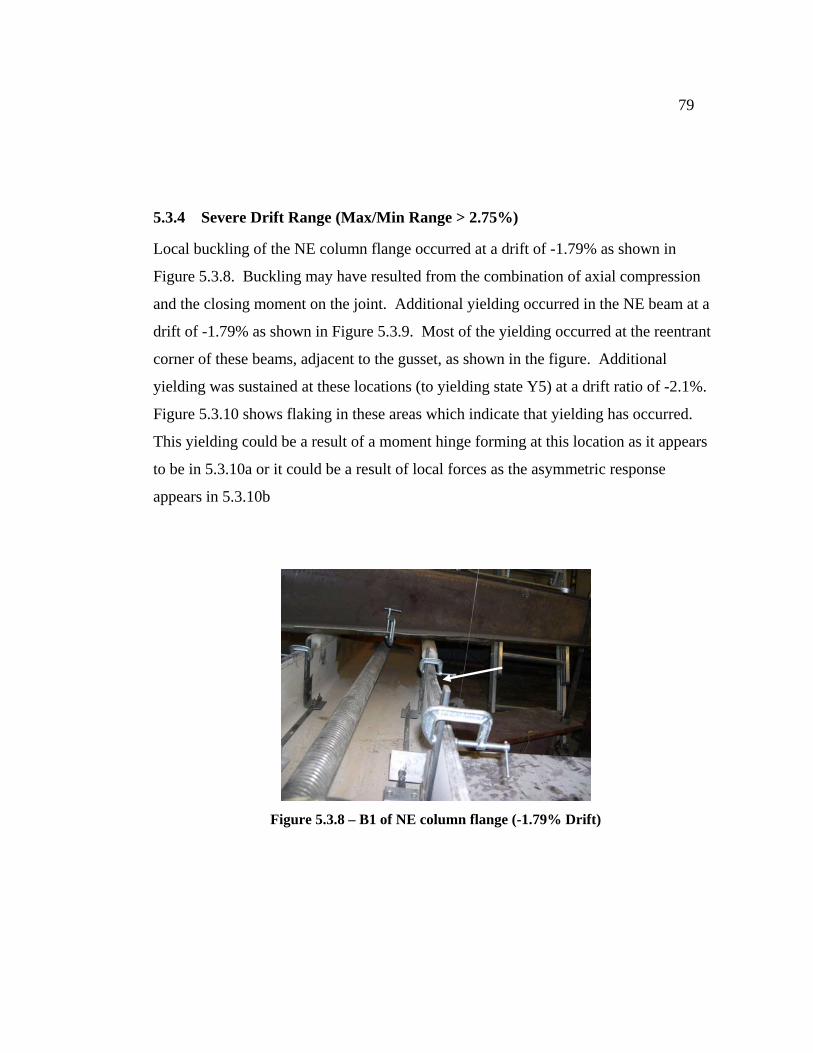
79
5.3.4 Severe Drift Range (Max/Min Range > 2.75%)
Local buckling of the NE column flange occurred at a drift of -1.79% as shown in
Figure 5.3.8. Buckling may have resulted from the combination of axial compression
and the closing moment on the joint. Additional yielding occurred in the NE beam at a
drift of -1.79% as shown in Figure 5.3.9. Most of the yielding occurred at the reentrant
corner of these beams, adjacent to the gusset, as shown in the figure. Additional
yielding was sustained at these locations (to yielding state Y5) at a drift ratio of -2.1%.
Figure 5.3.10 shows flaking in these areas which indicate that yielding has occurred.
This yielding could be a result of a moment hinge forming at this location as it appears
to be in 5.3.10a or it could be a result of local forces as the asymmetric response
appears in 5.3.10b
Figure 5.3.8 – B1 of NE column flange (-1.79% Drift)
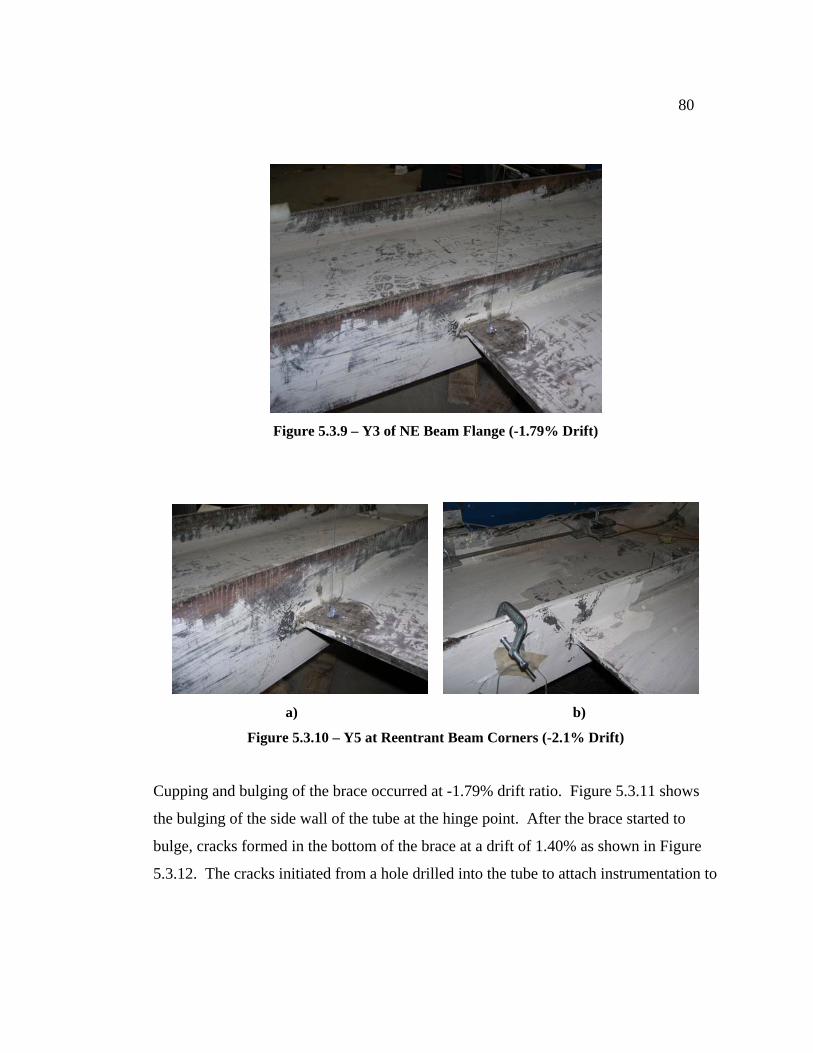
80
Figure 5.3.9 – Y3 of NE Beam Flange (-1.79% Drift)
a) b)
Figure 5.3.10 – Y5 at Reentrant Beam Corners (-2.1% Drift)
Cupping and bulging of the brace occurred at -1.79% drift ratio. Figure 5.3.11 shows
the bulging of the side wall of the tube at the hinge point. After the brace started to
bulge, cracks formed in the bottom of the brace at a drift of 1.40% as shown in Figure
5.3.12. The cracks initiated from a hole drilled into the tube to attach instrumentation to

81
measure the out-of-plane displacement of the brace. During the next cycle the brace
fractured through its cross section at a drift ratio of 1.67%, as shown in Figure 5.3.13.
Figure 5.3.11 – BC of Brace (-1.79% Drift)
Figure 5.3.12 – Crack in Brace (1.40% Drift)

82
Figure 5.3.13 – Fracture of Brace (1.67% Drift)
5.3.5 Specimen Summary
Specimen HSS-12 was designed using the 2t linear offset as prescribed in the AISC
Seismic Provisions. The specimen was similar to HSS-01, which failed due to weld
fracture, because the welds were sized to the expected brace capacity rather than the
capacity of the gusset plate. For HSS-12, CJP welds were used instead of fillet welds to
connect the gusset plate to the framing members. Specimen HSS-12 failed due to brace
fracture as desired. Figure 5.3.14 shows the gusset plate at the end of the test and it can
be seen that this gusset plate had very limited yielding.

83
Figure 5.3.14 – NE Gusset Plate (End of Test)
Figure 5.3.15 shows the SW column with significant yielding, but not as much as in
other experiments. The smaller amount of yielding could be due to the relatively small
drift that was experienced by the frame by the end of the experiment.
Figure 5.3.15 – SW Column (End of Test)

84
The gusset plate welds did not initiate cracking during the entire length of the test. This
was unusual since cracking was observed in all of the previous 11 tests.
5.4 HSS-13 – Tapered Plate with CJP Welds
5.4.1 Specimen Overview
Specimen HSS-13 had a tapered gusset plate and was identical to HSS-10 except that it
had CJP welds. HSS-10 experienced fillet weld cracks that were greater than one
quarter of the weld length.
The drift ranged from -2.03% to 2.05% for a total range of 4.08% (compared to 4.47%
for HSS-10) and resisted maximum loads of -176 kips to 349 kips for a range of 525
kips. Table 5.4.1 shows the performance states that were noticed and their associated
drift ratios. Figure 5.4.1 shows the hysteretic response.
Table 5.4.1 - HSS-13 Peak Results
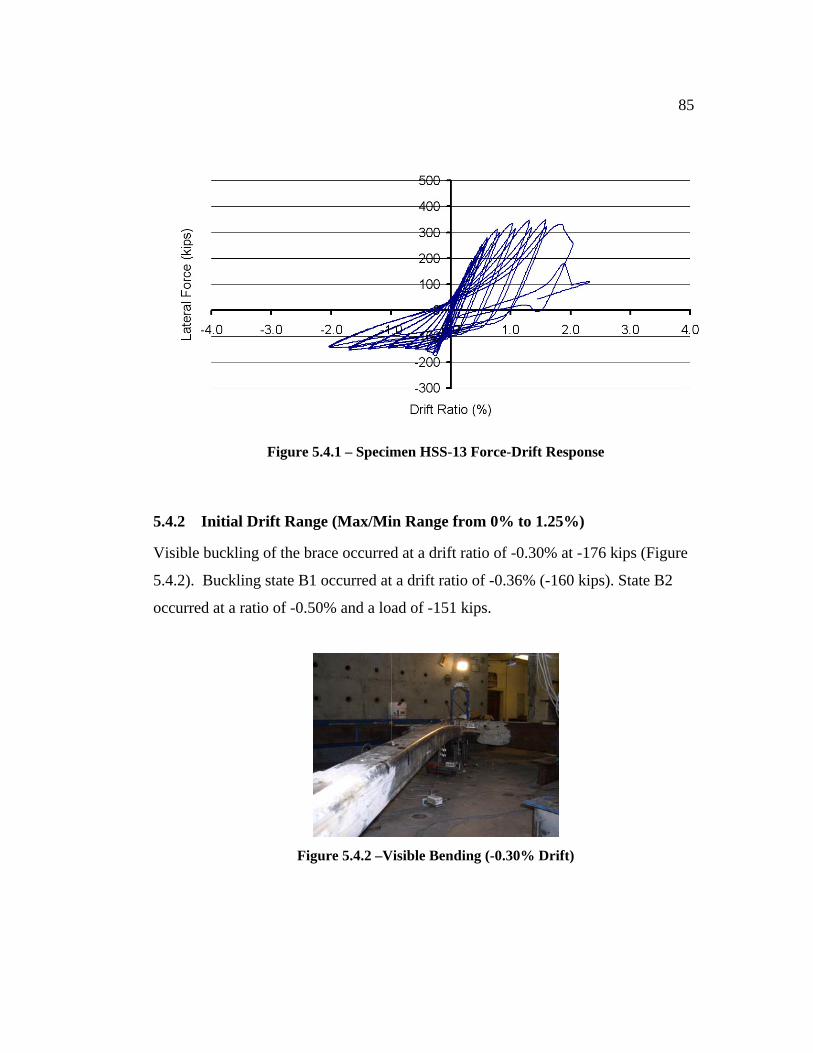
85
Figure 5.4.1 – Specimen HSS-13 Force-Drift Response
5.4.2 Initial Drift Range (Max/Min Range from 0% to 1.25%)
Visible buckling of the brace occurred at a drift ratio of -0.30% at -176 kips (Figure
5.4.2). Buckling state B1 occurred at a drift ratio of -0.36% (-160 kips). State B2
occurred at a ratio of -0.50% and a load of -151 kips.
Figure 5.4.2 –Visible Bending (-0.30% Drift)

86
Yield lines appeared in both of the gusset plates at 0.35% drift (193 kips). The
relatively faint yield lines appeared at the end of the brace as showed in Figure 5.4.3.
Figure 5.4.3 –Y1 at gusset plates (0.35% Drift)
5.4.3 Moderate Drift Range (Max/Min Range from 1.25% to 2.75%)
Brace yielding (designated by the strain gauges) occurred at a drift range of 0.54% (243
kips). Both gusset plates reached yield state Y3 at a drift of 0.82% (Figure 5.4.4), and
diagonal yield lines extended over half of the distance between the end of the brace and
the edge of the gusset plate. Hinging of both gusset plates became apparent at a drift
ratio of -1.38%. This is illustrated by Figure 5.4.5 which shows the SW gusset plate.

87
Figure 5.4.4 –Y3 at NE Gusset Plate (0.82% Drift)
Figure 5.4.5 –Y5 at SW gusset plate (-1.38% Drift)
Yielding occurred in the NE beam and reached a yield state of Y3 at the end of the
moderate drift range. Y1 yielding was noted in the SW column at a drift of -1.38%.
5.4.4 Severe Drift Range (Max/Min Range > 2.75%)
Y3 yielding occurred in both of the column flanges adjacent to the gusset plates at a
drift ratio of 1.35% (Figure 5.4.6). Initial yielding (Y1) also was first observed in the
south beam flange at a drift of 1.35%. Y5 yielding was noted in the SW beam at a load
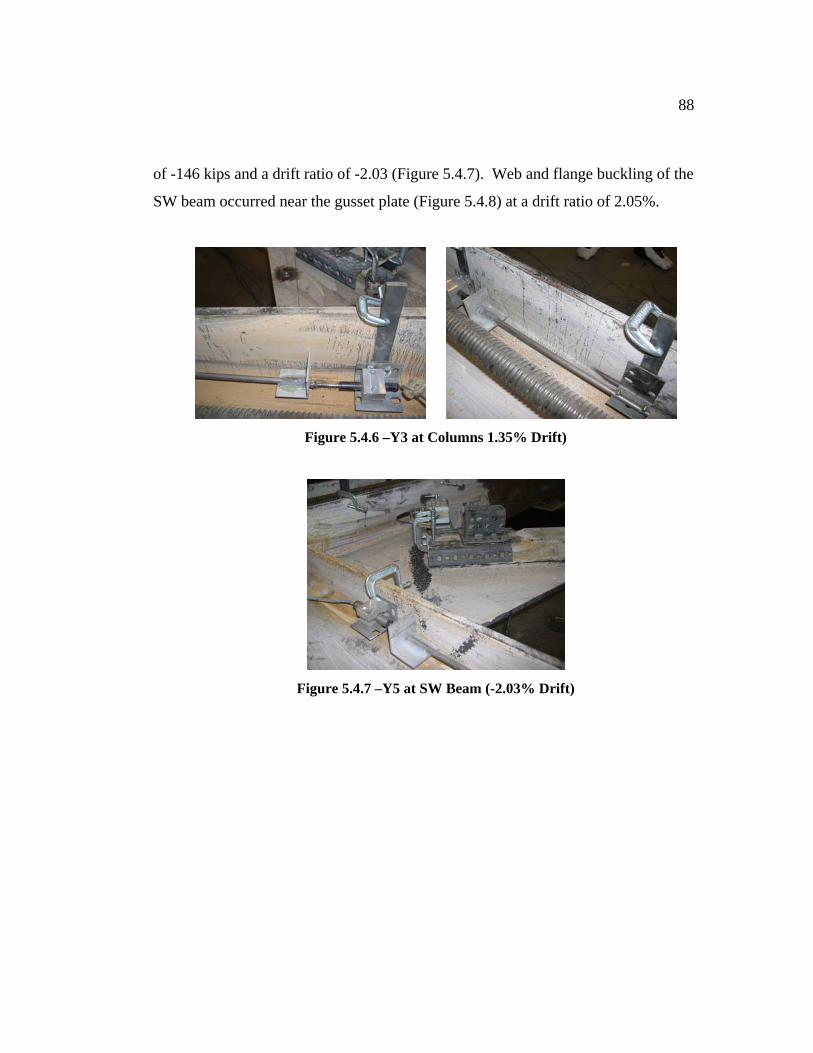
88
of -146 kips and a drift ratio of -2.03 (Figure 5.4.7). Web and flange buckling of the
SW beam occurred near the gusset plate (Figure 5.4.8) at a drift ratio of 2.05%.
Figure 5.4.6 –Y3 at Columns 1.35% Drift)
Figure 5.4.7 –Y5 at SW Beam (-2.03% Drift)
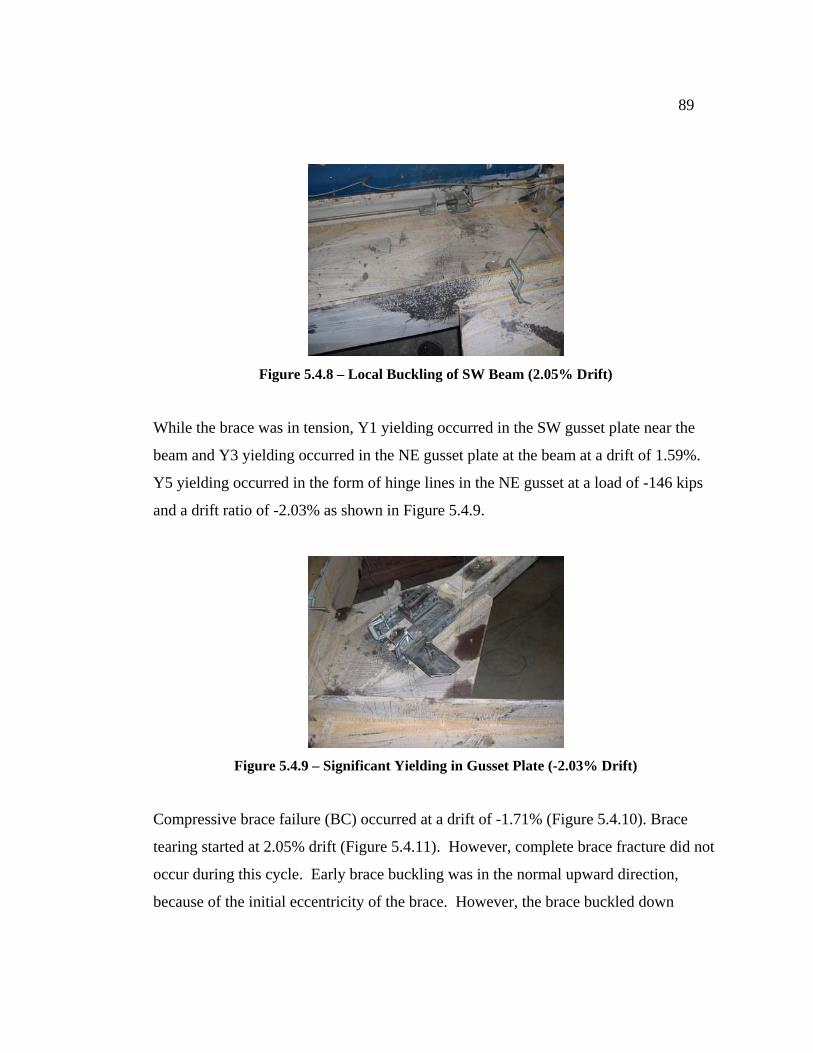
89
Figure 5.4.8 – Local Buckling of SW Beam (2.05% Drift)
While the brace was in tension, Y1 yielding occurred in the SW gusset plate near the
beam and Y3 yielding occurred in the NE gusset plate at the beam at a drift of 1.59%.
Y5 yielding occurred in the form of hinge lines in the NE gusset at a load of -146 kips
and a drift ratio of -2.03% as shown in Figure 5.4.9.
Figure 5.4.9 – Significant Yielding in Gusset Plate (-2.03% Drift)
Compressive brace failure (BC) occurred at a drift of -1.71% (Figure 5.4.10). Brace
tearing started at 2.05% drift (Figure 5.4.11). However, complete brace fracture did not
occur during this cycle. Early brace buckling was in the normal upward direction,
because of the initial eccentricity of the brace. However, the brace buckled down

90
toward the strong floor during the next compressive cycle at a drift of -0.33% (Figure
5.4.12). This compression cycle was stopped before the brace hit the floor (as a result,
this frame may have had a larger drift capacity in compression if the brace buckled
upward instead). The brace fractured during the next cycle at a drift of 2.32%.
Figure 5.4.10 –BC at brace (-1.71% Drift)
Figure 5.4.11 –Brace Initial Tearing (2.05% Drift)

91
Figure 5.4.12 – Downward Brace Buckling (-0.33% Drift)
5.4.5 Specimen Summary
Specimen HSS-13 used a tapered gusset plate with CJP welds. The relatively small size
of the gusset plate provided more ductility to the frame.
Compared to HSS-12, the framing members and gusset plates had a great deal more
yielding. This is shown by Figures 5.4.13 through 5.4.15. This seems to be a product
of the relatively high displacements that were experienced by the frame in tension,
especially the SW beam. When the brace was in tension, the beam was in compression.
This, combined with the closing moment may be the cause of the buckling of the flange
and web of the beam shown in 5.4.15.
One of the reasons that specimen HSS-13 was chosen as an experiment was to examine
how a tapered plate with complete joint penetration welds at the gusset plate would
compare to a tapered plate with fillet welds. Depending on what the goal is, it has
mixed reviews. On one hand, the complete joint penetration welds performed very well
because they did not crack at all. On the other hand, because they did not crack, the
system did not develop the added frame displacements associated with crack opening,
and this limits the ultimate drift capacity of the system. The question is whether or not

92
a certain amount of weld cracking can be tolerated in order to prolong the drift capacity
of the frame, and if so, how much?
Figure 5.4.13 – Yielding of NE Connection (End of Test)
Figure 5.4.14 –Yielding on West Column (End of Test)

93
Figure 5.4.15 –Local Buckling at South Beam (End of Test)
5.5 HSS-14 – Unreinforced Net Section
5.5.1 Specimen Overview
The typical reinforcement added to the net section of the brace was not used for
specimen HSS-14 (for detailed information on the net section reinforcement, see
Section 3.3). In order to alleviate the stress concentrations that may be felt at the net
section, a 7/8 inch hole was drilled at the end of the slot and was reamed out for added
smoothness.
The specimen failed as a result of brace fracture at the midspan of the brace. The
minimum drift reached was -2.04% and the maximum drift was 1.89%, resulting in a
range of 3.93%. The compression capacity was -170 kips and the tension capacity was
358 kips, resulting in a range of 528 kips. However, the brace buckled downward
(towards the floor) and the imposed drift history which was used for the previous tests
had to be altered in that the imposed compression drift was limited to a maximum of
two inches.

94
Table 5.5.1 shows the performance states noted for this specimen and the drifts at which
they occurred. Figure 5.5.1 shows the hysteretic response.
Table 5.5.1 - HSS-14 Peak Results
Figure 5.5.1 – Specimen HSS-14 Force-Drift Response

95
5.5.2 Initial Drift Range (Max/Min Range from 0% to 1.25%)
Seven cycles of 0.1% drift were imposed on the frame instead of the typical six cycles.
The applied drift from -0.51% to 0.37% was applied three times instead of the normal
two.
Buckling was observed at a drift ratio of -0.34% (Figure 5.5.2). Typically, this out of
plane movement happens gradually throughout the test. However, at this point in the
experiment, the brace moved out of plane at a faster rate. This would imply that the
brace was at a point of bifurcation. This sudden change can be seen on the hysteretic
graph in Figure 5.5.1 which shows higher compressive load before the brace buckled
(typically, the frame gains compressive resistance after buckling, i.e. the hysteretic
curve for HSS-12 in Figure 5.3.1).
Yielding in the gusset plates (at the end of the brace) was first observed at a drift ratio
of 0.28% (170 kips) as shown in Figure 5.5.3. Yielding also occurred in the beam
flanges in the initial drift range at 0.37% shown in Figure 5.5.4.
Figure 5.5.2 – Buckling Stage of HSS-14 (-0.34%)

96
Figure 5.5.3 – Y1 of NE Gusset Plate (0.28%)
Figure 5.5.4 – Y1 of NE Beam (0.37%)
5.5.3 Moderate Drift Range (Max/Min Range from 1.25% to 2.75%)
The NE gusset plate reached state Y3 at a drift of 0.58%, as shown in Figure 5.5.5. The
SW gusset also reached state Y3 but at a higher drift ratio, 1.06%. Yielding was also
noticed on the gusset plates at the reentrant corners. This occurred initially in the SW
gusset, adjacent to the beam at a drift ratio of 0.58% (Figure 5.5.6). It also occurred at a
drift ratio of 1.06% at the SW gusset plate adjacent to the beam, and in the NE gusset
plate, adjacent to the beam. Figure 5.5.7 shows hinge yield lines (due to compression)
on the bottom of the SW gusset plate at a drift ratio of -1.08%.

97
Figure 5.5.5 – Y3 of NE Gusset (0.58%)
Figure 5.5.6 – Y1 of NE Gusset at Beam (0.58%)

98
Figure 5.5.7 – Y1 of SW Gusset in Compression (-1.08%)
5.5.4 Severe Drift Range (Max/Min Range > 2.75%)
Yielding in the framing members increased in the severe drift range. State Y3 yielding
was reached in both columns (Figure 5.5.8 for the east column, Figure 5.5.9 for the west
column). State Y5 yielding was reached in both of the beams (Figure 5.5.10 for the
north beam and Figure 5.5.11 for the south beam) at 1.89% drift. The SW beam also
reached local buckling stage B1 in the flange and the web at this drift level.
Figure 5.5.8 – Y3 NE Column (1.61%)

99
Figure 5.5.9 – Y3 SW Column (1.89%)
Figure 5.5.10 – Y5 NE Beam (1.89%)
Figure 5.5.11 – Y5 SW Beam (1.89%)

100
Y3 yielding was observed in the NE gusset plate at the beam and the SW gusset plate in
the column at a drift ratio of 1.31% (Figure 5.5.12 and 5.5.13, respectively). Yielding
did not increase during subsequent drift cycles most likely due to the fact that the welds
at the same location cracked, thereby reducing the stiffness at this location.
Figure 5.5.12 – Y3 of NE Gusset at Reentrant Corner (1.31%)
Figure 5.5.13 – Y3 of SW Gusset at Reentrant Corner (1.31%)
During the compression drift ratio of -1.67%, a weld crack occurred on the NE gusset
plate adjacent to the beam shown in Figure 5.5.14. Cracks also appeared in the NE
column weld (two inches long, Figure 5.5.15) and in the SW beam weld at a drift level
of -2.04%. The crack in the NE gusset plate weld at the column grew to six and a half
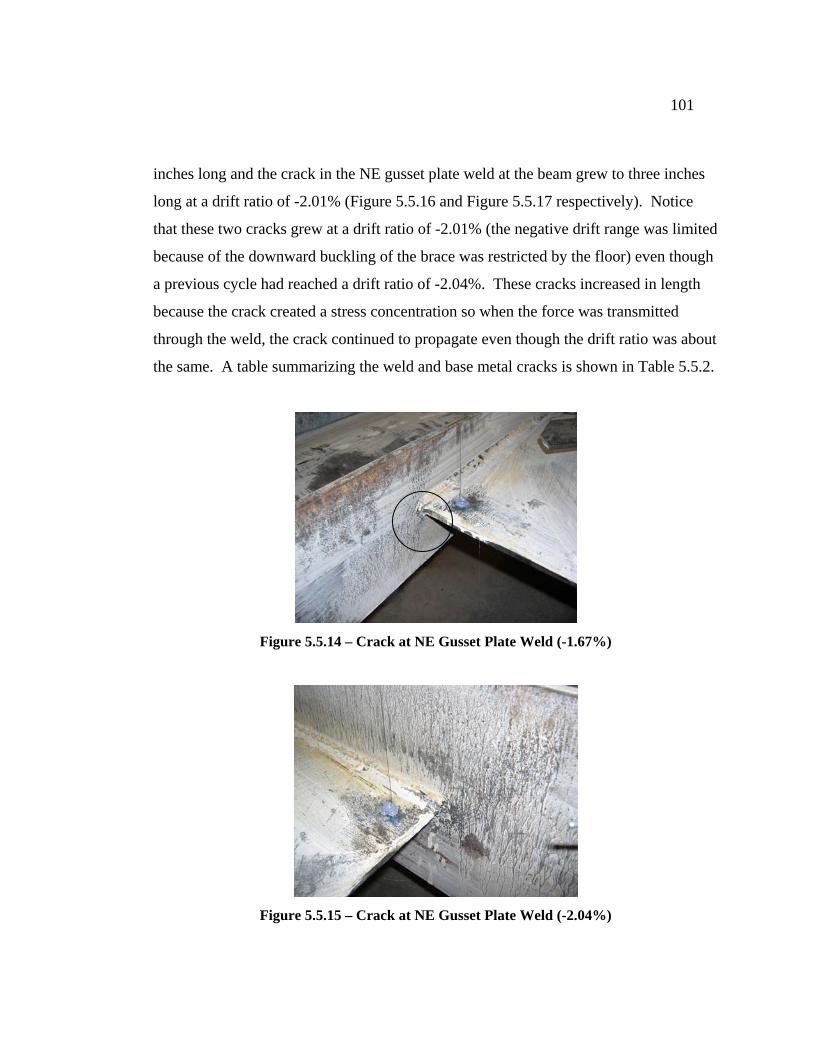
101
inches long and the crack in the NE gusset plate weld at the beam grew to three inches
long at a drift ratio of -2.01% (Figure 5.5.16 and Figure 5.5.17 respectively). Notice
that these two cracks grew at a drift ratio of -2.01% (the negative drift range was limited
because of the downward buckling of the brace was restricted by the floor) even though
a previous cycle had reached a drift ratio of -2.04%. These cracks increased in length
because the crack created a stress concentration so when the force was transmitted
through the weld, the crack continued to propagate even though the drift ratio was about
the same. A table summarizing the weld and base metal cracks is shown in Table 5.5.2.
Figure 5.5.14 – Crack at NE Gusset Plate Weld (-1.67%)
Figure 5.5.15 – Crack at NE Gusset Plate Weld (-2.04%)
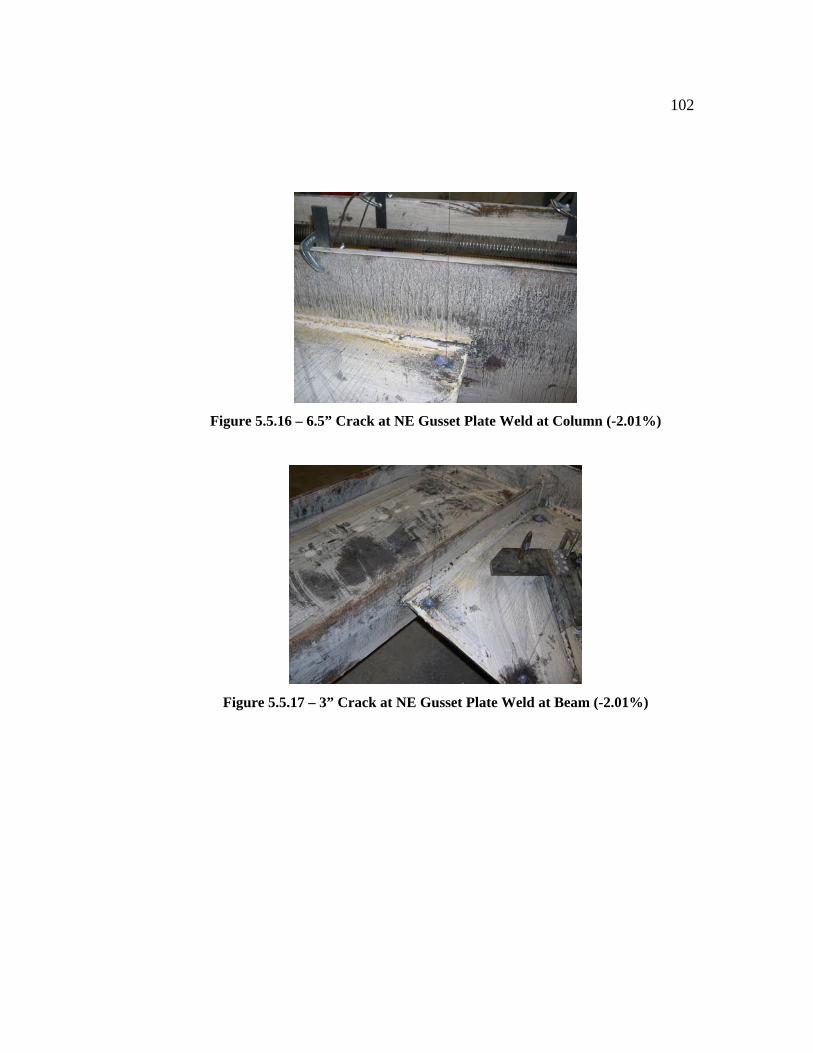
102
Figure 5.5.16 – 6.5” Crack at NE Gusset Plate Weld at Column (-2.01%)
Figure 5.5.17 – 3” Crack at NE Gusset Plate Weld at Beam (-2.01%)
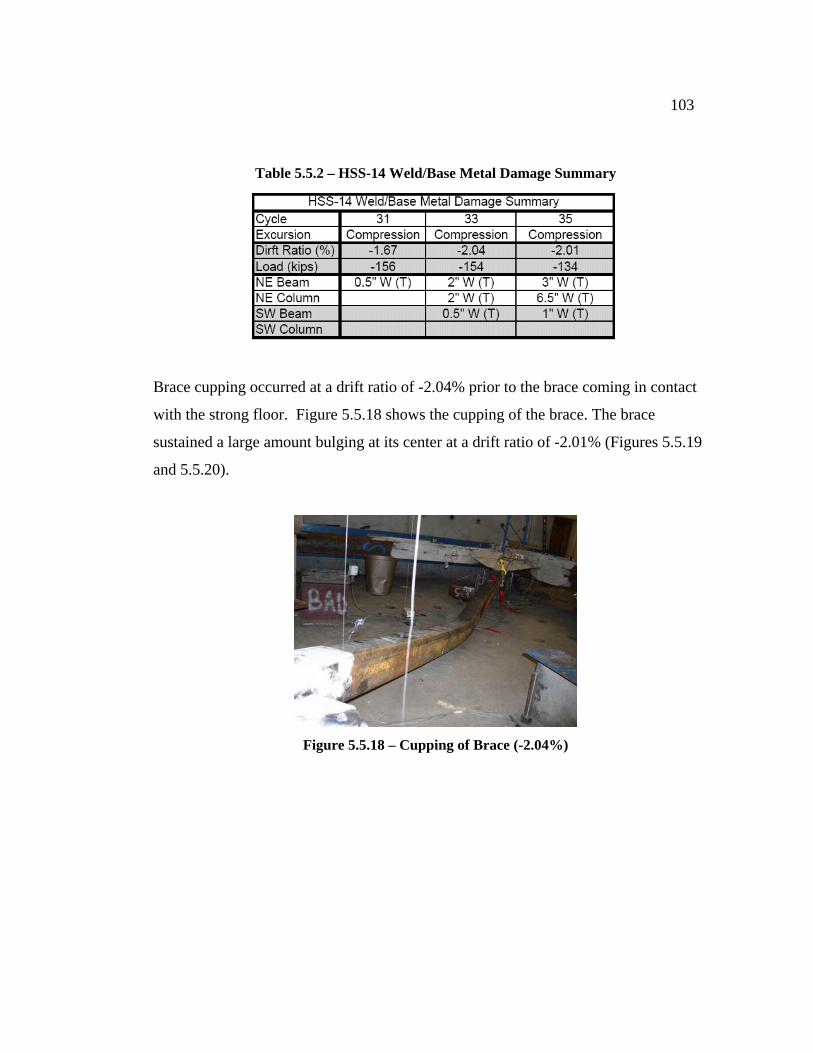
103
Table 5.5.2 – HSS-14 Weld/Base Metal Damage Summary
Brace cupping occurred at a drift ratio of -2.04% prior to the brace coming in contact
with the strong floor. Figure 5.5.18 shows the cupping of the brace. The brace
sustained a large amount bulging at its center at a drift ratio of -2.01% (Figures 5.5.19
and 5.5.20).
Figure 5.5.18 – Cupping of Brace (-2.04%)
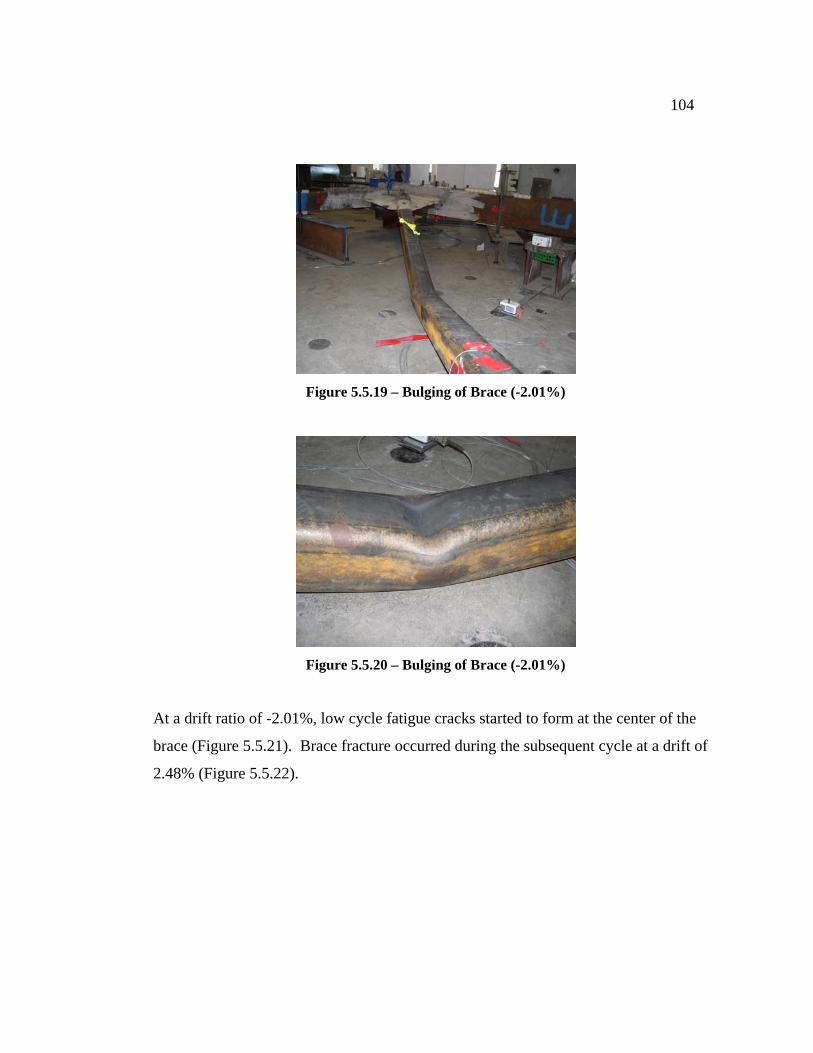
104
Figure 5.5.19 – Bulging of Brace (-2.01%)
Figure 5.5.20 – Bulging of Brace (-2.01%)
At a drift ratio of -2.01%, low cycle fatigue cracks started to form at the center of the
brace (Figure 5.5.21). Brace fracture occurred during the subsequent cycle at a drift of
2.48% (Figure 5.5.22).

105
Figure 5.5.21 – Fatigue Cracks in Brace (-2.01%)
Figure 5.5.22 – Brace Fracture (2.48%)
5.5.5 Specimen Summary
HSS-14 was designed to check the requirement of the net section reinforcement. The
net section holes are shown in Figure 5.5.23 and 5.5.24. As the photographs show,
there is no visible damage to these holes. In this respect, the test performed very well.
However, more testing is required to determine if the net section reinforcement can be
omitted.

106
Figure 5.5.23 – Net Section Hole Undamaged (End of Test)
Figure 5.5.24 – Net Section Hole Undamaged (End of Test)
Figure 5.5.25 shows the NE gusset plate after fracture of the brace. This view of the
plate isolates the extent of the yielding in the plate due to tension only since the brace
buckled down, and the compression yielding was limited to the underside of the plate.
It shows that the plate did yield significantly in tension.
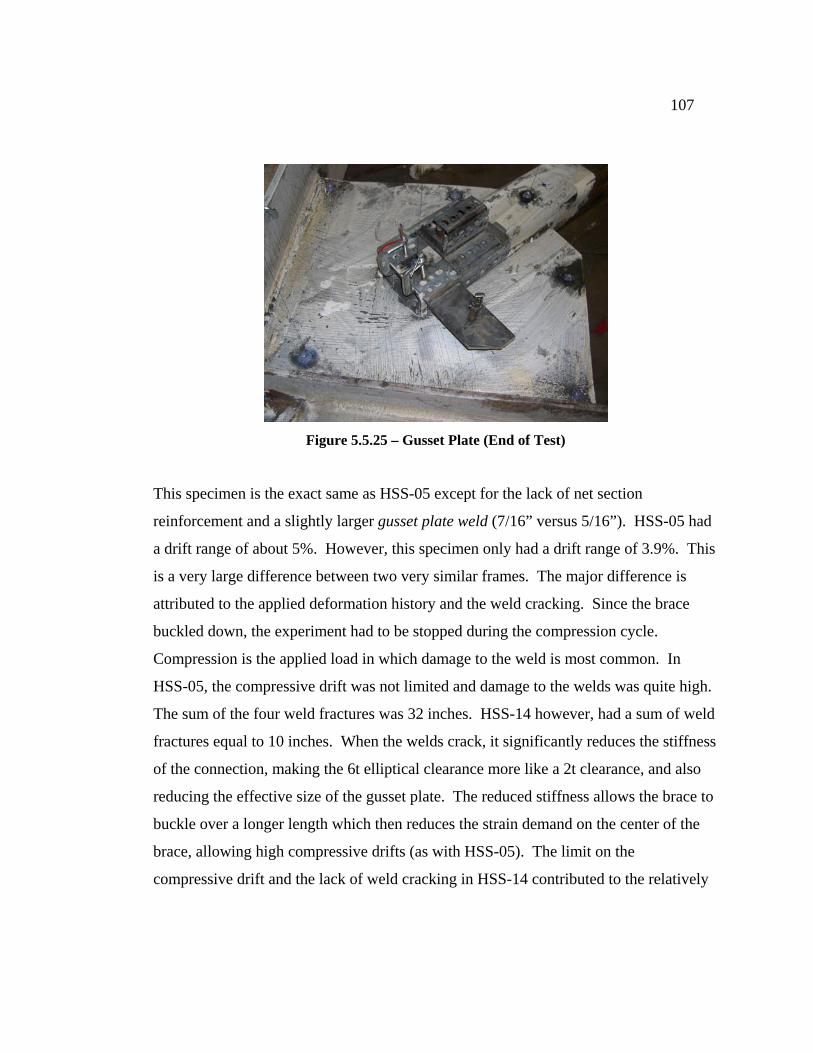
107
Figure 5.5.25 – Gusset Plate (End of Test)
This specimen is the exact same as HSS-05 except for the lack of net section
reinforcement and a slightly larger gusset plate weld (7/16” versus 5/16”). HSS-05 had
a drift range of about 5%. However, this specimen only had a drift range of 3.9%. This
is a very large difference between two very similar frames. The major difference is
attributed to the applied deformation history and the weld cracking. Since the brace
buckled down, the experiment had to be stopped during the compression cycle.
Compression is the applied load in which damage to the weld is most common. In
HSS-05, the compressive drift was not limited and damage to the welds was quite high.
The sum of the four weld fractures was 32 inches. HSS-14 however, had a sum of weld
fractures equal to 10 inches. When the welds crack, it significantly reduces the stiffness
of the connection, making the 6t elliptical clearance more like a 2t clearance, and also
reducing the effective size of the gusset plate. The reduced stiffness allows the brace to
buckle over a longer length which then reduces the strain demand on the center of the
brace, allowing high compressive drifts (as with HSS-05). The limit on the
compressive drift and the lack of weld cracking in HSS-14 contributed to the relatively
108
smaller drift range. If the applied displacement history was the same as HSS-05, the
specimen may have had weld cracking and a higher drift range similar to HSS-05.
5.6 HSS-15 – Reduced Splice Length
5.6.1 Specimen Overview
Specimen HSS-15 was designed with a splice length of 11.25 inches. By reducing the
length of the splice, the size of the gusset plate could be reduced, and this potentially
reduces the stiffness of the gusset plate.
This brace to gusset weld was increased from 5/16” to 7/16” to transfer the force in the
reduce length. In order to keep the thickness of the gusset plate down, block shear and
Whitmore fracture were checked by changing the φ factor from 0.75 to a β factor of
0.85. In addition, Whitmore yielding was totally neglected as a limit state, because
yielding in the gusset plate is desirable. With these three modifications to the design
code, the gusset plate was kept at 3/8”.
Because the brace of the previous test (HSS-14) buckled down and in order to prevent
this from happening again, a 5/16” offset between the centerline of the frame and the
centerline of the brace was used instead of a 3/16” offset. The 3/16” offset was used in
all of the previous tests except HSS-01 and HSS-02 (both of which buckled down). All
of the specimens following this test also used a 5/16” offset between the frame
centerline and the brace centerline.
The drift ranged from -2.22% to 1.87% for a total range of 4.09% and resisted
maximum loads of -155 kips to 332 kips for a range of 487 kips. Table 5.6.1 shows the

109
performance states that were noticed at the associated drift ratio. Figure 5.6.1 shows the
hysteretic response.
Table 5.6.1 - HSS-15 Peak Results
Figure 5.6.1 – Specimen HSS-15 Force-Drift Response
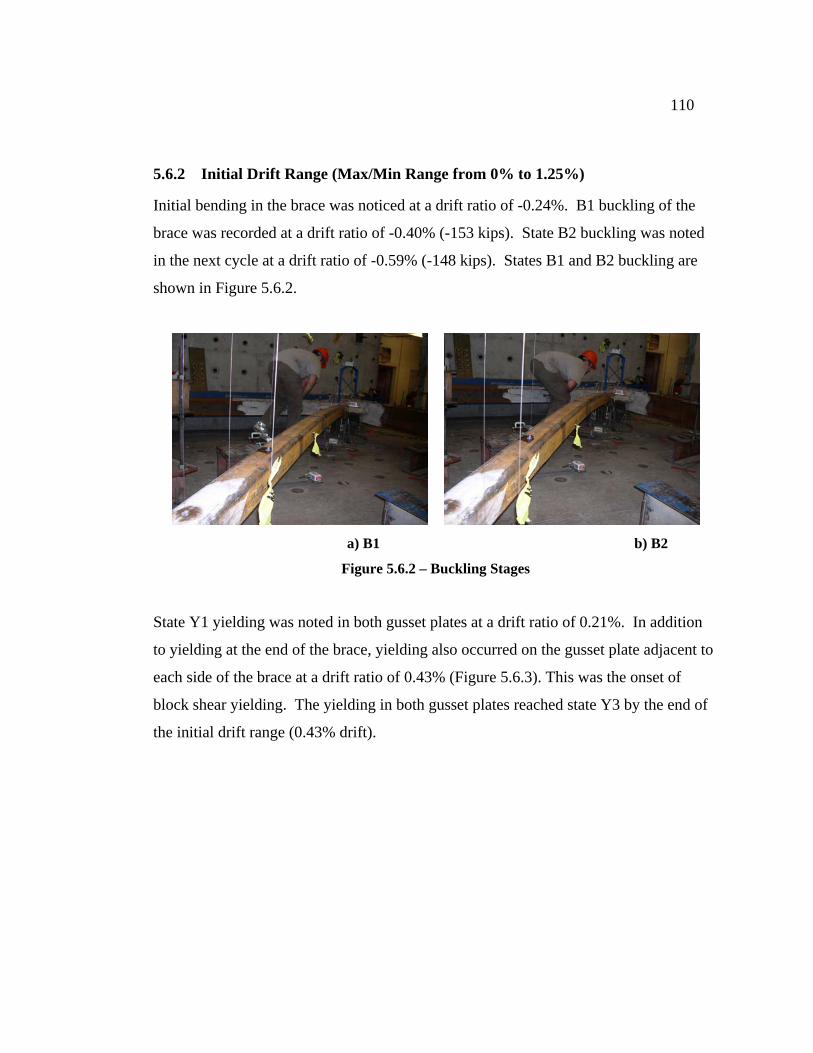
110
5.6.2 Initial Drift Range (Max/Min Range from 0% to 1.25%)
Initial bending in the brace was noticed at a drift ratio of -0.24%. B1 buckling of the
brace was recorded at a drift ratio of -0.40% (-153 kips). State B2 buckling was noted
in the next cycle at a drift ratio of -0.59% (-148 kips). States B1 and B2 buckling are
shown in Figure 5.6.2.
a) B1 b) B2
Figure 5.6.2 – Buckling Stages
State Y1 yielding was noted in both gusset plates at a drift ratio of 0.21%. In addition
to yielding at the end of the brace, yielding also occurred on the gusset plate adjacent to
each side of the brace at a drift ratio of 0.43% (Figure 5.6.3). This was the onset of
block shear yielding. The yielding in both gusset plates reached state Y3 by the end of
the initial drift range (0.43% drift).

111
Figure 5.6.3 – Yielding on Gusset Next to Brace at 232 kips (0.43%)
5.6.3 Moderate Drift Range (Max/Min Range from 1.25% to 2.75%)
The SW beam at the flange and web, and the NE beam in the web (Figure 5.6.4)
reached the state Y1 at 0.96% drift. Yielding in the NE beam reached state Y3 shown
in Figure 5.6.5 at a drift of -1.35%.
Figure 5.6.4 – Yielding on NE Beam Web (0.96%)

112
Figure 5.6.5 – Yielding on NE Beam Flange (-1.35%)
Prominent hinge lines developed in both gusset plates at a drift ratio of -1.35%. These
hinge lines are shown in Figure 5.6.6.
Figure 5.6.6 – Hinge Lines in Gusset Plates (-1.35%)
5.6.4 Severe Drift Range (Max/Min Range > 2.75%)
Y3 yielding was noted in the NE column at a drift ratio of 1.22% shown in Figure 5.6.7.
Yielding also occurred in the SW column and progressed throughout the severe drift
range. Flange buckling and web buckling did not occur during this test. Figure 5.6.8a
shows increased yielding in the NE beam web during the tension half of the cycle at
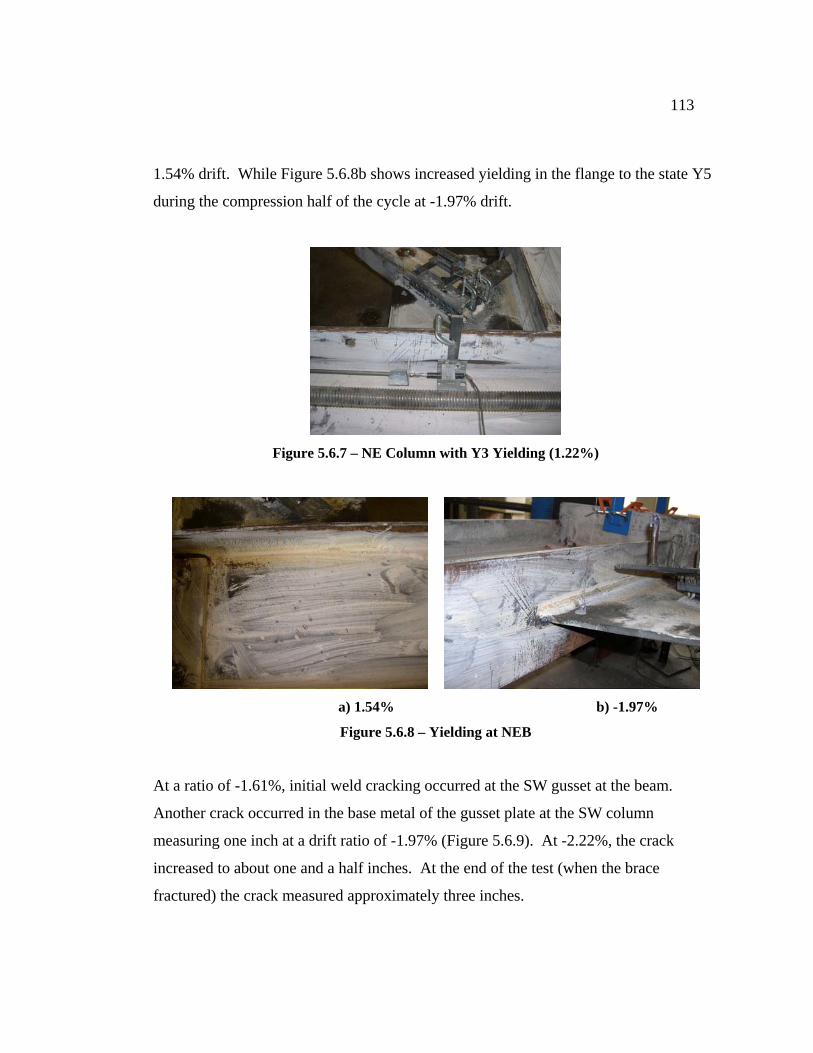
113
1.54% drift. While Figure 5.6.8b shows increased yielding in the flange to the state Y5
during the compression half of the cycle at -1.97% drift.
Figure 5.6.7 – NE Column with Y3 Yielding (1.22%)
a) 1.54% b) -1.97%
Figure 5.6.8 – Yielding at NEB
At a ratio of -1.61%, initial weld cracking occurred at the SW gusset at the beam.
Another crack occurred in the base metal of the gusset plate at the SW column
measuring one inch at a drift ratio of -1.97% (Figure 5.6.9). At -2.22%, the crack
increased to about one and a half inches. At the end of the test (when the brace
fractured) the crack measured approximately three inches.
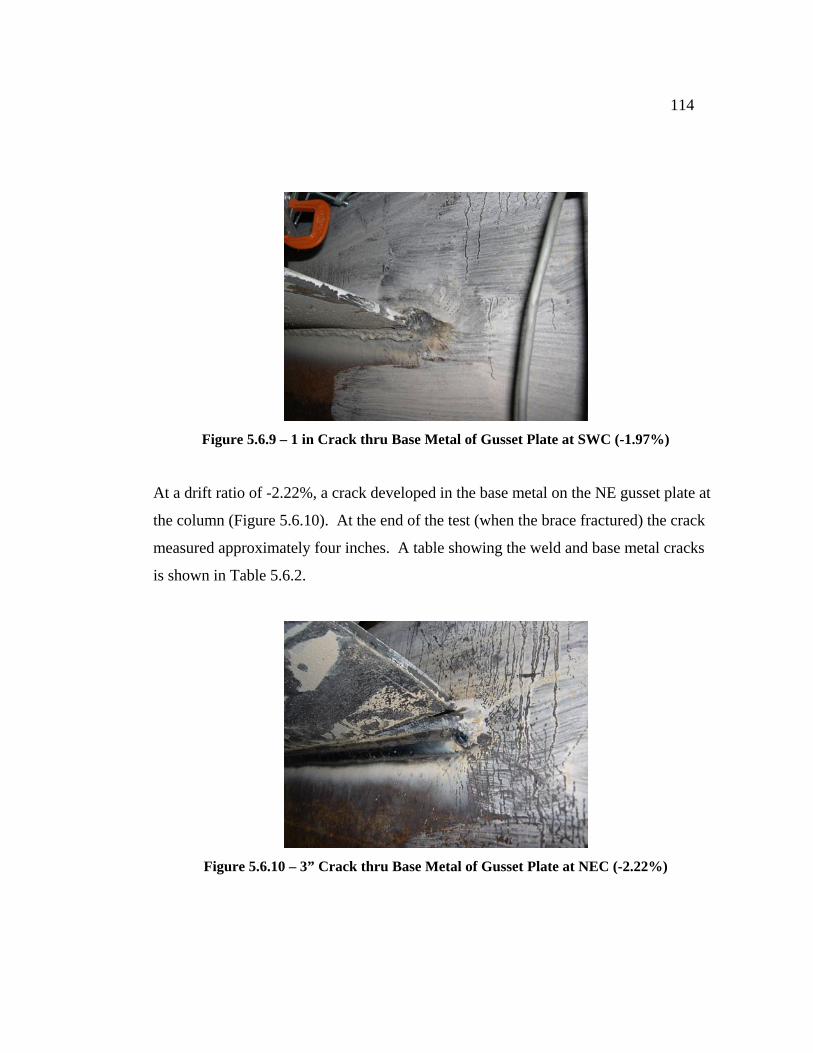
114
Figure 5.6.9 – 1 in Crack thru Base Metal of Gusset Plate at SWC (-1.97%)
At a drift ratio of -2.22%, a crack developed in the base metal on the NE gusset plate at
the column (Figure 5.6.10). At the end of the test (when the brace fractured) the crack
measured approximately four inches. A table showing the weld and base metal cracks
is shown in Table 5.6.2.
Figure 5.6.10 – 3” Crack thru Base Metal of Gusset Plate at NEC (-2.22%)
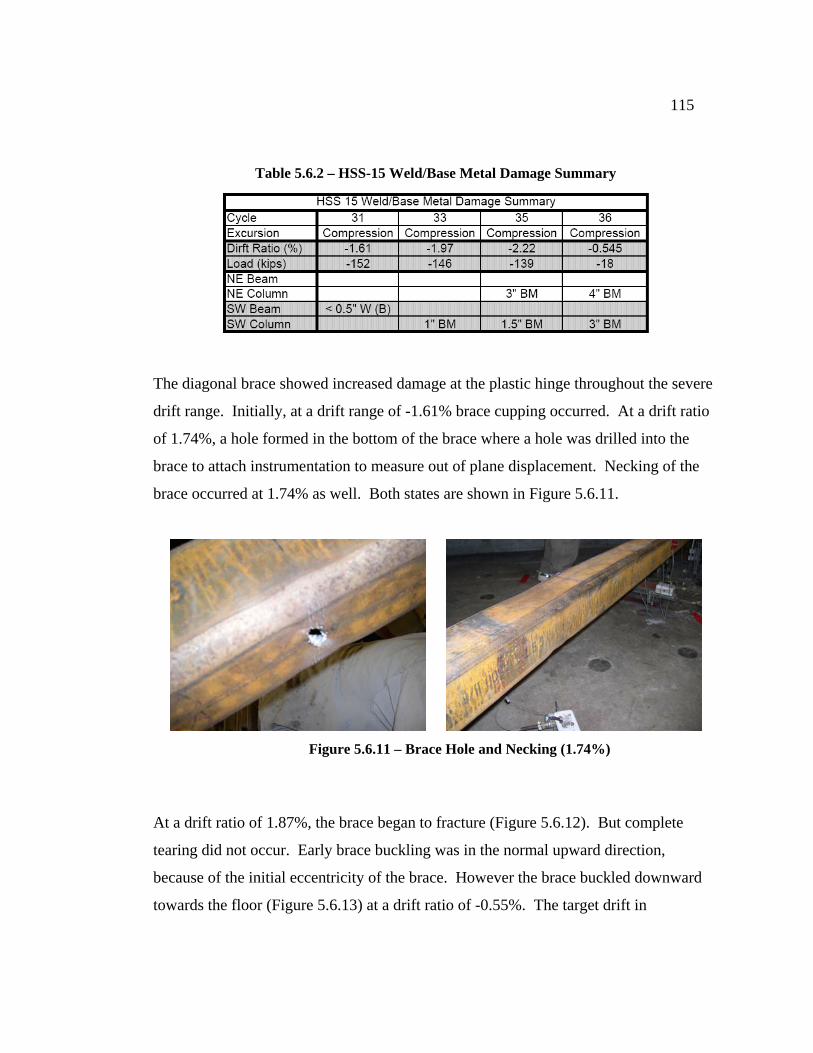
115
Table 5.6.2 – HSS-15 Weld/Base Metal Damage Summary
The diagonal brace showed increased damage at the plastic hinge throughout the severe
drift range. Initially, at a drift range of -1.61% brace cupping occurred. At a drift ratio
of 1.74%, a hole formed in the bottom of the brace where a hole was drilled into the
brace to attach instrumentation to measure out of plane displacement. Necking of the
brace occurred at 1.74% as well. Both states are shown in Figure 5.6.11.
Figure 5.6.11 – Brace Hole and Necking (1.74%)
At a drift ratio of 1.87%, the brace began to fracture (Figure 5.6.12). But complete
tearing did not occur. Early brace buckling was in the normal upward direction,
because of the initial eccentricity of the brace. However the brace buckled downward
towards the floor (Figure 5.6.13) at a drift ratio of -0.55%. The target drift in

116
compression was not reached to prevent the brace from touching the floor. During the
following cycle, the brace fractured completely at a drift of 2.5%.
Figure 5.6.12 – Brace Crack Halfway thru Member (1.87%)
Figure 5.6.13 – Brace Buckling Down (-0.55%)

117
5.6.5 Specimen Summary
In comparison to other similar specimens, HSS-15 performed rather poorly regarding
the total drift range. The total drift was -2.22% to 1.87% for a range of 4.09%. While
the total load was -155 kips to 332 kips for a range of 487 kips. Similar to HSS-13, if
the brace buckled up on the last cycle, the compression drift capacity may have
increased a little. However, this cycle was a repeat of the same applied drift as the
cycle before. Therefore the potential increase in drift would probably be small.
The welds of the frame seemed to perform very well. It was the base metal that
cracked. Although the base metal did crack, it was not seen until damage in the brace
(brace cupping) started to occur. And only when necking of the brace and a significant
hole occurred in the brace, did a crack of three inches develop in the gusset plate. By
the end of the test, the crack in the gusset plate at the northeast column measured four
inches and the crack in the gusset plate at the SW column measured three inches.
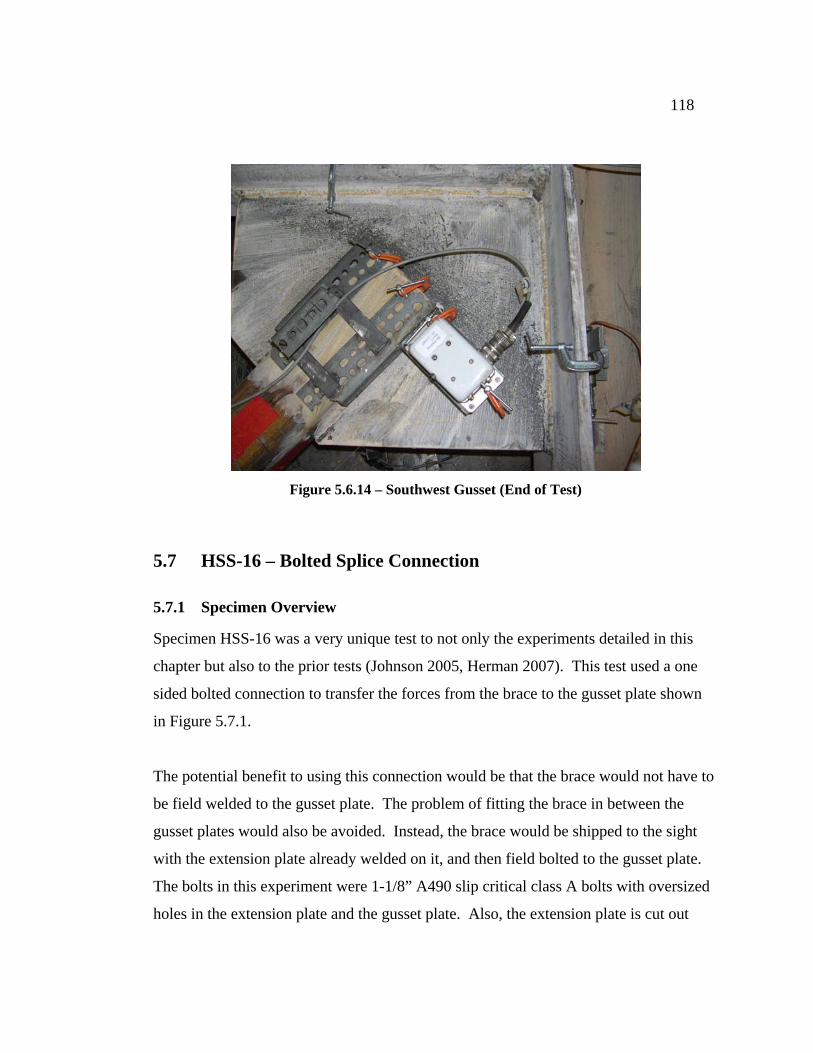
118
Figure 5.6.14 – Southwest Gusset (End of Test)
5.7 HSS-16 – Bolted Splice Connection
5.7.1 Specimen Overview
Specimen HSS-16 was a very unique test to not only the experiments detailed in this
chapter but also to the prior tests (Johnson 2005, Herman 2007). This test used a one
sided bolted connection to transfer the forces from the brace to the gusset plate shown
in Figure 5.7.1.
The potential benefit to using this connection would be that the brace would not have to
be field welded to the gusset plate. The problem of fitting the brace in between the
gusset plates would also be avoided. Instead, the brace would be shipped to the sight
with the extension plate already welded on it, and then field bolted to the gusset plate.
The bolts in this experiment were 1-1/8” A490 slip critical class A bolts with oversized
holes in the extension plate and the gusset plate. Also, the extension plate is cut out

119
with a notch in it as proposed by Packer (2007), so that the brace will have its entire
cross section for one third of the length of the connection to the extension plate, thereby
eliminating the problem of net section.
Figure 5.7.1 – Specimen HSS-16 Connection Detail
The frame failed by fracture of the net section at the 7/8 inch extension plate. The
applied load ranged from -146 kips to 301 kips for a total range of 447 kips. The drift
was measured from -2.86% to 3.03% for a range of 5.89%. Table 5.7.1 shows the
performance states that were noticed at the associated drift ratio. Figure 5.7.1 shows the
hysteretic response.

120
Table 5.7.1 - HSS-16 Peak Results
Figure 5.7.2 – Specimen HSS-16 Force-Drift Response

121
5.7.2 Initial Drift Range (Max/Min Range from 0% to 1.25%)
Visible bending of the SW connection was noticed at a drift ratio of -0.16% shown in
Figure 5.7.3. This displacement was located at the extension plate, not at the center of
the brace where it typically occurs. Since hinging occurred at the extension plate, B1,
B2 and BC were not calculated for this specimen. Figure 5.7.4 shows that the
eccentricity of the one sided connection was too much for the extension plate to resist
and a hinge formed here, between the end of the brace and the edge of the gusset plate.
The extension plate and gusset plate continued to bend with added deflection shown in
Figures 5.7.5 and 5.7.6. Hinge lines formed in the gusset plate at a drift ratio of -0.45%
shown in Figure 5.7.6.
Figure 5.7.3 – Visual Bending of SW Gusset and Extension Plate (-0.16%)
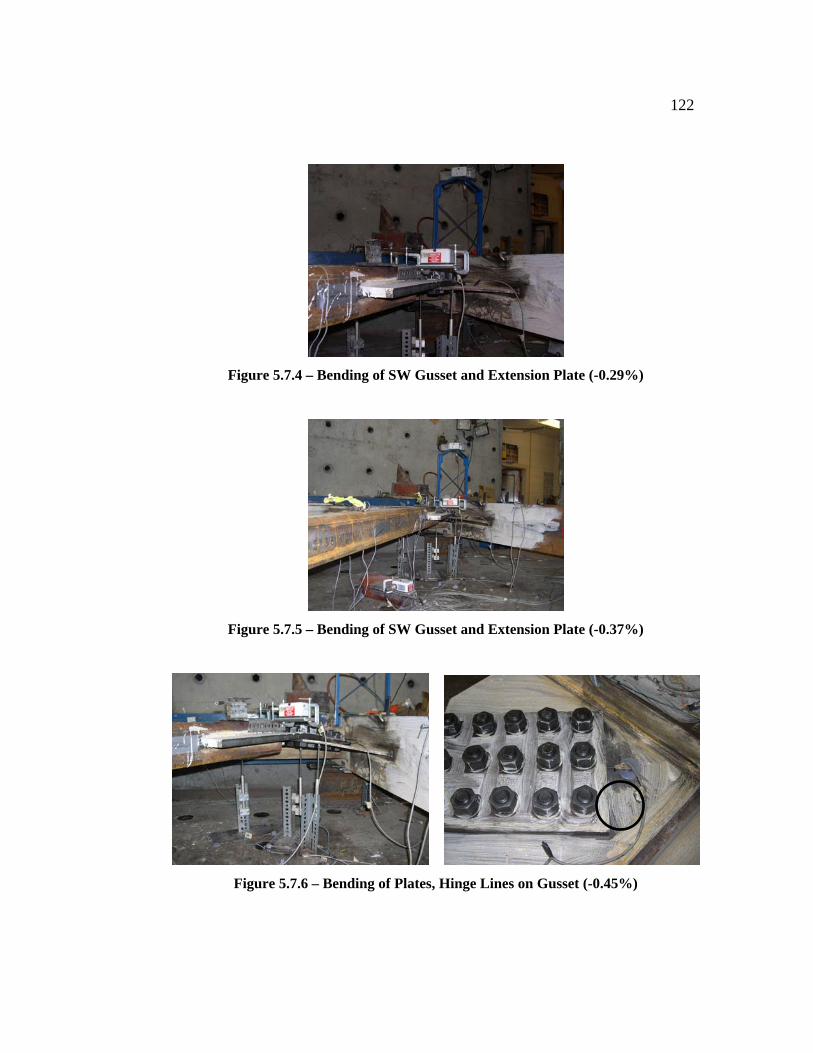
122
Figure 5.7.4 – Bending of SW Gusset and Extension Plate (-0.29%)
Figure 5.7.5 – Bending of SW Gusset and Extension Plate (-0.37%)
Figure 5.7.6 – Bending of Plates, Hinge Lines on Gusset (-0.45%)
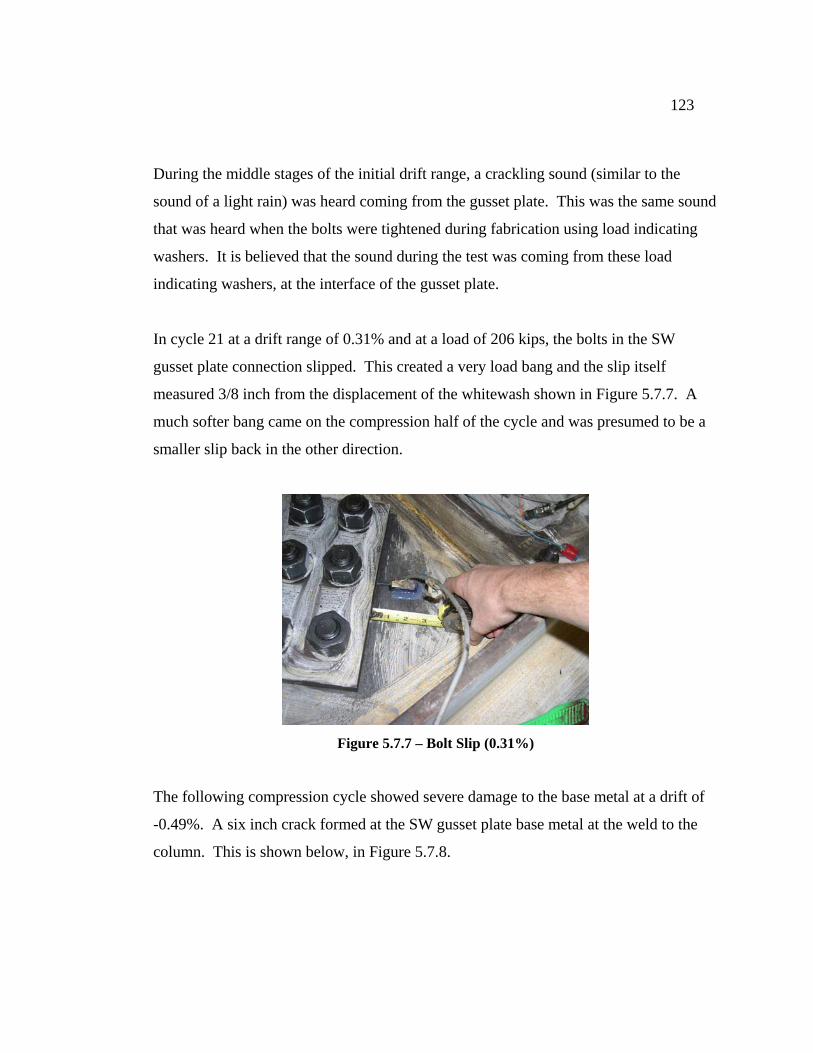
123
During the middle stages of the initial drift range, a crackling sound (similar to the
sound of a light rain) was heard coming from the gusset plate. This was the same sound
that was heard when the bolts were tightened during fabrication using load indicating
washers. It is believed that the sound during the test was coming from these load
indicating washers, at the interface of the gusset plate.
In cycle 21 at a drift range of 0.31% and at a load of 206 kips, the bolts in the SW
gusset plate connection slipped. This created a very load bang and the slip itself
measured 3/8 inch from the displacement of the whitewash shown in Figure 5.7.7. A
much softer bang came on the compression half of the cycle and was presumed to be a
smaller slip back in the other direction.
Figure 5.7.7 – Bolt Slip (0.31%)
The following compression cycle showed severe damage to the base metal at a drift of
-0.49%. A six inch crack formed at the SW gusset plate base metal at the weld to the
column. This is shown below, in Figure 5.7.8.

124
Figure 5.7.8 – Base Metal Fracture (-0.49%)
Because of the base metal crack and added deformation demands, the gusset plate
started to show additional yield lines. Y3 yielding was noticed in the gusset plate at the
beam, column, and at the end of the extension plate. These lines appeared to be hinge
lines where the gusset plate was hinging, however they could also have been a result of
the onset of local buckling of the gusset plate at the beam which wasn’t noticed until the
moderate drift range.
Figure 5.7.9 – Y3 of SW Gusset Plate (-0.49%)

125
5.7.3 Moderate Drift Range (Max/Min Range from 1.25% to 2.75%)
The yielding of the extension plate started to show through flaking of the whitewash at
a drift ratio of 0.67%, as shown in Figure 5.7.10. State Y3 yielding was reached by this
plate at a drift ratio of 1.08%.
Figure 5.7.10 – Y1 of SW Extension Plate (0.67%)
Initial yielding was spotted on both gusset plates for the first time while the brace was
in tension. At a drift of 0.81%, the system reached an applied load of 223 kips causing
the gusset plates to yield shown in Figure 5.7.11. At the same time, the SW gusset plate
buckled at the beam shown in Figure 5.7.12. It is important to note that this plate
buckled only after a long crack (13”) developed in the base metal of the SW gusset plate
at the column (making the connection eccentric).

126
Figure 5.7.11 – Y1 of NE Gusset Plate (0.81%)
Figure 5.7.12 – B1 of SW Gusset Plate (0.81%)
5.7.4 Severe Drift Range (Max/Min Range > 2.75%)
The bolts on the NE gusset slipped with a loud bang at a load of 276 kips, at a drift ratio
of 1.27% (Figure 5.7.13). Over the next couple of cycles, the frame continued to make
loud banging sounds. These sounds were presumed to come from the bolted
connections at the gusset plates slipping, but it was unable to determine exactly where
the slips were occurring because the potentiometers were dislodged whenever the
connection slipped. These loud sounds occurred only during the tensile half of the
cycles. Yielding in the SW gusset plate reached a stage of Y5 at a drift ratio of 1.43%
(Figure 5.7.14).
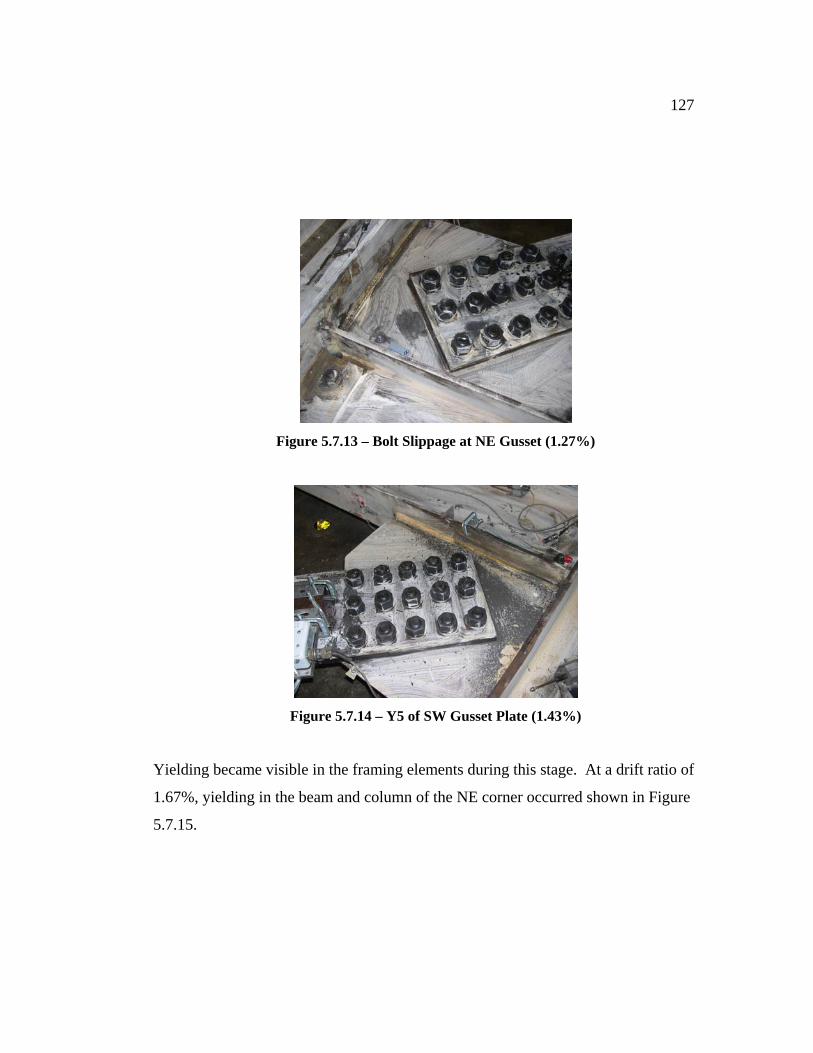
127
Figure 5.7.13 – Bolt Slippage at NE Gusset (1.27%)
Figure 5.7.14 – Y5 of SW Gusset Plate (1.43%)
Yielding became visible in the framing elements during this stage. At a drift ratio of
1.67%, yielding in the beam and column of the NE corner occurred shown in Figure
5.7.15.

128
Figure 5.7.15 – Y3 of NE Framing Elements (1.67%)
Throughout the test, the crack in the gusset plate base metal at the southwest column
continued to increase in length. At a drift ratio of -2.00% this crack tore the entire way
through the gusset to column connection (Figure 5.7.16). At -2.31% drift, the crack
started to tear the weld (or possibley, the base metal) at the beam, next to the column,
during the tension half of the cycle. This also caused considerable local damage to the
beam flange at this location. Figure 5.7.17 shows this damage. This crack grew rather
slowly after this point and reached a total of nine inches long by the end of the test at a
drift ratio of -2.86%. The total weld length left connecting the gusset plate to the SW
corner of the frame at this drift ratio was 16 inches.
Figure 5.7.16 – Complete Tear of Base Metal at SW Gusset (-2.00%)

129
Figure 5.7.17 – Crack Develops in Weld at Beam (2.28%)
A crack in the base metal at the weld connecting the NE gusset plate to the column
measured two inches at -1.98% drift. At a drift ratio of -2.31%, the crack grew to nine
inches long. Figure 5.7.18 shows this condition. At cycle 37 with a drift ratio of
-2.66%, the crack measured 17 inches long, and at -2.86% drift, the crack fractured over
the entire length of the gusset plate to column connection (Figure 5.7.19). A table
summarizing the weld and base metal damage is shown in Table 5.7.2.
Figure 5.7.18 – Base Metal Crack at NE Column (-2.31%)
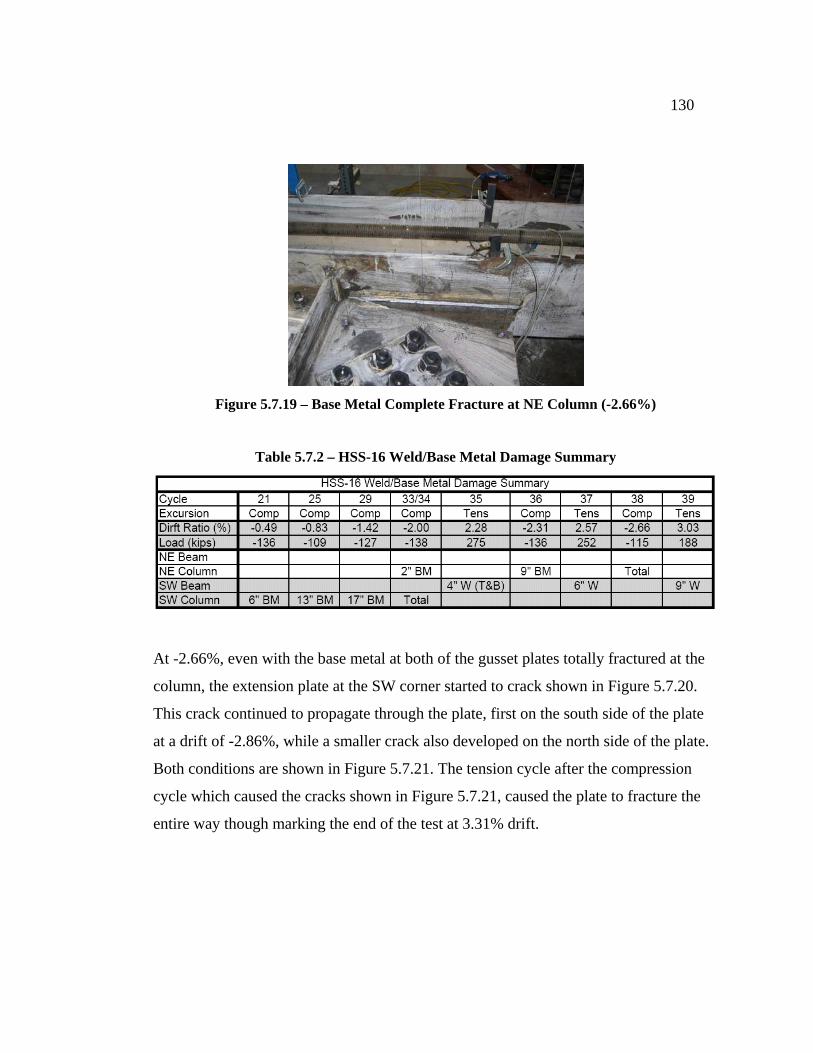
130
Figure 5.7.19 – Base Metal Complete Fracture at NE Column (-2.66%)
Table 5.7.2 – HSS-16 Weld/Base Metal Damage Summary
At -2.66%, even with the base metal at both of the gusset plates totally fractured at the
column, the extension plate at the SW corner started to crack shown in Figure 5.7.20.
This crack continued to propagate through the plate, first on the south side of the plate
at a drift of -2.86%, while a smaller crack also developed on the north side of the plate.
Both conditions are shown in Figure 5.7.21. The tension cycle after the compression
cycle which caused the cracks shown in Figure 5.7.21, caused the plate to fracture the
entire way though marking the end of the test at 3.31% drift.
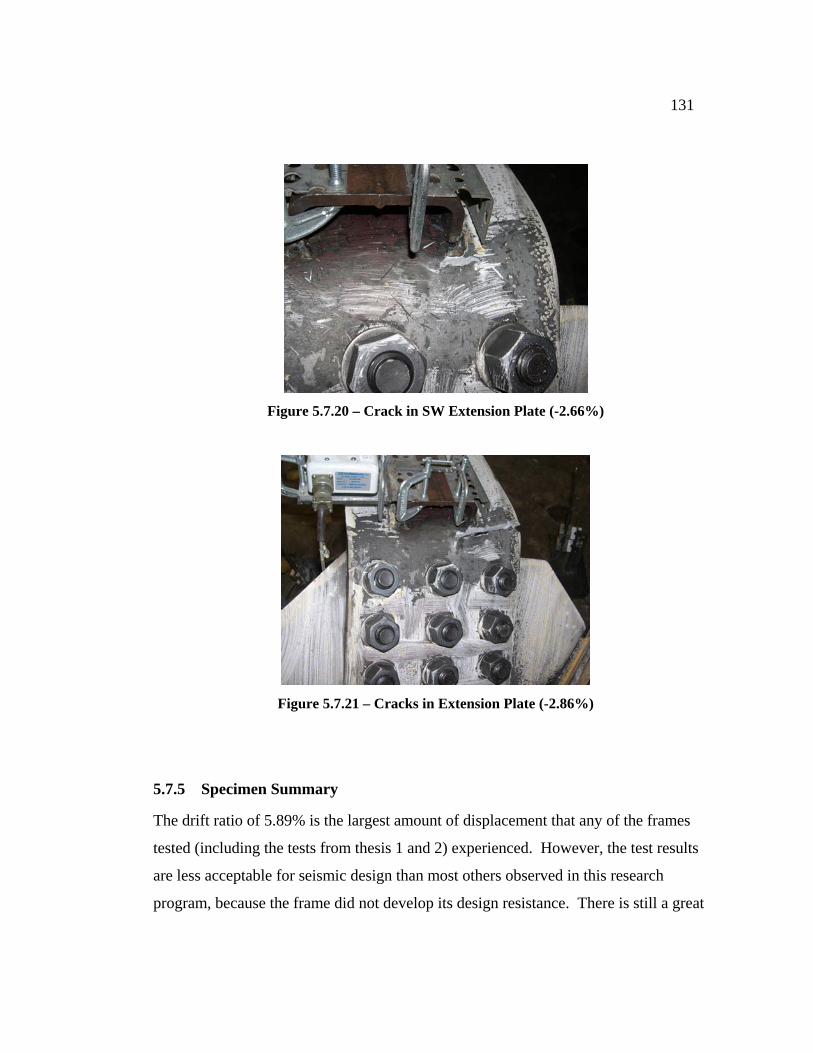
131
Figure 5.7.20 – Crack in SW Extension Plate (-2.66%)
Figure 5.7.21 – Cracks in Extension Plate (-2.86%)
5.7.5 Specimen Summary
The drift ratio of 5.89% is the largest amount of displacement that any of the frames
tested (including the tests from thesis 1 and 2) experienced. However, the test results
are less acceptable for seismic design than most others observed in this research
program, because the frame did not develop its design resistance. There is still a great

132
deal to learn from this test. To understand why this frame was able to withstand such a
large drift capacity could lead to new designs incorporating some of the same ideas, and
hopefully leading to frames with similar, or even higher, drift capacities. These ideas
will be discussed in chapter nine.
Some characteristics of the frame were sacrificed in order to attain such a large range of
displacement. Most notably, the force range was much smaller than previous
experiments. Since the connection buckled before the brace did (the connection was
weaker than the brace), the frame had an overall lower compression capacity, -146 kips.
With the bolts slipping, and the welds tearing in the initial drift range, the tension
capacity was also reduced, to only 301 kips. This gives a range of 447 kips, which is
more than 100 kips lower than HSS-12.
Damage to the base metal of the gusset plate occurred very early in this experiment.
The drift ratio at which it occurred was -0.49%. In performance based design, the
performance levels of immediate occupancy and operational are appropriate guidelines
for this drift ratio.
5.8 HSS-17 – 3/8” Tapered Plate
5.8.1 Specimen Overview
Specimen HSS-17 uses a 3/8 inch tapered gusset plate with 3/8 inch fillet welds for the
gusset plate welds. This specimen has the same geometry as the other two specimens
with tapered plates (HSS-10 and HSS-13) except the thickness of the gusset plate has
changed from 1/2 inch to 3/8 inch.

133
The calibration factor for the LVDT of the actuator was incorrect for this test and the
applied deflection was 1.45 times the anticipated deflection. The drift ratios shown in
this chapter are the corrected drift values. However since this situation was not realized
until after the test, there were fewer total cycles throughout the test, and these cycles of
applied drift were spaced further apart than in previous tests.
The specimen achieved a relatively large drift ratio, from -2.79% to 2.15% for a total
range of 4.94%, and a load ranging from -159 kips to 355 kips for a total range of 514
kips. Table 5.8.1 shows the performance states that were noticed at the associated drift
ratio. Figure 5.8.1 shows the hysteretic response.
Table 5.8.1 - HSS-17 Peak Results

134
Figure 5.8.1 – Specimen HSS-17 Force-Drift Response
5.8.2 Initial Drift Range (Max/Min Range from 0% to 1.25%)
Visible bending in the brace was noticed at a drift ratio of -0.25% as shown in Figure
5.8.2. State B1 buckling occurred at a drift of -0.51% (-155 kips) and state B2 followed
at a drift of -0.63% (-148 kips).
Figure 5.8.2 – Visible Buckling (-0.25%)

135
At a drift ratio of 0.26% initial yielding, Y1, occurred on both gusset plates as shown in
Figure 5.8.3. Yielding in these locations reached Y3 at a drift ratio of 0.32%, as shown
in Figure 5.8.4. Yielding of the SW gusset plate occurred during compression at a drift
ratio of -0.63% (the same time as B2 of the brace) shown in Figure 5.8.5.
Figure 5.8.3 – Y1 Yielding due to Tension in Both Gussets (0.26%)
Figure 5.8.4 – Y3 Yielding due to Tension in Both Gussets (0.32%)
.

136
Figure 5.8.5 – Compression Yield Lines of SW Gusset Plate (-0.63%)
5.8.3 Moderate Drift Range (Max/Min Range from 1.25% to 2.75%)
Figure 5.8.6 shows the yielding in the NE gusset plate at the end of the moderate drift
range at -1.34%. The tension yield lines are easier to see while the compression yield
lines are most noticeable only where they intersect the tension yield lines, and small
pieces of whitewash have flaked off. Also shown in Figure 5.8.6 is the SW gusset plate
which has displayed slightly more yielding.
Figure 5.8.6 – Gusset Plates Condition at End of Moderate Drift Range (-1.34%)
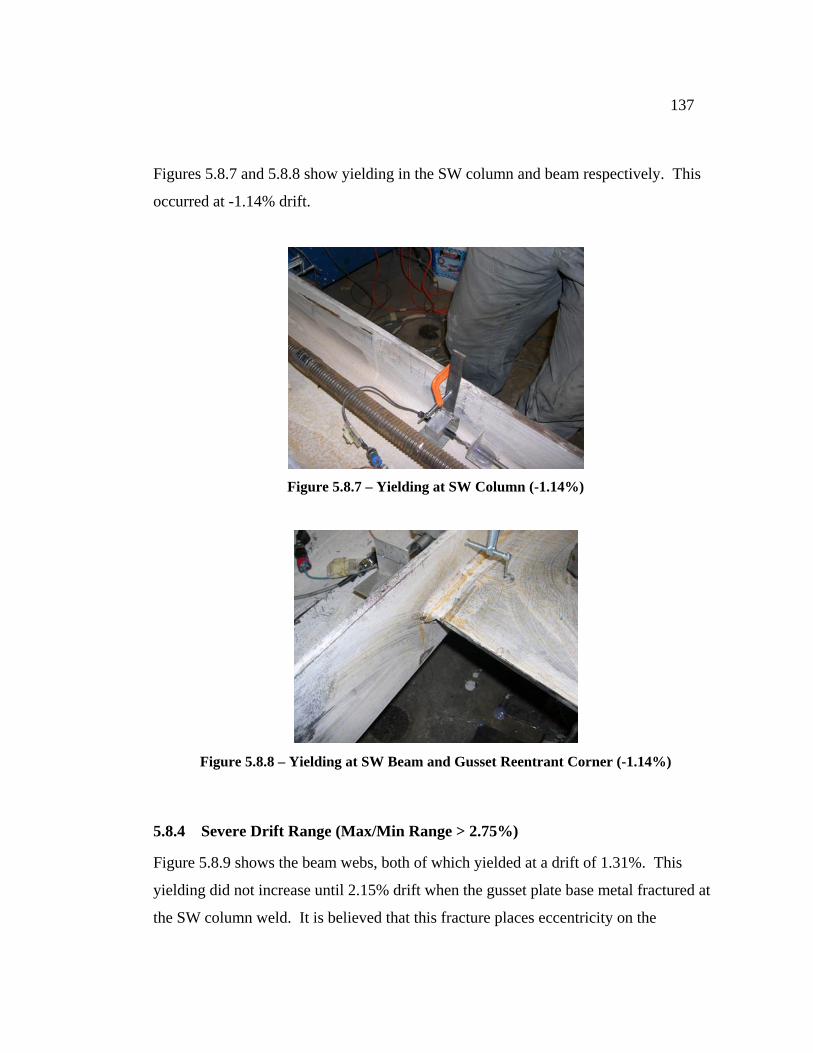
137
Figures 5.8.7 and 5.8.8 show yielding in the SW column and beam respectively. This
occurred at -1.14% drift.
Figure 5.8.7 – Yielding at SW Column (-1.14%)
Figure 5.8.8 – Yielding at SW Beam and Gusset Reentrant Corner (-1.14%)
5.8.4 Severe Drift Range (Max/Min Range > 2.75%)
Figure 5.8.9 shows the beam webs, both of which yielded at a drift of 1.31%. This
yielding did not increase until 2.15% drift when the gusset plate base metal fractured at
the SW column weld. It is believed that this fracture places eccentricity on the

138
connection adding stresses to the connection at the beam weld. This added stress was
enough to buckle the SW beam web and therefore yield the web shown in Figure 5.8.10.
Figure 5.8.9 – Yielding at Beam Webs (1.31%)
Figure 5.8.10 – Y3 and B1 of SW Beam Web (2.15%)
At a drift ratio of 1.77%, the base metal of both of the gusset plates at the columns
cracked. During the subsequent compression cycle at a drift of -2.31% these cracks
grew to six inches in the gusset plate at the NE column and 4 inches in the gusset plate
at the SW column, as shown in Figure 5.8.11 and 5.8.12, respectively. Also, significant
yielding, Y5, occurred in both gusset plates from the hinging at this drift level, shown in
Figure 5.8.13.

139
Figure 5.8.11 – 6” Base Metal Crack in Gusset at NE Column (-2.31%)
Figure 5.8.12 – 4” Base Metal Crack in Gusset at SW Column (-2.31%)
Figure 5.8.13 – Y5 of Gusset Plates (-2.31%)

140
The cracks in the base metal of the gusset plates did not propagate significantly during
successive tension cycles, only during compression cycles. The NE gusset at the
column fractured to a length of 15 inches at a drift of -2.79%, as shown in Figure
5.8.14. This crack seemed to affect the compression capacity of the system as it was
only able to support -127 kips. A table summarizing the weld and base metal damage is
shown in Table 5.8.2.
Figure 5.8.14 – 15” Base Metal Fracture (-2.79%)
Table 5.8.2 – HSS-17 Weld/Base Metal Damage Summary
At a drift of -2.31% brace cupping occurred, as shown in Figure 5.8.15. At a drift ratio
of 2.15%, low cycle fatigue cracks developed at the bottom of the brace, as shown in
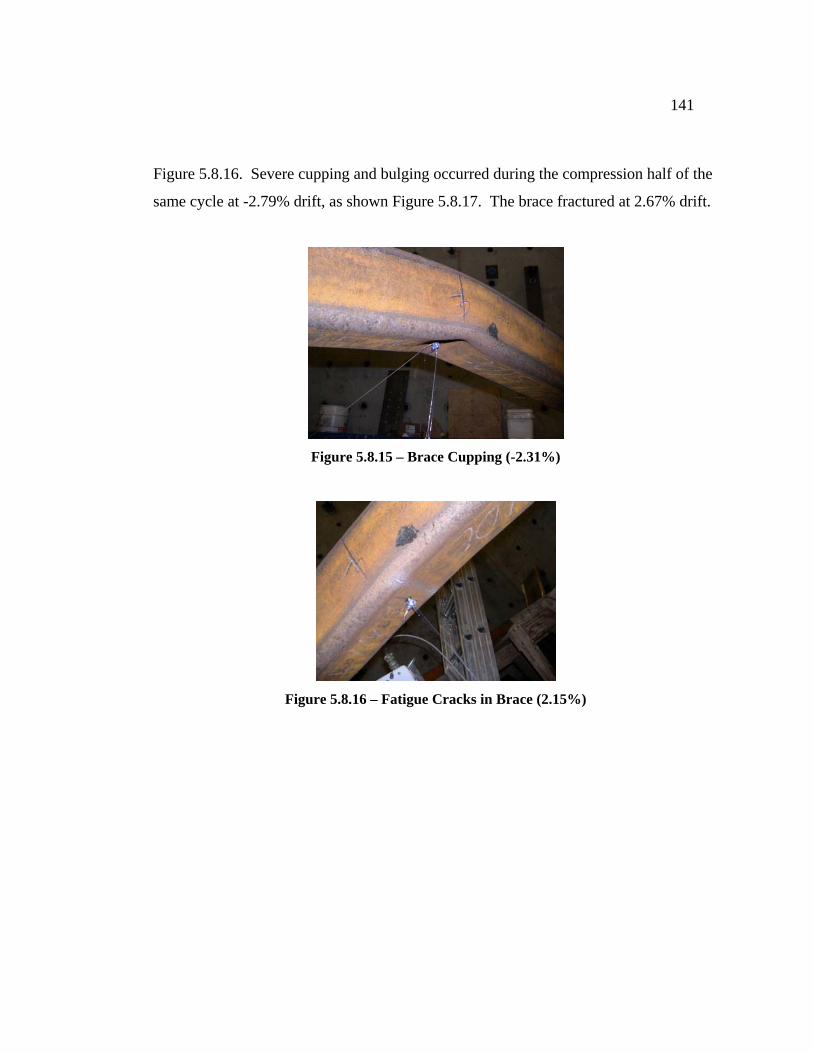
141
Figure 5.8.16. Severe cupping and bulging occurred during the compression half of the
same cycle at -2.79% drift, as shown Figure 5.8.17. The brace fractured at 2.67% drift.
Figure 5.8.15 – Brace Cupping (-2.31%)
Figure 5.8.16 – Fatigue Cracks in Brace (2.15%)

142
Figure 5.8.17 – Local Failure in Brace (-2.79%)
5.8.5 Specimen Summary
Overall, HSS-17 performed very well. The frame achieved a range of drifts from
-2.79% to 2.15% for a total range of 4.94%, one of the best for all 17 tests. Its drift
capacity is attributed to the very low in and out-of-plane stiffness of the gusset plates.
One thing of concern is the cracks in the base metal at the gusset plate welds. A 15 inch
crack on a 16 inch connection may be a warning flag. However, this base metal crack
length occurred at a drift level of -2.79% in compression after it had already sustained a
positive drift of 2.15%. A picture of the gusset plate at the end of the test is shown in
Figure 5.8.18.
Figure 5.8.18 – NE Gusset Plate (End of Test)

143
5.9 Hysteretic Envelope Comparison
Figure 5.9.1 shows the envelopes of the hysteretic curves for all of the specimens in the
positive drift region. Figure 5.9.2 shows the envelopes of the hysteretic curves for all of
the specimens in the negative drift region.
Figure 5.9.1 – Positive Hysteretic Envelopes
Figure 5.9.1 shows that while the specimens were in the elastic range, they had similar
strength and stiffness, but these characteristics started to diverge from one another as
the specimens started to respond inelastically when higher displacement was applied.
The only difference in all of the specimens during the elastic phase was the higher
stiffness of HSS-12 compared to the other specimens. The slipping of the bolts in
HSS-16 is quite obvious around 0.5% drift ratio and this slipping affected the strength
of the specimen for the entire length of the test. Of the remaining five tests (excluding
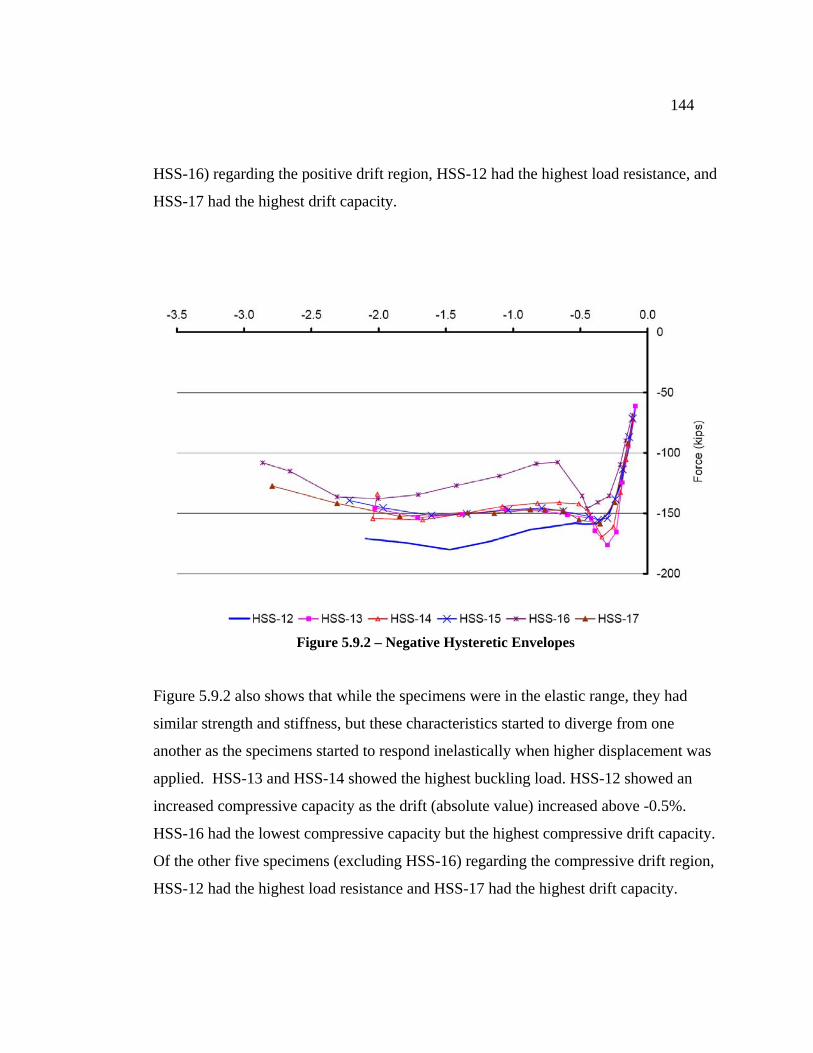
144
HSS-16) regarding the positive drift region, HSS-12 had the highest load resistance, and
HSS-17 had the highest drift capacity.
Figure 5.9.2 – Negative Hysteretic Envelopes
Figure 5.9.2 also shows that while the specimens were in the elastic range, they had
similar strength and stiffness, but these characteristics started to diverge from one
another as the specimens started to respond inelastically when higher displacement was
applied. HSS-13 and HSS-14 showed the highest buckling load. HSS-12 showed an
increased compressive capacity as the drift (absolute value) increased above -0.5%.
HSS-16 had the lowest compressive capacity but the highest compressive drift capacity.
Of the other five specimens (excluding HSS-16) regarding the compressive drift region,
HSS-12 had the highest load resistance and HSS-17 had the highest drift capacity.
145
Chapter 6: Analysis of Results
6.0 Introduction
The purpose of this chapter is to compare the results of the experiments described in the
previous chapter (HSS-12 through HSS-17) and determine how the gusset plate designs
influenced the specimen behavior. There are multiple ways to compare the different
experiments. These include comparisons between their ultimate drift or inelastic
deformation capacity (Section 6.1), the behavior of the steel at given drift or
performance levels (Section 6.2), their load capacity (Section 6.3), the magnitude of
their energy dissipation (Section 6.4), and their constructability (Section 6.5)
These categories do not all carry the same weight. The actual balance of these criteria
will depend on the seismic risk or hazard, the seismic design criteria, and the
performance objective. Ultimately, the goals of the structure are laid out in the
performance based design guidelines. The performance objectives are: Immediate
Occupancy, Life Safety, and Collapse Prevention. They are assigned as performance
requirements of a building (structural and non-structural) at certain drift levels
depending on the use of the building.
Many of the comparisons between these specimens have been made with the data
acquired during testing. Much of this data had to be manipulated into useful
information. Detailed calculations showing these manipulations are located in
Appendix D.
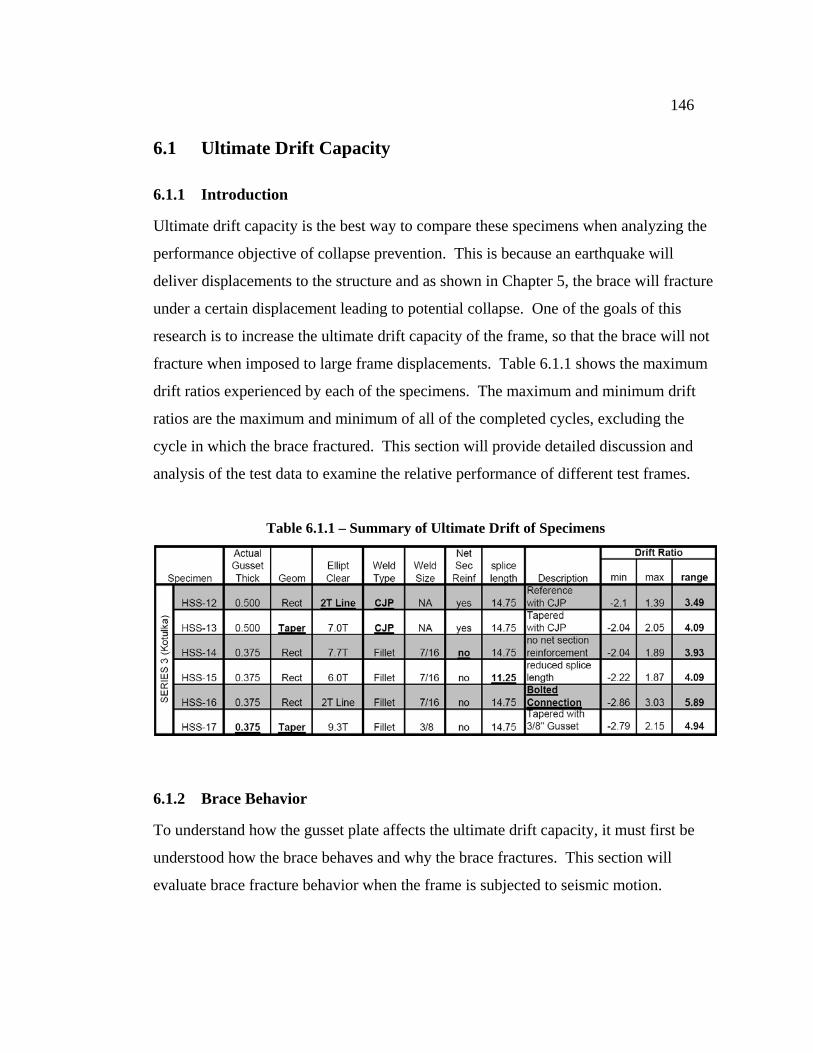
146
6.1 Ultimate Drift Capacity
6.1.1 Introduction
Ultimate drift capacity is the best way to compare these specimens when analyzing the
performance objective of collapse prevention. This is because an earthquake will
deliver displacements to the structure and as shown in Chapter 5, the brace will fracture
under a certain displacement leading to potential collapse. One of the goals of this
research is to increase the ultimate drift capacity of the frame, so that the brace will not
fracture when imposed to large frame displacements. Table 6.1.1 shows the maximum
drift ratios experienced by each of the specimens. The maximum and minimum drift
ratios are the maximum and minimum of all of the completed cycles, excluding the
cycle in which the brace fractured. This section will provide detailed discussion and
analysis of the test data to examine the relative performance of different test frames.
Table 6.1.1 – Summary of Ultimate Drift of Specimens
6.1.2 Brace Behavior
To understand how the gusset plate affects the ultimate drift capacity, it must first be
understood how the brace behaves and why the brace fractures. This section will
evaluate brace fracture behavior when the frame is subjected to seismic motion.
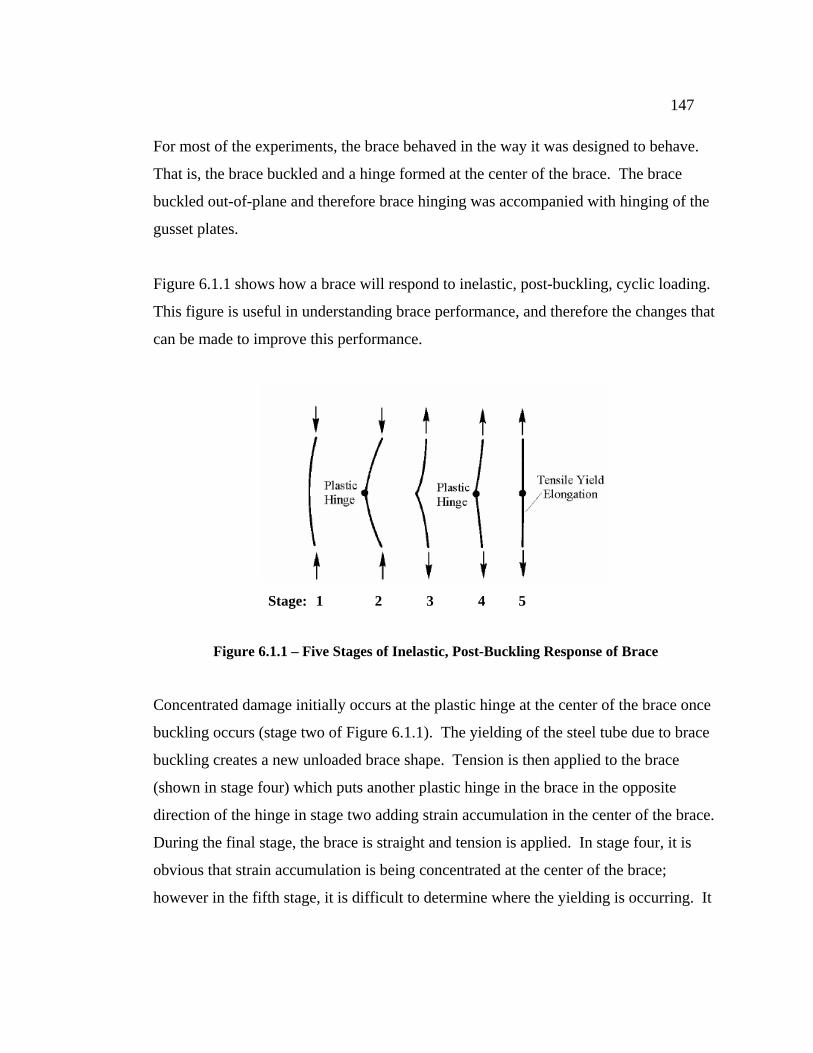
147
For most of the experiments, the brace behaved in the way it was designed to behave.
That is, the brace buckled and a hinge formed at the center of the brace. The brace
buckled out-of-plane and therefore brace hinging was accompanied with hinging of the
gusset plates.
Figure 6.1.1 shows how a brace will respond to inelastic, post-buckling, cyclic loading.
This figure is useful in understanding brace performance, and therefore the changes that
can be made to improve this performance.
Stage: 1 2 3 4 5
Figure 6.1.1 – Five Stages of Inelastic, Post-Buckling Response of Brace
Concentrated damage initially occurs at the plastic hinge at the center of the brace once
buckling occurs (stage two of Figure 6.1.1). The yielding of the steel tube due to brace
buckling creates a new unloaded brace shape. Tension is then applied to the brace
(shown in stage four) which puts another plastic hinge in the brace in the opposite
direction of the hinge in stage two adding strain accumulation in the center of the brace.
During the final stage, the brace is straight and tension is applied. In stage four, it is
obvious that strain accumulation is being concentrated at the center of the brace;
however in the fifth stage, it is difficult to determine where the yielding is occurring. It
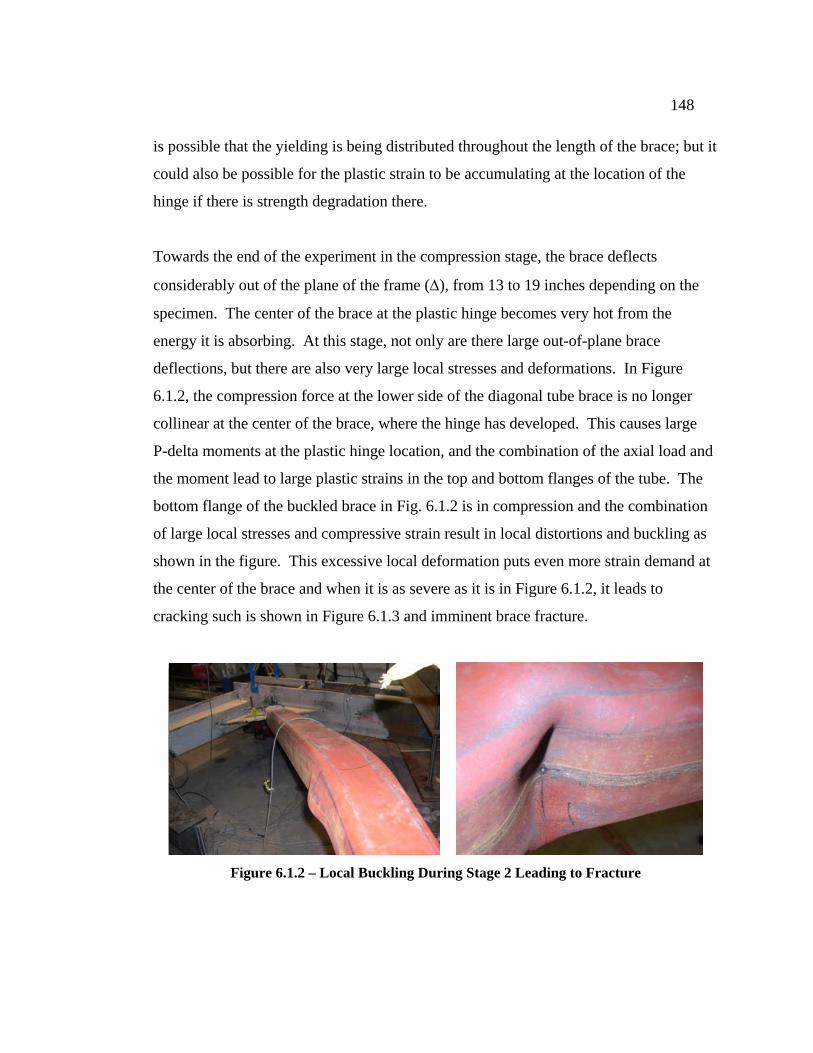
148
is possible that the yielding is being distributed throughout the length of the brace; but it
could also be possible for the plastic strain to be accumulating at the location of the
hinge if there is strength degradation there.
Towards the end of the experiment in the compression stage, the brace deflects
considerably out of the plane of the frame (Δ), from 13 to 19 inches depending on the
specimen. The center of the brace at the plastic hinge becomes very hot from the
energy it is absorbing. At this stage, not only are there large out-of-plane brace
deflections, but there are also very large local stresses and deformations. In Figure
6.1.2, the compression force at the lower side of the diagonal tube brace is no longer
collinear at the center of the brace, where the hinge has developed. This causes large
P-delta moments at the plastic hinge location, and the combination of the axial load and
the moment lead to large plastic strains in the top and bottom flanges of the tube. The
bottom flange of the buckled brace in Fig. 6.1.2 is in compression and the combination
of large local stresses and compressive strain result in local distortions and buckling as
shown in the figure. This excessive local deformation puts even more strain demand at
the center of the brace and when it is as severe as it is in Figure 6.1.2, it leads to
cracking such is shown in Figure 6.1.3 and imminent brace fracture.
Figure 6.1.2 – Local Buckling During Stage 2 Leading to Fracture
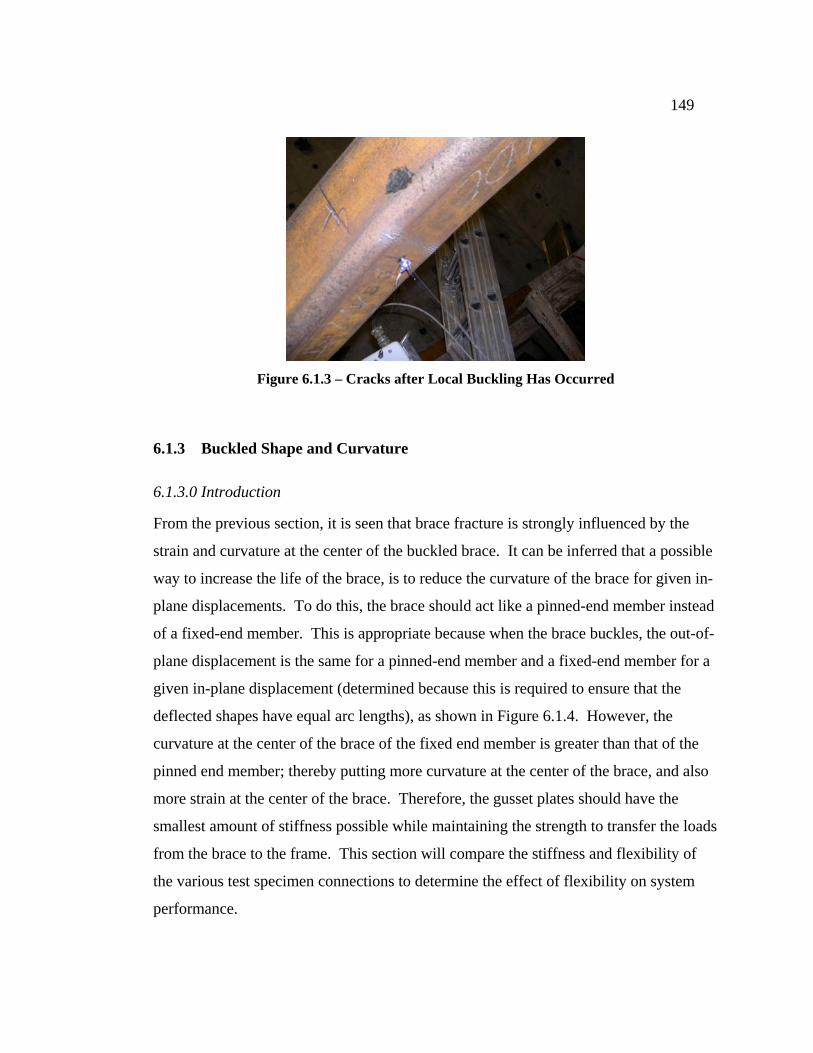
149
Figure 6.1.3 – Cracks after Local Buckling Has Occurred
6.1.3 Buckled Shape and Curvature
6.1.3.0 Introduction
From the previous section, it is seen that brace fracture is strongly influenced by the
strain and curvature at the center of the buckled brace. It can be inferred that a possible
way to increase the life of the brace, is to reduce the curvature of the brace for given in-
plane displacements. To do this, the brace should act like a pinned-end member instead
of a fixed-end member. This is appropriate because when the brace buckles, the out-of-
plane displacement is the same for a pinned-end member and a fixed-end member for a
given in-plane displacement (determined because this is required to ensure that the
deflected shapes have equal arc lengths), as shown in Figure 6.1.4. However, the
curvature at the center of the brace of the fixed end member is greater than that of the
pinned end member; thereby putting more curvature at the center of the brace, and also
more strain at the center of the brace. Therefore, the gusset plates should have the
smallest amount of stiffness possible while maintaining the strength to transfer the loads
from the brace to the frame. This section will compare the stiffness and flexibility of
the various test specimen connections to determine the effect of flexibility on system
performance.

150
Figure 6.1.4 – Buckled Shape Comparison at a Given In-Plane Displacement
This idea of allowing restraint free gusset plate rotation was realized by Astaneh-Asl
and is incorporated in the AISC Seismic Provisions with the 2t offset requirement
shown in Figure 6.1.5. The idea behind the provision is to allow a straight hinge line to
form in the gusset plate. However, when this idea is combined with the buckling
requirements of the gusset plate, the gusset plate must be thicker to resist buckling.
Conversely, if the brace is allowed to end at a location closer to the beam-column
intersection, the gusset plate buckling length is reduced and therefore, a relatively
thinner plate will suffice.
Figure 6.1.5 – 2t Clearance

151
6.1.3.1 Deflected Shape
Comparisons of the deflected shape of the brace are shown in Figure 6.1.6 at a drift of
0.35%, Figure 6.1.7 at a drift of 1.5%. , and Figure 6.1.8 at brace cupping. Specimen
HSS-14 buckled down and the data is not available for this specimen at a drift of 1.5%.
HSS-16 did not buckle at the center of the brace and therefore, the data is not available
at brace cupping.
Figure 6.1.6 – Deflected Shape at -0.35% Drift
None of the braces in any of the specimens even reached the state of B1 at this drift
ratio. There is still out-of-plane deflection as shown in the figure. However the
resulting shapes are more likely due to as-built condition (with differing initial
eccentricities) than the stiffness of the gusset plate.
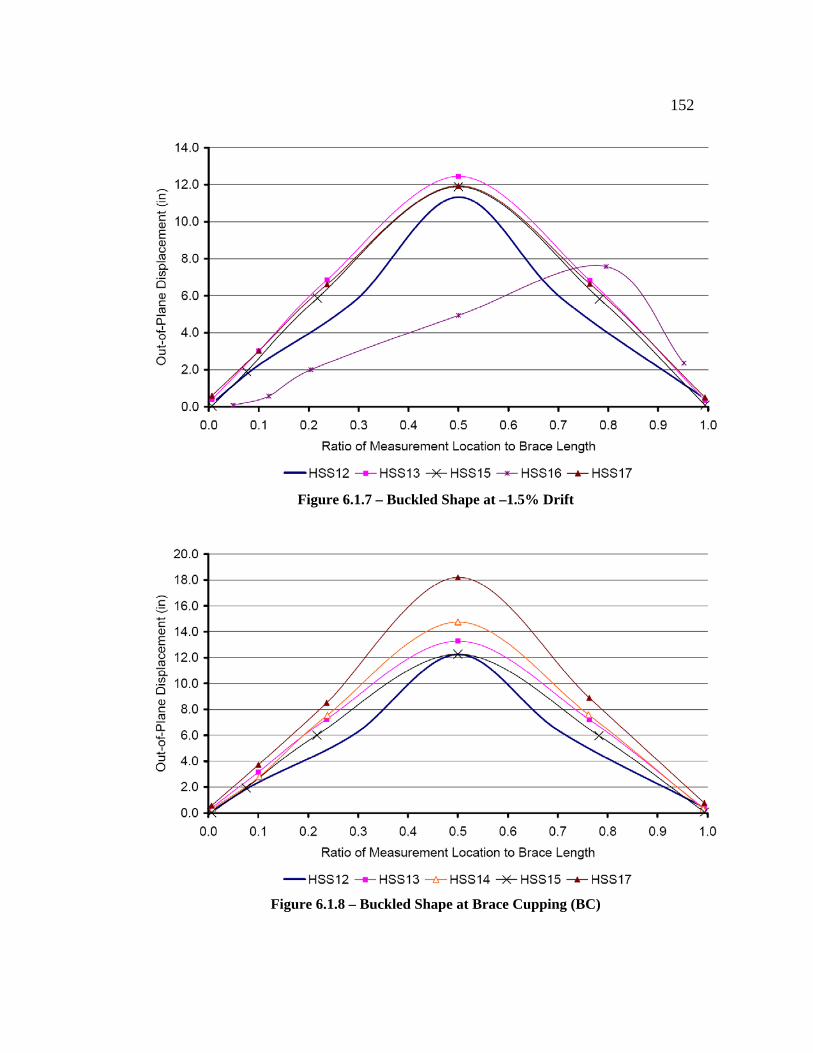
152
Figure 6.1.7 – Buckled Shape at –1.5% Drift
Figure 6.1.8 – Buckled Shape at Brace Cupping (BC)
153
Figure 6.1.7 and Figure 6.1.8 are much more valuable than the previous figure. This is
because the differing eccentricities from the as-built conditions of the specimens are
negligible compared to the larger out-of-plane displacements of the brace. At the drift
of -1.5%, the out-of-plane displacements of the specimens at midspan of the brace are
quite close. This provides empirical evidence that regardless of the buckled shape and
end plate rotation, the out-of-plane displacements will be equal at a given drift ratio.
More significant than the similar out-of-plane displacements shown in Figure 6.1.7, is
the different shapes of the buckled braces also portrayed in this figure. The buckled
shape of HSS-12, which has the thicker, larger plate, is showing double curvature.
Thus, there is a larger curvature at the center of the brace, leading to higher strain
accumulation. This also caused brace cupping at a low drift level, leading to cracking
of the brace, and eventual fracture. Figure 6.1.8 shows the deflected brace shapes at
brace cupping, and it can be seen that HSS-12 did not reach a very high out-of-plane
displacement when cupping occurred. It is apparent that the current 2t linear clearance
model does not assure the end rotation capacity needed to obtain optimal ductility from
the brace.
Conversely, the other three frames in Figure 6.1.7 (excluding HSS-16) show they are
bent in single curvature. This reduces the curvature at the center of the brace, and also
the strain. Therefore, brace cupping occurs at higher drifts associated with higher out-
of-plane displacements (Figure 6.1.8).
6.1.3.2 Out-of-Plane Displacement
Figure 6.1.9 and 6.1.10 show the out-of-plane displacement as a function of the drift
ratio and as a function of the total drift range, respectively. All the specimens (except
HSS-16) increase in out-of-plane displacement just about equally as the drift increases.
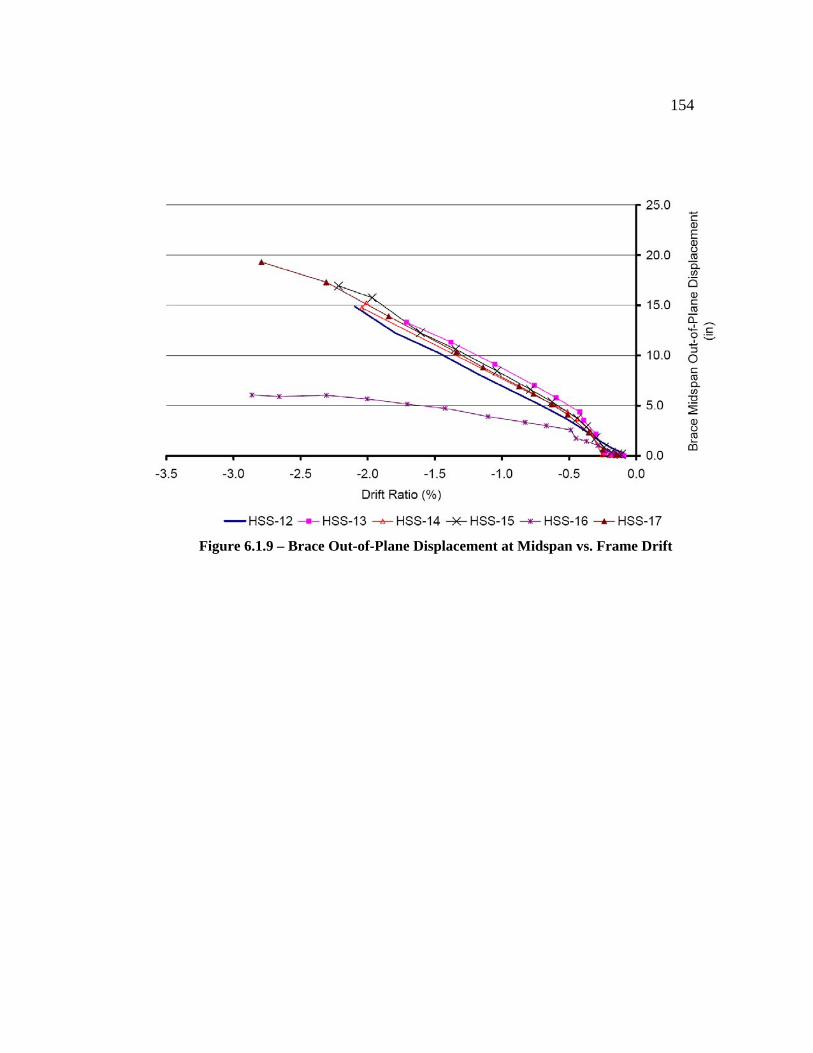
154
Figure 6.1.9 – Brace Out-of-Plane Displacement at Midspan vs. Frame Drift

155
Figure 6.1.10 – Brace Out-of-Plane Displacement at Midspan vs. Drift Range
Both graphs show that HSS-12 has a slightly smaller out-of-plane displacement than the
other four tests (except HSS-16). This is due to the fact the HSS-12 had shortened a
little more than the other specimens from the relatively higher lateral load it was
resisting (Figure 5.9.2 shows the higher load that HSS-12 resisted in the negative drift
range). This was due to the double curvature of the brace. Since the brace was slightly
shorter from the higher axial load, the out-of-plane displacement was a little less at a
given drift ratio as shown in the graphs.
6.1.3.3 Gusset Plate Qualitative Comparison
The four tests, HSS-13, HSS-14, HSS-15 and HSS-17 more closely demonstrate the
buckled shape of a pinned-end member than the buckled shape of HSS-12. Qualitative
stiffness comparisons are presented in Section 6.1.3.3a between HSS-13 and HSS-17,

156
and in Section 6.1.3.3b between HSS-14 and HSS-17. The rotational strength of plates
using an elliptical clearance is examined in Section 6.1.3.3c.
6.1.3.3a Gusset Plate Qualitative Stiffness Comparison between HSS-13 and HSS-17
A simple comparison is made here between HSS-13 and HSS-17. These specimens had
the same gusset plate geometry, except HSS-13 used a 1/2 inch gusset plate, while
HSS-17 used a 3/8 inch gusset plate. The equation shown below from Yoo (2006) can
be used to compare their stiffness:
⎟⎟⎠
⎞⎜⎜⎝
⎛=
12
3tWLEK w
averotational (6.1)
For more information on this equation, see Yoo (2006). All of the variables are equal
except the value of t. Therefore, HSS-13 had a stiffer gusset plate (in the out-of-plane
direction) than HSS-17 by a factor of:
37.2)8/3()2/1(
3
3
317
313 ===−
−
HSS
HSSrelative t
tK (6.2)
HSS-13 had a drift ratio range of 4.09% compared to 4.94% for HSS-17. This further
supports the idea that a stiffer gusset plate will shorten the drift life of the brace and
hinder the ultimate drift range of the frame.
6.1.3.3b Gusset Plate Qualitative Stiffness Comparison between HSS-14 and HSS-17
Because the gusset plate is not a longitudinal member, it is more accurate to compare
gusset plate stiffnesses with a three dimensional analysis. The equation above (used for
similar geometries) and the one shown here from Johnson (2005):
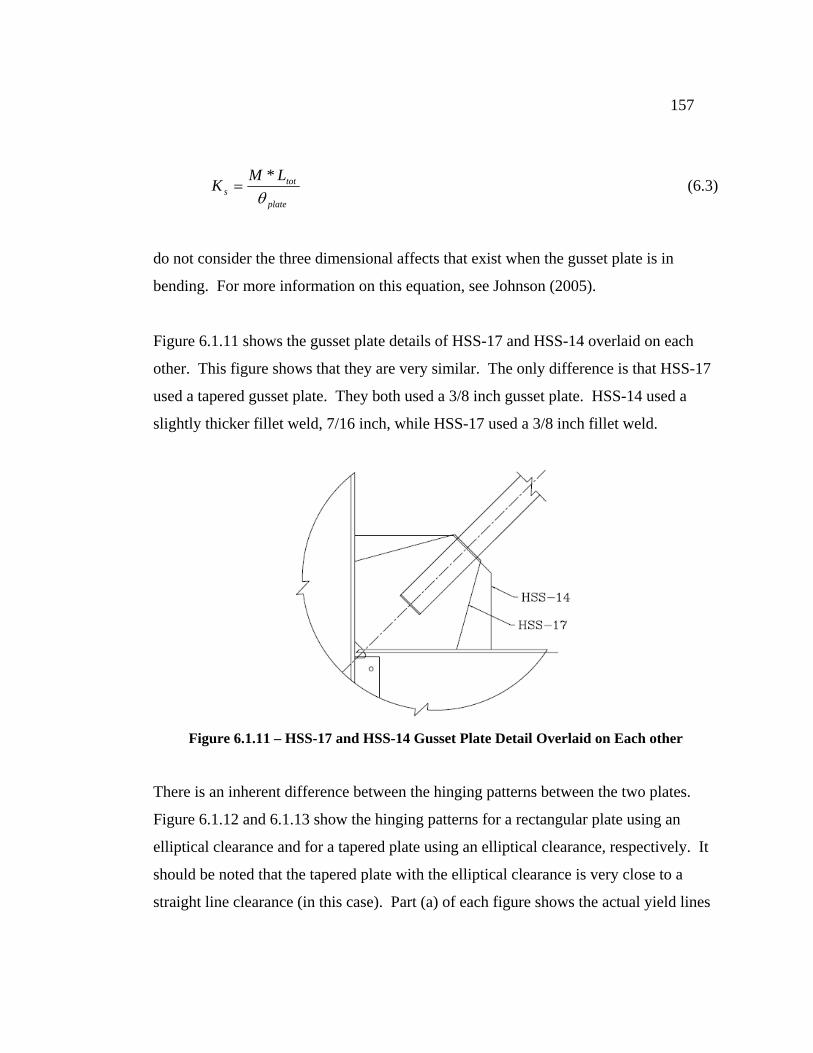
157
plate
tots
LMK
θ*
= (6.3)
do not consider the three dimensional affects that exist when the gusset plate is in
bending. For more information on this equation, see Johnson (2005).
Figure 6.1.11 shows the gusset plate details of HSS-17 and HSS-14 overlaid on each
other. This figure shows that they are very similar. The only difference is that HSS-17
used a tapered gusset plate. They both used a 3/8 inch gusset plate. HSS-14 used a
slightly thicker fillet weld, 7/16 inch, while HSS-17 used a 3/8 inch fillet weld.
Figure 6.1.11 – HSS-17 and HSS-14 Gusset Plate Detail Overlaid on Each other
There is an inherent difference between the hinging patterns between the two plates.
Figure 6.1.12 and 6.1.13 show the hinging patterns for a rectangular plate using an
elliptical clearance and for a tapered plate using an elliptical clearance, respectively. It
should be noted that the tapered plate with the elliptical clearance is very close to a
straight line clearance (in this case). Part (a) of each figure shows the actual yield lines
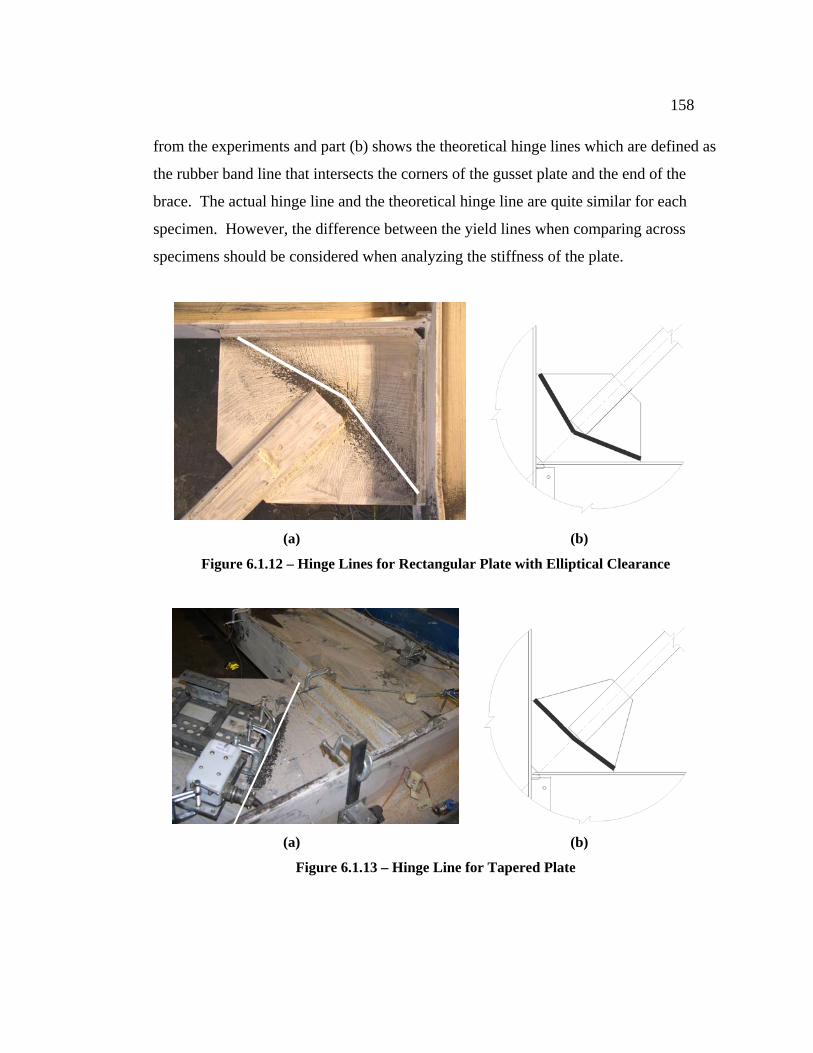
158
from the experiments and part (b) shows the theoretical hinge lines which are defined as
the rubber band line that intersects the corners of the gusset plate and the end of the
brace. The actual hinge line and the theoretical hinge line are quite similar for each
specimen. However, the difference between the yield lines when comparing across
specimens should be considered when analyzing the stiffness of the plate.
(a) (b)
Figure 6.1.12 – Hinge Lines for Rectangular Plate with Elliptical Clearance
(a) (b)
Figure 6.1.13 – Hinge Line for Tapered Plate
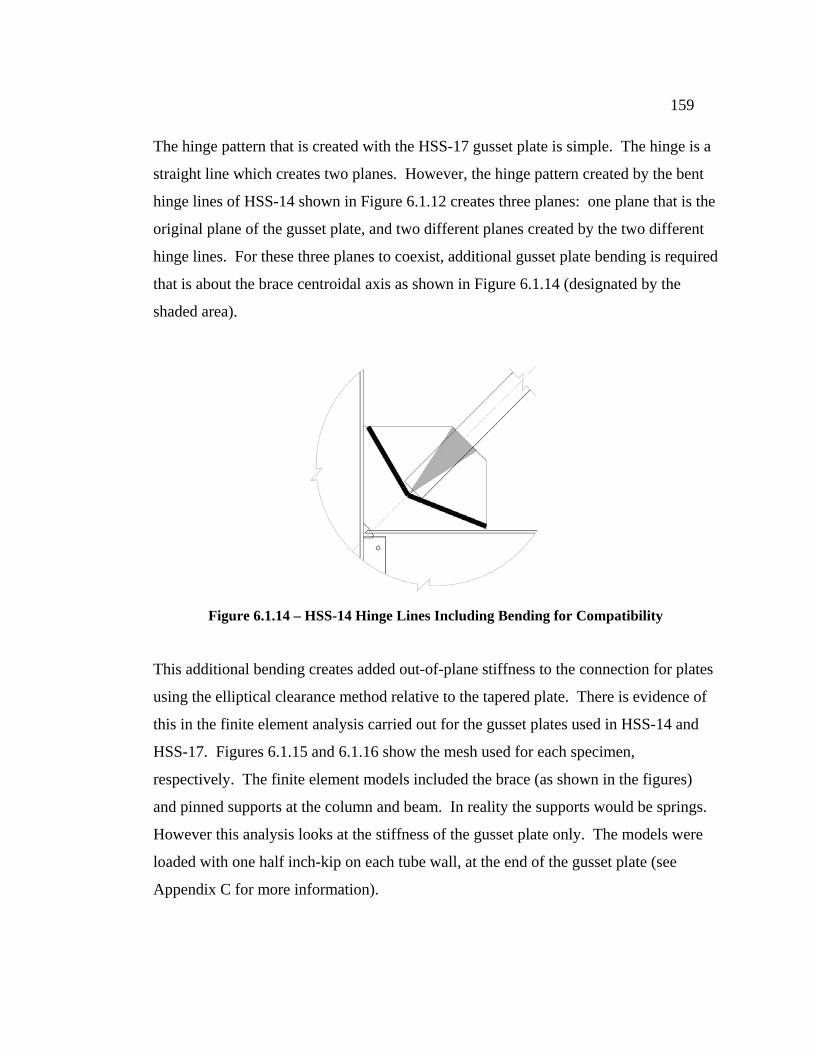
159
The hinge pattern that is created with the HSS-17 gusset plate is simple. The hinge is a
straight line which creates two planes. However, the hinge pattern created by the bent
hinge lines of HSS-14 shown in Figure 6.1.12 creates three planes: one plane that is the
original plane of the gusset plate, and two different planes created by the two different
hinge lines. For these three planes to coexist, additional gusset plate bending is required
that is about the brace centroidal axis as shown in Figure 6.1.14 (designated by the
shaded area).
Figure 6.1.14 – HSS-14 Hinge Lines Including Bending for Compatibility
This additional bending creates added out-of-plane stiffness to the connection for plates
using the elliptical clearance method relative to the tapered plate. There is evidence of
this in the finite element analysis carried out for the gusset plates used in HSS-14 and
HSS-17. Figures 6.1.15 and 6.1.16 show the mesh used for each specimen,
respectively. The finite element models included the brace (as shown in the figures)
and pinned supports at the column and beam. In reality the supports would be springs.
However this analysis looks at the stiffness of the gusset plate only. The models were
loaded with one half inch-kip on each tube wall, at the end of the gusset plate (see
Appendix C for more information).
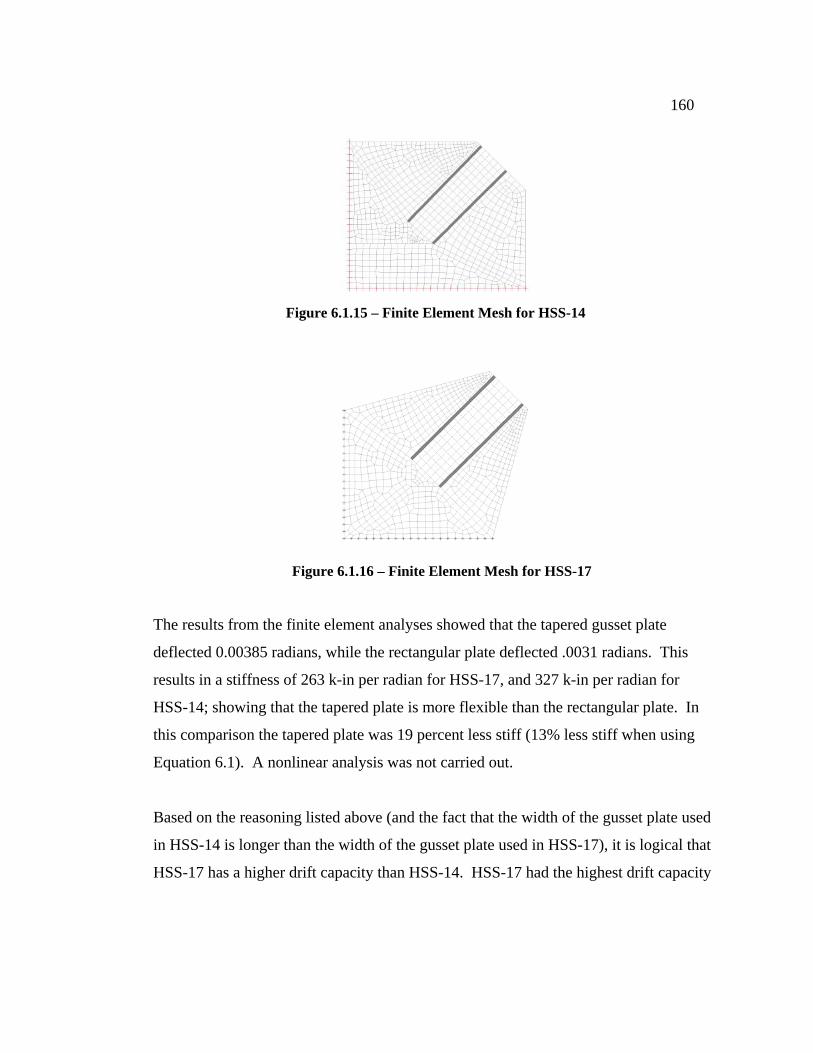
160
Figure 6.1.15 – Finite Element Mesh for HSS-14
Figure 6.1.16 – Finite Element Mesh for HSS-17
The results from the finite element analyses showed that the tapered gusset plate
deflected 0.00385 radians, while the rectangular plate deflected .0031 radians. This
results in a stiffness of 263 k-in per radian for HSS-17, and 327 k-in per radian for
HSS-14; showing that the tapered plate is more flexible than the rectangular plate. In
this comparison the tapered plate was 19 percent less stiff (13% less stiff when using
Equation 6.1). A nonlinear analysis was not carried out.
Based on the reasoning listed above (and the fact that the width of the gusset plate used
in HSS-14 is longer than the width of the gusset plate used in HSS-17), it is logical that
HSS-17 has a higher drift capacity than HSS-14. HSS-17 had the highest drift capacity
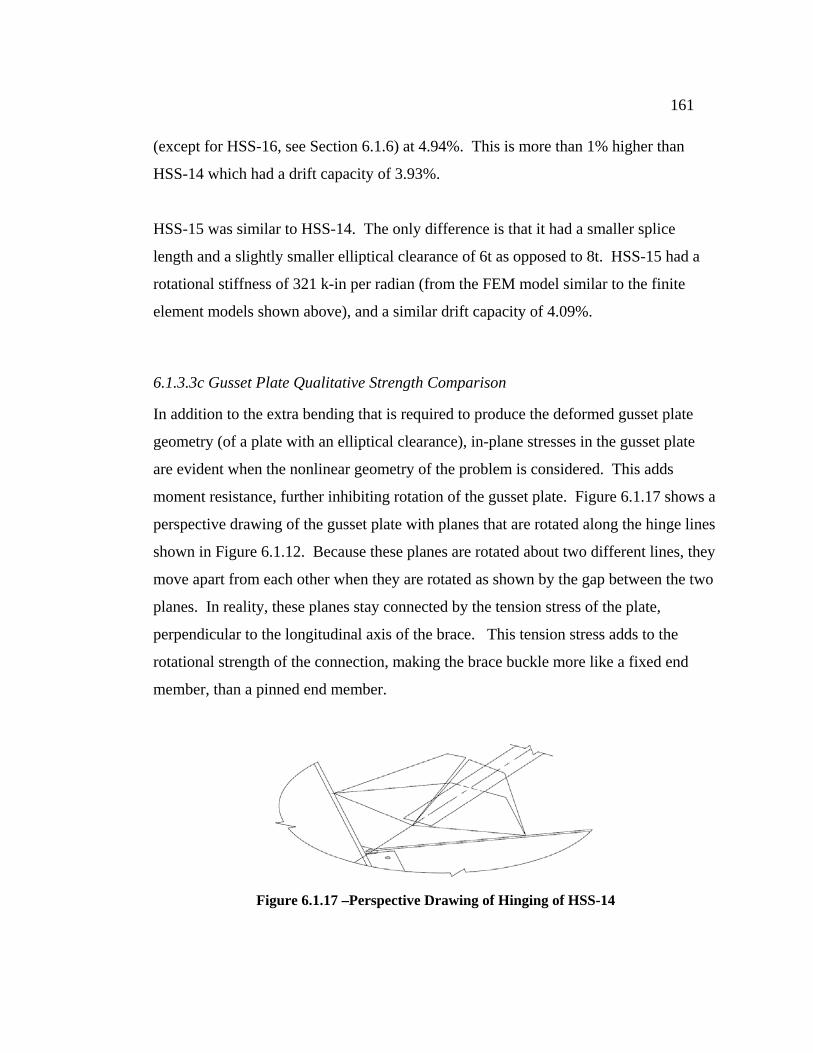
161
(except for HSS-16, see Section 6.1.6) at 4.94%. This is more than 1% higher than
HSS-14 which had a drift capacity of 3.93%.
HSS-15 was similar to HSS-14. The only difference is that it had a smaller splice
length and a slightly smaller elliptical clearance of 6t as opposed to 8t. HSS-15 had a
rotational stiffness of 321 k-in per radian (from the FEM model similar to the finite
element models shown above), and a similar drift capacity of 4.09%.
6.1.3.3c Gusset Plate Qualitative Strength Comparison
In addition to the extra bending that is required to produce the deformed gusset plate
geometry (of a plate with an elliptical clearance), in-plane stresses in the gusset plate
are evident when the nonlinear geometry of the problem is considered. This adds
moment resistance, further inhibiting rotation of the gusset plate. Figure 6.1.17 shows a
perspective drawing of the gusset plate with planes that are rotated along the hinge lines
shown in Figure 6.1.12. Because these planes are rotated about two different lines, they
move apart from each other when they are rotated as shown by the gap between the two
planes. In reality, these planes stay connected by the tension stress of the plate,
perpendicular to the longitudinal axis of the brace. This tension stress adds to the
rotational strength of the connection, making the brace buckle more like a fixed end
member, than a pinned end member.
Figure 6.1.17 –Perspective Drawing of Hinging of HSS-14

162
6.1.3.4 Gusset Plate Plastic Rotation Comparison
Figures 6.1.18 and 6.1.19 show the NE gusset plate rotation and the SW gusset plate
rotation respectively, as a function of the drift ratio. These graphs show a
representation of how flexible the gusset plates are and how much rotation they allow at
high drift levels. Calculations for determining the gusset plate rotation are shown in
Appendix D.
Figure 6.1.18 – NE Gusset Plate Rotation vs. Story Drift

163
Figure 6.1.19 – SW Gusset Plate Rotation vs. Story Drift
Both of the gusset plates used with HSS-12 show considerably less rotation than the
other gusset plates. For example, at a drift ratio of -2.0%, the rotation of the gusset
plates used for HSS-12 is about 0.11 radians. However, the other specimens (excluding
HSS-16, see Section 6.1.6) average a rotation of about 0.18 radians.
The out-of-plane displacements for pinned-end members and fixed-end members are
equal at a given in-plane displacement of the brace as described in Section 6.1.3.0
(neglecting the axial shortening due to the load which is a small portion of displacement
at higher displacements). Therefore, in order for the brace in HSS-12, which has a
stiffer and stronger gusset plate connection, to reach the same out-of-plane
displacement, the brace must be bent in double curvature. As mentioned before, the
double curvature leads to higher strains in the bottom of the brace. These strains
eventually lead to brace fracture, causing HSS-12 to have a short drift life relative to the
other specimens.

164
Conversely, the gusset plates used in HSS-17 reached the highest rotation of all of the
specimens. This led to reduced curvature at the center of the brace (at a given drift
ratio), and lower strain demand. HSS-17 had a drift ratio range of 4.94%, second only
to HSS-16 of these six tests (Recall that HSS-16 suffered large rotations at the bolted
extension plate and is therefore not representative of typical brace-gusset behavior).
In conclusion, the specimens that allowed larger gusset plate plastic rotations reduced
the curvature at the center of the brace. The gusset plates that allowed the higher
rotations were also the gusset plates that were less stiff, (i.e. HSS-13, HSS-14, HSS-15
and HSS-17).
6.1.3.5 Summary
From the ultimate drift capacity results, the tapered plates performed better than the
rectangular plates. This is partly due to the fact that they had a smaller end rotational
stiffness than the rectangular plates with the elliptical clearance (when all else is equal).
Of all of the specimens, HSS-12 had the smallest drift ratio range. This was partly
because although the 2t requirement creates a straight forward hinging pattern, the
thickness of the plate required to resist gusset plate buckling had a larger effect on the
gusset plate stiffness and rotational allowance. The resulting stiff gusset plate increased
the curvature of the buckled brace at midspan, at a given drift ratio, which led to early
fracture.
A table showing the stiffness of the connections from finite element analyses of selected
specimens is shown here:
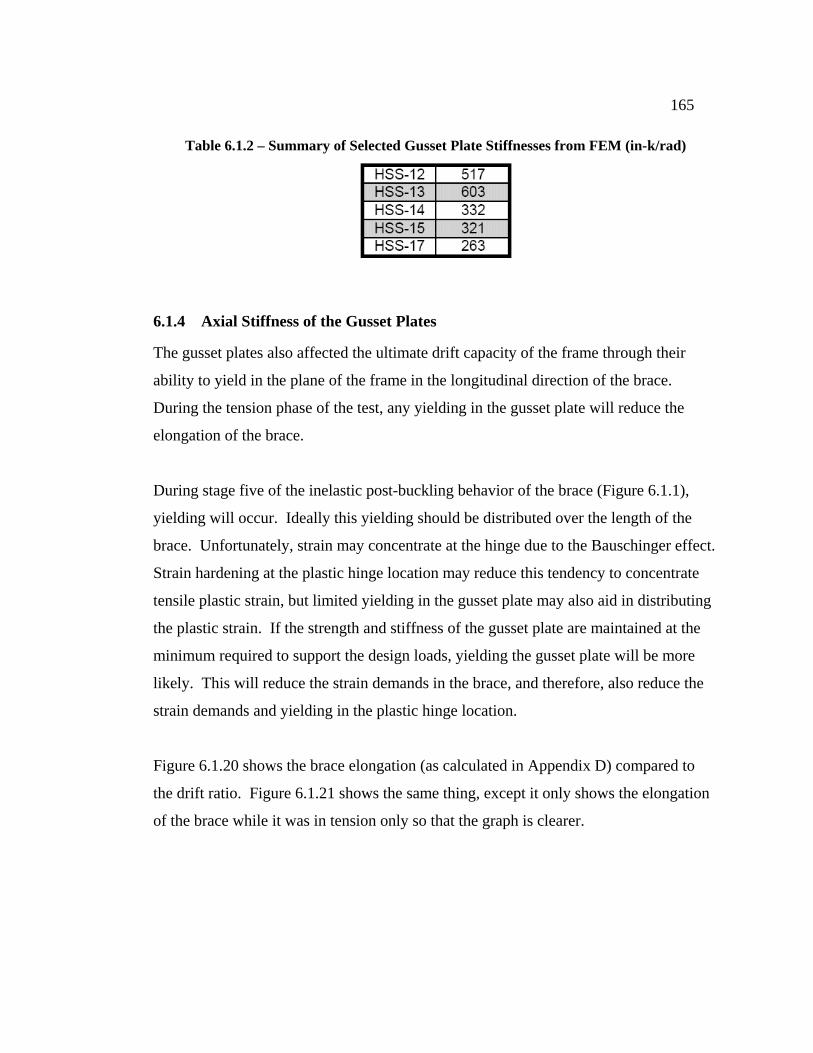
165
Table 6.1.2 – Summary of Selected Gusset Plate Stiffnesses from FEM (in-k/rad)
6.1.4 Axial Stiffness of the Gusset Plates
The gusset plates also affected the ultimate drift capacity of the frame through their
ability to yield in the plane of the frame in the longitudinal direction of the brace.
During the tension phase of the test, any yielding in the gusset plate will reduce the
elongation of the brace.
During stage five of the inelastic post-buckling behavior of the brace (Figure 6.1.1),
yielding will occur. Ideally this yielding should be distributed over the length of the
brace. Unfortunately, strain may concentrate at the hinge due to the Bauschinger effect.
Strain hardening at the plastic hinge location may reduce this tendency to concentrate
tensile plastic strain, but limited yielding in the gusset plate may also aid in distributing
the plastic strain. If the strength and stiffness of the gusset plate are maintained at the
minimum required to support the design loads, yielding the gusset plate will be more
likely. This will reduce the strain demands in the brace, and therefore, also reduce the
strain demands and yielding in the plastic hinge location.
Figure 6.1.20 shows the brace elongation (as calculated in Appendix D) compared to
the drift ratio. Figure 6.1.21 shows the same thing, except it only shows the elongation
of the brace while it was in tension only so that the graph is clearer.
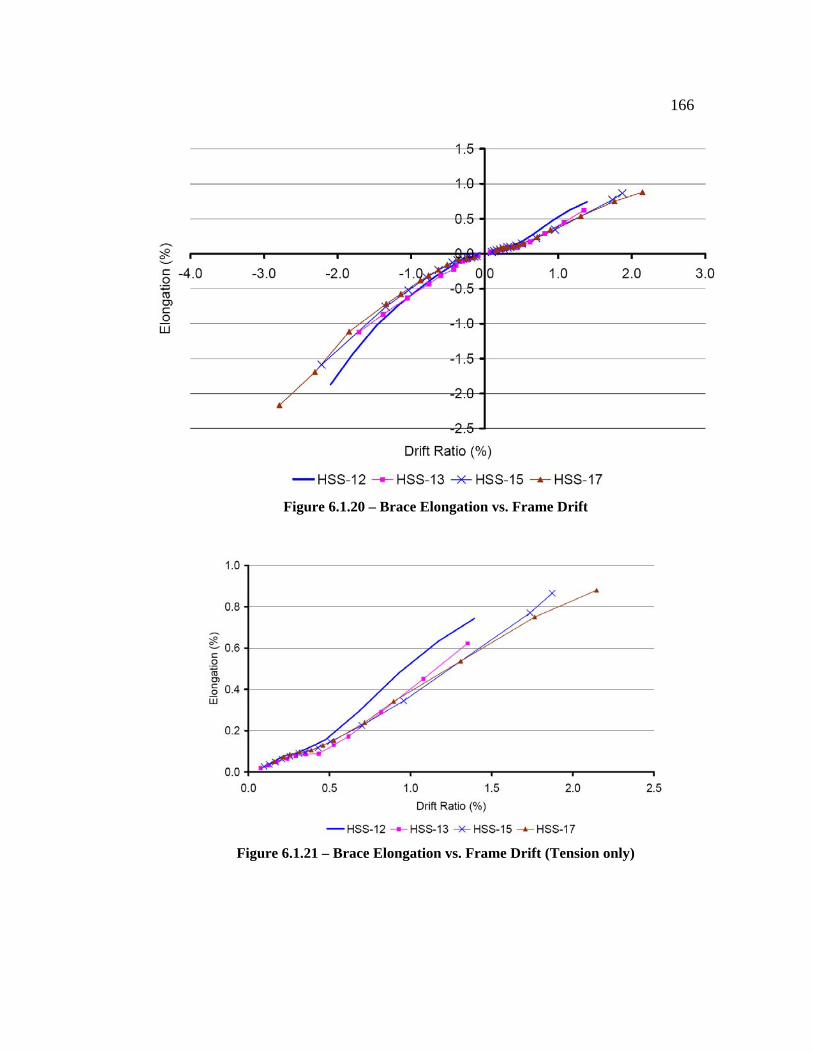
166
Figure 6.1.20 – Brace Elongation vs. Frame Drift
Figure 6.1.21 – Brace Elongation vs. Frame Drift (Tension only)

167
These graphs show that for the frames which have thicker, larger gusset plates, the
brace elongates more at a given drift ratio potentially putting more strain demand at the
center of the brace. For example, the brace elongation for HSS-12 is about 0.55% at a
drift of 1.0%. However, all of the other frames have a brace elongation of about 0.4%
at a drift of 1.0%. Since the framing elements are the same for all of the specimens, it is
reasonable to assume that the difference between HSS-12 and the others is occurring
through yielding in the gusset plates. Conversely, HSS-17 has the smallest in-plane
strength stiffness because of its tapered 3/8 inch plate, and it seems to have the smallest
brace elongation for larger drifts.
Figure 6.1.22 shows the negative elongation of the brace compared to the total drift
range. While Figure 6.1.23 shows the positive elongation of the brace compared to the
total drift range. This shows the same results as the previous two figures. HSS-12
shows the highest brace elongation for a given total drift ratio. The other frames are
rather comparable but it seems that HSS-17 may have a slightly smaller elongation for a
given drift ratio.
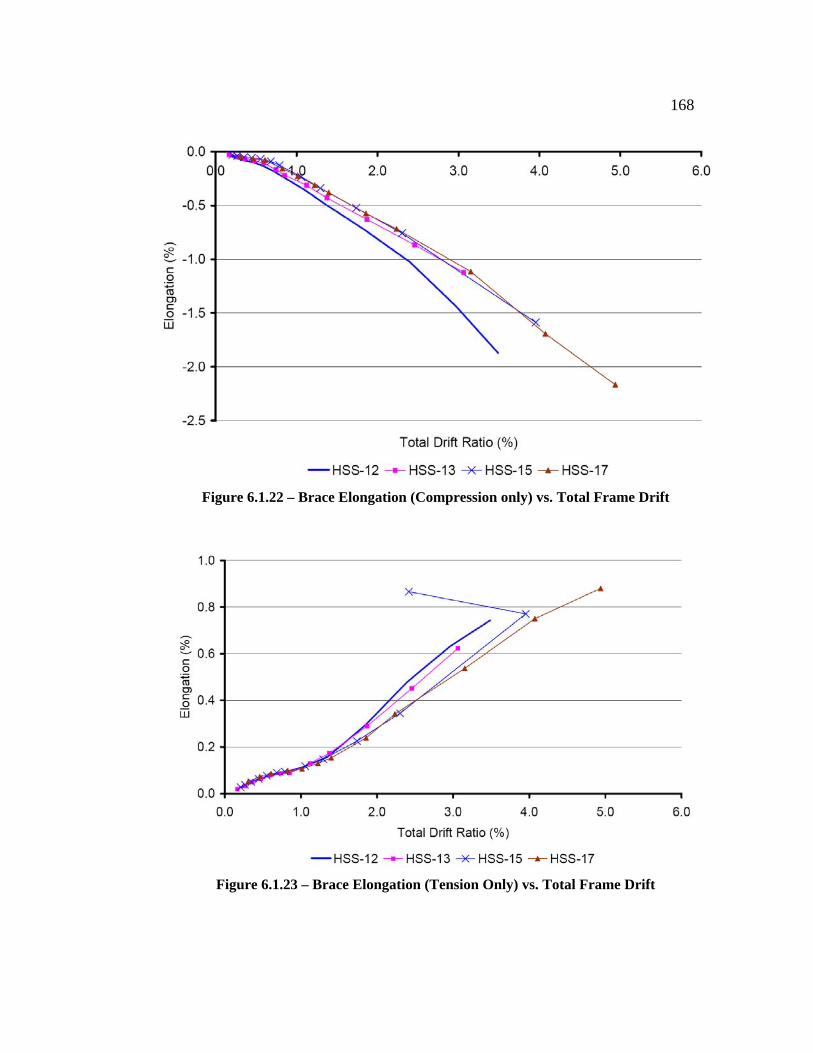
168
Figure 6.1.22 – Brace Elongation (Compression only) vs. Total Frame Drift
Figure 6.1.23 – Brace Elongation (Tension Only) vs. Total Frame Drift

169
Figure 6.1.24 shows the elongation of the gusset plate (measured from the end of the
brace to the center of the beam-column intersection, includes elongation in both NE and
SW gusset plate). It should be noted that this figure shows the elongation of the gusset
plates before weld or base/metal cracking occurred. It shows that relatively, the gusset
plates in HSS-17 absorbed a large amount of strain, especially at high drift levels. This
gusset plate has the lowest axial stiffness of all of the specimens. This is because it has
the smallest thickness (along with others), and it also has the smallest width, giving it
the smallest area, and therefore lowest axial stiffness. Therefore, as the figure suggests,
this gusset plate absorbed the most strain. Conversely, HSS-12 used a 1/2” thick plate
and a very large geometry, and had the smallest amount of elongation.
Figure 6.1.24 – Gusset Plate Elongation vs. Frame Drift (Tension Only)
At higher drifts, the strength of the gusset plate significantly affects the force in the
brace. As Figure 6.1.25 shows, the specimens which used larger, stronger plates also
have higher brace forces.

170
Figure 6.1.25 – Brace Force vs. Drift Ratio
The higher brace force adds to the axial elongation in the brace, adding strain in the
plastic hinge. The added strain shortens the life of the brace. HSS-12 shows the highest
brace force at high drift levels, while HSS-16, HSS-15 and HSS-17 show the lower
brace forces.
The results presented in this section show that the specimens which had gusset plates
with lower axial stiffness and strength also had a higher drift capacity. This is because
when the gusset plate is smaller, during the tension cycle, plastic strain can occur more
readily in the gusset plate instead of the hinge point of the brace. This is also true,
because the smaller gusset plates with smaller axial capacities deliver a smaller load to
the brace. It should be noted however, that a gusset plate that is too small and/or weak
may adversely affect the drift life of the specimen.

171
6.1.5 Weld/Base Metal Damage
Although, it is not desirable to have damage to the gusset plate welds at an early drift
ratio based on performance based design standards, damage to these welds will increase
the ultimate drift range of the frame. Whether it is damage to the welds themselves, or
damage to the base metal of the gusset plate at the welds, it has the same negative
impact on the condition of the structure but a positive affect on the ultimate drift
capacity of the frame.
Figure 6.1.26 shows the total drift ratio range of each specimen with respect to the
amount of total weld tearing that occurred for the entire test (each mark on the graph
represents a specimen). This graph does not take into account many other influential
characteristics and therefore has limited value. However, the graph shows a consistent
trend between amount of weld tearing and total drift range: the higher the amount of
weld tearing, the larger the drift capacity.
Figure 6.1.26 – Total Drift Range vs. Total Weld/Base Metal Crack Length
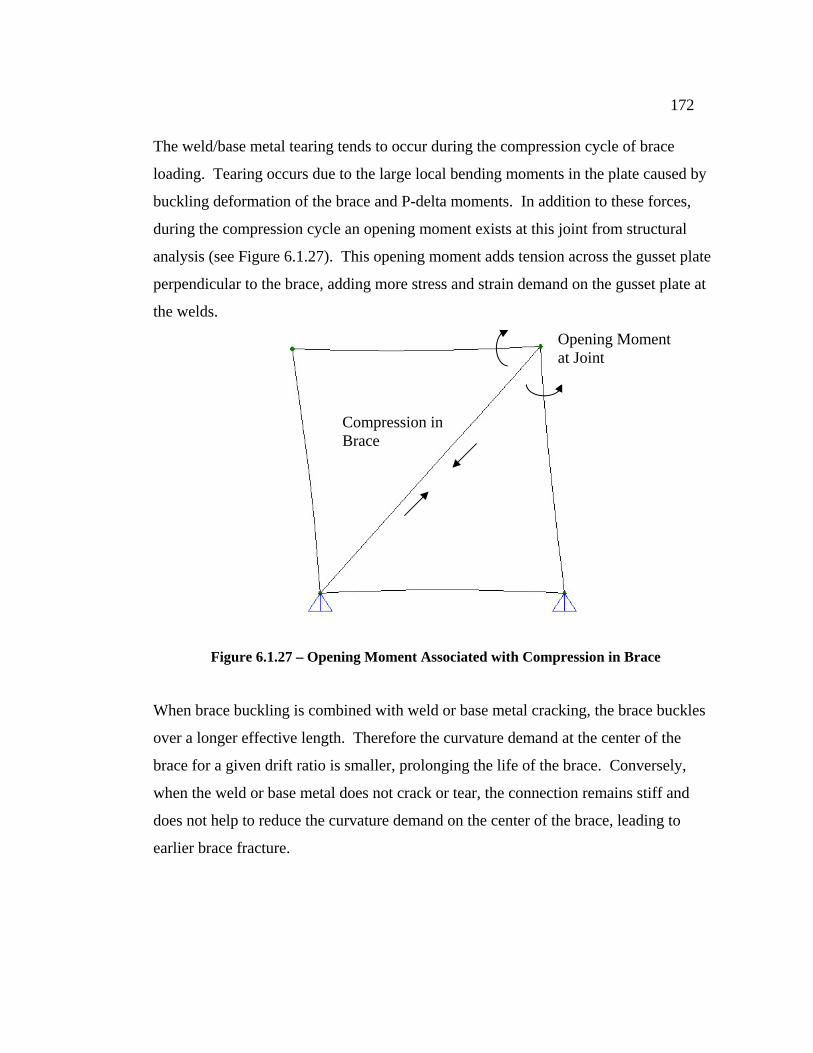
172
The weld/base metal tearing tends to occur during the compression cycle of brace
loading. Tearing occurs due to the large local bending moments in the plate caused by
buckling deformation of the brace and P-delta moments. In addition to these forces,
during the compression cycle an opening moment exists at this joint from structural
analysis (see Figure 6.1.27). This opening moment adds tension across the gusset plate
perpendicular to the brace, adding more stress and strain demand on the gusset plate at
the welds.
Figure 6.1.27 – Opening Moment Associated with Compression in Brace
When brace buckling is combined with weld or base metal cracking, the brace buckles
over a longer effective length. Therefore the curvature demand at the center of the
brace for a given drift ratio is smaller, prolonging the life of the brace. Conversely,
when the weld or base metal does not crack or tear, the connection remains stiff and
does not help to reduce the curvature demand on the center of the brace, leading to
earlier brace fracture.
Compression in Brace
Opening Moment at Joint
173
Additionally, when the base metal or the welds crack, it can be inferred that the axial
stiffness of the connection is reduced. For example, if a rectangular plate cracks over a
couple of inches at both of the reentrant corners, a tensile load will no longer be able to
be transferred across the crack. Therefore, the load will need to be resisted over a
smaller gusset plate width (and area), essentially turning a rectangular plate into a
tapered plate and reducing the axial stiffness.
It should be noted that weld cracking seems to be fairly dependant on the applied drift
history. This is important because the applied drift histories are different between
specimens. Furthermore, because the Seismic Provisions require braces in opposing
direction, a more symmetric applied displacement is more likely than one with higher
compressive drifts than tension drifts. This will be discussed in more detail in the
following chapter.
It is shown above that cracking or tearing of the weld/base metal is advantageous to the
ultimate drift capacity of the frame. However, as will be shown in Chapter 7, if a weld
is too small and weld fracture occurs before the brace fractures, then the ductility and
inelastic deformation capacity of the system is reduced. This reduction limits the ability
of the frame to meet performance based design criteria.
There should be a balance in the design of the gusset plate welds. They should not
sustain cracking at low levels to aid in meeting operational and serviceability in
performance based design limits. However, limited cracking at high drift levels will
increase the inelastic drift capacity and aid in meeting Life Safety and Collapse
Prevention performance based design limits.

174
6.1.6 HSS-16
HSS-16 is a much different specimen than the other five tested in this test series. It had
a bolted connection to the gusset plate as opposed to the other specimens which were
welded. HSS-16 buckled at the connection, and had a very large drift ratio range,
5.89%. If ultimate drift capacity were the only criteria for seismic design, then the
gusset plate detail for HSS-16 may be the preferred design. However, other
requirements exist for seismic design, which are discussed in future sections of this
chapter, and these were not as acceptable for this specimen.
6.1.7 Summary
Examining the ultimate drift capacity is an accurate way to compare different frames
ability to meet Life Safety and Collapse Prevention performance based design limits.
The series of tests analyzed in this chapter show that the gusset plate detail drastically
affects the ultimate drift capacity of the frame.
The brace fractures due to the plastic strain accumulation at the center of the brace
(Yoo, 2006). If this plastic strain accumulation can be reduced at a given drift level,
then the frame can reach higher displacements without the brace fracturing, thereby
leading to a safer structure by postponing collapse.
When the brace buckles, the curvature of the brace at midspan severely affects the
plastic strain accumulation. Local deformation leads to further plastic strain
accumulation, which leads to fracture. If the gusset plates are designed to have a low
out-of-plane stiffness, then the shape of the brace will have single curvature as with a
member with pinned-end connections. Therefore the plastic strain accumulation at the
center of the brace will be smaller at a given drift level. Gusset plates with smaller out-
of-plane stiffness increase the drift capacity of the frame.

175
When the brace is in tension, the location of the plastic hinge will experience increased
plastic strain accumulation. The plastic strain accumulation will lead to cracking which
will lead to fracture of the brace. If the gusset plates are designed to have low axial
stiffness, then yielding will occur in the gusset plate, thereby reducing plastic strain
demands at the plastic hinge of the brace and increasing the drift capacity of the frame.
Controlled cracking or tearing of the welds or base metal can also increase the ultimate
drift capacity of the frame. When the gusset plates or gusset plate welds initiate
cracking at the reentrant corners, the effective size of the gusset plate becomes smaller.
A smaller effective gusset plate reduces the effective out-of-plane stiffness of the gusset
plate. It also reduces the axial stiffness of the connection.
In conclusion, the two major factors that cause the plastic strain accumulation are the
hinging under compressive loads and the tension in the brace after hinging. It is unsure
which increases the plastic strain accumulation more adversely. However, the solution
is the same for each problem. A smaller thinner gusset plate will reduce the out-of-
plane stiffness and the in-plane stiffness increasing the drift capacity of the frame.
6.2 Performance State Comparison
6.2.0 Introduction
Seismic design is based on the premise that structures should have less damage during
smaller, more frequent earthquakes, but may have a large amount of damage during
larger, more infrequent earthquakes. Performance based design builds on this concept
to recognize that the level of damage may be controlled to achieve economic benefits
based upon acceptable seismic risk. Because large earthquakes have a much longer
return period than the life expectancy of the building, owners usually are willing to take
the risk that the building may not be usable after such an earthquake. Smaller
176
earthquakes however, have a greater chance of occurring during the lifespan of the
building, and therefore buildings should be able to resist these seismic events with less
damage to the structure. Performance levels, in order of decreasing acceptable expected
deformation levels, include:
10. Collapse Prevention
11. Life Safety
12. Immediate Occupancy
The drift level that is associated with Immediate Occupancy is dependant on the
structure. For example, a hospital may require more strict performance levels of the
structure for Immediate Occupancy than an office building. Furthermore, the same
hospital may require that the level of Immediate Occupancy be satisfied at larger, more
infrequent earthquakes; since during these earthquakes, hospitals are critical to the
recovery of the community.
The Life Safety performance level deals with the safety of those within the building
during an earthquake (excluding the possibility of building collapse). Much more
damage is expected in this performance level. However, the structure and other
building components shall avoid life threatening responses such as falling debris and
loss of gravity load bearing elements.
In order to satisfy the performance level of Collapse Prevention, most of the effort
within this research was to prolong the life of the brace which was discussed in the
previous section, 6.1. However, the specimens still had some strength and stiffness
after the brace fractured. The capacity after the brace fractured was approximately 100
kips in either direction, and the stiffness was approximately 40 kips per one percent
drift (compared to the original stiffness of 500 kips per one percent drift).

177
This section will compare the performance levels of different areas of the frame. This
section will examine the brace in Section 6.2.1, the gusset plate in Section 6.2.2, the
gusset plate welds/base metal in Section 6.2.3 and the framing members in Section
6.2.4.
6.2.1 Performance State Comparison of Brace
The performance state of the brace for each experiment as described and defined in
Chapter 5, is listed in Table 6.2.1. Most of the performance states, which occurred at
lower drift levels, occurred at relatively similar drift levels between specimens. More
varied results between the frames occurred at higher drift levels.
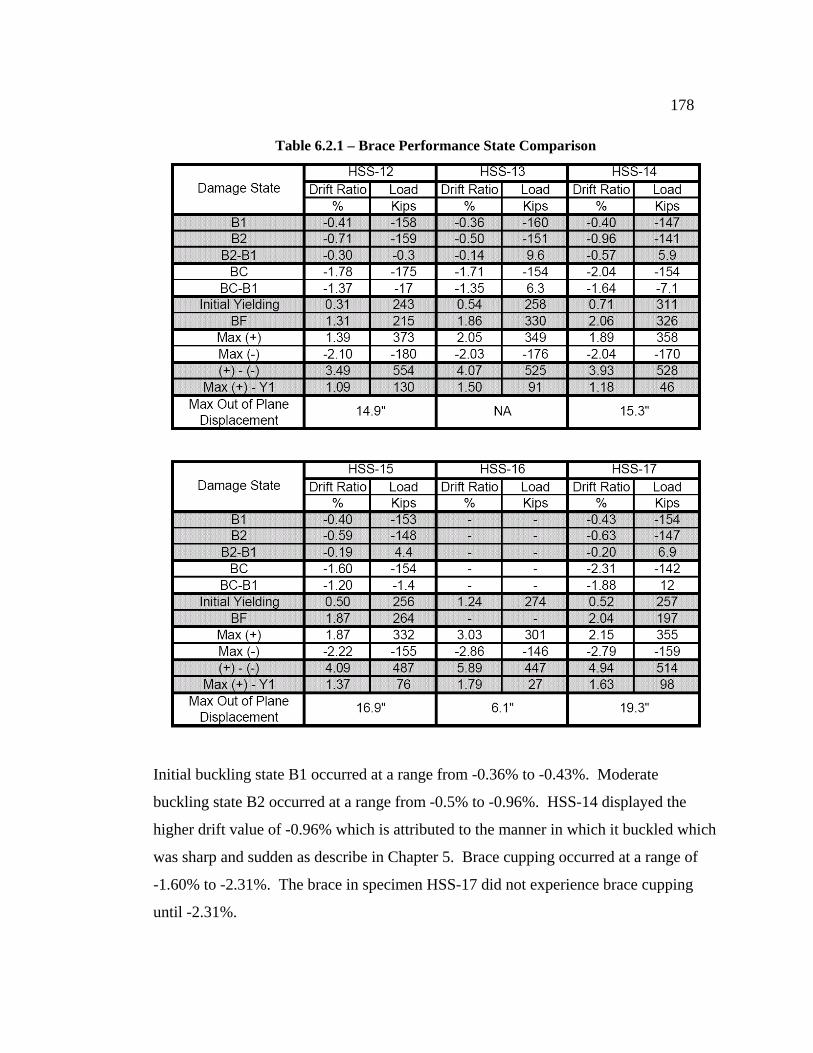
178
Table 6.2.1 – Brace Performance State Comparison
Initial buckling state B1 occurred at a range from -0.36% to -0.43%. Moderate
buckling state B2 occurred at a range from -0.5% to -0.96%. HSS-14 displayed the
higher drift value of -0.96% which is attributed to the manner in which it buckled which
was sharp and sudden as describe in Chapter 5. Brace cupping occurred at a range of
-1.60% to -2.31%. The brace in specimen HSS-17 did not experience brace cupping
until -2.31%.
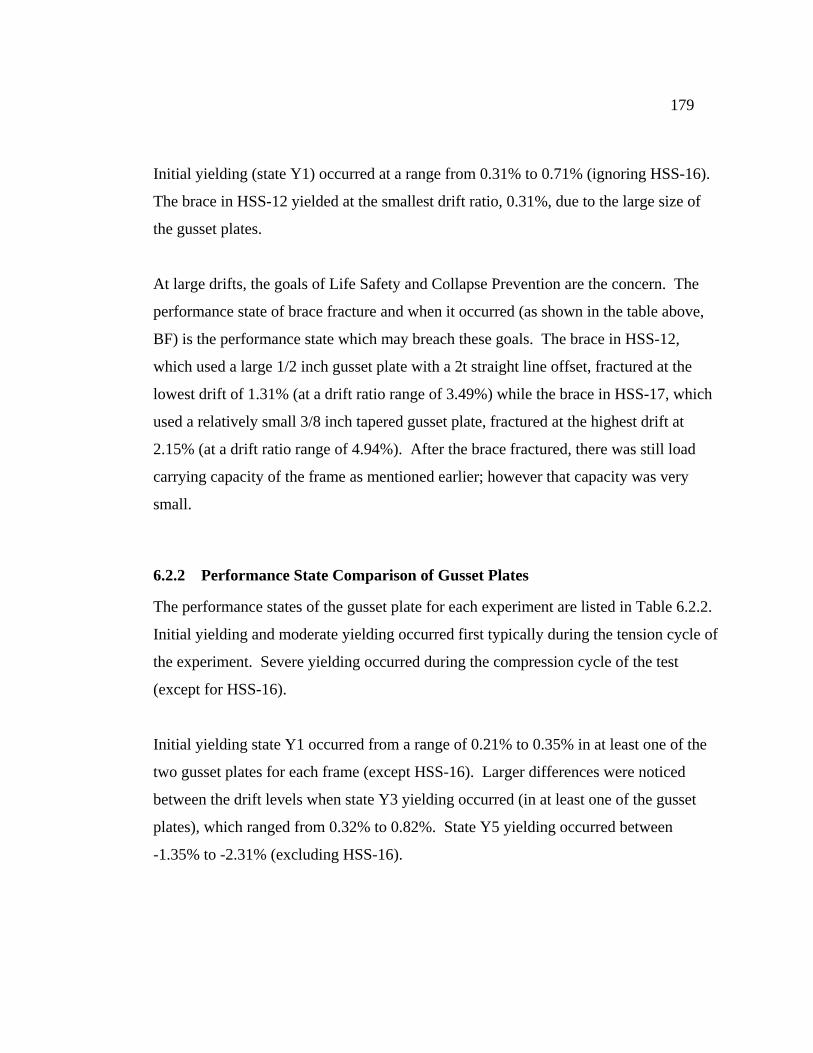
179
Initial yielding (state Y1) occurred at a range from 0.31% to 0.71% (ignoring HSS-16).
The brace in HSS-12 yielded at the smallest drift ratio, 0.31%, due to the large size of
the gusset plates.
At large drifts, the goals of Life Safety and Collapse Prevention are the concern. The
performance state of brace fracture and when it occurred (as shown in the table above,
BF) is the performance state which may breach these goals. The brace in HSS-12,
which used a large 1/2 inch gusset plate with a 2t straight line offset, fractured at the
lowest drift of 1.31% (at a drift ratio range of 3.49%) while the brace in HSS-17, which
used a relatively small 3/8 inch tapered gusset plate, fractured at the highest drift at
2.15% (at a drift ratio range of 4.94%). After the brace fractured, there was still load
carrying capacity of the frame as mentioned earlier; however that capacity was very
small.
6.2.2 Performance State Comparison of Gusset Plates
The performance states of the gusset plate for each experiment are listed in Table 6.2.2.
Initial yielding and moderate yielding occurred first typically during the tension cycle of
the experiment. Severe yielding occurred during the compression cycle of the test
(except for HSS-16).
Initial yielding state Y1 occurred from a range of 0.21% to 0.35% in at least one of the
two gusset plates for each frame (except HSS-16). Larger differences were noticed
between the drift levels when state Y3 yielding occurred (in at least one of the gusset
plates), which ranged from 0.32% to 0.82%. State Y5 yielding occurred between
-1.35% to -2.31% (excluding HSS-16).
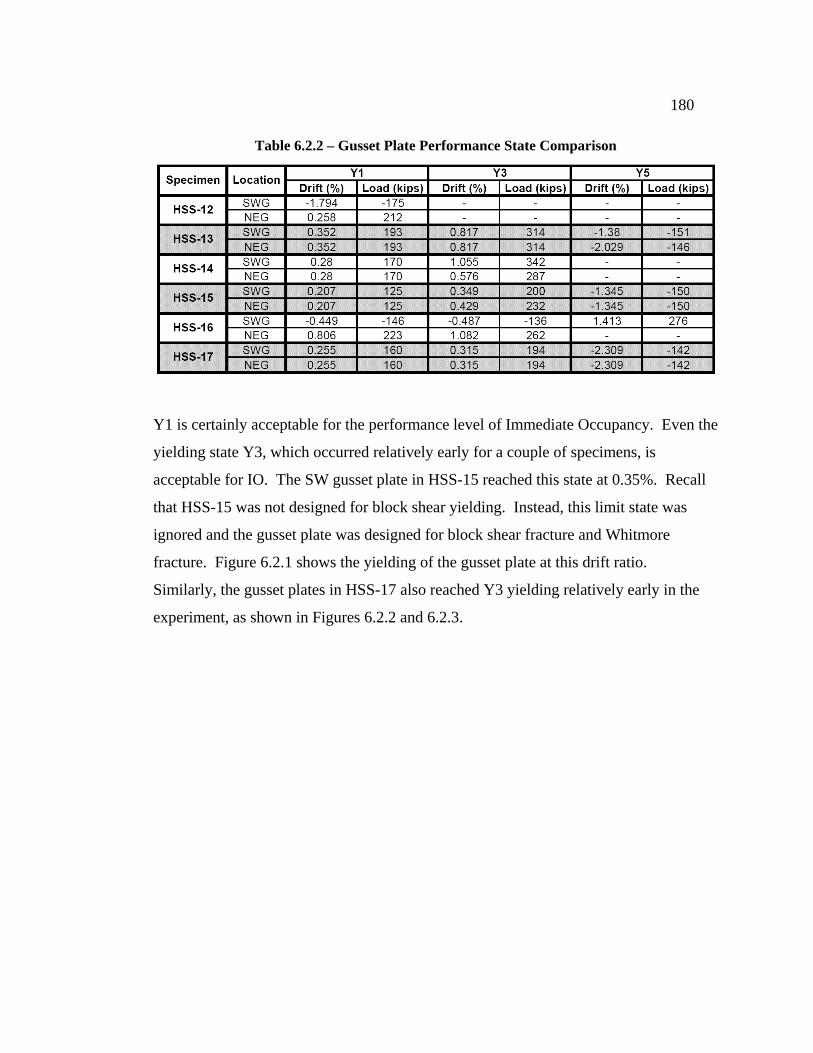
180
Table 6.2.2 – Gusset Plate Performance State Comparison
Y1 is certainly acceptable for the performance level of Immediate Occupancy. Even the
yielding state Y3, which occurred relatively early for a couple of specimens, is
acceptable for IO. The SW gusset plate in HSS-15 reached this state at 0.35%. Recall
that HSS-15 was not designed for block shear yielding. Instead, this limit state was
ignored and the gusset plate was designed for block shear fracture and Whitmore
fracture. Figure 6.2.1 shows the yielding of the gusset plate at this drift ratio.
Similarly, the gusset plates in HSS-17 also reached Y3 yielding relatively early in the
experiment, as shown in Figures 6.2.2 and 6.2.3.
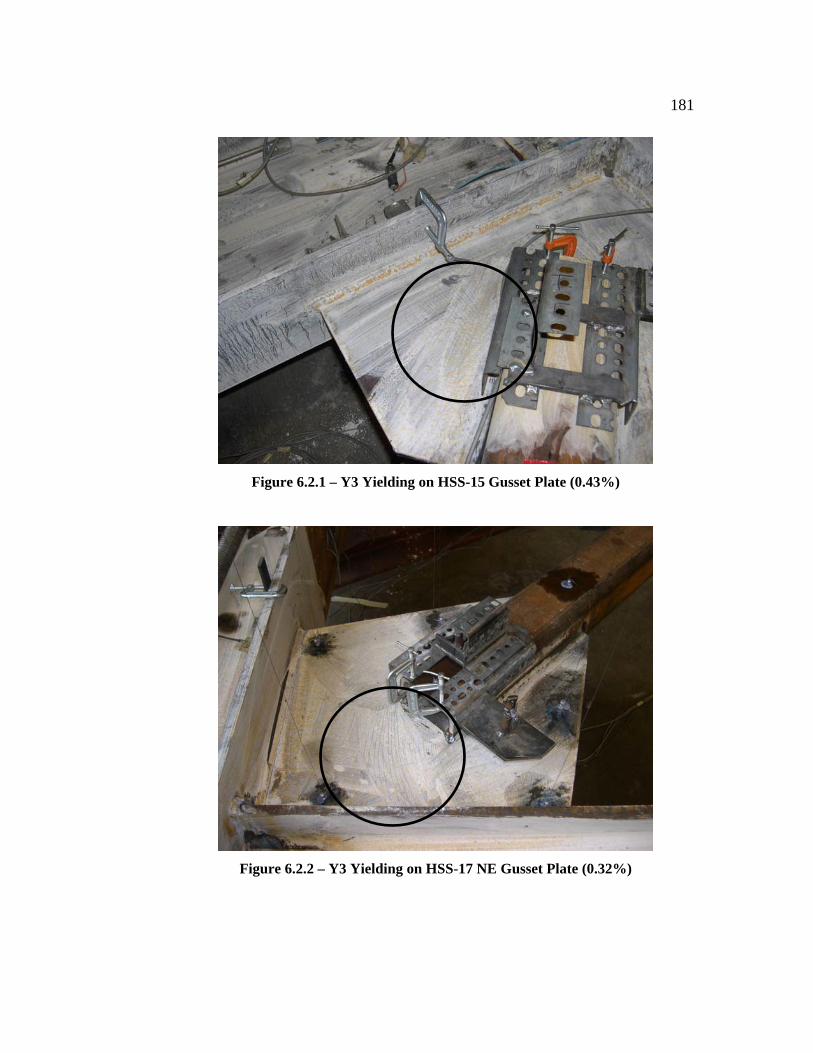
181
Figure 6.2.1 – Y3 Yielding on HSS-15 Gusset Plate (0.43%)
Figure 6.2.2 – Y3 Yielding on HSS-17 NE Gusset Plate (0.32%)
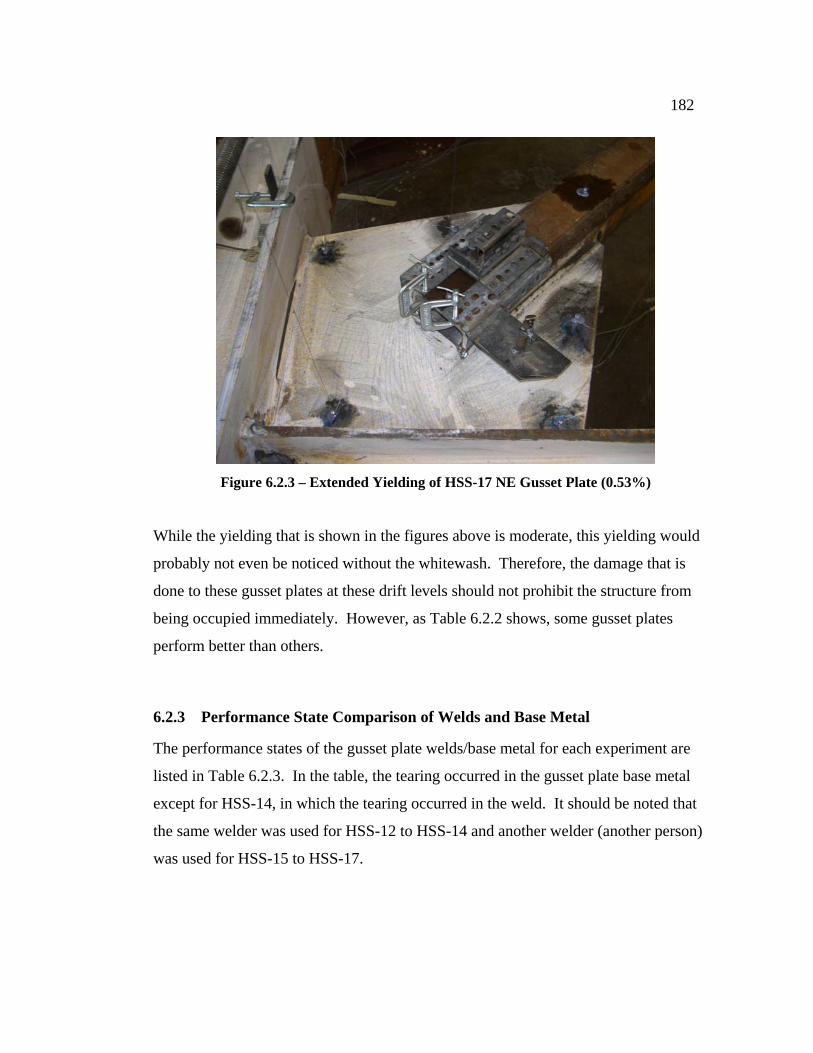
182
Figure 6.2.3 – Extended Yielding of HSS-17 NE Gusset Plate (0.53%)
While the yielding that is shown in the figures above is moderate, this yielding would
probably not even be noticed without the whitewash. Therefore, the damage that is
done to these gusset plates at these drift levels should not prohibit the structure from
being occupied immediately. However, as Table 6.2.2 shows, some gusset plates
perform better than others.
6.2.3 Performance State Comparison of Welds and Base Metal
The performance states of the gusset plate welds/base metal for each experiment are
listed in Table 6.2.3. In the table, the tearing occurred in the gusset plate base metal
except for HSS-14, in which the tearing occurred in the weld. It should be noted that
the same welder was used for HSS-12 to HSS-14 and another welder (another person)
was used for HSS-15 to HSS-17.

183
Table 6.2.3 – Weld/Base Metal Performance State Comparison
In general, the performance of these welds at low drift levels (less than 1%) was quite
acceptable except for HSS-16. HSS-16 used a one-sided connection which had an
eccentric extension plate bolted to the gusset plate. The geometry of this detail caused
the extension plate to hinge instead of the center of the brace, placing large rotational
demands on the gusset plate (Figure 6.2.4). Due to the rotational demand, the base
metal at the SW column weld in this specimen developed a 6 inch crack at a drift of
-0.49%. For the performance level of Immediate Occupancy, weld or base metal
cracking should not occur. This would need to be repaired before people occupied the
building. This is because once a crack forms, stress concentrations will occur at this
location, propagating the crack, and creating more damage and less resistance to lateral
loads, compromising the stability of the structure. HSS-16 did not perform well in this
regard. However, the connections which used welded brace-to-gusset connections

184
performed well within the performance level of IO. None of these welds or the base
metal cracked until the severe drift range.
Figure 6.2.4 – SW Gusset Plate Rotation vs. Story Drift
In general, the performance of the welds was also quite acceptable at high drift ratios.
None of the specimens other than HSS-16 showed any weld or base metal cracking until
a drift ratio over 1.5% drift. Also, HSS-14 and HSS-17 only showed severe weld or
base metal damage at over 2% drift (absolute value). When the cracking in the base
metal or the welds becomes this high, Life Safety and Collapse Prevention are in
question. However, at such large drift ratios, brace fracture is in close proximity and
tearing of the welds actually increases the life of the brace as discussed in Section 6.1.5.
The gusset plate welds and base metal for HSS-12 and HSS-13 did not crack during the
entire test. These welds showed a very high performance for Immediate Occupancy.
Although as stated in Section 6.1.5, the lack of tearing did not help to increase the drift
185
capacity of the frame. These gusset plates were 1/2 inch thick compared to the other
four specimens that used 3/8 inch thick gusset plates. Therefore, the base metal did not
crack.
In conclusion, performance of all of the gusset plate welds/base metal was acceptable
for all performance levels, except HSS-16. The complete joint penetration welds used
in HSS-12 and HSS-13 did not experience any cracking during the entire length of the
test. The fillet welds used in HSS-14 through HSS-17 were designed to have higher
capacity than the tensile strength of the plate. When buckling occurred at the center of
the brace, these fillet welds, and/or base metal cracked only at drift levels above 1.5%.
This shows a high performance for Immediate Occupancy. Severe weld/base metal
cracking occurred in these welds at about 2% if at all. This is acceptable for Life Safety
and Collapse Prevention, because they did not totally fracture. This is also
advantageous to these performance levels because the amount of damage to the welds
actually helped to increase the drift life of the brace (as was shown in Section 6.1.5)
The base metal in HSS-16 did not have an adequate performance for Immediate
Occupancy. This was not due to the design of the welds or gusset plate however. It
was due to the buckling shape of the brace and connections. The hinging of the
extension plate caused high rotational demand in sub sequentially, the cracking of the
base metal.
For the higher drift levels in HSS-16, the cracks tore more than any other specimen.
However, they did not fracture. Therefore, this specimen performed highly for the
performance levels of Life Safety and Collapse Prevention, in terms of drift capacity.
However, in terms of load capacity, these performance levels did not perform as well as
the other specimens as designated by Table 6.2.3.

186
6.2.4 Performance State Comparison of Framing Elements
This section will compare the performance state of the framing elements for each of the
six tests carried out in this thesis. Moments and shears are also included in this section.
Table 6.2.4 shows a comparison of the performance of the framing elements at a given
drift ratio range. Damage written in bold signifies either local flange buckling of the
column or severe yielding in the column.
Table 6.2.4 – Framing Elements Performance State Comparison
This comparison vaguely shows that the stiffer (in-plane stiffness) gusset plates cause
more damage to the framing members at smaller drifts. For example, HSS-12 (which
used a gusset plate with the highest in-plane stiffness because of its very large
geometric size and thickness) received Y1 yielding to three of the four framing
elements at a drift ratio range of 1.35%; while this did not occur in HSS-17 (which used
a gusset plate with the lowest in-plane stiffness because of its small geometric size and
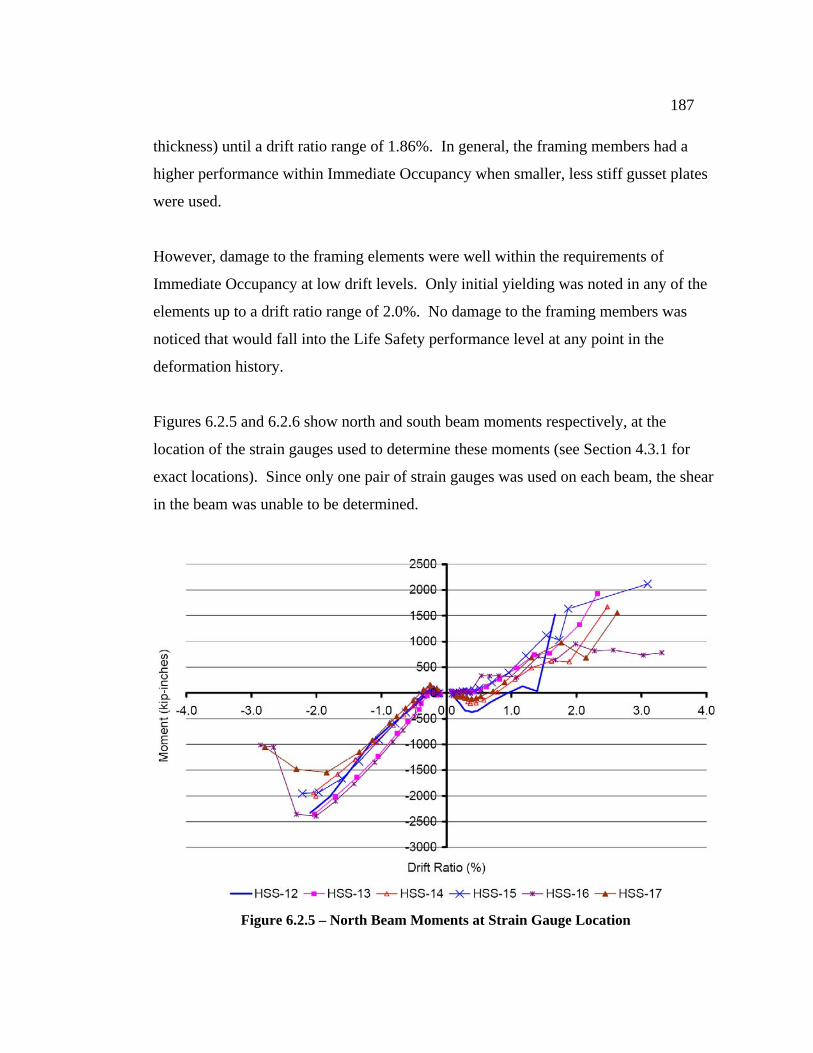
187
thickness) until a drift ratio range of 1.86%. In general, the framing members had a
higher performance within Immediate Occupancy when smaller, less stiff gusset plates
were used.
However, damage to the framing elements were well within the requirements of
Immediate Occupancy at low drift levels. Only initial yielding was noted in any of the
elements up to a drift ratio range of 2.0%. No damage to the framing members was
noticed that would fall into the Life Safety performance level at any point in the
deformation history.
Figures 6.2.5 and 6.2.6 show north and south beam moments respectively, at the
location of the strain gauges used to determine these moments (see Section 4.3.1 for
exact locations). Since only one pair of strain gauges was used on each beam, the shear
in the beam was unable to be determined.
Figure 6.2.5 – North Beam Moments at Strain Gauge Location
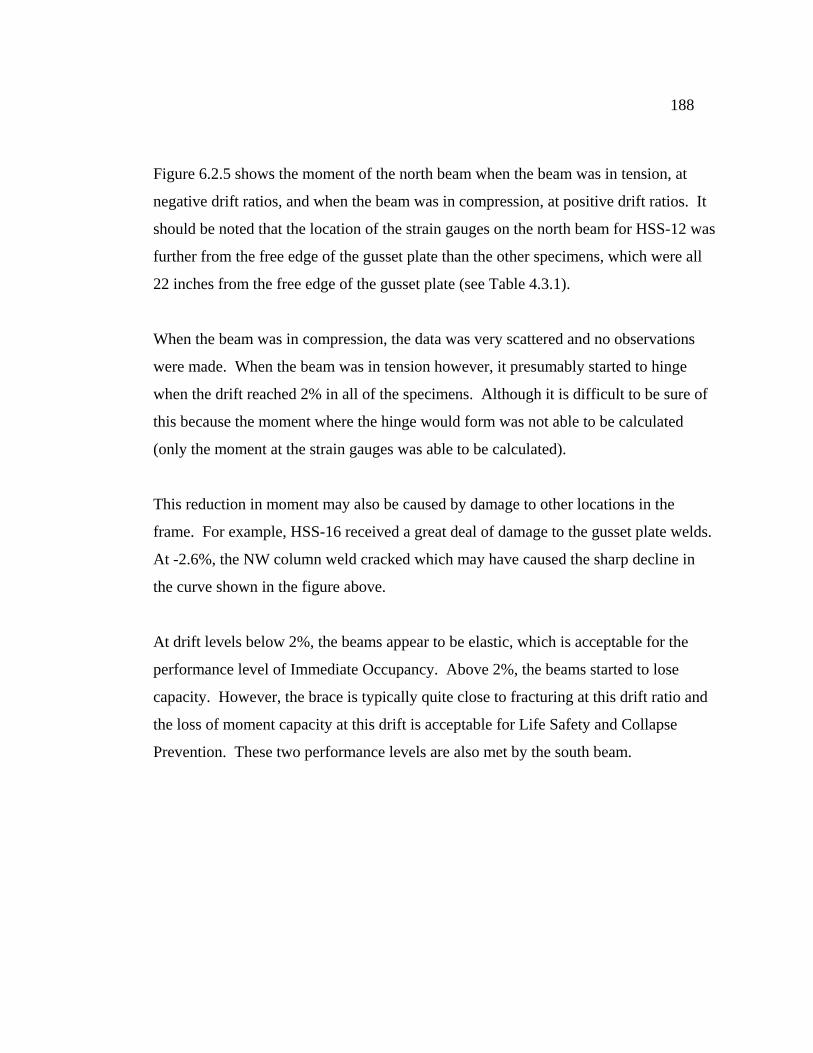
188
Figure 6.2.5 shows the moment of the north beam when the beam was in tension, at
negative drift ratios, and when the beam was in compression, at positive drift ratios. It
should be noted that the location of the strain gauges on the north beam for HSS-12 was
further from the free edge of the gusset plate than the other specimens, which were all
22 inches from the free edge of the gusset plate (see Table 4.3.1).
When the beam was in compression, the data was very scattered and no observations
were made. When the beam was in tension however, it presumably started to hinge
when the drift reached 2% in all of the specimens. Although it is difficult to be sure of
this because the moment where the hinge would form was not able to be calculated
(only the moment at the strain gauges was able to be calculated).
This reduction in moment may also be caused by damage to other locations in the
frame. For example, HSS-16 received a great deal of damage to the gusset plate welds.
At -2.6%, the NW column weld cracked which may have caused the sharp decline in
the curve shown in the figure above.
At drift levels below 2%, the beams appear to be elastic, which is acceptable for the
performance level of Immediate Occupancy. Above 2%, the beams started to lose
capacity. However, the brace is typically quite close to fracturing at this drift ratio and
the loss of moment capacity at this drift is acceptable for Life Safety and Collapse
Prevention. These two performance levels are also met by the south beam.

189
Figure 6.2.6 – South Beam Moments at Strain Gauge Location
From Figure 6.2.6, the moment in the south beams grew until about a drift of 2%.
Plastic hinging of the beams may have occurred around this drift at the free edge of the
gusset plate, although it is not definite for the reasons mentioned above.
However, it is clear that two of the specimens (HSS-13 and HSS-14) had beam web and
beam flange buckling at the south beam at about 2.0% drift as shown in Figure 6.2.7.
The graph above for the south beams in these specimens show a sharp reduction in
moment at this drift ratio. This occurred while there was tension in the brace, which
forces the beam to be in compression, and also occurs when there is closing moment at
the beam-column joint as depicted earlier in Figure 6.1.27. The closing moment applied
compression in the beam web, which caused the web to buckle along with the flange,
reducing the moment capacity. Local web and flange buckling should be tolerable for
Life Safety and Collapse Prevention. Depending on the goals of Immediate Occupancy

190
for the structure, the damage may be beyond the limits of this performance state.
However, because this damage occurred at 2%, the framing members of the structure
performed well for Immediate Occupancy.
Figure 6.2.7 – Local Beam Web and Beam Flange Buckling of HSS-14
Further comparisons between most specimens could not be made from this figure
because the location of the strain gauges on the beam relative to the free edge of the
gusset plate was not the same for each test. This is because the lateral support of the
channel assembly put limits on where the strain gauges could be located. However, two
specimens did have strain gauges in the same location of the south beam, HSS-14 and
HSS-16. The beam in HSS-14 had much higher moments because the column weld of
HSS-16 cracked quite significantly throughout the length of the test, limiting the
amount of moment transferred through the gusset plate to the beam.
The east and west column moments are shown in Figures 6.2.8 and 6.2.9, respectively.
The east and west column shears are shown in Figure 6.2.10 and 6.2.11, respectively.

191
Figure 6.2.8 – East Column Moments at Gusset Plate
Figure 6.2.9 – West Column Moments at Gusset Plate

192
Figure 6.2.10 – East Column Shears
Figure 6.2.11 – West Column Shears

193
The column moments shown in Figure 6.2.8 and 6.2.9 reveal that they are quite similar
for all of the specimens. The strain gauges used for both columns in HSS-12 and in the
east column for HSS-13 malfunctioned and the data is unavailable. The most noticeable
characteristic of the graphs is the reduction in moment at 2% drift. This is probably due
to the hinging of the beam, rather than hinging of the column since the column has a 30
percent larger plastic (and elastic) section modulus.
It is advantageous to the system for Life Safety and Collapse Prevention that the column
has a higher modulus than the beam. Hinging in the columns can cause severe damage
to the structure and nonstructural elements. This however, does not have much to do
with the gusset plate detail. Instead, all of the specimens share this trait. This leads to a
potential requirement that the column should have a higher modulus than that of the
beam. However, more research is needed to understand how the system would respond
if the reverse was true.
At low drift levels, the moments and shear in the columns appear to be elastic. This is
acceptable for the performance level of Immediate Occupancy
The graph for the west column shears shows that HSS-16 carries a smaller moment
relative to the other specimens. This is due to the reduced joint stiffness since the SW
column base metal at the gusset plate weld cracked early and continued to propagate
during the length of the test. The column shears in Figure 6.2.10 and 6.2.11 are directly
calculated from the column moments and show similar results as mentioned for the
column moments.
The proportion of shear resisted by the columns compared to the total shear in the frame
increased as the drift increased is shown in Figure 6.2.12 for the negative drift and in
Figure 6.2.13 for the positive drift. At least one pair of strain gauges malfunctioned on
194
each of the columns in HSS-12 and HSS-13, and no information is available concerning
the column shears for these tests.
Figure 6.2.12 – Ratio of Shear Resistance from Columns (Negative Drift)
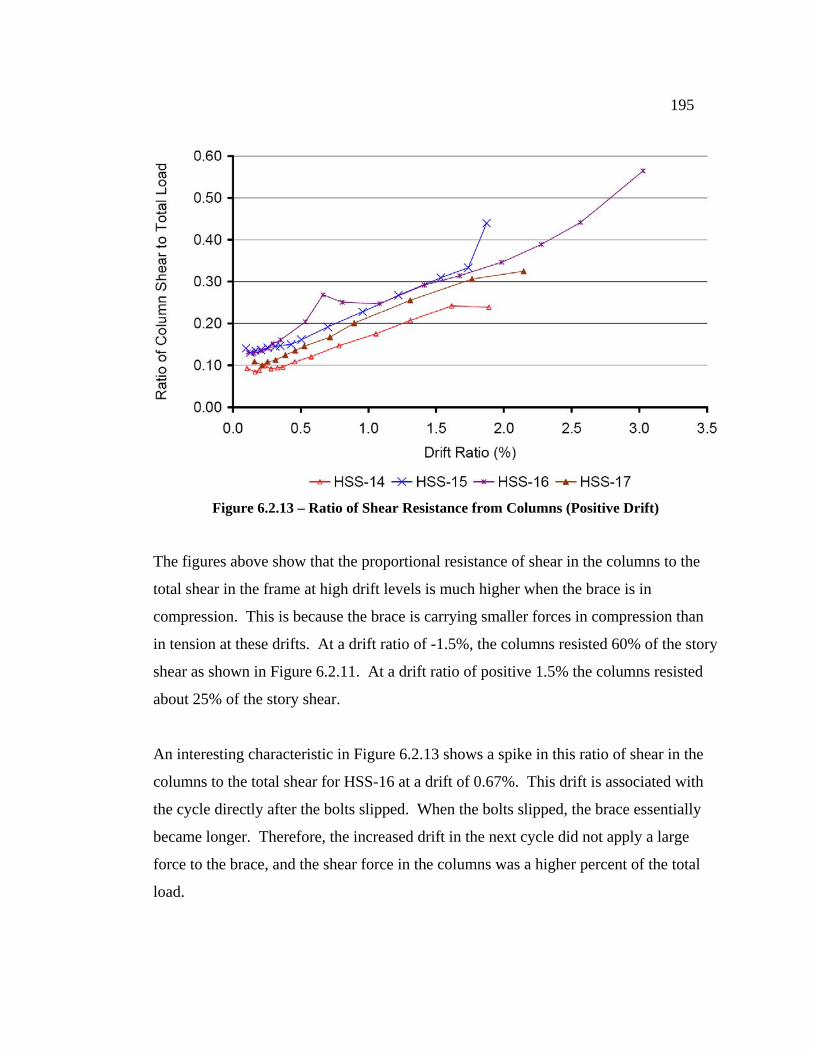
195
Figure 6.2.13 – Ratio of Shear Resistance from Columns (Positive Drift)
The figures above show that the proportional resistance of shear in the columns to the
total shear in the frame at high drift levels is much higher when the brace is in
compression. This is because the brace is carrying smaller forces in compression than
in tension at these drifts. At a drift ratio of -1.5%, the columns resisted 60% of the story
shear as shown in Figure 6.2.11. At a drift ratio of positive 1.5% the columns resisted
about 25% of the story shear.
An interesting characteristic in Figure 6.2.13 shows a spike in this ratio of shear in the
columns to the total shear for HSS-16 at a drift of 0.67%. This drift is associated with
the cycle directly after the bolts slipped. When the bolts slipped, the brace essentially
became longer. Therefore, the increased drift in the next cycle did not apply a large
force to the brace, and the shear force in the columns was a higher percent of the total
load.

196
Also, due to the bolt slipping and extension plate hinging in HSS-16 throughout the test,
the load in the brace never reached its capacity. This was why the column shears
typically carried a higher percentage of the total load than the other specimens did as
shown in the previous two figures.
In summary, damage to the framing members at low drift ratios (below 1%) was well
within the respective limits of Immediate Occupancy; and damage to the frame at high
drift levels was within the respective limits of Life Safety and Collapse Prevention. It
appears that the specimens with the stiffer gusset plates deliver higher load to the
framing elements of the specimen. For this reason, slightly more damage was seen for
the frames with larger gusset plates at a given drift ratio. It is also important to note that
in these specimens, the beams had a smaller nominal moment capacity than the
columns.
The most severe damage that was experienced by the framing members was local web
and flange buckling at the beam. This occurred in two specimens at a drift ratio of
about 2%. This could inhibit the performance level of Immediate Occupancy.
However, since the gravity load carrying system was still in working condition, Life
Safety was met by the beam. (It should be noted that the beam did not carry gravity
loads during the experiment, nor was it designed to carry gravity load.) Therefore, the
framing member performed very well with the connection details used in all of the
specimens for all the performance levels.
6.2.5 Summary for Performance State Comparisons
At low drift levels below 1%, damage was seen in all areas of the frame: at the brace,
gusset plate, gusset plate welds, and framing members. However, most of the areas of
the frame had a high performance for Immediate Occupancy.

197
Weld or base metal damage was not seen until high drift levels for all specimens which
used a welded brace-to-gusset connection. Damage for these specimens was not seen
until 1.61%, and severe damage was not seen until 2% drift. This is quite high
performance for the level of Immediate Occupancy. For Life Safety and Collapse
Prevention, it is unclear how much weld and base metal tearing is acceptable at high
drifts. It is required that the base metal and weld do not fail before the brace fractures.
However, some tearing at these locations was shown to actually increase the life of the
brace. Therefore, a balance between the two to maximize the drift life of the brace and
the seismic performance may be possible.
HSS-16 is the only specimen to have severe damage to the base metal below 2% drift.
This occurred at -0.49%. The requirements of Immediate Occupancy are not satisfied
when the base metal has this much damage. However, the base metal did not fail
completely at the column and the beam before the extension plate fractured,
demonstrating the resilience of the gusset plate.
Damage to the framing members does slightly depend on the size of the gusset plate.
Typically, the larger the gusset plate, the more load is drawn to the framing members.
Consequentially, more damage is seen in the specimens with larger gusset plates. At
high drift levels, this may lead to issues of Life Safety and Collapse Prevention if the
column where to develop large amounts of damage, possibly including hinging of the
column. However, since the beam had a smaller plastic modulus of the column, more
damage was experienced by the beam
For low drift levels (below 1%), the performance of the brace was about equal for all of
the specimens, and Immediate Occupancy was satisfied at a relatively high drift.
However, the larger, stiffer, and stronger gusset plates caused premature fracture of the
brace (as discussed in Section 6.1), leading to issues of Life Safety and Collapse
Prevention sooner with these specimens.

198
6.3 Load Capacity
Load capacity is another way to compare the specimens carried out in this series of
tests. This section will discuss why the load capacities are different and how valuable
the added capacity is to seismic resistance. Table 6.3.1 shows the maximum and
minimum loads (delivered by the actuator) resisted by the specimen and the subsequent
range of force.
Table 6.3.1 – Load Capacity Comparison
In general, the specimens with stiffer (in the out-of-plane direction and the in-plane
direction) gusset plates had a higher load capacity. For example HSS-12 had the
highest range of resistance. This can be attributed to the compression capacity and the
tension capacity. As was mentioned in Section 6.1.3, HSS-12 had stiffer gusset plates
in the out-of-plane direction and therefore buckled more like a member with fixed ends
than with pinned ends. This raised the buckling capacity of the brace, and therefore
raised the compressive capacity of the frame. Since the gusset plates in this specimen
did not yield in tension very much in comparison to the other specimens, the brace
experienced higher strains. Therefore, the tension force resisted may have been higher

199
due to higher strain hardening in the brace. Additionally, the large gusset plates caused
the framing members to have a shorter effective length, causing them to be stiffer and
carry more shear. This added capacity to the frame in both directions (unfortunately,
column shears for HSS-12 were not calculated due to faulty strain gauge
measurements).
Conversely, specimens which used smaller gusset plates generally had smaller load
capacity ranges. This can be seen in HSS-15 and HSS-17 which used the smallest
gusset plates. Both of the gusset plates used in these specimens were 3/8 inch thick.
HSS-15 had a reduced splice length that reduced the geometric sized of the plate, and
HSS-17 had a tapered plate that reduced the geometric size. These specimens had the
smallest load capacity ranges of the specimens outside of HSS-16.
HSS-16 had the smallest load capacity range of all of the specimens in this series of
tests. While this alone does not preclude the use of this type of connection for the
brace, this connection does not exhibit the behavior postulated in special concentrically
braced frames, because the full compressive buckling resistance of the brace was not
achieved. This means that the subject frame did not have the seismic resistance
required by the design specification, and the system did not exhibit the type of behavior
required by seismic resisting theory. In seismic design, members are designed to yield,
and buckle, while the connections are designed to carry the force that the members
deliver. This is stated in the AISC Seismic Provisions specifically for connections in
compression in Section 13.3c:
“Bracing connections shall be designed for a required compressive strength based on
buckling limit states that is at least equal to 1.1RyPn (LRFD) or (1.1/1.5)RyPn (ASD), as
appropriate, where Pn is the nominal compressive strength of the brace.”

200
The value of 1.1RyPn equals 237 kips and was used in the connection design. Figure
6.3.1 shows the force in the brace as a function of the drift ratio of the frame. The
figure shows that the compressive force in the brace of HSS-16 only reached a
maximum of 160 kips. This value is well below the 237 kip design force and did not
meet the requirements in AISC. The lack of compression capacity was due to the fact
that the extension plate of the connection hinged before the compression capacity of the
brace was met; which would have been met only if the brace buckled.
Figure 6.3.1 – Brace Force as a Function of Drift Ratio
Frames that have a higher load resistance have a small advantage at low drift levels. If
the load delivered by the earthquake is very close to the buckling load or yielding load
of the frame, a frame with higher load will be able to resist this load elastically.
However, a frame with a smaller load resistance may require the ductility of the frame
to absorb the excess load over the elastic capacity.
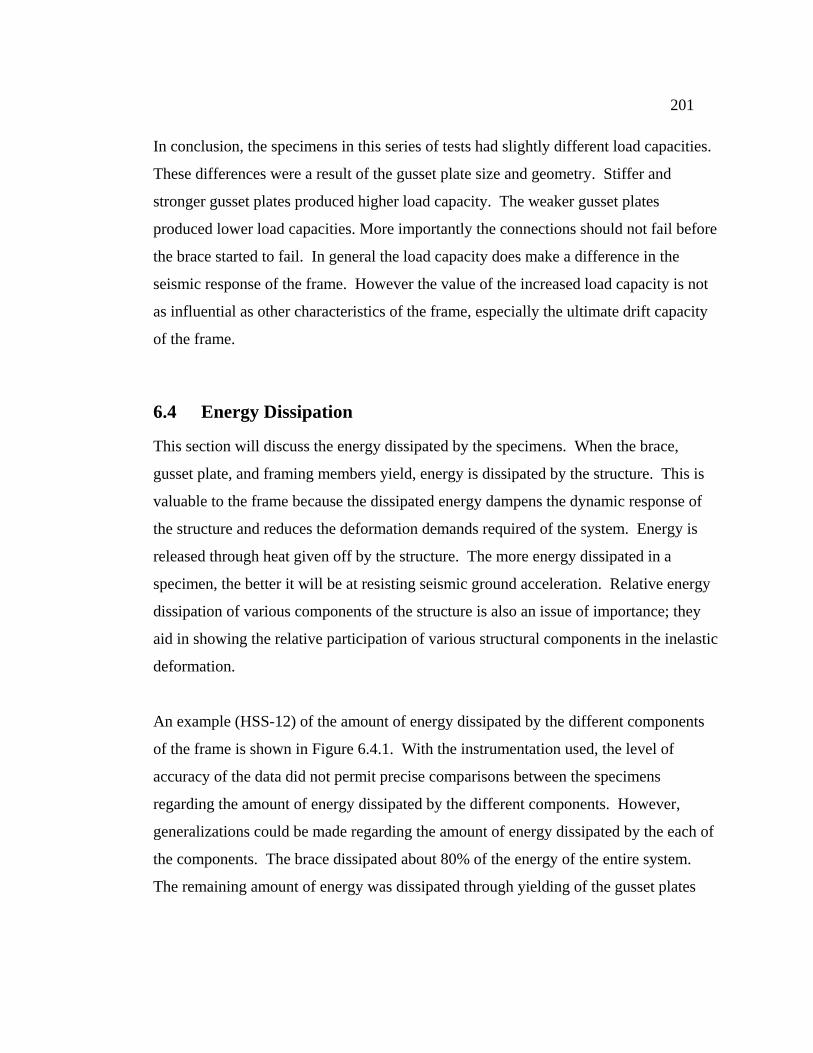
201
In conclusion, the specimens in this series of tests had slightly different load capacities.
These differences were a result of the gusset plate size and geometry. Stiffer and
stronger gusset plates produced higher load capacity. The weaker gusset plates
produced lower load capacities. More importantly the connections should not fail before
the brace started to fail. In general the load capacity does make a difference in the
seismic response of the frame. However the value of the increased load capacity is not
as influential as other characteristics of the frame, especially the ultimate drift capacity
of the frame.
6.4 Energy Dissipation
This section will discuss the energy dissipated by the specimens. When the brace,
gusset plate, and framing members yield, energy is dissipated by the structure. This is
valuable to the frame because the dissipated energy dampens the dynamic response of
the structure and reduces the deformation demands required of the system. Energy is
released through heat given off by the structure. The more energy dissipated in a
specimen, the better it will be at resisting seismic ground acceleration. Relative energy
dissipation of various components of the structure is also an issue of importance; they
aid in showing the relative participation of various structural components in the inelastic
deformation.
An example (HSS-12) of the amount of energy dissipated by the different components
of the frame is shown in Figure 6.4.1. With the instrumentation used, the level of
accuracy of the data did not permit precise comparisons between the specimens
regarding the amount of energy dissipated by the different components. However,
generalizations could be made regarding the amount of energy dissipated by the each of
the components. The brace dissipated about 80% of the energy of the entire system.
The remaining amount of energy was dissipated through yielding of the gusset plates

202
(about 10 to 15 percent) and framing members (about 5 to 10 percent) as shown in the
figure.
Figure 6.4.1 – Energy Dissipated by HSS-12
Figure 6.4.2 shows a comparison of the energy dissipated as a function of the total drift
range for all of the frames. For lower drift levels, all of the frames dissipate energy at
about the same rate as the drift increases. HSS-16 was the first to show smaller values
of energy dissipation at given drift levels. This was due to the buckling pattern of the
specimen. Since the extension plate hinged instead of the brace, less energy was
absorbed by the frame. The other five frames dissipated energy as the drift increased at
about the same rate.
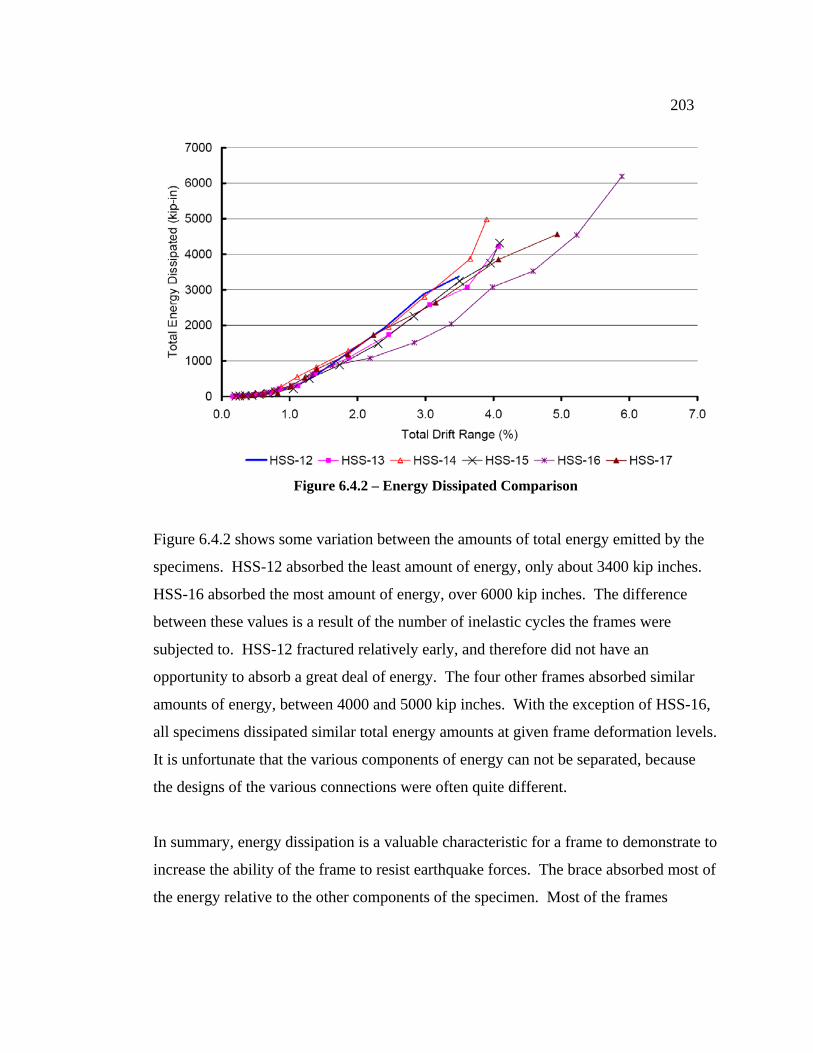
203
Figure 6.4.2 – Energy Dissipated Comparison
Figure 6.4.2 shows some variation between the amounts of total energy emitted by the
specimens. HSS-12 absorbed the least amount of energy, only about 3400 kip inches.
HSS-16 absorbed the most amount of energy, over 6000 kip inches. The difference
between these values is a result of the number of inelastic cycles the frames were
subjected to. HSS-12 fractured relatively early, and therefore did not have an
opportunity to absorb a great deal of energy. The four other frames absorbed similar
amounts of energy, between 4000 and 5000 kip inches. With the exception of HSS-16,
all specimens dissipated similar total energy amounts at given frame deformation levels.
It is unfortunate that the various components of energy can not be separated, because
the designs of the various connections were often quite different.
In summary, energy dissipation is a valuable characteristic for a frame to demonstrate to
increase the ability of the frame to resist earthquake forces. The brace absorbed most of
the energy relative to the other components of the specimen. Most of the frames

204
compared similarly, except for HSS-12 which absorbed a relatively small amount of
energy, and HSS-16, which absorbed the most amount of energy, albeit at a slower rate
than the other specimens.
6.5 Constructability
This section will discuss the constructability of the frame. Section 6.5.1 will discuss the
net section reinforcement of the brace. Section 6.5.2 will discuss the size and geometry
of the gusset plate.
6.5.1 Net Section Reinforcement
HSS-12 and HSS-13 were constructed with net section reinforcement. HSS-14 was not
constructed with this reinforcement. Since no damage was seen at this location during
the experiment, the remaining specimens tested (HSS-15 to HSS-17) also did not
include the reinforcement. No damage was evident at the net section for the remaining
tests. The lack of net section reinforcement did not seem to affect the frame in any
other noticeable way.
According to the results of these experiments, net section reinforcement may be
unnecessary. However there are multiple factors that may affect the net section
differently and it should not be assumed that the net section reinforcement is not
required for a brace which uses the exact same connection detail. This is true even if
the size of the brace, gusset plate, and framing elements, all remain the same. This is
because, if the load was applied in a different pattern, or if the slab stiffened the
connection, the net section may still fracture. Further testing is required to determine
the limits when net section reinforcement is required or when it is unnecessary.

205
6.5.2 Gusset Plate Size and Geometry
Two issues of constructability are in question regarding the size and geometry of the
gusset plate. Fabrication of the plate will be discussed first, and erection of the frame
will follow.
For fabrication purposes, larger plates are more expensive, simply because there is more
steel. Tapered plates are slightly more difficult to fabricate because of the angled cuts,
although this could be offset by the reduced amount of steel for the plate (if the steel
that is cut away is not wasted due to the remaining angular geometry). Gusset plates
designed with elliptical clearance reduce the size of the gusset plate, and also use
orthogonal plates.
Erection issues were brought to attention during erection of two of the frames. HSS-14
and HSS-15 used rectangular plates with an elliptical clearance which brings the end of
the brace closer to the beam column intersection. The end of the brace is close enough
that the brace could not be placed in between the gusset plates without pulling the frame
apart (Figure 6.5.1). This is not realistic in the field during construction. There are
many methods however, to erect a frame which uses these gusset plates. For example,
the brace could be held in place before the above the brace is placed into position. This
puts limitation on planning and erection sequence, but is still possible.
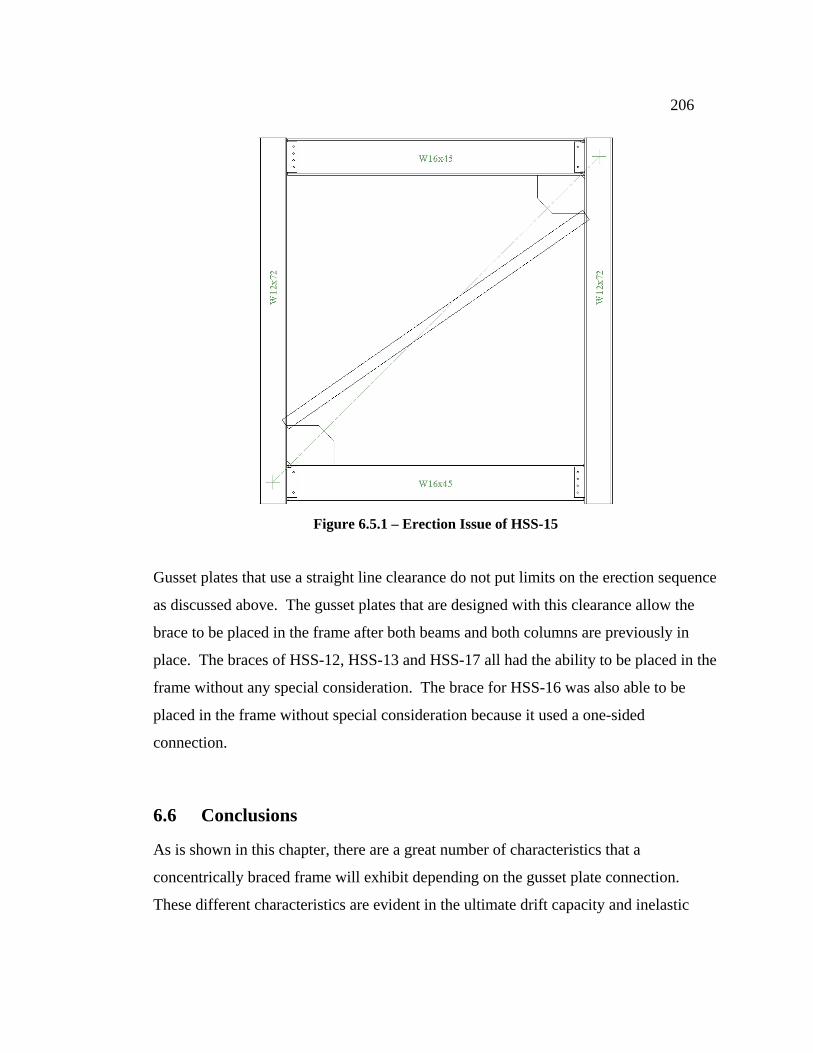
206
Figure 6.5.1 – Erection Issue of HSS-15
Gusset plates that use a straight line clearance do not put limits on the erection sequence
as discussed above. The gusset plates that are designed with this clearance allow the
brace to be placed in the frame after both beams and both columns are previously in
place. The braces of HSS-12, HSS-13 and HSS-17 all had the ability to be placed in the
frame without any special consideration. The brace for HSS-16 was also able to be
placed in the frame without special consideration because it used a one-sided
connection.
6.6 Conclusions
As is shown in this chapter, there are a great number of characteristics that a
concentrically braced frame will exhibit depending on the gusset plate connection.
These different characteristics are evident in the ultimate drift capacity and inelastic
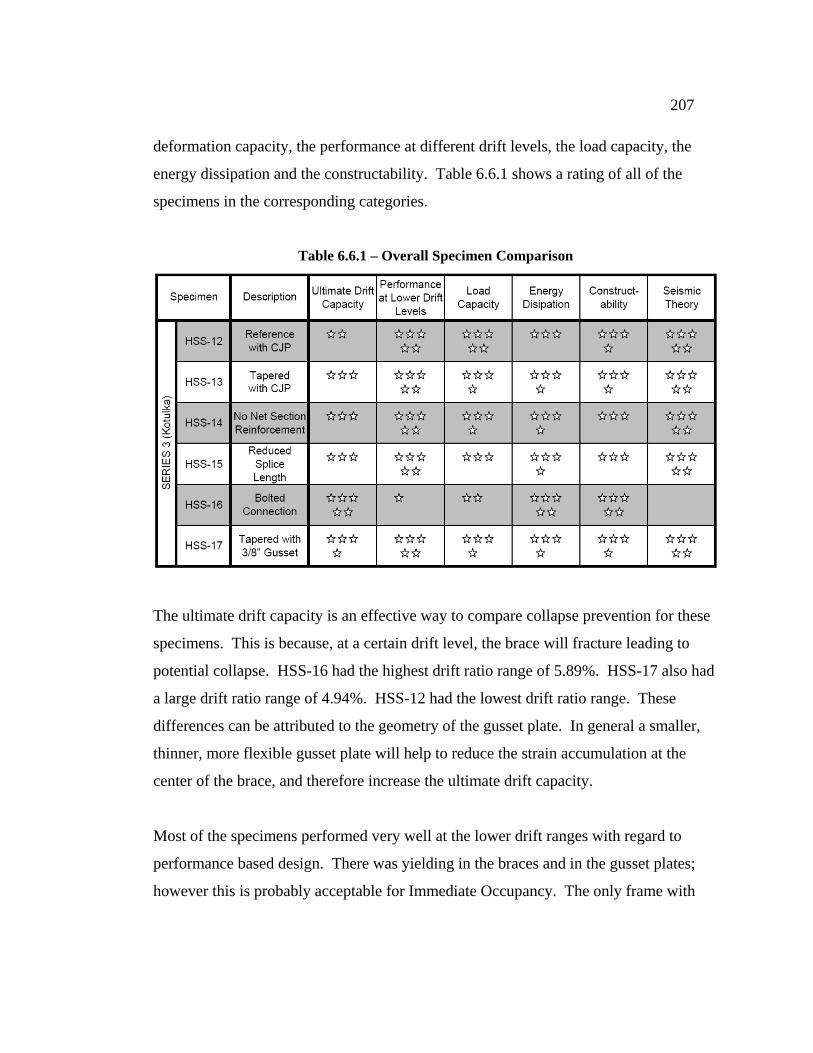
207
deformation capacity, the performance at different drift levels, the load capacity, the
energy dissipation and the constructability. Table 6.6.1 shows a rating of all of the
specimens in the corresponding categories.
Table 6.6.1 – Overall Specimen Comparison
The ultimate drift capacity is an effective way to compare collapse prevention for these
specimens. This is because, at a certain drift level, the brace will fracture leading to
potential collapse. HSS-16 had the highest drift ratio range of 5.89%. HSS-17 also had
a large drift ratio range of 4.94%. HSS-12 had the lowest drift ratio range. These
differences can be attributed to the geometry of the gusset plate. In general a smaller,
thinner, more flexible gusset plate will help to reduce the strain accumulation at the
center of the brace, and therefore increase the ultimate drift capacity.
Most of the specimens performed very well at the lower drift ranges with regard to
performance based design. There was yielding in the braces and in the gusset plates;
however this is probably acceptable for Immediate Occupancy. The only frame with

208
considerable damage was HSS-16. At -0.49% drift, this specimen experienced base
metal crack initiation at the gusset plate.
There were differences in the load capacity of the specimens. HSS-12 had the largest
load capacity of all of the specimens. However load capacity is not as influential in
determining good seismic design as compared to other criteria.
Energy dissipation between the frames was relatively equal for HSS-13, HSS-14, HSS-
15 and HSS-17. HSS-12 dissipated a relatively small amount of energy because of its
lack of ultimate drift capacity.
Constructability should be addressed when comparing these frames. All of the frames
are capable of being constructed. However, some will be slightly easier than others.
The category of seismic theory is shown in Table 6.6.1. Engineers have generally
agreed that in steel structures, the members should yield and buckle before the
connections. This is also required in AISC Seismic Provisions. HSS-16 did not adhere
to this requirement. The other five specimens did adhere to this requirement and
ultimately failed through brace fracture. If the structural design industry changed or
relaxed this requirement, then the connection detail for HSS-16 may be a direction for
further research as it did acquire the largest drift range.

209
Chapter 7: Analysis of Test Program Results
7.0 Introduction
This chapter presents the measured results of all of the specimens that have been tested
within the test program thus far, HSS-01 to HSS-17, and uses the results to understand
the influence of the parameters on the seismic response of the structure. This section
will focus on the characteristics of the frame that affect the ultimate drift capacity
(before the brace fractures). These characteristics include the size, strength and
stiffness of the gusset plate, the gusset plate welds, and the applied displacement
history.
This chapter is divided into the following sections. Section 7.1 gives a brief overall
comparison of all of the specimens. Section 7.2 will discuss the weld and base metal
damage. Section 7.3 will discuss how the applied displacement history affected the
ultimate drift capacity of the specimen. Section 7.4 will discuss how an earthquake may
actually load a structure and what effect that will have on weld cracking. Section 7.5
will discuss the gusset plate strength and stiffness, and how it affected the ultimate drift
capacity of the frame. Section 7.6 will discuss the performance of the framing
elements.
7.1 Overall Comparison
Table 7.1.1 shows an overall comparison of each specimen’s brace drift life and should
be used only for general reference. This table shows the study parameters of each
specimen (underlined in bold) and the maximum and minimum drifts attained in each
specimen in all of the cycles before the cycle which caused the brace (or brace
connection) to fracture.

210
Table 7.1.1 – Overall Comparison of All Specimens
7.2 Weld/Base Metal Damage
Weld/Base metal cracking occurred in all but three (HSS-11 through HSS-13) of the
specimens in the test program. The total length of the cracking at various drift ranges is
shown in Table 7.2.1. The values underlined in italics and bold designate that they are
approximate; because actual measurements were not taken (instead they were

211
approximated from pictures taken during the experiment). Figure 7.2.1 plots the total
crack length ratio (compared to the total gusset plate weld length) with respect to the
drift ratio range for specific specimens. This table and figure should be used for general
reference. More detailed analysis of this information is included in the following
subsections. Cracking occurred in the welds for HSS-01 to HSS-14, and cracking
occurred in the base metal for HSS-15 to HSS-17.
Table 7.2.1 – Total Weld/Base Metal Crack Length at Given Drift Range

212
Figure 7.2.1 – Total Weld/Base Metal Crack Length vs. Drift Ratio

213
As stated in Chapter 6, cracking of the gusset plate welds (or base metal in the heat
affected zone) increases the drift capacity by decreasing the in-plane and out-of-plane
effective stiffness of the gusset plate (as shown by the finite element analyses in
Appendix C). Although cracking in the welds or base metal may increase the drift
capacity of the brace, under-designed welds can crack at low drift levels, compromising
the system performance. Furthermore, welds that fracture before the brace fractures
will severely limit the drift capacity of the brace, and therefore potentially limit the drift
capacity of the frame. Comparisons are made between HSS-13 and HSS-10 in Section
7.2.2 and between HSS-1 and HSS-12 in Section 7.2.3. A broader comparison of the
weld cracking and its effect on the drift capacity is also made between all of the 3/8
inch rectangular plates that used an elliptical clearance in Section 7.2.4.
7.2.2 Weld Damage of Tapered Plates
HSS-10 and HSS-13 were similar specimens in that they had the same tapered gusset
plate geometry, and the same plate thickness. The difference between the two
specimens was the gusset plate weld. HSS-10 used 1/2 inch fillet welds, while HSS-13
used complete joint penetration welds. During the experiments, the welds in HSS-10
cracked. However, neither the welds nor the base metal cracked in HSS-13. Figure
7.2.2 shows the NE gusset plate rotation verses negative story drift. Data was
unavailable for HSS-13 at the SW gusset plate. Rotation was measured according to
Appendix D.
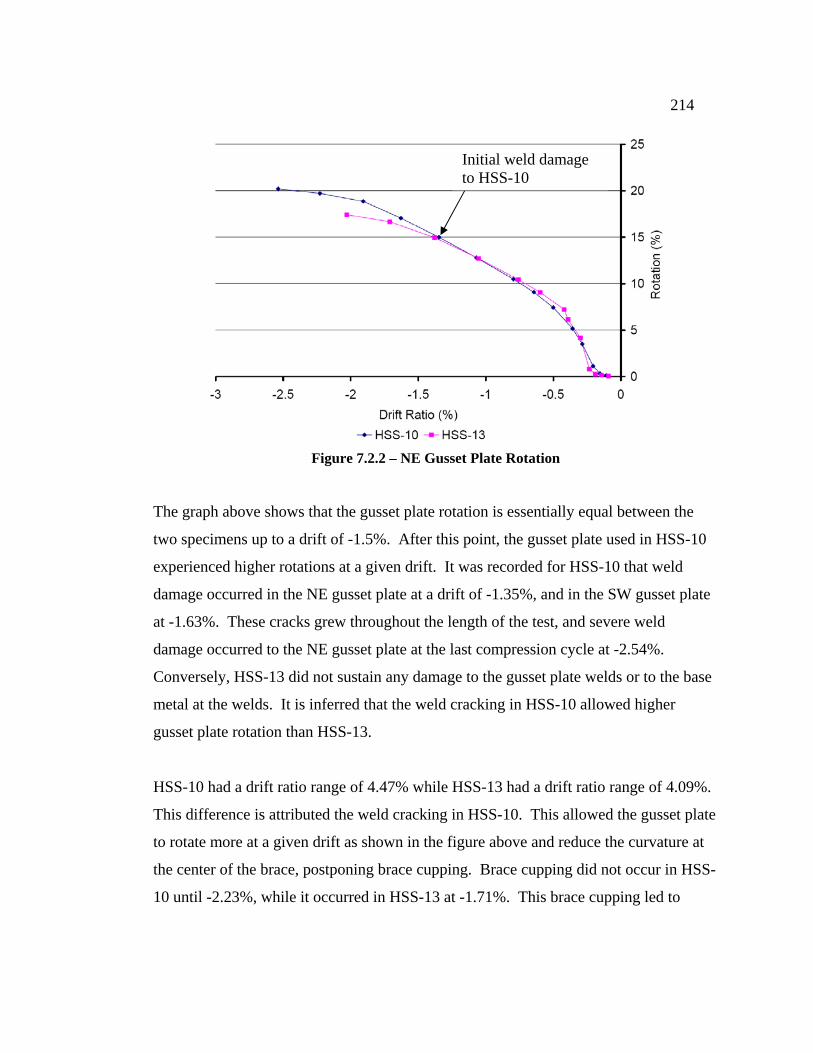
214
Figure 7.2.2 – NE Gusset Plate Rotation
The graph above shows that the gusset plate rotation is essentially equal between the
two specimens up to a drift of -1.5%. After this point, the gusset plate used in HSS-10
experienced higher rotations at a given drift. It was recorded for HSS-10 that weld
damage occurred in the NE gusset plate at a drift of -1.35%, and in the SW gusset plate
at -1.63%. These cracks grew throughout the length of the test, and severe weld
damage occurred to the NE gusset plate at the last compression cycle at -2.54%.
Conversely, HSS-13 did not sustain any damage to the gusset plate welds or to the base
metal at the welds. It is inferred that the weld cracking in HSS-10 allowed higher
gusset plate rotation than HSS-13.
HSS-10 had a drift ratio range of 4.47% while HSS-13 had a drift ratio range of 4.09%.
This difference is attributed the weld cracking in HSS-10. This allowed the gusset plate
to rotate more at a given drift as shown in the figure above and reduce the curvature at
the center of the brace, postponing brace cupping. Brace cupping did not occur in HSS-
10 until -2.23%, while it occurred in HSS-13 at -1.71%. This brace cupping led to
Initial weld damage to HSS-10

215
fracture of the brace. Therefore, weld cracking can have a positive effect on the seismic
performance of the frame. Although there are not experimental measurements, it is also
postulated that weld cracking reduces the effective axial stiffness of the gusset plate, as
supported by the finite element analyses in Section 7.2.1, thereby reducing axial strains
in the brace and increasing the life of the brace.
This however, does not preclude the use of CJP welds. As will be shown later, the
positive drift capacity is a viable method for comparing specimens, and these two
frames had similar positive drift capacities. Additionally, allowing weld cracking in
order to increase the drift capacity is controversial, and as shown in the next subsection,
may drastically reduce the drift capacity of the frame. Also, due to the test setup, 3/8
inch thick gusset plates were quite common. And unfortunately, CJP welds were not
able to be used on 3/8 inch thick plates (only on 1/2 inch thick plates) and therefore, no
comparison could be made.
7.2.3 Weld Damage of Rectangular Plates with 2t Line Clearance
HSS-01 and HSS-12 are very similar. These specimens use the exact same gusset plate
geometry and thickness with the straight line 2t offset. However, HSS-01 used the
uniform force method to design the gusset plate welds and HSS-12 used complete joint
penetration welds. As mentioned earlier, the uniform force method only designs the
welds for the axial force in the brace. The design does not include stresses in the weld
due to the moment transferring from the beam to the column, or any out-of-plane forces
associated with brace buckling. HSS-01 used 3/16 inch welds.
The gusset plate welds in HSS-01 started to tear at -1.04% drift. At this drift, cracks
formed in the gusset plate welds at the NE column, NE beam, and SW beam. These
cracks continued to propagate throughout the length of the test, and at a drift of 1.29%,

216
the welds at the SW gusset plate fractured completely. The total drift ratio range for
this specimen was 2.75%.
Specimen HSS-12 was designed with CJP welds. Damage was not noted during the
entire length of the test. Brace fracture occurred in HSS-12, which is the desirable
failure mechanism. The total drift ratio range for this specimen was 3.49%.
Therefore, it is shown that the uniform force method does not accurately predict the
load experienced by the gusset plate welds. This design led to the fracture of the gusset
plate welds in HSS-01, cutting off the load path from the brace to the frame. This
significantly increases the chance of collapse. Gusset plate welds should be designed
based on the strength of the gusset plate instead of the uniform force method to guard
against this weld fracture.
From this section, it can be inferred that although cracking in the welds may increase
the ultimate drift capacity of the frame by reducing the effective stiffness of the gusset
plate (Section 7.2.2); a crack can propagate causing the weld to fracture before brace
fracture occurs. Therefore a balance needs to be met by the weld design.
7.2.4 Weld Damage of Rectangular Plates with Elliptical Clearance
Specimens HSS-05, HSS-06, HSS-08, HSS-14, and HSS-15 had 3/8 inch rectangular
gusset plates with elliptical clearances (7.7t, 7.7t, 3.3t, 7.7t, and 6.0t respectively). All
of these specimens sustained weld cracking, except for HSS-15 which cracked in the
base metal in the heat affected zone. Figure 7.2.3 shows the relationship between total
weld/base metal cracking length ratio of the specimen and the drift ratio range at which
the cracks were measured. The figure shows that in general, specimens which had
longer weld crack also had larger ultimate drift ratios.
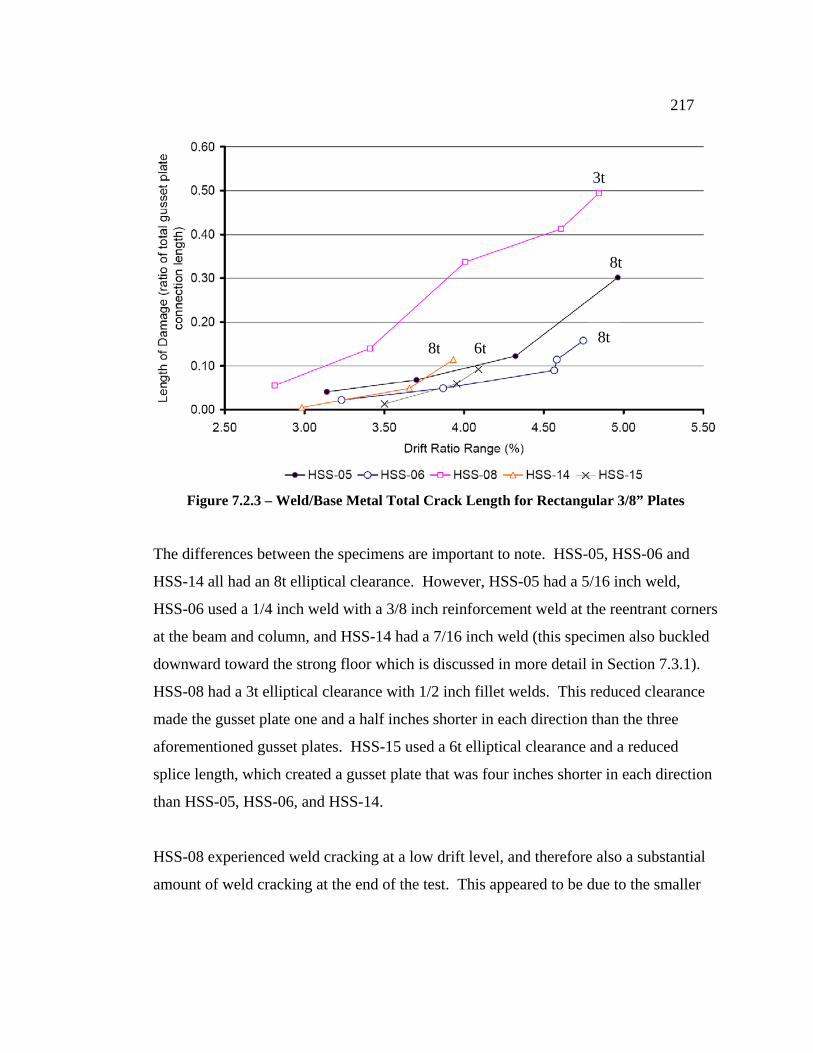
217
Figure 7.2.3 – Weld/Base Metal Total Crack Length for Rectangular 3/8” Plates
The differences between the specimens are important to note. HSS-05, HSS-06 and
HSS-14 all had an 8t elliptical clearance. However, HSS-05 had a 5/16 inch weld,
HSS-06 used a 1/4 inch weld with a 3/8 inch reinforcement weld at the reentrant corners
at the beam and column, and HSS-14 had a 7/16 inch weld (this specimen also buckled
downward toward the strong floor which is discussed in more detail in Section 7.3.1).
HSS-08 had a 3t elliptical clearance with 1/2 inch fillet welds. This reduced clearance
made the gusset plate one and a half inches shorter in each direction than the three
aforementioned gusset plates. HSS-15 used a 6t elliptical clearance and a reduced
splice length, which created a gusset plate that was four inches shorter in each direction
than HSS-05, HSS-06, and HSS-14.
HSS-08 experienced weld cracking at a low drift level, and therefore also a substantial
amount of weld cracking at the end of the test. This appeared to be due to the smaller
3t
8t 6t
8t
8t
218
elliptical clearance of 3t. Because of the amount of weld cracking, an elliptical
clearance of 3t is not recommended (Herman, 2007)
Of the remaining four specimens (HSS-05, HSS-06, HSS-14 and HSS-15), the two with
the larger welds (7/16 inch) also had considerable smaller drift ratio ranges (3.93% and
4.09%). This is compared to the other two specimens which had drift ratio ranges of
4.75% and 4.96%. There were other possible reasons for HSS-14 and HSS-15 to have
lower drift ranges. HSS-14 buckled down, which is discussed in more detail in the next
section. And HSS-15 had a reduced splice length. However, the stiffness of the gusset
plate for HSS-15 was essentially equal to the stiffness of HSS-05, HSS-06 and HSS-14
as determined by a finite element analysis shown in Appendix C.
Therefore, the comparison between HSS-15 and, HSS-05 and HSS-06, appears to show
that the weld size has a role in determining the ultimate drift capacity of the frame,
since there were no other major differences between the frames. The thicker weld in
HSS-15 probably limited the length of cracking, reducing the out-of-plane rotation and
flexibility of the gusset plate.
7.2.5 Tapered Plate vs. Rectangular Plate with Cracked Welds
It has been proposed by the fabrication industry that to simulate tapered plates, the
gusset plate weld of a rectangular plate could be stopped before reaching the end of the
plate. An example is shown in Figure 7.2.4. This type of connection was analyzed
using a finite element model (more information available in Appendix C) to calculate
the stiffness of the connection (also to calculate the stiffness of a fully welded
connection with weld cracks), and was compared between the stiffnesses of the tapered
gusset plates and the rectangular plates (everything else being equal). Figure 7.2.5
shows the rotational stiffness of each of these plates.
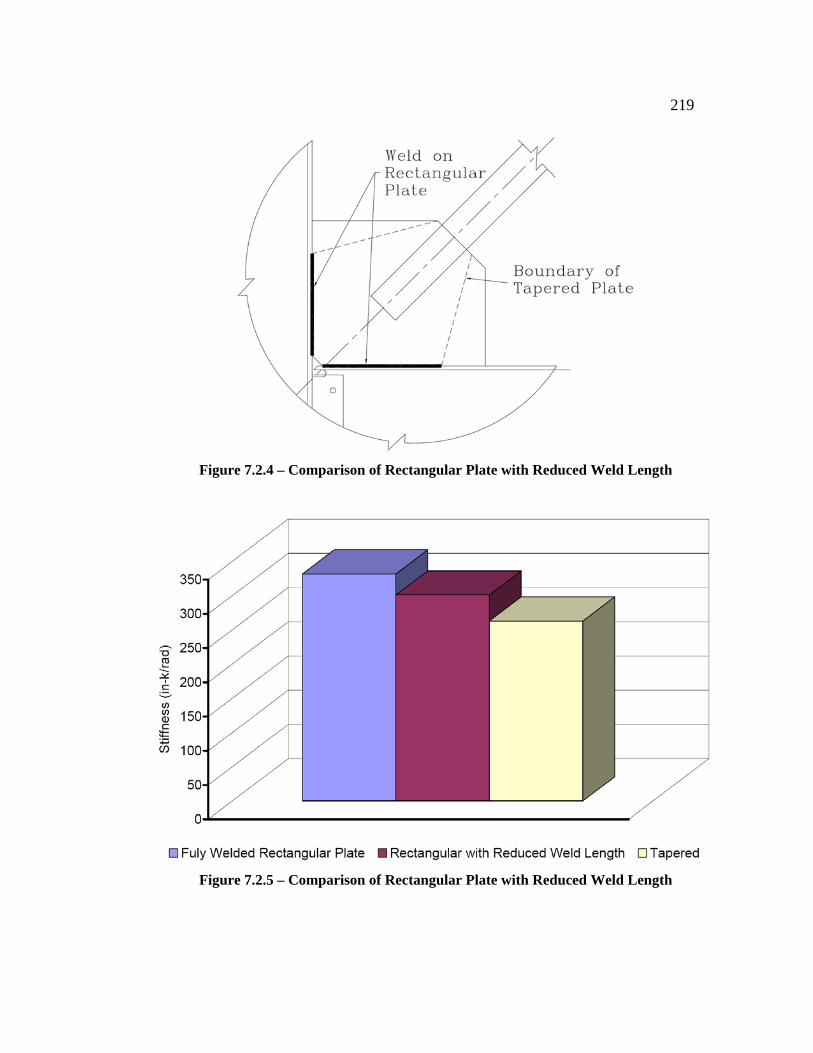
219
Figure 7.2.4 – Comparison of Rectangular Plate with Reduced Weld Length
Figure 7.2.5 – Comparison of Rectangular Plate with Reduced Weld Length

220
This graph shows that while the stiffness of the plate with the reduced weld length was
smaller than the fully welded rectangular plate, the tapered plate still had less stiffness.
Therefore, simply reducing the weld length of the rectangular plate does not exactly
imitate the tapered plate. This analysis does not include nonlinearity. However, it is
presumed that the strength of the rectangular plate with the reduced welds will be less
that the fully welded rectangular plate, and larger than the tapered plate.
7.2.6 Conclusions
The gusset plate welds have an impact on the seismic response and ultimate drift
capacity of the specimen. When the welds or base metal crack, the in-plane and out-of-
plane effective gusset plate stiffness and strength are reduced and higher rotations and
displacements are experienced by the gusset plate. This reduces the demand on the
center of the brace, prolonging the life of the brace. Figure 7.2.6 shows a graph which
marks the total amount of cracking verses the total drift range for each specimen (each
mark on the graph represents a single specimen). This graph does not take into account
many other influential characteristics and therefore has limited value. However, the
graph shows a direct positive relationship between amount of weld tearing and total
drift ratio range.

221
Figure 7.2.6 – Total Drift Range vs. Weld/Base Metal Tearing Length
More importantly, these welds should not fail before brace fracture occurs. As shown
with HSS-01, this reduces the ultimate drift capacity of the frame. Additionally, the
amount of weld cracking in HSS-08 was quite severe, and an alternate applied load may
cause the welds to completely fracture before the brace fractures. Therefore, using a 3t
elliptical clearance is not recommended to design the gusset plate geometry. Also, the
weld cracking in HSS-05 was high and a stronger weld should be utilized (see Section
7.3 for further discussion).
While this evidence points to allowing some weld cracking, it may not be reliable in
real structures. Section 7.4 further discusses the allowance of weld cracking.
The thickness of the weld and the base metal does affect when these components crack.
However, these components may also crack depending on the applied displacement.

222
7.3 Displacement History Comparison
Due to the experiment setup, the applied displacement history was not the same for all
of the specimens. Losses resulting from rigid body rotation and bolt slip at the frame
boundaries caused differences. More severe differences were caused by the direction of
brace buckling. In most of the tests, the brace buckled up away from the strong floor.
However, in three specimens (HSS-01, HSS-02, and HSS-14), the brace buckled toward
the strong floor. The applied negative displacement was limited in HSS-02 and HSS-14
to prevent the brace from contacting the floor. Here, the influence of these limited
applied compression drifts on specific specimens is studied.
7.3.1 Displacement History of HSS-05 and HSS-06 vs. HSS-14
HSS-14 was nearly identical to HSS-05 and HSS-06. They all had an 8t elliptical
clearance. However, HSS-05 had a 5/16 inch weld, HSS-06 used a 1/4 inch weld with a
3/8 inch reinforcement weld at the reentrant corners at the beam and column, and
HSS-14 had a 7/16 inch weld (this specimen also buckled downward toward the strong
floor). This subsection will look at what affect the difference in the applied
displacement had on these specimens. Figures 7.3.1 through 7.3.3 shows the
displacement histories for HSS-05, HSS-06, and HSS-14 respectively. Figure 7.3.4
shows a comparison of the ultimate drift range of the three frames.
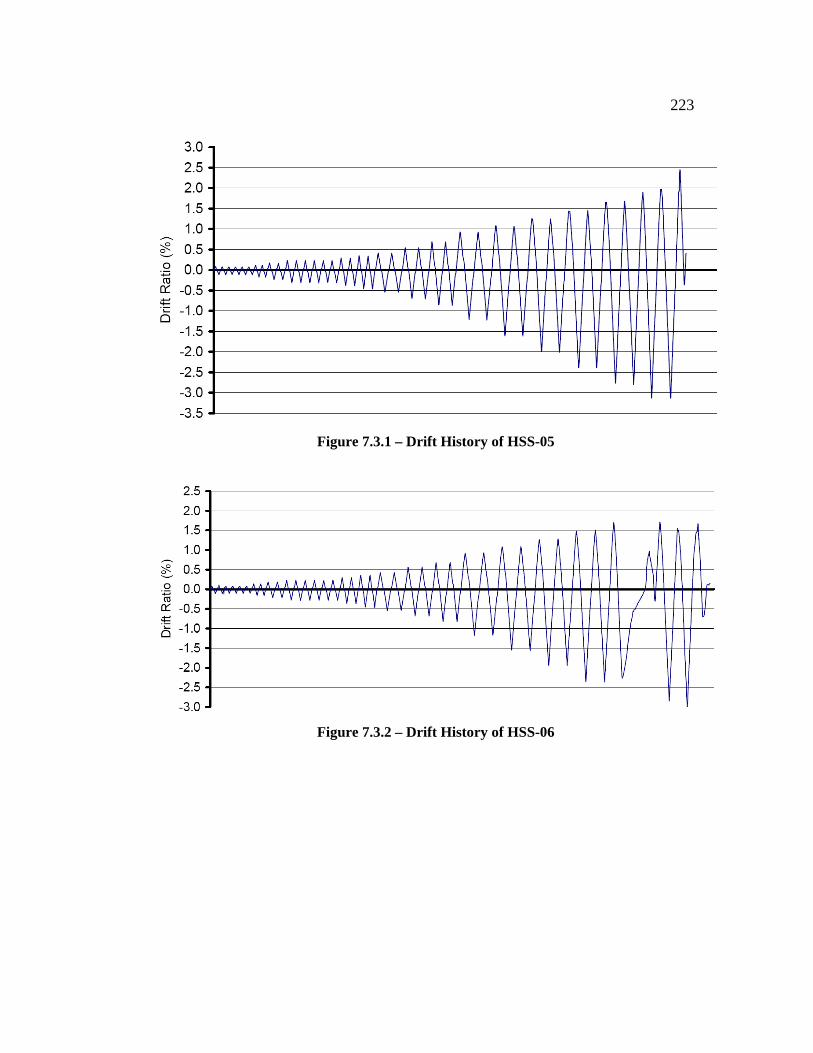
223
Figure 7.3.1 – Drift History of HSS-05
Figure 7.3.2 – Drift History of HSS-06

224
Figure 7.3.3 – Drift History of HSS-14
Figure 7.3.4 – Ultimate Drift Range of HS-05, HSS-06 and HSS-14
The negative drift capacity of HSS-14 was two thirds of that achieved by HSS-05 and
HSS-06. However, the positive drift capacity of HSS-14 was exactly the same as the
positive drift capacity of HSS-05. Figure 7.2.4 shows the performance for the welds
was similar to a drift range of 3.7%. At which point, the negative drift was limited for
HSS-14 due to the direction of brace buckling. With increased negative drift demand,
specimen HSS-05 and HSS-06 the weld cracks elongated, increasing the flexibility of
the gusset plate connection. And therefore, the additional negative drift demand in
HSS-05 and HSS-06, may not have contributed to the cumulative strain in the brace,
therefore, not significantly influencing the positive drift capacity.

225
7.3.2 Displacement History of HSS-02 vs. HSS-03
Similarly, HSS-02 buckled down, and HSS-03 buckled up. Specimen HSS-02 had a 1/2
inch weld, while HSS-03 had a 7/16 inch weld. Figure 7.2.5 shows a comparison of the
ultimate drift range of the two specimens. The results are similar.
Figure 7.3.5 – Ultimate Drift Range of HSS-02 and HSS-03
7.3.3 Conclusion
The data provided in this section shows that similar specimens with severely contrasting
applied negative drifts, had very similar positive drift capacities. This implies that
brace fracture may not only depend on the maximum negative drift ratio. This may be
due to weld and base metal cracking making the connection more flexible as shown in
Section 7.2.1. It is also possible that the strain applied during the positive drift has a
greater affect than the strain applied during the negative drift (although there is no
evidence of this). Table 7.3.2 shows a list of specimens in order of highest positive drift
capacity. Table 7.3.1 shows a list of specimens in order of largest drift range for
comparison purposes.

226
Table 7.3.1 – Specimens Arranged From Largest Total Drift Range

227
Table 7.3.2 – Specimens Arranged From Highest Positive Drift Capacity
Table 7.3.2 shows a very strong pattern. The groups in this table were assigned to help
show the pattern discussed here. Aside from group 1, the bolted connection of HSS-16,
and HSS-08 which had early weld cracking, the three specimens with the highest
positive drift capacity were the specimens that used tapered plates, shown in group 2
228
(there were no other tapered plates). HSS-17 used a 3/8 inch plate and received the
highest positive drift, while HSS-13 and HSS-10 used 1/2 inch plates and received the
2nd and 3rd highest positive drift. Group 3 included four specimens with the next four
highest positive drifts. All of these specimens used 3/8 inch rectangular plates with
elliptical clearances ranging from 6t to 8t. The following three specimens with the next
highest drifts in the table, group 4, all used 1/2 inch rectangular plates with elliptical
clearances ranging from 6t to 9t. Specimen HSS-09 used a similar gusset plate and
received a positive drift similar to this group. However, this specimen used CJP welds
to connect the gusset plate to the frame and had a smaller drift capacity; therefore it is
included in group 5. The remaining specimens in group 5, either used the 2t straight
line clearance with a half inch gusset plate, or used a 7/8 inch gusset plate with an
elliptical clearance. These specimens had the smallest positive drift capacity.
The negative drift does affect fracture of the brace. However, with the results shown in
this chapter, specimens with equivalent gusset plate geometry and thickness have
fractured at similar positive drifts regardless of the applied negative drift. The table
above shows some striking patterns with the gusset plate geometry.
It is important to remember that in SCBFs, it is required that braces face opposite
directions in one floor. Therefore, a more symmetric applied displacement is likely,
similar to the specimens which were limited in negative drift.
7.4 Actual Seismic Loading
Unfortunately, an earthquake will not load a structure exactly as the experiment loaded
the specimens. Instead, the earthquake will apply unpredictable displacements, and
may have many more cycles than what was tested in the lab. If the welds crack and are
subjected to more cycles of displacement, which may not even be as high as the
displacement applied in the experiment, the cracks will still propagate. One critical
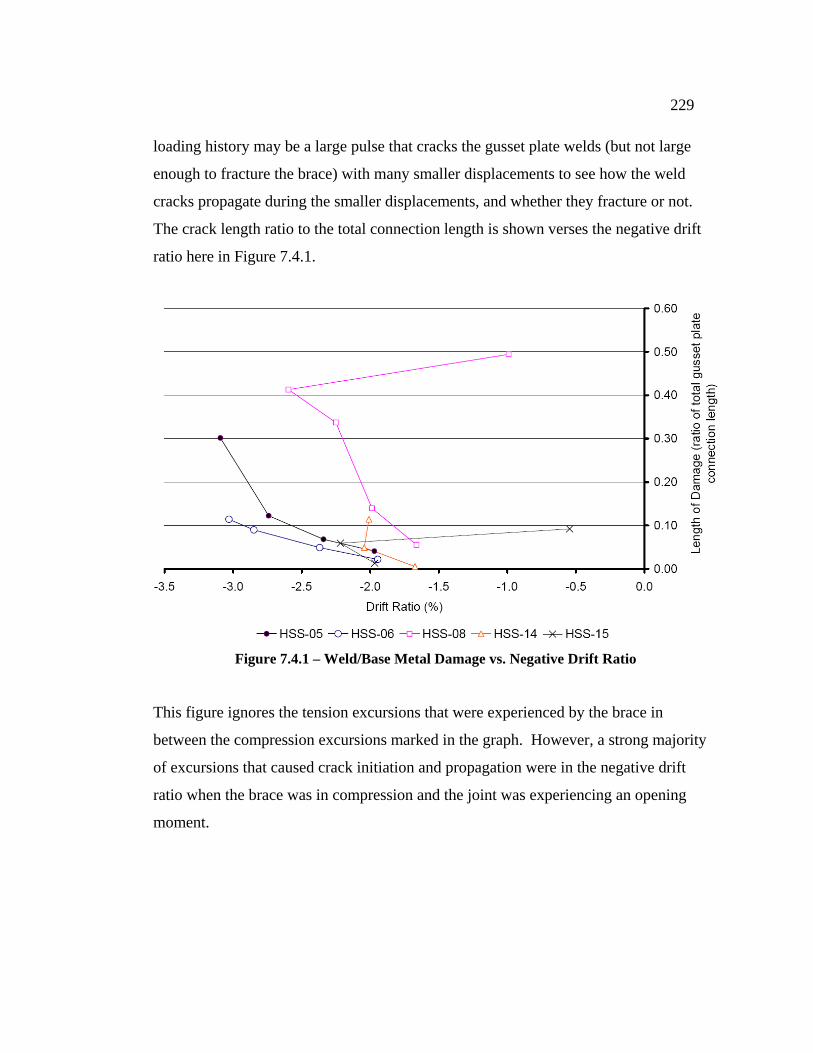
229
loading history may be a large pulse that cracks the gusset plate welds (but not large
enough to fracture the brace) with many smaller displacements to see how the weld
cracks propagate during the smaller displacements, and whether they fracture or not.
The crack length ratio to the total connection length is shown verses the negative drift
ratio here in Figure 7.4.1.
Figure 7.4.1 – Weld/Base Metal Damage vs. Negative Drift Ratio
This figure ignores the tension excursions that were experienced by the brace in
between the compression excursions marked in the graph. However, a strong majority
of excursions that caused crack initiation and propagation were in the negative drift
ratio when the brace was in compression and the joint was experiencing an opening
moment.

230
The graph shows that weld cracks propagated during the negative drift ratios regardless
of the magnitude of the drift. This is because the stress concentrations that exist at the
edge of the crack will further propagate the crack even at small negative drift ratios.
Therefore, even though all of the gusset plate welds (except the welds in HSS-01)
withstood applied displacements up to brace fracture, it should not be assumed that this
will be guaranteed in a building structure even with similar gusset plate geometry. This
is especially true for earthquakes that last a long period of time, but do not necessarily
apply large displacements to a structure. For this reasoning, the welds should not have
as much cracking as HSS-05 and HSS-08 experienced.
7.5 Gusset Plate Strength and Stiffness
Regardless of which drift capacity is used to compare specimens (positive drift capacity
or total drift range), gusset plate geometry will affect the drift capacity of the specimen
as shown in Chapter 6. This section will examine specimens in the entire test program
to further distinguish the characteristics of the gusset plate that are advantageous to the
drift life of the brace.
As stated earlier, if the strength and stiffness of the gusset plate are maintained at a
minimum to support design loads, a higher ultimate drift capacity of the brace will
result. Limited axial strength and stiffness, and rotational strength and stiffness both
add to the ultimate drift capacity of the frame.
7.5.1 Rotational Strength and Stiffness
Free rotation at the gusset plate allows the brace to buckle in single curvature. The
graph below in Figure 7.5.1, shows the SW gusset plate rotations for seven specimens
and is a strong indicator of which gusset plate geometry allows free rotation at the joint.
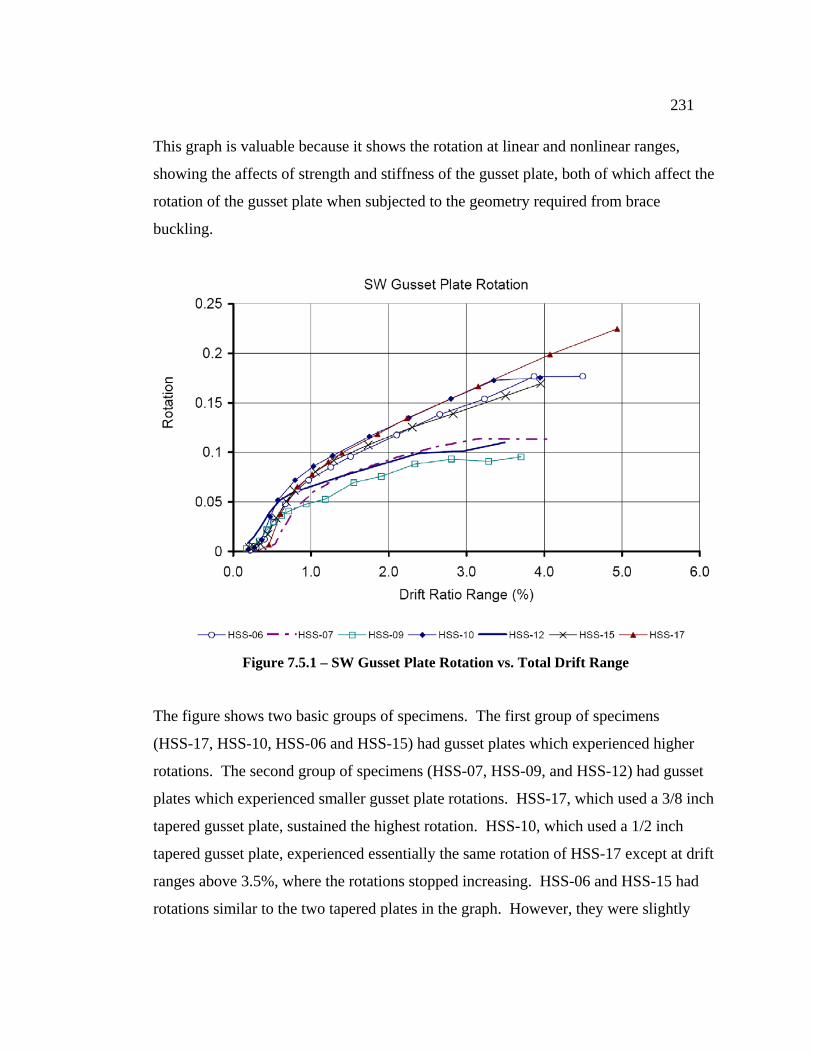
231
This graph is valuable because it shows the rotation at linear and nonlinear ranges,
showing the affects of strength and stiffness of the gusset plate, both of which affect the
rotation of the gusset plate when subjected to the geometry required from brace
buckling.
Figure 7.5.1 – SW Gusset Plate Rotation vs. Total Drift Range
The figure shows two basic groups of specimens. The first group of specimens
(HSS-17, HSS-10, HSS-06 and HSS-15) had gusset plates which experienced higher
rotations. The second group of specimens (HSS-07, HSS-09, and HSS-12) had gusset
plates which experienced smaller gusset plate rotations. HSS-17, which used a 3/8 inch
tapered gusset plate, sustained the highest rotation. HSS-10, which used a 1/2 inch
tapered gusset plate, experienced essentially the same rotation of HSS-17 except at drift
ranges above 3.5%, where the rotations stopped increasing. HSS-06 and HSS-15 had
rotations similar to the two tapered plates in the graph. However, they were slightly

232
lower at a given drift ratio. The next group of lines in the graph (three of them) shows
the gusset plate rotations of larger, thicker gusset plates. HSS-07, which used a 7/8 inch
gusset plate and an elliptical clearance, HSS-09, which used a 1/2 inch rectangular
gusset plate with CJP welds, and HSS-12 which used a 1/2 inch gusset plate with a 2t
straight line clearance, all had significantly smaller rotations than the four
aforementioned specimens. This is because the gusset plates used for these specimens
have much higher stiffness as shown in Appendix C and strength (an example is shown
in 7.5.2), prohibiting rotation. This then puts higher curvature at the center of the brace,
leading to earlier brace fracture.
In conclusion, the figure above shows basically two groups of specimens. The first
group included HSS-06, HSS-10, HSS-15 and HSS-17. All of these specimens had less
stiff, less strong gusset plates which led to larger ultimate drift range capacities and
higher positive drift capacities as shown here in Table 7.5.1:
Table 7.5.1 – Drift Capacity of Specimens Analyzed for Gusset Plate Rotation
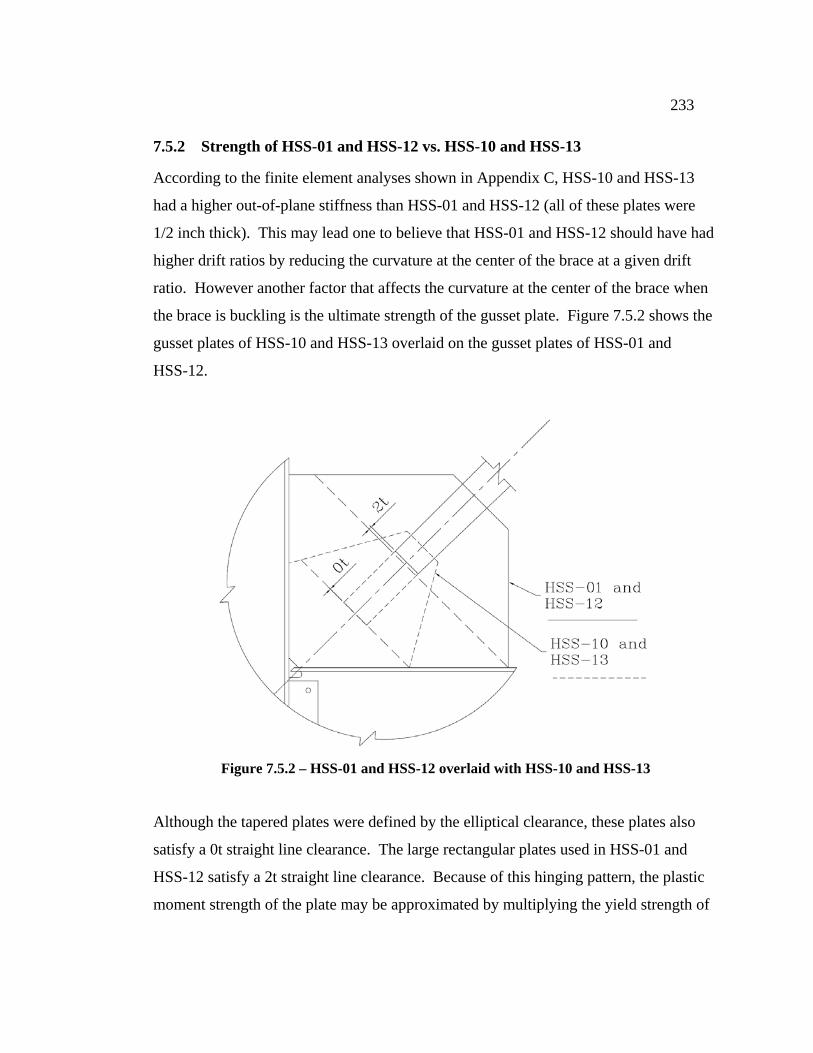
233
7.5.2 Strength of HSS-01 and HSS-12 vs. HSS-10 and HSS-13
According to the finite element analyses shown in Appendix C, HSS-10 and HSS-13
had a higher out-of-plane stiffness than HSS-01 and HSS-12 (all of these plates were
1/2 inch thick). This may lead one to believe that HSS-01 and HSS-12 should have had
higher drift ratios by reducing the curvature at the center of the brace at a given drift
ratio. However another factor that affects the curvature at the center of the brace when
the brace is buckling is the ultimate strength of the gusset plate. Figure 7.5.2 shows the
gusset plates of HSS-10 and HSS-13 overlaid on the gusset plates of HSS-01 and
HSS-12.
Figure 7.5.2 – HSS-01 and HSS-12 overlaid with HSS-10 and HSS-13
Although the tapered plates were defined by the elliptical clearance, these plates also
satisfy a 0t straight line clearance. The large rectangular plates used in HSS-01 and
HSS-12 satisfy a 2t straight line clearance. Because of this hinging pattern, the plastic
moment strength of the plate may be approximated by multiplying the yield strength of

234
the plate (Fy) by the plastic section modulus (btg2/4), where b is equal to the entire
length of the hinge line (as opposed to the Whitmore width since the entire width of the
plate will need to bend in order to satisfy compatibility).
4
2g
yp
btFM = (7.1)
For HSS-01 and HSS-12, the plastic moment capacity is:
inkM p −=⎟⎟⎠
⎞⎜⎜⎝
⎛= 5.132
45.0*4.4250
2
(7.2)
For the tapered plates, the ultimate plastic capacity is:
inkM p −=⎟⎟⎠
⎞⎜⎜⎝
⎛= 1.74
45.0*7.2350
2
(7.3)
The moment capacity of the large rectangular plates is almost twice that of the tapered
plates. Therefore, once the gusset plates reached their plastic strength, the rectangular
plates applied a higher end moment, thereby limiting the out-of-plane gusset plate
rotation compared to the out-of-plane plate rotation of the tapered plates. This led to
higher curvature in the brace at the hinge point for the rectangular plates. Figure 7.5.3
shows this smaller rotation with HSS-12 compared to HSS-10. This figure also shows
that at smaller drifts (below 0.5%), HSS-12 had higher gusset plate rotation than
HSS-10 at a given drift due to the smaller gusset plate stiffness value for the gusset
plate used in HSS-12 (Appendix C). This implies that the ultimate strength of the
gusset plate may be a better indicator than the stiffness of the gusset plate in

235
determining which will have the largest effect on the hinge point (since HSS-12 had
quite a smaller drift capacity than HSS-10).
This calculation of moment capacity should not be used for gusset plates that use an
elliptical clearance. This is because bending in the perpendicular direction (as
discussed in Chapter 6) increases the strength of the gusset plates that use an elliptical
clearance. Also, nonlinear geometry will add to the stiffness of the plates that use an
elliptical clearance. This thesis does not examine the ultimate strength of these plates.
Figure 7.5.3 – HSS-10 and HSS-12 SW Gusset Plate Rotation
7.5.3 Axial Strength and Stiffness
Specimens that had gusset plates with limited axial strength and stiffness reduced the
amount of elongation in the brace for a given drift ratio. The theoretical axial
stiffnesses of the gusset plates are shown in Appendix C, and the theoretical axial

236
strengths are shown in Table 7.5.2 and were determined by Equation 7.4 below where w
is the maximum width (measured perpendicular to the longitudinal axis of the brace) of
the gusset plate and tg is the thickness of the gusset plate. Figure 7.5.4 shows the brace
elongation verses the drift ratio for ten specimens.
gyp wtFP = (7.4)
Table 7.5.2 – Axial Strength of Specimens

237
Figure 7.5.4 – Brace Elongation vs. Drift Ratio
The graph (along with the table) shows that the stiffer and stronger gusset plates
required the brace to be elongated more at a given drift ratio. HSS-11 used a 7/8 inch
gusset plate with a large beam (W16x89). This specimen had the highest gusset plate
stiffness (Appendix C) and required the highest brace elongation at a given drift ratio.
This specimen also had the smallest drift ratio range and the smallest positive drift
capacity of all of the specimens. (This specimen did not have any weld cracking either.
However, at the extremely low drift range which the brace failed, only two other
specimens had experienced significant weld damage, HSS-01 and HSS-16.) The three
specimens with the three next highest brace elongation measurements were HSS-07,
which used a 7/8 inch gusset plate and an elliptical clearance, HSS-09, which used a 1/2
inch gusset plate with CJP welds, and HSS-12 which used a 1/2 inch gusset plate with a
2t straight line clearance. Of the ten specimens analyzed here, these three specimens

238
had the next three highest gusset plate strengths as shown in Table 7.5.2 and also had
the next three smallest positive drift capacities and ultimate drift ranges. The next two
specimens, HSS-10 and HSS-13 which had average strengths and stiffnesses, used 1/2
inch tapered plates, and had average drift ranges, 4.47% and 4.09% respectively. The
remaining four specimens, HSS-15, HSS-06, HSS-17 and HSS-08, which all had 3/8
inch gusset plates and low in-plane strengths and stiffnesses, had the lowest amount of
brace elongation at a given drift. These specimens also had high ultimate drift ranges
and high positive drift capacities.
HSS-08 had significantly less brace elongation than the other braces, including the other
specimens with 3/8 inch plates, including both tapered and rectangular plates. This
specimen sustained large weld cracks and this may have contributed to the lower
amount of brace elongation. However, even at low drifts, prior to weld cracking, the
brace elongation was smaller than any of the other specimens at a given drift ratio. It is
not clear why this specimen had lower elongation, although it allowed this specimen to
have the 2nd highest positive drift capacity, next only to HSS-16.
7.6 Performance of Framing Elements
Damage to the framing elements was noticed in the form of yielding, local web
buckling, and local flange buckling in most of the specimens. To focus on Life Safety
and Collapse Prevention performance levels, only local buckling of the framing
members is analyzed in this section.
A real structure may respond quite differently to local buckling than the way the
specimen responded in the experiment. This is because, for beams in the specimen,
there is no gravity load applied. However, in a real structure, a beam carries the slab,
and if a flange or web buckles, the load carrying capability may be compromised. For
the columns in the experiment, the gravity load is applied by post-tensioned rods. This

239
application is displacement controlled. Therefore, if local buckling causes the column
to lose capacity, the load is simply reduced. However, in a real building structure,
gravity loads are force controlled on the columns. Therefore, if local buckling causes
the column to lose capacity, the force is not reduced, and partial or total collapse is
possible.
It is much more valuable to the structure for damage to occur to the beam instead of the
column because the column bears the gravity load (and seismic load) of the entire
building above the frame. Table 7.6.1 shows where and when local buckling of the
framing elements occurred for all of the tests in the program. In the table, local
buckling of the column is shown underlined in bold.
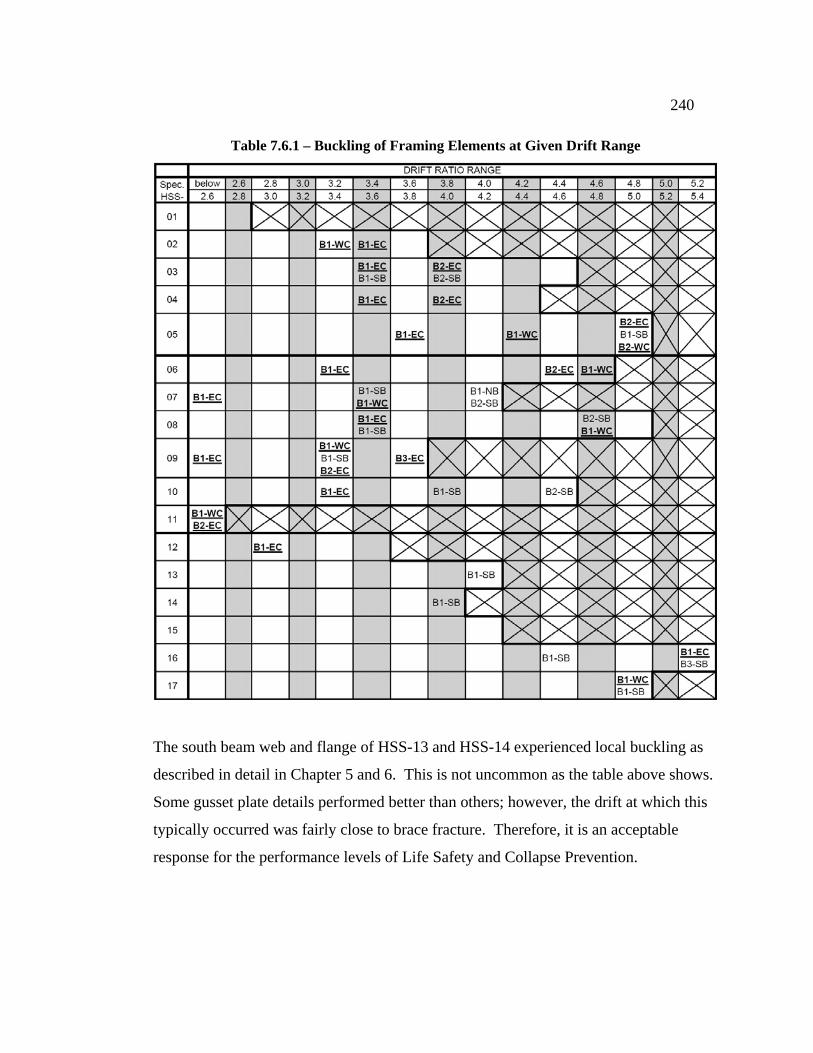
240
Table 7.6.1 – Buckling of Framing Elements at Given Drift Range
The south beam web and flange of HSS-13 and HSS-14 experienced local buckling as
described in detail in Chapter 5 and 6. This is not uncommon as the table above shows.
Some gusset plate details performed better than others; however, the drift at which this
typically occurred was fairly close to brace fracture. Therefore, it is an acceptable
response for the performance levels of Life Safety and Collapse Prevention.
241
A stronger beam will prevent local beam web and local beam flange buckling from
occurring. However, a strong beam will have negative consequences on the drift life of
the brace. HSS-11 used a larger beam (and also used a 7/8 inch gusset plate). This
specimen had the smallest ultimate drift range (2.58%) and the smallest positive drift
capacity (1.06%). HSS-07, which had the same gusset plate design, but had a smaller
beam, had an ultimate drift range (4.04%) and the positive drift capacity (1.26%).
Therefore, the beam should not be made larger to avoid local buckling of the beam
flange or web. The existing local buckling and crippling checks in the AISC
Specifications are adequate for the design of the beams. Although these equations may
not totally prevent this damage state from occurring, they will postpone these local
damage conditions from occurring until high drift levels in which Life Safety and
Collapse Prevention are concerned.
It is more critical for the columns to avoid or buckling. However, almost all of the
specimens had local buckling of the column flange at some point. The specimens that
showed the earliest signs of column buckling were the same specimens that had the
lower ultimate drift ranges, and the lower positive drift capacities. These specimens
were HSS-07 and HSS-11, which had 7/8 inch gusset plates and specimens HSS-09 and
HSS-12, which had 1/2 inch gusset plates, as shown in the table above. HSS-16 and
HSS-17 did not experience buckling of the columns until relatively late in the
experiment (over 4.8% drift range). In HSS-16, this is attributed to the cracks in the
base metal which relieved the constraint on the column. However, in HSS-17, it is
attributed to the low in-plane rotational stiffness of the tapered gusset plate. Another
interesting note is that in HSS-15, which was the specimen with the reduced splice
length making the gusset plate very small, no local buckling occurred. This further
leads to evidence that smaller, more flexible gusset plates are more advantageous to
preventing collapse of the structure.
242
It should be noted that after the brace fractures, the stability of the structure will rely on
frame action of the beams and columns. The larger gusset plates may be helpful in
resisting this frame action along with the fully rigid beam to column connection.
However, a detailed analysis of how helpful these larger plates would be to the
resistance of the frame was not carried out. It is believed that the benefit would not
outweigh the benefits that a smaller gusset plate has shown to provide.
7.7 Conclusions
The size and shape of the gusset plate greatly affect the structural response of special
concentrically braced frames. In general, the gusset plates that are more flexible and
have a smaller strength, both rotational and axial, will allow the brace to reach a higher
ultimate drift capacity for the frames (so long as the maximum load of the brace can be
transferred to the frame). When the weld or base metal cracks, the effective stiffness
(and presumably strength) is reduced resulting in a larger drift capacity.
From the experimental results, it is shown that the negative drift ratio may not affect the
positive drift capacity as much as originally expected. This is because during the
negative drift excursions, buckling of the brace and the opening moment cause the
welds/base metal to crack. The cracks reduce the effective stiffness of the plate,
prolonging the life of the brace. Therefore the positive drift ratio may be a better way to
compare the drift capacity of these specimens.
The design of the weld should not fracture before the brace fractures. However, certain
amounts of cracking of the welds/base metal will prolong the life of the brace.
Therefore, the weld should have a balanced design. It should only crack at high drift
levels when brace fracture is imminent.
243
The larger, stiffer, stronger gusset plates also lead to damage in the framing members
(including the columns) at smaller drifts. This reduces the structures ability to carry
gravity (and seismic) loads. This is further evidence that these gusset plates should not
be used for SCBFs.
244
Chapter 8: Design Guide
8.0 Introduction
This chapter presents a design guide to assist structural engineers in designing and
analyzing gusset plates for SCBFs. This design guide has been written for SCBFs using
tube sections as the brace, which are welded to a gusset plate that is welded to the beam
and column and with complete joint penetration welds joining the web and flanges of
the beam to the flange of the column. Although the connection type is specific, it is
possible to extrapolate the theoretical information in this guide, and apply it to other
connection types.
The geometry and thickness of the gusset plate have a significant impact on the overall
response of the braced frame. It is important that the gusset plate is strong enough so
that it does not fail before the brace develops its full resistance and ductile capacity.
However, if the gusset plate is too stiff and strong, it will negatively affect the inelastic
deformation capacity of the brace and the frame. The goal of this design guide is to
balance these two criteria by designing a gusset plate with as low stiffness as possible,
while retaining the required strength of the plate.
Limit states that affect the thickness of the gusset plate include Whitmore yielding,
Whitmore fracture, block shear, gross shear at the column, gross shear at the beam, and
buckling of the gusset plate. To maximize the ductility of the system, some of these
limit states should be altered from the current design provisions. Section 8.1 discusses
the recommended changes to current design procedures.
This research has presented evidence that the current 2t straight line offset is
detrimental to the braced frame in that it leads to larger and thicker gusset plates which
245
induce greater inelastic demands into the beam and column framing elements and may
cause early failure of the brace. Instead, an elliptical offset model has been proposed to
reduce the size and thickness of the gusset plate while permitting brace end rotation and
developing the required resistance of the brace. This elliptical offset can be used with
rectangular plates or tapered plates. Section 8.2 will discuss how to design a gusset
plate using the elliptical clearance method. Section 8.3 will discuss how to determine
what the elliptical clearance of an existing gusset plate is. Both of these methods use an
iterative process.
Section 8.4 will discuss the design of the gusset plate welds. These welds create a load
path from the gusset plate to the frame and can significantly influence the hysteretic
performance of the brace. The tests in this thesis have also checked the necessity of the
net section reinforcement. Section 8.5 will discuss recommendations made for the
design of this reinforcement. Section 8.6 will discuss the beam-to-column connection.
8.1 Gusset Plate Strength Design and Analysis
In designing an SCBF for seismic loads it is important that the gusset plates have
limited stiffness. The limit state calculations listed in this section will calculate the
resistance and minimum required thickness of the gusset plate for strength, making
various changes to the current design provisions.
As stated in AISC, the design forces shall be based on the expected strength of the
brace. For tensile limit states, the design force shall be:
gyyt AFRP = (8.1)
and for compressive limit states the design force shall be:

246
nyc PRP 1.1= (8.2)
Where Ry is the ratio of the expected yield strength of the brace to the nominal yield
stress of the brace (Fy), Ag is the gross area of the section and Pn is the nominal
compressive strength of the brace determined by the AISC specifications.
Typically, limit states require a resistance factor (φ) which reduces the ultimate strength
capacity. However, strength design considerations are not the issue for gusset plate
connection design because the connection design forces far exceed the factored loads on
the structure. Instead ductility under extreme seismic loading is the major design
concern. An alternate design method (Roeder, Lehman, and Yoo 2005) has been
developed based upon β values and balance conditions to optimize the ductility
achieved with the structural system. Therefore, β shall be used in place of φ to
determine the minimum strength of the limit states, for tensile forces:
tn PR ≥β (8.3)
for compressive forces:
cn PR ≥β (8.4)
8.1.1 Net Section Fracture
Net section fracture is a possible failure that occurs when the gusset plate tears at the
end of the brace joint. This net section fracture is normally defined by the Whitmore
width and is particularly important in bolted brace joints. Nevertheless, this tensile

247
fracture is possible for welded braces, and it must be considered in gusset plate
connection design.
Typically, net section fracture limit states require a φ factor of 0.75. It is recommended
to use a β value of 0.85 in place of the φ factor for the design of the gusset plate for net
section fracture on the Whitmore width, because tests have shown that reasonable
ductility is achieved with this β value. The strength of the net section fracture in the
gusset plate should be determined as:
))30tan(2( ccugn blFtR += ββ (8.1.1)
where:
85.0=β (8.1.2)
and lc is the brace-to-gusset plate splice length. By increasing the β factor, a thinner,
more flexible gusset plate can be used. This will provide greater ductility from the
connection.
8.1.2 Whitmore Yielding
This research has shown that it is desirable for the gusset plate to yield shortly after
brace yielding occurs. This is because; gusset plate yielding increases the inelastic
deformation capacity of the system and decreases the inelastic damage to the beam and
column members. Therefore, a β value of 1.1 for Whitmore yielding is appropriate.
However, with welded brace connections and the expected ratio of the yield to tensile
strength of structural plate material, the net section fracture check will negate the
requirements for this check.
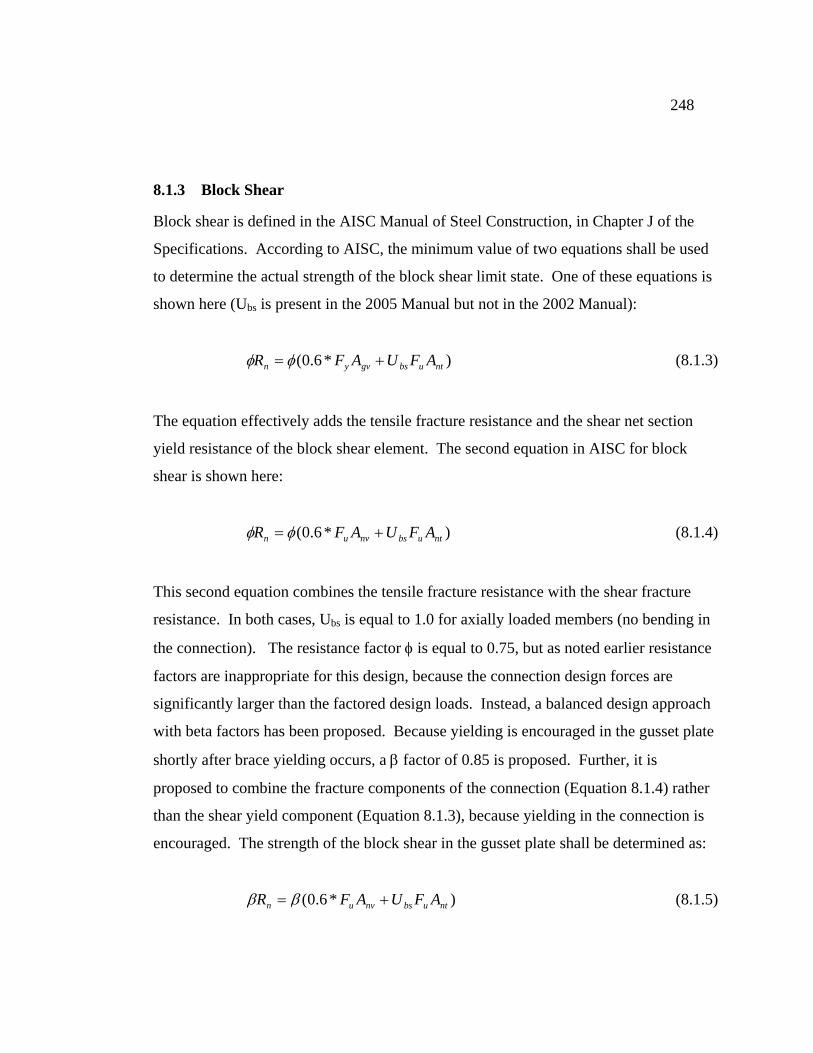
248
8.1.3 Block Shear
Block shear is defined in the AISC Manual of Steel Construction, in Chapter J of the
Specifications. According to AISC, the minimum value of two equations shall be used
to determine the actual strength of the block shear limit state. One of these equations is
shown here (Ubs is present in the 2005 Manual but not in the 2002 Manual):
)*6.0( ntubsgvyn AFUAFR += φφ (8.1.3)
The equation effectively adds the tensile fracture resistance and the shear net section
yield resistance of the block shear element. The second equation in AISC for block
shear is shown here:
)*6.0( ntubsnvun AFUAFR += φφ (8.1.4)
This second equation combines the tensile fracture resistance with the shear fracture
resistance. In both cases, Ubs is equal to 1.0 for axially loaded members (no bending in
the connection). The resistance factor φ is equal to 0.75, but as noted earlier resistance
factors are inappropriate for this design, because the connection design forces are
significantly larger than the factored design loads. Instead, a balanced design approach
with beta factors has been proposed. Because yielding is encouraged in the gusset plate
shortly after brace yielding occurs, a β factor of 0.85 is proposed. Further, it is
proposed to combine the fracture components of the connection (Equation 8.1.4) rather
than the shear yield component (Equation 8.1.3), because yielding in the connection is
encouraged. The strength of the block shear in the gusset plate shall be determined as:
)*6.0( ntubsnvun AFUAFR += ββ (8.1.5)
249
where:
85.0=β (8.1.6)
8.1.4 Gusset Plate Buckling
The gusset plate should be designed to resist buckling. Current design procedures
appear to provide substantial resistance to gusset plate buckling (an example of the
current design procedure is shown in Appendix A.2.3, although this limit state was not a
tested parameter.
From this research, it is recommended that perpendicular reinforcement plates are not
added to the free edges of the gusset plates to resist buckling based on the
recommendations made by Astaneh-Asl (1998), which would have required the use of
these reinforcement plates on the 3/8 inch gusset plates of the specimens within this test
program. It is perceived that these plates prevent deformation of the gusset and end
rotation of the brace thus adversely affecting the life of the brace. This
recommendation is based on the connection detail within these tests and is subject to
change if changes in the connection details are made.
Calculating gusset plate buckling requires the unbraced length of the gusset plate to be
known. To determine this value, the geometry of the plate shall be first determined in
accordance with Section 8.2.
8.1.5 Conclusion
This balanced design approach will permit thinner, more flexible gusset plate
connections which yield shortly after brace yielding but not before significant plastic

250
deformation of the brace. This should assure that the connection has adequate
resistance to develop the capacity of the brace while permitting the full ductility of the
brace and frame system.
Other limit states shall also be checked to design the gusset plate. These limit states
include (but not necessarily limited to) gross shear at the beam, gross shear at the
column and plate buckling. These limit states were not tested parameters, and shall be
calculated with the methods called out in AISC and/or common engineering principles.
8.2 Design of Gusset Plate Geometry Using Elliptical Clearance
Within this design method, there are two options for the gusset plate height to width
ratio. The first option is given in chapter 13 of AISC and constrains the ratio to:
cb ddWTHT −=− )tan()tan( θθ (8.2.01)
where db is the depth of the beam, dc is the depth of the column, and the remaining
variables are shown in Figure 8.2.1. The second option is a slight variance of the first
option. This option constrains the gusset plate so that the free edges of the gusset plate
intersect each other at the centerline of the brace.
Figure 8.2.1 shows a diagram of the elliptical clearance and the variables used to define
it. The figure shows a gusset plate which uses the height to width ratio determined by
Equation 8.2.01. In this option xs is equal to xb (see Figure 8.2.1 for location of
measurements). In the second option, xs is equal to zero, which creates a smaller gusset
plate.

251
Figure 8.2.1 – Gusset Plate with Elliptical Clearance
8.2.1 Rectangular Gusset Plate Geometry Design
A list of the steps to design a rectangular plate with an elliptical clearance is shown
below. The value for the variable N is recommended to be eight, making the clearance
equal to eight times the thickness of the gusset plate, tg (where tg is assumed using
Section 8.1 and verified after the geometry is determined).
1. Assume a height for the gusset plate (HT) to establish a trial geometry with the
following equations:
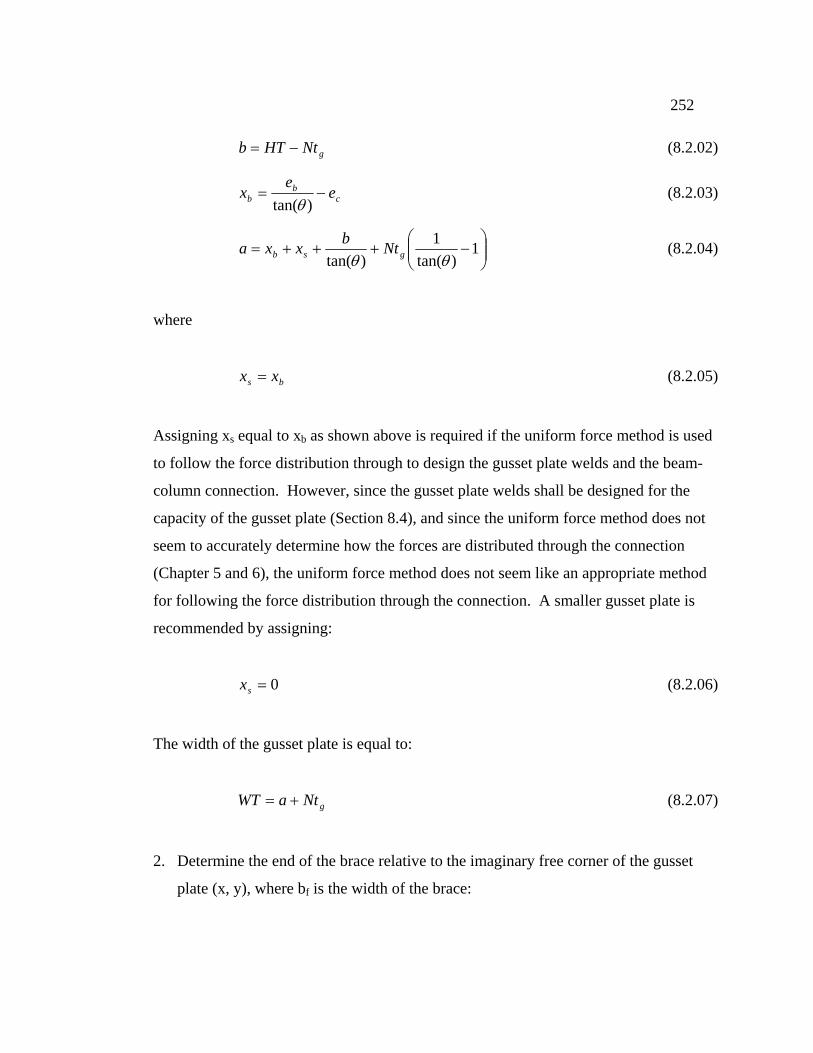
252
gNtHTb −= (8.2.02)
cb
b ee
x −=)tan(θ
(8.2.03)
⎟⎟⎠
⎞⎜⎜⎝
⎛−+++= 1
)tan(1
)tan( θθ gsb Ntbxxa (8.2.04)
where
bs xx = (8.2.05)
Assigning xs equal to xb as shown above is required if the uniform force method is used
to follow the force distribution through to design the gusset plate welds and the beam-
column connection. However, since the gusset plate welds shall be designed for the
capacity of the gusset plate (Section 8.4), and since the uniform force method does not
seem to accurately determine how the forces are distributed through the connection
(Chapter 5 and 6), the uniform force method does not seem like an appropriate method
for following the force distribution through the connection. A smaller gusset plate is
recommended by assigning:
0=sx (8.2.06)
The width of the gusset plate is equal to:
gNtaWT += (8.2.07)
2. Determine the end of the brace relative to the imaginary free corner of the gusset
plate (x, y), where bf is the width of the brace:
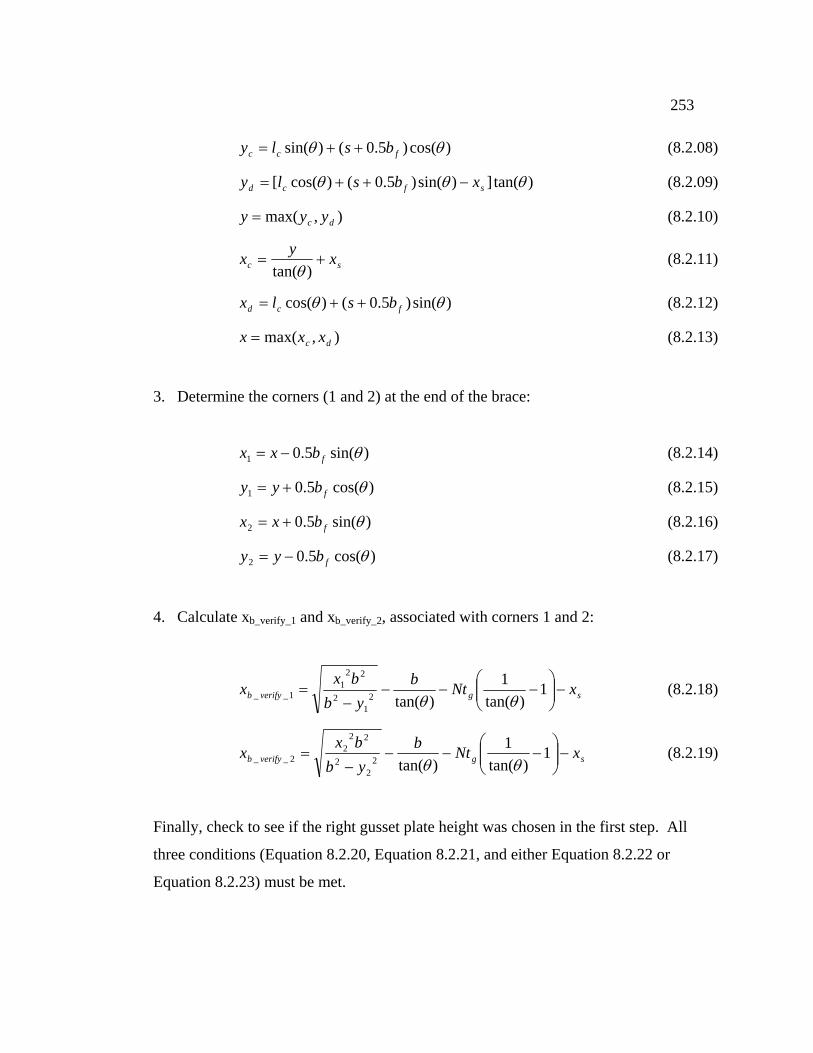
253
)cos()5.0()sin( θθ fcc bsly ++= (8.2.08)
)tan(])sin()5.0()cos([ θθθ sfcd xbsly −++= (8.2.09)
),max( dc yyy = (8.2.10)
sc xyx +=)tan(θ
(8.2.11)
)sin()5.0()cos( θθ fcd bslx ++= (8.2.12)
),max( dc xxx = (8.2.13)
3. Determine the corners (1 and 2) at the end of the brace:
)sin(5.01 θfbxx −= (8.2.14)
)cos(5.01 θfbyy += (8.2.15)
)sin(5.02 θfbxx += (8.2.16)
)cos(5.02 θfbyy −= (8.2.17)
4. Calculate xb_verify_1 and xb_verify_2, associated with corners 1 and 2:
sgverifyb xNtbyb
bxx −⎟⎟
⎠
⎞⎜⎜⎝
⎛−−−
−= 1
)tan(1
)tan(21
2
221
1__ θθ (8.2.18)
sgverifyb xNtbybbxx −⎟⎟
⎠
⎞⎜⎜⎝
⎛−−−
−= 1
)tan(1
)tan(22
2
222
2__ θθ (8.2.19)
Finally, check to see if the right gusset plate height was chosen in the first step. All
three conditions (Equation 8.2.20, Equation 8.2.21, and either Equation 8.2.22 or
Equation 8.2.23) must be met.

254
bverifyb xx ≤1__ (8.2.20)
bverifyb xx ≤2__ (8.2.21)
And
bverifyb xx =1__ (8.2.22)
Or
bverifyb xx =2__ (8.2.23)
If xb_verify_1 and/or xb_verify_2 is greater than xb, then a larger gusset plate is required. If
xb_verify_1 and xb_verify_2 are both smaller than xb, then a smaller gusset plate is required.
This process is continued until the height of the gusset plate has converged.
The gusset plate should then be checked for plate buckling and also verified with the
other limit states specified in Section 8.1 after the geometry has been determined. If the
gusset plate thickness needs to be changed based on the strength of these limit states,
then this process shall be reevaluated.
If a large beam is combined with a small brace angle, or if a large column is combined
with a large brace angle, the gusset plate will be rather large and may have an awkward
geometry. Under these conditions, it is further recommended to set xs equal to zero to
reduce the size of the gusset plate and create a more accurately shaped plate.
8.2.2 Tapered Gusset Plate Geometry Design
For a tapered plate, the procedure in Section 8.2.1 is used. However, it is advised to set
xs equal to zero with Equation 8.2.06 or else awkward shaped plates will result.

255
The height and width of the gusset plate that is determined in Section 8.2.1 will be the
overall height and width of the tapered gusset plate. However the height of the gusset
plate at the column and the width of the gusset plate at the beam will differ due to the
taper. The following equations will determine these values.
If yc > yd then:
)sin()sin(2 θθsb
xWTx fxsf −−−= (8.2.24)
)tan()(
θf
f
xWTHTy
−−= (8.2.25)
If yc < yd then:
)cos()cos(2)tan(
θθθ sb
xHTy fxsf −−+= (8.2.26)
)tan()( θff yHTWTx −−= (8.2.27)
Finally, the height of the gusset plate at the column and the width of the gusset plate at
the beam are determined by Equations 8.2.28 and 8.2.29:
)tan(φfc xHTHT −= (8.2.28)
)tan(φfb yWTWT −= (8.2.29)
Where φ equals the taper angle. The taper angles that were tested in the HSS-10,
HSS-13 and HSS-17 were all 15 degrees. Therefore, a taper angle of 15 degrees is
recommended.

256
8.3 Gusset Plate Weld Design
The research shows that the gusset plate welds are important to the hysteretic behavior
of the brace. These welds need to perform satisfactory in all the performance levels.
Especially, they shall be designed so that they will not completely tear before the brace.
However, some tearing is advantageous to the drift capacity of the frame.
The uniform force method proposes to design the gusset plate welds for the strength of
the brace. This seems logical because it should cause the brace to fail before the welds.
However, since the connection has rotational stiffness both in the plane of the frame and
in the out-of-plane direction, it will draw other forces than simply the force from the
brace. The combination of all of these forces and gusset plate deformations induced by
brace buckling cause higher stress and strain in the welds than what is predicted by the
uniform force method and has lead to premature failure as shown in specimen HSS-01.
The gusset plate welds shall be designed so that they will not fail before the brace
fractures. In order to meet this criterion, the test results show that the welds should be
designed to develop the full capacity of the gusset plate. This can be assured by the
equation:
gyyeffEXX tFRtF ≥6.0**5.1 β (8.3.1)
The 1.5 factor that is multiplied to the strength of the weld above, is used because
testing has indicated that fillet welds subjected to tension resist about 50 percent higher
loads than fillet welds subjected to shear (AISC 2005, AWS 2006).
A β factor of 0.65 is necessary in these calculations, because the existing φ factor equal
to 0.75 has provided slightly unconservative weld sizes in these experiments. An
example using this equation is shown in Appendix A, Section A.3.2.
257
Complete joint penetration welds are permitted for the gusset plate welds in accordance
with AISC section J2, and they also develop the full plastic capacity of the plate if the
CJP weld is of matching metal to the plate steel. Although the tests that have used these
welds have not attained large drift capacity, these tests have each used a 1/2 inch thick
gusset plate. If this design guide is used for this frame geometry and brace force, a 3/8
inch gusset plate will result. Therefore, the stiffness of the connection will be reduced,
leading to a higher drift capacity.
8.4 Design of Net Section Reinforcement
Three tests, HSS-14, HSS-15 and HSS-17 have been tested that did not include net
section reinforcement. According to the AISC Seismic Provisions, net section was
required (see Section 3.3. for calculations). None of these tests showed any cracks or
damage at this location. In this respect, these specimens performed very well. These
results lead to the notion that the net section reinforcement may not be needed.
Nonlinear analyses (Jung 2006) suggest that this net section issue is influenced by the
stiffness of the connection. The analysis further suggests that net section reinforcement
can be avoided in these tests because of the flexibility of the connection.
The net section reinforcement used in the first 13 specimens had a β factor ranging from
0.75 to 0.80 (as determined from the as-built dimensions). Because none of these tests
experienced any damage to the net section, and because none of the tests without the net
section reinforcement received any damage either (β was equal to 1.05 with these
specimens), it is recommended that the limit state of net section fracture at the brace be
checked using a β factor of 0.9. In calculating the strength of the net section, Rt should
be multiplied by the expected ultimate tensile strength of the brace as shown below.

258
teutn PAFRP ≥= ββ (8.4.1)
Or if the net section requires reinforcement:
tsusebubtn PAFAFRP ≥+= )(ββ (8.4.2)
Where Aeb is the effective area of the brace, As is the area of the stiffeners and:
9.0=β (8.4.3)
8.5 Design of Beam-to-Column Connection
This research has shown that concentrically braced frames do not simply act like a truss
experiencing only axial loads. The gusset plate and beam-to-column connection
provide a substantial rigid connection. This rigid connection enables moments to be
transferred from the beam to the column, providing frame action as resistance. It is
recommended to use CJP welds at the flanges and the web of the beam to connect to the
column. This was used in all of the specimens, and high performance was observed
from this connection.

259
Chapter 9: Conclusions and Recommendations
9.0 Introduction
This chapter will present the findings on SCBFs gathered from all of the experiments in
the test program. Section 9.1 will present a summary of the experiment results
completed for this research thesis. Conclusions are shown in Section 9.2 based on the
analysis of all of the experiments within the test program. Section 9.3 summarizes the
design recommendations made in this thesis. Section 9.4 will present recommendations
for future research.
9.1 Summary
Six full scale special concentrically braced frames were tested to observe their response
to applied cyclical displacement. These tests consisted of a single bay, one story frame
with a single diagonal brace. All of the tests used a W12x72 for both of the columns, a
W16x45 for both of the beams and an HSS5x5x3/8 for the brace. The only difference
between the frames was the connection detail between the brace and the frame. The
connection detail greatly affects the seismic performance of the specimens at the
different performance levels as shown by the experiments.
The purpose of the overall test program was to determine how the SCBFs would
respond depending on different connection details. Mainly, changes were made to the
gusset plate geometry. These changes affected the drift life of the brace before fracture,
the amount of weld tearing of the gusset plate welds, the amount of energy dissipation,
and the constructability of the specimen.

260
Specimen HSS-12 used the 2t linear offset to locate the end of the brace and design the
gusset plate. This created a plate with the same geometry and thickness as the reference
specimen (HSS-01) designed to imitate the industry standard. Since HSS-01 fractured
at the gusset plate welds, HSS-12 was designed with complete joint penetration welds.
These CJP welds were the test study parameter. These welds did not crack during the
entire length of the test, and the brace fractured at midspan marking the end of the test.
Because of the size, strength and stiffness (axial and bending) of the plate, the specimen
reached relatively low drift levels. The ultimate drift range was 3.49% while the
positive drift capacity was 1.39%.
The next specimen that was tested, HSS-13, used the same 1/2 inch tapered gusset plate
with a 7t elliptical clearance as HSS-10. However, since HSS-10 received severe weld
cracking, HSS-13 used complete joint penetration welds for the gusset plate welds. The
tapered plate and the CJP welds were the test study parameters. No cracking occurred
in the CJP welds and the brace fractured at midspan. This specimen had an ultimate
drift range of 4.09% and a positive drift capacity of 2.05%.
HSS-14 was tested to analyze the load carrying ability of the net section that did not
include net section reinforcement at the brace-to-gusset intersection. HSS-14 used the
same gusset plate design as HSS-05 and HSS-06, which was a 3/8 inch rectangular plate
with an 8t elliptical clearance. However, the gusset plate welds were slightly larger at
7/16 inch. HSS-14 buckled down to the strong floor and therefore the applied negative
drift was limited to 2.0%. No damage was noticed at the net section holes due to the
lack of reinforcement. Weld damage was noted at a drift ratio of -1.67% and the total
crack lengths measured 11% of the total gusset plate weld length at the end of the test.
The brace ultimately fractured at the center. This specimen had a fairly low ultimate
drift range of 3.93%, but a high positive drift capacity of 1.89%.
261
The following specimen, HSS-15 used a reduced splice length distance between the
brace and the gusset plate, which was the study parameter. This created a much smaller
plate than the other rectangular plates, four inches shorter in each direction than the
gusset plates used in HSS-14. The elliptical clearance was 6t and no net section
reinforcement was used. The welds connecting the brace to the gusset plate needed to
be increased from 5/16 to 7/16 of an inch since the splice length was reduced.
According to the limit states of Whitmore fracture, Whitmore yielding, and block shear,
the gusset plate needed to be thicker than 3/8 inch. However, due to the overwhelming
evidence that thinner plates performed much better, these limit states where changed to
be less stringent and a 3/8 inch plate was used, thereby also checking the accuracy of
these limit state provisions. Cracking of the base metal was noted at a drift ratio of -
1.61% and the total crack lengths measured 9% of the total gusset plate weld length at
the end of the test. HSS-15 fractured at the center of the brace. This specimen had an
ultimate drift range of 4.09% and a positive drift capacity of 1.87%
HSS-16 was the only specimen that did not use a weld connecting the brace to the
gusset plate. Instead, the brace was welded to an extension plate which was bolted to
the gusset plate with A490 slip critical bolts with oversized holes in both the gusset
plate and the extension plate. This bolted connection was the test study parameter.
This specimen was also the only specimen to not buckle at the center of the brace.
Instead, a plastic hinge developed in the southwest extension plate and in the southwest
gusset plate. Damage to the base metal occurred relatively early in the experiment at -
0.49% and the total crack lengths measured 55% of the total gusset plate weld length at
the end of the test. The load path from the brace was lost when the extension plate
fractured. The ultimate drift range for this experiment was the highest for all of the
specimens in the test program at 5.89% while the positive drift capacity was also the
highest at 3.03%.
262
The last specimen tested was HSS-17 and used a 3/8 inch tapered plate, which was the
test study parameter, with 3/8 inch gusset plate welds. The plate had the same geometry
as HSS-10 and HSS-13. This specimen did not use net section reinforcement. Cracking
of the base metal was noted at a drift ratio of 1.77% and the total crack lengths
measured 31% of the total gusset plate weld length at the end of the test. Due to the low
strength and stiffness of the plate (axial and rotational) the specimen experienced a
large ultimate total drift range of 4.94%, and a high positive drift capacity of 2.15%.
9.2 Conclusions
This section is divided into two sections. The first section, Section 9.2.1 lists
conclusions on the analysis of the SCBFs. Section 9.2.2 states conclusions concerned
with the design of SCBFs.
9.2.1 Conclusions on Analysis of SCBFs
Analysis techniques and design guides tend to drastically simplify the behavior of
concentric braced frames. This simplification steers the way engineers think of braced
frames to believing that they only carry axial forces. However, these frames respond in
a very different manner.
9.2.1.1 Frame Action
When a gusset plate is connected to a beam and column, a rigid joint is created that will
transfer moments from the beam to the column. This moment puts additional stress on
the gusset plate, gusset plate welds, and the beam-to-column connection.
During negative drift, the brace is in compression and the beam-column joints (at the
gusset plates) are experiencing an opening moment as shown in Figure 9.2.1. The other

263
two joints have closing moments applied to them. The opposite is also true: when the
brace is in tension, the beam-column joints (at the gusset plates) are experiencing a
closing moment, and the other two joints are experiencing an opening moment.
Figure 9.2.1 – Opening Moment Associated with Compression in Brace
The opening moment applies tension across the gusset plate (perpendicular to the
longitudinal axis of the brace). This, combined with the out-of-plane bending due to
brace buckling, caused many of the welds (or base metal) to crack and propagate.
There is a large amount of evidence showing that this opening moment is occurring and
affecting the response of the frame. In HSS-01, the gusset plate welds were designed
for the axial capacity of the brace (using the uniform force method). However, these
welds cracked during the experiment. These cracks propagated throughout the length of
the test and ultimately failed before the brace fractured. Additionally, in all of the tests,
weld (or base metal) crack initiation and propagation typically occurred while the brace
Compression in Brace
Opening Moment at Joint
264
was in compression (not tension). Nonlinear finite element analyses have also shown
that this opening moment transfers across the gusset plate (Jung, 2006).
Another important thing to note is that the direction of the interface forces (at the beam-
to-gusset interface and column-to-gusset interface) applied by the moment are opposite
to the interface forces that the uniform force method predicts due to the axial force in
the brace. In reality, the interface forces will be a combination of these two applied
forces.
9.2.1.2 Gusset Plate Out-of-Plane Bending
Typically, building structures deal with one-dimensional members; and the strength and
stiffness of these members can be calculated with simple expressions. However, gusset
plates are two dimensional members. Some gusset plates that have a straight line
hinging pattern may be simplified to determine their strength or stiffness with the
simple expressions used for one-dimensional members with limited loss in accuracy.
However, rectangular gusset plates that use an elliptical clearance do not have a straight
line hinging pattern. Because of this, the bending in the gusset plate that resists rotation
is much more complicated than the other plates. A two-dimensional analysis such as
the FEM analysis carried out in Appendix C is required to accurately determine the
stiffness of the gusset plates. Additionally a three dimensional analysis of these models
including nonlinear material and geometry is required to accurately determine the
ultimate strength of the gusset plate and also the stiffness of the gusset plate after initial
yielding.

265
9.2.1.3 Drift Capacity
The major goal of this research is to design an SCBF with a high performance in the
levels of Life Safety and Collapse Prevention. An effective way to achieve high
performance at these levels is to postpone brace fracture.
In determining which specimen will have the largest drift capacity (before the brace
fractures), it is important to look at both the ultimate drift range and the positive drift
capacity of these experiments. The ultimate drift range is a logical measurement to
compare the different specimens’ drift capacities since both the positive and negative
drift add strain accumulation to the brace; and therefore both directions of drift will
contribute to the fracture of the brace. However, as shown with specimens that have
limited negative drift, similar specimens had similar positive drifts. For example,
HSS-14 was limited to -2.0% drift, and had an ultimate drift range of 3.9% and a
positive drift capacity of 1.9%. Similar specimens HSS-05 and HSS-06 averaged an
ultimate drift range of 4.9%, and a positive drift capacity of 1.8%. Notice that these
similar specimens had more similarity with their positive drift than with their total drift
range. This is due partly to the fact that, as the negative drift increases, the gusset plate
welds or base metal cracks, and therefore, the effective strength and stiffness of the
connection is reduced, thereby reducing the plastic strain accumulation at the hinge
point of the brace. Therefore, within these experiments, positive drift capacity needs to
be compared, as well as ultimate drift range, to determine which specimen has a better
drift capacity. In a real building structure, the random applied displacement from an
earthquake will also affect the fracture life of the brace (or possibly the gusset plate
welds or base metal).
9.2.2 Conclusions on Design of Gusset Plates in SCBFs
For improved performance in Life Safety and Collapse Prevention, it is observed that
the gusset plate should be as small, flexible, and weak enough to yield (after the brace
266
yields), all while supporting the maximum load delivered by the brace. This will allow
the gusset plate to rotate freely like a pinned end member during brace buckling. And it
will also allow that gusset plate to yield in tension. These two characteristics will
reduce the plastic strain accumulation at the center of the brace and prolong the life of
the brace.
By designing the gusset plate to be stronger than the brace, this will insure that the
brace fractures before the gusset plate. Therefore, the frame will be able to absorb as
much energy as possible through the brace and maintain a load path for the diagonal
brace at the maximum possible drift levels.
9.2.2.1 Clearance Requirements
In order to reduce the size of the gusset plate, an elliptical clearance (between 6t and 8t)
should be used to locate the end of the brace. This will create a smaller plate and as the
results show, a higher drift capacity. However, if an elliptical clearance is used that is
too small as with HSS-08, which had a 3t elliptical clearance, additional stress can be
put on the welds causing them to crack. If an elliptical clearance is too large, then the
gusset plate approaches the straight line clearance achieved by HSS-01 and HSS-12
which both had below average drift capacities.
It is especially true to use this elliptical clearance because if the limit state of gusset
plate buckling controls the thickness of the plate, a thicker plate will be required for a
gusset plate that uses the straight line clearance. This thicker plate drastically increases
the strength and stiffness of the gusset plate, thereby not limiting the strain demand at
the center of the brace, leading to earlier brace fracture.
267
9.2.2.2 Tapered vs. Rectangular Plates
In general, tapered gusset plates have a smaller strength and stiffness than rectangular
plates. This is true simply because they have less steel. Additionally, for the out-of-
plane strength and stiffness, a tapered plate, which uses an elliptical clearance, may also
be close to satisfying the 2t linear offset. This will allow more free rotation than a
rectangular plate which uses an elliptical clearance by the reasoning discussed in
Section 9.2.1.2. In general, the specimens that used tapered plates had slightly higher
drift capacities then specimens that used rectangular plates. For this reasoning, tapered
plates are recommended. However, similar results regarding drift capacity were
recorded with rectangular plates that used elliptical clearances, and are therefore also
acceptable.
9.2.2.3 Gusset Plate Minimum Strength
The gusset plates should be designed to support the maximum load from the brace to
guard against failure of the plate before brace fracture. However, any additional size,
strength or stiffness will reduce the drift capacity of the brace. Therefore, the brace
should have the smallest possible strength and stiffness while resisting the maximum
load from the brace.
The design force specified in the AISC Seismic Provisions should be used. However,
since it is such a high load, it is not logical to use the φ factors that are listed in the
specifications when checking the limit states of the gusset plates. In this seismic design,
it is detrimental to the seismic response of the frame to have too much conservatism.
9.2.2.4 Gusset Plate Weld Design
Cracking in the gusset plate welds or base metal has shown to increase the ultimate drift
capacity of the frame. However, early weld or base metal cracking can prohibit the
268
occupancy of a building after a seismic event. Additionally, if complete weld fracture
occurs, it will reduce the drift life of the brace. This occurred in HSS-01 when the
welds, which were designed using the uniform force method, completely fractured.
Therefore, the uniform force method should not be used to design the welds. Instead,
the gusset plate welds should be designed for the strength of the gusset plate. Since
only one type of displacement history was tested, welds should not be designed to crack
at all. If other applied displacements are tested and similar results are found that show
the welds cracking but maintaining the load path from the brace to the frame, it may be
appropriate to increase the capacity of the weld design by using a higher φ or β factor.
However, because of the uncertainty associated with the actual applied displacement
due to a seismic event, it is inaccurate to assume that the welds will respond in the exact
same way as the welds in the experiment.
9.2.2.5 Bolted Connections
All but one of the tests used welds to connect the brace to the gusset plate. HSS-16 was
the only bolted connection in the test program. This specimen did not buckle in the
expected way, and therefore, it did not reach the expected buckling strength. It also
experienced very early weld cracking and ultimately failed at the extension plate, not at
the center of the brace. However, this specimen had the highest ultimate drift range and
highest positive drift capacity. For this type of connection to be viable, either a solution
needs to be found that will enforce the brace to buckle at the center of the brace and
therefore fracture at this location, or the code would need to be rephrased so that the
brace is not required to be the first to fracture.
9.2.2.6 Framing Elements
The response of the beams and columns of SCBFs are influenced by the size and shape
of the gusset plates and they are also influential to the response of the brace. From the

269
experiments, the specimens that used the larger, stiffer, and stronger plates also
experienced local web and flange buckling of the framing members at smaller drift
ranges. This is shown by HSS-07 and HSS-11 which used the thickest gusset plates
(7/8 inch) in the test program. These specimens also experienced local flange buckling
at a lower drift than all of the other specimens. Therefore, smaller, more flexible plates
should be used so that local buckling does not occur in the framing elements which can
lead to partial or total collapse.
One logical way to guard against local flange and web buckling of the framing members
is to use a larger beam. However, HSS-11 was the only specimen which used a larger
beam, W16x89, than the other specimens, which all used a W16x45. This larger beam
created higher connection stiffness and hence, this specimen had the lowest positive
drift capacity, and the lowest ultimate drift range of all of the specimens, including the
only other specimen to use a 7/8 inch gusset plate. Therefore, larger beams should not
be utilized to resist local buckling. Instead, the current design procedures which were
used for designing the smaller beam should be used for checking local flange and web
limit states even though these limit states may be reached at high drift levels.
9.2.2.7 Net Section Reinforcement
Specimens HSS-14, HSS-15 and HSS-17 did not include net section reinforcement at
the brace even though they were required to according to the AISC Seismic Provision
calculations. This suggests that the requirement for net section reinforcement
underestimates the strength of the net section of the brace. More testing is required to
determine whether net section reinforcement can be omitted for all different conditions.
Other influential conditions include pulse type loading, and increased effective gusset
plate thickness (Jung, 2006).
270
9.2.3 Design Recommendations
Based on the conclusions above, the following recommendations are made for the
gusset plate design:
• The gusset plate welds should be designed for the expected tensile yield stress of
the plate. Either CJP welds or fillet welds can be used to resist this stress. If
fillet welds are used, a factor of 1.5 can be multiplied by the strength of the weld
since the force is perpendicular to the longitudinal axis of the weld (AWS and
AISC). However, a β factor of 0.65 should be used instead of a φ factor of 0.75.
• To calculate the strength of the limit states of block shear fracture and Whitmore
fracture of the gusset plate, a β factor of 0.85 should be used instead of the φ
factor of 0.75.
• The limit states of Whitmore yielding and block shear yielding should not be
checked for the gusset plate design.
• Instead of using a φ factor of 0.75 to calculate the strength of the net section of
the brace, it is recommended that a β factor of 0.9 is used.
• An elliptical clearance of 6t to 8t should be used to locate the end of the brace
on the gusset plate.
9.3 Recommendations for Future Research
The following list gives recommendations where further research should be directed to
advance the performance of braced frames used for seismic resistance.
9.3.1 Reduced Depth Brace
In order to prolong the drift life of the brace, it is encouraged that the gusset plate be
designed to reduce the plastic strain demand on center of the brace. A more direct

271
approach to reducing the strain demand at the center of the brace is to redesign the
center of the brace. Figure 9.3.1 shows a brace which does not maintain a consistent
cross section over the entire length of the brace.
Figure 9.3.1 – Reduced Depth Brace
The idea behind this detail is to increase the accumulated strain capacity at the location
where the brace buckles. For this to work, the brace needs to buckle at the central plate.

272
Since the plate is thinner than the tube, the curvature required at a given drift level will
deliver a smaller strain to the outer fibers of the plate than it would to the outer fibers of
the tube if the brace had a constant cross section. Additionally, local buckling will not
occur in the plate at the hinge point as it does in the tube (leading to fracture). Also,
because the area of the plate is larger than the area of the tube, when the brace is in
tension, this plate will see less strain concentration at the hinge point. Instead, the brace
will yield more uniformly over the entire length.
The central plate should be designed so that it does not reduce the buckling strength of
the brace. However, it should be made thin enough so that the hinge occurs at the plate,
instead of at the brace, directly next to the plate. Nonlinear analyses have shown that
the plate should not have a higher plastic section modulus than the brace to ensure that
hinging occurs in the central plate before it occurs in the brace. More testing is required
to determine how the central plate should be designed.
Existing X-bracing typically uses a gusset plate at the center of the X configuration for
assembly of the structure. It should be noted that this plate will not provide the same
benefits as the configuration above. That is because in X-bracing, the braces
experiencing compressive loads will be braced by the braces that are experiencing
tensile loads at the central gusset plates. Therefore, these gusset plates will buckle
(under a certain drift) midway between the center gusset plate and the end gusset plate.
At this location, the brace has a constant cross section, and the brace will develop a
plastic hinge leading to fracture of the brace at this location.
A similar type of brace that also takes advantage of reducing the depth of the brace is a
pair of plates that are spaced apart the same thickness of the gusset plates. These plates
would be the entire length of the brace, connected to the gusset plates, and could be
stitched together to avoid local buckling.

273
9.3.2 Net Section
The results within this test program have shown that net section reinforcement may be
unnecessary. However, other testing has shown failure can occur at the net section. A
comprehensive study needs to be analyzed to further understand what is required for net
section reinforcement. Additional studies include a larger gusset plate combined with
the absence of net section reinforcement, which nonlinear analyses have suggested my
concentrate stresses at the net section location (Jung, 2006). Also, a test that includes a
slab, which increases the effective stiffness of the gusset plate, may also cause an
increase the stress at the net section.
9.3.3 More Accurate Gravity Load Application
Because of the test setup, the gravity load on the column was displacement controlled.
However, in a real building structure, the load will be force controlled. Therefore, the
local buckling that occurred in the columns may lead to partial or total collapse which
was not able to be captured in this test setup. It is important to know how much damage
a column can experience before it compromises the ability to carry vertical loads
Similarly, a gravity load should be applied to the beam. This is because, it is important
to know at what damage level the ability of the beam to carry shears and moments is
compromised, causing potential partial collapse or even progressive collapse
9.3.4 Shake Table
It is recommended that a shake table test is applied to an SCBF. There are many
simplifications when using quasi-static loading to a specimen. A shake table test will
avoid these simplifications and examine how the structure will behave when subjected
to ground accelerations.
274
9.3.5 Slab
Much of this research has been aimed at limiting the strength and stiffness of the gusset
plate. However, none of these experiments have examined what effect a slab will have
on the strength and stiffness of the gusset plate. Therefore, a slab should be added to
the experiment to see how it affects the performance of the brace.
9.3.6 Size of Brace
To date in this research program has looked at only HSS5x5x3/8. It is important to look
at larger braces as the curvature of the brace (during brace buckling) will apply higher
strains at the extreme fiber potentially leading to earlier brace fracture.
9.3.7 Type of Brace
Since fracture of the brace directly follows local buckling of the brace, different shapes
should be tested. These different shapes will have unlike local buckling characteristics,
and will therefore fracture at different drifts. Also, the steel grade, and hence, the
ductile characteristics of that particular steel grade, will be dissimilar.
9.3.8 Applied Displacement History
As mentioned earlier, the cracks in the weld and in the base metal will propagate even if
the displacement is not increased from the previous cycle. Therefore, it is essential to
look at different displacement histories to see if the damage to the welds will propagate
to failure after a crack initiates. Especially recommended is a pulse excitation which
has an initial surge which may crack the weld or base metal, followed by numerous
cycles of smaller applied displacement.

275
9.3.9 Strength Evaluation of FEM Models
The finite element models seem to be a valuable tool in helping determine the stiffness
of gusset plates. These models should be taken to the nonlinear range so that the
ultimate strength can be determined, and also the stiffness of the plate after initial
yielding has occurred.
9.3.10 Gusset Plate Buckling Provisions
The provision for gusset plate buckling should be tested. A β factor of 0.9 is suggested.
9.3.11 New Method for Determining Clearance
The elliptical clearance method works with rectangular plates and it also works with
tapered plates. However, the clearance values that this method designs should not be
used when comparing tapered plates to rectangular plates. This is because, a tapered
plate has less of an overlap than a rectangular plate (Section 6.1.3.3b) and therefore,
ultimately a different clearance. Instead some other method that takes into account the
taper should be utilized so that the comparisons are on the same level. Perhaps an angle
measurement between the lines that connect the corners of the gusset plate to the end of
the brace should be made and then used to compare the plates.

276
Figure 9.3.2 – Clearance Lines for Rectangular Plate
Figure 9.3.3 – Clearance Lines for Tapered Plate
The elliptical clearance is the same for these two figures. However, the difference
between the angles that are created by the clearance lines is quite different. The angle
between the two lines shown in Figure 9.3.2 is about 15 degrees. The angle between
the two lines in Figure 9.3.3 is about 0 degrees.
9.3.12 Tapered Plate with Higher Clearance
Since HSS-10 had early weld cracking, a higher clearance may prolong the drift at
which weld cracking occurs. This would be due to less demand on the welds from the
hinging of the plate.

277
9.3.13 Whitmore Section
When checking Whitmore yielding or fracture, the entire width of the plate may be a
better way to determine when these limit states are met. It is apparent that a rectangular
plate will have more strength than a tapered plate for these limit states, and if the entire
width of the plate is included in the limit state calculations, the rectangular plates will
have a higher strength as expected. This is opposed to the current procedure which will
predict equal strengths for tapered plates and rectangular plates so long as the Whitmore
width is located within the limits of the gusset plate, which typically occurs.
9.3.14 Quarter Inch Plate
Since there have been such positive results from thinner plates, a quarter inch plate is
suggested. If the Whitmore width proposed above is used, and the proposed β factors in
Chapter 8 are used, the brace-to-gusset plate splice may only need to be increased a
small amount to have all of the required limit states satisfied. It should be interesting to
see if such a thin gusset plate will be able to resist the hinging demands associated with
brace buckling.
9.3.15 Beam-to-Column Connection
Based on the research, the beam-beam to column connection has performed well with
CJP welds at the beam web and flanges. However, since the gusset plate and beam-to-
column connection appear to act compositely, it would appear that to use a CJP weld for
the beam flange that is next to the gusset plate is unnecessary. Instead, this weld could
be left out as shown in Figure 9.3.4.
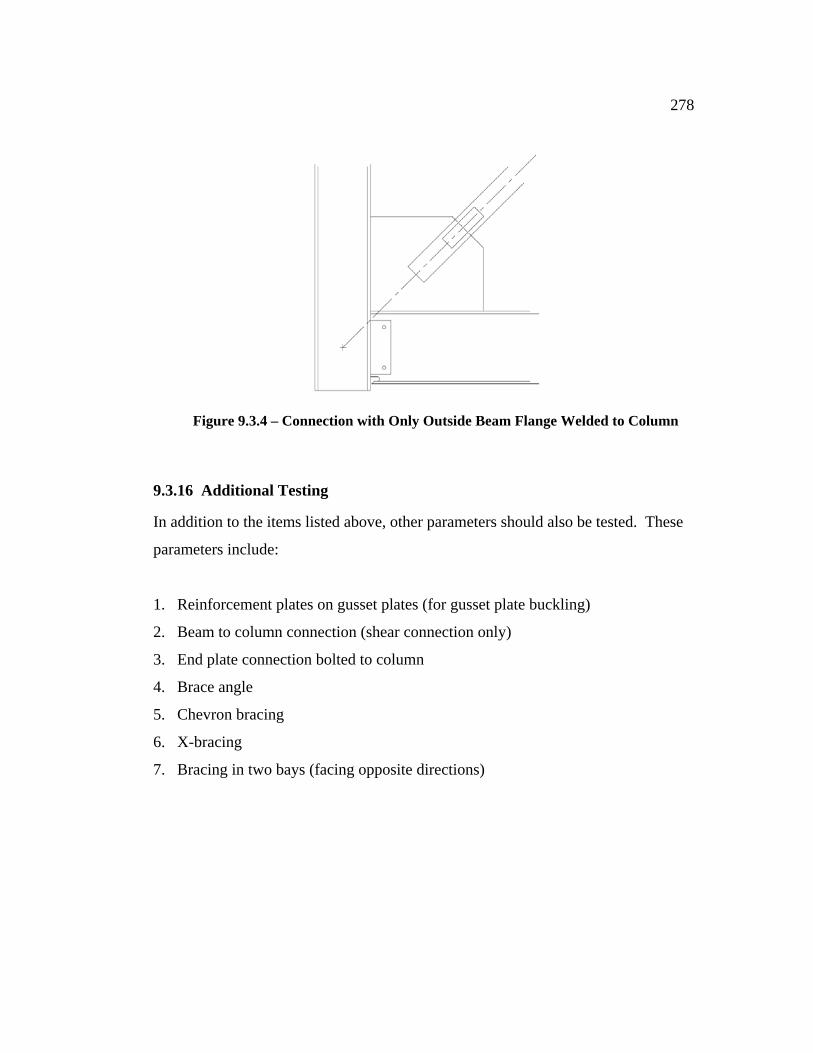
278
Figure 9.3.4 – Connection with Only Outside Beam Flange Welded to Column
9.3.16 Additional Testing
In addition to the items listed above, other parameters should also be tested. These
parameters include:
1. Reinforcement plates on gusset plates (for gusset plate buckling)
2. Beam to column connection (shear connection only)
3. End plate connection bolted to column
4. Brace angle
5. Chevron bracing
6. X-bracing
7. Bracing in two bays (facing opposite directions)
279
References
1. AISC “Manual of Steel Construction, Load and Resistance Factor Design,” 3rd Edition, American Institute of Steel Construction, Chicago, Illinois, 2001
2. AISC “Seismic Provisions for Structural Steel Buildings,” American Institute of Steel Construction, Chicago, Illinois, 2002
3. Aslani, F., Goel, S., “Experimental and Analytical Study of the Inelastic Behavior of Double Angle Bracing Members Under Severe Cyclic Loading,” Research Report UMCE 89-5, Department of Civil Engineering, University of Michigan, Ann Arbor, Michigan, February, 1989
4. Aslani, F., Goel, S., Xu, P., “Effect of Stitch Spacing on the Cyclic Behavior of Built-up Bracing Members,” Report UMCE 87-8, University of Michigan, Ann Arbor, Michigan, January, 1987
5. Astaneh-Asl, A., "Seismic Behavior and Design of Gusset Plates," Steel TIPS, Structural Steel Educational Council, Moraga, California, December, 1998
6. Astaneh-Asl, A., Cochran, M., and Sabelli, R., “Seismic Detailing of Gusset Plates for Special Concentrically Braced Frames,” Steel TIPS, Structural Steel Educational Council, Moraga, California, December, 2006
7. Astaneh-Asl, A., Goel, S.C., and Hanson, R.D., “Cyclic Behavior of Double Angle Bracing Members with End Gusset Plates,” Research Report UMEE 82R7, Department of Civil Engineering, University of Michigan, Ann Arbor, Michigan, August, 1982
8. Astaneh-Asl, A., Goel, S.C., and Hanson, R.D., “Cyclic Out-of-Plane Buckling of Double Angle Bracing.” Journal of Structural Engineering, American Society of Civil Engineers, 111(5), 1135-1153, 1985
9. ATC 24, "Guidelines for Cyclic Seismic Testing of Components of Steel Structures," Applied Technology Council, 1992
280
10. Becker, R., "Seismic Design of Special Concentrically Braced Steel Frames," Steel TIPS, Structural Steel Educational Council, Moraga, California, November, 1995
11. Bjorhovde, R., “Limit States Design Considerations for Gusset Plates.” Journal of Constructed Steel Research, 9, 61-73, 1988
12. Bjorhovde, R. and Chakrabarti, S.K., “Tests of Full-size Gusset plate Connections.” Journal of Structural Engineering, American Society of Civil Engineers, 111(3), 667-115, 1985
13. Brown, V.L.S., "Stability of Gusseted Connections in Steel Structures," A thesis submitted in partial fulfillment of Doctor of Philosophy in Civil Engineering, University of Delaware, 1988
14. Chakrabarti, S.K., Tests of Gusset Plate Connections. M.S. Thesis, University of Arizona, 1983
15. Chambers, J.J., Ernst, C.J., “Brace Frame Gusset Plate Research: Phase 1 Literature Review Volumes I and II”, Department of Civil and Environmental Engineering, University of Utah, Salt Lake City, Utah, February, 2005
16. Cheng, J.J.R., Grondin, G.Y., Yam M.C.H, "Design and Behavior of Gusset Plate Connections," Fourth International Workshop on Connections in Steel Structures, Roanoke, VA, October 2000
17. Cheng, J.J.R., Rabinovitch, J.S., and Yam, M.C.H., “Behavior of Gusset Plate Connections under Compressive Monotonic and Cyclic Loadings.” Proceedings, 1993 Annual Technical Session, April 5-6, Milwaukee, Wisconsin, Structural Stability Research Council, 45-58, 1993
18. Christopulos, A.S., "Improved Seismic Performance of Buckling Restrained Braced Frames", Department of Civil Engineering, University of Washington, Seattle, Washington, June, 2005
19. Cochran, M., Honeck, W.C., "Design of Special Concentric Braced Frames," Steel TIPS, Structural Steel Educational Council, Moraga, California, May, 2004
281
20. FEMA 350, "Recommended Seismic Design Criteria for New Steel Moment-Frame Buildings," FEMA 350, Federal Emergency Management Agency, Washington, D.C., 2000
21. FEMA 355C, "State of the Art Report on Systems Performance of Steel Moment Frames Subject to Earthquake Ground Shaking," FEMA 355, Federal Emergency Management Agency, Washington, D.C., 2000
22. FEMA 355D, "State of the Art Report on Connection Performance," FEMA 355, Federal Emergency Management Agency, Washington, D.C., 2000
23. Gaylord, E.H., Gaylord, C.N., Stallmeyer, J.E., "Design of Steel Structures," 3rd edition, New York, Mc-Graw-Hill, Inc., c1992
24. Grondin, G.Y., Nast, T.E., and Cheng, J.J.R., "Strength and Stability of Corner Gusset Plates Under Cyclic Loading," Proceedings of Annual Technical Session and Meeting, Structural Stability Research Council, 2000
25. Gugerli, H., Goel, S.C., “Inelastic Cyclic Behavior of Steel Bracing Frames,” Report UMEE 82R1, University of Michigan, Ann Arbor, Michigan, January, 1982
26. Gunnerson, I., "Numerical Performance Evaluation of Braced Frame Systems", Department of Civil Engineering, University of Washington, Seattle, Washington, December, 2004
27. Han Yoo, J., "Analytical Investigation on the Behavior of Braced Frame" Department of Civil Engineering, University of Washington, Seattle, Washington, June, 2006
28. Hardash, S, Bjorhovde, R., "New Design Criteria for Gusset Plates in Tension," Engineering Journal, AISC, Vol. 22, No. 2, Second Quarter, 1985
29. Herman, D., “Further Impovements On and Understanding of Special Concentrically Braced Frame Systems”, Department of Civil Engineering, University of Washington, Seattle, Washington, January, 2007

282
30. Hu, S.Z., Cheng, J.J.R., “Compressive Behavior of Gusset Plate Connections,” University of Alberta, Department of Civil Engineering, Structural Engineering Report, n153, July, 1987
31. Jain, A.K., Goel, S.C., Hanson, R.D, "Hysteresis Behavior of Bracing Members and Seismic Response of Braced Frames with Different Proportions," Research Report UMEE 78R3, Department of Civil Engineering, University of Michigan, Ann Arbor, Michigan, July, 1978
32. Johnson, S.M., "Improved Seismic Performance of Special Concentrically Braced Frames", Department of Civil Engineering, University of Washington, Seattle, Washington, June, 2005
33. Lehman, D.E., Roeder, C.W., Herman, D.J., Johnson, S.M., and Kotulka, B., “Improved Seismic Performance of Gusset Plate Connections.” Submitted for publication review, Journal of Structural Engineering, ASCE, Reston, VA
34. Lehman, D., Roeder, C., Jung H. Y., Johnson, S., "Seismic Response of Braced Frame Connections," 13th World Conference on Earthquake Engineering, Vancouver, B.C., Canada, Paper No. 1459, August 2004
35. Lesik, D.F., Kennedy, D.J.L., "Ultimate Strength of Fillet Welded Connections Loaded in Plane," Canadian Journal of Civil Engineering, Vol. 17, No. 1, National Research Council of Canada, Ottawa, Canada, 1990
36. Liu, J. and. Astaneh-Asl, “Cyclic Testing of Simple Connections, Including Effects of the Slap”, Journal of Structural Engineering, Vol 126, No. 1, January, pp. 32-39
37. Martinez-Saucedo, G., and Packer, J. A., “Slotted Tube End Connections: Seismic Loading Performance,” Pacific Structural Steel Conference 2007, Wairakei, New Zealand, p 90-96, 13-16 March 2007
38. Murphy, G., "Advanced Mechanics of Materials," New York and London, McGraw-Hill Book Company, Inc., c1946

283
39. Nast, T., Grondin, G., Cheng, R., “Cyclic Behavior of Stiffened Gusset Plate-Brace Member Assemblies,” University of Alberta, Department of Civil Engineering, Structural Engineering Report, n229, December, 1999
40. Rabinovitch, J., Cheng, R., “Cyclic behavior of steel gusset plate connections,” University of Alberta, Department of Civil Engineering, Structural Engineering Report, n 191, August, 1993
41. Roeder C.W., "Connection Performance for Seismic Design of Steel Moment Frames," ASCE, Journal of Structural Engineering, p517-525, April, 2002
42. Roeder, C.W., MacRae, G., Leland, A., Rospo, A. "Extending the Fatigue Life of Riveted Coped Stringer Connections." Journal of Bridge Engineering, ASCE, v 10, n 1, p 69-76 January/February 2005.
43. Roeder, C.W., Lehman, D.E. "Performance-Based Seismic Design of Concentrically Braced Frames", National Science Foundation, Grant CMS-0301792
44. Roeder, C.W., Lehman, D.E., and Yoo, J., “Improved Design of Steel Frame Connections”, International Journal of Steel Structures, v.5,n.2, July 2005
45. SAC Steel Project, "Protocol for Fabrication, Inspection, Testing and Documentation of Beam-Column Connection Tests and Other Experiments," Report No. SAC/BD-97/02, SAC Joint Venture, October 1997
46. Salmon, C.G., Johnson, J.E., "Steel Structures Design and Behavior," 4th edition, HarperCollins College Publishers, c1996
47. Shaback, B., Brown, T., "Behaviour of square hollow structural steel braces with end connections under reversed cyclic axial loading," Canadian Journal of Civil Engineering, v 30, n 4, p 745-753, August, 2003
48. Tam M.C.H., Cheng J.J.R., "Behavior and Design of Gusset Plate Connections in Compression," Journal of Constructional Steel Research, Vol 58, No. 5-8, Elsevier, pgs 1143-59, 2002

284
49. Tamboli, A.R., "Handbook of structural steel connection design and details," New York, McGraw-Hill, c1999
50. Timoshenko, S.P., Gere, J.M., "Theory of Elastic Stability," New York, McGraw-Hill Book Company, Inc., c1961
51. Thornton, W.A., "Bracing Connections for Heavy Construction," Engineering Journal, AISC, Vol. 21, No. 3, pp. 139-148., 1984
52. Tremblay R., "Inelastic seismic response of steel bracing members," Journal of Constructional Steel Research, 58, 665-701, 2002
53. Uriz, P., "Summary Of Test Results For UC Berkeley Special Concentric Braced Frame Specimen No. 1 (Scbf-1)", Retrieved May 5, 2005, from http://www.ce.berkeley.edu/~patxi/
54. Walpole, W. R. “Behaviour of cold-formed steel RHS members under cyclic loading.” Dept. of Civil Engineering, Univ. of Canterbury, Christchurch, New Zealand, 1996
55. Whitmore, R.E., "Experimental Investigation of Stresses in Gusset Plates," Bulletin No. 16, Engineering Experiment Station, University of Tennessee, 1952
56. Yam M.C.H., “Compressive Behavior and Strength of Steel Gusset Plate Connections,” University of Alberta, Department of Civil Engineering, Fall, 1987
57. Yang, F., Mahin, S., "Limiting Net Section Fracture in Slotted Tube Braces," Steel TIPS, Structural Steel Educational Council, Moraga, California, April 2005
58. Yoo, J.H., “Analytical Investigation on the Seismic Performance of Special Concentrically Braced Frames”, a dissertation submitted in partial fulfillment of the Ph.D degree, Department of Civil Engineering, University of Washington, Seattle, Washington, 2006
59. Yoo, J.H., Roader, C., and Lehman, D., “Impact of Design Parameters on the Seismic Performance of Gusset Plate connections”, in preparation, expected in 2007

285
60. Zhiyuan, L., Goel, S.C., "Investigation of Concrete-Filled Steel Tubes Under Cyclic Bending and Buckling," Research Report UMEE 87-3, Department of Civil Engineering, University of Michigan, Ann Arbor, Michigan, April, 1987
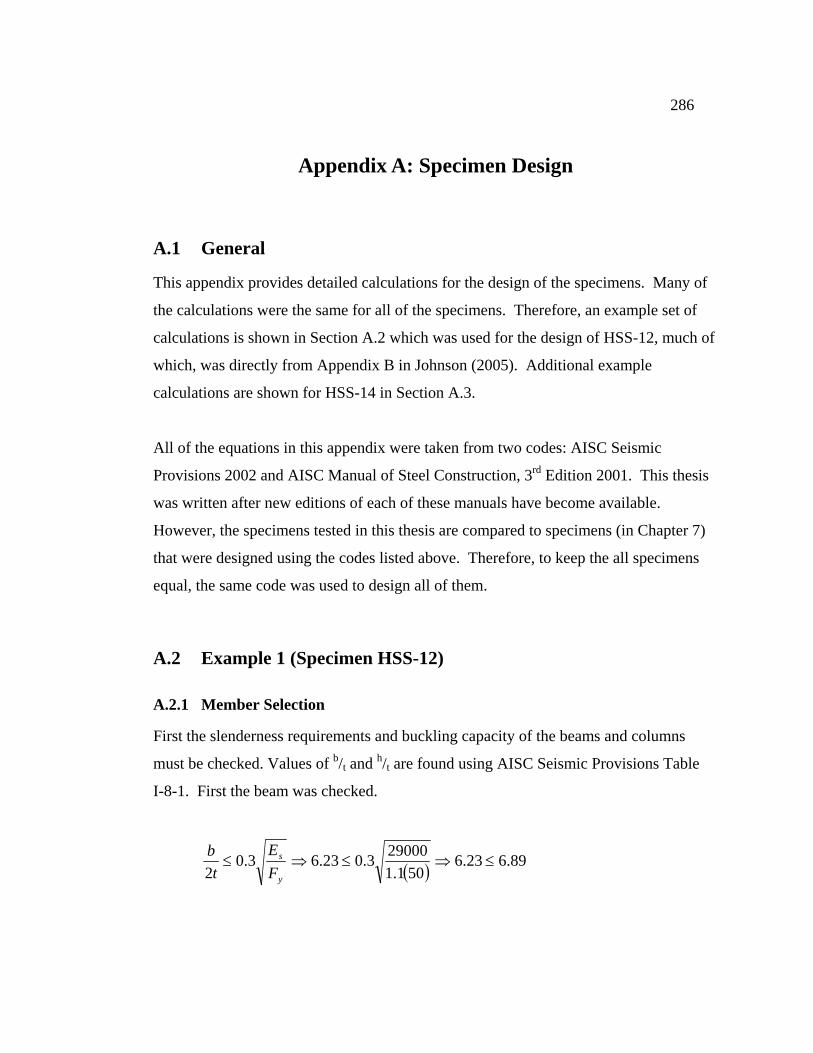
286
Appendix A: Specimen Design
A.1 General
This appendix provides detailed calculations for the design of the specimens. Many of
the calculations were the same for all of the specimens. Therefore, an example set of
calculations is shown in Section A.2 which was used for the design of HSS-12, much of
which, was directly from Appendix B in Johnson (2005). Additional example
calculations are shown for HSS-14 in Section A.3.
All of the equations in this appendix were taken from two codes: AISC Seismic
Provisions 2002 and AISC Manual of Steel Construction, 3rd Edition 2001. This thesis
was written after new editions of each of these manuals have become available.
However, the specimens tested in this thesis are compared to specimens (in Chapter 7)
that were designed using the codes listed above. Therefore, to keep the all specimens
equal, the same code was used to design all of them.
A.2 Example 1 (Specimen HSS-12)
A.2.1 Member Selection
First the slenderness requirements and buckling capacity of the beams and columns
must be checked. Values of b/t and h/t are found using AISC Seismic Provisions Table
I-8-1. First the beam was checked.
( ) 89.623.6501.1
290003.023.63.02
≤⇒≤⇒≤y
s
FE
tb

287
( ) ⎟⎟⎠
⎞⎜⎜⎝
⎛−≤⇒⎟
⎟⎠
⎞⎜⎜⎝
⎛−≤
)50)(3.13(9.035033.2
501.12900012.11.4133.212.1
y
u
y
s
PP
FE
th
φ
88.441.41 ≤⇒
Therefore, the beam meets the slenderness requirements. Similarly, the column also
meets the slenderness requirements.
For the buckling capacity, values of λ are found first. Only the limiting case is shown
here for the beam and column design. The unbraced length for weak axis buckling was
taken to be half of the unbraced length for strong-axis buckling due to the fact that out-
of-plane restraints would be present. The length of the columns was taken as 13 feet
and for beams, 11 feet. As stated in the text the beam used was a W16x45 and the
column a W12x72.
( ) 556.029000
5057.1
12*5.51===
ππλ
EF
rK y
beaml
therefore
( )( ) ksiFcr 939.4350658.02556.0 ==
and
( ) ( ) kipsPn 73.4963.13939.4385.0 ==φ
Similarly for the columns:

288
( ) 388.029000
5031.5
12*131===
ππλ
EF
rK y
columnl
therefore
( )( ) ksiFcr 94.4650658.02388.0 ==
and
( ) ( ) kipsPn 91.8411.2194.4685.0 ==φ
The calculated capacity of the beam and column lead to a factor of safety of 1.42 and
2.41 respectively. This was deemed acceptable to allow for increased economy of the
frame. The next step was to check the capacity of the brace starting with slenderness
checks.
Based on the capacity of the actuator a HSS 5x5x3/8 section was used. From Table
I-8-1 of the AISC Seismic Provisions, slenderness requirements must be met for
rectangular HSS sections.
( ) 09.143.11463.1
2900064.03.1164.0 ≤⇒≤⇒≤y
s
FE
tb
As can be seen, the brace is adequate for the slenderness requirements. The tensile and
compressive capacity of the brace is determined next. The area of the brace is 6.18 in2
and the radius of gyration is 1.87". The length of the brace was known to be 11'-13/16".

289
( )( ) kipsAFRT gyy 56.36918.6463.1max ===
( )( ) ( ) 03.129000
463.187.1
121.111===
ππλ
EF
rK y
bracel
( )( )( ) kipsC 14.23718.6463.1658.203.1
max ==
The maximum tensile and compressive forces were then used to design the gusset
connections.
A.2.2 Brace-to-Gusset Plate Connection
A 5/16" weld was chosen for the brace to gusset plate connection due to the fact that this
is the maximum size for a single pass weld. Using this weld size was considered to be
the most economical detail for this connection. Therefore, knowing the maximum
tensile strength and the weld size the minimum connection length was determined. The
1.1 factor shown below is taken from general practice to add conservatism to the weld
design. This is not required in the code, nor is it the general practice of all engineers.
( ) ( ) wEXX AFT θ5.1max sin5.00.16.0
1.175.0
+=
( ) ( )( ) ( )4165707.00.00.1706.0
1.175.0
max lT ⎟⎠⎞
⎜⎝⎛+=
Solving for l:
"6.14=l

290
Therefore use:
"75.14=l
The net section of the brace must also be checked due to the slot needed to connect the
brace to the gusset.
ygue FAFA 1.1=
In this equation Ry is left out due to the fact that material properties of the brace were
known. Also, as Fy increases Fu will also increase. Although Fu will typically not
increase at the same rate Fy will, the φ factor of 1.1 will account for difference of
increase in strength. Knowing Fy and Fu the needed Ae can be solved for.
( )( ) 239.558
4618.61.1 inAe ==
The effective area of the brace can be determined according to AISC Manual of Steel
Construction. Here it is assumed that a thickener plate will need to be provided and that
the gross area of the brace is the original area minus the area removed for the slots.
( ) ⎟⎟⎠
⎞⎜⎜⎝
⎛+⎟
⎠⎞
⎜⎝⎛⎟⎠⎞
⎜⎝⎛ +−== thickenerne AUAA 2
83
161
21218.69.0
( )( ) 239.529.018.5 inAA thickenere =+=
Solving for Athickener
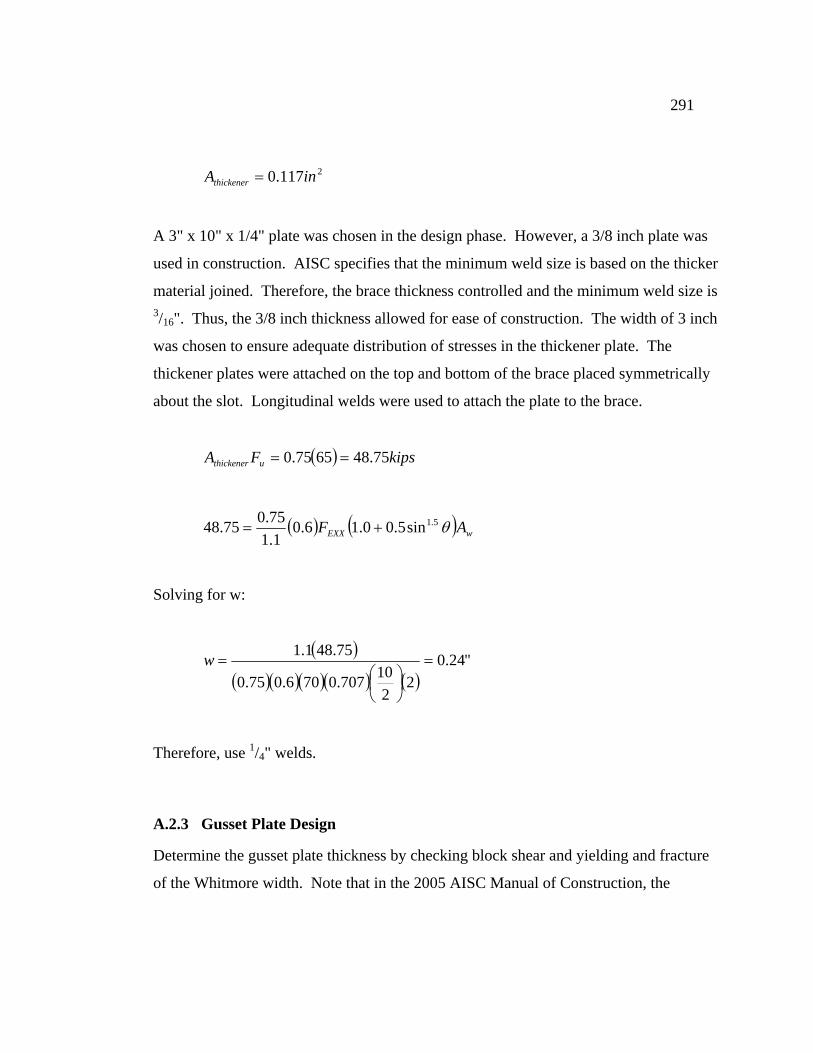
291
2117.0 inAthickener =
A 3" x 10" x 1/4" plate was chosen in the design phase. However, a 3/8 inch plate was
used in construction. AISC specifies that the minimum weld size is based on the thicker
material joined. Therefore, the brace thickness controlled and the minimum weld size is 3/16". Thus, the 3/8 inch thickness allowed for ease of construction. The width of 3 inch
was chosen to ensure adequate distribution of stresses in the thickener plate. The
thickener plates were attached on the top and bottom of the brace placed symmetrically
about the slot. Longitudinal welds were used to attach the plate to the brace.
( ) kipsFA uthickener 75.486575.0 ==
( ) ( ) wEXX AF θ5.1sin5.00.16.01.175.075.48 +=
Solving for w:
( )( )( )( )( ) ( )
"24.02
210707.0706.075.0
75.481.1=
⎟⎠⎞
⎜⎝⎛
=w
Therefore, use 1/4" welds.
A.2.3 Gusset Plate Design
Determine the gusset plate thickness by checking block shear and yielding and fracture
of the Whitmore width. Note that in the 2005 AISC Manual of Construction, the
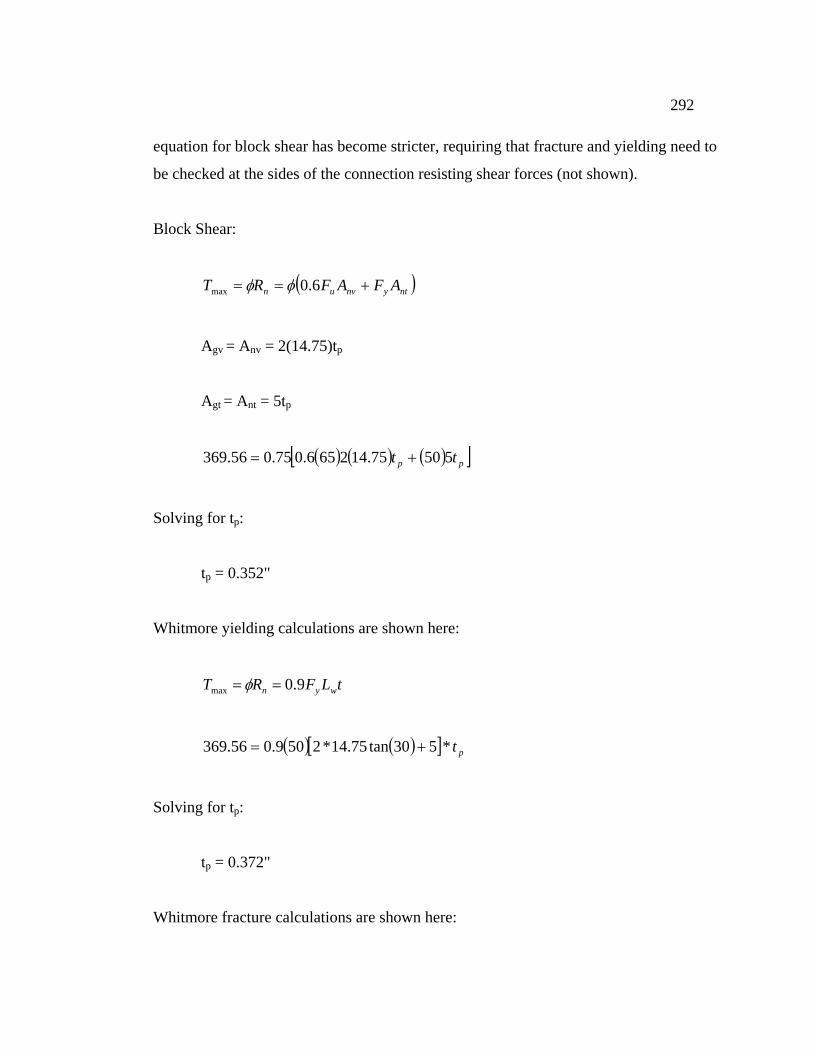
292
equation for block shear has become stricter, requiring that fracture and yielding need to
be checked at the sides of the connection resisting shear forces (not shown).
Block Shear:
( )ntynvun AFAFRT +== 6.0max φφ
Agv = Anv = 2(14.75)tp
Agt = Ant = 5tp
( ) ( ) ( )[ ]pp tt 55075.142656.075.056.369 +=
Solving for tp:
tp = 0.352"
Whitmore yielding calculations are shown here:
tLFRT wyn 9.0max ==φ
( ) ( )[ ] pt*530tan75.14*2509.056.369 +=
Solving for tp:
tp = 0.372"
Whitmore fracture calculations are shown here:
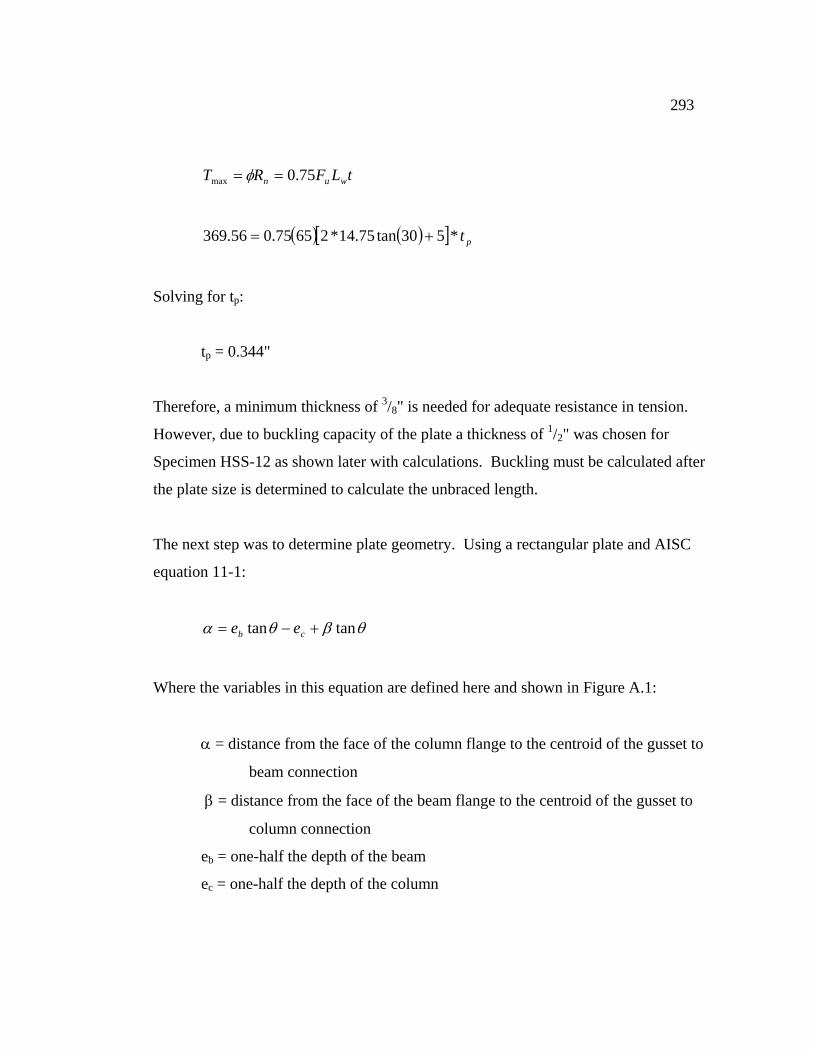
293
tLFRT wun 75.0max == φ
( ) ( )[ ] pt*530tan75.14*26575.056.369 +=
Solving for tp:
tp = 0.344"
Therefore, a minimum thickness of 3/8" is needed for adequate resistance in tension.
However, due to buckling capacity of the plate a thickness of 1/2" was chosen for
Specimen HSS-12 as shown later with calculations. Buckling must be calculated after
the plate size is determined to calculate the unbraced length.
The next step was to determine plate geometry. Using a rectangular plate and AISC
equation 11-1:
θβθα tantan +−= cb ee
Where the variables in this equation are defined here and shown in Figure A.1:
α = distance from the face of the column flange to the centroid of the gusset to
beam connection
β = distance from the face of the beam flange to the centroid of the gusset to
column connection
eb = one-half the depth of the beam
ec = one-half the depth of the column

294
Figure A.1 - Uniform Force Method (Johnson 2005)
The representations of α, β, eb, ec, and φ are identified in Figure A.1. As can be seen in
the above equation there are two unknowns: α and β. In order to define the plate size
the designer must choose a value of either α or β and then solve for the other parameter
using the above equation. Another constraint used to solve for the size of the plate is
the clearance requirement of "2t". This requirement was described earlier in Chapter 3
and is also described in section C13.1 of the AISC Seismic Provisions Commentary.
With this extra constraint the geometry of the plate is found using an iterative process.
Figure A.2 shows a schematic of the required plate dimensions. Equations for the width
and height of the plate were generated from these dimensions:
( ) ( ) ( )θθ cossin21' sbLxHeight c +⎟
⎠⎞
⎜⎝⎛ ++=
( ) ( ) ( ) ( )θθθθcos
290tan)sin(')cos(' p
cb
txxeeWidth −−++−=
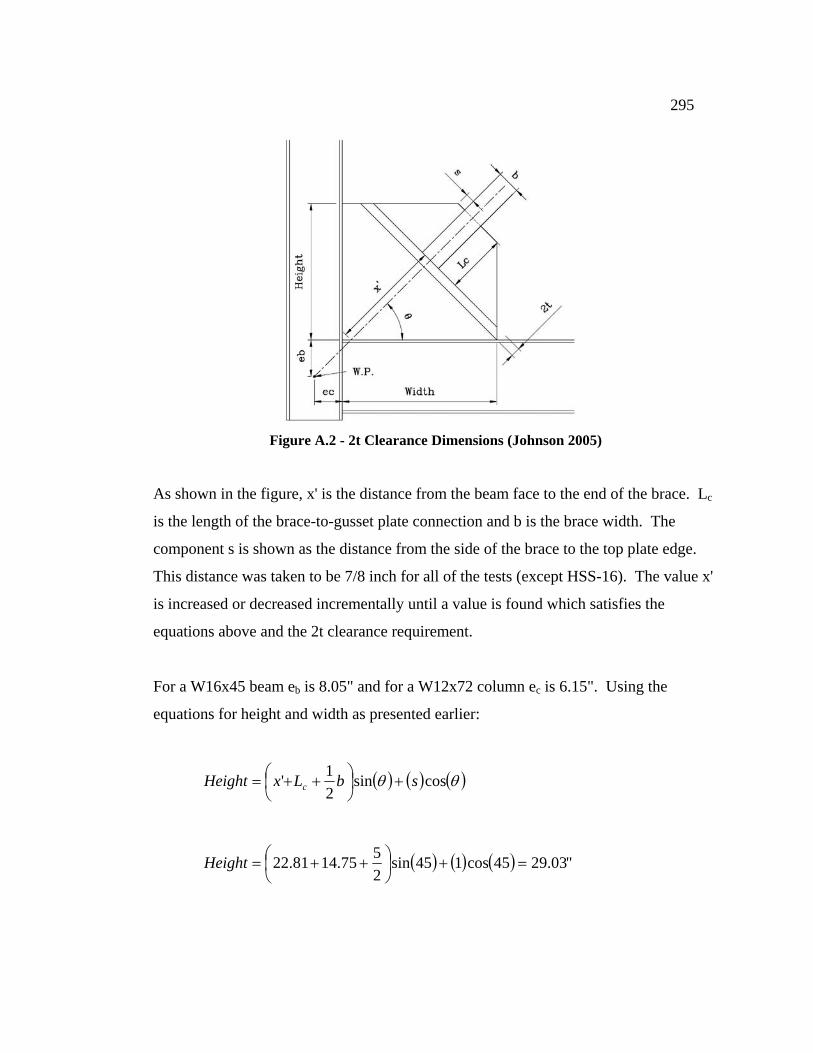
295
Figure A.2 - 2t Clearance Dimensions (Johnson 2005)
As shown in the figure, x' is the distance from the beam face to the end of the brace. Lc
is the length of the brace-to-gusset plate connection and b is the brace width. The
component s is shown as the distance from the side of the brace to the top plate edge.
This distance was taken to be 7/8 inch for all of the tests (except HSS-16). The value x'
is increased or decreased incrementally until a value is found which satisfies the
equations above and the 2t clearance requirement.
For a W16x45 beam eb is 8.05" and for a W12x72 column ec is 6.15". Using the
equations for height and width as presented earlier:
( ) ( ) ( )θθ cossin21' sbLxHeight c +⎟
⎠⎞
⎜⎝⎛ ++=
( ) ( ) ( ) "03.2945cos145sin2575.1481.22 =+⎟⎠⎞
⎜⎝⎛ ++=Height
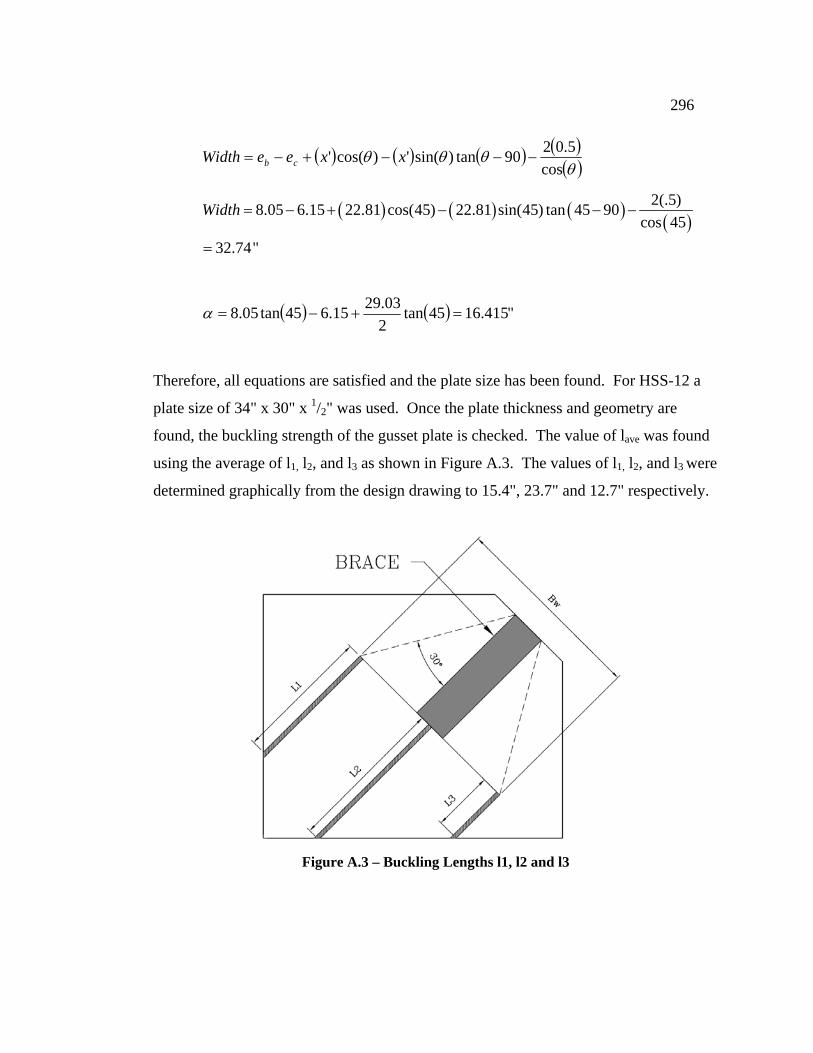
296
( ) ( ) ( ) ( )( )θθθθ
cos5.0290tan)sin(')cos(' −−−+−= xxeeWidth cb
( ) ( ) ( ) ( )2(.5)8.05 6.15 22.81 cos(45) 22.81 sin(45) tan 45 90
cos 4532.74"
Width = − + − − −
=
( ) ( ) "415.1645tan203.2915.645tan05.8 =+−=α
Therefore, all equations are satisfied and the plate size has been found. For HSS-12 a
plate size of 34" x 30" x 1/2" was used. Once the plate thickness and geometry are
found, the buckling strength of the gusset plate is checked. The value of lave was found
using the average of l1, l2, and l3 as shown in Figure A.3. The values of l1, l2, and l3 were
determined graphically from the design drawing to 15.4", 23.7" and 12.7" respectively.
Figure A.3 – Buckling Lengths l1, l2 and l3

297
( ) ( ) 80.029000
50125.0
"47.175.02900012
===ππ
λ y
p
ave Ft
Kl
Solving for the buckling capacity:
( ) ( ) ( ) kipsRn 16.3585.003.2250658.085.028.0 ==φ
Since the buckling capacity of the plate is greater than that of the brace the gusset plate
design is adequate. It should also be checked if a thinner plate can resist buckling,
shown here for a 3/8 inch plate:
( ) ( ) 07.129000
5012375.0
"47.175.02900012
===ππ
λ y
p
ave Ft
Kl
Solving for the buckling capacity:
( ) ( ) ( ) kipsRn 1.218375.003.2250658.085.0207.1 ==φ
Therefore, a 3/8 inch plate is not adequate since it does not have a buckling capacity
greater than the compression capacity of the brace, Cmax, calculated above. A ½ inch
thick gusset plate was used instead.
A.2.4 Gusset Plate-to-Frame Connection Design
First, the interface forces are calculated. They are calculated here using the uniform
force method. However, this research has lead to the belief that this method does not
accurately represent the forces seen in the gusset plate welds. Instead, the welds should
be designed based on the strength of the gusset plate (Section 8.2).

298
( ) ( )22bc eer +++= βα
( ) ( ) 7.3205.81515.617 22 =+++=r
kipsVuc 7.1696.3697.32
15== kipsH uc 6.696.369
7.3215.6
==
kipsVub 1.916.3697.32
05.8== kipsH ub 3.1926.369
7.3217
==
Complete joint penetration welds were used to attach the gusset plate to the beam and to
the column. (Complete joint penetration welds are used since HSS-01, which had the
same gusset plate geometry, used fillet welds which fractured.) By combining the
horizontal and vertical interface forces, the total force on the column weld is shown
below along with the capacity of the weld:
kipsVHT ucucuc 4.18322 =+=
kipstHeightFP gEXXcw 2.4875.0*)130(*70*8.0*6.0*)1(*6.0 =−=−= φφ
Therefore, a CJP weld is adequate for the gusset plate to column connection. The
gusset plate to beam connection force is calculated below along with the capacity of the
weld
kipsVHT ububub 8.21222 =+=

299
kipstWidthFP gEXXbw 4.5545.0*)134(*70*8.0*6.0*)1(*6.0 =−=−= φφ
Therefore, a CJP weld is adequate for the gusset plate to beam connection. In the two
previous calculations of the weld size, the length of the gusset plate was reduced by 1"
to account for the weld access in the frame corner. The base material of the beam is
checked here:
( ) ( )[ ] kipsRn 7.109065134565.06.075.02 =−=φ
Therefore the base material is adequate since the strength is greater than the resultant
force on the beam Tub. The column base metal is okay by inspection. The next step is
to check the beam web for yielding and web crippling. Local yielding of the beam web
is shown here:
( ) wyn tFNkR += 5.2φ
( ) ( )( ) ( ) kipsRn 95.610345.050134967.05.2 =−+=φ
The beam web is more than adequate for web yielding in that the resistance is
approximately three times greater than the interface force. Crippling of the beam web is
checked below. The concentrated force is applied at a distance greater than d/2
therefore:
( )w
fy
f
wwn t
tEFtt
dNtR
⎥⎥
⎦
⎤
⎢⎢
⎣
⎡
⎟⎟⎠
⎞⎜⎜⎝
⎛⎟⎠⎞
⎜⎝⎛+=
5.1
2 3180.075.0φ

300
( ) ( ) ( ) ( )( )345.0
565.05029000565.0345.0
1.1613431345.080.075.0
5.12
⎥⎥⎦
⎤
⎢⎢⎣
⎡⎟⎠⎞
⎜⎝⎛⎟⎠⎞
⎜⎝⎛ −
+=nRφ
kipsRn 94.432=φ
This capacity is much larger than the expected interface force caused by the
compressive force of the brace. Therefore the beam is adequate for all checks.
Similarly the column satisfies all checks.
A.2.5 Beam-to-Column Connection – CJP
Beam column connection forces were determined in the previous section. Equilibrium
is applied in order to obtain the required design forces. The horizontal and vertical
forces in the beam column connection are shown here (these forces are concentric as
determined by the uniform force method):
kipsHH ucbc 6.69==
kipsVV ubbc 1.91==
Using complete penetration welds for the beam web, the capacity is:
( ) lywn FtR 6.075.0=φ
In this equation l is found by taking the depth of the member minus the thickness of the
flanges and accounting for the weld access holes which are both 1".
( ) ( ) "0.1312565.021.16 =−−=l

301
kipsRn 9.1000.13*50*345.0*6.0*75.0 ==φ
For this specimen the resistance is adequate. Using complete penetration welds for the
beam flanges, the capacity is:
( )( )( ) kipsRn 17904.750565.09.0 ==φ
Therefore the beam flange has adequate strength.
A.2.6 Beam-to-Column Connection – Simple Shear
Using the plastic capacity of the beam a shear force can be found to design the
connection.
( )( ) kipsM
V p 6.667.92
3.82505.15.1===
l
Using Table 10-9 an initial design is found using: 3/4” diameter A490X bolts with
standard holes, 13” x 4 1/2” x 3/8” plate and 5/16” fillet welds to connect the shear plate to
column flange. Assuming a flexible connection φRn = 69.8 kips. Then using Table 10-
1 web bearing of the beam is checked. From this table for an uncoped W16 beam:
( ) kipstRn w 1.121345.0351351 ===φ
Therefore, according to initial design the shear connection design is adequate. The next
step is to verify adequacy by checking each limit state individually. As mentioned the
shear plate was assumed to be grade A572 steel.
302
From AISC Table 7-10 the shear capacity of a single A490X bolt in single shear is 24.9
kips.
9.247.164
6.66≤== kipsFv
Therefore the bolt strength is adequate. Bearing at the connection material is checked
here:
( ) ( ) ( ) ( ) uucn FtdFtLr 4.275.02.175.0 ≤=φ
( ) ( ) kipsrn 9.326583
434.275.0 =⎟
⎠⎞
⎜⎝⎛⎟⎠⎞
⎜⎝⎛=φ
Since the bearing capacity of the plate is greater than the strength of the bolt the shear
plate is adequate for bearing. Similarly it was found that the beam web was adequate
for bearing. Next, shear strength of the plate needs to be checked. First the elastic yield
strength of the plate is checked:
( ) nvu AFRn 6.075.0=φ
where
26563.3834
161
4313 inAnv =⎥
⎦
⎤⎢⎣
⎡⎟⎠⎞
⎜⎝⎛ −−=
therefore
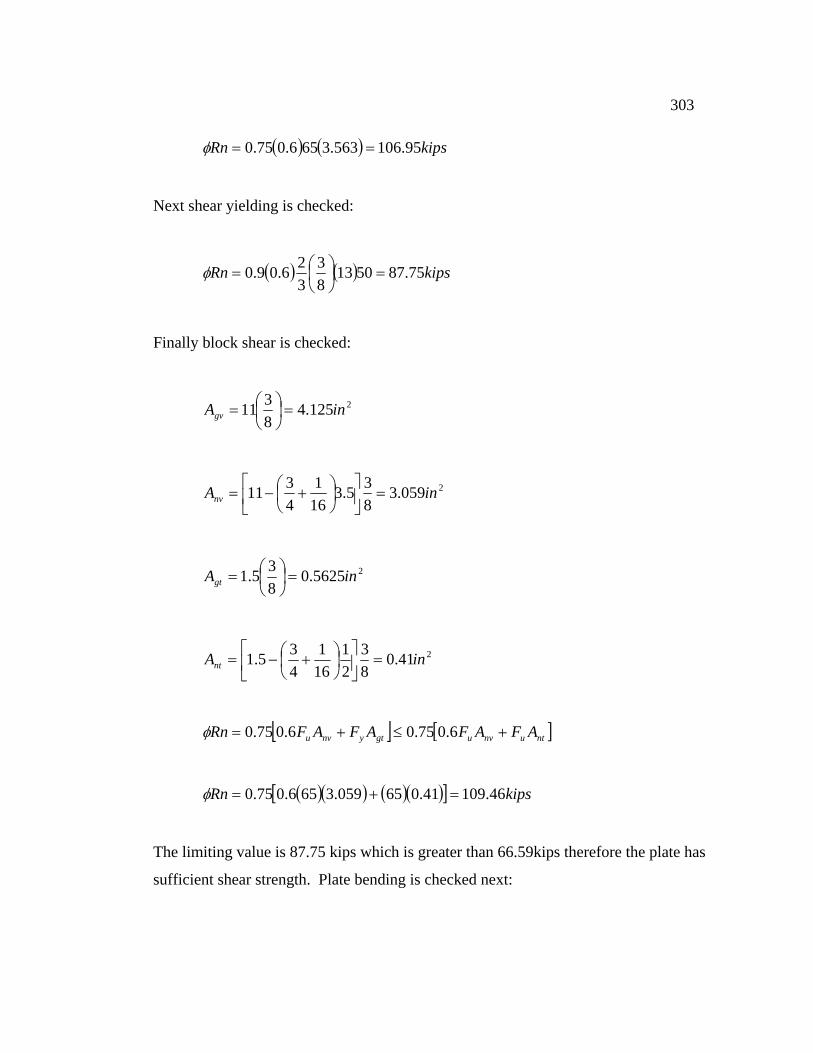
303
( ) ( ) kipsRn 95.106563.3656.075.0 ==φ
Next shear yielding is checked:
( ) ( ) kipsRn 75.87501383
326.09.0 =⎟
⎠⎞
⎜⎝⎛=φ
Finally block shear is checked:
2125.48311 inAgv =⎟⎠⎞
⎜⎝⎛=
2059.3835.3
161
4311 inAnv =⎥
⎦
⎤⎢⎣
⎡⎟⎠⎞
⎜⎝⎛ +−=
25625.0835.1 inAgt =⎟⎠⎞
⎜⎝⎛=
241.083
21
161
435.1 inAnt =⎥
⎦
⎤⎢⎣
⎡⎟⎠⎞
⎜⎝⎛ +−=
[ ] [ ]ntunvugtynvu AFAFAFAFRn +≤+= 6.075.06.075.0φ
( )( ) ( )( )[ ] kipsRn 46.10941.065059.3656.075.0 =+=φ
The limiting value is 87.75 kips which is greater than 66.59kips therefore the plate has
sufficient shear strength. Plate bending is checked next:

304
( ) ( ) inkeV −== 77.199359.66
( ) ( ) inkRn −=⎟⎠⎞
⎜⎝⎛⎟⎠⎞
⎜⎝⎛= 3.4755013
83
619.0 2φ
Thus, the plate has sufficient bending capacity. Lastly, the shear plate welds are
designed. Table 8-5 is used to size the fillet welds that connect the shear plate to the
face of the column flange. The needed values are as follows:
0=k
Here k is conservatively taken to be zero. However, the actual value of k could be used
with linear interpolation to find a more accurate value of C.
231.0133===
l
ea
Linearly interpolating between tabulated values for a of 0.20 and 0.25
56.22
48.264.2≈
+≈C
lDCCRn 1=φ
11 =C , 5=D , 13=l
kipsRn 4.166=φ

305
As can be seen the weld strength is more than sufficient proving that the simplifications
were acceptable.
A.3 Example 2 (Specimen HSS-14)
The following example shows calculations used for the design of specimen HSS-14.
This example shows only calculations that were different from the previous design
example in section A.2 above.
A.3.1 Gusset Plate Design
The gusset plate design shown in this section is an example of the process explained in
Section 8.1.1 which uses the elliptical clearance method. The thickness of the plate first
had to be assumed and was calculated to be 3/8 inch based on the limit states of
Whitmore yielding, Whitmore fracture, and block shear (similar calculations are shown
in section A.2.3). Buckling was then checked to determine if the assumed thickness
was correct after the geometry was determined. The geometry was determined using
the following steps:
1. Assume the height of the gusset plate (21 inches) to establish a trial geometry with
these equations:
"1.18375.*7.721 =−=−= gNtHTb
"94.1125.6)45tan(
22)tan(
=−=−= cb
b ee
xθ
"94.1== bs xx
⎟⎟⎠
⎞⎜⎜⎝
⎛−+++= 1
)tan(1
)tan( θθ gsb Ntbxxa

306
"0.221)45tan(
1375.0*7.7)45tan(
1.1894.194.1 =⎟⎟⎠
⎞⎜⎜⎝
⎛−+++=a
"9.24375.0*7.722 =+=+= gNtaWT
2. Determine the end of the brace relative to the gusset plate free corner (x, y):
)cos()5.0()sin( θθ fcc bsly ++=
"8.12)45cos()5*5.0875(.)45sin(75.14 =++=cy
)tan(])sin()5.0()cos([ θθθ bfcd xbsly −++=
[ ] "9.10)45tan(94.1)45sin()5*5.0875.0()45cos(75.14 =−++=dy
8.12),max( == dc yyy
8.1494.1)45tan(
8.12)tan(
=+=+= sc xyxθ
)sin()5.0()cos( θθ fcd bslx ++=
8.12)45sin()5*5.0875.0()45cos(75.14 =++=dx
8.14),max( == dc xxx
3. Determine the corners of the brace:
0.13)45sin(5*5.08.14)sin(5.01 =−=−= θfbxx
6.14)45cos(5*5.08.12)cos(5.01 =+=+= θfbyy
5.16)45sin(5*5.08.14)sin(5.02 =+=+= θfbxx
0.11)45cos(5*5.08.12)cos(5.02 =−=−= θfbyy
4. Verify if xb is correct for each corner (corner 1 and corner 2).

307
sgverifyb xNtbyb
bxx −⎟⎟
⎠
⎞⎜⎜⎝
⎛−−−
−= 1
)tan(1
)tan(21
2
221
1__ θθ
85.194.11)45tan(
1375.0*7.7)45tan(
1.186.141.181.18*0.13
22
22
1__ =−⎟⎟⎠
⎞⎜⎜⎝
⎛−−−
−=verifybx
sgverifyb xNtbybbx
x −⎟⎟⎠
⎞⎜⎜⎝
⎛−−−
−= 1
)tan(1
)tan(22
2
222
2__ θθ
80.094.11)45tan(
1375.0*7.7)45tan(
1.180.111.181.18*5.16
22
22
2__ =−⎟⎟⎠
⎞⎜⎜⎝
⎛−−−
−=verifybx
Finally, check to see if the right gusset plate height was chosen in the first step. All
three conditions shall be met.
bverifyb xx ≤1__
bverifyb xx ≤2__
And
bverifyb xx =1__
Or
bverifyb xx =2__
Since both xb_verify’s are less than xb, and since xb_verify_1 is equal to xb then the correct
height was chosen. (Actually, xb_verify_1 does not equal xb and the height should be
20.97, but 21 is close enough.) The thickness of the plate was verified with the
buckling check shown below. The values of l1, l2 and l3 were taken from the design
drawing and were equal to 3.26", 11.54" and 0.53" respectively.
308
( ) ( ) 23.029000
50125.0
1.55.02900012
===ππ
λ y
p
ave Ft
Kl
Solving for the buckling capacity:
( ) ( ) ( ) kipsRn 1.343375.003.2250658.085.02234.0 ==φ
Therefore, a 3/8 inch plate works for buckling.
A.3.2 Gusset Plate-to-Framing Element Welds
The weld design in this section is based on the design calculations shown in Section 8.4.
The weld is to be designed based on the tensile strength of the gusset plate:
gyyeffEXX tFRtF ≥6.0**5.1 β
The strength of the two 7/16 inch fillet welds are shown here:
kipstF effEXX 3.2516/7*707.0*70*6.0*65.0*5.1*26.0**5.1 ==β
While the capacity of the gusset plate is:
kipstFR gyy 6.20375.0*50*1.1 ==
Therefore, the weld design is acceptable. It is apparent that the weld design is slightly
conservative. According to the weld design equation, a 3/8 inch weld is adequate:
309
kipstF effEXX 7.2116/5*707.0*70*6.0*75.0*5.1*26.0**5.1 ==φ
A 7/16 inch weld was used because these welds were in the process of being evaluated
during this test.

310
Appendix B: Specimen Drawings
B.1 General
This appendix contains design drawings of the specimens tested by Johnson (2005),
Herman (2007) and the specimens detailed in this thesis. Details for the framing
members and their connections, which are similar for all of the tests, can be seen in
Appendix A of Johnson (2005). Details of the test setup including the channel
assembly, reaction block, load beam, and actuator assembly can be found in Appendix
C of Johnson (2005).

311
Figure B.1 – Speciman HSS-01

312
Figure B.2 – HSS-01 Gusset Plate Detail

313
Figure B.3 – Speciman HSS-02

314
Figure B.4 – HSS-02 Gusset Plate Detail
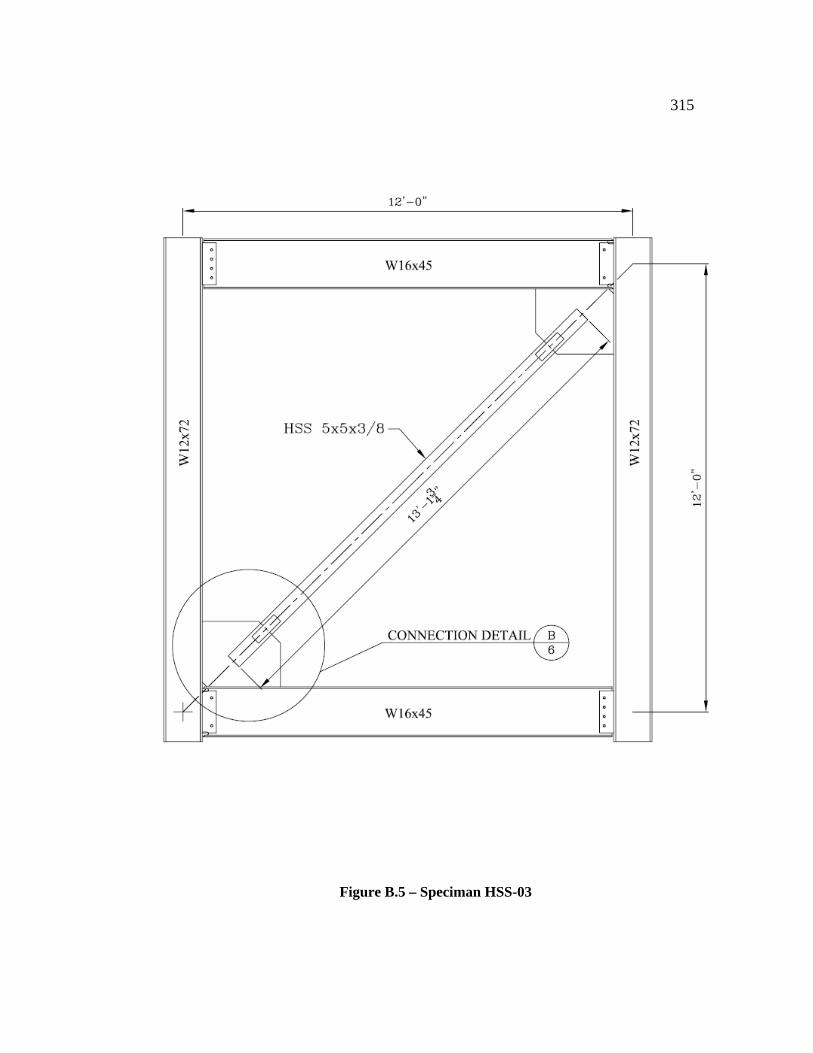
315
Figure B.5 – Speciman HSS-03

316
Figure B.6 – HSS-03 Gusset Plate Detail
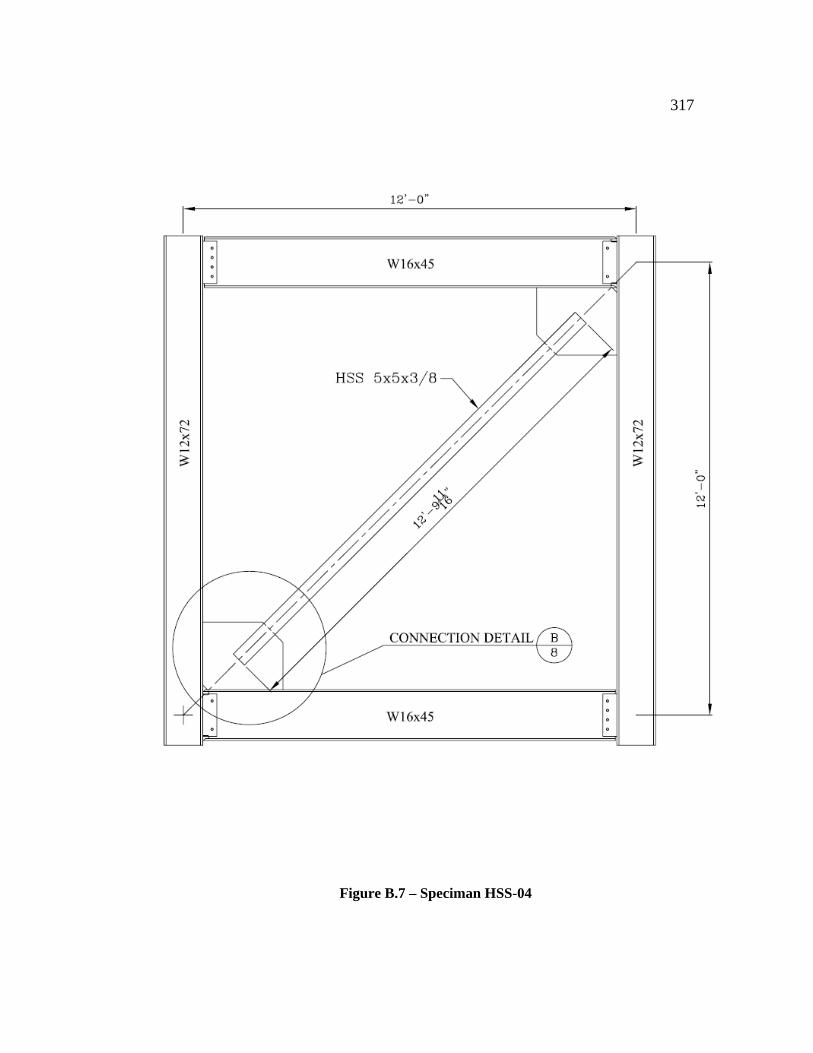
317
Figure B.7 – Speciman HSS-04
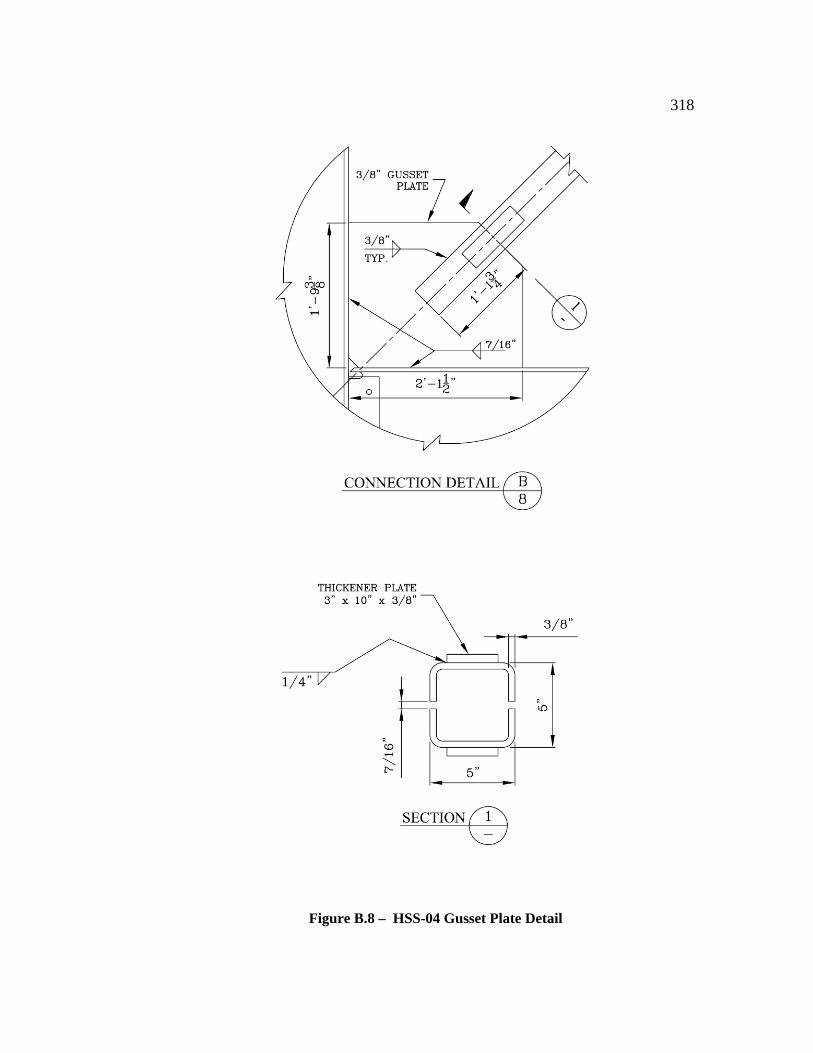
318
Figure B.8 – HSS-04 Gusset Plate Detail

319
Figure B.9 – Speciman HSS-05
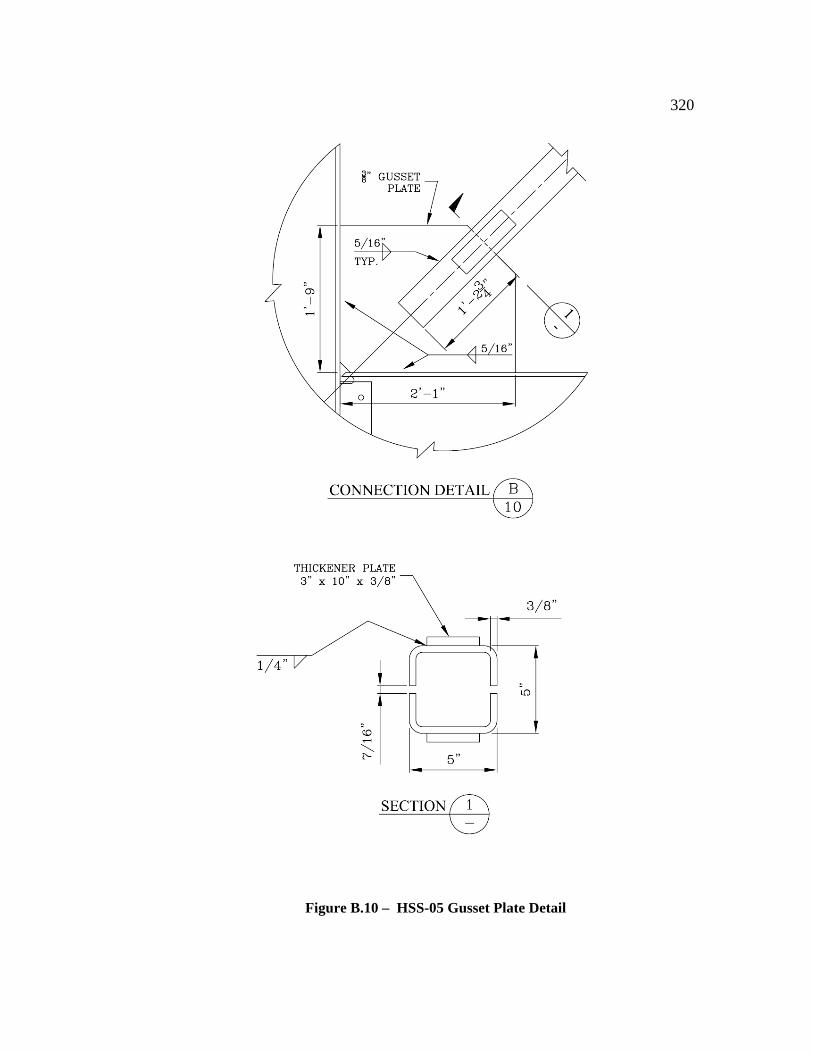
320
Figure B.10 – HSS-05 Gusset Plate Detail
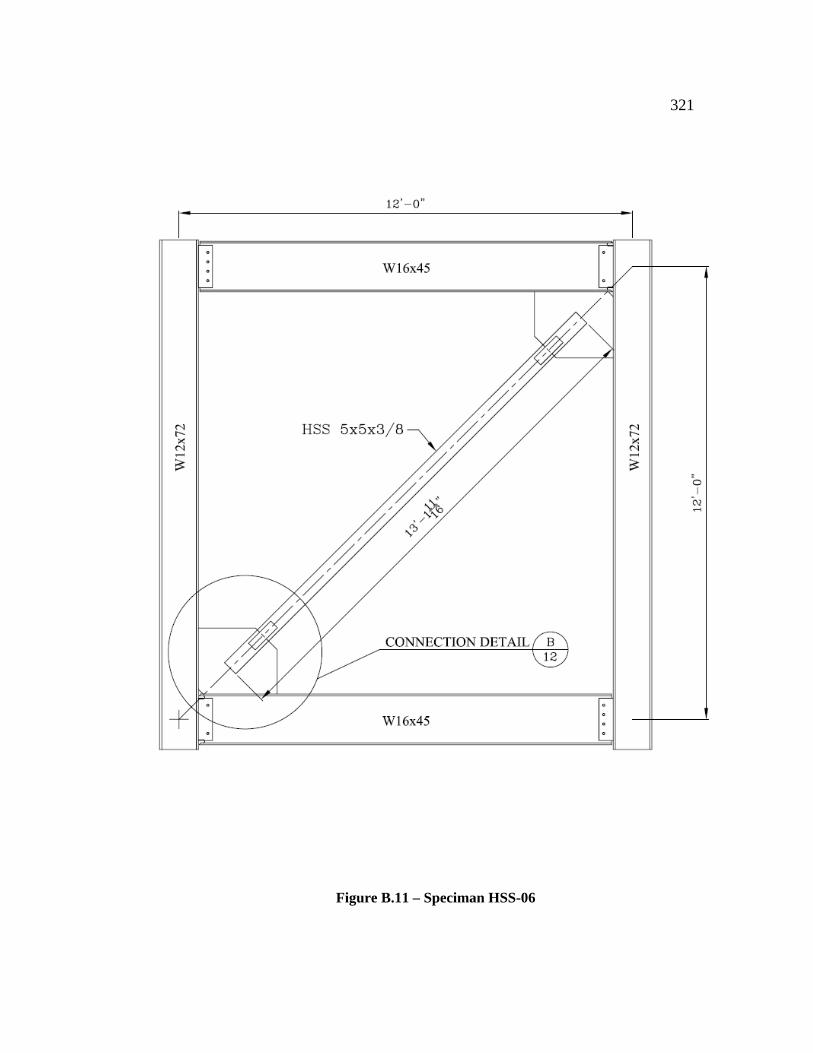
321
Figure B.11 – Speciman HSS-06

322
Figure B.12 – HSS-06 Gusset Plate Detail

323
Figure B.13 – Speciman HSS-07
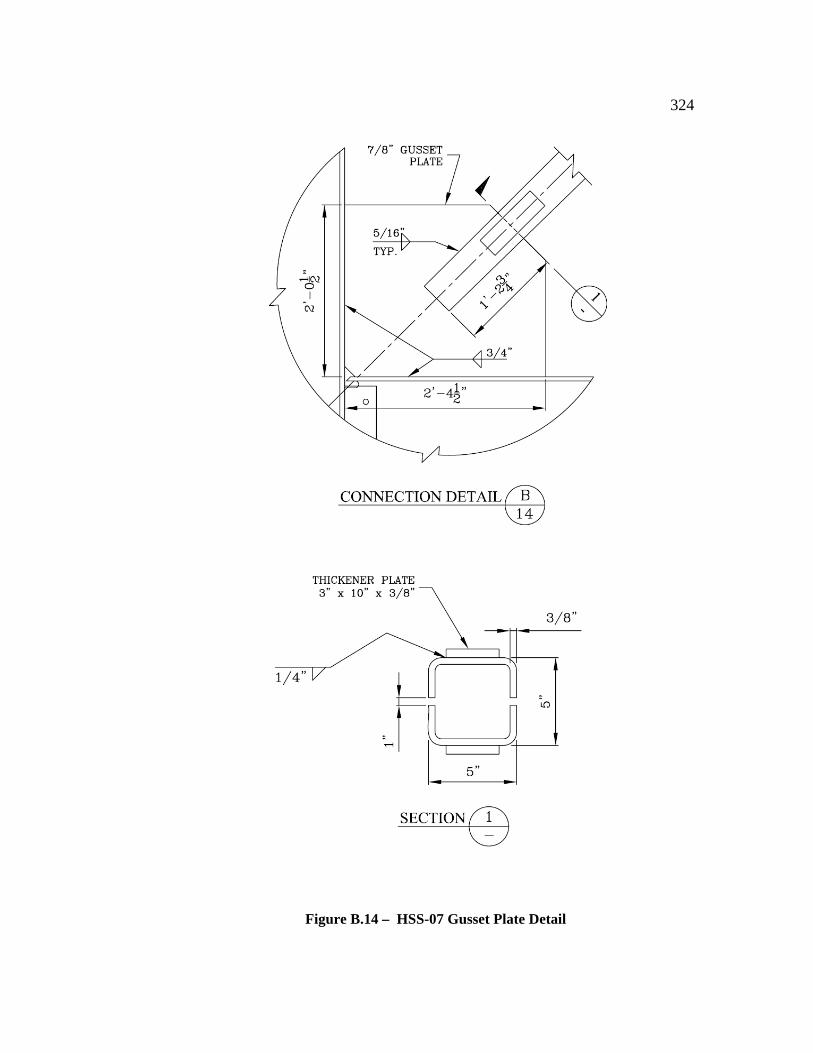
324
Figure B.14 – HSS-07 Gusset Plate Detail

325
Figure B.5 – Speciman HSS-08
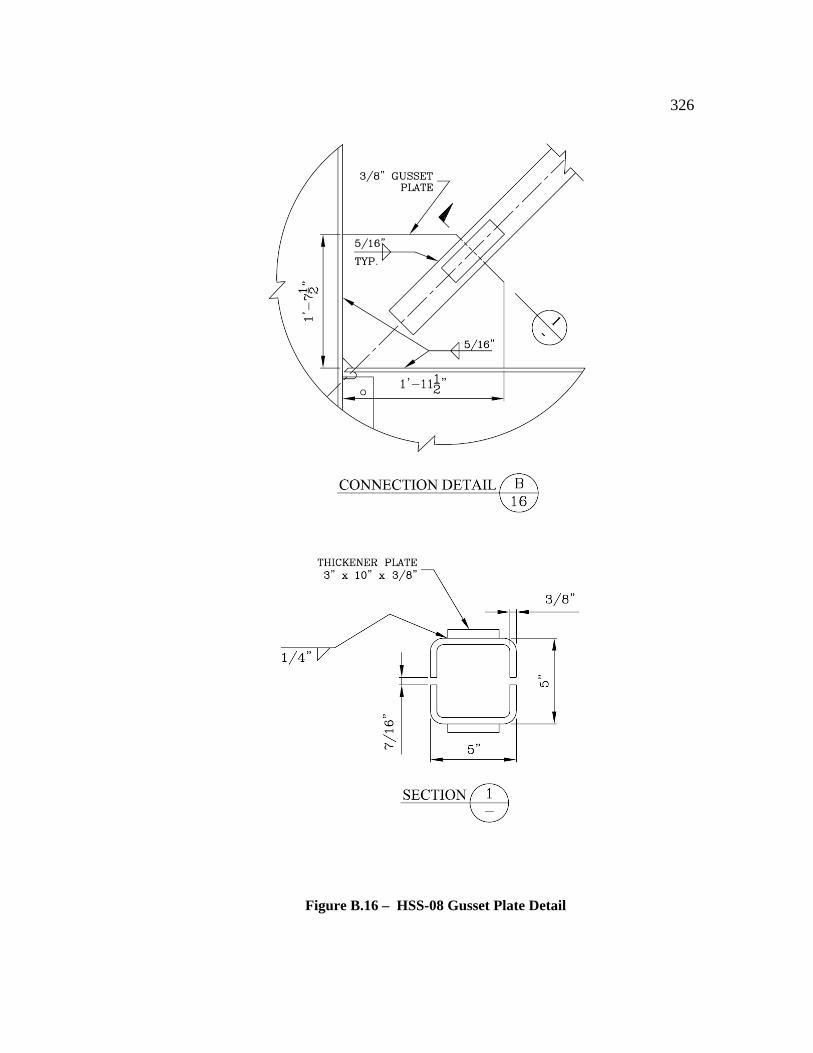
326
Figure B.16 – HSS-08 Gusset Plate Detail
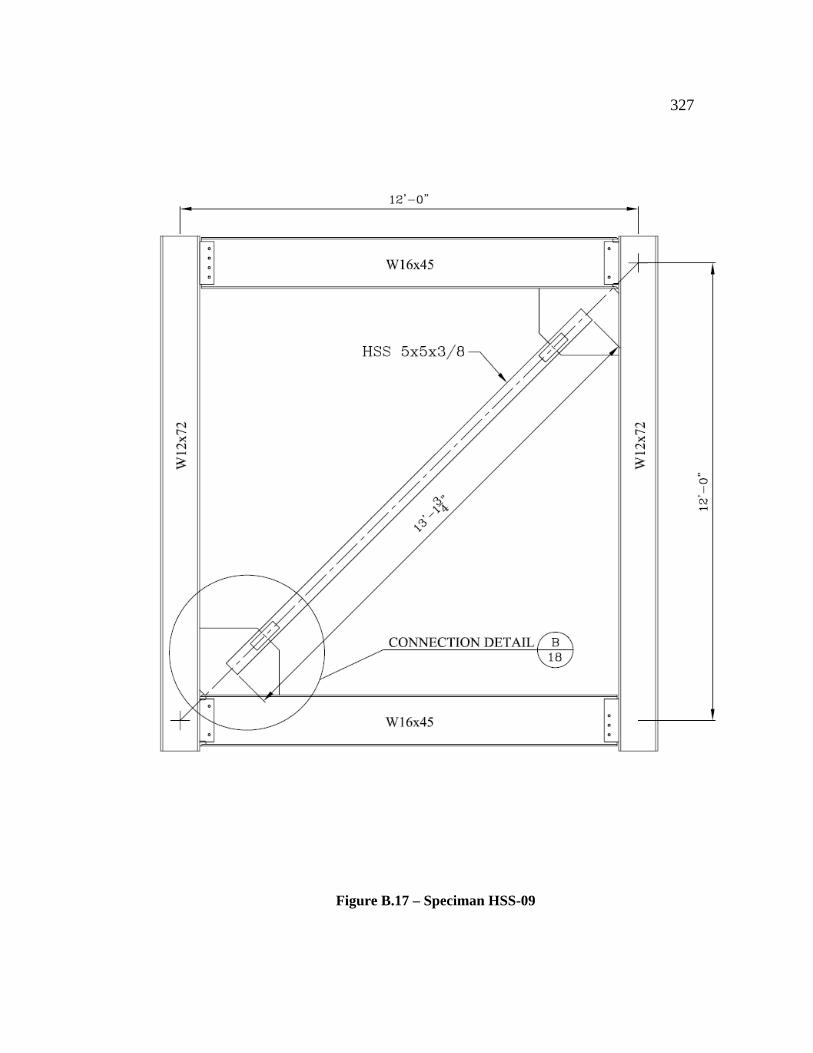
327
Figure B.17 – Speciman HSS-09

328
Figure B.18 – HSS-09 Gusset Plate Detail

329
Figure B.19 – Speciman HSS-10
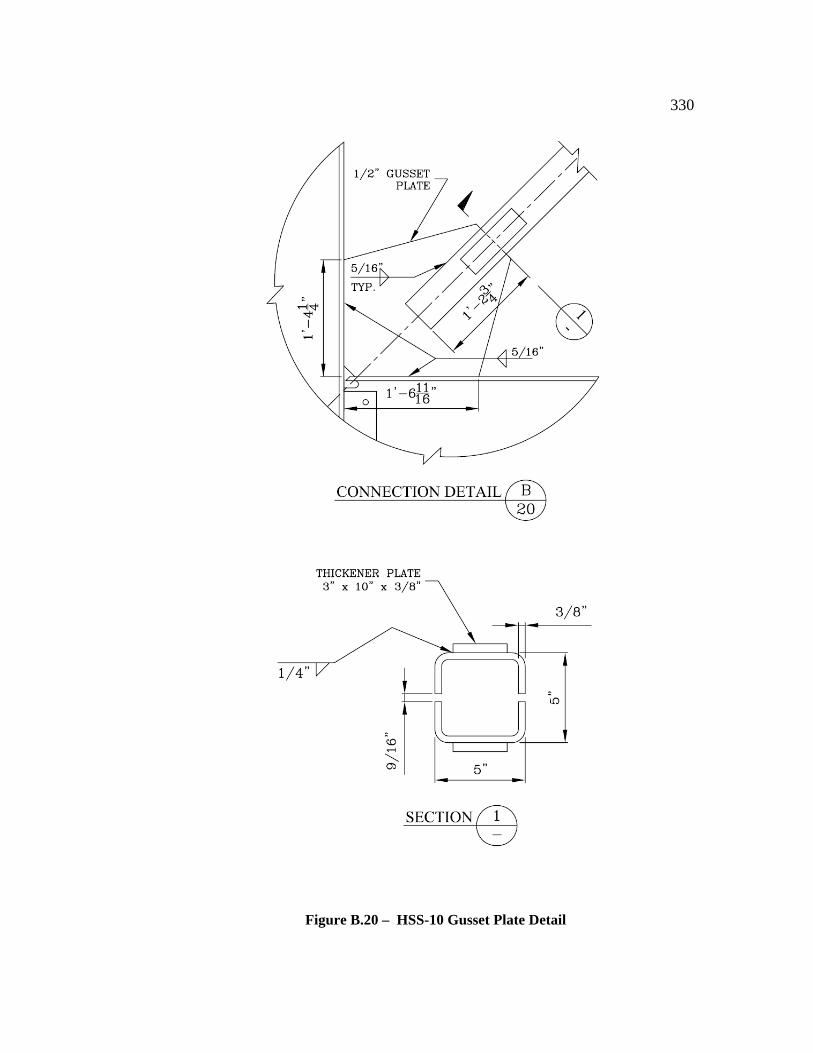
330
Figure B.20 – HSS-10 Gusset Plate Detail
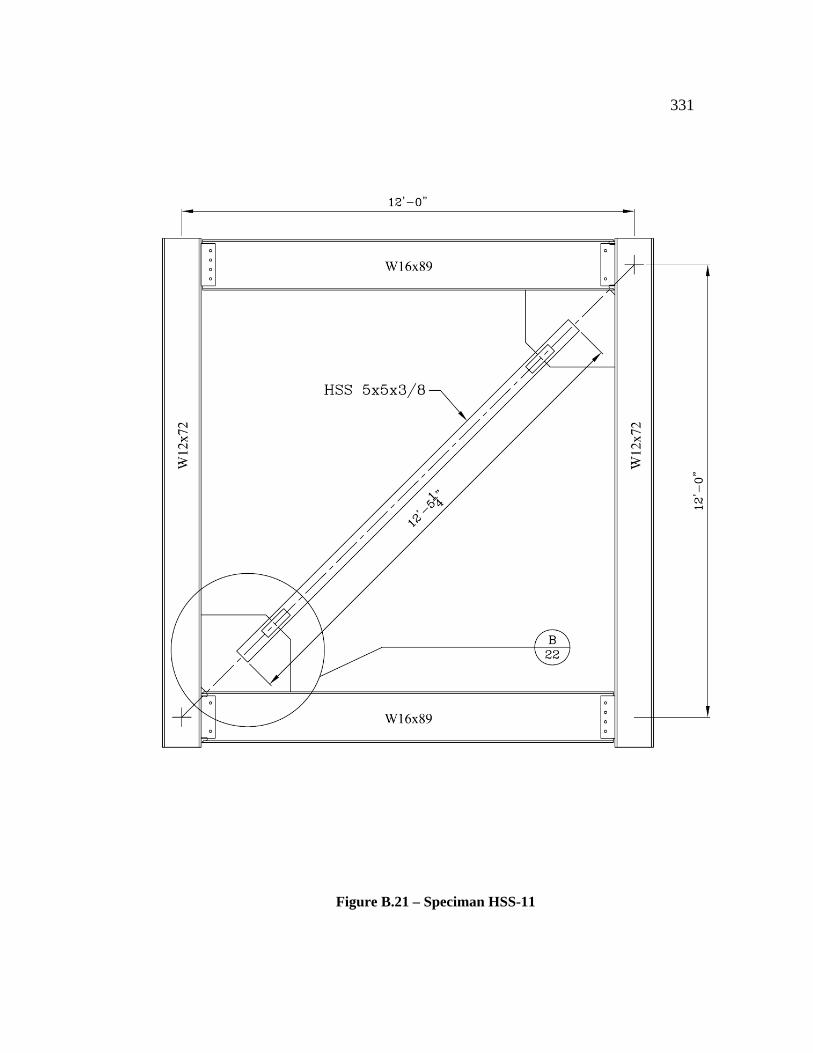
331
Figure B.21 – Speciman HSS-11

332
Figure B.22 – HSS-11 Gusset Plate Detail

333
Figure B.23 – Speciman HSS-12

334
Figure B.24 – HSS-12 Gusset Plate Detail

335
Figure B.25 – Speciman HSS-13
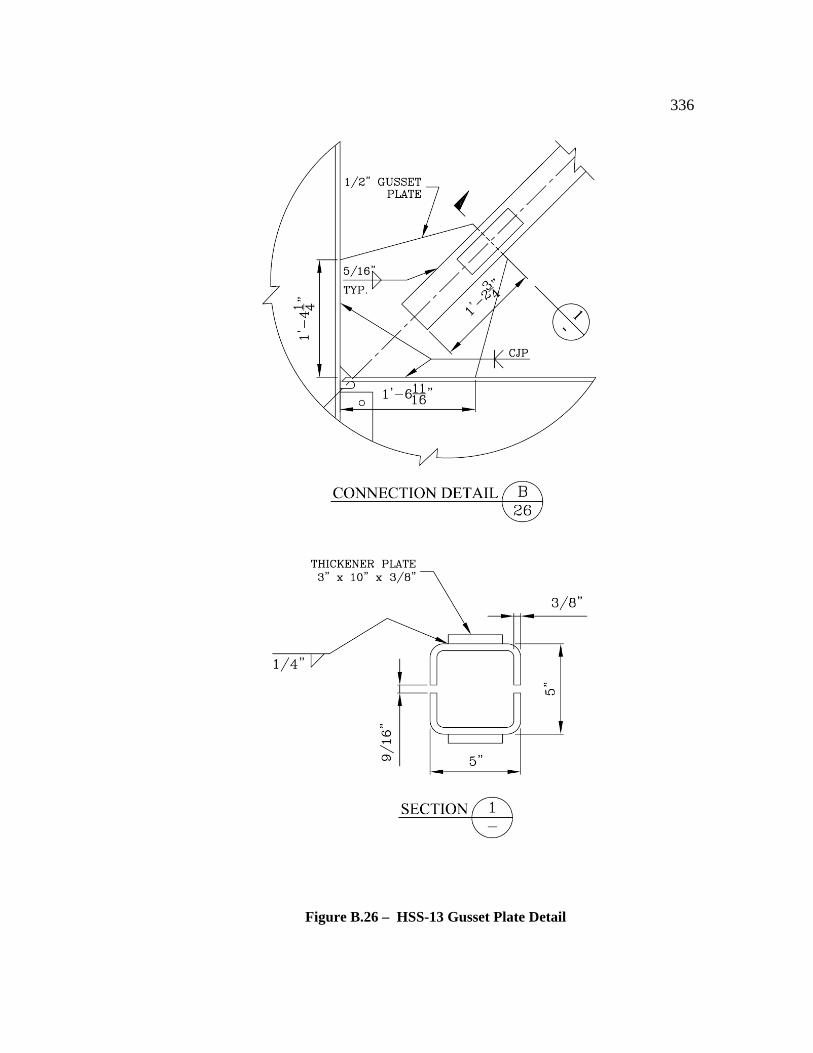
336
Figure B.26 – HSS-13 Gusset Plate Detail

337
Figure B.27 – Speciman HSS-14
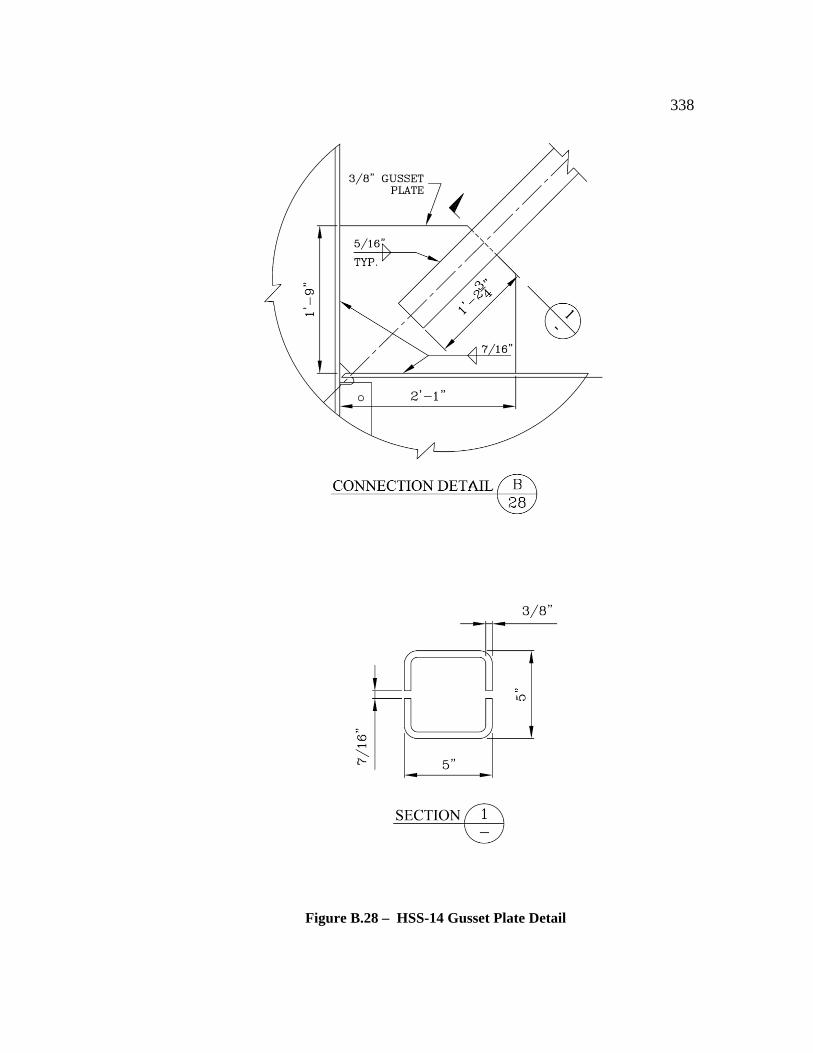
338
Figure B.28 – HSS-14 Gusset Plate Detail
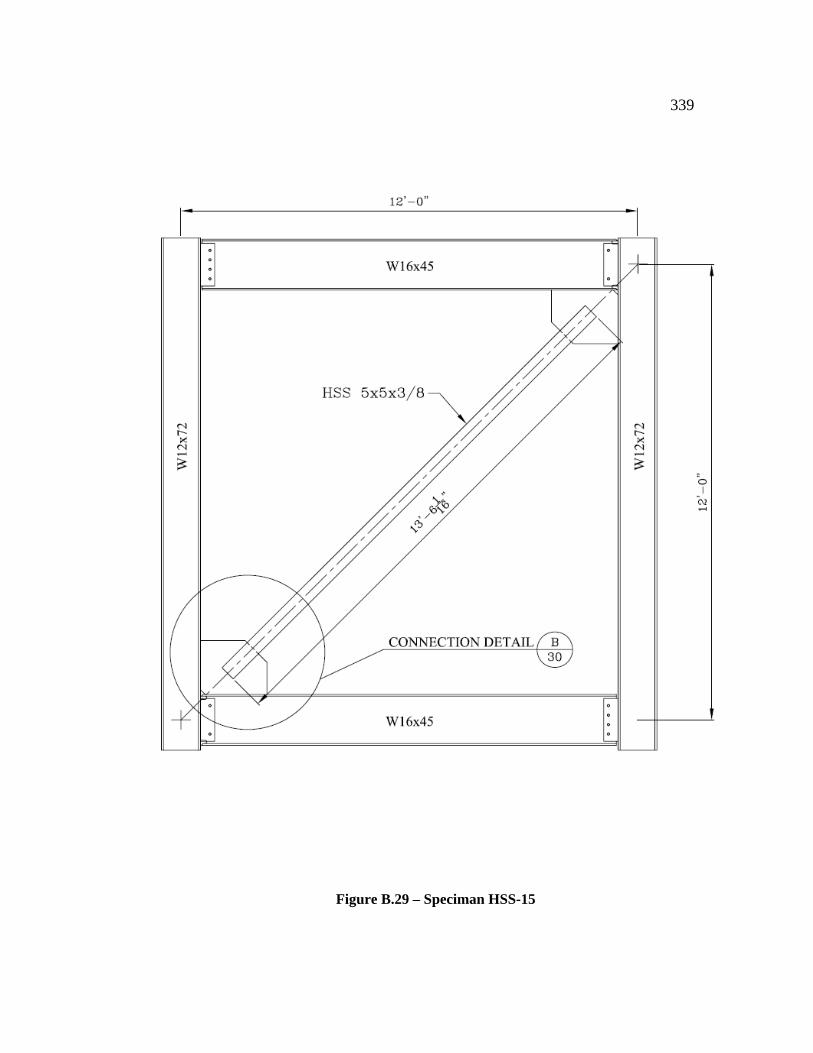
339
Figure B.29 – Speciman HSS-15
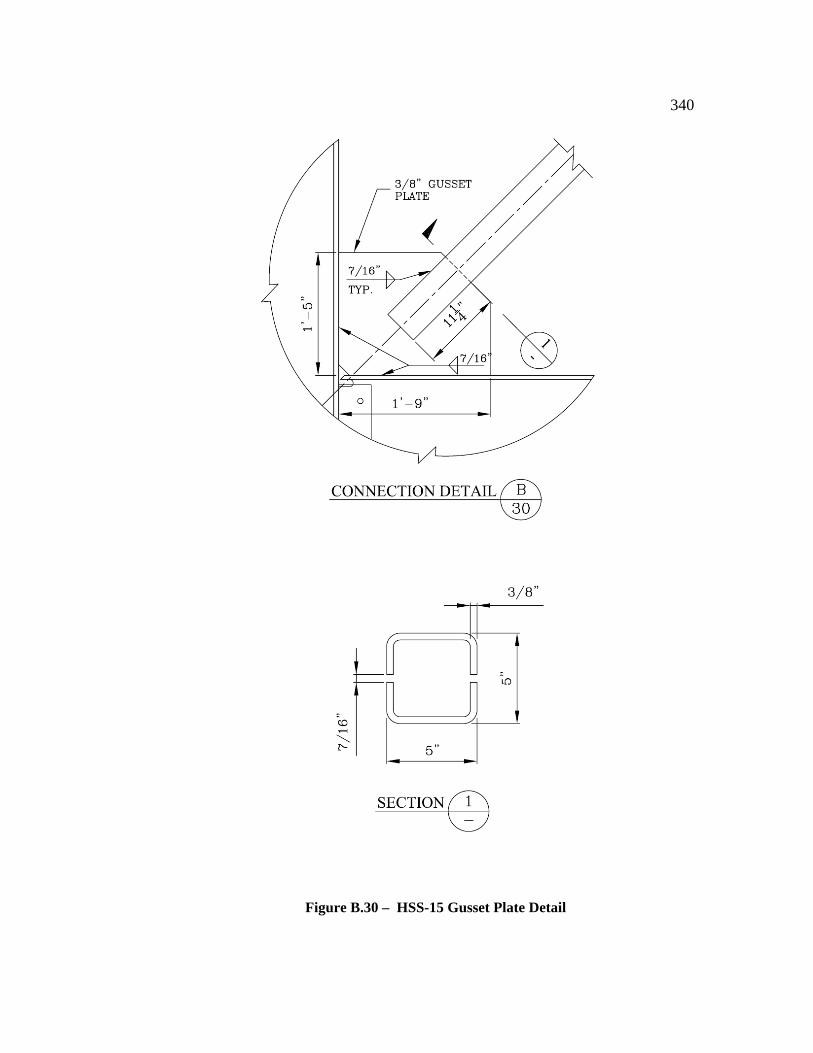
340
Figure B.30 – HSS-15 Gusset Plate Detail
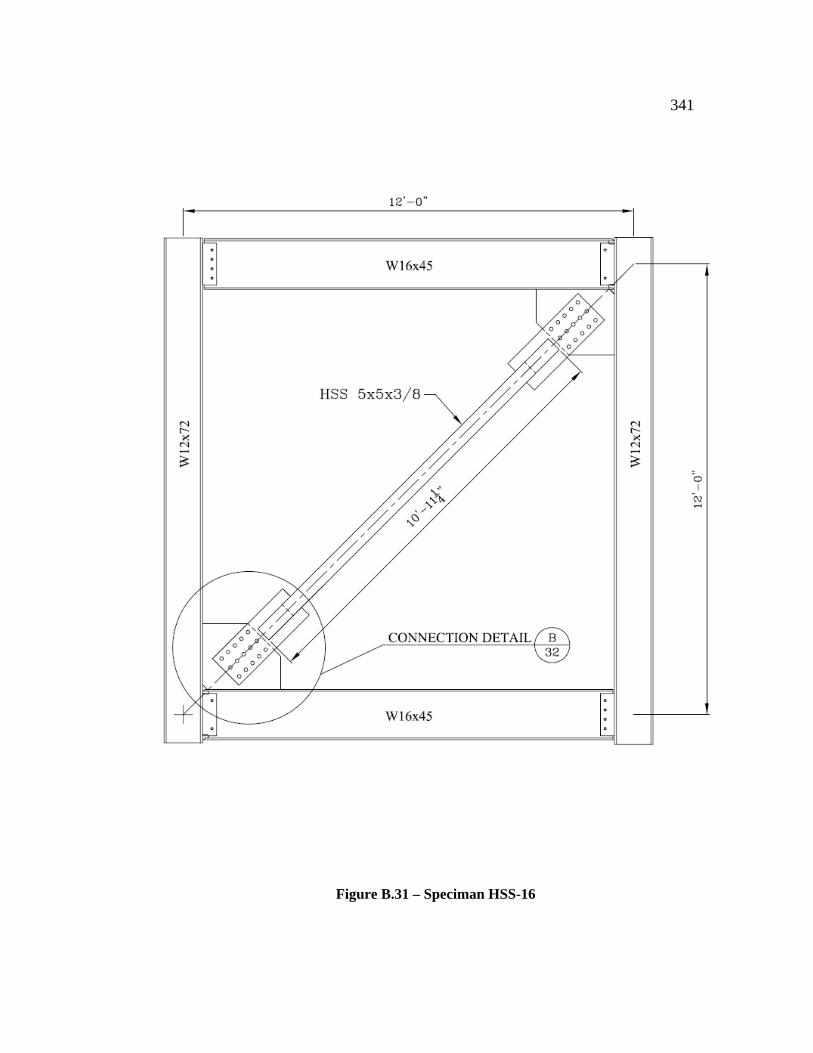
341
Figure B.31 – Speciman HSS-16
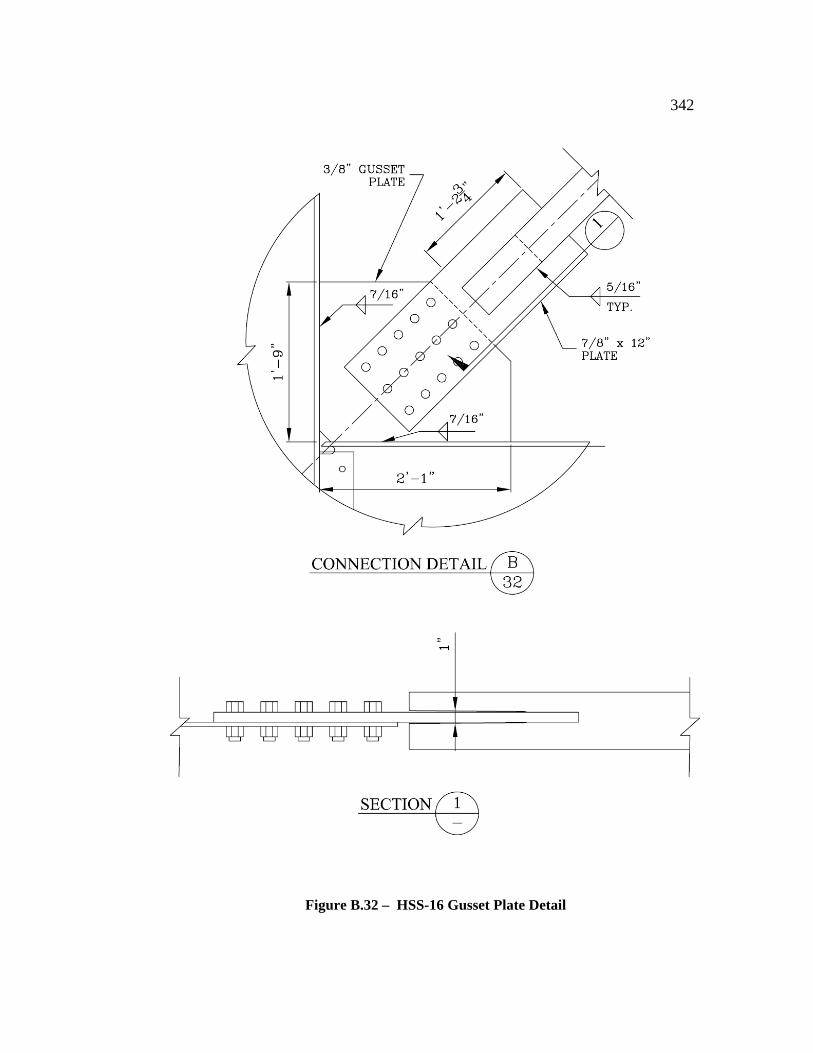
342
Figure B.32 – HSS-16 Gusset Plate Detail

343
Figure B.33 – Speciman HSS-17
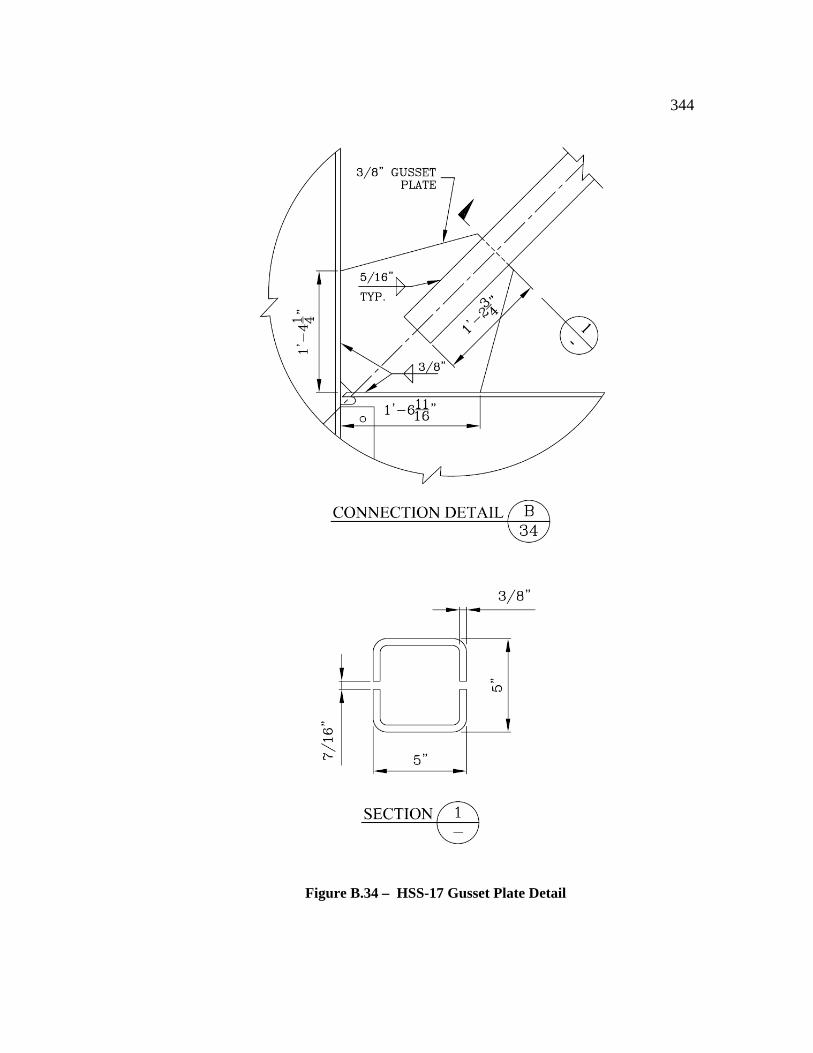
344
Figure B.34 – HSS-17 Gusset Plate Detail

345
Appendix C: Finite Element Analyses
C.1 General
A series of finite element analyses were carried out for the gusset plates used for the
specimens in the entire test program. These analyses used SAP2000 Advanced, version
9.2.0. A linear elastic analysis was carried out for each model. Neither geometric, nor
material nonlinearity was included in the model.
C.2 Model Description
The models were very similar. An example of one of the finite element models is
shown below in Figure C.1.1. The gusset plates used thick shell elements for the type
of area member (two dimensional member). Each model contained the gusset plate and
the HSS tube walls only. The tube walls used framing elements (one dimensional
members instead of two dimensional members) defined as a rectangular section
measuring 3/8 of an inch by 5 inches. Each tube wall was divided at each joint in the
gusset plate mesh, and also connected to these joints in the mesh. However, to keep the
models relatively simple, the top and bottom walls were not included in the model.
These were left out on all of the models and therefore, the difference from leaving these
walls out should have had a similar effect on all of the models. The models used pinned
supports at the edge of the gusset plates. In reality, these supports would be springs,
and also have rotational resistance as well. However, all of the gusset plates were
modeled this way, and therefore, the differnces should be negligible.
HSS-01 through HSS-12, excluding HSS-10, used straight line mesh generation, while
the remaining specimens used a random mesh generation (see Figures C.5.1 to C.13.1
for the mesh details). This was done because the random mesh algorithm did not work

346
on all of the gusset plates. However, since HSS-14 had the same gusset plate geometry
as HSS-05 and HSS-06, and because they used different mesh geometries (straight line
generation verses random generation), it was verified that this difference was negligible
(less than 1.0% difference as shown in Section C.4).
Figure C.1.1 – 3D View of Example FEM Model
C.3 Loads
Each finite element model of the gusset plate was loaded with an axial load and a
moment. The axial load applied was equal to one half kip at each tube wall at the edge
of the gusset plate as shown in Figure C.3.1. The moment applied was equal to one half
inch-kip at each tube wall at the edge of the gusset plate as shown in Figure C.3.2.
Each of the loads was divided into x and y components.

347
Figure C.3.1 – Axial Load on Gusset Plates
Figure C.3.2 – Moment on Gusset Plates

348
C.4 Results
To determine the stiffnesses of the gusset plates, the deflection and rotation were
computed at each point of applied load in the direction of the applied load by the
computer program. The average between the two values determined at these two points
was calculated and the stiffness was determined as the force over deformation. Table
C.1 shows the results of the finite element analyses.
Table C.1 – Gusset Plate Stiffness as Determined by FEM Analysis

349
C.5 Specimen HSS-01 (same as HSS-12)
The finite element mesh for HSS-01 and HSS-12 is shown below in Figure C.5.1.
Figure C.3.1 – Finite Element Mesh for HSS-01 and HSS-12

350
C.6 Specimen HSS-02 (same as HSS-03 and HSS-09)
The finite element mesh for HSS-02, HSS-03, and HSS-09 is shown here in Figure
C.6.1.
Figure C.6.1 – Finite Element Mesh for HSS-02 and HSS-03
C.7 Specimen HSS-04
The finite element mesh for HSS-04 is shown here in Figure C.7.1
Figure C.7.1 – Finite Element Mesh for HSS-04
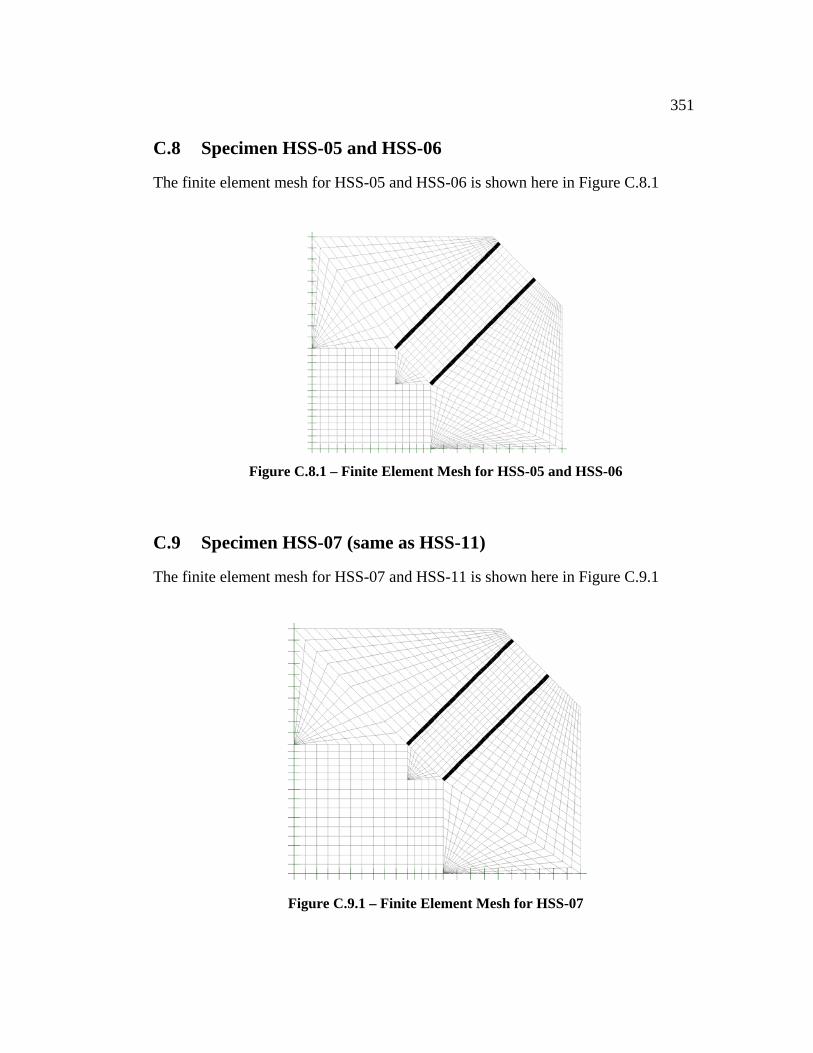
351
C.8 Specimen HSS-05 and HSS-06
The finite element mesh for HSS-05 and HSS-06 is shown here in Figure C.8.1
Figure C.8.1 – Finite Element Mesh for HSS-05 and HSS-06
C.9 Specimen HSS-07 (same as HSS-11)
The finite element mesh for HSS-07 and HSS-11 is shown here in Figure C.9.1
Figure C.9.1 – Finite Element Mesh for HSS-07
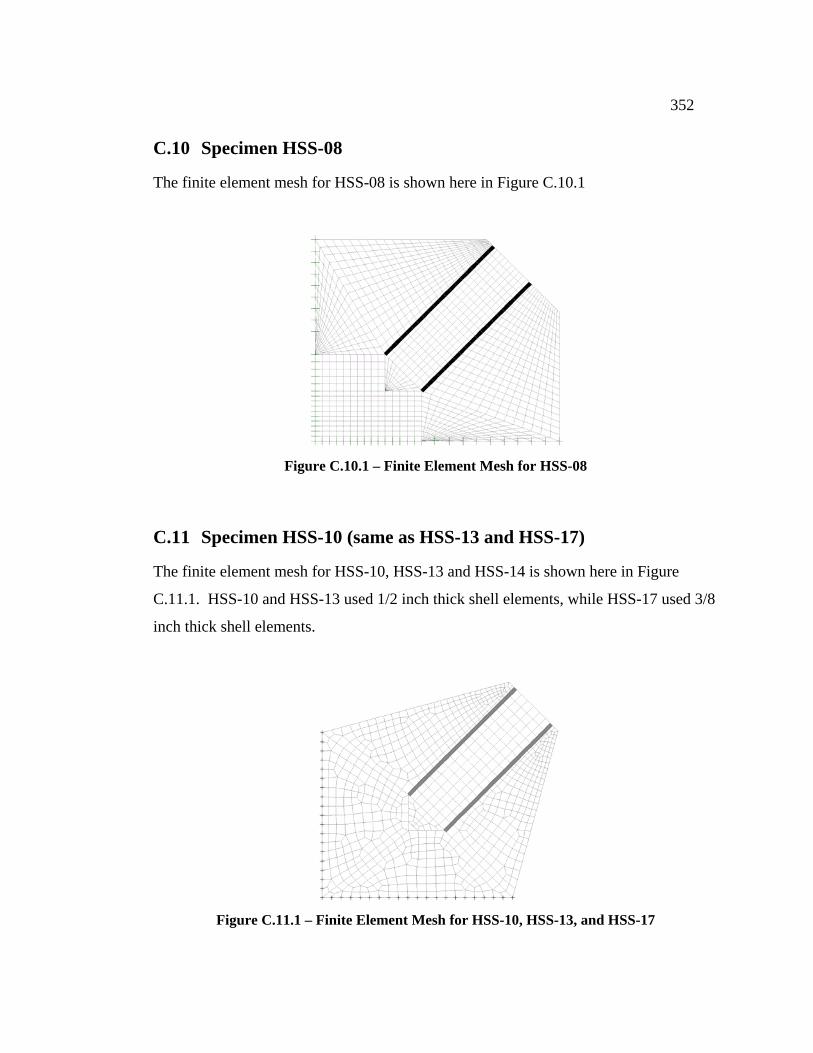
352
C.10 Specimen HSS-08
The finite element mesh for HSS-08 is shown here in Figure C.10.1
Figure C.10.1 – Finite Element Mesh for HSS-08
C.11 Specimen HSS-10 (same as HSS-13 and HSS-17)
The finite element mesh for HSS-10, HSS-13 and HSS-14 is shown here in Figure
C.11.1. HSS-10 and HSS-13 used 1/2 inch thick shell elements, while HSS-17 used 3/8
inch thick shell elements.
Figure C.11.1 – Finite Element Mesh for HSS-10, HSS-13, and HSS-17

353
C.12 Specimen HSS-14
The finite element mesh for HSS-14 is shown here in Figure C.12.1
Figure C.12.1 – Finite Element Mesh for HSS-14
An additonal finite element model of the gusset plate used in HSS-14 was analyzed to
determine the effective stiffness of the gusset plate with weld cracks that typically
occurred at the reentrant corners of the gusset plate during testing. This model did not
include boundary conditions (pin supports) at the location of the cracks for a length of
6-1/4 inches at the reentrant corner at the beam, and for 4-3/4 inches at the reentrant
corner at the column, as shown in Figure C.12.2. The crack lengths were chosen to be
this so that the connection length would be the same as the connection length for the
tapered plates that were tested in HSS-10, HSS-13 and HSS-17.

354
Figure C.12.2 – FEM Mesh for HSS-14 with Weld Cracks
C.13 Specimen HSS-15
The finite element mesh for HSS-15 is shown here in Figure C.13.1
Figure C.13.1 – Finite Element Mesh for HSS-15
No support here
No support here
6-1/4”
4-3/4”
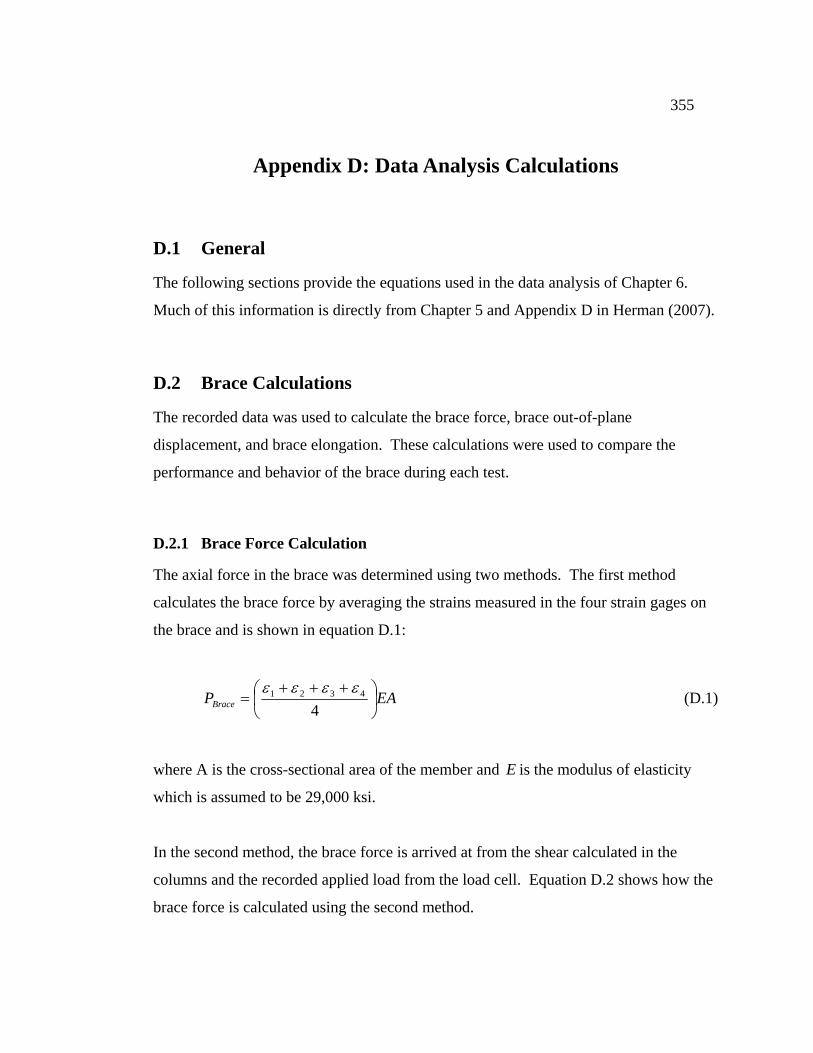
355
Appendix D: Data Analysis Calculations
D.1 General
The following sections provide the equations used in the data analysis of Chapter 6.
Much of this information is directly from Chapter 5 and Appendix D in Herman (2007).
D.2 Brace Calculations
The recorded data was used to calculate the brace force, brace out-of-plane
displacement, and brace elongation. These calculations were used to compare the
performance and behavior of the brace during each test.
D.2.1 Brace Force Calculation
The axial force in the brace was determined using two methods. The first method
calculates the brace force by averaging the strains measured in the four strain gages on
the brace and is shown in equation D.1:
EAPBrace ⎟⎠⎞
⎜⎝⎛ +++
=4
4321 εεεε (D.1)
where A is the cross-sectional area of the member and E is the modulus of elasticity
which is assumed to be 29,000 ksi.
In the second method, the brace force is arrived at from the shear calculated in the
columns and the recorded applied load from the load cell. Equation D.2 shows how the
brace force is calculated using the second method.
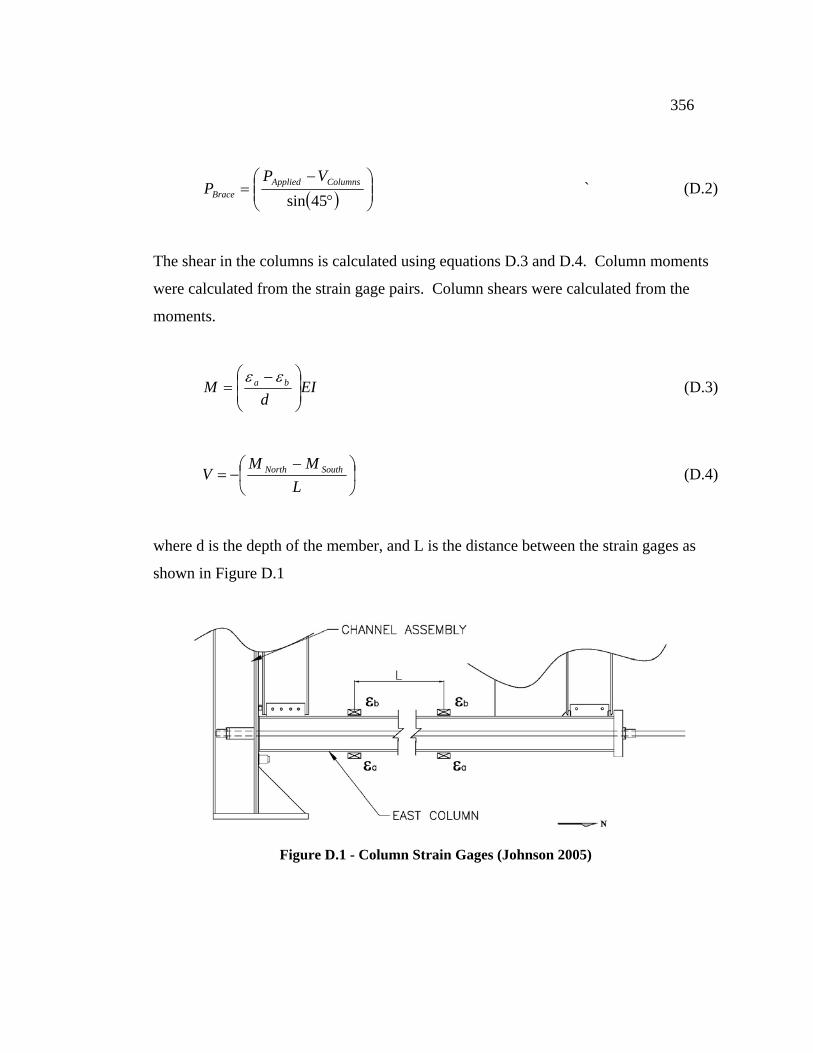
356
( ) ⎟⎟⎠
⎞⎜⎜⎝
⎛°
−=
45sinColumnsApplied
Brace
VPP ` (D.2)
The shear in the columns is calculated using equations D.3 and D.4. Column moments
were calculated from the strain gage pairs. Column shears were calculated from the
moments.
EId
M ba⎟⎟⎠
⎞⎜⎜⎝
⎛ −=
εε (D.3)
⎟⎠
⎞⎜⎝
⎛ −−=
LMM
V SouthNorth (D.4)
where d is the depth of the member, and L is the distance between the strain gages as
shown in Figure D.1
Figure D.1 - Column Strain Gages (Johnson 2005)

357
D.2.2 Brace Out-of-Plane Displacement Calculation
Out-of-plane displacement measurements were taken at various points along the brace
but only the mid-span measurements required calculations. The out-of-plane
displacement of the brace mid-span was calculated using the measured vertical and
horizontal displacement of the center of the brace. The instrumentation configuration at
mid-span is shown in Figure D.2. Device 54 provides the length of variable 54DΔ and
Device 53 provides the length of variable 53DΔ . The remaining variables used in the
calculation are illustrated in Figure D.3.
Figure D.2 - Brace Out-of-Plane Measurement Schematic (Johnson 2005)
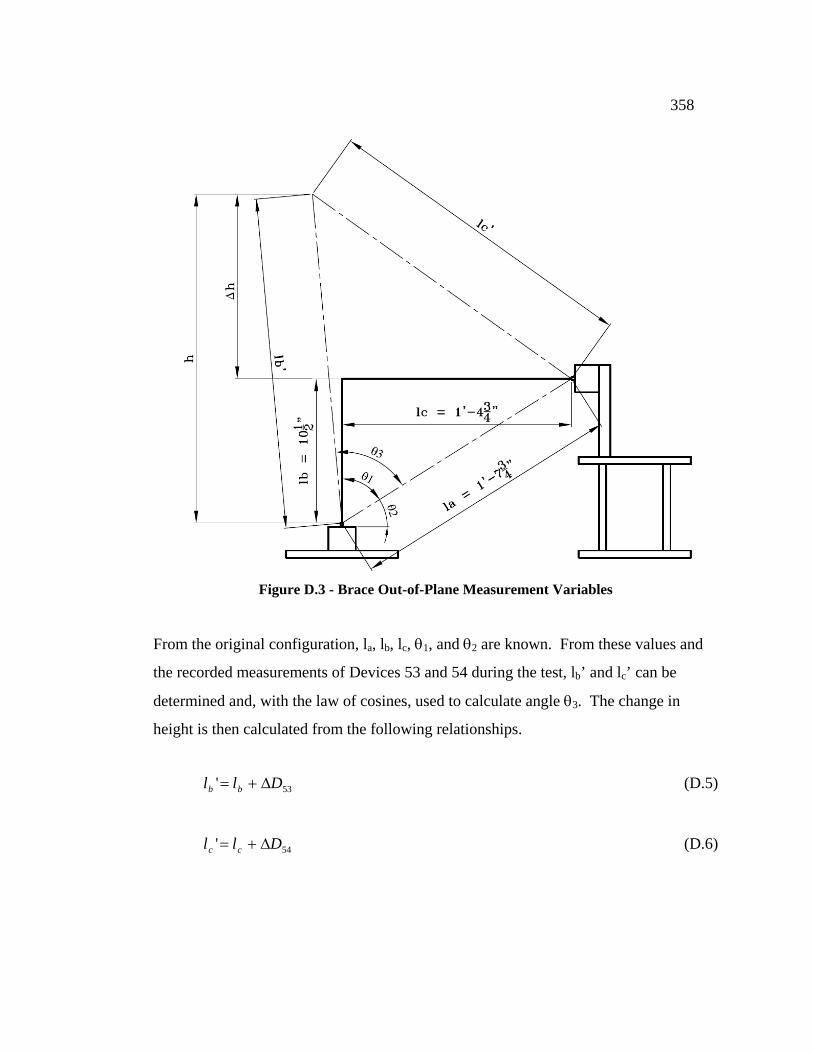
358
Figure D.3 - Brace Out-of-Plane Measurement Variables
From the original configuration, la, lb, lc, θ1, and θ2 are known. From these values and
the recorded measurements of Devices 53 and 54 during the test, lb’ and lc’ can be
determined and, with the law of cosines, used to calculate angle θ3. The change in
height is then calculated from the following relationships.
53' Dll bb Δ+= (D.5)
54' Dll cc Δ+= (D.6)

359
⎟⎟
⎠
⎞
⎜⎜
⎝
⎛ −+= −
'
2'2'21
3 2cos
ba
cba
lllll
θ (D.7)
( )23' cos θθ += blh (D.8)
blhh −=Δ (D.9)
D.2.3 Brace Elongation
A correction was made to the brace elongation measurement recorded by Device 40 as
shown in Figure D.4. Measurements recorded when the brace was straight were the
actual changes in length. When the brace buckled out of plane, the device and Tie-off
Point rotated with the brace ends as shown in Figure D.5. To correct for the rotations of
the measurement points, the buckled shape of the brace was assumed to be triangular
which allowed the use of the calculated out-of-plane displacement of the brace mid-
span. Figure D.6 illustrates the variables used in this correction.
Figure D.4 - Brace Elongation Measurement (Johnson 2005)

360
Figure D.5 - Brace Elongation Measurement Schematic (Johnson 2005)
Figure D.6 - Brace Elongation Measurement Variables (Johnson 2005)
The value Yb represents the distance the measurement was taken above the centerline of
the gusset plate. The value Xb is found using Yb, the measured out-of-plane
displacement of the brace at mid-span, and the original length of the brace as illustrated
in equation D.10. Brace shortening was then obtained using equation D.11.
361
⎥⎥⎥⎥
⎦
⎤
⎢⎢⎢⎢
⎣
⎡Δ
=
2Brace
bb LhYX (D.10)
2Brace ol XΔ = − (D.11)
where hΔ is the value calculated from equation D.9, LBrace is the original measured end-
to-end length of the brace, and lo is the measured change in length of the brace.
D.2.3 Gusset Plate Elongation
Gusset plate elongation was calculated by the following. A string potentiometer was
used to measure the displacement between the SW and NE beam-column intersection.
From this value, the corrected brace elongation was subtracted to get the combined
change in lengths from each end of the brace to the center of each beam-column
intersection. This change in length was divided by the actual length to convert the value
to a strain.
D.2.4 Brace Yielding
Brace yielding was determined from two different measurements. The first measurment
was calculated using the four strain gauges on each wall of the brace. When the
average strain gauge reading was greater than or equal to 0.2%, brace yielding was said
to have occurred.
Brace yielding was also determined from the calculated elongation. When the brace
percent elongation was greater than the material yield percent elongation, yielding was
said to have occurred. This value was compared to that calculated using the local
strains in the brace (above). These two methods typically produced similar results.
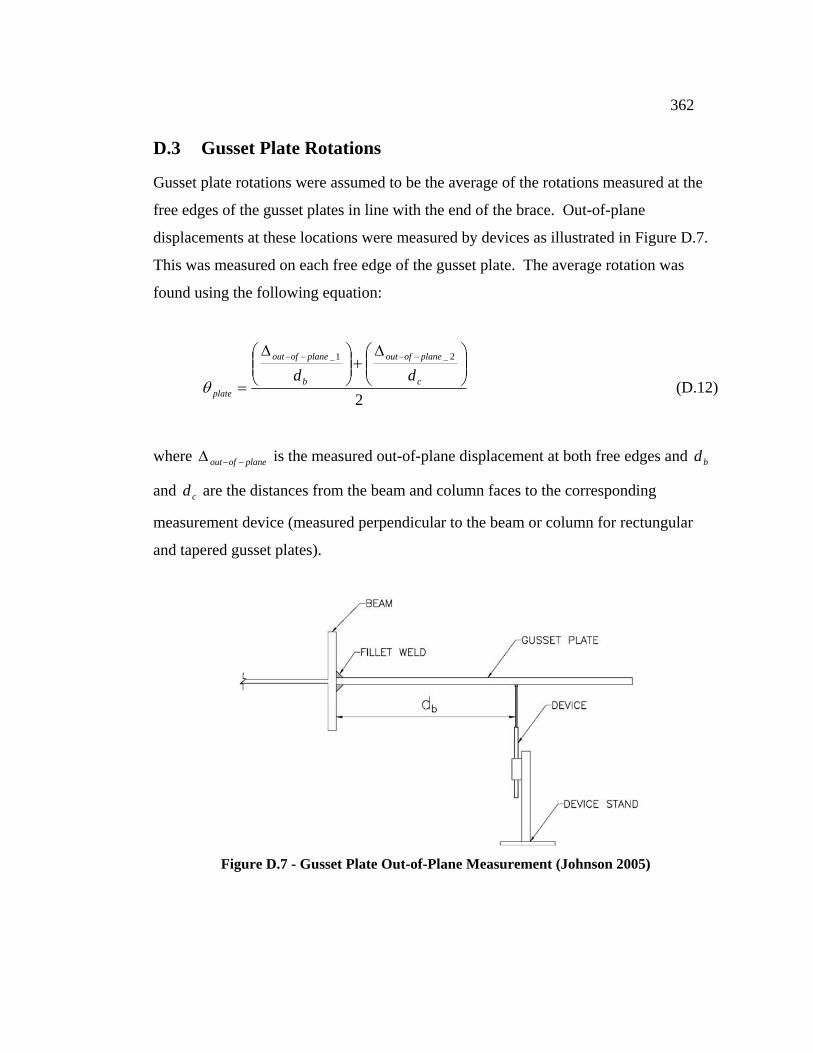
362
D.3 Gusset Plate Rotations
Gusset plate rotations were assumed to be the average of the rotations measured at the
free edges of the gusset plates in line with the end of the brace. Out-of-plane
displacements at these locations were measured by devices as illustrated in Figure D.7.
This was measured on each free edge of the gusset plate. The average rotation was
found using the following equation:
2
2_1_⎟⎟⎠
⎞⎜⎜⎝
⎛ Δ+⎟⎟
⎠
⎞⎜⎜⎝
⎛ Δ
=
−−−−
c
planeofout
b
planeofout
plate
ddθ (D.12)
where planeofout −−Δ is the measured out-of-plane displacement at both free edges and bd
and cd are the distances from the beam and column faces to the corresponding
measurement device (measured perpendicular to the beam or column for rectungular
and tapered gusset plates).
Figure D.7 - Gusset Plate Out-of-Plane Measurement (Johnson 2005)

363
D.4 Beam and Column Forces
The forces in the beams and columns were calculated using the opposing pairs of strain
gauges. Shears and moments were calculated using equations D.3 and D.4. Moments
were only calculated for the columns. They were not calculated for the beams since
only one pair of strain gauges were applied to the beams.
D.5 Shear Tab Rotations
Rotations of the shear connections were found using the difference of the devices
divided by the depth between them as shown in the following equation.
⎟⎟⎠
⎞⎜⎜⎝
⎛ −=
d
barotation d
κκθ (D.13)
Figure D.8 illustrates these variables.
Figure D.8 - Beam and Column Rotations (Johnson 2005)

364
D.6 Energy Dissipation Calculation
Energy dissipation was calculated using equation D.14. This equation calculates the
area enclosed by the hysteresis loops, when used for a complete loop. This area is
shown as the gray area in Figure D.9.
( )iiii
totalPP
E Δ−Δ⎟⎠
⎞⎜⎝
⎛ += +
+∑ 11
2 (D.14)
Figure D.9 - Energy Dissipation Calculation
The energy dissipated by the system was calculated using the applied lateral load and
the corrected story drift. The energy dissipated by the brace was calculated using the
brace elongation (Device 40, corrected) and the calculated brace force. The energy
dissipated by the brace and the connections was calculated using the frame elongation
(Device 41) and the calculated brace force. The energy dissipated by the connections
was calculated by subtracting the energy dissipated by the brace from the energy
dissipated by the brace and connections. The energy dissipated by the framing elements

365
was calculated by subtracting the energy dissipated by the brace and connection from
the energy dissipated by the whole system.
D.7 Drift Calculation
The overall drift of the frame, mΔ , was measured by potentiometer 36 as located in
Figure D.10. Bolt slippage, sΔ , at the channel assembly connection was measured by
potentiometer 46 as located in Figure D.10 and removed from the drift measurement.
Uplift, EU and WU , at the two column bases was measured by potentiometers 29 and
48 as located in Figure D.10. The rigid body rotation of the frame is illustrated in
Figure D.11.
Figure D.10 - Drift Correction Potentiometer Locations (Johnson 2005)
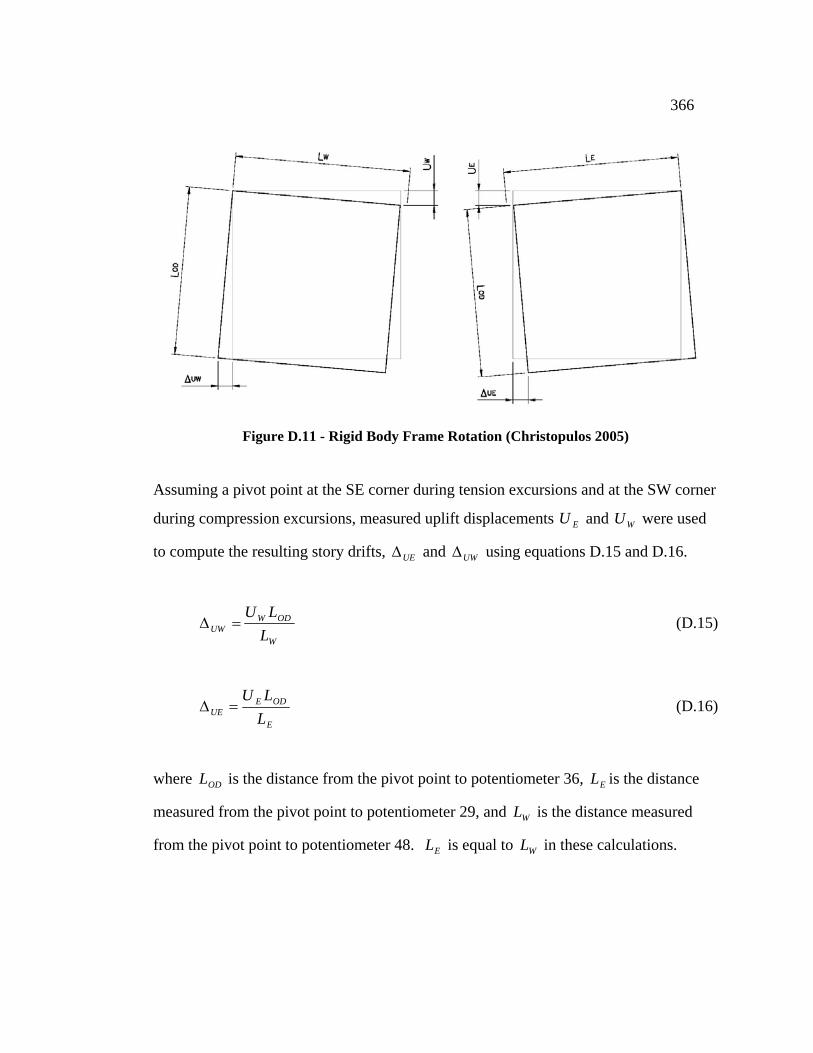
366
Figure D.11 - Rigid Body Frame Rotation (Christopulos 2005)
Assuming a pivot point at the SE corner during tension excursions and at the SW corner
during compression excursions, measured uplift displacements EU and WU were used
to compute the resulting story drifts, UEΔ and UWΔ using equations D.15 and D.16.
W
ODWUW L
LU=Δ (D.15)
E
ODEUE L
LU=Δ (D.16)
where ODL is the distance from the pivot point to potentiometer 36, EL is the distance
measured from the pivot point to potentiometer 29, and WL is the distance measured
from the pivot point to potentiometer 48. EL is equal to WL in these calculations.
367
The drifts resulting from lateral and rotational rigid body movements were removed
from the recorded story drift using equation D.17 to calculate the actual story drift,
ADΔ .
SUWUEMAD Δ−Δ−Δ+Δ=Δ (D.1)