Three Screeners: Internet week - three screening panel session

GuruFocus Manual of Stocks
20 Most Popular Gurus' Stocks
April 2016
“I think I could make you 50% a year on $1 million. No, I know I could.
I guarantee that.”
“You have to turn over a lot of rocks to find those little anomalies. You
have to find the companies that are off the map – way off the map.”
“I started at page one (of Moody’s manuals) and went through every
company that traded, from A to Z.”
—Warren Buffett
www.gurufocus.com

GuruFocus Manual of Stocks
About GuruFocus
GuruFocus is the premier website for value investing research. We follow the stock picks and portfolio changes of the world's best investors in order to
gain market insight and ideas. We also developed some of the best value screeners and research tools: All-In-One Screener, Buffett-Munger Screener and
Undervalued Predictable Companies along with 10-Year Financials, Historical Valuations and Interactive Charts. These screening and research tools cover
the stock markets in the U.S. as well as in Canada, Europe, Asia, Australia, etc. GuruFocus also regularly publishes financial news, articles about value
investing ideas and strategies as well as newsletters. To learn more about GuruFocus and to try a free 7-day Premium Membership trial, check out
www.gurufocus.com!
Overview of Coverage
Covers more than 78,000 stocks from 71 countries.
Glossary
DCF (FCF Based)
This is the intrinsic value calculated from the Discounted Cash Flow model with default parameters. In a discounted cash flow
model, the future cash flow is estimated based on a cash flow growth rate and a discount rate. The cash flow of the future is
discounted to its current value at the discount rate. All of the discounted future cash flow is added together to get the current
intrinsic value of the company.
GuruFocus DCF calculator is a two-stage model. The first stage is called the growth stage; the second is called the terminal stage.
The default values are defined as: 1. Discount Rate: d=12%; 2. Growth Rate in the growth stage: g1=20%. Growth Rate in the
growth stage = average free cash flow growth rate in the past 10 years or 20%, whichever is less => Average Free Cash Flow
Growth Rate in the past 10 years was 20%, which is NO less than 20% => Growth Rate: 20%. 3. Terminal Growth Rate: g2=4%. 4.
Years of Growth Stage: y1=10. 5. Years of Terminal Growth: y2=10.
DCE (Earnings
Based)
The calculation method is the same as the Discounted Cash Flow model except earnings are used in the calculation instead of free
cash flow. This is the default method of calculation with GuruFocus DCF calculator.
Financial Strength
GuruFocus Financial Strength Rank measures how strong a company’s financial situation is. It is ranked based on interest
coverage (current year), debt to revenue ratio and Altman Z-score. A company that ranks high in financial strength is likely to
withstand any business slowdowns and recessions.
Graham Number
Graham Number is a figure that measures a stock's fundamental value by taking into account the company's earnings per share
and book value per share. It is calculated as the square root of 22.5*Tangible Book*Earnings per Share. The Graham Number is the
upper bound of the price range that a defensive investor should pay for the stock. According to the theory, any stock price below
the Graham Number is considered undervalued and thus worth investing in. The Graham Number is a combination of asset
valuation and earnings power valuation.
Med. P/S
This valuation method assumes that the stock valuation will revert to its historical mean in terms of Price/Sales Ratio. The reason
we use P/S Ratio instead of P/E Ratio or P/B Ratio is because Price/Sales Ratio is independent of profit margin and can be applied
to a broader range of situations. Median P/S Value is calculated as trailing 12 month (TTM) revenue per share times 10-year
median P/S ratio.
NCAVIn calculating the Net Current Asset Value (NCAV), Benjamin Graham uses a company's current assets (such as cash, marketable
securities and inventories) minus its total liabilities (including preferred stock and long-term debt).
Peter Lynch Value
Peter Lynch Fair Value applies to growing companies. The ideal range for the growth rate is between 10 - 20% a year. Peter Lynch
thinks that the fair P/E value for a growth company equals its growth rate, that is PEG = 1. The earnings here are trailing 12 month
(TTM) earnings. The growth rate we use is the average growth rate for earnings per share over the past five years. If Five-Year
Earnings Growth Rate is greater than 25% a year, we use 25. If Five-Year Earnings Growth Rate is smaller than 5% a year, we do
not calculate Peter Lynch Fair Value.
Profitability Rank
GuruFocus Profitability Rank ranks how profitable a company is and how likely it is that the company’s business will stay that way.
It is based on these factors: operating margin, Piotroski F-Score, the trend of the operating margin (five-year average), consistency
of profitability and Predictability Rank. The company with an uptrend in profit margin has a higher rank.
Warning
Signs/Good Signs
We conducted a thorough checkup using a checklist of 32 items that cover the areas of financial strength, profitability, growth and
valuation of each company. These warning signs do not necessarily mean you should not invest in the stock. But you should be
aware of them before you invest.
Yield on Cost (5y)
(Dividends)
Yield on Cost assumes that you buy the stock today and hold it for five years. If the company raises its dividend at the same rate
as it did over the past five years, this calculates the dividends investors receive annually in five years relative to the stock price
today. Therefore: Yield-on-Cost=Dividend Yield*(1+Dividend Growth Rate)^5.
GuruFocus.com is not operated by a broker, a dealer, or a registered investment adviser. Under no circumstances does any information posted on GuruFocus.com represent a recommendation to buy or sell a security. The
information on this site, and in its related newsletters, is not intended to be, nor does it constitute, investment advice or recommendations. The gurus may buy and sell securities before and after any particular article and report and
information herein is published, with respect to the securities discussed in any article and report posted herein. In no event shall GuruFocus.com be liable to any member, guest or third party for any damages of any kind arising out
of the use of any content or other material published or available on GuruFocus.com, or relating to the use of, or inability to use, GuruFocus.com or any content, including, without limitation, any investment losses, lost profits, lost
opportunity, special, incidental, indirect, consequential or punitive damages. Past performance is a poor indicator of future performance. The information on this site, and in its related newsletters, is not intended to be, nor does it
constitute, investment advice or recommendations. The information on this site is in no way guaranteed for completeness, accuracy or in any other way. The gurus listed in this website are not affiliated with GuruFocus.com, LLC.
Stock quotes provided by InterActive Data. Fundamental company data provided by Morningstar, updated daily.

As of 04-18-2016 * All financial numbers are in millions except for per share data
GuruFocus Manual of Stocks www.gurufocus.com/stock/NAS:AAPL A
Apple Inc (NAS:AAPL)
$ 107.48
Computer Hardware - Consumer Electronics
Market Cap: $ 595,932 Mil
Apple Inc designs, manufactures, & markets mobile communication & media
devices, personal computers, & portable digital music players, & sells a
variety of related software, services, accessories, networking solutions, &
third-party digital content.
Ratios
CurrentIndustry
Median
Historical
Median
P/E (ttm) 11.41 16.75 16.06
Forward P/E 10.76 13.97 N/A
P/B 4.64 1.44 5.29
P/S 2.62 0.88 3.49
P/FCF 9.8 12.80 13.68
Shiller P/E 26.05 25.89 58.24
PEG 0.36 1.49 0.3
Valuation Analysis
% of Price
NCAV -20.92 -19
Tangible Book 21.49 20
Graham Number 67.49 63
Price 107.48
Median P/S 142.84 133
Peter Lynch Value 235.5 219
DCE (Earnings Based) 268.17 250
DCF (FCF Based) 312.24 291
Dividend & Ownership
Dividend Yield(ttm) % 1.91
Dividend Yield(forward) % 1.89
Payout 0.22
Dividend Growth(5y) % N/A
Yield on Cost(5y) % 1.91
Continuous Div. since 2012
Insider Ownership % 0.18
Institution Ownership % 58.08
Short % of Float 1
Financial Strength
Score: 6 /10 CurrentIndustry
Median
Historical
Median
Cash to Debt 0.61 1.44 14.70
Equity to Asset 0.44 0.57 0.62
Interest Coverage 81.04 24.21 No Debt
F-Score 7 5.00 6
Profitability
Score: 9 /10 CurrentIndustry
Median
Historical
Median
Operating Margin (%) 30.28 3.57 28.43
Net-Margin (%) 22.87 2.95 21.55
ROE (%) 42.94 5.77 32.13
ROA (%) 19.47 3.00 19.51
ROC (Joel Greenblatt)
(%)345.43 10.58 326.89
Growth
10 Yr 5 Yr 1 Yr
Revenue Growth (%) 35 28.7 23.60
EBITDA Growth (%) 49.9 32.2 29.70
EBIT Growth (%) 48.7 28.4 26.00
EPS without NRI
Growth (%)47.1 27.9 27.00
Free Cash Flow Growth
(%)46.8 31.5 10.10
Book Value Growth (%) 36.5 21.4 9.30
Quarterly
Dec14 Mar15 Jun15 Sep15 Dec15
Revenue 74599 58010 49605 51501 75872
Net Income 18024 13569 10677 11124 18361
EPS 3 2 2 2 3
Revenue (YoY) % 30 27 33 22 2
Net Income (YoY) % 38 33 38 31 2
EPS (YoY) % 48 40 45 38 7
Guru Trades
Guru Date ActionImpact
%
Cur.
Shares
Manning & Napier
Advisors, Inc03/31/16 Sell -2.42 0
Murray Stahl 03/31/16 Add 0.01 5,994
Ken Fisher 03/31/16 Add 0.01 11,315,252
Zeke Ashton 12/31/15 Buy 11.7 38,500
David Einhorn 12/31/15 Reduce -9.04 6,284,774
Chase Coleman 12/31/15 Buy 8.97 10,600,000
Warning Signs
SEVERE Asset Growth: faster than revenue growth
Good Signs
GOOD Piotroski F-Score: High
GOOD Per Share Revenue: Consistent growth
Insider Trades
Insider Position Date TradesCur.
Shares
Schiller Philip WSenior Vice
Pre04/04/16 -26284 49575
Williams Jeffrey E COO 04/04/16 -26284 3079
Schiller Philip WSenior Vice
Pre03/30/16 -268644 49575
Williams Jeffrey E COO 03/22/16 -268644 3079
Maestri LucaSenior Vice
Pre03/15/16 -18241 421
13.12 28.55 28.3 30.23 46.5 60.32 100.3 81.44 119 133 112.1 Annual Price High
7.24 11.9 11.5 11.17 27.44 45.05 57.86 55.79 71.4 103.12 93.42 Low
Gain(%) SP500(%)
1W 1.10 1.6
1M 5.04 1.7
3M 13.63 9.1
6M -0.87 0.5
YTD 4.85 1.9
2006 2007 2008 2009 2010 2011 2012 2013 2014 2015 Current Stock Performance
65855 133850 100706 166788 259934 354324 626546 428718 591016 615336 595932 Market Cap
6143 6225 6315 6349 6473 6557 6617 6522 6123 5793 5545 Sh. Outstanding-diluted(Mil)
33.9 39 16.8 20.4 18.7 13.8 15.1 12 15.7 12 11.4 Year End P/E
6.6 9.2 4.5 5.3 5.4 4.6 5.3 3.5 5.3 5.2 4.6 P/B
3.5 5.5 2.7 3.9 4 3.3 4 2.6 3.4 2.8 2.6 P/S
20.8 25.6 9 11.5 12.1 9.1 10.2 7.1 9.7 7.6 7.3 EV/EBITDA
Trend 2007 2008 2009 2010 2011 2012 2013 2014 2015 TTM Per share data
3.9 5.1 6.8 10.1 16.5 23.7 26.2 29.9 40.3 41 Revenue Per Share
0.6 1 1.3 2.2 4 6.3 5.7 6.5 9.2 9.4 EPS
0.7 1.3 1.4 2.5 4.6 6.3 6.8 8.2 12 11 Free Cashflow Per Share
-- -- -- -- -- 0.4 1.6 1.8 2 2 Dividends Per Share
2.3 3.5 5 7.3 11.1 17.2 18.7 17.5 19.8 20.7 Tang. Book Per Share
13.8 20.7 23.6 35.2 57.6 82.5 90.7 103.2 139.8 134.9 Median P/S Value
5.4 8.7 12 18.8 31.4 49.4 48.9 50.4 64.1 64.1 Graham Number
Trend 2007 2008 2009 2010 2011 2012 2013 2014 2015 TTM Income Statement
24006 32479 42905 65225 108249 156508 170910 182795 233715 234988 Revenue
34 34.3 40.1 39.4 40.5 43.9 37.6 38.6 40.1 40.1 Gross Margin %
4409 6275 11740 18385 33790 55241 48999 52503 71230 71155 Operating Income
18.4 19.3 27.4 28.2 31.2 35.3 28.7 28.7 30.5 30 Operating Margin %
3496 4834 8235 14013 25922 41733 37037 39510 53394 53731 Net Income
14.6 14.9 19.2 21.5 24 26.7 21.7 21.6 22.9 22.7 Net Margin %
28.5 26.3 30.5 35.3 41.7 42.8 30.6 33.6 46.3 43.1 ROE %
16.4 15.7 19.7 22.8 27.1 28.5 19.3 18 20.5 19.4 ROA %
Trend 2007 2008 2009 2010 2011 2012 2013 2014 2015 Dec15 Balance Sheet
9352 11875 5263 11261 9815 10746 14259 13844 21120 16904 Cash & Equivalents
25347 36171 47501 75183 116371 176064 207000 231839 290479 279527 Total Assets
-- -- -- -- -- -- 16960 28987 53463 48540 Long-term Debt
10815 13874 15861 27392 39756 57854 83451 120292 171124 153951 Total Liabilities
5368 -- -- -- -- -- 19764 23313 27416 26843 Common Equity
Trend 2007 2008 2009 2010 2011 2012 2013 2014 2015 TTM Cashflow Statement
5470 9596 10159 18595 37529 50856 53666 59713 81266 75007 Cashflow from Operations
-3249 -8189 -17434 -13854 -40419 -48227 -33774 -22579 -56274 -55559 Cashflow from Investing
-3 -124 -- -- -- -- -22860 -45000 -35253 -37086 Repurchase of Stock
362 359 475 912 831 665 -22330 -44270 -34710 -36622 Net Issuance of Debt
739 1116 663 1257 1444 -1698 -16379 -37549 -17716 -22237 Cashflow from Financing
-986 -1199 -1213 -2121 -7452 -9402 -9076 -9813 -11488 -12229 Capital Expenditure
4484 8397 8946 16474 30077 41454 44590 49900 69778 62778 Free Cash Flow
Competitor
Ticker CompanyFinancial
StrengthProfitability Market Cap($M) P/E P/S
Operating
Margin(%)ROA(%) ROE(%)
NAS:AAPL Apple Inc 6 9 595,932 11.41 2.62 30.28 19.47 42.94
XKRX:005930 Samsung Electronics Co Ltd 8 8 143,372 11.77 0.84 13.16 7.93 8.93
TSE:6758 Sony Corp 7 6 34,253 35.26 0.43 3.52 0.79 5.13
TSE:6752 Panasonic Corp 6 3 21,422 10.51 0.41 5.65 6.18 19.02
SZSE:000333 Midea Group Co Ltd 9 6 20,449 10.39 0.94 10.70 9.61 28.18
133
62.88
7.24
451M
225.3M
GuruFocus.com is not operated by a broker, a dealer, or a registered investment adviser. Under no circumstances does any information posted on GuruFocus.com represent a recommendation to buy or sell a security. The
information on this site, and in its related newsletters, is not intended to be, nor does it constitute, investment advice or recommendations. The gurus may buy and sell securities before and after any particular article and report and
information herein is published, with respect to the securities discussed in any article and report posted herein. In no event shall GuruFocus.com be liable to any member, guest or third party for any damages of any kind arising out
of the use of any content or other material published or available on GuruFocus.com, or relating to the use of, or inability to use, GuruFocus.com or any content, including, without limitation, any investment losses, lost profits, lost
opportunity, special, incidental, indirect, consequential or punitive damages. Past performance is a poor indicator of future performance. The information on this site, and in its related newsletters, is not intended to be, nor does it
constitute, investment advice or recommendations. The information on this site is in no way guaranteed for completeness, accuracy or in any other way. The gurus listed in this website are not affiliated with GuruFocus.com, LLC.
Stock quotes provided by InterActive Data. Fundamental company data provided by Morningstar, updated daily.

As of 04-18-2016 * All financial numbers are in millions except for per share data
GuruFocus Manual of Stocks www.gurufocus.com/stock/NYSE:AGN A
Allergan PLC (NYSE:AGN)
$ 219.91
Drug Manufacturers - Drug Manufacturers - Specialty & Generic
Market Cap: $ 86,796 Mil
Allergan PLC is a specialty pharmaceutical company. The Company is
engaged in developing, manufacturing and distributing generic, brand and
biosimilar products.
Ratios
CurrentIndustry
Median
Historical
Median
P/E (ttm) 24.82 28.34 27.45
Forward P/E 12.06 15.48 N/A
P/B 1.22 2.93 1.75
P/S 4.29 2.82 1.84
P/FCF 20.82 29.84 14.66
Shiller P/E 821.81 48.60 48.39
PEG N/A 1.88 9.54
Valuation Analysis
% of Price
NCAV -154.04 -70
Tangible Book -108.55 -49
Median P/S 94 43
Graham Number 131.96 60
Price 219.91
Dividend & Ownership
Dividend Yield(ttm) % N/A
Dividend Yield(forward) % N/A
Payout N/A
Dividend Growth(5y) % N/A
Yield on Cost(5y) % 0.09
Continuous Div. since 2014
Insider Ownership % 0.52
Institution Ownership % 88.79
Short % of Float 1.53
Financial Strength
Score: 6 /10 CurrentIndustry
Median
Historical
Median
Cash to Debt 0.03 3.34 0.42
Equity to Asset 0.56 0.63 0.59
Interest Coverage 0.00 24.52 6.67
F-Score 6 5.00 6
Profitability
Score: 6 /10 CurrentIndustry
Median
Historical
Median
Operating Margin (%) -12.96 8.73 6.95
Net-Margin (%) 21.42 6.28 5.41
ROE (%) 5.65 7.27 6.44
ROA (%) 3.21 3.90 3.54
ROC (Joel Greenblatt)
(%)-47.76 14.32 20.42
Growth
10 Yr 5 Yr 1 Yr
Revenue Growth (%) 8.3 1 3.10
EBITDA Growth (%) N/A -8.2 51.80
EBIT Growth (%) N/A N/A 0.00
EPS without NRI Growth
(%)N/A N/A 0.00
Free Cash Flow Growth
(%)14.3 25.1 10.10
Book Value Growth (%) 23.4 50.5 70.50
Quarterly
Dec14 Mar15 Jun15 Sep15 Dec15
Revenue 2416 4234 5755 4089 4198
Net Income -733 -512 -243 5301 -631
EPS -3 -2 -1 13 -2
Revenue (YoY) % -173 59 116 90 74
Net Income (YoY) % 394 -631 -599 -608 -14
EPS (YoY) % 224 -436 -386 -436 -36
Guru Trades
Guru Date ActionImpact
%
Cur.
Shares
Ken Fisher 03/31/16 Reduce 0 3,225
Daniel Loeb 12/31/15 Add 5.49 5,400,000
Paul Singer 12/31/15 Add 5.19 2,020,500
Eric Mindich 12/31/15 Buy 4.66 948,569
Steve Mandel 12/31/15 Sell -2.99 0
John Paulson 12/31/15 Reduce -2.4 5,532,600
David Einhorn 12/31/15 Buy 2.35 410,000
Warning Signs
SEVERE Sloan Ratio: Poor quality of earnings
SEVERE Per Share Revenue: Declined
SEVERE Long-Term Debt: Keep issuing new debt
Good Signs
GOOD Price: Close to 2-year low
Insider Trades
Insider Position Date TradesCur.
Shares
Basgoz Nesli Director 12/07/15 -2300 4062
Bisaro PaulExec
Chairman08/24/15 1000 421755
Saunders Brent LCEO and
Preside08/21/15 1000 132862
Basgoz Nesli Director 06/09/15 -2200 4286
34.76 33.69 31.14 40.12 51.95 72.1 90.85 168 270.61 339.5 312.5 Annual Price High
21.42 25.28 20.76 23.74 37.69 50.59 55.89 83.1 167.93 252.1 216.39 Low
Gain(%) SP500(%)
1W -7.98 1.6
1M -23.27 1.7
3M -26.45 9.1
6M -20.77 0.5
YTD -30.51 1.9
2006 2007 2008 2009 2010 2011 2012 2013 2014 2015 Current Stock Performance
2667 2813 2779 4888 6498 7675 10982 29266 68445 123281 86796 Market Cap
102 117 118 116 124 127 128 142 220 368 395 Sh. Outstanding-diluted(Mil)
-- 21.6 12.8 20.3 34.5 29.2 114.1 -- -- 35.3 24.8 Year End P/E
1.6 1.5 1.3 1.6 2 2.2 2.9 3.1 2.4 1.7 1.2 P/B
1.4 1.3 1.2 1.7 1.8 1.7 1.9 7.8 5.2 6.1 4.3 P/S
-21.9 6.7 5.6 10.5 11.7 8.5 18.1 56.6 87.9 49.3 38.6 EV/EBITDA
Trend 2007 2008 2009 2010 2011 2012 2013 2014 2015 TTM Per share data
21.3 21.5 24 28.7 36.2 46.1 18.3 30.7 41 51.1 Revenue Per Share
1.3 2.1 2 1.5 2.1 0.8 -5.3 -7.4 10 8.9 EPS
3 2.7 2.6 4.1 3.8 4 6.4 9 10.7 10.6 Free Cashflow Per Share
-- -- -- -- -- -- -- -- -- -- Dividends Per Share
3.6 6.5 -1.6 1 1.9 -37.6 -39.6 -32.6 -108.5 -126.8 Tang. Book Per Share
39.3 39.6 43.7 52.9 66.7 85.3 39.4 91.2 94 91.6 Median P/S Value
9.8 17.2 -- 5.7 9.4 -- 54.2 89.6 143.6 160.7 Graham Number
Trend 2007 2008 2009 2010 2011 2012 2013 2014 2015 TTM Income Statement
2496.7 2535.5 2793 3566.9 4584.4 5914.9 2602.5 6738.9 15071 18276 Revenue
39.7 40.7 42.8 44 44 42.6 36.8 48.8 68.1 66.4 Gross Margin %
255.7 358.2 383.9 305.4 523.4 315.7 -369.2 -2443.9 -3014.5 -2368.6 Operating Income
10.2 14.1 13.8 8.6 11.4 5.3 -14.2 -36.3 -20 -14 Operating Margin %
141 238.4 222 184.4 260.9 97.3 -750.4 -1630.5 3915.2 3915.2 Net Income
5.7 9.4 8 5.2 5.7 1.6 -28.8 -24.2 26 24.6 Net Margin %
8 12.1 8.7 5.9 7.6 2.6 -11.2 -8.6 7 4.6 ROE %
3.9 6.7 4.6 3.2 4.2 0.9 -4.1 -4.3 4.2 2.6 ROA %
Trend 2007 2008 2009 2010 2011 2012 2013 2014 2015 Dec15 Balance Sheet
204.6 507.6 201.4 282.8 209.3 319 329 250 1096 1698.2 Cash & Equivalents
3472 3677.9 5903.5 5686.6 6698.3 14115 22726 52758 135841 139132 Total Assets
899.4 824.7 1150.2 1016.1 848.5 6257.1 8517.4 14838 40293 41240 Long-term Debt
1622.6 1569.3 2880.4 2404.9 3134.7 10281 13194 24427 59249 64747 Total Liabilities
-- 0.4 0.4 0.4 0.4 0.4 -- -- -- -- Common Equity
Trend 2007 2008 2009 2010 2011 2012 2013 2014 2015 TTM Cashflow Statement
427.2 416.6 376.8 571 632 665.8 1213.5 2243 4530 4530 Cashflow from Operations
-64.3 -93.4 -1036.1 -74.1 -719 -5749 -275.3 -5370.6 -37121 -37121 Cashflow from Investing
-1.8 -0.9 -3.6 -6.3 -14.2 -16.1 -170 -130.1 -118 -118 Repurchase of Stock
14.4 7.5 29.8 48.4 40.7 -16.1 -170 -130.1 3953.1 3953.1 Net Issuance of Debt
-312.5 -20.2 353.1 -411.3 16.4 5189.6 -867.3 3017.5 33443 33443 Cashflow from Financing
-75.9 -100.5 -71.9 -67.5 -145.4 -146.5 -307.9 -274.7 -609.6 -609.6 Capital Expenditure
351.3 316.1 304.9 503.5 486.6 519.3 905.6 1968.3 3920.4 3920.4 Free Cash Flow
Competitor
Ticker CompanyFinancial
StrengthProfitability Market Cap($M) P/E P/S
Operating
Margin(%)ROA(%) ROE(%)
NYSE:AGN Allergan PLC 6 6 86,796 24.82 4.29 -12.96 3.21 5.65
NYSE:TEVA Teva Pharmaceutical Industries Ltd 7 7 49,912 30.22 2.41 9.88 3.22 6.47
TSE:4502 Takeda Pharmaceutical Co Ltd 6 6 39,477 0.00 2.34 -8.78 -2.50 -5.07
BOM:524715 Sun Pharmaceuticals Industries Ltd 6 7 30,077 51.34 7.18 19.49 14.81 25.68
NYSE:ZTS Zoetis Inc 7 7 24,147 71.44 5.10 21.32 4.95 27.96
339.5
159.37
20.76
12M
5.9M
GuruFocus.com is not operated by a broker, a dealer, or a registered investment adviser. Under no circumstances does any information posted on GuruFocus.com represent a recommendation to buy or sell a security. The
information on this site, and in its related newsletters, is not intended to be, nor does it constitute, investment advice or recommendations. The gurus may buy and sell securities before and after any particular article and report and
information herein is published, with respect to the securities discussed in any article and report posted herein. In no event shall GuruFocus.com be liable to any member, guest or third party for any damages of any kind arising out
of the use of any content or other material published or available on GuruFocus.com, or relating to the use of, or inability to use, GuruFocus.com or any content, including, without limitation, any investment losses, lost profits, lost
opportunity, special, incidental, indirect, consequential or punitive damages. Past performance is a poor indicator of future performance. The information on this site, and in its related newsletters, is not intended to be, nor does it
constitute, investment advice or recommendations. The information on this site is in no way guaranteed for completeness, accuracy or in any other way. The gurus listed in this website are not affiliated with GuruFocus.com, LLC.
Stock quotes provided by InterActive Data. Fundamental company data provided by Morningstar, updated daily.

As of 04-18-2016 * All financial numbers are in millions except for per share data
GuruFocus Manual of Stocks www.gurufocus.com/stock/NYSE:AIG A
American International Group Inc (NYSE:AIG)
$ 55.28
Insurance - Insurance - Diversified
Market Cap: $ 63,541 Mil
American International Group Inc is a holding company. The Company,
through its subsidiaries, provides insurance and related services in the
United States and abroad.
Ratios
CurrentIndustry
Median
Historical
Median
P/E (ttm) 38.94 13.59 10.78
Forward P/E 9.51 10.18 N/A
P/B 0.73 1.14 0.73
P/S 1.27 1.05 1.03
P/FCF N/A 8.00 4.92
Shiller P/E N/A 13.49 16.78
PEG N/A 0.87 0.56
Valuation Analysis
% of Price
NCAV -324.09 -586
Median P/S 44.71 81
Graham Number 48.98 89
Price 55.28
Tangible Book 75.1 136
Dividend & Ownership
Dividend Yield(ttm) % 1.84
Dividend Yield(forward) % 2.33
Payout 0.49
Dividend Growth(5y) % N/A
Yield on Cost(5y) % 1.84
Continuous Div. since 2013
Insider Ownership % 1.44
Institution Ownership % 89.11
Short % of Float 1.16
Financial Strength
Score: 6 /10 CurrentIndustry
Median
Historical
Median
Cash to Debt 0.06 93.84 0.02
Equity to Asset 0.18 0.24 0.10
Interest Coverage 2.56 36.84 2.56
F-Score 5 4.00 4
Profitability
Score: 4 /10 CurrentIndustry
Median
Historical
Median
Operating Margin (%) 5.63 8.90 6.88
Net-Margin (%) 3.76 6.56 7.84
ROE (%) 2.16 9.15 4.87
ROA (%) 0.43 1.87 0.82
ROC (Joel Greenblatt)
(%)0.00 53.23 0.00
Growth
10 Yr 5 Yr 1 Yr
Revenue Growth (%) -29.5 -29.2 -1.80
EBITDA Growth (%) N/A -35.7 -41.30
EBIT Growth (%) N/A N/A -68.00
EPS without NRI Growth
(%)N/A -28.4 -72.70
Free Cash Flow Growth
(%)N/A N/A 0.00
Book Value Growth (%) -18.8 -0.1 -3.30
Quarterly
Dec14 Mar15 Jun15 Sep15 Dec15
Revenue 15410 15975 15699 12822 13831
Net Income 655 2468 1800 -231 -1841
EPS 0 2 1 -0 -2
Revenue (YoY) % -12 -1 -3 -23 -10
Net Income (YoY) % -67 53 -41 -111 -381
EPS (YoY) % -65 63 -37 -112 -424
Guru Trades
Guru Date ActionImpact
%
Cur.
Shares
Steven Romick 03/31/16 Add 0.81 9,381,080
Murray Stahl 03/31/16 Reduce -0.01 37,789
Ken Fisher 03/31/16 Sell -0.01 0
Richard Perry 12/31/15 Reduce -8.85 5,766,852
Carl Icahn 12/31/15 Add 8.6 42,244,071
Jana Partners 12/31/15 Buy 3.72 4,253,840
Leon Cooperman 12/31/15 Add 0.99 4,096,526
John Paulson 12/31/15 Reduce -0.91 11,603,200
Bruce Berkowitz 12/31/15 Reduce -0.77 271,560
Andreas Halvorsen 12/31/15 Sell -0.61 0
Warning Signs
SEVERE Per Share Revenue: Declined
Good Signs
GOOD Dividend yield: Close to 5-year high
GOOD P/B Ratio: Close to 1-year low
Insider Trades
Insider Position Date Trades Cur. Shares
Fisher Peter R. Director 05/05/15 4280 9000
1219.87 1218.37 993.86 42.08 49.74 51.25 37.21 52.3 56.51 64.54 61.97 Annual Price High
967.72 859.99 22.62 5.86 18.56 20.07 23.2 34.84 46.88 48.87 50.2 Low
Gain(%) SP500(%)
1W 3.37 1.6
1M 3.64 1.7
3M -1.46 9.1
6M -6.15 0.5
YTD -10.81 1.9
2006 2007 2008 2009 2010 2011 2012 2013 2014 2015 Current Stock Performance
156831 123542 3538 3392 6780 44006 52114 74740 77066 73987 63541 Market Cap
131 130 132 135 137 1799 1687 1481 1448 1334 1149 Sh. Outstanding-diluted(Mil)
11.3 20.9 -- -- 4.2 2.2 23.8 8.3 10.8 43.7 38.9 Year End P/E
1.5 1.3 0.3 84.8 0.5 0.4 0.5 0.7 0.7 0.8 0.7 P/B
1.4 1.2 0.5 0.1 0.1 0.6 0.9 1.1 1.3 1.4 1.3 P/S
13.1 16.6 -2.6 16.6 4.5 10.8 5.7 5.7 5.7 10 8.9 EV/EBITDA
Trend 2007 2008 2009 2010 2011 2012 2013 2014 2015 TTM Per share data
847.3 52.4 556.8 567.3 36.2 42.2 46.5 44.5 43.7 43.4 Revenue Per Share
47.8 -756.9 -90.5 11.6 11 2 6.1 5.2 1.7 1.4 EPS
227.3 -10.5 134.8 -- -- -- -- -- -- -- Free Cashflow Per Share
14.6 12.4 -- -- -- -- 0.2 0.5 0.8 0.8 Dividends Per Share
683 42.8 -45.6 94.9 53.5 66.4 68.6 77.7 75.1 78.6 Tang. Book Per Share
870 60.1 573.8 587 38.2 42.3 47.9 45.5 44.7 45.6 Median P/S Value
856.4 -- 309.9 177.5 107.8 55.2 96.9 95.7 52.8 81.4 Graham Number
Trend 2007 2008 2009 2010 2011 2012 2013 2014 2015 TTM Income Statement
110064 6896 75352 77526 65105 71214 68874 64406 58327 58327 Revenue
-- -- -- -- -- -- -- -- -- -- Gross Margin %
8943 -106528 -14307 17936 -901 2891 9368 10501 3281 3281 Operating Income
8.1 -1544.8 -19 23.1 -1.4 4.1 13.6 16.3 5.6 4.5 Operating Margin %
6200 -99289 -10949 7786 20622 3438 9085 7529 2196 2196 Net Income
5.6 -1439.8 -14.5 10 31.7 4.8 13.2 11.7 3.8 3 Net Margin %
6.3 -134.3 -20 2 21.2 3.5 9.2 7.3 2.2 1.8 ROE %
0.6 -10.4 -1.3 1 3.3 0.6 1.7 1.4 0.4 0.4 ROA %
Trend 2007 2008 2009 2010 2011 2012 2013 2014 2015 Dec15 Balance Sheet
2284 8642 4400 1558 1474 1151 2241 1758 1629 1739.5 Cash & Equivalents
1048k 860418 847585 683443 553054 548633 541329 515581 496943 507404 Total Assets
162935 192590 136733 106461 75253 48500 41693 31217 29350 30607 Long-term Debt
952560 807708 777761 598124 451516 450631 440859 408683 407285 407181 Total Liabilities
6878 -- -- 368 4766 4766 4766 4766 4766 4766 Common Equity
Trend 2007 2008 2009 2010 2011 2012 2013 2014 2015 TTM Cashflow Statement
35171 -122 18584 16910 -81 3676 5865 5007 2877 2877 Cashflow from Operations
-67834 47176 5778 -10225 36448 16612 7099 14284 8462 8462 Cashflow from Investing
-6016 -1000 -- -- -70 -13000 -597 -4902 -10691 -10691 Repurchase of Stock
-5810 6343 5344 2199 25277 -13000 -597 -4902 -10691 -10691 Net Issuance of Debt
33307 -40734 -28997 -9261 -36926 -20564 -11758 -19788 -11429 -11429 Cashflow from Financing
-5642 -1258 -341 -- -- -- -- -- -- -- Capital Expenditure
29529 -1380 18243 -- -- -- -- -- -- -- Free Cash Flow
Competitor
Ticker CompanyFinancial
StrengthProfitability Market Cap($M) P/E P/S
Operating
Margin(%)ROA(%) ROE(%)
NYSE:BRK.B Berkshire Hathaway Inc 4 8 354,116 14.78 1.69 16.58 4.47 9.78
XTER:ALV Allianz SE 6 6 76,157 10.18 0.61 9.26 0.79 10.53
NYSE:AIG American International Group Inc 6 4 63,541 38.94 1.27 5.63 0.43 2.16
XPAR:CS AXA SA 5 4 61,011 9.93 0.46 6.60 0.64 8.40
1219.87
607.01
5.86
66M
33.2M
GuruFocus.com is not operated by a broker, a dealer, or a registered investment adviser. Under no circumstances does any information posted on GuruFocus.com represent a recommendation to buy or sell a security. The
information on this site, and in its related newsletters, is not intended to be, nor does it constitute, investment advice or recommendations. The gurus may buy and sell securities before and after any particular article and report and
information herein is published, with respect to the securities discussed in any article and report posted herein. In no event shall GuruFocus.com be liable to any member, guest or third party for any damages of any kind arising out
of the use of any content or other material published or available on GuruFocus.com, or relating to the use of, or inability to use, GuruFocus.com or any content, including, without limitation, any investment losses, lost profits, lost
opportunity, special, incidental, indirect, consequential or punitive damages. Past performance is a poor indicator of future performance. The information on this site, and in its related newsletters, is not intended to be, nor does it
constitute, investment advice or recommendations. The information on this site is in no way guaranteed for completeness, accuracy or in any other way. The gurus listed in this website are not affiliated with GuruFocus.com, LLC.
Stock quotes provided by InterActive Data. Fundamental company data provided by Morningstar, updated daily.

As of 04-18-2016 * All financial numbers are in millions except for per share data
GuruFocus Manual of Stocks www.gurufocus.com/stock/NYSE:AXP A
American Express Co (NYSE:AXP)
$ 62.59
Credit Services
Market Cap: $ 60,340 Mil
American Express Co is a payments, network and travel company, which
offers credit payment card products and travel-related services to consumers
and businesses.
Ratios
CurrentIndustry
Median
Historical
Median
P/E (ttm) 12.44 14.29 16.1
Forward P/E 11.09 10.15 N/A
P/B 2.93 1.06 3.63
P/S 1.91 3.05 2.41
P/FCF 6.53 8.12 8.2
Shiller P/E 16.1 13.36 18.35
PEG 1.16 0.62 1.78
Valuation Analysis
% of Price
NCAV -85.37 -136
Tangible Book 21.33 34
Graham Number 49.19 79
Peter Lynch Value 56.35 90
Price 62.59
DCE (Earnings Based) 67.03 107
Median P/S 78.24 125
DCF (FCF Based) 102.39 164
Dividend & Ownership
Dividend Yield(ttm) % 1.87
Dividend Yield(forward) % 1.87
Payout 0.22
Dividend Growth(5y) % 11.1
Yield on Cost(5y) % 3.17
Continuous Div. since 2011
Insider Ownership % 0.53
Institution Ownership % 86.92
Short % of Float 2.51
Financial Strength
Score: 4 /10 CurrentIndustry
Median
Historical
Median
Cash to Debt 0.43 N/A 0.19
Equity to Asset 0.13 0.47 0.09
Interest Coverage 4.89 4.20 2.68
F-Score 5 4.00 5
Profitability
Score: 8 /10 CurrentIndustry
Median
Historical
Median
Operating Margin (%) 24.19 20.23 21.19
Net-Margin (%) 15.73 15.28 14.82
ROE (%) 23.84 6.80 27.09
ROA (%) 3.28 2.28 3.02
ROC (Joel Greenblatt)
(%)0.00 13.47 0.00
Growth
10 Yr 5 Yr 1 Yr
Revenue Growth (%) 5.8 7.7 0.40
EBITDA Growth (%) 10 10.6 -6.20
EBIT Growth (%) 10.2 11.1 -7.70
EPS without NRI
Growth (%)8.4 9.6 -9.40
Free Cash Flow Growth
(%)3.7 8.7 3.10
Book Value Growth (%) 10.7 9 5.60
Quarterly
Dec14 Mar15 Jun15 Sep15 Dec15
Revenue 9081 7950 8284 8193 8391
Net Income 1447 1525 1473 1266 899
EPS 1 1 1 1 1
Revenue (YoY) % 8 -3 -4 -1 -8
Net Income (YoY) % 11 6 -4 -14 -38
EPS (YoY) % 15 11 -1 -11 -36
Guru Trades
Guru Date ActionImpact
%
Cur.
Shares
Steven Romick 03/31/16 Add 1.57 5,057,409
T Rowe Price Equity
Income Fund03/31/16 Add 0.15 4,553,600
Murray Stahl 03/31/16 Buy 0.02 10,628
Ken Fisher 03/31/16 Add 0.01 11,829,092
Jeff Ubben 12/31/15 Sell -4.87 0
Sarah Ketterer 12/31/15 Buy 1.52 858,848
Warning Signs
MEDIUM Per Share Revenue: Growth slow down
Good Signs
GOOD Operating margin: Expansion
Insider Trades
Insider Position Date TradesCur.
Shares
Williams Ronald A Director 01/26/16 18040 59125
Gupta AshwiniPres-
Risk/Info11/20/15 -103084 120091
Buckminster Douglas
E.
Pres, Global
Co11/11/15 -46345 50444
Squeri Stephen JVice
Chairman07/30/15 -219474 183743
Squeri Stephen JGroup
Pres., Gl05/27/15 -431913 173437
61.9 65.55 52.02 41.83 48.05 53.59 61.05 90.73 95.84 93.04 69.55 Annual Price High
50.62 50.84 17.23 10.26 36.79 42.36 47.17 57.48 80.24 67.87 51.11 Low
Gain(%) SP500(%)
1W 4.44 1.6
1M 5.40 1.7
3M -0.76 9.1
6M -18.27 0.5
YTD -9.82 1.9
2006 2007 2008 2009 2010 2011 2012 2013 2014 2015 Current Stock Performance
72743 60239 21516 48300 51375 54906 63515 96537 95180 67394 60340 Market Cap
1238 1196 1156 1171 1195 1184 1141 1089 1051 1003 964 Sh. Outstanding-diluted(Mil)
20.3 15.5 8.1 32.2 12.8 11.3 15 18.6 16.8 13.8 12.4 Year End P/E
6.9 5.5 1.8 3.4 3.2 2.9 3.4 5 4.6 3.3 2.9 P/B
3 2.3 0.8 2.4 1.9 1.9 2.1 3 2.9 2.1 1.9 P/S
21.3 19.4 20.7 -78.8 15.2 11.9 13.9 15.4 13.4 10.9 10.1 EV/EBITDA
Trend 2007 2008 2009 2010 2011 2012 2013 2014 2015 TTM Per share data
23 24.5 20.9 23.1 25.3 27.7 30.2 32.5 32.7 32.5 Revenue Per Share
3.4 2.3 1.5 3.4 4.1 3.9 4.9 5.6 5.1 5 EPS
6.4 5.9 4.8 6.6 7.2 5.3 6.9 9.3 9.6 9.6 Free Cashflow Per Share
0.6 0.7 0.7 0.7 0.7 0.8 0.7 1.2 1.1 1.1 Dividends Per Share
8 10.2 12.1 13.6 16.1 17.1 18.3 20.2 21.3 21.6 Tang. Book Per Share
55.6 58.8 40.2 55.5 60.6 66.1 72.3 77.9 78.2 78.4 Median P/S Value
25 23.8 20.5 32 38.6 38.7 44.8 50.3 49.2 51.7 Graham Number
Trend 2007 2008 2009 2010 2011 2012 2013 2014 2015 TTM Income Statement
27559 28365 24523 27582 29962 31555 32870 34188 32818 32818 Revenue
-- -- -- -- -- -- -- -- -- -- Gross Margin %
5694 3581 2841 5964 6956 6451 7888 8991 7938 7938 Operating Income
20.7 12.6 11.6 21.6 23.2 20.4 24 26.3 24.2 24.3 Operating Margin %
4012 2699 2130 4057 4935 4482 5359 5885 5163 5163 Net Income
14.6 9.5 8.7 14.7 16.5 14.2 16.3 17.2 15.7 15.8 Net Margin %
37.3 23.5 13.7 26.5 28.2 23.5 27.7 29.1 24.5 23.6 ROE %
2.9 2 1.7 3 3.3 2.9 3.5 3.8 3.2 3.3 ROA %
Trend 2007 2008 2009 2010 2011 2012 2013 2014 2015 Dec15 Balance Sheet
7107 8128 16599 16709 24893 22250 18988 22288 22762 21836 Cash & Equivalents
149743 126074 125145 147042 153337 153140 153375 159103 161184 156809 Total Assets
55285 60041 52338 66416 59570 58973 55330 57955 48061 51042 Long-term Debt
138714 114233 110739 130812 134543 134254 133879 138430 140511 135378 Total Liabilities
-- -- 237 238 -- 221 213 205 194 199 Common Equity
Trend 2007 2008 2009 2010 2011 2012 2013 2014 2015 TTM Cashflow Statement
8491 7773 6337 8729 9768 7082 8547 10990 10972 10972 Cashflow from Operations
-17101 7561 -6752 -1229 -491 -6545 -7269 -7967 -8193 -8193 Cashflow from Investing
-2720 -218 -- -590 -2300 -3952 -3943 -4389 -4480 -4480 Repurchase of Stock
-2720 -42 614 73 -1706 -3509 -3222 -4027 -4287 -4287 Net Issuance of Debt
15466 -10440 -4647 -7878 -677 -3268 -3891 11 -2029 -2029 Cashflow from Financing
-883 -977 -772 -878 -1189 -1053 -1006 -1195 -1341 -1341 Capital Expenditure
7608 6796 5565 7851 8579 6029 7541 9795 9631 9631 Free Cash Flow
Competitor
Ticker CompanyFinancial
StrengthProfitability Market Cap($M) P/E P/S
Operating
Margin(%)ROA(%) ROE(%)
NYSE:MA MasterCard Inc 9 8 108,486 29.16 11.53 52.53 25.01 59.89
NYSE:AXP American Express Co 4 8 60,340 12.44 1.91 24.19 3.28 23.84
NAS:PYPL PayPal Holdings Inc 5 4 48,467 52.86 7.23 15.80 4.79 10.85
NYSE:COF Capital One Financial Corp 6 7 37,792 10.14 1.68 25.12 1.29 8.33
NYSE:SYF Synchrony Financial 5 6 24,289 11.00 2.33 33.93 2.85 19.13
95.84
42.79
10.26
34M
17M
GuruFocus.com is not operated by a broker, a dealer, or a registered investment adviser. Under no circumstances does any information posted on GuruFocus.com represent a recommendation to buy or sell a security. The
information on this site, and in its related newsletters, is not intended to be, nor does it constitute, investment advice or recommendations. The gurus may buy and sell securities before and after any particular article and report and
information herein is published, with respect to the securities discussed in any article and report posted herein. In no event shall GuruFocus.com be liable to any member, guest or third party for any damages of any kind arising out
of the use of any content or other material published or available on GuruFocus.com, or relating to the use of, or inability to use, GuruFocus.com or any content, including, without limitation, any investment losses, lost profits, lost
opportunity, special, incidental, indirect, consequential or punitive damages. Past performance is a poor indicator of future performance. The information on this site, and in its related newsletters, is not intended to be, nor does it
constitute, investment advice or recommendations. The information on this site is in no way guaranteed for completeness, accuracy or in any other way. The gurus listed in this website are not affiliated with GuruFocus.com, LLC.
Stock quotes provided by InterActive Data. Fundamental company data provided by Morningstar, updated daily.

As of 04-18-2016 * All financial numbers are in millions except for per share data
GuruFocus Manual of Stocks www.gurufocus.com/stock/NYSE:BAC B
Bank of America Corporation (NYSE:BAC)
$ 14.17
Banks - Banks - Global
Market Cap: $ 146,314 Mil
Bank of America Corporation is a bank holding and a financial holding
company. Through its subsidiaries, it provides banking and non-banking
financial services and products throughout the United States and in selected
international markets.
Ratios
CurrentIndustry
Median
Historical
Median
P/E (ttm) 11.16 12.64 15.14
Forward P/E 8.44 11.33 N/A
P/B 0.62 1.03 0.73
P/S 1.94 2.92 1.92
P/FCF 7.91 10.50 6.09
Shiller P/E 12.46 16.90 6.84
PEG 0.75 1.04 0.84
Valuation Analysis
% of Price
NCAV -166.47 -1175
Median P/S 14.01 99
Price 14.17
Tangible Book 15.73 111
Graham Number 21.04 148
Dividend & Ownership
Dividend Yield(ttm) % 1.41
Dividend Yield(forward) % 1.43
Payout 0.16
Dividend Growth(5y) % 17
Yield on Cost(5y) % 3.09
Continuous Div. since 2016
Insider Ownership % 0.15
Institution Ownership % 64.57
Short % of Float 0.75
Financial Strength
Score: 6 /10 CurrentIndustry
Median
Historical
Median
Cash to Debt 0.70 2.36 0.30
Equity to Asset 0.12 0.10 0.09
Interest Coverage 2.04 1.68 0.52
F-Score 6 4.00 4
Profitability
Score: 4 /10 CurrentIndustry
Median
Historical
Median
Operating Margin (%) 26.37 31.26 7.11
Net-Margin (%) 18.95 22.64 5.63
ROE (%) 5.45 8.47 1.59
ROA (%) 0.72 0.90 0.27
ROC (Joel Greenblatt)
(%)0.00 19.37 0.00
Growth
10 Yr 5 Yr 1 Yr
Revenue Growth (%) -7.4 -12.4 -3.60
EBITDA Growth (%) -24.1 15 60.50
EBIT Growth (%) N/A N/A 78.00
EPS without NRI
Growth (%)N/A N/A 95.30
Free Cash Flow Growth
(%)N/A N/A 0.00
Book Value Growth (%) -2.9 -0.8 6.60
Quarterly
Mar15 Jun15 Sep15 Dec15 Mar16
Revenue 20914 21956 20513 19667 19512
Net Income 3097 5134 4321 3336 2680
EPS 0 0 0 0 0
Revenue (YoY) % -7 1 -3 5 -7
Net Income (YoY) % -1222 124 -1963 9 -13
EPS (YoY) % -600 126 -975 8 -16
Guru Trades
Guru Date ActionImpact
%
Cur.
Shares
Steven Romick 03/31/16 Add 0.84 23,487,790
T Rowe Price Equity
Income Fund03/31/16 Reduce -0.14 21,648,300
Ken Fisher 03/31/16 Add 0 43,096,188
Murray Stahl 03/31/16 Add 0 42,857
Bruce Berkowitz 12/31/15 Reduce -10.6 3,908,303
Caxton Associates 12/31/15 Reduce -6.72 656,400
Louis Moore Bacon 12/31/15 Add 2.41 5,547,609
Richard Snow 12/31/15 Add 1.23 3,140,470
Warning Signs
SEVERE Per Share Revenue: Declined
Insider Trades
Insider Position Date TradesCur.
Shares
Nguyen Thong MPres, Ret.
Bnkg02/22/16 30000 40314
Bramble Frank P Director 02/16/16 75000 186680
Nguyen Thong MPres, Ret.
Bnkg07/21/15 -7520 278
54.9 54.05 45.03 18.59 19.48 15.25 11.61 15.88 18.13 18.45 16.83 Annual Price High
43.09 41.1 11.25 3.14 10.95 4.99 5.56 11.03 14.51 15.15 11.16 Low
Gain(%) SP500(%)
1W 8.70 1.6
1M 3.17 1.7
3M -2.84 9.1
6M -12.91 0.5
YTD -16.52 1.9
2006 2007 2008 2009 2010 2011 2012 2013 2014 2015 Current Stock Performance
238777 183286 70646 130273 134536 58580 125136 164914 188141 174700 146314 Market Cap
4599 4463 4596 7729 9790 10255 10841 11491 10585 11214 10326 Sh. Outstanding-diluted(Mil)
11.6 12.6 22.8 -- -- 556 45.7 17.3 49.8 12.9 11.2 Year End P/E
1.8 1.3 0.5 0.7 0.6 0.3 0.6 0.8 0.8 0.8 0.6 P/B
3.4 2.8 0.9 0.9 1.1 0.6 1.5 2 2.3 2.3 1.9 P/S
13.7 22 63.5 61.1 46.3 104.1 52.5 17.6 35.8 12 10.6 EV/EBITDA
Trend 2007 2008 2009 2010 2011 2012 2013 2014 2015 TTM Per share data
15 15.8 15.5 11.3 9.1 7.7 7.7 8 7.4 7.3 Revenue Per Share
3.3 0.5 -0.3 -0.4 0 0.3 0.9 0.4 1.3 1.3 EPS
2 0.4 16.5 8.3 6.2 -- 8 2.4 -- 1.8 Free Cashflow Per Share
2.4 2.2 0 0 0 0 0 0.1 0.2 0.2 Dividends Per Share
11.5 7.1 8.8 11.2 12 12.6 13.1 13.9 15.2 15.1 Tang. Book Per Share
28.7 30 31.4 23 17.5 14.6 15 15.1 14.1 14.3 Median P/S Value
29.2 9.5 -- -- 1.5 8.5 16.1 10.6 20.9 20 Graham Number
Trend 2007 2008 2009 2010 2011 2012 2013 2014 2015 TTM Income Statement
66833 72782 119643 110220 93454 83334 88942 84247 82507 81648 Revenue
-- -- -- -- -- -- -- -- -- -- Gross Margin %
20924 4428 4360 -1323 -230 3072 16172 6855 22154 21531 Operating Income
31.3 6.1 3.6 -1.2 -0.3 3.7 18.2 8.1 26.9 26.1 Operating Margin %
14982 4008 6276 -2238 1446 4188 11431 4833 15888 15471 Net Income
22.4 5.5 5.3 -2 1.6 5 12.9 5.7 19.3 18.8 Net Margin %
10.4 1.6 -1.1 -1.6 0 1.2 4.3 1.6 5.8 5.5 ROE %
0.9 0.2 0.3 -0.1 0.1 0.2 0.5 0.2 0.8 0.7 ROA %
Trend 2007 2008 2009 2010 2011 2012 2013 2014 2015 Mar16 Balance Sheet
54304 42427 145541 134860 146106 129446 142862 146099 167097 175255 Cash & Equivalents
1716k 1818k 2223k 2265k 2129k 2210k 2102k 2105k 2144k 2158k Total Assets
197508 268292 438521 448431 372265 275585 249674 243139 236764 237579 Long-term Debt
1569k 1641k 1992k 2037k 1899k 1973k 1870k 1861k 1888k 1901k Total Liabilities
-- 76766 128734 150905 156621 158142 155293 153458 151042 151574 Common Equity
Trend 2007 2008 2009 2010 2011 2012 2013 2014 2015 TTM Cashflow Statement
11036 4034 129731 82594 64490 -13858 92817 26739 27730 25481 Cashflow from Operations
-108480 -2930 157925 -30347 52429 -37177 25058 -4204 -54954 -54154 Cashflow from Investing
-3790 -- -- -- -- -- -3220 -1675 -2374 -2374 Repurchase of Stock
-2672 10127 13468 -- -- -- -3220 -1675 -2374 -2387 Net Issuance of Debt
103412 -10695 -199568 -65387 -104696 42416 -95442 -12201 48585 49509 Cashflow from Financing
-2143 -2098 -2240 -987 -1307 -- -521 -1160 -- 13 Capital Expenditure
8893 1936 127491 81607 63183 -- 92296 25579 -- 20023 Free Cash Flow
Competitor
Ticker CompanyFinancial
StrengthProfitability Market Cap($M) P/E P/S
Operating
Margin(%)ROA(%) ROE(%)
NYSE:BAC Bank of America Corporation 6 4 146,314 11.16 1.94 26.37 0.72 5.45
NYSE:C Citigroup Inc 6 6 132,990 8.39 1.79 32.51 0.95 7.47
LSE:HSBA HSBC Holdings PLC 5 5 124,903 10.74 1.82 27.21 0.53 6.38
54.9
25.88
3.14
517M
258.6M
GuruFocus.com is not operated by a broker, a dealer, or a registered investment adviser. Under no circumstances does any information posted on GuruFocus.com represent a recommendation to buy or sell a security. The
information on this site, and in its related newsletters, is not intended to be, nor does it constitute, investment advice or recommendations. The gurus may buy and sell securities before and after any particular article and report and
information herein is published, with respect to the securities discussed in any article and report posted herein. In no event shall GuruFocus.com be liable to any member, guest or third party for any damages of any kind arising out
of the use of any content or other material published or available on GuruFocus.com, or relating to the use of, or inability to use, GuruFocus.com or any content, including, without limitation, any investment losses, lost profits, lost
opportunity, special, incidental, indirect, consequential or punitive damages. Past performance is a poor indicator of future performance. The information on this site, and in its related newsletters, is not intended to be, nor does it
constitute, investment advice or recommendations. The information on this site is in no way guaranteed for completeness, accuracy or in any other way. The gurus listed in this website are not affiliated with GuruFocus.com, LLC.
Stock quotes provided by InterActive Data. Fundamental company data provided by Morningstar, updated daily.
As of 04-18-2016 * All financial numbers are in millions except for per share data
GuruFocus Manual of Stocks www.gurufocus.com/stock/NYSE:BRK.B B
Berkshire Hathaway Inc (NYSE:BRK.B)
$ 144.38
Insurance - Insurance - Diversified
Market Cap: $ 354,116 Mil
Berkshire Hathaway Inc is a conglomerate holding company owning
subsidiaries engaged in a number of business activities, including property
and casualty insurance and reinsurance, utilities and energy, finance,
manufacturing, service and retailing.
Ratios
CurrentIndustry
Median
Historical
Median
P/E (ttm) 14.78 13.59 16.14
Forward P/E 15.77 10.18 N/A
P/B 1.39 1.14 1.37
P/S 1.69 1.05 1.55
P/FCF 23.11 8.00 19.85
Shiller P/E 23.94 13.49 23.29
PEG 1.05 0.87 0.78
Valuation Analysis
% of Price
NCAV -84.61 -59
Tangible Book 74.9 52
DCF (FCF Based) 97.78 68
Graham Number 128.31 89
Median P/S 132.58 92
DCE (Earnings Based) 141.34 98
Peter Lynch Value 142.54 99
Price 144.38
Dividend & Ownership
Dividend Yield(ttm) % N/A
Dividend Yield(forward) % N/A
Payout N/A
Dividend Growth(5y) % N/A
Yield on Cost(5y) % N/A
Continuous Div. since N/A
Insider Ownership % 0.01
Institution Ownership % 37.24
Short % of Float 0.95
Financial Strength
Score: 4 /10 CurrentIndustry
Median
Historical
Median
Cash to Debt 0.85 93.84 1.33
Equity to Asset 0.46 0.24 0.44
Interest Coverage 9.94 36.84 7.80
F-Score 6 4.00 5
Profitability
Score: 8 /10 CurrentIndustry
Median
Historical
Median
Operating Margin (%) 16.58 8.90 13.84
Net-Margin (%) 11.42 6.56 9.87
ROE (%) 9.78 9.15 8.80
ROA (%) 4.47 1.87 3.90
ROC (Joel Greenblatt)
(%)0.00 53.23 0.00
Growth
10 Yr 5 Yr 1 Yr
Revenue Growth (%) 8.4 9.6 8.30
EBITDA Growth (%) 10.4 14 19.40
EBIT Growth (%) 11.9 15.7 24.40
EPS without NRI Growth
(%)9.7 16.5 21.20
Free Cash Flow Growth
(%)10.9 7.8 -8.40
Book Value Growth (%) 10.1 11.3 6.40
Quarterly
Dec14 Mar15 Jun15 Sep15 Dec15
Revenue 48259 48644 51368 58989 51820
Net Income 4155 5164 4013 9428 5478
EPS 2 2 2 4 2
Revenue (YoY) % 3 7 3 15 7
Net Income (YoY) % -17 10 -37 104 32
EPS (YoY) % -17 10 -37 104 32
Guru Trades
Guru Date ActionImpact
%
Cur.
Shares
Arnold Van Den Berg 03/31/16 Reduce -0.25 228,449
Murray Stahl 03/31/16 Reduce -0.08 213,911
Ken Fisher 03/31/16 Reduce 0 5,583,718
Bill Gates 12/31/15 Reduce -3.78 74,381,548
Mohnish Pabrai 12/31/15 Buy 3.03 87,006
Scott Black 12/31/15 Reduce -2.17 35,817
Zeke Ashton 12/31/15 Add 2.1 33,500
David Rolfe 12/31/15 Reduce -0.9 4,192,862
Arnold Van Den Berg 12/31/15 Reduce -0.45 238,934
Diamond Hill Capital 12/31/15 Buy 0.43 491,474
Lou Simpson 12/31/15 Add 0.33 2,768,922
Warning Signs
MEDIUM Price: Close to 10-year high
MEDIUM Long-Term Debt: Issuing new debt
Good Signs
GOOD Per Share Revenue: Consistent growth
GOOD Operating margin: Expansion
76 99.7 96.6 70.8 83.72 87.28 90.69 118.94 152.67 151.37 144.04 Annual Price High
57 69.58 52.4 46 64.94 66 76.29 89.7 108.78 127.74 124.13 Low
Gain(%) SP500(%)
1W 1.69 1.6
1M 2.17 1.7
3M 13.72 9.1
6M 7.21 0.5
YTD 8.64 1.9
2006 2007 2008 2009 2010 2011 2012 2013 2014 2015 Current Stock Performance
169699 219910 149387 152482 197204 188119 220052 290965 368186 323837 354116 Market Cap
2313 2319 2323 2327 2453 2475 2477 2465 2465 2465 2453 Sh. Outstanding-diluted(Mil)
15.4 16.6 29.9 19 15.1 18.4 15 15 18.6 13.5 14.8 Year End P/E
1.6 1.8 1.4 1.2 1.3 1.1 1.2 1.3 1.5 1.3 1.4 P/B
1.7 1.9 1.4 1.4 1.4 1.3 1.4 1.6 1.9 1.5 1.7 P/S
8.7 9.6 17.3 9.9 8.6 9.2 7.7 8.3 10 7.3 8 EV/EBITDA
Trend 2007 2008 2009 2010 2011 2012 2013 2014 2015 TTM Per share data
51 46.4 48.3 55.5 58.1 65.6 73.9 79 85.5 85.5 Revenue Per Share
5.7 2.1 3.5 5.3 4.1 6 7.9 8.1 9.8 9.8 EPS
3.1 2.2 4.7 4.9 5 4.5 6.7 6.8 6.3 6.3 Free Cashflow Per Share
-- -- -- -- -- -- -- -- -- -- Dividends Per Share
37.8 32.5 41.9 44 45.3 45.1 67.2 69.4 74.9 74.5 Tang. Book Per Share
79.1 71.9 74.9 86.2 90 101.7 114.5 122.4 132.6 128.2 Median P/S Value
69.7 39.6 57.1 72.3 65 78 109.3 112.2 128.3 120.2 Graham Number
Trend 2007 2008 2009 2010 2011 2012 2013 2014 2015 TTM Income Statement
118245 107786 112493 136185 143688 162463 182150 194673 210821 210821 Revenue
-- -- -- -- -- -- -- -- -- -- Gross Margin %
20161 7574 11552 19051 15314 22236 28796 28105 34946 34946 Operating Income
17.1 7 10.3 14 10.7 13.7 15.8 14.4 16.6 16.3 Operating Margin %
13213 4994 8055 12967 10254 14824 19476 19872 24083 24083 Net Income
11.2 4.6 7.2 9.5 7.1 9.1 10.7 10.2 11.4 11.2 Net Margin %
11.5 4.3 6.7 9 6.4 8.4 9.5 8.6 9.7 9.8 ROE %
5.1 1.9 2.9 3.9 2.7 3.6 4.3 3.9 4.5 4.5 ROA %
Trend 2007 2008 2009 2010 2011 2012 2013 2014 2015 Dec15 Balance Sheet
44329 25539 30558 38227 37299 46992 48186 63269 71730 67072 Cash & Equivalents
273160 267399 297119 372229 392647 427452 484931 525867 552257 542394 Total Assets
33826 36882 37909 58574 60384 62736 72224 79890 84289 84393 Long-term Debt
152427 158132 166017 214911 227797 239805 263041 285697 296707 294560 Total Liabilities
-- -- -- -- 8 8 8 8 8 8 Common Equity
Trend 2007 2008 2009 2010 2011 2012 2013 2014 2015 TTM Cashflow Statement
12550 11252 15846 17895 20476 20950 27704 32010 31491 31491 Cashflow from Operations
-13428 -32066 -11161 -18277 -19189 -10574 -27535 -19369 -26668 -26668 Cashflow from Investing
-- -- -- -- -- -- -- -- -- -- Repurchase of Stock
-- -- -- -- -- -- -- -- -- -- Net Issuance of Debt
1366 2286 233 8125 -2217 -806 961 2731 3803 3803 Cashflow from Financing
-5373 -6138 -4937 -5980 -8191 -9775 -11087 -15185 -16082 -16082 Capital Expenditure
7177 5114 10909 11915 12285 11175 16617 16825 15409 15409 Free Cash Flow
Competitor
Ticker CompanyFinancial
StrengthProfitability Market Cap($M) P/E P/S
Operating
Margin(%)ROA(%) ROE(%)
NYSE:BRK.B Berkshire Hathaway Inc 4 8 354,116 14.78 1.69 16.58 4.47 9.78
XTER:ALV Allianz SE 6 6 76,157 10.18 0.61 9.26 0.79 10.53
NYSE:AIG American International Group Inc 6 4 63,541 38.94 1.27 5.63 0.43 2.16
XPAR:CS AXA SA 5 4 61,011 9.93 0.46 6.60 0.64 8.40
152.67
53.34
46
28M
14.1M
GuruFocus.com is not operated by a broker, a dealer, or a registered investment adviser. Under no circumstances does any information posted on GuruFocus.com represent a recommendation to buy or sell a security. The
information on this site, and in its related newsletters, is not intended to be, nor does it constitute, investment advice or recommendations. The gurus may buy and sell securities before and after any particular article and report and
information herein is published, with respect to the securities discussed in any article and report posted herein. In no event shall GuruFocus.com be liable to any member, guest or third party for any damages of any kind arising out
of the use of any content or other material published or available on GuruFocus.com, or relating to the use of, or inability to use, GuruFocus.com or any content, including, without limitation, any investment losses, lost profits, lost
opportunity, special, incidental, indirect, consequential or punitive damages. Past performance is a poor indicator of future performance. The information on this site, and in its related newsletters, is not intended to be, nor does it
constitute, investment advice or recommendations. The information on this site is in no way guaranteed for completeness, accuracy or in any other way. The gurus listed in this website are not affiliated with GuruFocus.com, LLC.
Stock quotes provided by InterActive Data. Fundamental company data provided by Morningstar, updated daily.

As of 04-18-2016 * All financial numbers are in millions except for per share data
GuruFocus Manual of Stocks www.gurufocus.com/stock/NYSE:C C
Citigroup Inc (NYSE:C)
$ 45.11
Banks - Banks - Global
Market Cap: $ 132,990 Mil
Citigroup Inc is a financial services holding company. It provides financial
products and services, including consumer banking, credit cards, corporate
and investment banking, securities brokerage and wealth management.
Ratios
CurrentIndustry
Median
Historical
Median
P/E (ttm) 8.39 12.64 12.31
Forward P/E 8.2 11.33 N/A
P/B 0.65 1.03 0.77
P/S 1.79 2.92 1.86
P/FCF 3.73 10.50 3.71
Shiller P/E 29.29 16.90 4.51
PEG 0.74 1.04 3.49
Valuation Analysis
% of Price
NCAV -464.64 -1030
Price 45.11
Median P/S 47.06 104
Peter Lynch Value 57.62 128
Tangible Book 60.03 133
Graham Number 85.48 189
Dividend & Ownership
Dividend Yield(ttm) % 0.45
Dividend Yield(forward) % 0.45
Payout 0.03
Dividend Growth(5y) % N/A
Yield on Cost(5y) % 0.45
Continuous Div. since 2014
Insider Ownership % 2.08
Institution Ownership % 73.45
Short % of Float 1.04
Financial Strength
Score: 6 /10 CurrentIndustry
Median
Historical
Median
Cash to Debt 0.60 2.36 0.29
Equity to Asset 0.13 0.10 0.08
Interest Coverage 2.08 1.68 0.57
F-Score 7 4.00 4
Profitability
Score: 6 /10 CurrentIndustry
Median
Historical
Median
Operating Margin (%) 32.51 31.26 17.13
Net-Margin (%) 22.58 22.64 11.57
ROE (%) 7.47 8.47 5.24
ROA (%) 0.95 0.90 0.48
ROC (Joel Greenblatt)
(%)0.00 19.37 0.00
Growth
10 Yr 5 Yr 1 Yr
Revenue Growth (%) -21.1 -1.8 -0.40
EBITDA Growth (%) N/A 11.2 56.00
EBIT Growth (%) N/A 12 70.00
EPS without NRI
Growth (%)N/A 3.4 147.00
Free Cash Flow Growth
(%)N/A N/A -14.10
Book Value Growth (%) -13.2 4 5.20
Quarterly
Dec14 Mar15 Jun15 Sep15 Dec15
Revenue 17899 19736 19470 18692 18456
Net Income 344 4770 4846 4291 3335
EPS 0 2 2 1 1
Revenue (YoY) % -1 -2 0 -5 3
Net Income (YoY) % -86 21 2577 51 869
EPS (YoY) % -91 23 4933 53 1600
Guru Trades
Guru Date ActionImpact
%
Cur.
Shares
Steven Romick 03/31/16 Add 0.65 11,132,480
T Rowe Price Equity
Income Fund03/31/16 Add 0.06 5,349,900
Manning & Napier
Advisors, Inc03/31/16 Reduce 0 86,760
Ken Fisher 03/31/16 Reduce 0 12,019,747
Bruce Berkowitz 12/31/15 Sell -4.3 0
Louis Moore Bacon 12/31/15 Add 2.36 1,526,238
Warning Signs
SEVERE Per Share Revenue: Declined
Good Signs
GOOD Piotroski F-Score: High
GOOD Operating margin: Expansion
GOOD Dividend yield: Close to 5-year high
GOOD P/E Ratio: Close to 3-year low
Insider Trades
Insider Position Date TradesCur.
Shares
Callahan DonHead of
Operati02/11/16 5700 261342
Mills WilliamCEO, North
Amer02/11/16 1000 426638
Gerspach John C CFO 02/09/16 13000 295242
Corbat Michael CEO 01/22/16 25000 382546
Oneill Michael E Director 01/22/16 25000 142788
564.1 557 296.9 74.6 49.7 51.3 40.17 53.29 56.37 60.34 51.75 Annual Price High
450.5 292.9 37.7 10.2 31.5 23.11 24.82 39.56 45.68 46.95 34.98 Low
Gain(%) SP500(%)
1W 11.00 1.6
1M 5.47 1.7
3M 5.89 9.1
6M -15.01 0.5
YTD -13.10 1.9
2006 2007 2008 2009 2010 2011 2012 2013 2014 2015 Current Stock Performance
273598 161255 38057 94280 137446 76927 119822 157854 163624 152832 132990 Market Cap
499 500 577 1210 2968 2999 3016 3042 3037 3008 2948 Sh. Outstanding-diluted(Mil)
13 42.3 -- -- 13.3 7.3 16.6 12.3 24.6 9.6 8.4 Year End P/E
2.3 1.4 0.5 0.6 0.8 0.4 0.6 0.8 0.8 0.8 0.7 P/B
3.2 1.8 0.7 0.3 1.6 1 1.7 2.1 2.1 2.1 1.8 P/S
19 160.1 -8 -68.1 25.9 15.5 26.8 10.7 16.2 9.2 8.5 EV/EBITDA
Trend 2007 2008 2009 2010 2011 2012 2013 2014 2015 TTM Per share data
157.1 89.4 66.4 29.2 25.8 22.9 25.2 25.4 25.4 25.3 Revenue Per Share
7.2 -56.3 -8 3.5 3.6 2.4 4.3 2.2 5.4 5.4 EPS
-- 162.9 -47 11.2 20.5 -4.6 19.6 14.1 12.1 12.1 Free Cashflow Per Share
21.6 11.2 0.1 -- 0 0 0 0 0.2 0.2 Dividends Per Share
90.7 42.3 39.2 43 48.9 50.6 54.4 56.1 60 58.9 Tang. Book Per Share
297.6 168 209.4 54.4 48 42.9 46.9 47.3 47.1 46.9 Median P/S Value
109.8 -- -- 58.6 62.9 52.9 72.1 52.7 85.6 72.9 Graham Number
Trend 2007 2008 2009 2010 2011 2012 2013 2014 2015 TTM Income Statement
78495 51599 80285 86601 77331 69190 76724 77219 76354 76354 Revenue
-- -- -- -- -- -- -- -- -- -- Gross Margin %
776 -52355 -7799 13184 14722 7825 19802 14701 24826 24826 Operating Income
1 -101.5 -9.7 15.2 19 11.3 25.8 19 32.5 32.4 Operating Margin %
3617 -27684 -1606 10602 11067 7541 13659 7310 17242 17242 Net Income
4.6 -53.7 -2 12.2 14.3 10.9 17.8 9.5 22.6 22.5 Net Margin %
3.1 -23.1 -6.3 6.7 6.5 4 6.7 3.2 7.5 7.5 ROE %
0.2 -1.3 -0.1 0.6 0.6 0.4 0.7 0.4 1 0.9 ROA %
Trend 2007 2008 2009 2010 2011 2012 2013 2014 2015 Dec15 Balance Sheet
107572 199584 192886 190409 184485 138587 198890 160197 133097 150658 Cash & Equivalents
2187k 1938k 1857k 1914k 1874k 1865k 1880k 1842k 1731k 1800k Total Assets
427112 359593 364019 381183 323505 239463 221116 223080 201275 209294 Long-term Debt
2074k 1797k 1704k 1750k 1696k 1676k 1676k 1632k 1509k 1581k Total Liabilities
-- 57 286 29 29 30 31 31 31 31 Common Equity
Trend 2007 2008 2009 2010 2011 2012 2013 2014 2015 TTM Cashflow Statement
-71430 96520 -54610 35686 64795 -10362 63244 46343 39737 39737 Cashflow from Operations
-62377 -77611 37168 43337 -8772 30335 -91338 28582 14883 14883 Cashflow from Investing
397 -7 -3 -6 -1 -5 -837 -1232 -5452 -5452 Repurchase of Stock
397 6857 17511 -6 -1 -5 -837 -1232 -5452 -5452 Net Issuance of Debt
144494 -24537 13006 -77428 -56646 -12501 23094 -70270 -64773 -64773 Cashflow from Financing
-- -2541 -2264 -2363 -3448 -3604 -3490 -3386 -3198 -3198 Capital Expenditure
-- 93979 -56874 33323 61347 -13966 59754 42957 36539 36539 Free Cash Flow
Competitor
Ticker CompanyFinancial
StrengthProfitability Market Cap($M) P/E P/S
Operating
Margin(%)ROA(%) ROE(%)
NYSE:BAC Bank of America Corporation 6 4 146,314 11.16 1.94 26.37 0.72 5.45
NYSE:C Citigroup Inc 6 6 132,990 8.39 1.79 32.51 0.95 7.47
LSE:HSBA HSBC Holdings PLC 5 5 124,903 10.74 1.82 27.21 0.53 6.38
564.1
276.95
10.2
107M
53.4M
GuruFocus.com is not operated by a broker, a dealer, or a registered investment adviser. Under no circumstances does any information posted on GuruFocus.com represent a recommendation to buy or sell a security. The
information on this site, and in its related newsletters, is not intended to be, nor does it constitute, investment advice or recommendations. The gurus may buy and sell securities before and after any particular article and report and
information herein is published, with respect to the securities discussed in any article and report posted herein. In no event shall GuruFocus.com be liable to any member, guest or third party for any damages of any kind arising out
of the use of any content or other material published or available on GuruFocus.com, or relating to the use of, or inability to use, GuruFocus.com or any content, including, without limitation, any investment losses, lost profits, lost
opportunity, special, incidental, indirect, consequential or punitive damages. Past performance is a poor indicator of future performance. The information on this site, and in its related newsletters, is not intended to be, nor does it
constitute, investment advice or recommendations. The information on this site is in no way guaranteed for completeness, accuracy or in any other way. The gurus listed in this website are not affiliated with GuruFocus.com, LLC.
Stock quotes provided by InterActive Data. Fundamental company data provided by Morningstar, updated daily.

As of 04-18-2016 * All financial numbers are in millions except for per share data
GuruFocus Manual of Stocks www.gurufocus.com/stock/NAS:CSCO C
Cisco Systems Inc (NAS:CSCO)
$ 28.19
Communication Equipment
Market Cap: $ 141,855 Mil
Cisco Systems Inc is engaged in designing, manufacturing and selling of
Internet Protocol (IP) based networking products and services related to the
communications and information technology (IT) industry.
Ratios
CurrentIndustry
Median
Historical
Median
P/E (ttm) 13.95 21.89 16.66
Forward P/E 11.44 13.93 N/A
P/B 2.34 1.72 2.56
P/S 2.91 1.16 2.97
P/FCF 11.46 15.68 12.82
Shiller P/E 18.78 28.11 20.53
PEG 2.16 2.10 1.84
Valuation Analysis
% of Price
NCAV 2.48 9
Tangible Book 6.65 24
Peter Lynch Value 14.08 50
Graham Number 17.38 62
DCE (Earnings Based) 24.4 87
Price 28.19
Median P/S 28.73 102
DCF (FCF Based) 30.5 108
Dividend & Ownership
Dividend Yield(ttm) % 3.16
Dividend Yield(forward) % 3.73
Payout 0.42
Dividend Growth(5y) % N/A
Yield on Cost(5y) % 3.16
Continuous Div. since 2011
Insider Ownership % 0.18
Institution Ownership % 76.47
Short % of Float 1.02
Financial Strength
Score: 6 /10 CurrentIndustry
Median
Historical
Median
Cash to Debt 2.45 2.45 5002.16
Equity to Asset 0.54 0.58 0.64
Interest Coverage 20.00 27.56 19.12
F-Score 6 5.00 6
Profitability
Score: 8 /10 CurrentIndustry
Median
Historical
Median
Operating Margin (%) 24.56 2.94 22.40
Net-Margin (%) 20.84 2.28 18.84
ROE (%) 17.39 4.03 17.45
ROA (%) 9.41 2.09 10.01
ROC (Joel Greenblatt)
(%)393.31 9.44 265.61
Growth
10 Yr 5 Yr 1 Yr
Revenue Growth (%) 9.2 6.3 4.50
EBITDA Growth (%) 7.5 6.4 12.80
EBIT Growth (%) 6.3 6.8 21.20
EPS without NRI
Growth (%)6.9 6.8 21.70
Free Cash Flow Growth
(%)7.3 7.8 17.10
Book Value Growth (%) 13.1 8.6 6.60
Quarterly
Jan15 Apr15 Jul15 Oct15 Jan16
Revenue 11936 12137 12843 12682 11927
Net Income 2397 2437 2319 2430 3147
EPS 0 0 0 0 1
Revenue (YoY) % 7 5 4 4 -0
Net Income (YoY) % 68 12 3 33 31
EPS (YoY) % 70 12 5 37 35
Guru Trades
Guru Date ActionImpact
%
Cur.
Shares
Tweedy Browne Global
Value03/31/16 Add 1.55 5,214,000
Yacktman Focused
Fund03/31/16 Reduce -0.42 9,000,000
Steven Romick 03/31/16 Add 0.34 15,692,750
Yacktman Fund 03/31/16 Reduce -0.29 15,400,000
T Rowe Price Equity
Income Fund03/31/16 Reduce -0.11 8,758,900
Manning & Napier
Advisors, Inc03/31/16 Add 0.01 832,444
Warning Signs
SEVERE Gross margin: Declined
MEDIUM Price: Close to 5-year high
MEDIUM P/S Ratio: Close to 1-year high
Good Signs
GOOD Per Share Revenue: Consistent growth
Insider Trades
Insider Position Date TradesCur.
Shares
Patel PankajEVP, Chief
Deve03/24/16 -35814 703695
Dedicoat ChrisEVP,
Worldwide03/24/16 -31800 346253
Bhatt PratSVP, Corp
Contr03/22/16 -50000 110250
Bhatt PratSVP, Corp
Contr03/18/16 -21785 110250
Johnson Kristina M Director 03/18/16 -5000 23599
27.63 34.08 27.54 24.38 27.57 22.05 21.19 26.38 28.46 30.19 28.69 Annual Price High
17.12 25.3 14.47 13.62 19.07 13.73 15.12 19.65 21.35 24.62 22.51 Low
Gain(%) SP500(%)
1W 0.76 1.6
1M 1.81 1.7
3M 19.22 9.1
6M 0.78 0.5
YTD 4.47 1.9
2006 2007 2008 2009 2010 2011 2012 2013 2014 2015 Current Stock Performance
108335 176087 129587 127328 130461 86797 84503 137905 128850 144516 141855 Market Cap
6272 6265 6163 5857 5848 5563 5404 5380 5281 5146 5032 Sh. Outstanding-diluted(Mil)
20.1 24.6 16.9 21 17.4 13.7 10.7 13.8 16.9 16.4 14 Year End P/E
4.5 5.6 3.8 3.3 3 1.8 1.7 2.3 2.3 2.4 2.3 P/B
4 5.2 3.4 3.6 3.4 2.1 1.9 2.8 2.8 3 2.9 P/S
12.2 14.2 9 10.5 8.8 5.4 4 7.3 7.7 7.7 7 EV/EBITDA
Trend 2007 2008 2009 2010 2011 2012 2013 2014 2015 TTM Per share data
5.6 6.4 6.2 6.8 7.8 8.5 9 8.9 9.6 9.7 Revenue Per Share
1.2 1.3 1.1 1.3 1.2 1.5 1.9 1.5 1.8 2 EPS
1.4 1.8 1.5 1.6 1.6 1.9 2.2 2.1 2.2 2.5 Free Cashflow Per Share
-- -- -- -- 0.1 0.3 0.6 0.7 0.8 0.8 Dividends Per Share
2.8 3.4 4.2 4.3 5.1 6.1 6.3 5.7 6.5 6.5 Tang. Book Per Share
16.6 19 18.2 20.3 23 25.3 26.9 26.4 28.3 28.4 Median P/S Value
8.5 10 9.9 11.3 11.6 14.3 16.2 13.8 15.9 16.3 Graham Number
Trend 2007 2008 2009 2010 2011 2012 2013 2014 2015 TTM Income Statement
34922 39540 36117 40040 43218 46061 48607 47142 49161 49589 Revenue
64 64.1 63.9 64 61.4 61.2 60.6 58.9 60.4 61.6 Gross Margin %
8621 9442 7322 9164 7674 10065 11196 9345 10770 12179 Operating Income
24.7 23.9 20.3 22.9 17.8 21.9 23 19.8 21.9 24.6 Operating Margin %
7333 8052 6134 7767 6490 8041 9983 7853 8981 10333 Net Income
21 20.4 17 19.4 15 17.5 20.5 16.7 18.3 20.9 Net Margin %
26.5 24.5 16.8 18.7 14.2 16.3 18.1 13.6 15.4 17.4 ROE %
15.2 14.4 9.7 10.4 7.7 9 10.4 7.6 8.2 9.4 ROA %
Trend 2007 2008 2009 2010 2011 2012 2013 2014 2015 Jan16 Balance Sheet
3728 5191 5718 4581 7662 9799 7925 6726 6877 5704.8 Cash & Equivalents
53340 58734 68128 81130 87095 91759 101191 105070 113481 111027 Total Assets
6408 6393 10295 12188 16234 16297 12928 20337 21457 20307 Long-term Debt
21860 24381 29481 36863 39869 40473 42071 48416 53783 51185 Total Liabilities
-- -- -- 37793 38648 39271 42297 41884 43592 43556 Common Equity
Trend 2007 2008 2009 2010 2011 2012 2013 2014 2015 TTM Cashflow Statement
10104 12089 9897 10173 10079 11491 12894 12332 12552 13866 Cashflow from Operations
-8342 -4193 -9959 -11931 -2934 -3815 -11768 -6643 -10088 -8839 Cashflow from Investing
-7681 -10441 -3611 -7864 -6713 -4560 -2773 -9413 -4324 -4472 Repurchase of Stock
-2375 -7324 -2748 -4586 -4882 -3188 565 -7506 -2308 -2917 Net Issuance of Debt
-1331 -6433 589 621 -4064 -5539 -3000 -6888 -2313 -3510 Cashflow from Financing
-1251 -1268 -1005 -1008 -1174 -1126 -1160 -1275 -1227 -1253 Capital Expenditure
8853 10821 8892 9165 8905 10365 11734 11057 11325 12613 Free Cash Flow
Competitor
Ticker CompanyFinancial
StrengthProfitability Market Cap($M) P/E P/S
Operating
Margin(%)ROA(%) ROE(%)
NAS:CSCO Cisco Systems Inc 6 8 141,855 13.95 2.91 24.56 9.41 17.39
NAS:QCOM Qualcomm Inc 8 8 77,061 17.01 3.44 22.82 9.63 13.98
OSTO:ERIC B LM Ericsson Telephone Co 8 6 31,734 15.45 1.32 9.94 5.84 11.66
OHEL:NOKIA Nokia Oyj 8 5 24,729 8.65 1.65 13.15 11.72 26.67
NYSE:MSI Motorola Solutions Inc 8 6 13,196 24.10 2.76 17.44 6.71 49.01
34.08
10.23
13.62
103M
51.4M
GuruFocus.com is not operated by a broker, a dealer, or a registered investment adviser. Under no circumstances does any information posted on GuruFocus.com represent a recommendation to buy or sell a security. The
information on this site, and in its related newsletters, is not intended to be, nor does it constitute, investment advice or recommendations. The gurus may buy and sell securities before and after any particular article and report and
information herein is published, with respect to the securities discussed in any article and report posted herein. In no event shall GuruFocus.com be liable to any member, guest or third party for any damages of any kind arising out
of the use of any content or other material published or available on GuruFocus.com, or relating to the use of, or inability to use, GuruFocus.com or any content, including, without limitation, any investment losses, lost profits, lost
opportunity, special, incidental, indirect, consequential or punitive damages. Past performance is a poor indicator of future performance. The information on this site, and in its related newsletters, is not intended to be, nor does it
constitute, investment advice or recommendations. The information on this site is in no way guaranteed for completeness, accuracy or in any other way. The gurus listed in this website are not affiliated with GuruFocus.com, LLC.
Stock quotes provided by InterActive Data. Fundamental company data provided by Morningstar, updated daily.

As of 04-18-2016 * All financial numbers are in millions except for per share data
GuruFocus Manual of Stocks www.gurufocus.com/stock/NYSE:GE G
General Electric Co (NYSE:GE)
$ 31.06
Industrial Products - Diversified Industrials
Market Cap: $ 289,809 Mil
General Electric Co is a diversified company with products & services that
range from aircraft engines, power generation, oil & gas production
equipment, household appliances, medical imaging, business & consumer
financing and industrial products.
Ratios
CurrentIndustry
Median
Historical
Median
P/E (ttm) N/A 18.29 17.43
Forward P/E 18.08 15.95 N/A
P/B 2.97 1.50 1.98
P/S 2.64 0.95 1.86
P/FCF 25.25 15.92 11.98
Shiller P/E 22.52 25.20 14.65
PEG N/A 1.64 2.42
Valuation Analysis
% of Price
NCAV -26.26 -85
Tangible Book 1.71 6
Median P/S 21.83 70
Price 31.06
Dividend & Ownership
Dividend Yield(ttm) % 2.95
Dividend Yield(forward) % 2.96
Payout 5.41
Dividend Growth(5y) % 14.4
Yield on Cost(5y) % 5.78
Continuous Div. since 2016
Insider Ownership % 0.13
Institution Ownership % 61.35
Short % of Float 1.82
Financial Strength
Score: 6 /10 CurrentIndustry
Median
Historical
Median
Cash to Debt 0.52 1.09 0.30
Equity to Asset 0.20 0.53 0.15
Interest Coverage 3.88 16.71 2.34
F-Score 5 5.00 6
Profitability
Score: 5 /10 CurrentIndustry
Median
Historical
Median
Operating Margin (%) 13.55 5.57 20.09
Net-Margin (%) -5.13 3.95 9.63
ROE (%) -5.52 6.66 11.27
ROA (%) -1.04 3.38 1.95
ROC (Joel Greenblatt)
(%)7.97 11.67 9.95
Growth
10 Yr 5 Yr 1 Yr
Revenue Growth (%) -2.9 -4.6 -2.00
EBITDA Growth (%) -11.3 -19 -30.30
EBIT Growth (%) -10.1 -13.8 -21.00
EPS without NRI
Growth (%)-14.8 -26.9 -127.10
Free Cash Flow Growth
(%)-3.1 -8 -39.60
Book Value Growth (%) 1.1 0.6 -17.80
Quarterly
Dec14 Mar15 Jun15 Sep15 Dec15
Revenue 23381 29356 32754 31511 25747
Net Income 5152 -13573 -1360 2506 6301
EPS 0 -1 -0 0 1
Revenue (YoY) % 208 -12 2 -1 10
Net Income (YoY) % 61 -553 -138 -29 22
EPS (YoY) % 58 -550 -137 -29 29
Guru Trades
Guru Date ActionImpact
%
Cur.
Shares
Steven Romick 03/31/16 Reduce -0.46 9,238,990
T Rowe Price Equity
Income Fund03/31/16 Reduce -0.37 22,544,100
Murray Stahl 03/31/16 Add 0.01 83,399
Manning & Napier
Advisors, Inc03/31/16 Reduce -0.01 137,820
Ken Fisher 03/31/16 Reduce 0 31,153,343
John Burbank 12/31/15 Buy 2.6 4,965,525
Warning Signs
SEVERE Per Share Revenue: Declined
SEVERE Gross margin: Declined
SEVERE Operating margin: Declined
MEDIUM Payout ratio: Too high
MEDIUM Dividend yield: Close to 3-year low
Insider Trades
Insider Position Date TradesCur.
Shares
Bornstein Jeffrey SSenior Vice
Pre02/04/16 -168313 87156
Dimitrief AlexanderSenior Vice
Pre02/01/16 30612 113780
Dimitrief AlexanderSenior Vice
Pre01/25/16 65272 83168
Dsouza Francisco Director 04/30/15 36500 36500
Schapiro Mary L Director 04/30/15 7000 7100
38.49 42.12 38.43 17.07 19.5 21.52 23.12 28.03 28.03 31.28 31.93 Annual Price High
32.11 34.09 12.84 6.66 13.88 14.69 17.91 20.9 23.95 23.27 27.45 Low
Gain(%) SP500(%)
1W 0.78 1.6
1M 2.48 1.7
3M 9.72 9.1
6M 12.34 0.5
YTD 0.35 1.9
2006 2007 2008 2009 2010 2011 2012 2013 2014 2015 Current Stock Performance
382421 370240 161278 161332 194155 189363 218414 282006 254150 292165 289809 Market Cap
10394 10218 10098 10615 10678 10620 10564 10289 10123 10016 9331 Sh. Outstanding-diluted(Mil)
18.7 17.1 9.4 14.9 17.5 14.5 16.2 22.2 16.9 -- -- Year End P/E
3.4 3.2 1.5 1.4 1.6 1.6 1.8 2.2 2 3 3 P/B
2.5 2.2 0.9 1 1.3 1.3 1.5 2.6 2.1 2.7 2.6 P/S
14.9 13.5 10 13.3 13.1 10.8 12 25.4 21.6 28.6 28.5 EV/EBITDA
Trend 2007 2008 2009 2010 2011 2012 2013 2014 2015 TTM Per share data
16.9 18 14.6 14 13.8 13.9 11 11.6 11.7 11.7 Revenue Per Share
2.2 1.7 1 1.1 1.2 1.3 1.3 1.5 -0.6 -0.6 EPS
2.5 3.2 1.5 2.5 2 1.5 2.1 2 1.3 1.2 Free Cashflow Per Share
1.2 1.2 0.6 0.5 0.6 0.7 0.8 0.9 0.9 0.9 Dividends Per Share
1.8 0.8 3.8 4.2 3 3.6 3.8 6.1 1.7 2.8 Tang. Book Per Share
31.3 33.8 27.2 26.1 25.7 25.8 20.4 22.3 21.8 21.5 Median P/S Value
9.5 5.7 9.2 10.4 9.1 10.6 8 11.4 2.6 -- Graham Number
Trend 2007 2008 2009 2010 2011 2012 2013 2014 2015 TTM Income Statement
172488 181581 155278 149567 146542 146684 113245 117184 117386 119368 Revenue
57.6 53.9 51.1 52.1 53.4 49.3 29.5 28.6 29.6 29.5 Gross Margin %
51290 45528 28304 29724 34581 29788 15459 16632 16862 16177 Operating Income
29.7 25.1 18.2 19.9 23.6 20.3 13.7 14.2 14.4 10.7 Operating Margin %
22208 17410 11025 11644 14151 13641 13057 15233 -6126 -6126 Net Income
12.9 9.6 7.1 7.8 9.7 9.3 11.5 13 -5.2 -4.5 Net Margin %
19.6 15.7 9.7 9.6 11.2 11.4 10.3 11.8 -5.4 -4.4 ROE %
3 2.2 1.4 1.5 1.9 1.9 2 2.3 -1.1 -0.8 ROA %
Trend 2007 2008 2009 2010 2011 2012 2013 2014 2015 Dec15 Balance Sheet
15731 48187 70488 78943 84501 77268 88555 70025 70483 87073 Cash & Equivalents
795683 797769 781901 747793 718189 684999 656560 654954 492692 575640 Total Assets
319013 322847 337631 312842 262003 258500 242742 190226 147466 179868 Long-term Debt
680124 693104 664610 628857 601751 561973 525994 526795 394418 468755 Total Liabilities
669 702 702 702 702 702 702 702 702 702 Common Equity
Trend 2007 2008 2009 2010 2011 2012 2013 2014 2015 TTM Cashflow Statement
43322 48653 24417 36124 33359 31331 28510 27709 19891 19891 Cashflow from Operations
-69504 -34768 42378 32436 19882 11302 29117 -5034 59488 59488 Cashflow from Investing
-12319 -1249 623 -1263 -1456 -4164 -9278 -1218 -1099 -1099 Repurchase of Stock
-12319 10757 623 -1263 -1456 -4164 -9278 -1218 -1099 -1099 Net Issuance of Debt
27937 19136 -43513 -61586 -46863 -51074 -45575 -16956 -76054 -76054 Cashflow from Financing
-17803 -16010 -8634 -9800 -12637 -15119 -6754 -7134 -7309 -7309 Capital Expenditure
25519 32643 15783 26324 20722 16212 21756 20575 12582 12582 Free Cash Flow
Competitor
Ticker CompanyFinancial
StrengthProfitability Market Cap($M) P/E P/S
Operating
Margin(%)ROA(%) ROE(%)
NYSE:GE General Electric Co 6 5 289,809 0.00 2.64 13.55 -1.04 -5.52
NYSE:MMM 3M Co 9 9 102,584 22.37 3.58 22.94 15.18 37.75
NYSE:HON Honeywell International Inc 6 7 88,826 19.25 2.35 17.80 10.22 26.58
FRA:SIE Siemens AG 7 6 85,365 10.63 1.03 7.99 6.37 22.16
NYSE:DHR Danaher Corp 6 8 64,840 19.81 3.22 16.67 8.07 14.27
42.12
17.73
6.66
270M
134.8M
GuruFocus.com is not operated by a broker, a dealer, or a registered investment adviser. Under no circumstances does any information posted on GuruFocus.com represent a recommendation to buy or sell a security. The
information on this site, and in its related newsletters, is not intended to be, nor does it constitute, investment advice or recommendations. The gurus may buy and sell securities before and after any particular article and report and
information herein is published, with respect to the securities discussed in any article and report posted herein. In no event shall GuruFocus.com be liable to any member, guest or third party for any damages of any kind arising out
of the use of any content or other material published or available on GuruFocus.com, or relating to the use of, or inability to use, GuruFocus.com or any content, including, without limitation, any investment losses, lost profits, lost
opportunity, special, incidental, indirect, consequential or punitive damages. Past performance is a poor indicator of future performance. The information on this site, and in its related newsletters, is not intended to be, nor does it
constitute, investment advice or recommendations. The information on this site is in no way guaranteed for completeness, accuracy or in any other way. The gurus listed in this website are not affiliated with GuruFocus.com, LLC.
Stock quotes provided by InterActive Data. Fundamental company data provided by Morningstar, updated daily.

As of 04-18-2016 * All financial numbers are in millions except for per share data
GuruFocus Manual of Stocks www.gurufocus.com/stock/NAS:GOOGL A
Alphabet Inc (NAS:GOOGL)
$ 787.68
Online Media - Internet Content & Information
Market Cap: $ 542,176 Mil
Alphabet Inc through its subsidiary Google Inc is engaged in improving the
ways people connect with information & products including Search, Android,
YouTube, Apps, Maps & Ads. It also produces internet-connected home
devices & provides internet services.
Ratios
CurrentIndustry
Median
Historical
Median
P/E (ttm) 34.36 30.58 29.77
Forward P/E 19.92 19.92 N/A
P/B 4.52 2.96 4.17
P/S 7.27 1.94 6.55
P/FCF 33.85 24.82 29.17
Shiller P/E 56.74 9999.00 52.07
PEG 2.38 1.41 0.82
Valuation Analysis
% of Price
NCAV 79.44 10
Tangible Book 146.38 19
Graham Number 279.27 35
Peter Lynch Value 332.47 42
DCF (FCF Based) 662.83 84
DCE (Earnings Based) 674.13 86
Median P/S 709.8 90
Price 787.68
Dividend & Ownership
Dividend Yield(ttm) % N/A
Dividend Yield(forward) % N/A
Payout N/A
Dividend Growth(5y) % N/A
Yield on Cost(5y) % N/A
Continuous Div. since N/A
Insider Ownership % 0.37
Institution Ownership % 34.45
Short % of Float 1.21
Financial Strength
Score: 9 /10 CurrentIndustry
Median
Historical
Median
Cash to Debt 14.00 22.40 585.86
Equity to Asset 0.82 0.63 0.80
Interest Coverage 186.15 87.31 1139.33
F-Score 5 5.00 5
Profitability
Score: 8 /10 CurrentIndustry
Median
Historical
Median
Operating Margin (%) 25.82 4.72 30.54
Net-Margin (%) 21.90 3.16 24.33
ROE (%) 14.18 6.36 17.63
ROA (%) 11.84 3.03 14.87
ROC (Joel Greenblatt)
(%)71.91 39.56 123.55
Growth
10 Yr 5 Yr 1 Yr
Revenue Growth (%) 24.2 18.8 12.80
EBITDA Growth (%) 22.4 13.8 10.30
EBIT Growth (%) 21 11.2 16.50
EPS without NRI
Growth (%)22.2 11.2 18.70
Free Cash Flow Growth
(%)23.5 10.6 40.10
Book Value Growth (%) 25.3 19.4 14.80
Quarterly
Dec14 Mar15 Jun15 Sep15 Dec15
Revenue 18103 17258 17727 18675 21329
Net Income 4675 3586 3931 3979 4923
EPS 7 5 5 6 7
Revenue (YoY) % 15 12 11 13 18
Net Income (YoY) % 47 4 17 45 5
EPS (YoY) % 45 3 1 44 4
Guru Trades
Guru Date ActionImpact
%
Cur.
Shares
Manning & Napier
Advisors, Inc03/31/16 Reduce -1.05 294,554
Murray Stahl 03/31/16 Reduce -0.27 15,037
Ken Fisher 03/31/16 Add 0.04 973,292
Caxton Associates 12/31/15 Buy 3.02 24,400
Stanley Druckenmiller 12/31/15 Buy 2.61 32,800
Pioneer Investments 12/31/15 Buy 2.15 723,236
Andreas Halvorsen 12/31/15 Reduce -1.67 1,853,460
Bill Nygren 12/31/15 Reduce -1.6 217,000
Jeremy Grantham 12/31/15 Reduce -1.47 638,864
Louis Moore Bacon 12/31/15 Add 1.43 91,766
Steve Mandel 12/31/15 Buy 1.34 404,297
Warning Signs
SEVERE Gross margin: Declined
SEVERE Operating margin: Declined
SEVERE Asset Growth: faster than revenue growth
Good Signs
GOOD Interest Coverage: Comfortable
255.07 371.25 346.08 311.74 313.69 323.26 384.42 560.89 610.69 793.96 780.91 Annual Price High
168.69 219.55 128.84 141.51 218.25 237.67 279.82 351.79 498.2 497.1 701.02 Low
Gain(%) SP500(%)
1W 2.70 1.6
1M 3.92 1.7
3M 9.78 9.1
6M 12.55 0.5
YTD 0.26 1.9
2006 2007 2008 2009 2010 2011 2012 2013 2014 2015 Current Stock Performance
142200 216328 96832 197012 190841 209847 233426 376363 361465 534765 542176 Market Cap
618 632 634 638 646 654 665 678 687 693 688 Sh. Outstanding-diluted(Mil)
46.8 52.1 23.1 30.4 22.6 21.7 21.9 34.4 25.7 33.9 34.4 Year End P/E
8.4 9.5 3.4 5.5 4.1 3.6 3.3 4.3 3.5 4.4 4.5 P/B
13.5 13.2 4.5 8.4 6.5 5.6 5.1 6.8 5.5 7.2 7.3 P/S
31.8 32.7 10 17.4 13.2 11.9 10.9 16.2 13.5 18.8 19.1 EV/EBITDA
Trend 2007 2008 2009 2010 2011 2012 2013 2014 2015 TTM Per share data
26.3 34.4 37.1 45.4 58 69.3 81.9 96.1 108.2 108.4 Revenue Per Share
6.7 6.7 10.2 13.2 14.9 16.2 18.8 20.6 22.8 22.9 EPS
5.3 8.7 13.3 10.9 17 20.1 16.7 16.6 23.2 23.3 Free Cashflow Per Share
-- -- -- -- -- -- -- -- -- -- Dividends Per Share
31.9 35.6 47.8 60.7 75.8 81.5 103.9 122.8 146.4 137.6 Tang. Book Per Share
172.2 224.9 243.2 297.9 380.2 454.9 537.6 629.5 709.8 674.6 Median P/S Value
69.1 73.1 104.8 134.1 159.4 178.5 213.1 234 274.3 258.1 Graham Number
Trend 2007 2008 2009 2010 2011 2012 2013 2014 2015 TTM Income Statement
16594 21796 23651 29321 37905 46039 55519 66001 74989 74989 Revenue
59.9 60.4 62.6 64.5 65.2 62.7 60.4 61.1 62.4 62.5 Gross Margin %
5084.4 6632 8312 10381 11742 13834 15403 16496 19360 19360 Operating Income
30.6 30.4 35.1 35.4 31 30.1 27.7 25 25.8 25.9 Operating Margin %
4203.7 4226.9 6520 8505 9737 10737 12733 14136 16348 16419 Net Income
25.3 19.4 27.6 29 25.7 23.3 22.9 21.4 21.8 21.8 Net Margin %
21.2 16.6 20.3 20.7 18.7 16.5 16 14.8 14.1 14.1 ROE %
19.2 14.8 18 17.3 14.9 12.9 12.4 11.8 11.8 11.8 ROA %
Trend 2007 2008 2009 2010 2011 2012 2013 2014 2015 Dec15 Balance Sheet
6081.6 8656.7 10198 13630 9983 14778 18898 18347 16549 17512 Cash & Equivalents
25336 31768 40497 57851 72574 93798 110920 129187 147461 140987 Total Assets
-- -- -- -- 2986 2988 2236 3228 1995 2360 Long-term Debt
2646.1 3528.7 4493 11610 14429 22083 23611 25327 27130 26787 Total Liabilities
0.3 0.3 15817 18235 20264 22835 25922 28767 32982 31274 Common Equity
Trend 2007 2008 2009 2010 2011 2012 2013 2014 2015 TTM Cashflow Statement
5775.4 7852.9 9316 11081 14565 16619 18659 22376 26024 26024 Cashflow from Operations
-3681.6 -5319.4 -8019 -10680 -19041 -13056 -13679 -21055 -23711 -23711 Cashflow from Investing
-- -- -- -801 -- -- -- -- -1780 -- Repurchase of Stock
-- -- -- -801 -- -- -- -- -1780 -- Net Issuance of Debt
403.1 87.6 233 3050 807 1229 -857 -1439 -3677 -3677 Cashflow from Financing
-2402.8 -2358.5 -810 -4018 -3438 -3273 -7358 -10959 -9915 -9915 Capital Expenditure
3372.6 5494.4 8506 7063 11127 13346 11301 11417 16109 16109 Free Cash Flow
Competitor
Ticker CompanyFinancial
StrengthProfitability Market Cap($M) P/E P/S
Operating
Margin(%)ROA(%) ROE(%)
NAS:GOOGL Alphabet Inc 9 8 542,176 34.36 7.27 25.82 11.84 14.18
NAS:FB Facebook Inc 8 7 314,372 86.29 17.57 34.72 8.31 9.23
HKSE:00700 Tencent Holdings Ltd 8 8 200,318 43.96 12.33 39.54 12.42 29.09
NAS:BIDU Baidu Inc 9 7 66,770 13.06 6.87 17.60 27.73 54.24
JSE:NPN Naspers Ltd 7 8 58,936 68.02 11.86 -0.02 7.94 15.39
793.96
332.56
128.84
29M
14.7M
GuruFocus.com is not operated by a broker, a dealer, or a registered investment adviser. Under no circumstances does any information posted on GuruFocus.com represent a recommendation to buy or sell a security. The
information on this site, and in its related newsletters, is not intended to be, nor does it constitute, investment advice or recommendations. The gurus may buy and sell securities before and after any particular article and report and
information herein is published, with respect to the securities discussed in any article and report posted herein. In no event shall GuruFocus.com be liable to any member, guest or third party for any damages of any kind arising out
of the use of any content or other material published or available on GuruFocus.com, or relating to the use of, or inability to use, GuruFocus.com or any content, including, without limitation, any investment losses, lost profits, lost
opportunity, special, incidental, indirect, consequential or punitive damages. Past performance is a poor indicator of future performance. The information on this site, and in its related newsletters, is not intended to be, nor does it
constitute, investment advice or recommendations. The information on this site is in no way guaranteed for completeness, accuracy or in any other way. The gurus listed in this website are not affiliated with GuruFocus.com, LLC.
Stock quotes provided by InterActive Data. Fundamental company data provided by Morningstar, updated daily.

As of 04-18-2016 * All financial numbers are in millions except for per share data
GuruFocus Manual of Stocks www.gurufocus.com/stock/NYSE:GS G
Goldman Sachs Group Inc (NYSE:GS)
$ 159.02
Brokers & Exchanges - Capital Markets
Market Cap: $ 67,162 Mil
Goldman Sachs Group Inc is a investment banking, securities and investment
management firm. Its segments include Investment Banking, Trading and
Principal Investments, Asset Management and Securities Services.
Ratios
CurrentIndustry
Median
Historical
Median
P/E (ttm) 13.16 15.91 10.91
Forward P/E 8.98 14.16 N/A
P/B 0.88 1.11 1.14
P/S 2.17 3.53 2.34
P/FCF 14.25 14.07 5.56
Shiller P/E 10.02 22.12 11.13
PEG 3.54 0.89 1.31
Valuation Analysis
% of Price
NCAV -1611.37 -1013
Peter Lynch Value 108.69 68
Price 159.02
Tangible Book 170.16 107
Median P/S 171.4 108
Graham Number 215.15 135
Dividend & Ownership
Dividend Yield(ttm) % 1.63
Dividend Yield(forward) % 1.64
Payout 0.21
Dividend Growth(5y) % 13.9
Yield on Cost(5y) % 3.12
Continuous Div. since 2011
Insider Ownership % 4.06
Institution Ownership % 71.13
Short % of Float 0.99
Financial Strength
Score: 6 /10 CurrentIndustry
Median
Historical
Median
Cash to Debt 0.31 N/A 0.10
Equity to Asset 0.10 0.58 0.06
Interest Coverage 1.63 18.34 1.56
F-Score 5 5.00 4
Profitability
Score: 7 /10 CurrentIndustry
Median
Historical
Median
Operating Margin (%) 25.96 15.30 33.62
Net-Margin (%) 17.99 12.26 22.69
ROE (%) 6.47 5.26 10.02
ROA (%) 0.70 1.69 0.91
ROC (Joel Greenblatt)
(%)0.00 15.32 0.00
Growth
10 Yr 5 Yr 1 Yr
Revenue Growth (%) 0.6 4.5 1.20
EBITDA Growth (%) 0.1 3.7 -26.40
EBIT Growth (%) 0.3 5.7 -26.80
EPS without NRI Growth
(%)-0.8 11.1 -29.20
Free Cash Flow Growth
(%)N/A N/A 0.00
Book Value Growth (%) 10.1 5.9 5.30
Quarterly
Dec14 Mar15 Jun15 Sep15 Dec15
Revenue 7688 10617 9069 6861 7273
Net Income 2166 2844 1048 1426 765
EPS 4 6 2 3 1
Revenue (YoY) % -12 14 -1 -18 -5
Net Income (YoY) % -7 40 -49 -36 -65
EPS (YoY) % -5 48 -52 -37 -71
Guru Trades
Guru Date ActionImpact
%
Cur.
Shares
Ken Fisher 03/31/16 Reduce -0.01 235,381
Scott Black 12/31/15 Reduce -1.07 11,176
Louis Moore Bacon 12/31/15 Buy 1.01 180,000
Ken Heebner 12/31/15 Reduce -0.57 633,000
Ruane Cunniff 12/31/15 Reduce -0.44 769,530
Jeremy Grantham 12/31/15 Add 0.1 241,438
Warning Signs
SEVERE Long-Term Debt: Keep issuing new debt
Good Signs
GOOD Operating margin: Expansion
GOOD Dividend yield: Close to 5-year high
GOOD P/B Ratio: Close to 3-year low
Insider Trades
Insider Position Date TradesCur.
Shares
Cohn Gary DPresident
and C11/25/15 -39290 636421
Palm Gregory KExecutive
VP -11/25/15 -31103 920590
Blankfein Lloyd CChairman of
the11/25/15 -5250 1893k
Schwartz Harvey MExecutive
Vice07/17/15 -33326 270332
Blankfein Lloyd CChairman of
the06/19/15 -104186 2236k
205.1 247.92 215.05 192.28 184.92 175 129.72 177.26 196.89 218.4 180.23 Annual Price High
127.04 164.9 52 59.2 131.08 87.7 90.43 127.56 152.72 171.86 140.69 Low
Gain(%) SP500(%)
1W 5.48 1.6
1M 4.27 1.7
3M 2.29 9.1
6M -13.59 0.5
YTD -11.69 1.9
2006 2007 2008 2009 2010 2011 2012 2013 2014 2015 Current Stock Performance
80388 88544 33776 86971 85346 43901 59335 79122 83397 75603 67162 Market Cap
477 461 456 551 585 557 516 500 473 459 422 Sh. Outstanding-diluted(Mil)
9.9 9.2 17 7.8 12.8 20.5 9 11.5 11.4 14.9 13.2 Year End P/E
2.5 2.2 0.7 1.4 1.2 0.7 0.9 1.1 1.1 1 0.9 P/B
2.5 2.3 1.6 2 2.5 1.8 1.9 2.6 2.7 2.5 2.2 P/S
15.9 17.2 37.6 12.8 18.6 26.6 15.8 17.7 19.7 26.1 25.2 EV/EBITDA
Trend 2007 2008 2009 2010 2011 2012 2013 2014 2015 TTM Per share data
99.7 48.7 82 66.9 51.7 66.2 68.5 73 73.7 73.4 Revenue Per Share
24.7 4.5 22.1 13.2 4.5 14.1 15.5 17.1 12.1 12.1 EPS
-152.3 -0.3 85.9 -11.2 38.3 23.1 7.7 -17.5 11.2 11.2 Free Cashflow Per Share
1.4 1.4 1.5 1.4 1.4 1.8 2.1 2.3 2.6 2.6 Dividends Per Share
88.6 100.2 114.2 127.8 127.3 138.5 149.9 161.4 170.2 168.1 Tang. Book Per Share
231.6 115.5 194.1 156.3 119 153.6 158.8 169.4 171.4 175.2 Median P/S Value
222 100.4 238.5 194.7 113.6 209.8 228.4 249 215.6 243.5 Graham Number
Trend 2007 2008 2009 2010 2011 2012 2013 2014 2015 TTM Income Statement
45987 22222 45173 39161 28811 34163 34206 34528 33820 33820 Revenue
-- -- -- -- -- -- -- -- -- -- Gross Margin %
17604 2336 19829 12892 6169 11207 11737 12357 8778 8778 Operating Income
38.3 10.5 43.9 32.9 21.4 32.8 34.3 35.8 26 25.2 Operating Margin %
11599 2322 13385 8354 4442 7475 8040 8477 6083 6083 Net Income
25.2 10.5 29.6 21.3 15.4 21.9 23.5 24.6 18 17.4 Net Margin %
29 3.8 18.1 10.4 3.4 10 10 10 6.6 6.5 ROE %
1.2 0.2 1.5 1 0.5 0.8 0.9 1 0.7 0.7 ROA %
Trend 2007 2008 2009 2010 2011 2012 2013 2014 2015 Dec15 Balance Sheet
11882 122404 38291 39788 56008 72669 61133 57600 75105 66164 Cash & Equivalents
1120k 884547 848942 911332 923225 938555 911507 855842 861395 866823 Total Assets
164174 168220 185085 174399 173545 167305 160965 190111 200175 195800 Long-term Debt
1077k 820178 778228 833976 852846 862839 833040 773045 774667 780020 Total Liabilities
-- -- 8 8 -- 8 8 9 9 9 Common Equity
Trend 2007 2008 2009 2010 2011 2012 2013 2014 2015 TTM Cashflow Statement
-68197 1894 48875 -5357 22501 12879 4543 -7623 6961 6961 Cashflow from Operations
396 -4337 -1561 -985 629 -3734 -8728 -14909 -18574 -18574 Cashflow from Investing
-8165 -2034 -2 -4183 -6048 -4640 -6175 -5469 -4135 -4135 Repurchase of Stock
-8165 4071 6258 -3602 -5680 -4323 -6110 -5346 -3876 -3876 Net Issuance of Debt
73390 7901 -22828 7839 -6910 7516 -7351 18999 29118 29118 Cashflow from Financing
-2037 -2027 -1556 -1227 -1184 -961 -706 -678 -1833 -1833 Capital Expenditure
-70234 -133 47319 -6584 21317 11918 3837 -8301 5128 5128 Free Cash Flow
Competitor
Ticker CompanyFinancial
StrengthProfitability Market Cap($M) P/E P/S
Operating
Margin(%)ROA(%) ROE(%)
NYSE:GS Goldman Sachs Group Inc 6 7 67,162 13.16 2.17 25.96 0.70 6.47
NYSE:MS Morgan Stanley 6 5 50,394 8.86 1.42 24.16 0.75 7.65
NYSE:SCHW Charles Schwab Corp 7 7 38,097 28.02 6.01 35.78 0.87 10.83
SHSE:600030 CITIC Securities Co Ltd 5 7 33,575 10.47 3.69 49.37 3.21 16.34
SHSE:600837 Haitong Securities Co Ltd 5 8 26,760 10.29 4.35 55.01 3.11 17.42
247.92
97.96
52
30M
14.9M
GuruFocus.com is not operated by a broker, a dealer, or a registered investment adviser. Under no circumstances does any information posted on GuruFocus.com represent a recommendation to buy or sell a security. The
information on this site, and in its related newsletters, is not intended to be, nor does it constitute, investment advice or recommendations. The gurus may buy and sell securities before and after any particular article and report and
information herein is published, with respect to the securities discussed in any article and report posted herein. In no event shall GuruFocus.com be liable to any member, guest or third party for any damages of any kind arising out
of the use of any content or other material published or available on GuruFocus.com, or relating to the use of, or inability to use, GuruFocus.com or any content, including, without limitation, any investment losses, lost profits, lost
opportunity, special, incidental, indirect, consequential or punitive damages. Past performance is a poor indicator of future performance. The information on this site, and in its related newsletters, is not intended to be, nor does it
constitute, investment advice or recommendations. The information on this site is in no way guaranteed for completeness, accuracy or in any other way. The gurus listed in this website are not affiliated with GuruFocus.com, LLC.
Stock quotes provided by InterActive Data. Fundamental company data provided by Morningstar, updated daily.
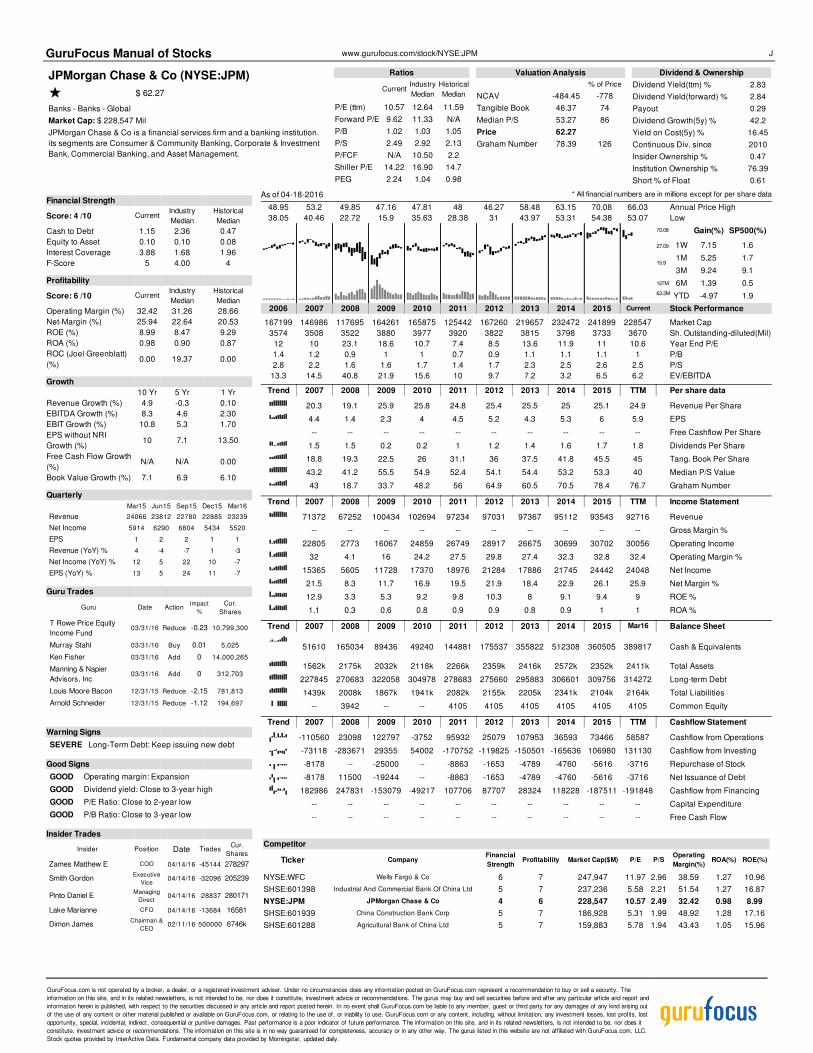
As of 04-18-2016 * All financial numbers are in millions except for per share data
GuruFocus Manual of Stocks www.gurufocus.com/stock/NYSE:JPM J
JPMorgan Chase & Co (NYSE:JPM)
$ 62.27
Banks - Banks - Global
Market Cap: $ 228,547 Mil
JPMorgan Chase & Co is a financial services firm and a banking institution.
its segments are Consumer & Community Banking, Corporate & Investment
Bank, Commercial Banking, and Asset Management.
Ratios
CurrentIndustry
Median
Historical
Median
P/E (ttm) 10.57 12.64 11.59
Forward P/E 9.62 11.33 N/A
P/B 1.02 1.03 1.05
P/S 2.49 2.92 2.13
P/FCF N/A 10.50 2.2
Shiller P/E 14.22 16.90 14.7
PEG 2.24 1.04 0.98
Valuation Analysis
% of Price
NCAV -484.45 -778
Tangible Book 46.37 74
Median P/S 53.27 86
Price 62.27
Graham Number 78.39 126
Dividend & Ownership
Dividend Yield(ttm) % 2.83
Dividend Yield(forward) % 2.84
Payout 0.29
Dividend Growth(5y) % 42.2
Yield on Cost(5y) % 16.45
Continuous Div. since 2010
Insider Ownership % 0.47
Institution Ownership % 76.39
Short % of Float 0.61
Financial Strength
Score: 4 /10 CurrentIndustry
Median
Historical
Median
Cash to Debt 1.15 2.36 0.47
Equity to Asset 0.10 0.10 0.08
Interest Coverage 3.88 1.68 1.96
F-Score 5 4.00 4
Profitability
Score: 6 /10 CurrentIndustry
Median
Historical
Median
Operating Margin (%) 32.42 31.26 28.66
Net-Margin (%) 25.94 22.64 20.53
ROE (%) 8.99 8.47 9.29
ROA (%) 0.98 0.90 0.87
ROC (Joel Greenblatt)
(%)0.00 19.37 0.00
Growth
10 Yr 5 Yr 1 Yr
Revenue Growth (%) 4.9 -0.3 0.10
EBITDA Growth (%) 8.3 4.6 2.30
EBIT Growth (%) 10.8 5.3 1.70
EPS without NRI
Growth (%)10 7.1 13.50
Free Cash Flow Growth
(%)N/A N/A 0.00
Book Value Growth (%) 7.1 6.9 6.10
Quarterly
Mar15 Jun15 Sep15 Dec15 Mar16
Revenue 24066 23812 22780 22885 23239
Net Income 5914 6290 6804 5434 5520
EPS 1 2 2 1 1
Revenue (YoY) % 4 -4 -7 1 -3
Net Income (YoY) % 12 5 22 10 -7
EPS (YoY) % 13 5 24 11 -7
Guru Trades
Guru Date ActionImpact
%
Cur.
Shares
T Rowe Price Equity
Income Fund03/31/16 Reduce -0.23 10,799,300
Murray Stahl 03/31/16 Buy 0.01 5,025
Ken Fisher 03/31/16 Add 0 14,000,265
Manning & Napier
Advisors, Inc03/31/16 Add 0 312,703
Louis Moore Bacon 12/31/15 Reduce -2.15 781,813
Arnold Schneider 12/31/15 Reduce -1.12 194,697
Warning Signs
SEVERE Long-Term Debt: Keep issuing new debt
Good Signs
GOOD Operating margin: Expansion
GOOD Dividend yield: Close to 3-year high
GOOD P/E Ratio: Close to 2-year low
GOOD P/B Ratio: Close to 3-year low
Insider Trades
Insider Position Date TradesCur.
Shares
Zames Matthew E COO 04/14/16 -45144 278297
Smith GordonExecutive
Vice04/14/16 -32096 205239
Pinto Daniel EManaging
Direct04/14/16 -28837 280171
Lake Marianne CFO 04/14/16 -13684 16581
Dimon JamesChairman &
CEO02/11/16 500000 6746k
48.95 53.2 49.85 47.16 47.81 48 46.27 58.48 63.15 70.08 66.03 Annual Price High
38.05 40.46 22.72 15.9 35.63 28.38 31 43.97 53.31 54.38 53.07 Low
Gain(%) SP500(%)
1W 7.15 1.6
1M 5.25 1.7
3M 9.24 9.1
6M 1.39 0.5
YTD -4.97 1.9
2006 2007 2008 2009 2010 2011 2012 2013 2014 2015 Current Stock Performance
167199 146986 117695 164261 165875 125442 167260 219657 232472 241899 228547 Market Cap
3574 3508 3522 3880 3977 3920 3822 3815 3798 3733 3670 Sh. Outstanding-diluted(Mil)
12 10 23.1 18.6 10.7 7.4 8.5 13.6 11.9 11 10.6 Year End P/E
1.4 1.2 0.9 1 1 0.7 0.9 1.1 1.1 1.1 1 P/B
2.8 2.2 1.6 1.6 1.7 1.4 1.7 2.3 2.5 2.6 2.5 P/S
13.3 14.5 40.8 21.9 15.6 10 9.7 7.2 3.2 6.5 6.2 EV/EBITDA
Trend 2007 2008 2009 2010 2011 2012 2013 2014 2015 TTM Per share data
20.3 19.1 25.9 25.8 24.8 25.4 25.5 25 25.1 24.9 Revenue Per Share
4.4 1.4 2.3 4 4.5 5.2 4.3 5.3 6 5.9 EPS
-- -- -- -- -- -- -- -- -- -- Free Cashflow Per Share
1.5 1.5 0.2 0.2 1 1.2 1.4 1.6 1.7 1.8 Dividends Per Share
18.8 19.3 22.5 26 31.1 36 37.5 41.8 45.5 45 Tang. Book Per Share
43.2 41.2 55.5 54.9 52.4 54.1 54.4 53.2 53.3 40 Median P/S Value
43 18.7 33.7 48.2 56 64.9 60.5 70.5 78.4 76.7 Graham Number
Trend 2007 2008 2009 2010 2011 2012 2013 2014 2015 TTM Income Statement
71372 67252 100434 102694 97234 97031 97367 95112 93543 92716 Revenue
-- -- -- -- -- -- -- -- -- -- Gross Margin %
22805 2773 16067 24859 26749 28917 26675 30699 30702 30056 Operating Income
32 4.1 16 24.2 27.5 29.8 27.4 32.3 32.8 32.4 Operating Margin %
15365 5605 11728 17370 18976 21284 17886 21745 24442 24048 Net Income
21.5 8.3 11.7 16.9 19.5 21.9 18.4 22.9 26.1 25.9 Net Margin %
12.9 3.3 5.3 9.2 9.8 10.3 8 9.1 9.4 9 ROE %
1.1 0.3 0.6 0.8 0.9 0.9 0.8 0.9 1 1 ROA %
Trend 2007 2008 2009 2010 2011 2012 2013 2014 2015 Mar16 Balance Sheet
51610 165034 89436 49240 144881 175537 355822 512308 360505 389817 Cash & Equivalents
1562k 2175k 2032k 2118k 2266k 2359k 2416k 2572k 2352k 2411k Total Assets
227845 270683 322058 304978 278683 275660 295883 306601 309756 314272 Long-term Debt
1439k 2008k 1867k 1941k 2082k 2155k 2205k 2341k 2104k 2164k Total Liabilities
-- 3942 -- -- 4105 4105 4105 4105 4105 4105 Common Equity
Trend 2007 2008 2009 2010 2011 2012 2013 2014 2015 TTM Cashflow Statement
-110560 23098 122797 -3752 95932 25079 107953 36593 73466 58587 Cashflow from Operations
-73118 -283671 29355 54002 -170752 -119825 -150501 -165636 106980 131130 Cashflow from Investing
-8178 -- -25000 -- -8863 -1653 -4789 -4760 -5616 -3716 Repurchase of Stock
-8178 11500 -19244 -- -8863 -1653 -4789 -4760 -5616 -3716 Net Issuance of Debt
182986 247831 -153079 -49217 107706 87707 28324 118228 -187511 -191848 Cashflow from Financing
-- -- -- -- -- -- -- -- -- -- Capital Expenditure
-- -- -- -- -- -- -- -- -- -- Free Cash Flow
Competitor
Ticker CompanyFinancial
StrengthProfitability Market Cap($M) P/E P/S
Operating
Margin(%)ROA(%) ROE(%)
NYSE:WFC Wells Fargo & Co 6 7 247,947 11.97 2.96 38.59 1.27 10.96
SHSE:601398 Industrial And Commercial Bank Of China Ltd 5 7 237,236 5.58 2.21 51.54 1.27 16.87
NYSE:JPM JPMorgan Chase & Co 4 6 228,547 10.57 2.49 32.42 0.98 8.99
SHSE:601939 China Construction Bank Corp 5 7 186,928 5.31 1.99 48.92 1.28 17.16
SHSE:601288 Agricultural Bank of China Ltd 5 7 159,883 5.78 1.94 43.43 1.05 15.96
70.08
27.09
15.9
127M
63.3M
GuruFocus.com is not operated by a broker, a dealer, or a registered investment adviser. Under no circumstances does any information posted on GuruFocus.com represent a recommendation to buy or sell a security. The
information on this site, and in its related newsletters, is not intended to be, nor does it constitute, investment advice or recommendations. The gurus may buy and sell securities before and after any particular article and report and
information herein is published, with respect to the securities discussed in any article and report posted herein. In no event shall GuruFocus.com be liable to any member, guest or third party for any damages of any kind arising out
of the use of any content or other material published or available on GuruFocus.com, or relating to the use of, or inability to use, GuruFocus.com or any content, including, without limitation, any investment losses, lost profits, lost
opportunity, special, incidental, indirect, consequential or punitive damages. Past performance is a poor indicator of future performance. The information on this site, and in its related newsletters, is not intended to be, nor does it
constitute, investment advice or recommendations. The information on this site is in no way guaranteed for completeness, accuracy or in any other way. The gurus listed in this website are not affiliated with GuruFocus.com, LLC.
Stock quotes provided by InterActive Data. Fundamental company data provided by Morningstar, updated daily.

As of 04-18-2016 * All financial numbers are in millions except for per share data
GuruFocus Manual of Stocks www.gurufocus.com/stock/NYSE:MA M
MasterCard Inc (NYSE:MA)
$ 97.67
Credit Services
Market Cap: $ 108,486 Mil
MasterCard Inc is a technology company in the payments industry that
connects consumers, financial institutions, merchants, governments and
businesses, enabling them to use electronic forms of payment instead of
cash and checks.
Ratios
CurrentIndustry
Median
Historical
Median
P/E (ttm) 29.16 14.29 26.48
Forward P/E 23.42 10.15 N/A
P/B 18.08 1.06 8.23
P/S 11.53 3.05 6.96
P/FCF 30.08 8.12 26.37
Shiller P/E 59.57 13.36 64.53
PEG 1.55 0.62 1.38
Valuation Analysis
% of Price
NCAV -2.41 -2
Tangible Book 2.99 3
Graham Number 15 15
Median P/S 58.96 60
Peter Lynch Value 63.58 65
Price 97.67
Dividend & Ownership
Dividend Yield(ttm) % 0.72
Dividend Yield(forward) % 0.79
Payout 0.2
Dividend Growth(5y) % 73.3
Yield on Cost(5y) % 11.25
Continuous Div. since 2011
Insider Ownership % 0.13
Institution Ownership % 84.31
Short % of Float 0.83
Financial Strength
Score: 9 /10 CurrentIndustry
Median
Historical
Median
Cash to Debt 2.05 N/A 12.92
Equity to Asset 0.37 0.47 0.45
Interest Coverage 83.25 4.20 83.25
F-Score 4 4.00 5
Profitability
Score: 8 /10 CurrentIndustry
Median
Historical
Median
Operating Margin (%) 52.53 20.23 47.00
Net-Margin (%) 39.39 15.28 31.01
ROE (%) 59.89 6.80 42.78
ROA (%) 25.01 2.28 21.81
ROC (Joel Greenblatt)
(%)792.89 13.47 634.74
Growth
10 Yr 5 Yr 1 Yr
Revenue Growth (%) 14.8 15.2 5.20
EBITDA Growth (%) N/A 18.6 1.50
EBIT Growth (%) N/A 19.1 2.10
EPS without NRI
Growth (%)N/A 21.1 8.10
Free Cash Flow Growth
(%)37 19.9 23.40
Book Value Growth (%) 19.6 5.7 -8.30
Quarterly
Dec14 Mar15 Jun15 Sep15 Dec15
Revenue 2411 2230 2390 2530 2517
Net Income 801 1020 921 977 890
EPS 1 1 1 1 1
Revenue (YoY) % 15 3 1 2 4
Net Income (YoY) % 29 17 -1 -4 11
EPS (YoY) % 33 22 1 -1 14
Guru Trades
Guru Date ActionImpact
%
Cur.
Shares
Manning & Napier
Advisors, Inc03/31/16 Reduce -0.08 4,693,533
Murray Stahl 03/31/16 Reduce -0.02 90,656
Ken Fisher 03/31/16 Add 0 250,623
Andreas Halvorsen 12/31/15 Reduce -1.81 162,264
Steve Mandel 12/31/15 Reduce -0.83 6,150,587
Westport Asset
Management12/31/15 Reduce -0.58 307,500
Warning Signs
SEVERE Asset Growth: faster than revenue growth
Good Signs
GOOD Financial Strength: Strong Financial Strength
Insider Trades
Insider Position Date TradesCur.
Shares
Murphy Timothy HGeneral
Counsel04/04/16 -20148 37167
Garrow Ronald EChief
Human
Res
04/04/16 -10034 8602
Haythornthwaite
RichardDirector 04/01/16 -3000 54492
Mastercard Foundation10%
Owner02/11/16 -107848 115177k
Mastercard Foundation10%
Owner02/09/16 -161775 115285k
10.55 22.32 32 25.84 26.72 38.1 49.85 83.55 89.08 101.5 97.36 Annual Price High
4.39 9.64 12.11 11.92 19.2 22.09 33.91 49.13 68.68 80.74 80.65 Low
Gain(%) SP500(%)
1W 3.08 1.6
1M 8.40 1.7
3M 9.20 9.1
6M -0.10 0.5
YTD -0.31 1.9
2006 2007 2008 2009 2010 2011 2012 2013 2014 2015 Current Stock Performance
13295 28250 14500 28618 27680 45535 58410 99775 99305 108654 108486 Market Cap
1358 1357 1301 1300 1310 1284 1258 1215 1169 1137 1111 Sh. Outstanding-diluted(Mil)
273.6 26.9 -- 22.9 15.9 25.1 22.4 32.5 27.9 29.1 29.2 Year End P/E
5.6 9.3 7.5 8.2 5.3 7.8 8.4 13.3 14.6 18 18.1 P/B
4 7.2 3.7 6.5 5.3 7.1 8.4 12.2 10.7 11.5 11.5 P/S
24.3 14 -74.1 10.4 7.9 13.5 12.6 19.6 17.3 19.5 19.5 EV/EBITDA
Trend 2007 2008 2009 2010 2011 2012 2013 2014 2015 TTM Per share data
3 3.8 3.9 4.2 5.2 5.9 6.8 8.1 8.5 8.5 Revenue Per Share
0.8 -0.2 1.1 1.4 1.5 2.2 2.6 3.1 3.4 3.3 EPS
0.5 0.2 1 1.2 2 2.2 3.2 2.6 3.3 3.2 Free Cashflow Per Share
0.1 0.1 0.1 0.1 0.1 0.1 0.3 0.5 0.7 0.7 Dividends Per Share
1.9 1.2 2.5 3.2 3.4 4.3 4.8 4 3 3.2 Tang. Book Per Share
20.8 26.6 27.3 29.4 36.3 40.8 47.5 56.1 59 57.8 Median P/S Value
5.8 -- 7.9 10.1 10.7 14.6 16.6 16.6 15 15.5 Graham Number
Trend 2007 2008 2009 2010 2011 2012 2013 2014 2015 TTM Income Statement
4067.6 4991.6 5099 5539 6714 7391 8312 9441 9667 9667 Revenue
100 100 100 100 100 100 100 100 100 100 Gross Margin %
1108.1 -534.5 2260 2752 2713 3937 4503 5106 5078 5078 Operating Income
27.2 -10.7 44.3 49.7 40.4 53.3 54.2 54.1 52.5 52.8 Operating Margin %
1085.9 -253.9 1463 1846 1906 2759 3116 3617 3808 3808 Net Income
26.7 -5.1 28.7 33.3 28.4 37.3 37.5 38.3 39.4 39.6 Net Margin %
40.3 -10.3 53.9 42.4 34.4 43.2 43.3 50.7 59.4 60 ROE %
19.2 -4 21 22.6 19.5 23.8 23.3 24.5 24.1 25.3 ROA %
Trend 2007 2008 2009 2010 2011 2012 2013 2014 2015 Dec15 Balance Sheet
1659.3 1505.2 2055 3067 4370 2829 3599 5137 5747 4298 Cash & Equivalents
6260 6475.8 7470 8837 10693 12462 14242 15329 16269 15202 Total Assets
149.8 19.4 22 -- -- -- -- 1494 3287 1943 Long-term Debt
3232.7 4548.5 3966 3632 4825 5545 6758 8539 10241 8952 Total Liabilities
0 -- -- -- -- -- -- -- -- -- Common Equity
Trend 2007 2008 2009 2010 2011 2012 2013 2014 2015 TTM Cashflow Statement
769.9 413.2 1378 1697 2684 2948 4135 3407 4043 4043 Cashflow from Operations
315.1 201.7 -664 -641 -748 -2839 -4 690 -715 -715 Cashflow from Investing
-600.5 -649.5 -- -- -1148 -1748 -2443 -3386 -3518 -3518 Repurchase of Stock
-598.9 -649.5 -- -- -1148 -1748 -2443 -3386 -3518 -3518 Net Issuance of Debt
-657.5 -751.4 -185 19 -1215 -1798 -2629 -2339 -2458 -2458 Cashflow from Financing
-156.4 -170.3 -140 -151 -177 -218 -299 -334 -342 -342 Capital Expenditure
613.4 243 1238 1546 2507 2730 3836 3073 3701 3701 Free Cash Flow
Competitor
Ticker CompanyFinancial
StrengthProfitability Market Cap($M) P/E P/S
Operating
Margin(%)ROA(%) ROE(%)
NYSE:V Visa Inc 7 9 177,891 29.73 14.17 65.58 15.78 23.24
NYSE:MA MasterCard Inc 9 8 108,486 29.16 11.53 52.53 25.01 59.89
NYSE:AXP American Express Co 4 8 60,340 12.44 1.91 24.19 3.28 23.84
NAS:PYPL PayPal Holdings Inc 5 4 48,467 52.86 7.23 15.80 4.79 10.85
NYSE:COF Capital One Financial Corp 6 7 37,792 10.14 1.68 25.12 1.29 8.33
101.5
48.56
4.39
115M
57.6M
GuruFocus.com is not operated by a broker, a dealer, or a registered investment adviser. Under no circumstances does any information posted on GuruFocus.com represent a recommendation to buy or sell a security. The
information on this site, and in its related newsletters, is not intended to be, nor does it constitute, investment advice or recommendations. The gurus may buy and sell securities before and after any particular article and report and
information herein is published, with respect to the securities discussed in any article and report posted herein. In no event shall GuruFocus.com be liable to any member, guest or third party for any damages of any kind arising out
of the use of any content or other material published or available on GuruFocus.com, or relating to the use of, or inability to use, GuruFocus.com or any content, including, without limitation, any investment losses, lost profits, lost
opportunity, special, incidental, indirect, consequential or punitive damages. Past performance is a poor indicator of future performance. The information on this site, and in its related newsletters, is not intended to be, nor does it
constitute, investment advice or recommendations. The information on this site is in no way guaranteed for completeness, accuracy or in any other way. The gurus listed in this website are not affiliated with GuruFocus.com, LLC.
Stock quotes provided by InterActive Data. Fundamental company data provided by Morningstar, updated daily.

As of 04-18-2016 * All financial numbers are in millions except for per share data
GuruFocus Manual of Stocks www.gurufocus.com/stock/NAS:MSFT M
Microsoft Corp (NAS:MSFT)
$ 56.46
Application Software - Software - Infrastructure
Market Cap: $ 446,559 Mil
Microsoft Corp is engaged in designing, manufacturing, selling devices, and
online advertising. Its products include operating systems for computing
devices, servers, phones and other devices.
Ratios
CurrentIndustry
Median
Historical
Median
P/E (ttm) 40.34 23.64 15.9
Forward P/E 17.7 18.12 N/A
P/B 5.84 2.64 4.85
P/S 5.21 2.02 4.03
P/FCF 19.18 22.99 13.73
Shiller P/E 26.32 35.79 20.21
PEG 33.17 1.86 1.36
Valuation Analysis
% of Price
NCAV 1.46 3
Tangible Book 6.91 12
Graham Number 14.75 26
DCE (Earnings Based) 16.48 29
Median P/S 43.53 77
DCF (FCF Based) 43.72 77
Price 56.46
Dividend & Ownership
Dividend Yield(ttm) % 2.38
Dividend Yield(forward) % 2.59
Payout 0.92
Dividend Growth(5y) % 18.9
Yield on Cost(5y) % 5.66
Continuous Div. since 2004
Insider Ownership % 7.13
Institution Ownership % 72.8
Short % of Float 0.64
Financial Strength
Score: 8 /10 CurrentIndustry
Median
Historical
Median
Cash to Debt 2.31 12.17 No Debt
Equity to Asset 0.43 0.60 0.64
Interest Coverage 16.10 59.14 125.83
F-Score 5 5.00 6
Profitability
Score: 8 /10 CurrentIndustry
Median
Historical
Median
Operating Margin (%) 18.57 4.79 35.46
Net-Margin (%) 12.95 3.25 27.80
ROE (%) 13.70 6.22 34.26
ROA (%) 6.48 3.08 18.65
ROC (Joel Greenblatt)
(%)116.56 22.40 316.44
Growth
10 Yr 5 Yr 1 Yr
Revenue Growth (%) 11.4 9.5 -3.40
EBITDA Growth (%) 9.3 1.2 -29.70
EBIT Growth (%) 7.1 -1.9 -37.70
EPS without NRI
Growth (%)6.5 -4.4 -43.50
Free Cash Flow Growth
(%)10.1 2.2 -8.80
Book Value Growth (%) 12.5 14.5 -13.30
Quarterly
Dec14 Mar15 Jun15 Sep15 Dec15
Revenue 26470 21729 22180 20379 23796
Net Income 5863 4985 -3195 4620 4998
EPS 1 1 -0 1 1
Revenue (YoY) % 8 6 -5 -12 -10
Net Income (YoY) % -11 -12 -169 2 -15
EPS (YoY) % -9 -10 -172 6 -13
Guru Trades
Guru Date ActionImpact
%
Cur.
Shares
Steven Romick 03/31/16 Reduce -2.1 7,981,360
T Rowe Price Equity
Income Fund03/31/16 Reduce -0.43 7,504,700
Yacktman Fund 03/31/16 Reduce -0.15 7,200,000
Yacktman Focused Fund 03/31/16 Reduce -0.12 3,200,000
Manning & Napier
Advisors, Inc03/31/16 Add 0.01 815,056
Murray Stahl 03/31/16 Add 0 18,630
Warning Signs
SEVERE Gross margin: Declined
SEVERE Operating margin: Declined
SEVERE Asset Growth: faster than revenue growth
MEDIUM Per Share Revenue: Declined
MEDIUM Dividend yield: Close to 3-year low
Insider Trades
Insider Position Date TradesCur.
Shares
Capossela Christopher
C
EVP,
Chief
Mark
02/12/16 -10000 285809
Capossela Christopher
C
EVP,
Chief
Mark
02/09/16 -5000 295809
Gates William H Iii Director 02/05/16 -3000000 206993k
Gates William H Iii Director 02/03/16 -2000000 209993k
Gates William H Iii Director 02/02/16 -2000000 211993k
30.19 37.06 35.6 31.39 31.39 28.87 32.85 38.94 49.61 56.55 55.65 Annual Price High
21.51 26.72 17.53 15.15 23.01 23.71 25.96 26.46 34.98 40.29 49.28 Low
Gain(%) SP500(%)
1W 2.26 1.6
1M 3.84 1.7
3M 9.85 9.1
6M 19.91 0.5
YTD 0.96 1.9
2006 2007 2008 2009 2010 2011 2012 2013 2014 2015 Current Stock Performance
234445 276296 251744 211743 199451 217776 256375 287732 343566 354392 446559 Market Cap
10531 9886 9470 8996 8927 8593 8506 8470 8399 8254 7909 Sh. Outstanding-diluted(Mil)
19.5 20.7 14.7 14.7 11 9.7 15.3 13.3 15.9 30.2 40.3 Year End P/E
5.9 8.9 6.9 5.4 4.3 3.8 3.9 3.6 3.8 4.4 5.8 P/B
5.6 5.7 4.3 3.7 3.3 3.2 3.5 3.8 4 3.9 5.2 P/S
11.5 12.7 8.8 8.3 6.1 5.6 8 7.3 8.3 11.6 16.8 EV/EBITDA
Trend 2007 2008 2009 2010 2011 2012 2013 2014 2015 TTM Per share data
5.2 6.4 6.5 7 8.1 8.7 9.2 10.3 11.3 10.8 Revenue Per Share
1.4 1.9 1.6 2.1 2.7 2 2.6 2.6 1.5 1.4 EPS
1.6 1.9 1.8 2.5 2.9 3.4 2.9 3.2 2.8 2.9 Free Cashflow Per Share
0.4 0.4 0.5 0.5 0.6 0.8 0.9 1.1 1.2 1.3 Dividends Per Share
2.7 2.4 2.8 3.8 5.2 5.9 7.3 7.6 7.3 7.2 Tang. Book Per Share
20.8 25.7 26.1 28.2 32.8 35 37.1 41.6 45.5 44.8 Median P/S Value
9.3 10.1 10.2 13.3 17.8 16.3 20.7 21.2 15.5 16.4 Graham Number
Trend 2007 2008 2009 2010 2011 2012 2013 2014 2015 TTM Income Statement
51122 60420 58437 62484 69943 73723 77849 86833 93580 88084 Revenue
79.1 80.8 79.2 80.2 77.7 76.2 73.8 68.8 64.7 64.1 Gross Margin %
18438 22271 20363 24098 27161 21763 26764 27759 18161 16360 Operating Income
36.1 36.9 34.9 38.6 38.8 29.5 34.4 32 19.4 18.7 Operating Margin %
14065 17681 14569 18760 23150 16978 21863 22074 12193 11408 Net Income
27.5 29.3 24.9 30 33.1 23 28.1 25.4 13 13.1 Net Margin %
39.5 52.5 38.4 43.8 44.8 27.5 30.1 26.2 14.4 14.1 ROE %
21.2 26 19.3 22.9 23.8 14.8 16.6 14 7 6.5 ROA %
Trend 2007 2008 2009 2010 2011 2012 2013 2014 2015 Dec15 Balance Sheet
6111 10339 6076 5505 9610 6938 3804 8669 5595 6406.3 Cash & Equivalents
63171 72793 77888 86113 108704 121271 142431 172384 176223 176475 Total Assets
-- -- 3746 4939 11921 10713 12601 20645 27808 30988 Long-term Debt
32074 36507 38330 39938 51621 54908 63487 82600 96140 95365 Total Liabilities
60557 62849 62382 62856 63415 65797 67306 68366 68465 68328 Common Equity
Trend 2007 2008 2009 2010 2011 2012 2013 2014 2015 TTM Cashflow Statement
17796 21612 19037 24073 26994 31626 28833 32231 29080 30578 Cashflow from Operations
6089 -4587 -15770 -11314 -14616 -24786 -23811 -18833 -23001 -18942 Cashflow from Investing
-27575 -12533 -9353 -11269 -11555 -5029 -5360 -7316 -14443 -17845 Repurchase of Stock
-20793 -9039 -8774 -8958 -9133 -3116 -4429 -6709 -13809 -17212 Net Issuance of Debt
-24544 -12934 -7463 -13291 -8376 -9408 -8148 -8394 -9080 -10782 Cashflow from Financing
-2264 -3182 -3119 -1977 -2355 -2305 -4257 -5485 -5944 -6552 Capital Expenditure
15532 18430 15918 22096 24639 29321 24576 26746 23136 24026 Free Cash Flow
Competitor
Ticker CompanyFinancial
StrengthProfitability Market Cap($M) P/E P/S
Operating
Margin(%)ROA(%) ROE(%)
NAS:MSFT Microsoft Corp 8 8 446,559 40.34 5.21 18.57 6.48 13.70
NYSE:ORCL Oracle Corp 7 8 171,140 20.31 4.86 33.96 8.33 18.76
NYSE:VMW VMware Inc 8 9 21,895 22.21 3.35 18.21 6.62 13.20
BSP:CIEL3 Cielo SA 5 7 20,726 21.26 6.70 38.95 13.12 64.65
NAS:CA CA Inc 8 7 12,670 17.47 3.28 26.44 6.99 13.56
56.55
20.7
15.15
132M
66.2M
GuruFocus.com is not operated by a broker, a dealer, or a registered investment adviser. Under no circumstances does any information posted on GuruFocus.com represent a recommendation to buy or sell a security. The
information on this site, and in its related newsletters, is not intended to be, nor does it constitute, investment advice or recommendations. The gurus may buy and sell securities before and after any particular article and report and
information herein is published, with respect to the securities discussed in any article and report posted herein. In no event shall GuruFocus.com be liable to any member, guest or third party for any damages of any kind arising out
of the use of any content or other material published or available on GuruFocus.com, or relating to the use of, or inability to use, GuruFocus.com or any content, including, without limitation, any investment losses, lost profits, lost
opportunity, special, incidental, indirect, consequential or punitive damages. Past performance is a poor indicator of future performance. The information on this site, and in its related newsletters, is not intended to be, nor does it
constitute, investment advice or recommendations. The information on this site is in no way guaranteed for completeness, accuracy or in any other way. The gurus listed in this website are not affiliated with GuruFocus.com, LLC.
Stock quotes provided by InterActive Data. Fundamental company data provided by Morningstar, updated daily.

As of 04-18-2016 * All financial numbers are in millions except for per share data
GuruFocus Manual of Stocks www.gurufocus.com/stock/NYSE:ORCL O
Oracle Corp (NYSE:ORCL)
$ 41.24
Application Software - Software - Infrastructure
Market Cap: $ 171,140 Mil
Oracle Corporation develops, manufactures, markets, hosts and supports
database and middleware software, application software, cloud
infrastructure, hardware system including computer server, storage and
networking products and related services.
Ratios
CurrentIndustry
Median
Historical
Median
P/E (ttm) 20.31 23.64 18.86
Forward P/E 14.43 18.12 N/A
P/B 3.73 2.64 4
P/S 4.86 2.02 4.82
P/FCF 14.5 22.99 14.26
Shiller P/E 24.07 35.79 28.41
PEG 1.92 1.86 1.02
Valuation Analysis
% of Price
NCAV -1.27 -3
Tangible Book 1.53 4
Graham Number 8.35 20
Peter Lynch Value 11.1 27
Median P/S 40.94 99
Price 41.24
DCE (Earnings Based) 46.16 112
DCF (FCF Based) 67.77 164
Dividend & Ownership
Dividend Yield(ttm) % 1.46
Dividend Yield(forward) % 1.46
Payout 0.3
Dividend Growth(5y) % 20.3
Yield on Cost(5y) % 3.68
Continuous Div. since 2013
Insider Ownership % 26.91
Institution Ownership % 60.08
Short % of Float 1.38
Financial Strength
Score: 7 /10 CurrentIndustry
Median
Historical
Median
Cash to Debt 1.27 12.17 2.06
Equity to Asset 0.44 0.60 0.54
Interest Coverage 8.82 59.14 16.79
F-Score 5 5.00 6
Profitability
Score: 8 /10 CurrentIndustry
Median
Historical
Median
Operating Margin (%) 33.96 4.79 35.38
Net-Margin (%) 23.80 3.25 24.33
ROE (%) 18.76 6.22 24.08
ROA (%) 8.33 3.08 12.94
ROC (Joel Greenblatt)
(%)341.75 22.40 450.97
Growth
10 Yr 5 Yr 1 Yr
Revenue Growth (%) 14.6 8.8 -0.70
EBITDA Growth (%) 16.2 10.5 -9.00
EBIT Growth (%) 16.2 11.4 -11.50
EPS without NRI
Growth (%)16.6 12.8 -15.40
Free Cash Flow Growth
(%)17.3 12.1 -4.40
Book Value Growth (%) 18.4 12 0.40
Quarterly
Feb15 May15 Aug15 Nov15 Feb16
Revenue 9327 10706 8448 8993 9012
Net Income 2495 2757 1747 2197 2142
EPS 1 1 0 1 1
Revenue (YoY) % 0 -5 -2 -6 -3
Net Income (YoY) % -3 -24 -20 -12 -14
EPS (YoY) % 0 -23 -17 -9 -11
Guru Trades
Guru Date ActionImpact
%
Cur.
Shares
Yacktman Focused
Fund03/31/16 Reduce -0.89 6,100,000
Yacktman Fund 03/31/16 Reduce -0.74 10,500,000
Steven Romick 03/31/16 Add 0.39 21,418,880
Ken Fisher 03/31/16 Reduce 0 11,370,611
Manning & Napier
Advisors, Inc03/31/16 Add 0 238,490
Murray Stahl 03/31/16 Reduce 0 12,350
Warning Signs
MEDIUM Per Share Revenue: Growth slow down
MEDIUM Price: Close to 1-year high
Good Signs
GOOD Operating margin: Expansion
Insider Trades
Insider Position Date TradesCur.
Shares
Berg Jeffrey Director 04/11/16 -10400 116893
Fowler John FEVP,
Systems03/31/16 -14971 5016
Catz Safra CEO 03/28/16 -4000000 312424
Kurian ThomasPresident-
Produ03/22/16 -200000 33533
Daley DorianEVP, Gen'l
Coun03/22/16 -47500 25000
19.66 23.04 23.52 25.01 31.76 36.37 34.09 38.26 46.23 44.97 41.61 Annual Price High
12.2 16.29 15.4 13.85 21.46 24.78 25.61 29.96 35.84 35.44 33.94 Low
Gain(%) SP500(%)
1W 2.01 1.6
1M 6.27 1.7
3M 20.66 9.1
6M 10.04 0.5
YTD 13.11 1.9
2006 2007 2008 2009 2010 2011 2012 2013 2014 2015 Current Stock Performance
74556 99091 117626 97625 113437 173427 129835 156942 187577 188877 171140 Market Cap
5287 5269 5229 5130 5073 5128 5095 4844 4604 4503 4150 Sh. Outstanding-diluted(Mil)
22.6 23.7 21.6 17.9 18.8 20.5 13.5 15 17.6 19.6 20.3 Year End P/E
5 5.9 5.1 3.9 3.7 4.4 3 3.5 4 3.9 3.7 P/B
5.2 5.7 5.3 4.3 4.3 4.9 3.6 4.4 5.1 5.1 4.9 P/S
12.6 13.4 12.1 9.2 9.8 10.7 7 8.2 9.9 10.5 10.4 EV/EBITDA
Trend 2007 2008 2009 2010 2011 2012 2013 2014 2015 TTM Per share data
3.4 4.3 4.5 5.3 6.9 7.3 7.7 8.3 8.5 8.5 Revenue Per Share
0.8 1.1 1.1 1.2 1.7 2 2.3 2.4 2.2 2 EPS
1 1.4 1.5 1.7 2.1 2.6 2.8 3.1 2.9 2.8 Free Cashflow Per Share
-- -- 0.1 0.2 0.2 0.2 0.1 0.5 0.5 0.6 Dividends Per Share
-0.5 -0.7 -0.2 0.2 2 2.2 2.3 2.5 1.9 1.6 Tang. Book Per Share
16.4 20.7 21.8 25.5 33.5 35 36.9 40 40.8 40.9 Median P/S Value
-- -- -- 2.4 8.8 9.8 10.8 11.5 9.7 8.8 Graham Number
Trend 2007 2008 2009 2010 2011 2012 2013 2014 2015 TTM Income Statement
17996 22430 23252 26820 35622 37121 37180 38275 38226 37159 Revenue
76.7 77.8 79.4 78.5 76.4 78.5 80.2 81.1 80.3 79.5 Gross Margin %
5974 7844 8321 9062 12033 13706 14684 14759 13871 12618 Operating Income
33.2 35 35.8 33.8 33.8 36.9 39.5 38.6 36.3 33.8 Operating Margin %
4274 5521 5593 6135 8547 9981 10925 10955 9938 8843 Net Income
23.8 24.6 24.1 22.9 24 26.9 29.4 28.6 26 23.7 Net Margin %
26.8 27.6 23.3 22 24.2 23.9 24.7 23.9 20.8 18.7 ROE %
13.4 13.5 11.8 11.3 12.7 13.1 13.6 12.7 9.9 8.3 ROA %
Trend 2007 2008 2009 2010 2011 2012 2013 2014 2015 Feb16 Balance Sheet
6218 8262 8995 9914 16163 14955 14613 17769 21716 17862 Cash & Equivalents
34572 47268 47416 61578 73535 78327 81812 90266 110903 107997 Total Assets
6235 10235 9237 11510 14772 13524 18494 22589 39959 40014 Long-term Debt
17653 24243 22326 30780 33759 34639 37164 43388 62240 61108 Total Liabilities
-- 12446 12980 14648 16653 17489 18893 21077 23156 23345 Common Equity
Trend 2007 2008 2009 2010 2011 2012 2013 2014 2015 TTM Cashflow Statement
5520 7402 8255 8681 11214 13743 14224 14921 14336 14114 Cashflow from Operations
-4971 -9076 -2599 -10319 -6081 -8381 -5956 -7539 -19047 -7750 Cashflow from Investing
-3937 -2023 -3972 -992 -1160 -5856 -11021 -9813 -8087 -10546 Repurchase of Stock
-3013 -735 -3212 -118 216 -5123 -9494 -7678 -6285 -9398 Net Issuance of Debt
-1139 3281 -4422 2664 516 -6099 -8500 -4068 9850 -4021 Cashflow from Financing
-319 -243 -529 -230 -450 -648 -650 -580 -1391 -1606 Capital Expenditure
5201 7159 7726 8451 10764 13095 13574 14341 12945 12508 Free Cash Flow
Competitor
Ticker CompanyFinancial
StrengthProfitability Market Cap($M) P/E P/S
Operating
Margin(%)ROA(%) ROE(%)
NYSE:ORCL Oracle Corp 7 8 171,140 20.31 4.86 33.96 8.33 18.76
NYSE:VMW VMware Inc 8 9 21,895 22.21 3.35 18.21 6.62 13.20
BSP:CIEL3 Cielo SA 5 7 20,726 21.26 6.70 38.95 13.12 64.65
NAS:CA CA Inc 8 7 12,670 17.47 3.28 26.44 6.99 13.56
NAS:CTXS Citrix Systems Inc 8 8 12,529 40.45 4.02 10.69 5.84 15.13
46.23
17.02
12.2
59M
29.3M
GuruFocus.com is not operated by a broker, a dealer, or a registered investment adviser. Under no circumstances does any information posted on GuruFocus.com represent a recommendation to buy or sell a security. The
information on this site, and in its related newsletters, is not intended to be, nor does it constitute, investment advice or recommendations. The gurus may buy and sell securities before and after any particular article and report and
information herein is published, with respect to the securities discussed in any article and report posted herein. In no event shall GuruFocus.com be liable to any member, guest or third party for any damages of any kind arising out
of the use of any content or other material published or available on GuruFocus.com, or relating to the use of, or inability to use, GuruFocus.com or any content, including, without limitation, any investment losses, lost profits, lost
opportunity, special, incidental, indirect, consequential or punitive damages. Past performance is a poor indicator of future performance. The information on this site, and in its related newsletters, is not intended to be, nor does it
constitute, investment advice or recommendations. The information on this site is in no way guaranteed for completeness, accuracy or in any other way. The gurus listed in this website are not affiliated with GuruFocus.com, LLC.
Stock quotes provided by InterActive Data. Fundamental company data provided by Morningstar, updated daily.
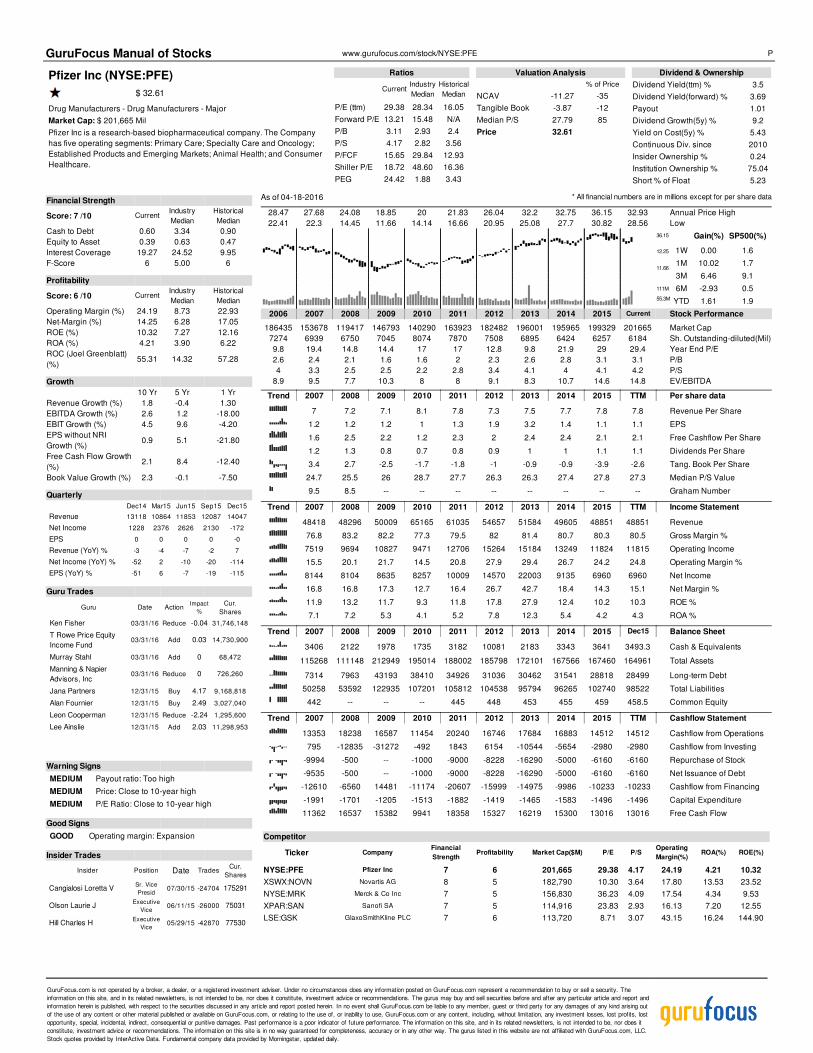
As of 04-18-2016 * All financial numbers are in millions except for per share data
GuruFocus Manual of Stocks www.gurufocus.com/stock/NYSE:PFE P
Pfizer Inc (NYSE:PFE)
$ 32.61
Drug Manufacturers - Drug Manufacturers - Major
Market Cap: $ 201,665 Mil
Pfizer Inc is a research-based biopharmaceutical company. The Company
has five operating segments: Primary Care; Specialty Care and Oncology;
Established Products and Emerging Markets; Animal Health; and Consumer
Healthcare.
Ratios
CurrentIndustry
Median
Historical
Median
P/E (ttm) 29.38 28.34 16.05
Forward P/E 13.21 15.48 N/A
P/B 3.11 2.93 2.4
P/S 4.17 2.82 3.56
P/FCF 15.65 29.84 12.93
Shiller P/E 18.72 48.60 16.36
PEG 24.42 1.88 3.43
Valuation Analysis
% of Price
NCAV -11.27 -35
Tangible Book -3.87 -12
Median P/S 27.79 85
Price 32.61
Dividend & Ownership
Dividend Yield(ttm) % 3.5
Dividend Yield(forward) % 3.69
Payout 1.01
Dividend Growth(5y) % 9.2
Yield on Cost(5y) % 5.43
Continuous Div. since 2010
Insider Ownership % 0.24
Institution Ownership % 75.04
Short % of Float 5.23
Financial Strength
Score: 7 /10 CurrentIndustry
Median
Historical
Median
Cash to Debt 0.60 3.34 0.90
Equity to Asset 0.39 0.63 0.47
Interest Coverage 19.27 24.52 9.95
F-Score 6 5.00 6
Profitability
Score: 6 /10 CurrentIndustry
Median
Historical
Median
Operating Margin (%) 24.19 8.73 22.93
Net-Margin (%) 14.25 6.28 17.05
ROE (%) 10.32 7.27 12.16
ROA (%) 4.21 3.90 6.22
ROC (Joel Greenblatt)
(%)55.31 14.32 57.28
Growth
10 Yr 5 Yr 1 Yr
Revenue Growth (%) 1.8 -0.4 1.30
EBITDA Growth (%) 2.6 1.2 -18.00
EBIT Growth (%) 4.5 9.6 -4.20
EPS without NRI
Growth (%)0.9 5.1 -21.80
Free Cash Flow Growth
(%)2.1 8.4 -12.40
Book Value Growth (%) 2.3 -0.1 -7.50
Quarterly
Dec14 Mar15 Jun15 Sep15 Dec15
Revenue 13118 10864 11853 12087 14047
Net Income 1228 2376 2626 2130 -172
EPS 0 0 0 0 -0
Revenue (YoY) % -3 -4 -7 -2 7
Net Income (YoY) % -52 2 -10 -20 -114
EPS (YoY) % -51 6 -7 -19 -115
Guru Trades
Guru Date ActionImpact
%
Cur.
Shares
Ken Fisher 03/31/16 Reduce -0.04 31,746,148
T Rowe Price Equity
Income Fund03/31/16 Add 0.03 14,730,900
Murray Stahl 03/31/16 Add 0 68,472
Manning & Napier
Advisors, Inc03/31/16 Reduce 0 726,260
Jana Partners 12/31/15 Buy 4.17 9,168,818
Alan Fournier 12/31/15 Buy 2.49 3,027,040
Leon Cooperman 12/31/15 Reduce -2.24 1,295,600
Lee Ainslie 12/31/15 Add 2.03 11,298,953
Warning Signs
MEDIUM Payout ratio: Too high
MEDIUM Price: Close to 10-year high
MEDIUM P/E Ratio: Close to 10-year high
Good Signs
GOOD Operating margin: Expansion
Insider Trades
Insider Position Date TradesCur.
Shares
Cangialosi Loretta VSr. Vice
Presid07/30/15 -24704 175291
Olson Laurie JExecutive
Vice06/11/15 -26000 75031
Hill Charles HExecutive
Vice05/29/15 -42870 77530
28.47 27.68 24.08 18.85 20 21.83 26.04 32.2 32.75 36.15 32.93 Annual Price High
22.41 22.3 14.45 11.66 14.14 16.66 20.95 25.08 27.7 30.82 28.56 Low
Gain(%) SP500(%)
1W 0.00 1.6
1M 10.02 1.7
3M 6.46 9.1
6M -2.93 0.5
YTD 1.61 1.9
2006 2007 2008 2009 2010 2011 2012 2013 2014 2015 Current Stock Performance
186435 153678 119417 146793 140290 163923 182482 196001 195965 199329 201665 Market Cap
7274 6939 6750 7045 8074 7870 7508 6895 6424 6257 6184 Sh. Outstanding-diluted(Mil)
9.8 19.4 14.8 14.4 17 17 12.8 9.8 21.9 29 29.4 Year End P/E
2.6 2.4 2.1 1.6 1.6 2 2.3 2.6 2.8 3.1 3.1 P/B
4 3.3 2.5 2.5 2.2 2.8 3.4 4.1 4 4.1 4.2 P/S
8.9 9.5 7.7 10.3 8 8 9.1 8.3 10.7 14.6 14.8 EV/EBITDA
Trend 2007 2008 2009 2010 2011 2012 2013 2014 2015 TTM Per share data
7 7.2 7.1 8.1 7.8 7.3 7.5 7.7 7.8 7.8 Revenue Per Share
1.2 1.2 1.2 1 1.3 1.9 3.2 1.4 1.1 1.1 EPS
1.6 2.5 2.2 1.2 2.3 2 2.4 2.4 2.1 2.1 Free Cashflow Per Share
1.2 1.3 0.8 0.7 0.8 0.9 1 1 1.1 1.1 Dividends Per Share
3.4 2.7 -2.5 -1.7 -1.8 -1 -0.9 -0.9 -3.9 -2.6 Tang. Book Per Share
24.7 25.5 26 28.7 27.7 26.3 26.3 27.4 27.8 27.3 Median P/S Value
9.5 8.5 -- -- -- -- -- -- -- -- Graham Number
Trend 2007 2008 2009 2010 2011 2012 2013 2014 2015 TTM Income Statement
48418 48296 50009 65165 61035 54657 51584 49605 48851 48851 Revenue
76.8 83.2 82.2 77.3 79.5 82 81.4 80.7 80.3 80.5 Gross Margin %
7519 9694 10827 9471 12706 15264 15184 13249 11824 11815 Operating Income
15.5 20.1 21.7 14.5 20.8 27.9 29.4 26.7 24.2 24.8 Operating Margin %
8144 8104 8635 8257 10009 14570 22003 9135 6960 6960 Net Income
16.8 16.8 17.3 12.7 16.4 26.7 42.7 18.4 14.3 15.1 Net Margin %
11.9 13.2 11.7 9.3 11.8 17.8 27.9 12.4 10.2 10.3 ROE %
7.1 7.2 5.3 4.1 5.2 7.8 12.3 5.4 4.2 4.3 ROA %
Trend 2007 2008 2009 2010 2011 2012 2013 2014 2015 Dec15 Balance Sheet
3406 2122 1978 1735 3182 10081 2183 3343 3641 3493.3 Cash & Equivalents
115268 111148 212949 195014 188002 185798 172101 167566 167460 164961 Total Assets
7314 7963 43193 38410 34926 31036 30462 31541 28818 28499 Long-term Debt
50258 53592 122935 107201 105812 104538 95794 96265 102740 98522 Total Liabilities
442 -- -- -- 445 448 453 455 459 458.5 Common Equity
Trend 2007 2008 2009 2010 2011 2012 2013 2014 2015 TTM Cashflow Statement
13353 18238 16587 11454 20240 16746 17684 16883 14512 14512 Cashflow from Operations
795 -12835 -31272 -492 1843 6154 -10544 -5654 -2980 -2980 Cashflow from Investing
-9994 -500 -- -1000 -9000 -8228 -16290 -5000 -6160 -6160 Repurchase of Stock
-9535 -500 -- -1000 -9000 -8228 -16290 -5000 -6160 -6160 Net Issuance of Debt
-12610 -6560 14481 -11174 -20607 -15999 -14975 -9986 -10233 -10233 Cashflow from Financing
-1991 -1701 -1205 -1513 -1882 -1419 -1465 -1583 -1496 -1496 Capital Expenditure
11362 16537 15382 9941 18358 15327 16219 15300 13016 13016 Free Cash Flow
Competitor
Ticker CompanyFinancial
StrengthProfitability Market Cap($M) P/E P/S
Operating
Margin(%)ROA(%) ROE(%)
NYSE:PFE Pfizer Inc 7 6 201,665 29.38 4.17 24.19 4.21 10.32
XSWX:NOVN Novartis AG 8 5 182,790 10.30 3.64 17.80 13.53 23.52
NYSE:MRK Merck & Co Inc 7 5 156,830 36.23 4.09 17.54 4.34 9.53
XPAR:SAN Sanofi SA 7 5 114,916 23.83 2.93 16.13 7.20 12.55
LSE:GSK GlaxoSmithKline PLC 7 6 113,720 8.71 3.07 43.15 16.24 144.90
36.15
12.25
11.66
111M
55.3M
GuruFocus.com is not operated by a broker, a dealer, or a registered investment adviser. Under no circumstances does any information posted on GuruFocus.com represent a recommendation to buy or sell a security. The
information on this site, and in its related newsletters, is not intended to be, nor does it constitute, investment advice or recommendations. The gurus may buy and sell securities before and after any particular article and report and
information herein is published, with respect to the securities discussed in any article and report posted herein. In no event shall GuruFocus.com be liable to any member, guest or third party for any damages of any kind arising out
of the use of any content or other material published or available on GuruFocus.com, or relating to the use of, or inability to use, GuruFocus.com or any content, including, without limitation, any investment losses, lost profits, lost
opportunity, special, incidental, indirect, consequential or punitive damages. Past performance is a poor indicator of future performance. The information on this site, and in its related newsletters, is not intended to be, nor does it
constitute, investment advice or recommendations. The information on this site is in no way guaranteed for completeness, accuracy or in any other way. The gurus listed in this website are not affiliated with GuruFocus.com, LLC.
Stock quotes provided by InterActive Data. Fundamental company data provided by Morningstar, updated daily.

As of 04-18-2016 * All financial numbers are in millions except for per share data
GuruFocus Manual of Stocks www.gurufocus.com/stock/NYSE:V V
Visa Inc (NYSE:V)Not Rated $ 81.45
Credit Services
Market Cap: $ 177,891 Mil
Visa Inc is a payments technology company that connects consumers,
businesses, banks and governments in more than 200 countries and
territories to fast, secure and reliable electronic payments. The Company
operates a processing networks - VisaNet.
Ratios
CurrentIndustry
Median
Historical
Median
P/E (ttm) 29.73 14.29 26.88
Forward P/E 24.75 10.15 N/A
P/B 6.06 1.06 3.29
P/S 14.17 3.05 9.79
P/FCF 31.29 8.12 27.84
Shiller P/E 56.45 13.36 51.74
PEG 1.38 0.62 1.6
Valuation Analysis
% of Price
NCAV -1.58 -2
Tangible Book 2.88 4
Graham Number 13.32 16
Median P/S 56.22 69
Peter Lynch Value 64.44 79
Price 81.45
Dividend & Ownership
Dividend Yield(ttm) % 0.65
Dividend Yield(forward) % 0.7
Payout 0.18
Dividend Growth(5y) % 33.4
Yield on Cost(5y) % 2.75
Continuous Div. since 2008
Insider Ownership % 0.07
Institution Ownership % 82.22
Short % of Float 2.59
Financial Strength
Score: 7 /10 CurrentIndustry
Median
Historical
Median
Cash to Debt 1.34 N/A N/A
Equity to Asset 0.54 0.47 0.73
Interest Coverage 318.00 4.20 170.50
F-Score 8 4.00 8
Profitability
Score: 9 /10 CurrentIndustry
Median
Historical
Median
Operating Margin (%) 65.58 20.23 54.05
Net-Margin (%) 47.64 15.28 35.42
ROE (%) 23.24 6.80 13.25
ROA (%) 15.78 2.28 9.87
ROC (Joel Greenblatt)
(%)506.13 13.47 287.99
Growth
10 Yr 5 Yr 1 Yr
Revenue Growth (%) N/A 15.7 11.50
EBITDA Growth (%) N/A 21.2 22.90
EBIT Growth (%) N/A 22 20.30
EPS without NRI
Growth (%)N/A 22.6 22.90
Free Cash Flow Growth
(%)N/A 23 -5.10
Book Value Growth (%) N/A 8 18.70
Quarterly
Dec14 Mar15 Jun15 Sep15 Dec15
Revenue 3382 3409 3518 3571 3565
Net Income 1569 1550 1697 1512 1941
EPS 1 1 1 1 1
Revenue (YoY) % 7 8 12 11 5
Net Income (YoY) % 12 -3 25 41 24
EPS (YoY) % 15 0 28 44 27
Guru Trades
Guru Date ActionImpact
%
Cur.
Shares
Manning & Napier
Advisors, Inc03/31/16 Reduce -0.07 3,577,316
Murray Stahl 03/31/16 Reduce 0 172,664
Ken Fisher 03/31/16 Reduce 0 14,787,793
Steve Mandel 12/31/15 Add 0.99 12,769,259
Manning & Napier
Advisors, Inc12/31/15 Reduce -0.65 3,729,694
David Rolfe 12/31/15 Reduce -0.59 3,193,704
John Hussman 12/31/15 Reduce -0.44 75,000
Frank Sands 12/31/15 Reduce -0.39 44,284,945
Warning Signs
MEDIUM Price: Close to 10-year high
MEDIUM P/B Ratio: Close to 10-year high
Good Signs
GOOD Altman Z-Score: Strong
GOOD Piotroski F-Score: High
Insider Trades
Insider Position Date TradesCur.
Shares
Richey EllenVICE CHAIR
RISK03/03/16 -18736 31260
Richey EllenVICE CHAIR
RISK02/10/16 -39348 49996
Sheedy William M.EVP CORP
STRAT,12/16/15 -60930 235528
-- -- 22.13 22.24 24.15 25.79 38.12 55.67 66.91 80.46 80.33 Annual Price High
-- -- 11.6 10.61 16.37 17.28 24.78 37.9 49.16 61.59 67.77 Low
Gain(%) SP500(%)
1W 2.63 1.6
1M 11.36 1.7
3M 11.68 9.1
6M 6.66 0.5
YTD 3.44 1.9
2006 2007 2008 2009 2010 2011 2012 2013 2014 2015 Current Stock Performance
-- -- 51842 38984 53925 58854 89840 121944 131847 154297 177891 Market Cap
-- -- 5572 3036 2956 2828 2712 2624 2523 2457 2184 Sh. Outstanding-diluted(Mil)
-- -- 53.7 22.9 18.5 16.6 42.7 25.2 24.8 27.1 29.7 Year End P/E
-- -- 2.3 1.7 2.2 2.2 3.3 4.5 4.8 5.2 6.1 P/B
-- -- 10 8.3 6.8 6.6 8.8 10.7 10.6 12.4 14.2 P/S
-- -- 27.2 7.9 10.1 9.6 35.2 15.3 15.7 15.5 17.2 EV/EBITDA
Trend 2007 2008 2009 2010 2011 2012 2013 2014 2015 TTM Per share data
-- 1.1 2.3 2.7 3.2 3.8 4.5 5 5.6 5.7 Revenue Per Share
-- 0.1 0.8 1 1.3 0.8 1.9 2.2 2.6 2.7 EPS
-- 0 0.1 0.8 1.2 1.7 1 2.6 2.5 2.6 Free Cashflow Per Share
-- -- 0.1 0.1 0.2 0.2 0.3 0.4 0.5 0.5 Dividends Per Share
-- 0.4 0.9 0.7 1.2 1.7 1.5 1.7 3 2.6 Tang. Book Per Share
-- 15.1 20.4 26.6 31.6 37.6 43.8 49.1 55.2 54.2 Median P/S Value
-- 1.1 4 4 5.9 5.5 8 9.1 13.2 12 Graham Number
Trend 2007 2008 2009 2010 2011 2012 2013 2014 2015 TTM Income Statement
3590 6263 6911 8065 9188 10421 11778 12702 13880 14063 Revenue
-- 75.4 76.5 79.6 80.2 79.5 76.2 81.3 81.6 81.8 Gross Margin %
-1449 1232 3538 4589 5456 2139 7239 7697 9064 9222 Operating Income
-40.4 19.7 51.2 56.9 59.4 20.5 61.5 60.6 65.3 65.6 Operating Margin %
-1076 804 2353 2966 3650 2144 4980 5438 6328 6700 Net Income
-30 12.8 34.1 36.8 39.7 20.6 42.3 42.8 45.6 47.6 Net Margin %
-2624.4 7.4 10.4 12.3 14.2 7.9 18.3 20 22.1 23.2 ROE %
-29.3 4.1 7 9 10.7 5.7 13.1 14.6 16.1 16.2 ROA %
Trend 2007 2008 2009 2010 2011 2012 2013 2014 2015 Dec15 Balance Sheet
275 4979 4617 3867 2127 2074 3052 1971 3518 5135.3 Cash & Equivalents
4390 34981 32281 33408 34760 40013 35956 38569 40236 43369 Total Assets
-- 55 44 32 -- -- -- -- -- 3969.3 Long-term Debt
4891 12704 9092 8397 8323 12383 9086 11156 10394 14324 Total Liabilities
-- 1136 -- -- -- -- -- -- -- -- Common Equity
Trend 2007 2008 2009 2010 2011 2012 2013 2014 2015 TTM Cashflow Statement
505 531 558 2691 3872 5009 3022 7205 6584 6802 Cashflow from Operations
-463 554 1830 -1904 -2299 -2414 -1164 -941 -1435 -6993 Cashflow from Investing
-- -13446 -2646 -1000 -2024 -710 -5365 -4118 -2910 -4122 Repurchase of Stock
-- 5654 -2646 -1000 -2024 -710 -5365 -4118 -2910 -4123 Net Issuance of Debt
-37 3624 -2751 -1542 -3304 -2655 -1746 -6478 -3603 10943 Cashflow from Financing
-160 -415 -306 -241 -353 -376 -471 -553 -414 -436 Capital Expenditure
345 116 252 2450 3519 4633 2551 6652 6170 6366 Free Cash Flow
Competitor
Ticker CompanyFinancial
StrengthProfitability Market Cap($M) P/E P/S
Operating
Margin(%)ROA(%) ROE(%)
NYSE:V Visa Inc 7 9 177,891 29.73 14.17 65.58 15.78 23.24
NYSE:MA MasterCard Inc 9 8 108,486 29.16 11.53 52.53 25.01 59.89
NYSE:AXP American Express Co 4 8 60,340 12.44 1.91 24.19 3.28 23.84
NAS:PYPL PayPal Holdings Inc 5 4 48,467 52.86 7.23 15.80 4.79 10.85
NYSE:COF Capital One Financial Corp 6 7 37,792 10.14 1.68 25.12 1.29 8.33
80.46
34.93
10.61
142M
70.8M
GuruFocus.com is not operated by a broker, a dealer, or a registered investment adviser. Under no circumstances does any information posted on GuruFocus.com represent a recommendation to buy or sell a security. The
information on this site, and in its related newsletters, is not intended to be, nor does it constitute, investment advice or recommendations. The gurus may buy and sell securities before and after any particular article and report and
information herein is published, with respect to the securities discussed in any article and report posted herein. In no event shall GuruFocus.com be liable to any member, guest or third party for any damages of any kind arising out
of the use of any content or other material published or available on GuruFocus.com, or relating to the use of, or inability to use, GuruFocus.com or any content, including, without limitation, any investment losses, lost profits, lost
opportunity, special, incidental, indirect, consequential or punitive damages. Past performance is a poor indicator of future performance. The information on this site, and in its related newsletters, is not intended to be, nor does it
constitute, investment advice or recommendations. The information on this site is in no way guaranteed for completeness, accuracy or in any other way. The gurus listed in this website are not affiliated with GuruFocus.com, LLC.
Stock quotes provided by InterActive Data. Fundamental company data provided by Morningstar, updated daily.

As of 04-18-2016 * All financial numbers are in millions except for per share data
GuruFocus Manual of Stocks www.gurufocus.com/stock/NYSE:WFC W
Wells Fargo & Co (NYSE:WFC)
$ 48.84
Banks - Banks - Global
Market Cap: $ 247,947 Mil
Wells Fargo & Co is a diversified financial services company. It provides
retail, corporate and commercial banking services through banking stores
and offices, the internet and other distribution channels to individuals,
businesses and institutions.
Ratios
CurrentIndustry
Median
Historical
Median
P/E (ttm) 11.97 12.64 13.35
Forward P/E 10.52 11.33 N/A
P/B 1.42 1.03 1.57
P/S 2.96 2.92 2.62
P/FCF N/A 10.50 7.53
Shiller P/E 16.58 16.90 16.09
PEG 0.95 1.04 0.98
Valuation Analysis
% of Price
NCAV -326.32 -668
Tangible Book 26.35 54
Median P/S 43.14 88
Price 48.84
Graham Number 49.12 101
Peter Lynch Value 50.06 102
Dividend & Ownership
Dividend Yield(ttm) % 3.06
Dividend Yield(forward) % 3.11
Payout 0.36
Dividend Growth(5y) % 49
Yield on Cost(5y) % 22.47
Continuous Div. since 2010
Insider Ownership % 0.06
Institution Ownership % 80.12
Short % of Float 0.46
Financial Strength
Score: 6 /10 CurrentIndustry
Median
Historical
Median
Cash to Debt 0.06 2.36 0.14
Equity to Asset 0.11 0.10 0.10
Interest Coverage 7.80 1.68 2.96
F-Score 4 4.00 4
Profitability
Score: 7 /10 CurrentIndustry
Median
Historical
Median
Operating Margin (%) 38.59 31.26 31.30
Net-Margin (%) 25.93 22.64 21.20
ROE (%) 10.96 8.47 11.74
ROA (%) 1.27 0.90 1.35
ROC (Joel Greenblatt)
(%)0.00 19.37 0.00
Growth
10 Yr 5 Yr 1 Yr
Revenue Growth (%) 5.1 0.6 4.30
EBITDA Growth (%) 7.7 12.3 3.70
EBIT Growth (%) 10.2 12.5 1.40
EPS without NRI
Growth (%)9.7 13.3 0.50
Free Cash Flow Growth
(%)N/A N/A 0.00
Book Value Growth (%) 11.1 8.6 5.00
Quarterly
Mar15 Jun15 Sep15 Dec15 Mar16
Revenue 21278 21318 21875 21586 22195
Net Income 5804 5719 5796 5575 5462
EPS 1 1 1 1 1
Revenue (YoY) % 3 1 3 1 4
Net Income (YoY) % -2 -0 1 -2 -6
EPS (YoY) % -1 2 3 -1 -5
Guru Trades
Guru Date ActionImpact
%
Cur.
Shares
Arnold Van Den Berg 03/31/16 Reduce -0.16 505,414
T Rowe Price Equity
Income Fund03/31/16 Reduce -0.02 5,255,300
Ken Fisher 03/31/16 Add 0.01 19,102,039
Murray Stahl 03/31/16 Add 0 6,971
Manning & Napier
Advisors, Inc03/31/16 Add 0 397,159
Stanley Druckenmiller 12/31/15 Sell -5.19 0
Warning Signs
MEDIUM Long-Term Debt: Issuing new debt
Good Signs
GOOD Operating margin: Expansion
GOOD Dividend yield: Close to 5-year high
GOOD P/B Ratio: Close to 3-year low
Insider Trades
Insider Position Date TradesCur.
Shares
Dean Lloyd H Director 03/11/16 -2210 40984
Sloan Timothy JPresident &
COO03/10/16 -10000 533642
Loughlin Michael JSr. Executive
V12/09/15 -20000 222395
Sloan Timothy JSr. Executive
V10/22/15 -24000 522186
Strother James MSr. Executive
V07/23/15 -31000 181727
36.81 37.47 39.8 31.38 33.88 34.1 36.13 45.54 55.71 58.52 54.36 Annual Price High
30.52 29.49 20.51 8.12 23.25 22.88 27.56 34.18 44.23 50.02 45.16 Low
Gain(%) SP500(%)
1W 2.51 1.6
1M -3.46 1.7
3M -0.40 9.1
6M -7.00 0.5
YTD -10.55 1.9
2006 2007 2008 2009 2010 2011 2012 2013 2014 2015 Current Stock Performance
121273 99539 98028 139771 163078 145038 180002 238675 283439 276808 247947 Market Cap
3410 3383 3391 4563 5263 5323 5352 5371 5324 5210 5077 Sh. Outstanding-diluted(Mil)
14.5 12.7 37.9 15.2 14 9.8 10.2 11.7 13.4 13.2 12 Year End P/E
2.7 2.1 1.5 1.4 1.4 1.1 1.2 1.6 1.7 1.6 1.4 P/B
3.4 2.6 2.4 1.4 1.9 1.8 2.1 2.9 3.5 3.3 3 P/S
13 18.1 97.4 17.6 17.7 12.1 11.4 12.3 14.6 15.7 14.9 EV/EBITDA
Trend 2007 2008 2009 2010 2011 2012 2013 2014 2015 TTM Per share data
11.6 12.4 19.4 16.2 15.2 16.1 15.6 15.8 16.5 16.8 Revenue Per Share
2.4 0.7 1.8 2.2 2.8 3.4 3.9 4.1 4.1 4.1 EPS
-- -- -- -- -- -- -- -- -- -- Free Cashflow Per Share
1.2 1.3 0.5 0.2 0.4 0.8 1.2 1.4 1.5 1.5 Dividends Per Share
4.9 8.7 11.9 12.6 15.3 18.8 20.1 23.4 25.2 25.6 Tang. Book Per Share
30.4 32.8 51.5 42.4 39.7 42.1 40.8 41.4 43.1 32.1 Median P/S Value
16.2 11.7 21.6 25 31.2 37.7 41.9 46.5 48.4 48.6 Graham Number
Trend 2007 2008 2009 2010 2011 2012 2013 2014 2015 TTM Income Statement
39390 41897 88686 85210 80948 86086 83780 84347 86057 86974 Revenue
-- -- -- -- -- -- -- -- -- -- Gross Margin %
11627 3257 17998 19001 23656 28471 32629 33915 33641 33559 Operating Income
29.5 7.8 20.3 22.3 29.2 33.1 39 40.2 39.1 38.6 Operating Margin %
8057 2655 12275 12362 15869 18897 21878 23057 22894 22552 Net Income
20.5 6.3 13.8 14.5 19.6 22 26.1 27.3 26.6 25.9 Net Margin %
17.2 3.2 7.6 9.8 11.3 12.1 12.8 12.3 11.4 11 ROE %
1.5 0.3 1 1 1.2 1.4 1.5 1.4 1.3 1.3 ROA %
Trend 2007 2008 2009 2010 2011 2012 2013 2014 2015 Mar16 Balance Sheet
14757 23763 27080 16044 19440 21860 19919 19571 19111 18819 Cash & Equivalents
575442 1310k 1244k 1258k 1314k 1423k 1524k 1687k 1788k 1777k Total Assets
99393 267158 203861 156983 125354 127379 152998 183943 199536 198112 Long-term Debt
527814 1211k 1132k 1132k 1174k 1265k 1353k 1503k 1595k 1584k Total Liabilities
-- -- -- 8787 8931 9136 9136 9136 9136 9136 Common Equity
Trend 2007 2008 2009 2010 2011 2012 2013 2014 2015 TTM Cashflow Statement
9078 -4831 28613 18772 13665 58540 57641 17529 14772 12257 Cashflow from Operations
-77315 -18171 71785 -3675 -35044 -139890 -153492 -128380 -107235 -64311 Cashflow from Investing
-5542 -1623 -220 -636 -2416 -3918 -5356 -9414 -8697 -6105 Repurchase of Stock
-5542 12548 -220 739 -1120 -1827 -3132 -7574 -6971 -4993 Net Issuance of Debt
67966 32008 -97081 -26133 24775 83770 93910 110503 92003 51372 Cashflow from Financing
-- -- -- -- -- -- -- -- -- -- Capital Expenditure
-- -- -- -- -- -- -- -- -- -- Free Cash Flow
Competitor
Ticker CompanyFinancial
StrengthProfitability Market Cap($M) P/E P/S
Operating
Margin(%)ROA(%) ROE(%)
NYSE:WFC Wells Fargo & Co 6 7 247,947 11.97 2.96 38.59 1.27 10.96
SHSE:601398 Industrial And Commercial Bank Of China Ltd 5 7 237,236 5.58 2.21 51.54 1.27 16.87
NYSE:JPM JPMorgan Chase & Co 4 6 228,547 10.57 2.49 32.42 0.98 8.99
SHSE:601939 China Construction Bank Corp 5 7 186,928 5.31 1.99 48.92 1.28 17.16
SHSE:601288 Agricultural Bank of China Ltd 5 7 159,883 5.78 1.94 43.43 1.05 15.96
58.52
25.2
8.12
189M
94.4M
GuruFocus.com is not operated by a broker, a dealer, or a registered investment adviser. Under no circumstances does any information posted on GuruFocus.com represent a recommendation to buy or sell a security. The
information on this site, and in its related newsletters, is not intended to be, nor does it constitute, investment advice or recommendations. The gurus may buy and sell securities before and after any particular article and report and
information herein is published, with respect to the securities discussed in any article and report posted herein. In no event shall GuruFocus.com be liable to any member, guest or third party for any damages of any kind arising out
of the use of any content or other material published or available on GuruFocus.com, or relating to the use of, or inability to use, GuruFocus.com or any content, including, without limitation, any investment losses, lost profits, lost
opportunity, special, incidental, indirect, consequential or punitive damages. Past performance is a poor indicator of future performance. The information on this site, and in its related newsletters, is not intended to be, nor does it
constitute, investment advice or recommendations. The information on this site is in no way guaranteed for completeness, accuracy or in any other way. The gurus listed in this website are not affiliated with GuruFocus.com, LLC.
Stock quotes provided by InterActive Data. Fundamental company data provided by Morningstar, updated daily.

As of 04-18-2016 * All financial numbers are in millions except for per share data
GuruFocus Manual of Stocks www.gurufocus.com/stock/NYSE:WMT W
Wal-Mart Stores Inc (NYSE:WMT)
$ 69.86
Retail - Defensive - Discount Stores
Market Cap: $ 219,663 Mil
Wal-Mart Stores Inc operates retail stores in various formats under various
banners. Its operations comprise of three reportable business segments,
Walmart U.S., Walmart International and Sam's Club in three categories
retail, wholesale and others.
Ratios
CurrentIndustry
Median
Historical
Median
P/E (ttm) 15.24 20.79 15.2
Forward P/E 16.37 17.67 N/A
P/B 2.73 1.80 3.16
P/S 0.46 0.48 0.52
P/FCF 14.14 20.45 19.9
Shiller P/E 15.86 19.73 19.55
PEG 4.87 2.15 1.44
Valuation Analysis
% of Price
NCAV -26.53 -38
Tangible Book 20.19 29
Graham Number 45.62 65
DCE (Earnings Based) 54.27 78
Price 69.86
Median P/S 77.69 111
DCF (FCF Based) 119.92 172
Dividend & Ownership
Dividend Yield(ttm) % 2.83
Dividend Yield(forward) % 2.9
Payout 0.43
Dividend Growth(5y) % 10.2
Yield on Cost(5y) % 4.6
Continuous Div. since 1984
Insider Ownership % 1.03
Institution Ownership % 77.52
Short % of Float 2.1
Financial Strength
Score: 6 /10 CurrentIndustry
Median
Historical
Median
Cash to Debt 0.17 0.60 0.15
Equity to Asset 0.40 0.43 0.40
Interest Coverage 9.46 13.62 11.38
F-Score 5 5.00 6
Profitability
Score: 6 /10 CurrentIndustry
Median
Historical
Median
Operating Margin (%) 5.00 2.97 5.84
Net-Margin (%) 3.05 1.73 3.37
ROE (%) 18.51 8.61 20.88
ROA (%) 7.29 3.17 8.14
ROC (Joel Greenblatt)
(%)20.77 14.55 24.38
Growth
10 Yr 5 Yr 1 Yr
Revenue Growth (%) 7.5 5.4 -0.20
EBITDA Growth (%) 7.2 3.1 -7.20
EBIT Growth (%) 6.5 1.9 -10.80
EPS without NRI
Growth (%)6.6 2 -8.20
Free Cash Flow Growth
(%)17.6 11.5 -2.30
Book Value Growth (%) 7 5.7 1.00
Quarterly
Jan15 Apr15 Jul15 Oct15 Jan16
Revenue 131565 114826 120229 117408 129667
Net Income 4966 3341 3475 3304 4574
EPS 2 1 1 1 1
Revenue (YoY) % 1 -0 0 -1 -1
Net Income (YoY) % 12 -7 -15 -11 -8
EPS (YoY) % 12 -7 -14 -10 -6
Guru Trades
Guru Date ActionImpact
%
Cur.
Shares
Yacktman Fund 03/31/16 Reduce -0.17 1,300,000
T Rowe Price Equity
Income Fund03/31/16 Reduce 0 2,794,400
Manning & Napier
Advisors, Inc03/31/16 Reduce 0 334,165
Ken Fisher 03/31/16 Add 0 278,412
Tom Gayner 12/31/15 Sell -1.88 0
Barrow, Hanley,
Mewhinney & Strauss12/31/15 Reduce -1.2 4,771,345
Steven Cohen 12/31/15 Buy 0.51 1,000,000
Jeremy Grantham 12/31/15 Reduce -0.39 5,708,696
Warning Signs
SEVERE Operating margin: Declined
MEDIUM Per Share Revenue: Growth slow down
Insider Trades
Insider Position Date TradesCur.
Shares
Whaley Steven PSenior Vice
Pre03/01/16 -3000 27687
Ford Rollin L. EVP 02/25/16 -740 134982
Flynn Timothy Patrick Director 12/02/15 10000 25374
51.75 51.21 63.17 57.18 55.99 59.99 77.15 81.21 87.54 90.47 69.15 Annual Price High
43.02 42.27 45.72 46.42 48 48.41 57.36 68.23 72.66 56.42 60.84 Low
Gain(%) SP500(%)
1W 1.47 1.6
1M 1.42 1.7
3M 12.32 9.1
6M 18.07 0.5
YTD 13.47 1.9
2006 2007 2008 2009 2010 2011 2012 2013 2014 2015 Current Stock Performance
197007 201590 186171 202286 197142 209728 231814 241440 274315 209830 219663 Market Cap
4168 4072 3951 3877 3670 3474 3389 3283 3243 3217 3144 Sh. Outstanding-diluted(Mil)
17.6 16.2 13.9 14.4 12.5 13.6 13.9 15.3 16.8 14.5 15.2 Year End P/E
3.2 3.1 2.9 2.9 2.9 2.9 3 3.2 3.4 2.6 2.7 P/B
0.6 0.6 0.5 0.5 0.5 0.5 0.5 0.5 0.6 0.4 0.5 P/S
8.8 8.5 7.4 7.6 7.3 7.5 7.8 8.2 8.8 7.5 7.8 EV/EBITDA
Trend 2008 2009 2010 2011 2012 2013 2014 2015 2016 TTM Per share data
92.9 102.3 105.3 114.9 128.5 138.3 145.1 149.8 149.9 149.4 Revenue Per Share
3.1 3.4 3.7 4.5 4.5 5 4.9 5.1 4.6 4.6 EPS
1.3 2.9 3.6 3 3.1 3.7 3.1 5.1 4.9 4.9 Free Cashflow Per Share
0.9 1 1.1 1.2 1.5 1.6 1.9 1.9 2 2 Dividends Per Share
12.3 12.7 14.4 14.7 14.8 16.9 17.6 19.6 20.2 19.2 Tang. Book Per Share
48.1 53.2 54.5 59.4 66.7 71.8 75.3 77.9 77.7 77.8 Median P/S Value
29.5 30.9 34.7 37.2 38.9 43.6 43.8 46.9 45.6 45.3 Graham Number
Trend 2008 2009 2010 2011 2012 2013 2014 2015 2016 TTM Income Statement
378476 404374 408085 421849 446509 468651 476294 485651 482130 482130 Revenue
24.3 24.8 25.4 25.3 25 24.8 24.8 24.8 25.1 25.1 Gross Margin %
21952 22798 24002 25542 26491 27725 26872 27147 24105 24105 Operating Income
5.8 5.6 5.9 6.1 5.9 5.9 5.6 5.6 5 5 Operating Margin %
12731 13400 14370 16389 15699 16999 16022 16363 14694 14694 Net Income
3.4 3.3 3.5 3.9 3.5 3.6 3.4 3.4 3.1 3 Net Margin %
20.2 20.6 21.2 23.6 22.5 23 21 20.8 18.2 18.6 ROE %
8.1 8.2 8.6 9.3 8.4 8.6 7.9 8 7.3 7.3 ROA %
Trend 2008 2009 2010 2011 2012 2013 2014 2015 2016 Jan16 Balance Sheet
5492 7275 7907 7395 6550 7781 7281 9135 8705 7301.3 Cash & Equivalents
163514 163429 170407 180663 193406 203105 204751 203490 199581 201023 Total Assets
33402 34549 36401 43842 47079 41417 44559 43495 44030 43509 Long-term Debt
98906 98144 99939 112121 122091 126762 128496 122096 119035 122133 Total Liabilities
-- 393 -- -- 342 332 323 323 317 320.5 Common Equity
Trend 2008 2009 2010 2011 2012 2013 2014 2015 2016 TTM Cashflow Statement
20354 23147 26249 23643 24255 25591 23257 28564 27389 27389 Cashflow from Operations
-15670 -10742 -11620 -12193 -16609 -12637 -12526 -11125 -10675 -10675 Cashflow from Investing
-7691 -3521 -7276 -14776 -6298 -7600 -6683 -1015 -4112 -4112 Repurchase of Stock
-7691 -3521 -7712 -14776 -6298 -7600 -6683 -1015 -4112 -4112 Net Issuance of Debt
-7134 -9918 -14191 -12028 -8458 -11946 -10789 -15071 -16122 -16122 Cashflow from Financing
-14937 -11499 -12184 -12699 -13510 -12898 -13115 -12174 -11477 -11477 Capital Expenditure
5417 11648 14065 10944 10745 12693 10142 16390 15912 15912 Free Cash Flow
Competitor
Ticker CompanyFinancial
StrengthProfitability Market Cap($M) P/E P/S
Operating
Margin(%)ROA(%) ROE(%)
NYSE:WMT Wal-Mart Stores Inc 6 6 219,663 15.24 0.46 5.00 7.29 18.51
NAS:COST Costco Wholesale Corp 6 7 67,304 29.32 0.58 3.07 6.86 21.68
NYSE:TGT Target Corp 8 7 50,051 15.62 0.74 6.65 8.23 24.61
90.47
24.1
42.27
33M
16.3M
GuruFocus.com is not operated by a broker, a dealer, or a registered investment adviser. Under no circumstances does any information posted on GuruFocus.com represent a recommendation to buy or sell a security. The
information on this site, and in its related newsletters, is not intended to be, nor does it constitute, investment advice or recommendations. The gurus may buy and sell securities before and after any particular article and report and
information herein is published, with respect to the securities discussed in any article and report posted herein. In no event shall GuruFocus.com be liable to any member, guest or third party for any damages of any kind arising out
of the use of any content or other material published or available on GuruFocus.com, or relating to the use of, or inability to use, GuruFocus.com or any content, including, without limitation, any investment losses, lost profits, lost
opportunity, special, incidental, indirect, consequential or punitive damages. Past performance is a poor indicator of future performance. The information on this site, and in its related newsletters, is not intended to be, nor does it
constitute, investment advice or recommendations. The information on this site is in no way guaranteed for completeness, accuracy or in any other way. The gurus listed in this website are not affiliated with GuruFocus.com, LLC.
Stock quotes provided by InterActive Data. Fundamental company data provided by Morningstar, updated daily.

As of 04-18-2016 * All financial numbers are in millions except for per share data
GuruFocus Manual of Stocks www.gurufocus.com/stock/NYSE:XOM E
Exxon Mobil Corporation (NYSE:XOM)
$ 85.78
Oil & Gas - Integrated - Oil & Gas Integrated
Market Cap: $ 356,223 Mil
Exxon Mobil Corporation is engaged in energy, involving exploration for, and
production of, crude oil and natural gas, manufacture of petroleum products
and transportation and sale of crude oil, natural gas and petroleum products.
Ratios
CurrentIndustry
Median
Historical
Median
P/E (ttm) 22.28 15.66 11.52
Forward P/E 20.53 11.51 N/A
P/B 2.09 1.05 2.61
P/S 1.33 0.71 0.98
P/FCF 93.33 13.27 17.4
Shiller P/E 11.53 9.40 13.47
PEG N/A 0.85 1.06
Valuation Analysis
% of Price
NCAV -33.5 -39
Tangible Book 41.1 48
Graham Number 59.59 69
Median P/S 62.75 73
Price 85.78
Dividend & Ownership
Dividend Yield(ttm) % 3.42
Dividend Yield(forward) % 3.44
Payout 0.75
Dividend Growth(5y) % 11.4
Yield on Cost(5y) % 5.87
Continuous Div. since 1986
Insider Ownership % 0.58
Institution Ownership % 55.66
Short % of Float 1.06
Financial Strength
Score: 8 /10 CurrentIndustry
Median
Historical
Median
Cash to Debt 0.10 0.36 0.64
Equity to Asset 0.51 0.47 0.50
Interest Coverage 71.90 6.39 180.11
F-Score 5 5.00 7
Profitability
Score: 5 /10 CurrentIndustry
Median
Historical
Median
Operating Margin (%) 8.32 3.93 14.50
Net-Margin (%) 6.01 2.06 8.20
ROE (%) 9.39 3.02 25.47
ROA (%) 4.70 1.49 12.17
ROC (Joel Greenblatt)
(%)8.76 6.04 33.46
Growth
10 Yr 5 Yr 1 Yr
Revenue Growth (%) 3.5 -3.3 -33.30
EBITDA Growth (%) 1.1 -6.6 -40.40
EBIT Growth (%) -3 -12.1 -56.00
EPS without NRI
Growth (%)-0.4 -8.2 -49.30
Free Cash Flow Growth
(%)-12 -25.2 -67.40
Book Value Growth (%) 9.6 7.3 -1.00
Quarterly
Dec14 Mar15 Jun15 Sep15 Dec15
Revenue 87276 67618 74113 67344 59807
Net Income 6570 4940 4190 4240 2780
EPS 2 1 1 1 1
Revenue (YoY) % -21 -36 -33 -37 -31
Net Income (YoY) % -21 -46 -52 -47 -58
EPS (YoY) % -19 -44 -51 -47 -57
Guru Trades
Guru Date ActionImpact
%
Cur.
Shares
Yacktman Focused Fund 03/31/16 Reduce -0.17 1,200,000
Ken Fisher 03/31/16 Reduce -0.13 4,536,482
T Rowe Price Equity
Income Fund03/31/16 Reduce -0.1 6,494,500
Murray Stahl 03/31/16 Add 0.04 68,615
Yacktman Focused Fund 12/31/15 Reduce -0.9 1,300,000
Donald Yacktman 12/31/15 Reduce -0.8 4,266,560
Warning Signs
SEVERE Per Share Revenue: Declined
SEVERE Gross margin: Declined
SEVERE Operating margin: Declined
SEVERE Days Inventory: Building up
MEDIUM Payout ratio: Too high
Insider Trades
Insider Position Date TradesCur.
Shares
Corson Bradley WVice
President03/17/16 -2000 234780
Wascom Dennis GVice
President02/16/16 -5326 170137
Cleveland Randy JExecutive
Offic02/09/16 -9781 166305
Corson Bradley WVice
President02/08/16 -2000 236481
Spellings James M JrVice Pres. &
Ge02/05/16 -11924 197112
78.73 95.05 94.56 81.64 73.42 87.98 93.48 101.51 104.38 93.37 85.43 Annual Price High
56.17 69.91 62.35 62.22 56.57 68.03 77.6 85.16 86.41 68.71 73.18 Low
Gain(%) SP500(%)
1W 2.12 1.6
1M 2.60 1.7
3M 10.47 9.1
6M 6.08 0.5
YTD 9.94 1.9
2006 2007 2008 2009 2010 2011 2012 2013 2014 2015 Current Stock Performance
442508 504240 406067 322334 364064 401254 389648 438702 388382 323960 356223 Market Cap
5967 5557 5194 4848 4897 4875 4628 4419 4282 4196 4153 Sh. Outstanding-diluted(Mil)
11.7 12.9 9.2 17.1 11.8 10.1 8.9 13.7 12.2 20.3 22.3 Year End P/E
3.9 4.1 3.6 2.9 2.5 2.6 2.4 2.5 2.2 1.9 2.1 P/B
1.2 1.3 0.9 1.1 0.9 0.9 0.8 1 1 1.2 1.3 P/S
5.3 5.8 4 6.9 5.5 4.6 4.2 6.2 6.1 9.1 9.8 EV/EBITDA
Trend 2007 2008 2009 2010 2011 2012 2013 2014 2015 TTM Per share data
72.8 91.9 64.1 78.3 99.8 103.9 99.2 96.2 64.1 64 Revenue Per Share
7.3 8.7 4 6.2 8.4 9.7 7.4 7.6 3.9 3.8 EPS
6.6 7.8 1.2 4.4 5 4.7 2.5 2.8 0.9 0.9 Free Cashflow Per Share
1.4 1.6 1.7 1.7 1.9 2.2 2.5 2.7 2.9 2.9 Dividends Per Share
22.6 21.1 23.4 29.5 32.6 36.8 38.4 41.5 41.1 41.1 Tang. Book Per Share
71 89.1 62.6 77.2 97.3 101.4 96.9 94 62.8 73.7 Median P/S Value
61 64.2 45.8 64.2 78.6 89.7 79.8 84.2 59.7 69.1 Graham Number
Trend 2007 2008 2009 2010 2011 2012 2013 2014 2015 TTM Income Statement
404552 477359 310586 383221 486429 480681 438255 411939 268882 268882 Revenue
42.8 39.8 31.8 31.6 30 30.4 28.1 28.1 30 30 Gross Margin %
71479 83397 35325 53218 73504 79053 57720 51916 22277 22362 Operating Income
17.7 17.5 11.4 13.9 15.1 16.5 13.2 12.6 8.3 8.2 Operating Margin %
40610 45220 19280 30460 41060 44880 32580 32520 16150 16150 Net Income
10 9.5 6.2 8 8.4 9.3 7.4 7.9 6 6 Net Margin %
34.5 38.5 17.3 23.7 27.3 28 19.2 18.7 9.4 9.4 ROE %
17.6 19.2 8.4 11.4 13 13.5 9.6 9.3 4.7 4.7 ROA %
Trend 2007 2008 2009 2010 2011 2012 2013 2014 2015 Dec15 Balance Sheet
33981 31437 10693 7825 12664 9582 4644 4616 3705 4382 Cash & Equivalents
242082 228052 233323 302510 331052 333795 346808 349493 336758 342160 Total Assets
7183 7025 7129 12227 9322 7928 6891 11653 19925 19672 Long-term Debt
120320 115087 122754 155671 176656 167932 172805 175094 165947 170803 Total Liabilities
-- -- -- -- -- -- -- -- -- -- Common Equity
Trend 2007 2008 2009 2010 2011 2012 2013 2014 2015 TTM Cashflow Statement
52002 59725 28438 48413 55345 56170 44914 45116 30344 30344 Cashflow from Operations
-9728 -15499 -22419 -24204 -22165 -25601 -34201 -26975 -23824 -23824 Cashflow from Investing
-31822 -35734 -19703 -13093 -22055 -21068 -15998 -13183 -4039 -4039 Repurchase of Stock
-30743 -34981 -18951 -12050 -21131 -20875 -15948 -13153 -4034 -4034 Net Issuance of Debt
-38345 -44027 -27283 -26924 -28256 -33868 -15476 -17888 -7037 -7037 Cashflow from Financing
-15387 -19318 -22491 -26871 -30975 -34271 -33669 -32952 -26490 -26490 Capital Expenditure
36615 40407 5947 21542 24370 21899 11245 12164 3854 3854 Free Cash Flow
Competitor
Ticker CompanyFinancial
StrengthProfitability Market Cap($M) P/E P/S
Operating
Margin(%)ROA(%) ROE(%)
NYSE:XOM Exxon Mobil Corporation 8 5 356,223 22.28 1.33 8.32 4.70 9.39
SHSE:601857 PetroChina Co Ltd 6 7 219,569 40.79 0.77 4.03 1.49 3.02
NYSE:CVX Chevron Corp 6 5 185,868 40.27 1.34 3.50 1.72 2.97
104.38
24.11
56.17
60M
30.1M
GuruFocus.com is not operated by a broker, a dealer, or a registered investment adviser. Under no circumstances does any information posted on GuruFocus.com represent a recommendation to buy or sell a security. The
information on this site, and in its related newsletters, is not intended to be, nor does it constitute, investment advice or recommendations. The gurus may buy and sell securities before and after any particular article and report and
information herein is published, with respect to the securities discussed in any article and report posted herein. In no event shall GuruFocus.com be liable to any member, guest or third party for any damages of any kind arising out
of the use of any content or other material published or available on GuruFocus.com, or relating to the use of, or inability to use, GuruFocus.com or any content, including, without limitation, any investment losses, lost profits, lost
opportunity, special, incidental, indirect, consequential or punitive damages. Past performance is a poor indicator of future performance. The information on this site, and in its related newsletters, is not intended to be, nor does it
constitute, investment advice or recommendations. The information on this site is in no way guaranteed for completeness, accuracy or in any other way. The gurus listed in this website are not affiliated with GuruFocus.com, LLC.
Stock quotes provided by InterActive Data. Fundamental company data provided by Morningstar, updated daily.